Estimating Annual Survival Rates from Sparse Band … · Estimating Annual Survival Rates from...
25
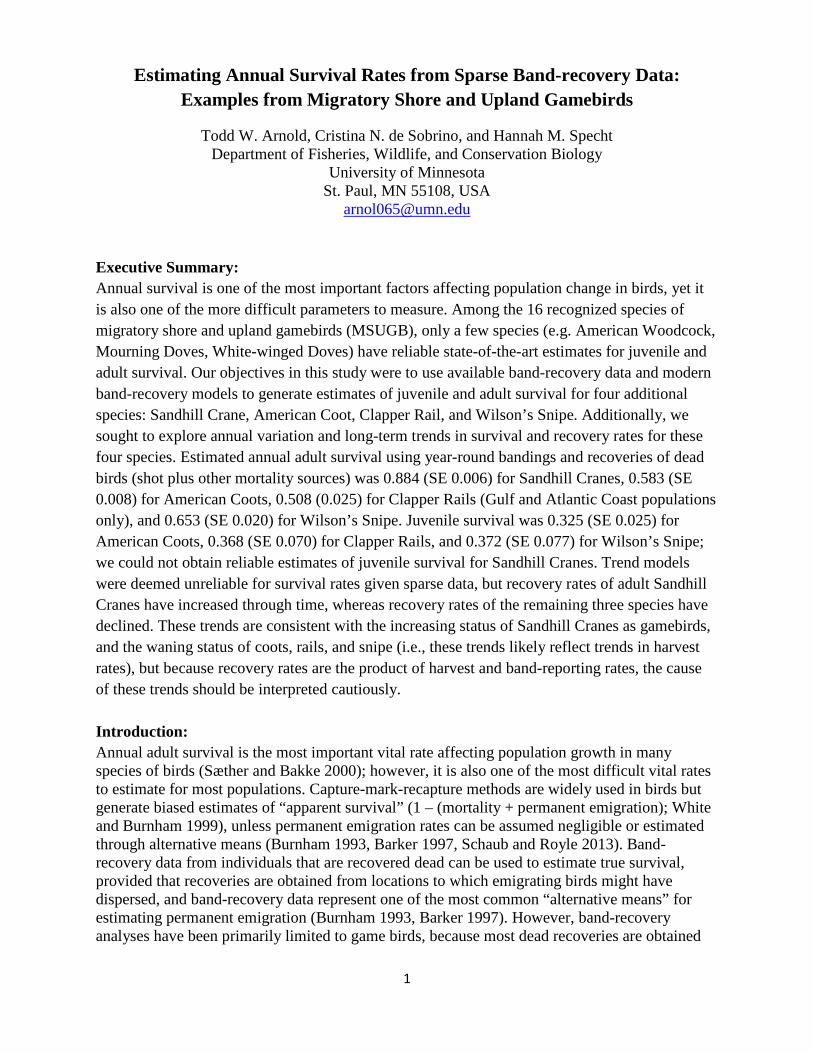
Estimating Annual Survival Rates from Sparse Band-recovery Data: Examples from Migratory Shore and Upland Gamebirds Todd W. Arnold, Cristina N. de Sobrino, and Hannah M. Specht Department of Fisheries, Wildlife, and Conservation Biology University of Minnesota St. Paul, MN 55108, USA [email protected] Executive Summary: Annual survival is one of the most important factors affecting population change in birds, yet it is also one of the more difficult parameters to measure. Among the 16 recognized species of migratory shore and upland gamebirds (MSUGB), only a few species (e.g. American Woodcock, Mourning Doves, White-winged Doves) have reliable state-of-the-art estimates for juvenile and adult survival. Our objectives in this study were to use available band-recovery data and modern band-recovery models to generate estimates of juvenile and adult survival for four additional species: Sandhill Crane, American Coot, Clapper Rail, and Wilson’s Snipe. Additionally, we sought to explore annual variation and long-term trends in survival and recovery rates for these four species. Estimated annual adult survival using year-round bandings and recoveries of dead birds (shot plus other mortality sources) was 0.884 (SE 0.006) for Sandhill Cranes, 0.583 (SE 0.008) for American Coots, 0.508 (0.025) for Clapper Rails (Gulf and Atlantic Coast populations only), and 0.653 (SE 0.020) for Wilson’s Snipe. Juvenile survival was 0.325 (SE 0.025) for American Coots, 0.368 (SE 0.070) for Clapper Rails, and 0.372 (SE 0.077) for Wilson’s Snipe; we could not obtain reliable estimates of juvenile survival for Sandhill Cranes. Trend models were deemed unreliable for survival rates given sparse data, but recovery rates of adult Sandhill Cranes have increased through time, whereas recovery rates of the remaining three species have declined. These trends are consistent with the increasing status of Sandhill Cranes as gamebirds, and the waning status of coots, rails, and snipe (i.e., these trends likely reflect trends in harvest rates), but because recovery rates are the product of harvest and band-reporting rates, the cause of these trends should be interpreted cautiously. Introduction: Annual adult survival is the most important vital rate affecting population growth in many species of birds (Sæther and Bakke 2000); however, it is also one of the most difficult vital rates to estimate for most populations. Capture-mark-recapture methods are widely used in birds but generate biased estimates of “apparent survival” (1 – (mortality + permanent emigration); White and Burnham 1999), unless permanent emigration rates can be assumed negligible or estimated through alternative means (Burnham 1993, Barker 1997, Schaub and Royle 2013). Band- recovery data from individuals that are recovered dead can be used to estimate true survival, provided that recoveries are obtained from locations to which emigrating birds might have dispersed, and band-recovery data represent one of the most common “alternative means” for estimating permanent emigration (Burnham 1993, Barker 1997). However, band-recovery analyses have been primarily limited to game birds, because most dead recoveries are obtained 1
Transcript of Estimating Annual Survival Rates from Sparse Band … · Estimating Annual Survival Rates from...
Estimating Annual Survival Rates from Sparse Band-recovery Data: Examples from Migratory Shore and Upland Gamebirds
Todd W. Arnold, Cristina N. de Sobrino, and Hannah M. Specht Department of Fisheries, Wildlife, and Conservation Biology
University of Minnesota St. Paul, MN 55108, USA
Executive Summary: Annual survival is one of the most important factors affecting population change in birds, yet it is also one of the more difficult parameters to measure. Among the 16 recognized species of migratory shore and upland gamebirds (MSUGB), only a few species (e.g. American Woodcock, Mourning Doves, White-winged Doves) have reliable state-of-the-art estimates for juvenile and adult survival. Our objectives in this study were to use available band-recovery data and modern band-recovery models to generate estimates of juvenile and adult survival for four additional species: Sandhill Crane, American Coot, Clapper Rail, and Wilson’s Snipe. Additionally, we sought to explore annual variation and long-term trends in survival and recovery rates for these four species. Estimated annual adult survival using year-round bandings and recoveries of dead birds (shot plus other mortality sources) was 0.884 (SE 0.006) for Sandhill Cranes, 0.583 (SE 0.008) for American Coots, 0.508 (0.025) for Clapper Rails (Gulf and Atlantic Coast populations only), and 0.653 (SE 0.020) for Wilson’s Snipe. Juvenile survival was 0.325 (SE 0.025) for American Coots, 0.368 (SE 0.070) for Clapper Rails, and 0.372 (SE 0.077) for Wilson’s Snipe; we could not obtain reliable estimates of juvenile survival for Sandhill Cranes. Trend models were deemed unreliable for survival rates given sparse data, but recovery rates of adult Sandhill Cranes have increased through time, whereas recovery rates of the remaining three species have declined. These trends are consistent with the increasing status of Sandhill Cranes as gamebirds, and the waning status of coots, rails, and snipe (i.e., these trends likely reflect trends in harvest rates), but because recovery rates are the product of harvest and band-reporting rates, the cause of these trends should be interpreted cautiously. Introduction: Annual adult survival is the most important vital rate affecting population growth in many species of birds (Sæther and Bakke 2000); however, it is also one of the most difficult vital rates to estimate for most populations. Capture-mark-recapture methods are widely used in birds but generate biased estimates of “apparent survival” (1 – (mortality + permanent emigration); White and Burnham 1999), unless permanent emigration rates can be assumed negligible or estimated through alternative means (Burnham 1993, Barker 1997, Schaub and Royle 2013). Band-recovery data from individuals that are recovered dead can be used to estimate true survival, provided that recoveries are obtained from locations to which emigrating birds might have dispersed, and band-recovery data represent one of the most common “alternative means” for estimating permanent emigration (Burnham 1993, Barker 1997). However, band-recovery analyses have been primarily limited to game birds, because most dead recoveries are obtained
1

through hunting (Brownie et al. 1978, Franklin et al. 2002; but see Francis 1995). For comparative studies of life-history ecology (e.g., Martin and Li 1992), this raises concerns that survival rates might be artificially lowered through harvest (Smith and Reynolds 1992), or that recovery patterns of harvested birds might be different from those of birds that die of natural causes (Schaub and Pradel 2004). Telemetry can provide estimates of true survival, but telemetry studies are often limited to only part of the year, or for migratory species to only part of a population’s annual range. Satellite transmitters are capable of tracking birds anywhere throughout the annual cycle, but it may still be difficult to differentiate mortality from transmitter loss or failure, and the large size of satellite transmitters make them unsuitable for smaller birds (Robinson et al. 2010). In addition, survival estimates based on telemetry raise more suspicions about deleterious marker effects than do studies using traditional leg bands or color markers (Barron et al. 2010). Thus, and mostly by default, band-recovery data remain one of the most viable tools for estimating true survival in birds. Available estimates of annual survival for American Coots (Fulica americana) and Wilson’s Snipe (Gallinago delicata) are limited to life-table estimates based on band-recovery data (Ryder 1963, Tuck 1972 in Mueller 1999), but these methods have been widely discredited (Anderson et al. 1985). Estimates of annual survival in Clapper Rails (Rallus longirostris) are based on shorter term telemetry studies that were annualized to a full year (Eddleman and Conway 1998). Survival estimates for Sandhill Cranes (Grus canadensis) include unpublished mark-recapture and band-recovery estimates (e.g., Nesbitt and Moore 1992, Drewien et al. 2000) plus indirect estimates based on population growth and recruitment rates (i.e. solving for the missing parameter, adult survival; Drewein et al. 1995). All four species are recognized as game species throughout some or all of their range, and are commonly grouped together with other hunted Rallidae, Scolopacidae and Columbiiformes into a group known as Migratory Shore and Upland Game Birds (MSUGB; Tacha and Braun 1994). However, despite their status as game birds, band recovery data for all species of MSUGB are limited, and state-of-the-art survival estimates are available only for American Woodcock, Mourning Doves, and White-winged Doves (Krementz et al. 2003, Otis et al. 2008, Collier et al. 2012). Our objectives in this study were to estimate average annual survival rates for juvenile and adult American Coots, Clapper Rails, Sandhill Cranes, and Wilson’s Snipe using modern band-recovery models (Brownie et al. 1978, White and Burnham 1999). These two parameters are important for population modeling, because they constitute two of the three vital rates (fecundity is the third) needed to construct a post birth pulse projection matrix. Additionally, we used long-term data to test for temporal trends in juvenile and adult survival or recovery rates. In the case of annual survival, negative trends might indicate reduced population viability (Franklin et al. 2002), whereas for band recovery rates such trends might indicate long-term changes in harvest or band reporting rates (Conroy et al. 2005). Given sparse data sets, we explored several options for increasing sample sizes, including use of non-traditional banding and recovery periods (e.g. year-round banding and recovery windows), alternative methods of band recovery (traditional studies have only used birds shot or found dead during the hunting season), inclusion of unknown age birds, and expansion of other banding criteria (e.g., inclusion of auxiliary markers). To better understand the consequences of these decisions, we conducted extensive simulation studies to examine the reliability of survival estimates derived from sparse data. We also conducted similar analyses on Mourning Doves (Zenaida macroura), which have been banded
2

and recovered in large numbers and for which reliable estimates of annual survival are available (Otis et al. 2008), to further explore the consequences of different inclusion criteria when applied to real data. Study Area Most of our analyses utilized data from birds banded and recovered throughout the United States and Canada. However, our analyses of Clapper Rails excluded birds banded in the Pacific Flyway (i.e., endangered/threatened populations located in Arizona and California). For Sandhill Cranes, we utilized combined banding data from all recognized subpopulations (Tacha et al. 1992) because data were too sparse to analyze populations separately, but we recognize that this may have interjected additional unmodeled heterogeneity into our estimates of survival and recovery rates (Franklin et al. 2002). Sources of Data We used bandings and recoveries of normal, wild caught (i.e., Status 3) birds obtained from the United States Geological Service Bird Banding Lab, Laurel, Maryland. Systematic recording of numbers of banded birds began in 1950 for most game birds (1955 for nongame birds), and we used bandings and recoveries from 1950 through 2010 (including recoveries from early 2011). Banding data were relatively sparse for all species and we expanded our sample beyond traditional criteria to maximize available data (Table 1). Our analysis included birds with auxiliary markers (except radio transmitters), birds captured by spotlighting, and those that had been blood sampled. The inclusion of auxiliary markers was particularly important for Sandhill Cranes, where the majority of birds have been marked with auxiliary markers (Table 1). Auxiliary bands comprised a smaller proportion of bandings for the other species, but were included to maintain consistent methodology across species. We defined three different banding periods: 1) the traditional preseason period, 1 Jul – 30 Sep, that occurred prior to most hunting seasons; 2) a postseason period, 15 Jan to 31 Mar, that began after hunting seasons typically are closed; and 3) year round bandings (All), with the start of each new year defined as 1 May (i.e., a year was defined as 1 May – 30 Apr). Recovery periods for pre and post season bandings were 1 Sep to 15 Feb, whereas the recovery period for year round bandings was defined the same as the banding period, 1 May to 30 Apr (Table 2). For each of three banding periods we evaluated three different groups of recoveries: 1) birds that were shot by hunters, 2) birds found dead from a variety of causes, but not reported as shot, and 3) birds that were encountered alive (for birds encountered more than once, we used only the terminal encounter). Brownie et al. (1978) and Francis (1995) both suggested that terminal live recoveries could be included in band-recovery analyses, but we wanted to evaluate this group separately because it seemed intuitively obvious that live recoveries would underestimate survival if used in band recovery models. For preseason and year-round banding periods, we compiled separate m-arrays depending on age at banding: juveniles (birds aged as local or hatch year [HY] at banding), adults (birds aged as
3
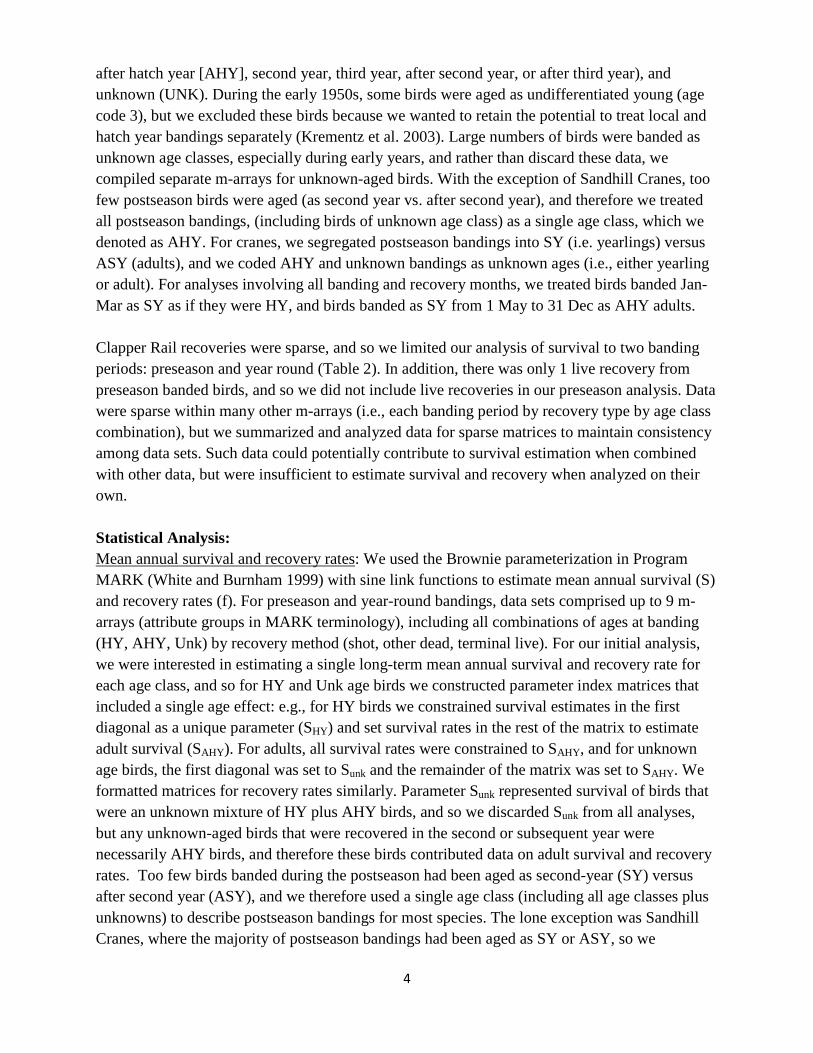
after hatch year [AHY], second year, third year, after second year, or after third year), and unknown (UNK). During the early 1950s, some birds were aged as undifferentiated young (age code 3), but we excluded these birds because we wanted to retain the potential to treat local and hatch year bandings separately (Krementz et al. 2003). Large numbers of birds were banded as unknown age classes, especially during early years, and rather than discard these data, we compiled separate m-arrays for unknown-aged birds. With the exception of Sandhill Cranes, too few postseason birds were aged (as second year vs. after second year), and therefore we treated all postseason bandings, (including birds of unknown age class) as a single age class, which we denoted as AHY. For cranes, we segregated postseason bandings into SY (i.e. yearlings) versus ASY (adults), and we coded AHY and unknown bandings as unknown ages (i.e., either yearling or adult). For analyses involving all banding and recovery months, we treated birds banded Jan-Mar as SY as if they were HY, and birds banded as SY from 1 May to 31 Dec as AHY adults. Clapper Rail recoveries were sparse, and so we limited our analysis of survival to two banding periods: preseason and year round (Table 2). In addition, there was only 1 live recovery from preseason banded birds, and so we did not include live recoveries in our preseason analysis. Data were sparse within many other m-arrays (i.e., each banding period by recovery type by age class combination), but we summarized and analyzed data for sparse matrices to maintain consistency among data sets. Such data could potentially contribute to survival estimation when combined with other data, but were insufficient to estimate survival and recovery when analyzed on their own. Statistical Analysis: Mean annual survival and recovery rates: We used the Brownie parameterization in Program MARK (White and Burnham 1999) with sine link functions to estimate mean annual survival (S) and recovery rates (f). For preseason and year-round bandings, data sets comprised up to 9 m-arrays (attribute groups in MARK terminology), including all combinations of ages at banding (HY, AHY, Unk) by recovery method (shot, other dead, terminal live). For our initial analysis, we were interested in estimating a single long-term mean annual survival and recovery rate for each age class, and so for HY and Unk age birds we constructed parameter index matrices that included a single age effect: e.g., for HY birds we constrained survival estimates in the first diagonal as a unique parameter (SHY) and set survival rates in the rest of the matrix to estimate adult survival (SAHY). For adults, all survival rates were constrained to SAHY, and for unknown age birds, the first diagonal was set to Sunk and the remainder of the matrix was set to SAHY. We formatted matrices for recovery rates similarly. Parameter Sunk represented survival of birds that were an unknown mixture of HY plus AHY birds, and so we discarded Sunk from all analyses, but any unknown-aged birds that were recovered in the second or subsequent year were necessarily AHY birds, and therefore these birds contributed data on adult survival and recovery rates. Too few birds banded during the postseason had been aged as second-year (SY) versus after second year (ASY), and we therefore used a single age class (including all age classes plus unknowns) to describe postseason bandings for most species. The lone exception was Sandhill Cranes, where the majority of postseason bandings had been aged as SY or ASY, so we
4

constructed three m-arrays for postseason cranes, including SY (including birds incorrectly aged as HY), ASY (including ASY and older age classes), and unknown (birds aged as unknown, but also any birds aged as AHY). For each species and banding period, we ran three different models: 1) a model where annual survival did not vary by recovery type (e.g., S(a2) for models with age structure, S(.) for postseason models without age structure), 2) a model where survival rates varied by recovery type (S(a2*type) or S(type)), and 3) a model where survival was the same for shot and other dead recoveries, but differed for live recoveries (S(a2*D/L) or S(D/L)). Recovery rates for each model were modeled as a function of age and recovery type (e.g. f(a2/unk)*type) and survival rates of unknown-aged birds were left unconstrained (i.e. we estimated unknown aged survival separately for each recovery type). We used AICc to rank these 3 models and examined parameter estimates to look for consistent patterns across data sets. Results Sandhill Cranes: Survival estimates for adult Sandhill Cranes based on dead recoveries from preseason or year-round bandings ranged from 0.85 to 0.90 and had relatively good precision (SE < 0.02), but estimates based on live recoveries and postseason bandings were typically lower (< 0.8) and less precise (Fig. 1). Although analyses from two of three banding periods indicated that survival rates differed by recovery type, this was primarily driven by variability of survival estimates among young cranes, and ad hoc models that constrained adult survival to be similar between shot cranes and other mortality sources (but juvenile survival to remain different) were supported by lower AICc; annual adult survival under a model with combined dead recoveries was 0.884 (SE 0.006). Several point estimates of annual survival for young Sandhill Cranes were 0 or 1, and we discarded these estimates as nonsensical (Appendix 2), but remaining estimates were also imprecise and highly variable (Fig. 1). Encounter rates for preseason cranes recovered by hunting were 0.5% for juveniles and 0.3% for adults (Appendix 2). Trend models for Sandhill Cranes suggested that average adult survival rates have not changed appreciably over time, whereas models for HY cranes gave nonsensical estimates of 100% survival (Table 3). Both Seber and Brownie models indicated that average encounter rates for adults have increased over time, whereas juvenile encounter rates have not changed (point estimates were non-significantly negative). American Coots: Most survival estimates for coots were between 0.3 and 0.4 for juveniles and between 0.5 and 0.6 for adults (Fig. 2). Postseason bandings, which contained a mixture of yearling and older coots, had intermediate survival rates of 0.4 to 0.55. Survival estimates based on terminal live recoveries were consistently lower than estimates from dead recoveries, but there was no evidence to suggest that survival estimates differed between birds recovered from hunting versus other forms of mortality, and models that set survival rates equal between these two recovery types had lower AICc. Estimated survival of HY and AHY coots under models that combined all dead recoveries from year-round bandings were 0.325 (SE 0.025) and 0.583 (SE
5
0.008), respectively. Recovery rates for preseason birds recovered through hunting were 1.6% per year for HY and 0.6% per year for AHY coots, respectively (Appendix 2). We based trend models for coots on year-round bandings using combined recoveries of all dead coots. Results for AHY birds indicated no trend in survival, whereas results from HY birds were inconsistent between Brownie and Seber formulations, with Brownie models indicating a non-significant positive slope (0.0044 ± 0.0086) and Seber models indicating a strongly significant positive slope (0.0817 ± 0.0189), with predicted survival rates increasing from 0.13 in 1950 to 0.95 in 2010. Clapper Rails: Annual survival estimates for Clapper Rails were approximately 35% for juveniles and 50% for adults in most analyses, but live recoveries generated a much higher survival estimate for adults and a lower estimate for juveniles (Fig. 3). Mean annual survival rates under a model with combined dead recoveries and year-round bandings were 0.368 (SE 0.070) for HY and 0.508 (SE 0.025) for AHY Clapper Rails. Encounter rates for preseason banded Clapper Rails recovered by hunters averaged 2.2% per year for HY birds and 1.1% for AHY birds. Trend models for Clapper Rails suggested significantly increasing HY survival and non-significantly declining AHY survival (Table 3), but intercepts for HY birds suggested that this model fit poorly. Trend models suggested declining encounter probabilities for both HY and AHY birds under both Brownie and Seber models (Table 3). Wilson’s Snipe: Survival estimates for snipe exhibited tremendous inconsistency among banding periods and recovery types (Fig. 4). Estimates based on year-round bandings for combined shot and other dead recoveries averaged 0.372 (SE 0.077) for juveniles and 0.653 (SE 0.020) for adults. Trend models for snipe suggested increasing juvenile survival, but declining adult survival through time, with increasing recovery rates for juveniles, but declining recovery rates for adults, and these patterns were consistent using both Seber and Brownie models. Encounter rates for preseason banded snipe recovered through hunting were 0.7% for both juveniles and adults. Mourning Doves: Survival estimates for Mourning Doves were best described by models that recognized different survival and recovery probabilities for all banding periods and for all recovery types (Fig. 5, Appendix 1). In particular, estimates of adult annual survival exhibited surprisingly large differences between data sets based on shot (S = 0.470, SE 0.002) versus other dead recoveries (S = 0.585, SE = 0.004). Discussion An ideal framework for a banding study is to have multiple banding regions to explore geographic sources of variation in survival and recovery rates, multiple years of bandings to explore temporal sources of variation, and large banding samples of each age- and sex-class to
6

explore demographic sources of variation (Burnham et al. 1984, Franklin et al. 2002, Rice et al. 2010). Reward-banding studies are also desirable to convert recovery rates into harvest rates and to safeguard against potential changes in reporting rates that might otherwise be interpreted as changes in harvest or survival (Nichols et al. 1995). Unfortunately, data sets that we analyzed lacked these characteristics, and to obtain adequate samples for analysis we were forced to summarize data over all banding regions and years, and to combine most forms of dead recoveries. However, when we used similar methods to analyze band-recovery data from Mourning Doves, which satisfied most of these sampling criteria, we were disconcerted to discover large differences in estimated survival between band recoveries from hunting (e.g. How Recovered = Shot) versus other forms of mortality (Appendix 3). Brownie models assume: (1) banded samples are representative of the target population; (2) age and sex are correctly determined; (3) there is no band loss; (4) survival rates are not affected by banding; (5) the year of band recoveries is correctly tabulated; (6) the fates of banded individuals are independent; (7) the fates of banded individuals are multinomial random; and (8) all individuals in an identifiable class have the same survival and recovery rates (Brownie et al. 1978). There is no feasible way that banding crews can randomly capture birds for banding, and so concerns that banded samples are non-representative of the population are always going to be a concern in banding analyses (Weatherhead and Ankney 1984). Except for American Woodcock, too few MSUGB are sexed at banding, and so recovery and survival estimates represent “average rates” for both males and females. However, because sexual roles in reproduction are similar between males and females in Gruiiformes and Columbiiformes, survival rates are also expected to be similar (Breitwisch 1989). Birds of unknown age at banding comprised a large proportion of total bandings for American Coots (39%), Wilson’s Snipe (27%), and Clapper Rails (16%), and Francis (1995) noted that this problem was also widespread within banding data on North American passerine birds. Because age (HY vs. AHY) was an important predictor of survival and encounter rates in almost all data sets, conventional analysis methods would demand that unknown-aged banding data be discarded. However, we employed a novel means of utilizing such data by coding the first year survival and recovery probabilities of unknown-aged birds with separate parameters, which we discarded as uninterpretable (they represented survival and recovery of unknown mixtures of HY and AHY birds), but encounters from all subsequent years represented AHY recovery and survival rates, and unknown-aged birds therefore contributed considerable data to parameter estimates for adult birds (e.g. for American Coots, they contributed almost as much data as did birds first banded as AHY adults). Brownie et al. (1978) developed Model 0 to account for situations where first-year recovery rates were atypical (i.e. associated with the banding site), and our approach simply extends this rationale to include survival rates. We utilized a wider selection of banding and recovery data than previous analysts (e.g. auxiliary markers, other dead recoveries, terminal live encounters). We suspect that auxiliary markers lead to increased band-reporting rates (T. Arnold, unpubl. data), but have no reason to suspect that
7
they affect survival rates (and note that we did not include birds marked with radiotransmitters). White et al. (2013) showed that band-recovery models were extremely robust to unrecognized heterogeneity in band-reporting rates, so additional heterogeneity in recovery caused by auxiliary markers would not bias our estimates of annual survival. With sufficient data from birds with and without auxiliary markers, it would be straightforward to test for variation in recovery rates, but sample sizes were inadequate for partitioning (most Sandhill Cranes had auxiliary markers, most other species lacked them). Live encounters consistently resulted in aberrant estimates of survival (estimates were almost always lower). Given that birds are necessarily of younger ages when alive than dead, this result was not really that surprising, but we note that others have recommended or used live encounters in band-encounter models (Brownie et al. 1978, Francis 1995), and we discourage this practice based on our findings. If a sufficient amount of live recovery data is available, analysts have the option of using such data in combined live-dead encounter models (e.g. Doherty et al. 2002). Although we used liberalized inclusion criteria for many aspects of our analysis, we excluded all data where the Bird Banding Lab had coded Hunting Seasons Survived as 99. Although this resulted in the exclusion of many seemingly valid recoveries, more detailed exploration of banding data for Mallards and American Black Ducks that received this code indicated that some unknown fraction of birds with HSS = 99 represented birds that were reported one or more years after their death (T. Arnold, unpubl. data). Inclusion of such data would have led to a modest positive bias in survival rates (Anderson and Burnham 1980). Assumptions 6, 7, and 8 have been combined and paraphrased as the “independence of fates and identity of rates” assumption by Lebreton et al. (1992), and violation of this assumption can be detected through goodness-of-fit tests or by estimating variance inflation factors (�̂�) that represents the difference in deviation between the observed data and data randomly generated under the proposed model. Although all data sets exhibited pronounced lack of fit under the most simple model considered here (e.g. Sa2,fa2, �̂� > 3.5), all data sets except American Coots had an estimated �̂� = 1 for the most general model Sa2*t,fa2*t; however, this model was never highly ranked by AICc, owing to the large number of estimable parameters. Thus, a large component of heterogeneity in our simpler models was undoubtedly due to unmodeled temporal variation in survival or band recovery rates. Most large-scale analyses of banding data for waterfowl have documented additional variation in survival or recovery rates associated with banding regions (e.g., flyways, latitude, or states and provinces; Doherty et al. 2002, Conroy et al. 2005, Rice et al. 2010), but we had insufficient data to consider regional variation in our analyses. We conducted exploratory analyses where we partitioned Sandhill Crane data into three smaller data sets and were able to calculate separate adult survival estimates for Rocky Mountain (0.878 ± 0.015), Midcontinent (0.877 ± 0.009), and Eastern populations (0.897 ± 0.017), but there was little evidence of survival differences for these 3 populations. Remaining data sets lacked sufficient geographic replication to allow separate survival estimates by region.
8

One of our major objectives in this project was to assess long-term variation in annual survival rates to: 1) test for linear trends (i.e. determine if survival is increasing or decreasing through time; Franklin et al. 2002) and 2) estimate annual process variation for use in population projection models (White 2000). Franklin et al. (2002) adopted protocol that were as lenient as possible while still ensuring good banding samples from at least 24 successive years, and their survey of all North American banding data uncovered only two non-waterfowl species, Mourning Doves and Common Grackles, that had sufficient data for trend analysis using random effects models. Despite having patchy data (i.e. long gaps with few or no band recoveries), we wanted to assess the performance of fixed-effect trend models at being able to detect long-term trends in survival and recovery. However, after conducting such analyses, we are cautious about applying them to sparse data sets such as these. For all four analyzed species, as well as Mourning Doves which had ample data, we obtained inconsistent and erratic results for HY survival, and Seber and Brownie models often produced very different results (Table 3). Estimates appeared more stable for AHY survival and recovery rates, but simulation modeling we conducted suggests that trend models are very prone to confuse trends in recovery rates with trends in survival rates when sample sizes are small, as they were in our analyses. We had hoped that Markov chain Monte Carlo (MCMC) methods that treated survival and recovery rate means and slopes as hyperparameters, with year effects modeled as random “shrinkage estimates” around these long term linear trends, might provide an appropriate mechanisms for analyzing sparse data such as these, but preliminary efforts to model data using MCMC methods were not encouraging. Acknowledgements: Data on bandings and recoveries were made available by Danny Bystrak at the USGS Bird Banding Laboratory, and we greatly appreciate the untold efforts of countless individuals who either captured and banded the birds, recovered and reported the bands, or entered and compiled the data records. Funding was provided by the Migratory Shore and Upland Gamebird Research Fund, as administered by Tom Cooper with the US Fish and Wildlife Service. We appreciate the assistance of the Minnesota Cooperative Fish and Wildlife Research Unit and the Department of Fisheries, Wildlife, and Conservation Biology at the University of Minnesota for help in administering grant monies. Literature Cited:
Anderson, D. R., and K. P. Burnham. 1980. Effect of delayed reporting of band recoveries on survival estimates. Journal of Field Ornithology 51:244-247.
Anderson, D. R., K, P. Burnham, and G. C. White. 1985. Problems in estimating age-specific survival rates from recovery data of birds ringed as young. Journal of Animal Ecology 54:89-98.
Barker, R. J. 1997. Joint modeling of live-recapture, tag-resight, and tag-recovery data. Biometrics 53:666-677.
9
Barron, D. G., J. D. Brawn, and P. J. Weatherhead. 2010. Meta-analysis of transmitter effects on avian behavior and ecology. Methods in Ecology and Evolution 1:180-187.
Breitwisch, R. 1989. Mortality patterns, sex ratios, and parental investment in monogamous birds. Current Ornithology 6:1-50.
Brownie, C., D. R. Anderson, K. P. Burnham, and D. S. Robson. 1978. Statistical inference from band recovery data: A handbook. U.S. Fish and Wildlife Service Resource Publication 131, Washington, DC.
Burnham, K. P. 1993. A theory for combined analysis of ring recovery and recapture data. Pages 199-214 in Marked Individuals in the Study of Bird Populations (J. D. Lebreton, ed.). pp199-213. Birkhaüser, Basel.
Collier, B. A., S. R. Kremer, C. D. Mason, and M. J. Peterson. 2012. Survival, fidelity, and recovery rates of White-winged Doves in Texas. Journal of Wildlife Management 76:1129-1134.
Conroy, M. J., C. J. Fonnesbeck, and N. L. Zimpfer. 2005. Modeling regional waterfowl harvest rates using Markov chain Monte Carlo. Journal of Wildlife Management 69:77-90.
Doherty, P. F., Jr., J. D. Nichols, J. Tautin, J. F. Voelzer, G. W. Smith, D. S. Benning, V. R. Bentley, J. K. Bidwell, K. S. Bollinger, A. R. Brazda, E. K. Buelna, J. R. Goldsberry, R. J. King, F. H. Roetker, J. W. Solberg, P. P. Thorpe, and J. W. Wortham. 2002. Sources of variation in breeding-ground fidelity of mallards (Anas platyrhynchos). Behavioral Ecology 13:543-550.
Drewien, R.C., W. M. Brown, and W. L. Kendall. 1995. Recruitment in Rocky Mountain Greater sandhill cranes and comparison with other crane populations. Journal of Wildlife Management 59:339-356.
Drewien, R. C., W. M. Brown, D. C. Lockman, W. L. Kendall, K. R. Clegg, V. K. Graham, and S. S. Manes. 2000. Band recoveries, mortality factors, and survival of Rocky Mountain Greater Sandhill Cranes, 1969-99. Unpublished report, U.S. Fish and Wildlife Service, Denver, CO.
Eddleman, W. R., and C. J. Conway. 1998. Clapper Rail (Rallus longirostris), The Birds of North America Online (A. Poole, Ed.). Ithaca: Cornell Lab of Ornithology; Retrieved from the Birds of North America Online: http://bna.birds.cornell.edu.ezp1.lib.umn.edu/bna/species/340
Francis, C. M. 1995. How useful are recoveries of North American passerines for survival analyses? Journal of Applied Statistics 22:1075-1081.
Franklin, A. B., D. R. Anderson, and K. P. Burnham. 2002. Estimation of long-term trends and variation in avian survival probabilities using random effects models. Journal of Applied Statistics 29:267-287.
Krementz, D. G., J. E. Hines, and D. R. Luukkonen. 2003. Survival and recovery rates of American woodcock banded in Michigan. Journal of Wildlife Management 67:398-407.
Lebreton, J.-D., K. P. Burnham, J. Clobert, and D. R. Anderson. 1992. Modeling survival and testing biological hypotheses using marked animals: a unified approach with case studies. Ecological Monographs 62:67-118.
10

Martin, T. E., and P. Li. 1992. Life history traits of open- vs. cavity-nesting birds. Ecology 73:579-592.
Mueller, H. 1999. Wilson's Snipe (Gallinago delicata), The Birds of North America Online (A. Poole, Ed.). Ithaca: Cornell Lab of Ornithology; Retrieved from the Birds of North America Online: http://bna.birds.cornell.edu.ezp1.lib.umn.edu/bna/species/417
Nichols, J. D., R. E. Reynolds, R. J. Blohm, R. E. Trost, J. E. Hines, and J. P. Bladen. 1995. Geographic variation in band reporting rates for mallards based on reward banding. Journal of Wildlife Management 59:697-708.
Otis, D. L., J. H. Schulz, and D. P. Scott. 2008. Mourning dove (Zenaida macroura) harvest and population parameters derived from a national banding study. U.S. Fish and Wildlife Service Biological Technical Publication BTP-R3010-2008.
Rice, M. B., D. A. Haukos, J. A. Dubovsky, and M. C. Runge. 2010. Continental survival and recovery rates of northern pintails using band-recovery data. Journal of Wildlife Management 74:778-787.
Robinson, W. D., M. S. Bowlin, I. Bisson, J. Shamoun-Baranes, K. Thorup, R. H. Diehl, T. H. Kunz, S. Mabey, and D. W. Winkler. 2010. Integrating concepts and technologies to advance the study of bird migration. Frontiers in Ecology Environment 8: 354-361.
Ryder, R. A. 1963. Migration and population dynamics of American coots in western North America. Proceedings of the International Ornithological Congress 13:441-453.
Sæther, B. E., and Ø. Bakke. 2000. Avian life history variation and contribution of demographic traits to the population growth rate. Ecology 81:642–653.
Schaub, M., and R. Pradel. 2004. Assessing the relative importance of different sources of mortality from recoveries of marked animals. Ecology 85:930-938.
Schaub, M., and J. A. Royle. 2013. Estimating true instead of apparent survival using spatial Cormack-Jolly-Seber models. Methods in Ecology and Evolution (early view).
Smith, G. W., and R. E. Reynolds. 1992. Hunting and mallard survival, 1979-88. Journal of Wildlife Management 56: 306-316.
Tacha, T. C., and C. E. Braun (eds.). 1994. Migratory shore and upland game bird management in North America. International Association of Fish and Wildlife Agencies, Washington, DC
Tacha, T. C., S. A. Nesbitt and P. A. Vohs. 1992. Sandhill Crane (Grus canadensis), The Birds of North America Online (A. Poole, Ed.). Ithaca: Cornell Lab of Ornithology; Retrieved from the Birds of North America Online: http://bna.birds.cornell.edu.ezp1.lib.umn.edu/bna/species/031
Weatherhead, P. J., and C. D. Ankney. 1984. Comment: a critical assumption of band-recovery models may often be violated. Wildlife Society Bulletin 12: 198-199.
White, G. C. 2000. Population viability analysis: data requirements and essential analyses. Pages 288–331 in L. Boitani and T. K. Fuller, editors. Research techniques in animal ecology: controversies and consequences. Columbia University Press, New York, NY.
White, G. C., and K. P. Burnham. 1999. Program MARK: Survival estimation from populations of marked animals. Bird Study 46: S120-S139:
11

White, G. C., L. S. Cordes, and T. W. Arnold. 2013. Band reporting rates of waterfowl: does individual heterogeneity bias estimated survival rates? Ecology and Evolution 3:4215-4220.
12
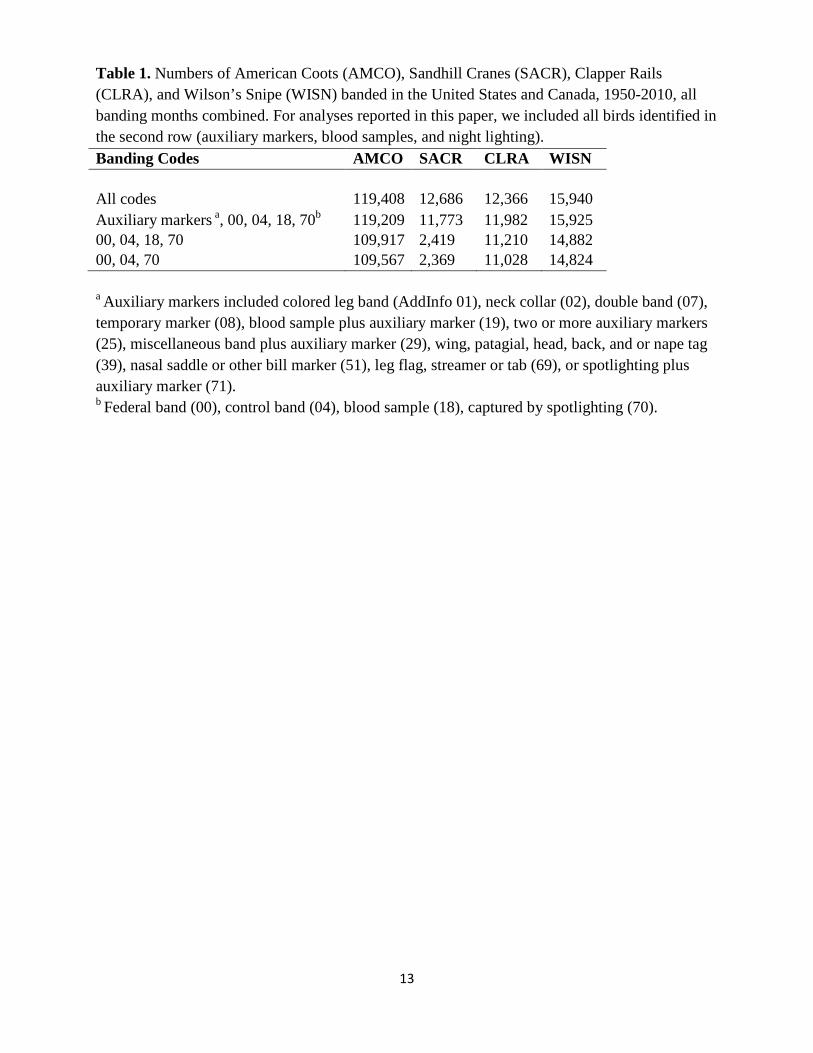
Table 1. Numbers of American Coots (AMCO), Sandhill Cranes (SACR), Clapper Rails (CLRA), and Wilson’s Snipe (WISN) banded in the United States and Canada, 1950-2010, all banding months combined. For analyses reported in this paper, we included all birds identified in the second row (auxiliary markers, blood samples, and night lighting). Banding Codes AMCO SACR CLRA WISN All codes
119,408 12,686 12,366 15,940 Auxiliary markers a, 00, 04, 18, 70b 119,209 11,773 11,982 15,925 00, 04, 18, 70 109,917 2,419 11,210 14,882 00, 04, 70 109,567 2,369 11,028 14,824
a Auxiliary markers included colored leg band (AddInfo 01), neck collar (02), double band (07), temporary marker (08), blood sample plus auxiliary marker (19), two or more auxiliary markers (25), miscellaneous band plus auxiliary marker (29), wing, patagial, head, back, and or nape tag (39), nasal saddle or other bill marker (51), leg flag, streamer or tab (69), or spotlighting plus auxiliary marker (71). b Federal band (00), control band (04), blood sample (18), captured by spotlighting (70).
13

Table 2: Samples sizes used for analyses of annual survival rates from band-recovery data for Migratory Shore and Upland Game Birds. For bandings of hatch year (HY) or unknown age (Unk) birds, recoveries are partitioned into direct (HY/Unk) versus indirect (Adult, AHY) recoveries. For Clapper Rails, shaded cells indicate insufficient data for analysis.
HY/Unk Recoveries Adult Recoveries
Species1 Period Age Banded Shot Other Live Shot Other Live AMCO Year round HY 33,100 510 103 14 158 47 23
Unk 45,793 224 80 33 520 230 280
AHY 39,046
551 184 313
Preseason HY 30,035 478 77 7 131 21 4
Unk 9,313 93 15 3 64 13 6
AHY 14,932
212 42 14
Postseason All 31,581
467 83 171
CLRA Year round HY 3,549 79 4 2 28 5 26
Unk 1,757 12 2 0 11 1 0
AHY 6,023
127 23 368
Preseason HY 3,041 17 2 0 25 3 0
Unk 1,152 12 2 0 6 0 0
AHY 1,100
25 4 0
Postseason All 237
3 0 0
SACR Year round HY 4,441 15 31 16 115 83 50
Unk 673 1 0 0 39 4 5
AHY 6,659
201 107 185
Preseason HY 2,797 15 19 4 86 26 19
Unk 14 0 0 0 0 0 0
AHY 1,310
30 18 30
Postseason SY 567 2 2 1 12 2 3
Unk 906 7 1 0 32 2 5
ASY 3,347
114 24 34
WISN Year round HY 4,708 43 11 1 22 7 17
Unk 4,255 26 3 1 41 18 19
AHY 6,930
86 36 29
Preseason HY 3,607 27 2 0 15 3 6
Unk 756 9 0 0 8 1 0
AHY 1,062
15 1 1
Postseason All 4,911
64 11 13
1 AMCO American Coot, CLRA Clapper Rail, SACR Sandhill Crane, WISN Wilson’s Snipe
14

Table 3. Beta parameter estimates and SE from trend models used to predict logit survival (S) or logit encounter rate (f or r) as a linear function of year (1950=1, 2010=61). Intercepts of >4 for survival (predicted S > 0.98) or >0 for encounter rates (predicted f or r > 0.5) are highlighted in gray, and these models are considered highly suspect.
HY Survival/Encounter AHY Survival/Encounter
Species Parm Model Int SE Slope SE Int SE Slope SE AMCO S Brownie -0.444 0.220 -0.002 0.009 0.292 0.056 0.003 0.003
S Seber 5.004 0.140 -0.038 0.011 0.310 0.056 0.003 0.003
CLRA S Brownie -1.976 0.521 0.073 0.032 0.386 0.344 -0.013 0.015
S Seber -1.849 0.506 0.076 0.031 0.497 0.395 -0.018 0.018
SACR S Brownie 1787.6 763.8 -30.6 12.4 1.731 0.239 0.006 0.006
S Seber 4.785 0.716 0.012 0.024 1.716 0.233 0.007 0.006
WISN S Brownie -2.610 1.621 0.131 0.111 1.500 0.349 -0.036 0.015
S Seber -2.769 0.654 0.143 0.039 1.471 0.333 -0.035 0.014
MODO S Brownie -0.623 0.028 -0.002 0.001 0.270 0.013 -0.012 0.000
S Seber 4.302 0.014 -0.006 0.000 0.232 0.013 -0.011 0.000
AMCO f Brownie -4.245 0.074 -0.020 0.003 -5.455 0.052 -0.010 0.003
r Seber 6.069 1.006 -0.190 0.019 -4.642 0.042 -0.015 0.002
CLRA f Brownie -3.725 0.173 -0.051 0.011 -4.143 0.286 -0.042 0.013
r Seber -3.613 0.197 -0.027 0.016 -3.264 0.261 -0.054 0.011
SACR f Brownie -4.568 0.471 -0.020 0.014 -6.059 0.204 0.008 0.005
r Seber 13.823 22.012 -0.239 0.362 -4.133 0.186 0.014 0.005
WISN f Brownie -5.389 0.279 0.012 0.012 -5.744 0.290 -0.009 0.013
r Seber -6.623 0.688 0.124 0.046 -4.130 0.259 -0.031 0.011
MODO f Brownie -4.362 0.010 0.007 0.000 -4.881 0.012 0.008 0.000
r Seber 0.715 0.167 0.215 0.021 -4.532 0.009 0.004 0.000
15

Fig. 1. Estimates of mean annual survival for Sandhill Cranes from models including only age effects on survival and recovery rates. Data sets varied according to banding period: all year, preseason (1 Jul – 30 Sep), or postseason (15 Jan – 31 Mar) and recovery method: shot, other dead, and live (terminal encounters only). Bandings and recoveries were from the United States and Canada, 1950-2010. Juvenile survival point estimates of 1 (year-round other, preseason shot) and 0 (postseason other) are omitted from the figure.
16
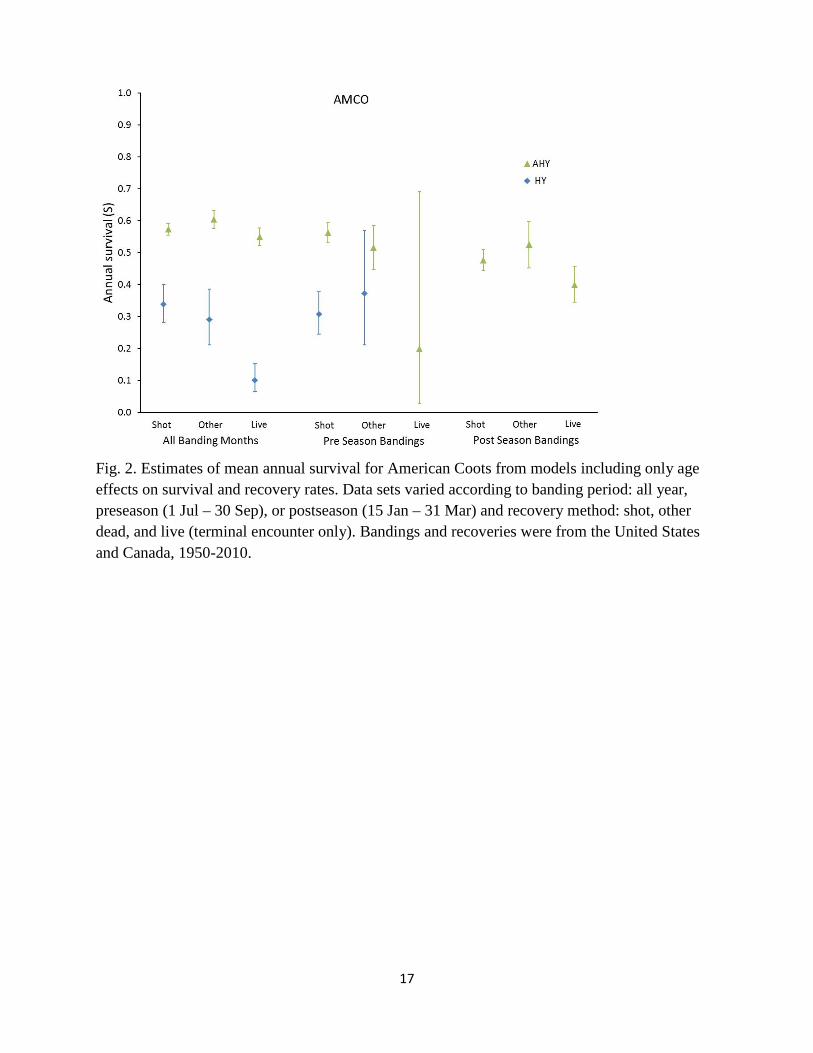
Fig. 2. Estimates of mean annual survival for American Coots from models including only age effects on survival and recovery rates. Data sets varied according to banding period: all year, preseason (1 Jul – 30 Sep), or postseason (15 Jan – 31 Mar) and recovery method: shot, other dead, and live (terminal encounter only). Bandings and recoveries were from the United States and Canada, 1950-2010.
17

Fig. 3. Estimates of mean annual survival for Clapper Rails from models including only age effects on survival and recovery rates. Data sets varied according to banding period: all year, preseason (1 Jul – 30 Sep), or postseason (15 Jan – 31 Mar) and recovery method: shot, other dead, and live (terminal encounter only). Bandings and recoveries were from the eastern United States, 1950-2010.
18
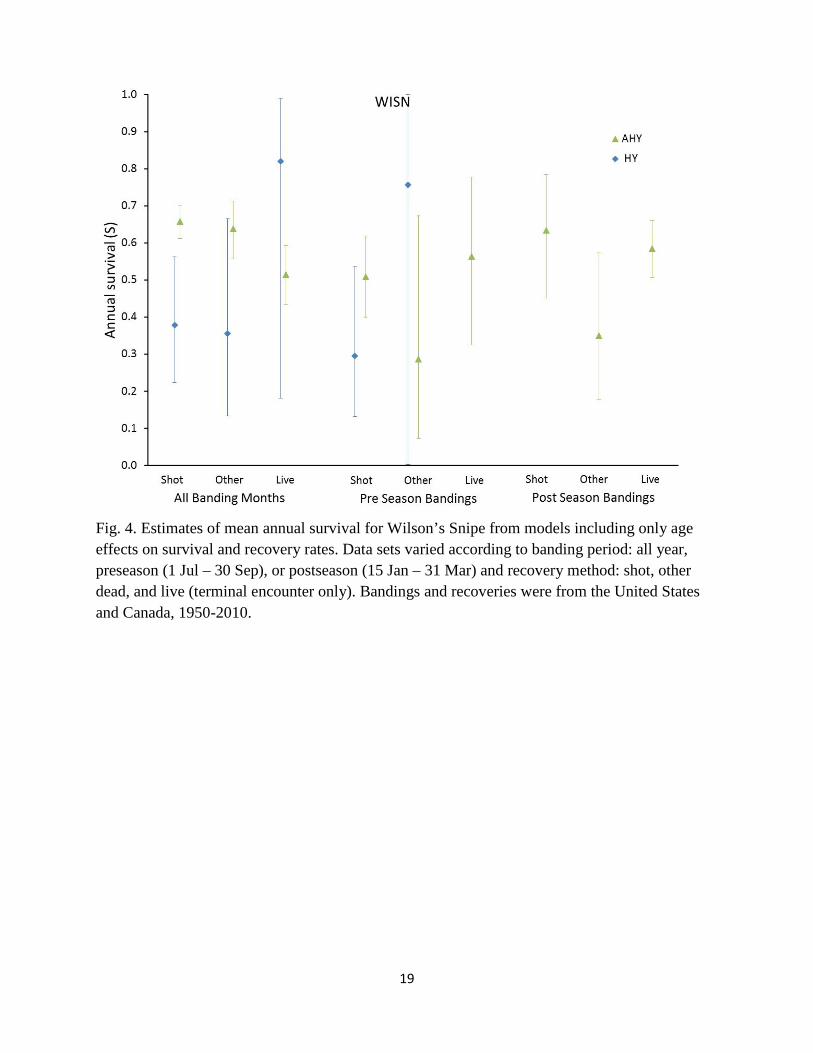
Fig. 4. Estimates of mean annual survival for Wilson’s Snipe from models including only age effects on survival and recovery rates. Data sets varied according to banding period: all year, preseason (1 Jul – 30 Sep), or postseason (15 Jan – 31 Mar) and recovery method: shot, other dead, and live (terminal encounter only). Bandings and recoveries were from the United States and Canada, 1950-2010.
19

Fig. 5. Estimates of mean annual survival for Mourning Doves from models including only age effects on survival and recovery rates. Data sets varied according to banding period: all year, preseason (1 Jul – 30 Sep), or postseason (15 Jan – 31 Mar) and recovery method: shot, other dead, and live (terminal encounter only). Bandings and recoveries were from the United States and Canada, 1950-2010.
20
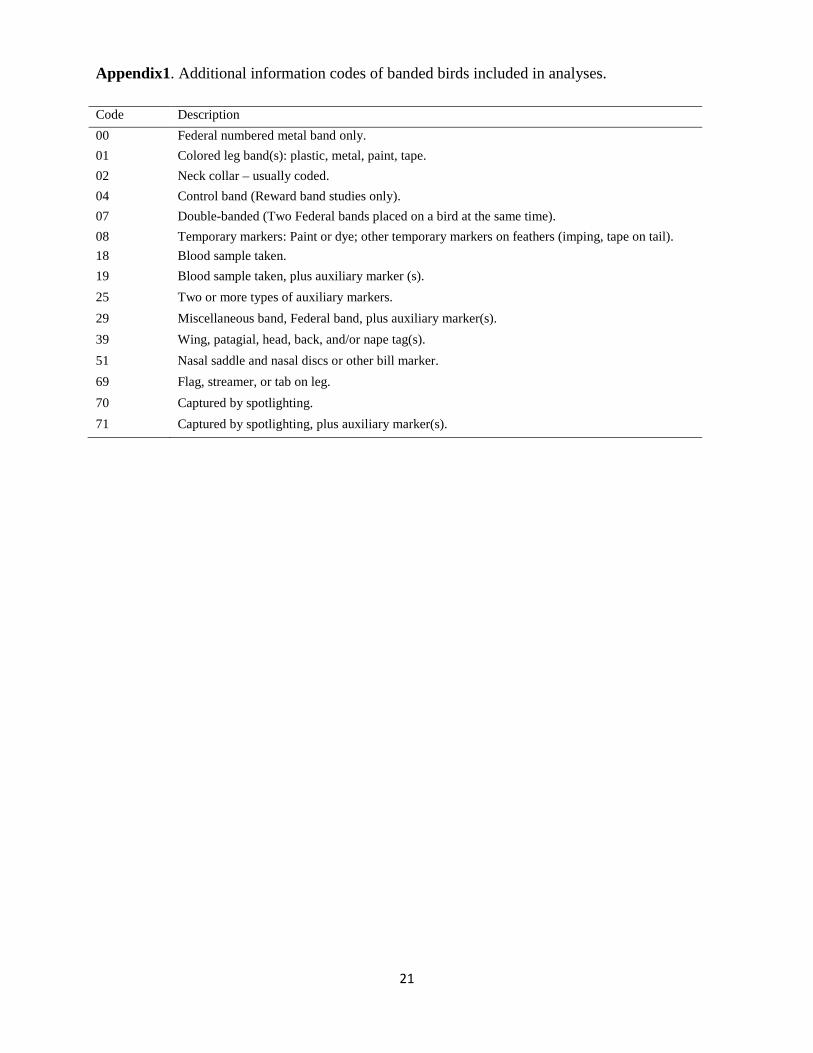
Appendix1. Additional information codes of banded birds included in analyses. Code Description 00 Federal numbered metal band only. 01 Colored leg band(s): plastic, metal, paint, tape. 02 Neck collar – usually coded. 04 Control band (Reward band studies only). 07 Double-banded (Two Federal bands placed on a bird at the same time). 08 Temporary markers: Paint or dye; other temporary markers on feathers (imping, tape on tail). 18 Blood sample taken. 19 Blood sample taken, plus auxiliary marker (s). 25 Two or more types of auxiliary markers. 29 Miscellaneous band, Federal band, plus auxiliary marker(s). 39 Wing, patagial, head, back, and/or nape tag(s). 51 Nasal saddle and nasal discs or other bill marker. 69 Flag, streamer, or tab on leg. 70 Captured by spotlighting. 71 Captured by spotlighting, plus auxiliary marker(s).
21

Appendix 2. Annual survival (S) and recovery (f) estimates for juvenile (HY) and adult (AHY) Sandhill Cranes (SACR), American Coots (AMCO), Clapper Rails (CLRA), Wilson’s Snipe (WISN), and Mourning Doves (MODO) based on models that predicted constant survival and recovery rates through time (e.g. Sa2,fa2). Sample sizes of HY and AHY (last 2 columns) represent numbers of recoveries during each age class. Gray-shaded cells indicate estimates based on ≤25 band recoveries, and yellow-shaded cells indicate boundary estimates (0 or 1) or convergence failure.
Spp Period Type HY S SE AHY S SE HY f SE AHY f SE HY AHY SACR All Shot 0.8002 0.0894 0.8946 0.0070 0.0034 0.0009 0.0040 0.0003 15 355
Other 1.0000 0.0000 0.8604 0.0111 0.0070 0.0013 0.0027 0.0003 31 194
Live 0.4119 0.0652 0.7869 0.0134 0.0036 0.0009 0.0063 0.0006 16 240
Pre Shot 1.0000 0.0000 0.9006 0.0122 0.0054 0.0014 0.0033 0.0004 15 116
Other 0.6334 0.1931 0.8953 0.0203 0.0068 0.0016 0.0018 0.0005 19 44
Live 0.2849 0.0830 0.8371 0.0245 0.0014 0.0007 0.0042 0.0009 4 49
Post Shot 0.5854 0.1756 0.8859 0.0108 0.0035 0.0025 0.0045 0.0005 2 144
Other 0.4911 0.3607 0.5978 0.0618 0.0035 0.0025 0.0029 0.0007 2 28
Live 0.0000 0.0000 0.6290 0.0500 0.0018 0.0018 0.0038 0.0008 1 39
AMCO All Shot 0.3385 0.0304 0.5740 0.0092 0.0154 0.0007 0.0060 0.0003 510 1,229
Other 0.2916 0.0448 0.6048 0.0144 0.0031 0.0003 0.0019 0.0001 103 461
Live 0.1009 0.0219 0.5506 0.0140 0.0004 0.0001 0.0031 0.0002 14 572
Pre Shot 0.3073 0.0340 0.5632 0.0163 0.0159 0.0007 0.0062 0.0005 478 407
Other 0.3730 0.0954 0.5162 0.0356 0.0026 0.0003 0.0009 0.0001 77 76
Live 0.0002 0.0416 0.2002 0.1791 0.0002 0.0001 0.5888 135.21 7 24
Post Shot NA NA 0.4769 0.0167 NA NA 0.0077 0.0004 NA 467
Other NA NA 0.5261 0.0378 NA NA 0.0012 0.0002 NA 83
Live NA NA 0.4003 0.0290 NA NA 0.0032 0.0003 NA 171
CLRA All Shot 0.3689 0.0766 0.5038 0.0275 0.0223 0.0025 0.0106 0.0011 79 166
Other 0.3634 0.1792 0.5284 0.0640 0.0011 0.0006 0.0018 0.0005 4 29
Live 0.1177 0.0238 0.6073 0.0155 0.0006 0.0004 0.0245 0.0016 2 394
Pre Shot 0.3454 0.0969 0.4831 0.0485 0.0247 0.0028 0.0123 0.0027 75 56
Other 0.2546 0.1943 0.6380 0.1104 0.0007 0.0005 0.0014 0.0008 2 7
WISN All Shot 0.3777 0.0900 0.6582 0.0228 0.0091 0.0014 0.0043 0.0005 43 149
Other 0.3562 0.1498 0.6384 0.0399 0.0023 0.0007 0.0015 0.0003 11 61
Live 0.8200 0.2282 0.5146 0.0409 0.0002 0.0002 0.0025 0.0005 1 65
Pre Shot 0.2955 0.1074 0.5082 0.0572 0.0075 0.0014 0.0070 0.0020 27 38
Other 0.7559 0.6897 0.2868 0.1714 0.0006 0.0004 0.0008 0.0006 2 5
Live 1.0000 0.0000 0.5642 0.1243 0.0000 0.0000 0.0007 0.0003 0 7
Post Shot NA NA 0.5851 0.0398 NA NA 0.0054 0.0008 NA 64
Other NA NA 0.6340 0.0881 NA NA 0.0008 0.0003 NA 11
Live NA NA 0.3503 0.1068 NA NA 0.0017 0.0006 NA 13
22
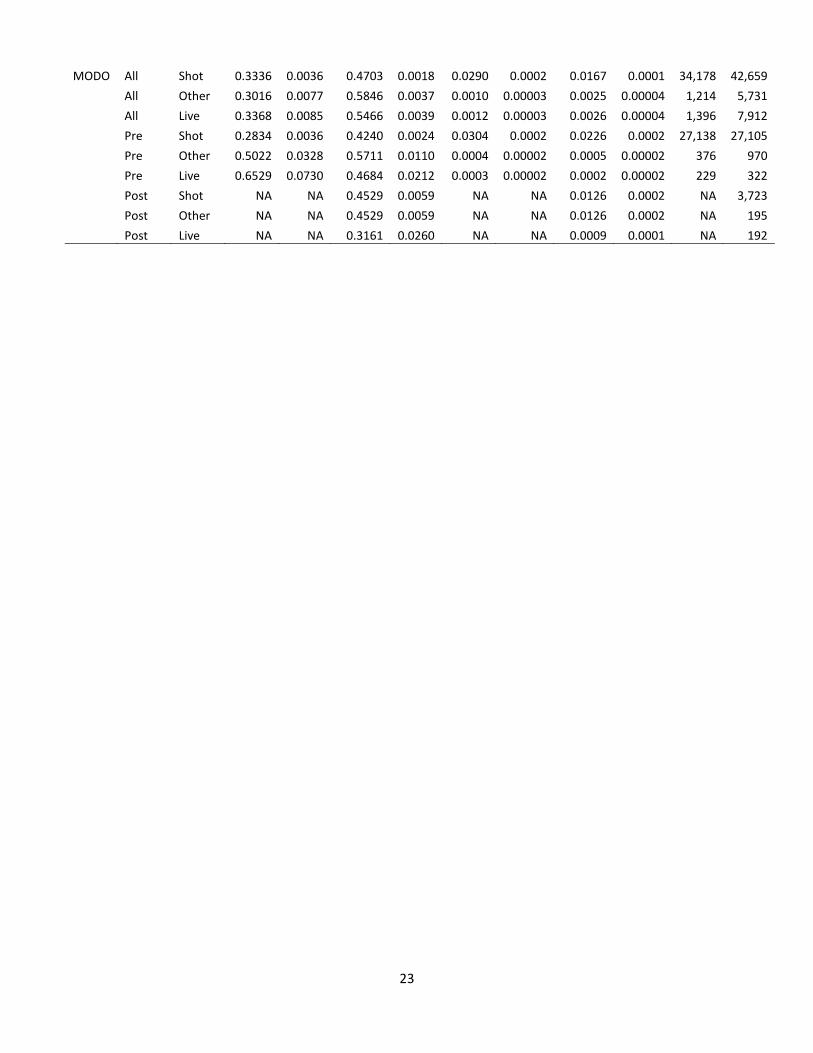
MODO All Shot 0.3336 0.0036 0.4703 0.0018 0.0290 0.0002 0.0167 0.0001 34,178 42,659
All Other 0.3016 0.0077 0.5846 0.0037 0.0010 0.00003 0.0025 0.00004 1,214 5,731
All Live 0.3368 0.0085 0.5466 0.0039 0.0012 0.00003 0.0026 0.00004 1,396 7,912
Pre Shot 0.2834 0.0036 0.4240 0.0024 0.0304 0.0002 0.0226 0.0002 27,138 27,105
Pre Other 0.5022 0.0328 0.5711 0.0110 0.0004 0.00002 0.0005 0.00002 376 970
Pre Live 0.6529 0.0730 0.4684 0.0212 0.0003 0.00002 0.0002 0.00002 229 322
Post Shot NA NA 0.4529 0.0059 NA NA 0.0126 0.0002 NA 3,723
Post Other NA NA 0.4529 0.0059 NA NA 0.0126 0.0002 NA 195
Post Live NA NA 0.3161 0.0260 NA NA 0.0009 0.0001 NA 192
23

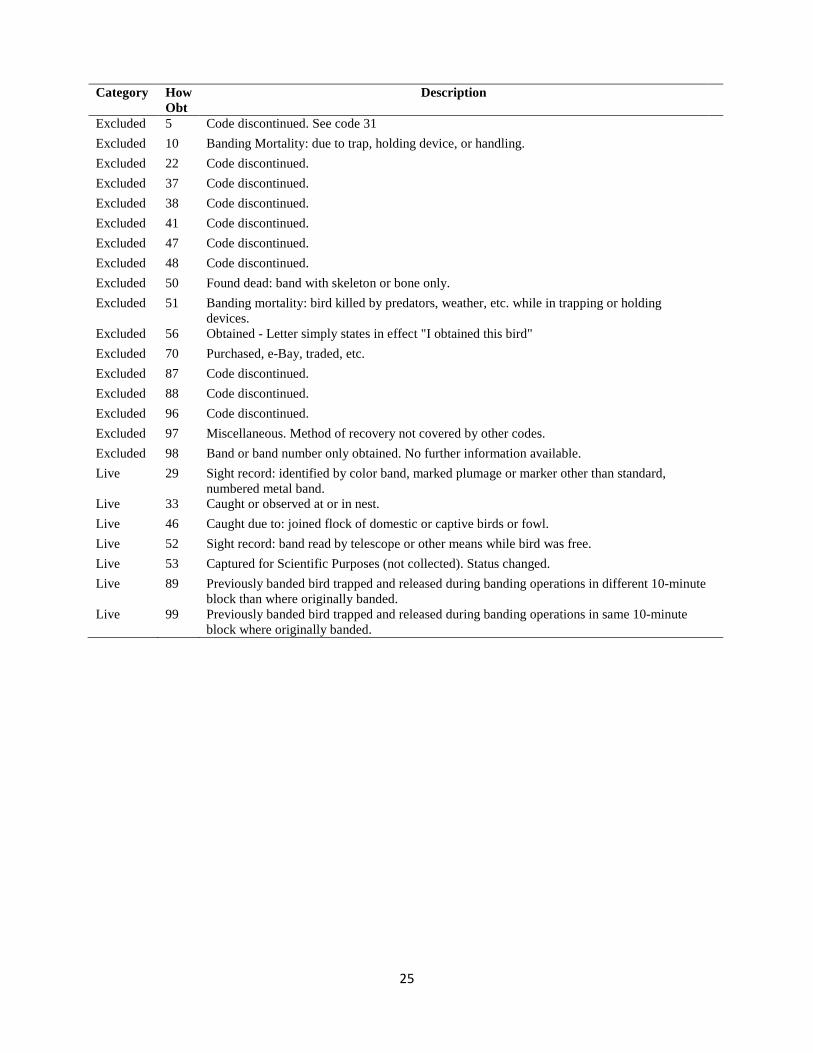
Appendix 3: Categorizations of How Obtained recovery codes into different recovery types (Shot, [Other] Dead, and Live) used in analyses of survival and recovery rates of Sandhill Cranes, American Coots, Clapper Rails, and Wilson’s Snipe. Category How
Obt Description
Shot 01 Shot. Dead 00 Found dead. Dead 02 Caught or found dead due to: starvation Dead 03 Caught due to: injury Dead 04 Caught by or due to: traps or snares other than devices used to catch birds for banding. Dead 06 Caught by or due to: rodent Dead 07 Caught by or due to: miscellaneous birds Dead 08 Caught by or due to: shrike Dead 09 Caught by or due to: hawks, owls, or other raptors. Dead 11 Caught by or due to: dog Dead 12 Caught by or due to: cat Dead 13 Caught due to striking: stationary object other than wires or towers. Dead 14 Caught due to striking or being struck by: motor vehicle. Dead 15 Caught or found dead due to: weather conditions. Dead 16 Collected as Scientific Specimen or captured for a Scientific Study. Dead 17 Drowned. Dead 18 Caught or found dead due to disease: botulism Dead 20 Caught due to disease. Dead 21 Bird caught or found dead in building or enclosure. Dead 23 Caught or found dead due to: oil or tar Dead 24 Caught or killed due to: fall from nest. Dead 25 Caught or killed due to: Poisoning Dead 26 Caught by or due to: entanglement in fishing gear Dead 27 Caught by or found dead due to striking or being struck by: moving train. Dead 28 Caught by hand. Dead 30 Died in nest. Dead 31 Caught by or due to: miscellaneous animal. Dead 34 Caught or found dead due to: fish Dead 36 Caught due to: exhaustion Dead 39 Caught or found dead due to striking or being struck by: moving aircraft. Dead 42 Caught due to striking or being struck by: moving farm machinery. Dead 43 Caught or found dead due to disease: trichomoniasis Dead 44 Caught or found dead due to control operations (roost bombing, gassing, avicides, etc.) Dead 45 Found dead or injured on highway. Dead 49 Caught at, on or in nest by predator. Dead 54 Caught due to striking: radio, TV, high tension, etc. wires or towers, or ceilometers. Dead 55 Caught due to pesticides. Birds reported killed or captured as a result of spray programs. Dead 57 Caught due to entanglement in anything other than fishing gear. Dead 91 Illegally taken
24
Category How
Obt Description
Excluded 5 Code discontinued. See code 31 Excluded 10 Banding Mortality: due to trap, holding device, or handling. Excluded 22 Code discontinued. Excluded 37 Code discontinued. Excluded 38 Code discontinued. Excluded 41 Code discontinued. Excluded 47 Code discontinued. Excluded 48 Code discontinued. Excluded 50 Found dead: band with skeleton or bone only. Excluded 51 Banding mortality: bird killed by predators, weather, etc. while in trapping or holding
devices.
Excluded 56 Obtained - Letter simply states in effect "I obtained this bird" Excluded 70 Purchased, e-Bay, traded, etc. Excluded 87 Code discontinued. Excluded 88 Code discontinued. Excluded 96 Code discontinued. Excluded 97 Miscellaneous. Method of recovery not covered by other codes. Excluded 98 Band or band number only obtained. No further information available. Live 29 Sight record: identified by color band, marked plumage or marker other than standard,
numbered metal band. Live 33 Caught or observed at or in nest. Live 46 Caught due to: joined flock of domestic or captive birds or fowl. Live 52 Sight record: band read by telescope or other means while bird was free. Live 53 Captured for Scientific Purposes (not collected). Status changed. Live 89 Previously banded bird trapped and released during banding operations in different 10-minute
block than where originally banded. Live 99 Previously banded bird trapped and released during banding operations in same 10-minute
block where originally banded.
25