
ESTIMATES OF AADT: Q UANTIFYING THE UNCER … · 2006-08-04 · ESTIMATES OF AADT: Q UANTIFYING THE...
25
ESTIMATES OF AADT: QUANTIFYING THE UNCERTAINTY Shashank Gadda Graduate Student Researcher Department of Civil Engineering The University of Texas at Austin ECJ 6.9, Austin, Texas 78712 Email: [email protected] Atul Magoon Undergraduate Summer Intern Department of Civil Engineering The University of Texas at Austin ECJ 6.9, Austin, Texas 78712 Email: [email protected] Kara M. Kockelman William J. Murray Jr. Associate Professor of Civil, Architectural and Environmental Engineering The University of Texas at Austin ECJ 6.9, Austin, Texas 78712 Tel: (512) 471-4379 FAX: (512) 475-8744 Email: [email protected] Submitted for presentation at the 86 th Annual Meeting of the Transportation Research Board, Washington, D.C., January 2007, and for publication in Transportation Research Record Word Count: 5369 + 4 tables + 12 Figures = 9369 words ABSTRACT AADT values provide a key variable in many models and policy decisions; however, these are simply rough estimates of traffic counts along the vast majority of roadway sections. This research quantifies the level of uncertainty in AADT estimates and compares these across sampling strategies. Variations in AADT estimation errors are investigated across roadway and area types, for both Minnesota and Florida automatic traffic recorder (ATR) sites. Errors as a function of distance to the nearest sampling site are also studied, using predictions of network travel patterns in Austin, Texas. Overall errors at ATR sites are found to be highest (averaging 24.6%) when data come from misclassified sites on weekends. Spatial and temporal (inter-sampling year) extrapolations can further add to such error, in a sizable way. The analytical results of this investigation suggest a variety of recommendations for agencies seeking to reduce and appreciate errors in their AADT estimates. These include sampling in spring and summer months (on weekdays), exercising greater caution with counts on multi- lane and low-AADT roadways, pursuing appropriate site assignment to ATR groups, and recognizing the effects of distance to the sampling site. With adequate attention, (average) errors in AADT estimates can probably be reduced to the 10 percent level. Nevertheless, these still will have an impact on investment decisions, crash rate calculations, travel demand model validation, and other analyses.
Transcript of ESTIMATES OF AADT: Q UANTIFYING THE UNCER … · 2006-08-04 · ESTIMATES OF AADT: Q UANTIFYING THE...

ESTIMATES OF AADT: QUANTIFYING THE UNCERTAINTY
Shashank GaddaGraduate Student Researcher
Department of Civil EngineeringThe University of Texas at Austin
ECJ 6.9, Austin, Texas 78712Email: [email protected]
Atul MagoonUndergraduate Summer Intern
Department of Civil EngineeringThe University of Texas at Austin
ECJ 6.9, Austin, Texas 78712Email: [email protected]
Kara M. KockelmanWilliam J. Murray Jr. Associate Professor of Civil,
Architectural and Environmental EngineeringThe University of Texas at Austin
ECJ 6.9, Austin, Texas 78712Tel: (512) 471-4379
FAX: (512) 475-8744Email: [email protected]
Submitted for presentation at the 86th Annual Meeting of the Transportation Research Board, Washington, D.C., January 2007, and for publication in Transportation Research Record
Word Count: 5369 + 4 tables + 12 Figures = 9369 words
ABSTRACTAADT values provide a key variable in many models and policy decisions; however, these are simply rough estimates of traffic counts along the vast majority of roadway sections. This research quantifies the level of uncertainty in AADT estimates and compares these across sampling strategies. Variations in AADT estimation errors are investigated across roadway and area types, for both Minnesota and Florida automatic traffic recorder (ATR) sites. Errors as a function of distance to the nearest sampling site are also studied, using predictions of network travel patterns in Austin, Texas. Overall errors at ATR sites are found to be highest (averaging 24.6%) when data come from misclassified sites on weekends. Spatial and temporal (inter-sampling year) extrapolations can further add to such error, in a sizable way.
The analytical results of this investigation suggest a variety of recommendations for agenciesseeking to reduce and appreciate errors in their AADT estimates. These include sampling in spring and summer months (on weekdays), exercising greater caution with counts on multi-lane and low-AADT roadways, pursuing appropriate site assignment to ATR groups, and recognizing the effects of distance to the sampling site. With adequate attention, (average) errors in AADT estimates can probably be reduced to the 10 percent level. Nevertheless, these still will have an impact on investment decisions, crash rate calculations, travel demand model validation, and other analyses.

Keywords: Annual average daily traffic (AADT), traffic counts, VMT estimation, automatic traffic recorders
INTRODUCTIONAADT is a key variable in many models and policy decisions, producing VMT estimates for analyses of crash rates, evaluation of infrastructure management needs, air quality compliance and validation of travel demand model predictions. Despite their importance, AADT values are simply rough estimates of traffic counts along the vast majority of roadway sections. In the U.S. these emerge from short-period traffic counts (SPTCs) in which one- to three-day samples are taken every few years at select points across large-scale networks. These counts are factored up to a yearly estimate based on year-to-year trends, sampling season and day-of-week factors developed using data obtained from permanent automatic traffic recorder (ATR) stations.
The number and spatial frequency of ATR sites and the durations and timing of the remaining network’s SPTC vary by state and by region, as well as by functional class of roadway. For example, there are 240 ATR sites in Texas, 293 in Florida and 78 in Minnesota. In Texas sampling is done for 24 hours once every five years at roughly 90,000 sites, except in non-attainment regions, where the frequency is every three years and on-system highways, where counts are done annually. In Minnesota, the sampling is done annually, for 24 hours at roughly 78 sites. Differences in protocol, from state to state and site to site, shape the uncertainty or error in the resulting AADT estimates. It is very important that analysts, including designers, planners and policymakers, have a sense of the magnitude of these errors, in order to appreciate the reliability of their results, their designs and their policies. By attaching uncertainty information to AADT estimates (e.g., via the use of confidence intervals), more accurate results can be communicated and more robust decisions made. This paper seeks to quantify the uncertainty in AADT estimates.
AADT can be determined precisely only at sites having permanent automatic traffic recorders(ATRs) that are accurately recording traffic flows throughout the year. In most states AADT is estimated by multiplying the SPTC by day of week (DOW) and month of year (MOY) factors, from the ATR group to which the site is assigned. This assignment of an SPTC to ATR groups can be rather imprecise, and different states use different methods of assignment(FHWA 2001). The error resulting from applying the factors from ATR groups to SPTC to estimate AADT is called the factoring error. In this study, this error is considered by assigning sites using simpler but intuitive classification schemes, such as the location of thesite (urban versus rural), functional class of the roadway (arterial, collector and freeway) and number of lanes (4 or fewer, 5 or more) on which the site is located. The ATR count data used in the analyses come from Department of Transportation staff in Florida (293 ATR sites) and Minnesota (58 ATR sites).
It is expensive to have short term counts on all roadway segments (e.g., every mile in a network); thus, the spatial frequency and timing of SPTC varies from state to state. Due to this, many segments are assigned an AADT estimated from the nearest SPTC location. The error involved in such assignments is referred to here as the spatial error. Since we do not have access to closely spaced traffic counts, this error is studied here using travel demand modeling results for network travel patterns in the Austin, Texas region and freeway traffic counts from Performance Measurement System (PeMS) data.

In this research, the relative magnitudes of errors in AADT estimates due to short-term sampling (i.e., day-to-day random variations in traffic counts), reliance on other sites’ factors, misclassification, and spatial approximation were studied using Minnesota, Florida, Austin, and Southern California data sets. The following sections describe findings from related literature, the data used here, along with analytical results and recommendations for sampling.
LITERATURE REVIEWDespite the central nature of AADT estimates in a variety of transportation planning and policy practice, relatively little work exists in this topic area. Sharma et al. (1996) studied the precision of AADT estimates using traffic data from 63 ATR sites in Minnesota. The ATR sites were grouped into five clusters based on their characteristics. Two of the five groups represented regional routes with low seasonal traffic, one represented average rural routes, and two represented routes serving recreational areas. The results of the study show estimated AADT values to be off by 11% in 95% of the cases with “regional routes serving commuters and business trips” enjoying the smallest AADT estimation errors and heavy-traffic rural routes serving recreational areas suffering the highest errors. Sharma et al. concluded that it is most important to assign a site to its correct group; incorrect assignment carries the greatest potential for significant estimation error. They also found that estimation error falls only moderately with count duration, from 16.5% at 24 hours to 13.13% at 72 hours. Granato (1998) used a single ATR’s data in Iowa to demonstrate how use of day-of-week (DOW) and month-of-year (MOY) factors reduces AADT error by roughly 25%, as compared to using one-day counts directly. He also found that longer counts (48 and 72 hours) contribute only minimally (error falls from 11.3% to 10.9%) in improving AADT accuracy. This research builds on such earlier work by investigating variability of AADT estimates across roadway locations and functional classes, using both Florida and Minnesota ATR data sets. It examines error for different classification schemes (including misclassification) and count durations (24, 48 and 72 hours), quantifying the relative contribution of different factors.
Several more recent studies have looked at improving AADT forecasts. Most involve finding the most efficient (least-error) methods to predict AADT from SPTCs. In terms of AADT forecasts, Lam and Xu (2000) analyzed data at 13 locations and found that neural networks consistently performed better than regression analysis, and 8-hour counts (if AADT is estimated from something less than a 24-hour interval) are most appropriate. Tang et al.(2003) used historical and current-year partial daily flow data from a Hong Kong ATR to compare four different forecasting models (including neural nets, nonparametric regression, and autoregressive integrated moving average models), and they concluded that Gaussian maximum likelihood methods performed best. Jiang et al. (2006) used a weighted combination of past and present counts along 122 highway segments over a 10-year period to estimate AADT. They concluded that accuracy improved when the averaging was applied on a large scale, and that the number of SPTC could be reduced on many segments.
None of the above mentioned studies has analyzed errors that come with spatial extrapolation of SPTC data. However, Eom et al. (2006) recently used spatial statistics to improve AADT prediction along non-freeway facilities in Wake County, North Carolina. They found that amodel which takes both spatial trend and spatial correlation into account provides better predictions for locations where no observed count data exist. Nevertheless, the level of spatial errors from simple extrapolation needs to be quantified. To address this gap in existing literature, this study uses travel demand model estimates of network flows on an average weekday in Austin, Texas. In this way, it is able to quantify AADT estimation error, as a function of distance to sampling site. In addition, using the Minnesota and Florida ATR data,
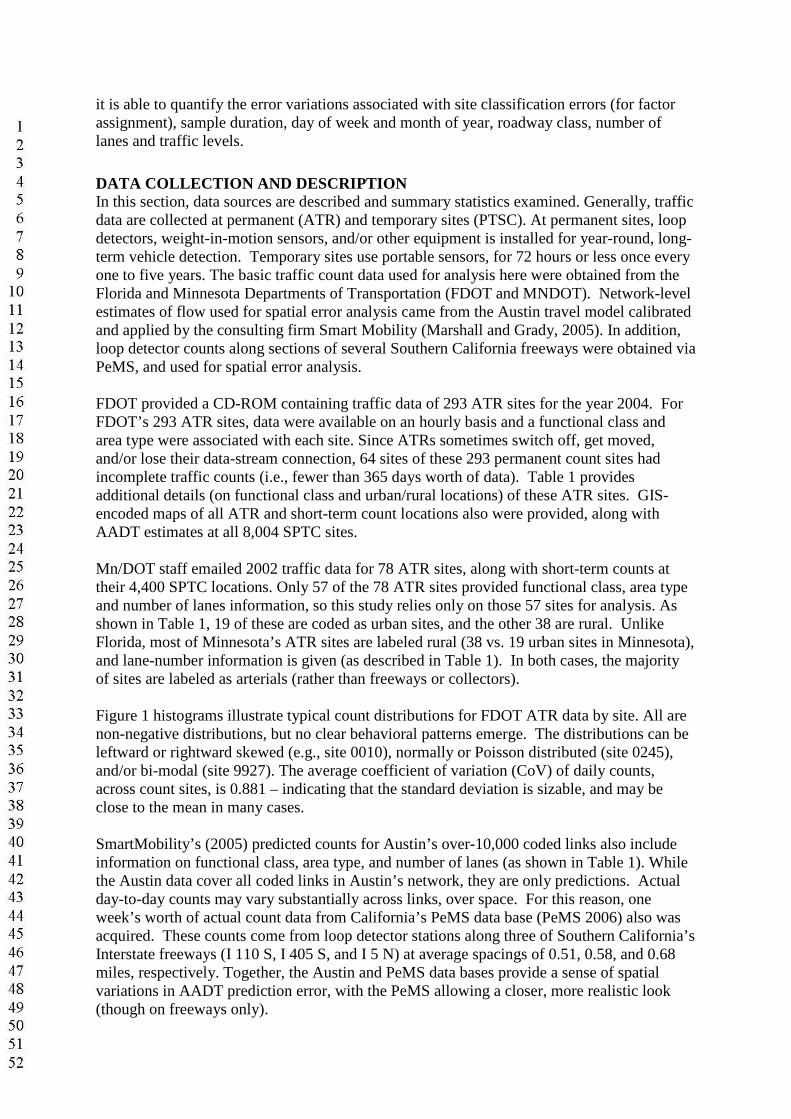
it is able to quantify the error variations associated with site classification errors (for factor assignment), sample duration, day of week and month of year, roadway class, number of lanes and traffic levels.
DATA COLLECTION AND DESCRIPTIONIn this section, data sources are described and summary statistics examined. Generally, traffic data are collected at permanent (ATR) and temporary sites (PTSC). At permanent sites, loop detectors, weight-in-motion sensors, and/or other equipment is installed for year-round, long-term vehicle detection. Temporary sites use portable sensors, for 72 hours or less once every one to five years. The basic traffic count data used for analysis here were obtained from the Florida and Minnesota Departments of Transportation (FDOT and MNDOT). Network-level estimates of flow used for spatial error analysis came from the Austin travel model calibrated and applied by the consulting firm Smart Mobility (Marshall and Grady, 2005). In addition, loop detector counts along sections of several Southern California freeways were obtained viaPeMS, and used for spatial error analysis.
FDOT provided a CD-ROM containing traffic data of 293 ATR sites for the year 2004. For FDOT’s 293 ATR sites, data were available on an hourly basis and a functional class and area type were associated with each site. Since ATRs sometimes switch off, get moved, and/or lose their data-stream connection, 64 sites of these 293 permanent count sites had incomplete traffic counts (i.e., fewer than 365 days worth of data). Table 1 provides additional details (on functional class and urban/rural locations) of these ATR sites. GIS-encoded maps of all ATR and short-term count locations also were provided, along with AADT estimates at all 8,004 SPTC sites.
Mn/DOT staff emailed 2002 traffic data for 78 ATR sites, along with short-term counts at their 4,400 SPTC locations. Only 57 of the 78 ATR sites provided functional class, area type and number of lanes information, so this study relies only on those 57 sites for analysis. As shown in Table 1, 19 of these are coded as urban sites, and the other 38 are rural. Unlike Florida, most of Minnesota’s ATR sites are labeled rural (38 vs. 19 urban sites in Minnesota), and lane-number information is given (as described in Table 1). In both cases, the majority of sites are labeled as arterials (rather than freeways or collectors).
Figure 1 histograms illustrate typical count distributions for FDOT ATR data by site. All are non-negative distributions, but no clear behavioral patterns emerge. The distributions can beleftward or rightward skewed (e.g., site 0010), normally or Poisson distributed (site 0245), and/or bi-modal (site 9927). The average coefficient of variation (CoV) of daily counts, across count sites, is 0.881 – indicating that the standard deviation is sizable, and may be close to the mean in many cases.
SmartMobility’s (2005) predicted counts for Austin’s over-10,000 coded links also include information on functional class, area type, and number of lanes (as shown in Table 1). While the Austin data cover all coded links in Austin’s network, they are only predictions. Actual day-to-day counts may vary substantially across links, over space. For this reason, one week’s worth of actual count data from California’s PeMS data base (PeMS 2006) also wasacquired. These counts come from loop detector stations along three of Southern California’sInterstate freeways (I 110 S, I 405 S, and I 5 N) at average spacings of 0.51, 0.58, and 0.68 miles, respectively. Together, the Austin and PeMS data bases provide a sense of spatial variations in AADT prediction error, with the PeMS allowing a closer, more realistic look (though on freeways only).

Differences in SPTC StandardsAs noted earlier, states and regions use different protocols in collecting short-term andpermanent counts. These protocols impact the uncertainty or error in their AADT estimates. In Florida SPTCs are taken annually at roughly 8,000 sites, at a spatial frequency of around 0.8 centerline-miles in urban areas and generally between 2 and 10 centerline-miles in rural areas. (Florida Traffic Information 2004). In Minnesota SPTCs are taken annually at around 4,400 sites, with a spatial frequency of roughly 1 mile in the urban areas and 1.5 miles in rural areas. (Mn/DOT 2006) In contrast, Texas’ short term counts are taken at approximately 80,000 sites total, at 1-, 3- or 5-year cycles, depending on whether the site lies along a state-system roadway or in a non-attainment area. They occur at an average spatial frequency of roughly 1 count per centerline mile (generally less than a mile in urban areas and potentially more than 5 miles in rural areas). (Crum 2005) Since SPTC data are taken for such a limited duration, the errors in their AADT estimates cannot be quantified without acquiring additional data. Thus, they were not examined here. However, an understanding of their duration and frequency is paramount in anticipating errors that emerge from their factoring and extrapolation over space and time.
METHODOLOGYIn this section the methods used to estimate and compare different types of error are described.
Sampling Errors and Factoring ErrorsDOW and MOY factors were created on the basis of individual-site as well as grouped-sitedata. A year’s AADT was estimated from each day’s short-term count using a variation ofthe Traffic Monitoring Guide’s (FHWA 2001) standard formula:
iiiiiiest GADMVOLAADT ****, = (1)
where AADTest,i is the estimate of annual average daily traffic count (vehicles per day) at location i, VOLi is the actual 24-hour axle volume, Mi is the applicable “seasonal” (MOY) factor (which may come from a group assignment), Di is the applicable DOW factor for factor group h, Ai is an axle-correction factor for location i, and Gi is a traffic growth factor for factor group h (for inter-sample years [and not applicable here]).
Eq. (1) can be modified as necessary, depending on the conditions used to take the short duration counts. In this study, vehicle counts (rather than axle counts) were given and analysis was done for the same year’s count, so axle-correction and traffic growth factors were not required. Moreover, every ATR site had (virtually) a full-year’s data, so month-of-year and day-of-week factors could be created expressly and precisely for each location. In this way, Eq. (1) becomes the following:
iiiiest DMVOLAADT **, = (2)
The two relevant factors for ATR site i, Mi and Di, were calculated as follows:

ii
i
AADTD DADT=
where AADTi is the true AADT (an average of all 365 days’ counts), MADT i is the average daily traffic for the applicable month in question, at location i, and DADT is the average daily traffic for the applicable day in question (e.g., all Mondays in the year, or all Fridays in the year), at that location. In this way, if a particular month of the year, or day of the week, has unusually low or high counts (e.g., January and Sunday exhibit less-than-AADT traffic levels, typically), it will have a monthly or daily factor that corrects for this bias, raising or lowering the day’s count to better reflect an annual (AADT) estimate. As noted, factors were created in two distinct ways: (1) using a site’s own data for a set of idealized factors (resulting in estimates of pure sampling error), (2) relying on other, similar sites’ data for these factors(resulting in estimates of factoring errors). For the latter approach, group membership was determined on the basis of area type (urban versus rural), functional class (freeway versus arterial, and, in the case of Florida, collector), and, in the case of Minnesota, number of lanes (2 to 4 lanes, versus 5 or more).
Error MeasurementSince both actual and estimated AADT values were available for all ATR sites, percentage errors in AADT estimation were calculated as follows:
i
iesti
i AADT
AADTAADTError
,100%
−=
These are computed as absolute errors, for purposes of averaging, and to achieve a sense of the overall magnitude of uncertainty inherent in relying on a single day’s data and/or relying on other sites’ factors.
Misclassification ErrorMisclassification error occurs when a site is assigned to an incorrect ATR group. This leads to application of the average factors of the (incorrect) ATR group to the site and may cause large errors in AADT estimation at that site. For example, if an urban site is misclassified as a rural site, the average factors of the rural ATR group are applied, in order to estimate the urban site’s AADT. These errors were quantified for the sites in both Florida and Minnesota when the sites were misclassified according to area type and functional class.
Spatial ErrorSpatial error occurs when a roadway segment is assigned the AADT from its nearest sampling site, due to non-availability of more local counts. These errors were quantified as follows. The Smart Mobility-predicted flows on the Austin travel network were assumed to be the actual counts on each of the coded 10,594 links. Then, the midpoint of a particular linkon a particular roadway was assumed to be the short term count location. The difference in flow from this location to (center points of) nearby links, along the same roadway, gave the spatial error involved in assigning the AADT at the short term count location to those links. The distance between mid-points of the links along the roadway was noted, in order to
ii
i
AADTM MADT=

appreciate how such error varies with distance from the assumed short term count site. Errorswere averaged for every 0.2 mile bin of values, in order to ascertain average error at a given distance. Seven distinct roadway sections were chosen from the Austin network, so that they included different area types, functional classes and numbers of lanes. And each provided the equivalent of three short-term count sites (using different links as starting points, or count sites). Thus, data for 21 hypothetical count sites was analyzed to estimate the extent of errorlikely caused by spatial extrapolation.
Of course, spatial extrapolation errors are compounded by temporal extrapolation (i.e., using 1 day’s count rather than 365 days’ count, and forecasting future year’s counts), mis-classification, and so forth. As in the case of all these computations, actual, total errors generally will be much higher, since they reflect all these sources of error.
Furthermore, the Austin data are simply model predictions, rather than actual counts. Actual counts may well vary greatly from day to day and link to link. To address such potential variations in spatial error, a week’s worth of PeMS data from 10 to 15 (consecutive) loop detector stations on each of three freeways (I 110 S, I 405 S, I 5 N) were used. Extrapolations were made out to almost 3 miles, and a series of 5 to 6 consecutive stations were used as the “base” station (to predict downstream counts, up to 3 miles away).
Count DurationsIn addition, the effects of longer short-period count durations were studied, to appreciate how AADT prediction errors decline. To estimate AADT using 48- and 72-hour traffic counts, the DOW and MOY factors were modified. Daily counts on consecutive calendar days were combined, and 7 DOW and 12 MOY factors were created. In these cases, DOW really characterized two or three consecutive days of the week. MOY factors used either one-half, one-third or two-third of the multi-day counts that crossed their edges (i.e., those sequences that overlapped with a different month).
RESULTS AND DISCUSSIONFigure 2 illustrates error frequencies across all sites and days for Minnesota and Florida ATR data. In Minnesota, roughly 40% of the sites exhibit average AADT estimation errors within 6% of the actual, and very few come close to 60% error. In comparison, 32% of Florida’s errors fall below 6%, and quite a few break 60%, with several sites exhibiting average errors as high as 90%. These results are supported by the finding that Florida ATR sites have a higher overall average error in AADT prediction (14%) as compared to Minnesota sites (12%).
Tables 2 and 3 present the prediction error results for Florida and Minnesota. These rely on the factors from similar sites (as determined by area type and functional class), and thus present an actual case. Using the same approach, Figures 3 through 7 illustrate how different factors affect the absolute level of errors in AADT estimation.
As can be seen from these various tables and Figures, a short-period count’s day of week and site classification have significant effects. Table 2 indicates that the average errors in estimation of AADT range from 11.5% to 20% and the maximum errors can be as high as 81%. Tables 3 shows how weekdays offer more reliable predictions than weekends, and urban sites tend to be more reliable for prediction than rural sites (particularly in Minnesota,
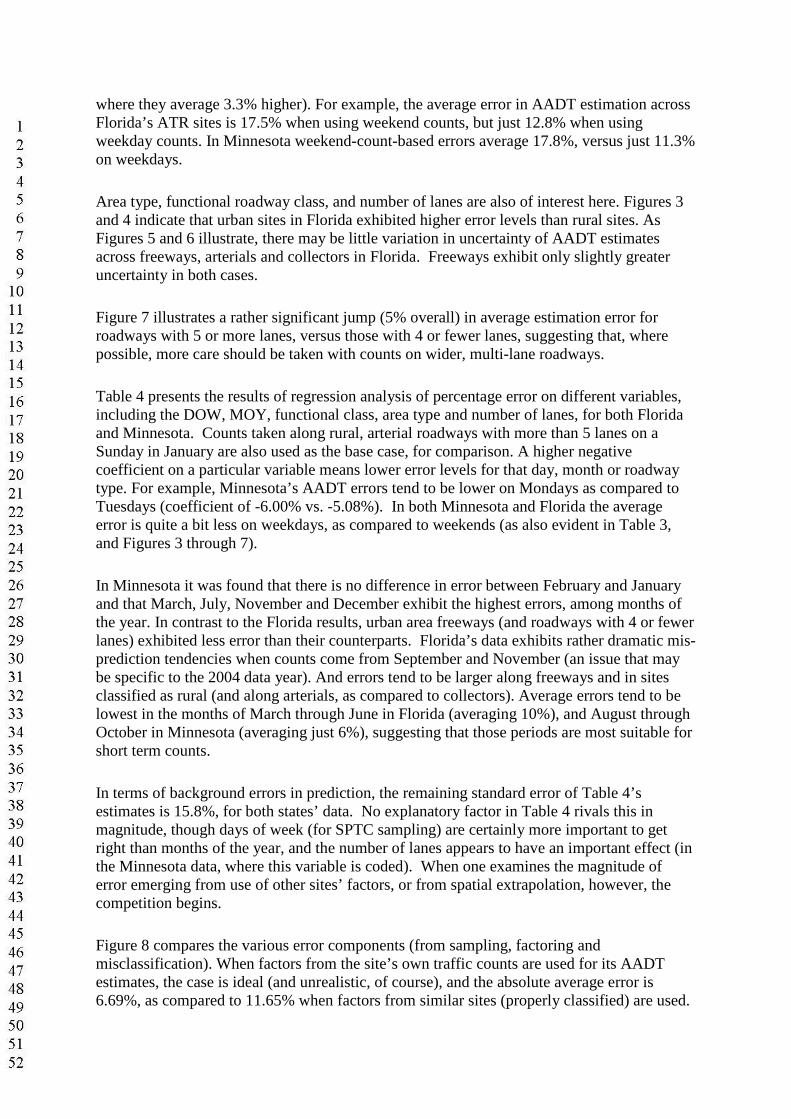
where they average 3.3% higher). For example, the average error in AADT estimation across Florida’s ATR sites is 17.5% when using weekend counts, but just 12.8% when using weekday counts. In Minnesota weekend-count-based errors average 17.8%, versus just 11.3% on weekdays.
Area type, functional roadway class, and number of lanes are also of interest here. Figures 3and 4 indicate that urban sites in Florida exhibited higher error levels than rural sites. As Figures 5 and 6 illustrate, there may be little variation in uncertainty of AADT estimates across freeways, arterials and collectors in Florida. Freeways exhibit only slightly greater uncertainty in both cases.
Figure 7 illustrates a rather significant jump (5% overall) in average estimation error for roadways with 5 or more lanes, versus those with 4 or fewer lanes, suggesting that, where possible, more care should be taken with counts on wider, multi-lane roadways.
Table 4 presents the results of regression analysis of percentage error on different variables, including the DOW, MOY, functional class, area type and number of lanes, for both Florida and Minnesota. Counts taken along rural, arterial roadways with more than 5 lanes on a Sunday in January are also used as the base case, for comparison. A higher negative coefficient on a particular variable means lower error levels for that day, month or roadway type. For example, Minnesota’s AADT errors tend to be lower on Mondays as compared to Tuesdays (coefficient of -6.00% vs. -5.08%). In both Minnesota and Florida the average error is quite a bit less on weekdays, as compared to weekends (as also evident in Table 3, and Figures 3 through 7). In Minnesota it was found that there is no difference in error between February and January and that March, July, November and December exhibit the highest errors, among months of the year. In contrast to the Florida results, urban area freeways (and roadways with 4 or fewer lanes) exhibited less error than their counterparts. Florida’s data exhibits rather dramatic mis-prediction tendencies when counts come from September and November (an issue that may be specific to the 2004 data year). And errors tend to be larger along freeways and in sites classified as rural (and along arterials, as compared to collectors). Average errors tend to be lowest in the months of March through June in Florida (averaging 10%), and August through October in Minnesota (averaging just 6%), suggesting that those periods are most suitable for short term counts.
In terms of background errors in prediction, the remaining standard error of Table 4’s estimates is 15.8%, for both states’ data. No explanatory factor in Table 4 rivals this in magnitude, though days of week (for SPTC sampling) are certainly more important to get right than months of the year, and the number of lanes appears to have an important effect (in the Minnesota data, where this variable is coded). When one examines the magnitude of error emerging from use of other sites’ factors, or from spatial extrapolation, however, the competition begins.
Figure 8 compares the various error components (from sampling, factoring and misclassification). When factors from the site’s own traffic counts are used for its AADT estimates, the case is ideal (and unrealistic, of course), and the absolute average error is 6.69%, as compared to 11.65% when factors from similar sites (properly classified) are used.
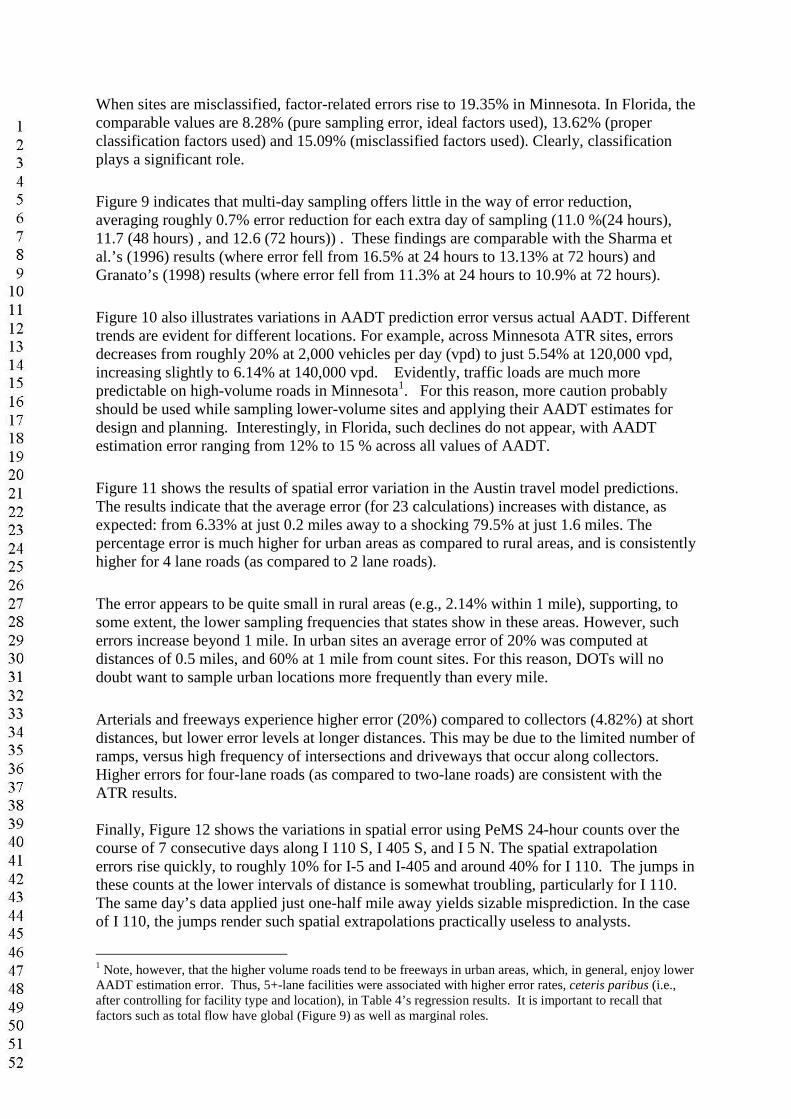
When sites are misclassified, factor-related errors rise to 19.35% in Minnesota. In Florida, the comparable values are 8.28% (pure sampling error, ideal factors used), 13.62% (proper classification factors used) and 15.09% (misclassified factors used). Clearly, classification plays a significant role.
Figure 9 indicates that multi-day sampling offers little in the way of error reduction, averaging roughly 0.7% error reduction for each extra day of sampling (11.0 %(24 hours), 11.7 (48 hours) , and 12.6 (72 hours)) . These findings are comparable with the Sharma et al.’s (1996) results (where error fell from 16.5% at 24 hours to 13.13% at 72 hours) and Granato’s (1998) results (where error fell from 11.3% at 24 hours to 10.9% at 72 hours).
Figure 10 also illustrates variations in AADT prediction error versus actual AADT. Different trends are evident for different locations. For example, across Minnesota ATR sites, errors decreases from roughly 20% at 2,000 vehicles per day (vpd) to just 5.54% at 120,000 vpd, increasing slightly to 6.14% at 140,000 vpd. Evidently, traffic loads are much more predictable on high-volume roads in Minnesota1. For this reason, more caution probably should be used while sampling lower-volume sites and applying their AADT estimates for design and planning. Interestingly, in Florida, such declines do not appear, with AADT estimation error ranging from 12% to 15 % across all values of AADT.
Figure 11 shows the results of spatial error variation in the Austin travel model predictions. The results indicate that the average error (for 23 calculations) increases with distance, as expected: from 6.33% at just 0.2 miles away to a shocking 79.5% at just 1.6 miles. The percentage error is much higher for urban areas as compared to rural areas, and is consistently higher for 4 lane roads (as compared to 2 lane roads).
The error appears to be quite small in rural areas (e.g., 2.14% within 1 mile), supporting, to some extent, the lower sampling frequencies that states show in these areas. However, sucherrors increase beyond 1 mile. In urban sites an average error of 20% was computed atdistances of 0.5 miles, and 60% at 1 mile from count sites. For this reason, DOTs will no doubt want to sample urban locations more frequently than every mile.
Arterials and freeways experience higher error (20%) compared to collectors (4.82%) at short distances, but lower error levels at longer distances. This may be due to the limited number of ramps, versus high frequency of intersections and driveways that occur along collectors.Higher errors for four-lane roads (as compared to two-lane roads) are consistent with the ATR results.
Finally, Figure 12 shows the variations in spatial error using PeMS 24-hour counts over the course of 7 consecutive days along I 110 S, I 405 S, and I 5 N. The spatial extrapolation errors rise quickly, to roughly 10% for I-5 and I-405 and around 40% for I 110. The jumps in these counts at the lower intervals of distance is somewhat troubling, particularly for I 110. The same day’s data applied just one-half mile away yields sizable misprediction. In the case of I 110, the jumps render such spatial extrapolations practically useless to analysts.
1 Note, however, that the higher volume roads tend to be freeways in urban areas, which, in general, enjoy lower AADT estimation error. Thus, 5+-lane facilities were associated with higher error rates, ceteris paribus (i.e., after controlling for facility type and location), in Table 4’s regression results. It is important to recall that factors such as total flow have global (Figure 9) as well as marginal roles.

Freeways are relatively well controlled roadway environments, with few points of entrance and exit (though these points certainly can represent major ramps and facility merges). If misprediction can be so severe in these cases (consistent with the Austin TDM evidence), analysts should be highly skeptical of counts one or more miles away when seeking to estimate VMT, crash rates, emissions and other variables. Perhaps a combination of upstream and downstream counts will assist the prediction, as well as evidence from cross-street counts, to obtain a sense of whether traffic is being added or removed from the facility of interest. Alternatively, far more frequent SPTC spacings may be necessary, to ensure extrapolation does not exceed 0.5 miles, except in locations where traffic loads are known to be highly stable over space.
CONCLUSIONS AND RECOMMENDATIONSAADT estimates are fundamental to the analysis of transportation data sets and the management of transportation systems. Using three different data sets, this research helps illuminate the magnitude and sources of uncertainty in their estimation. Consistent with expectations and practice, the results obtained here suggest that sample counts should not be taken over the weekends as there is a higher probability of error in AADT estimates. Rural sites and facilities with many lanes also require greater care in Minnesota, though those with higher counts in Florida tend to prove more predictable overall.
Proper site classification is key, and tendencies may vary by state. These analyses of ATR data can be performed by any agency, to assess whether certain roadway types or times of year require greater sampling caution. Fine clustering, on the basis of functional class, lane count, and multiple area types, may prove very useful.
Spatial errors can increase dramatically beyond 0.5 miles (from the count site) in urban areas and 1 mile in rural areas; thus, caution is needed when assigning the AADT estimate for the nearest SPTC site to a roadway segment, and additional SPTC locations may be most prudent, particularly in locations where counts average less than 1 per mile.
Appreciation of the uncertainties inherent in AADT and VMT estimates is paramount for robust evaluations of crash rates, pavement deterioration, and other transportation data. Thisresearch seeks to enlighten the use of such estimates, and thereby enhance transport decision making. The results of this work can serve as base estimates for how such errors vary by area type, functional class, number of lanes and distance to nearest SPTC station. Given the magnitudes of errors witnessed here, transportation agencies may wish to increase the spatial frequency of their SPTCs as well as pay closer attention to urban freeways and other facilities exhibiting the greatest predictive errors.
ACKNOWELDGEMENTSWe are thankful for assistance provided by Minnesota DOT’s Gene Hicks and Kou Vang, the Florida DOT, and Smart Mobility‘s Norm Marshall and Brian Grady for their ready willingness to share data. We appreciate Jason Lemp’s assistance with statistical software, Texas DOT’s research sponsorship (under project 0-5191), and Annette Perrone’sadministrative assistance.

REFERENCES Crum, Shannon (2005) Director of Data Management, Texas Department of Transportation, Transportation Planning and Policy Division. Phone conversation on September 1, 2005 with Kara Kockelman.
Eom, J.K., M.S. Park, Y. Heo, , and L.F Huntsunger,. (2006) Improved Prediction of Annual Average Daily Traffic for Non-Freeway Facilities by Applying Spatial Statistical Method. Proceedings of the 85th Annual Meeting of the Transportation Research Board, Washington DC, and under consideration for publication in Transport Policy.
FHWA. (2001) Traffic Monitoring Guide, U.S. Department of Transportation, Federal Highway Administration, Office of Highway Policy Information.
Florida Department of Transportation (2005) 2004 Florida Traffic Information. (CD-ROM), FDOT, Tallahasse, FL.
Granato, S. (1998) The Impact of Factoring Traffic Counts for Daily and Monthly Variation in Reducing Sample Counting Error. Proceedings of the Crossroads 2000 Conference (Ames, Iowa), pp.122-125. Accessed July 2006 at http://www.ctre.iastate.edu/pubs/crossroads/122impact.pdf
Jiang, Zhuojun., M. R McCord,. and P. K.Goel. (2006) Improved AADT Estimation by Combining Information in Image- and Ground-Based Traffic Data ASCE Journal of Transportation Engineering 132 (7), pp. 523-600.
Lam, W.H.K. and J.Xu. (2000). Estimation of AADT from Short Period Counts in Hong Kong – A Comparison between Neural Network Method and Regression AnalysisJournal of Advanced Transportation 34 (2), pp. 249-268.
Minnesota Department of Transportation (Mn/DOT) (2006) Mn/DOT Website. Accessed on March 20, 2006 at http://www.dot.state.mn.us/tda/maps/trafficvol.html.
Marshall, N., Grady, B. (2005). Travel Demand Modeling for Regional Visioning and Scenario Analysis. Transportation Research Record 1921
PeMS (2006) Freeway Performance Measurement System, version 6.3. Accessed on July 25, 2006 at http://pems.eecs.berkeley.edu.
Sharma, S.C., B.M.Gulati and S. N.Rizak, (1996) Statewide Traffic Volume Studies and Precision of AADT Estimates. ASCE Journal of Transportation Engineering 122 (6), pp. 430-439.
Tang, Y. F., W. H. K Lam,., and L. P.Pan. (2003) Comparison of Four Modeling Techniques for Short-Term AADT Forecasting in Hong Kong. Journal of Transportation Engineering 129 (3), pp. 223-329.

LIST OF TABLES AND FIGURES
Table 1. Data Description (Number of sites)
Table 2. Average errors in AADT estimation for different site classification schemes
Table 3. Error comparisons between weekdays and weekends
Table 4. Regression analysis with dependent variable as error
Figure 1. Example traffic count histograms (using Florida’s ATR data)
Figure 2: Error frequencies across all sites and days for Minnesota and Florida ATR data
Figure 3. Variation in AADT estimate errors by day of week and location (using Florida’s ATR data)
Figure 4. Variation in AADT estimate errors by day of week and location (using Minnesota’s ATR data)
Figure 5. Variation in AADT estimate errors by day of week and functional class (using Florida’s ATR data)
Figure 6. Variation in AADT estimate error by day of week and functional class (using Minnesota’s ATR data)
Figure 7. Variation in AADT estimate errors by day of week and number of lanes
(using Minnesota’s ATR data)
Figure 8. Variation in AADT estimate error by factoring method used (using Florida and Minnesota ATR data)
Figure 9. Effect of count duration on AADT estimate error (using Florida’ ATR data)
Figure 10. Variation in AADT estimate error, as a function of AADT (using Minnesota’s and Florida’s ATR data)
Figure 11. Spatial variation in AADT estimate error for different roadway and location types (using Austin TDM data)
Figure 12 Spatial variation in AADT estimate error for freeways during different days of the week using one week’s worth of PeMS data (average of 3 Southern California sites)
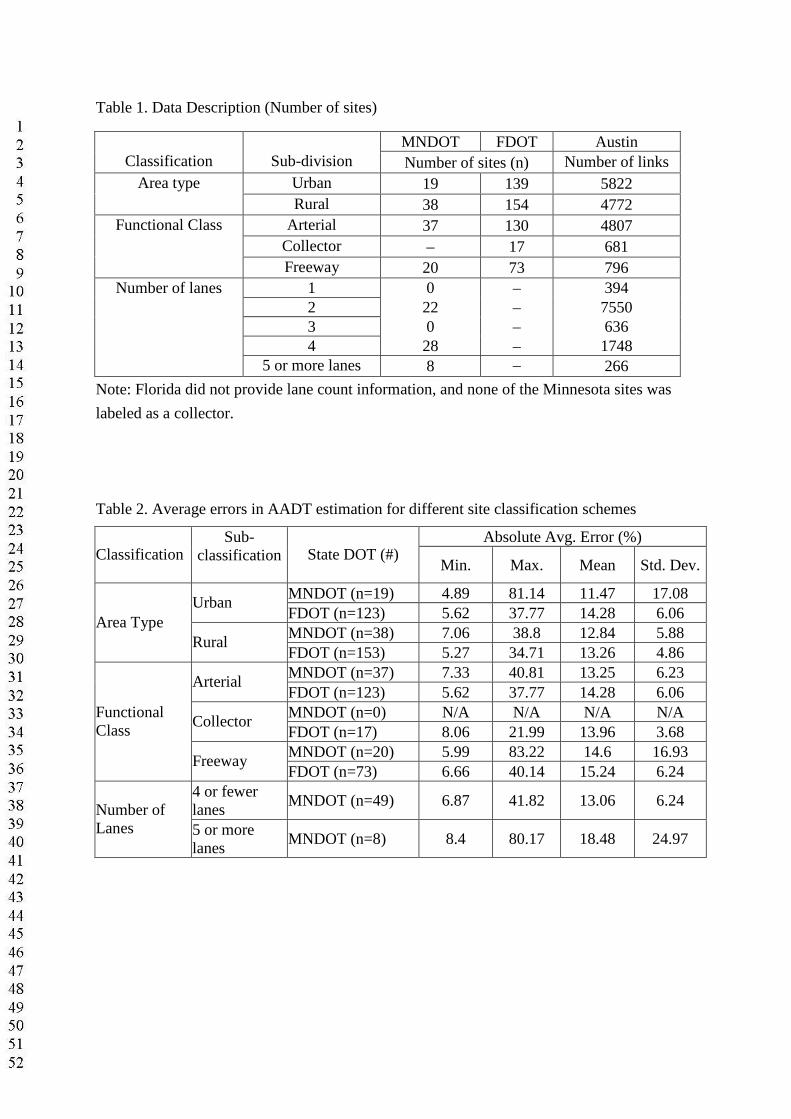
Table 1. Data Description (Number of sites)
Note: Florida did not provide lane count information, and none of the Minnesota sites was
labeled as a collector.
Table 2. Average errors in AADT estimation for different site classification schemes
MNDOT FDOT Austin Classification Sub-division Number of sites (n) Number of links
Urban 19 139 5822Area typeRural 38 154 4772
Arterial 37 130 4807Collector – 17 681
Functional Class
Freeway 20 73 7961 0 – 3942 22 – 75503 0 – 6364 28 – 1748
Number of lanes
5 or more lanes 8 – 266
Absolute Avg. Error (%)Classification
Sub-classification State DOT (#)
Min. Max. Mean Std. Dev.
MNDOT (n=19) 4.89 81.14 11.47 17.08Urban
FDOT (n=123) 5.62 37.77 14.28 6.06MNDOT (n=38) 7.06 38.8 12.84 5.88
Area TypeRural
FDOT (n=153) 5.27 34.71 13.26 4.86MNDOT (n=37) 7.33 40.81 13.25 6.23
ArterialFDOT (n=123) 5.62 37.77 14.28 6.06MNDOT (n=0) N/A N/A N/A N/A
CollectorFDOT (n=17) 8.06 21.99 13.96 3.68MNDOT (n=20) 5.99 83.22 14.6 16.93
Functional Class
FreewayFDOT (n=73) 6.66 40.14 15.24 6.24
4 or fewer lanes
MNDOT (n=49) 6.87 41.82 13.06 6.24Number of Lanes 5 or more
lanesMNDOT (n=8) 8.4 80.17 18.48 24.97

Table 3. Error comparisons between weekdays and weekends
Absolute Avg. Error (%)Classification
Sub-classificationState DOT (#)
Weekend WeekdayMNDOT (n=19) 1111..3333 9.47
UrbanFDOT (n=123) 17.57 12.74MNDOT (n=38) 16.03 12.21
Area TypeRural
FDOT (n=153) 17.77 11.26MNDOT (n=37) 16.50 11.95
ArterialFDOT (n=123) 17.54 12.75MNDOT (n=0) N/A N/A
CollectorFDOT (n=17) 18.49 12.16MNDOT (n=20) 18.68 12.97
Functional Class
FreewayFDOT (n=73) 19.00 13.16
4 or fewer lanes MNDOT (n=49) 16.91 11.52Lanes
5 or more lanes MNDOT (n=8) 20.46 17.69

Table 4. Regression analysis with dependent variable as error
MNDOT FDOTVariableBeta t-statistic Beta t-statistic
(Constant) 24.738 45.9 19.284 84.1Monday -6.004 -14.7 -8.770 -44.4Tuesday -5.082 -12.5 -8.933 -45.2Wednesday -4.999 -12.2 -8.998 -45.5Thursday -6.079 -14.8 -9.643 -49.0Friday -6.890 -16.8 -9.853 -50.0Saturday -3.196 -7.8 -6.701 -34.0February 0.000 N/A -0.508 -2.0March 2.575 5.6 -2.222 -8.7April -0.906 -1.9 -1.958 -7.6May -2.703 -5.8 -2.125 -8.4June -3.194 -6.8 -2.484 -9.6July 0.825 1.8 -0.679 -2.7August -0.757 -1.6 -0.283 -1.1September -1.527 -3.3 11.747 45.5October -1.445 -3.1 -0.070 -0.3November 1.364 2.9 9.788 37.7December 1.807 3.9 1.359 5.3Urban -3.202 -10.9 0.929 8.7Collector N/A N/A -0.129 -0.6Freeway -0.976 -3.4 2.400 17.74 or fewer lanes -6.994 -19.1 - - Adj. R Square 0.0476 0.1106
Std. Error of Y|X 15.766y= Error %
15.826y= Error %
Nobs 57 293
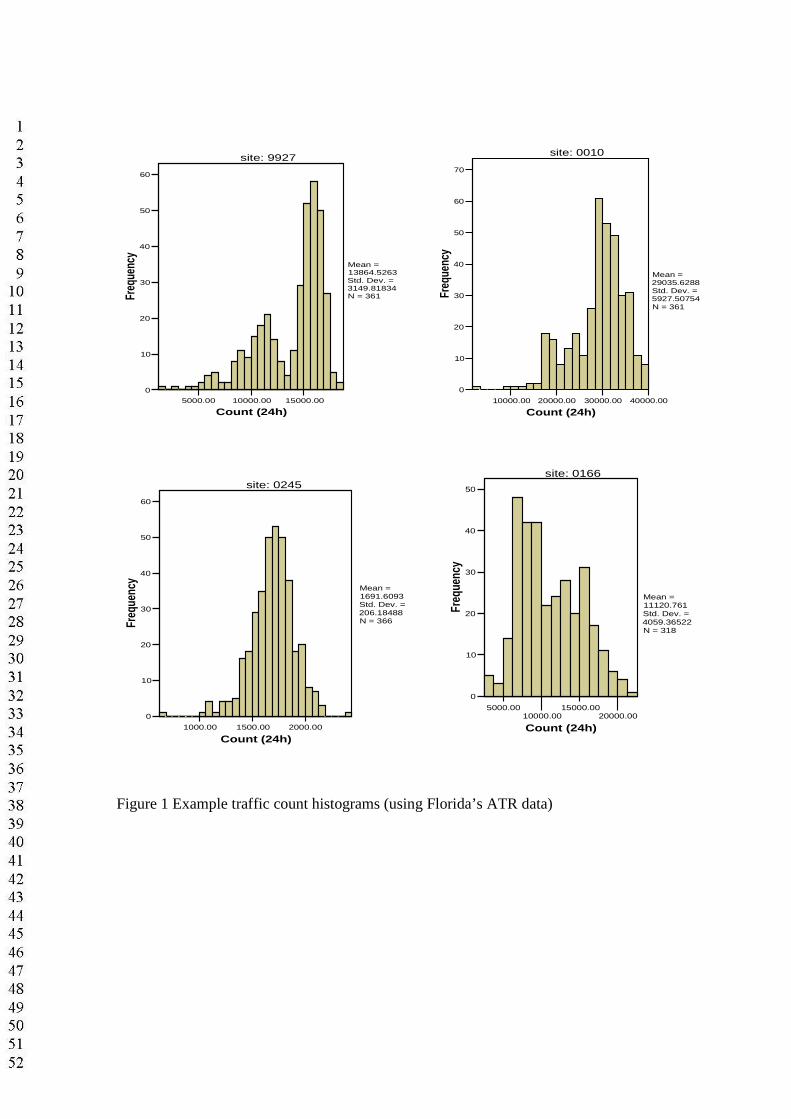
Figure 1 Example traffic count histograms (using Florida’s ATR data)
5000.0010000.00
15000.0020000.00
Count (24h)
0
10
20
30
40
50
Freq
uenc
y
Mean = 11120.761Std. Dev. = 4059.36522N = 318
site: 0166
10000.00 20000.00 30000.00 40000.00
Count (24h)
0
10
20
30
40
50
60
70
Freq
uenc
y
Mean = 29035.6288Std. Dev. = 5927.50754N = 361
site: 0010
5000.00 10000.00 15000.00
Count (24h)
0
10
20
30
40
50
60
Freq
uenc
y
Mean = 13864.5263Std. Dev. = 3149.81834N = 361
site: 9927
1000.00 1500.00 2000.00
Count (24h)
0
10
20
30
40
50
60
Freq
uenc
y
Mean = 1691.6093Std. Dev. = 206.18488N = 366
site: 0245


0 30 60 90 120 150
Error (%)
0
0.105
0.209
0.314
0.418
Freq
uenc
y
FDOT
0 30 60 90 120 150
Error (%)
0
0.048
0.096
0.144
0.192
0.24
Freq
uenc
y
MNDOT
Figure 2 Error frequencies across all sites and days for Minnesota and Florida ATR data

0
5
10
15
20
25
Sun Mon Tue Wed Thu Fri Sat
Day of Week
Err
or in
est
imat
ion
of A
AD
T (%
)
Urban
Rural
Figure 3 Variation in AADT estimate errors by day of week and location (using Florida’s ATR data)
Urban vs. Rural
0
5
10
15
20
Sun Mon Tue Wed Thu Fri Sat
Day of Week
Err
or
in e
stim
atio
n o
f A
AD
T (
%)
Urban
Rural
Figure 4 Variation in AADT estimate errors by day of week and location (using Minnesota’s ATR data)

Figure 5 Variation in AADT estimate errors by day of week and functional class (using Florida’s ATR data)
0
5
10
15
20
25
Sun Mon Tue Wed Thu Fri Sat
Day of Week
Err
or
in e
stim
atio
n o
f AA
DT
(%)
Arterial
Freeway
Figure 6 Variation in AADT estimate error by day of week and functional class (using Minnesota’s ATR data)
0
5
10
15
20
25
Sun Mon Tue Wed Thu Fri Sat
Day of Week
Err
or
in e
stim
atio
n o
f AA
DT
(%)
Arterial
Collector
Freeway
0
5
10
15
20
25
Sun Mon Tue Wed Thu Fri Sat
Day of Week
Err
or
in e
stim
atio
n o
f AA
DT
(%)
Arterial
Collector
Freeway

Figure 7 Variation in AADT estimate errors by day of week and number of lanes(using Minnesota’s ATR data)
Figure 8 Variation in AADT estimate error by factoring method used (using Florida’s and Minnesota’s ATR data)
0
5
10
15
20
25
MDOT FDOT
Err
or (
%)
Ideal Factoring Cluster Factoring Misclassification Factoring
0
5
10
15
20
25
Sun Mon Tue Wed Thu Fri Sat
Day of week
Err
or
in e
stim
atio
n o
f AA
DT
(%)
4 or fewer Lanes
More than 4 Lanes

Figure 9 Effect of count duration on AADT estimate error (using Florida’ ATR data)
10
10.5
11
11.5
12
12.5
13
Avg. Error inAADT
Estimates (%)
24h 48h 72h
Count duration

0
5
10
15
20
25
0 30000 60000 90000 120000 150000
AADT
Err
or
(%)
MNDOTFDOT
Figure 10 Variation in AADT estimate error, as a function of AADT (using Florida’s
and Minnesota’s ATR data)

Figure 11 Spatial variation in AADT estimate error for different roadway and location
types (using Austin TDM data)
0
30
60
90
120
150
0 0.2 0.4 0.6 0.8 1 1.2 1.4 1.6 1.8
Distance (miles)
Err
or (
%)
All Roadways
0
30
60
90
120
150
0 0.5 1 1.5 2
Distance (miles)
Err
or (
%)
Arterial Collector Freeway
0
30
60
90
120
150
0 0.2 0.4 0.6 0.8 1 1.2 1.4 1.6 1.8
Distance (miles)
Err
or (
%)
Urban Rural
0
30
60
90
120
150
0 0.2 0.4 0.6 0.8 1 1.2 1.4 1.6 1.8
Distance (miles)
Err
or (
%)
2 Lanes 4 Lanes
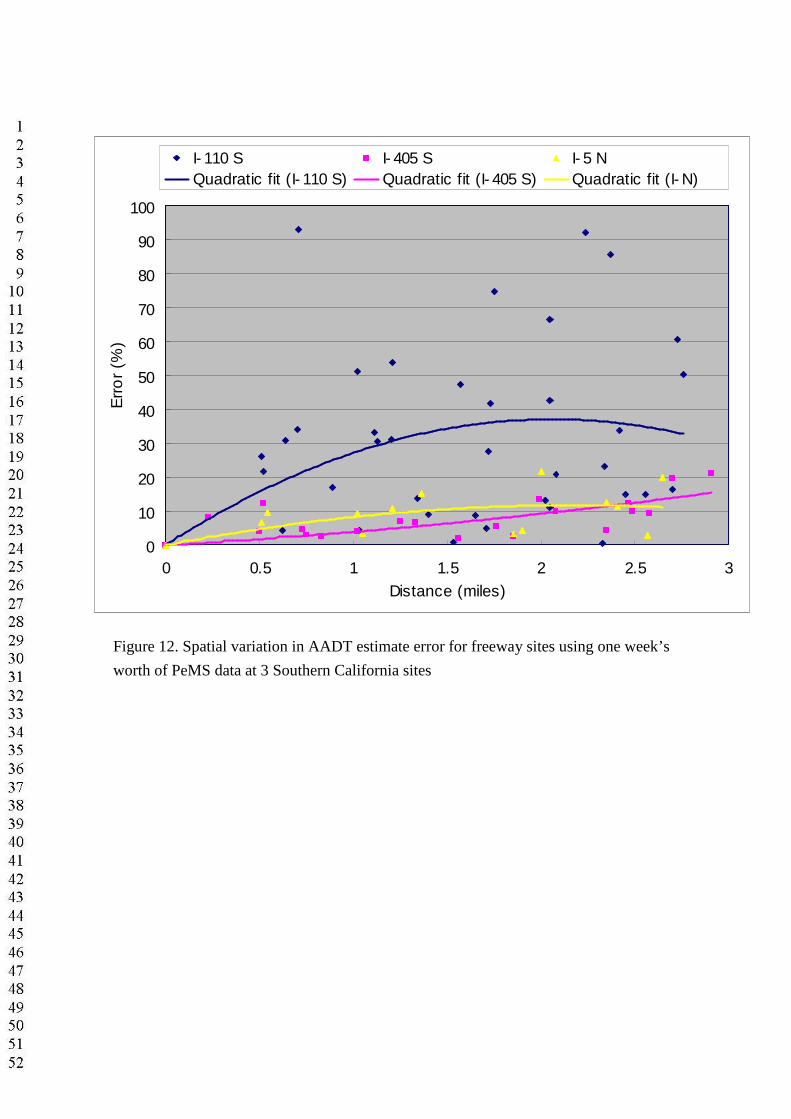
Figure 12. Spatial variation in AADT estimate error for freeway sites using one week’s
worth of PeMS data at 3 Southern California sites
0
10
20
30
40
50
60
70
80
90
100
0 0.5 1 1.5 2 2.5 3Distance (miles)
Err
or
(%)
I- 110 S I- 405 S I- 5 NQuadratic fit (I- 110 S) Quadratic fit (I- 405 S) Quadratic fit (I- N)