Estimate of National Use of Aircraft- and Airfield-Deicing ...
87
THIS DOCUMENT INTENDED SOLELY FOR ACRP 11-02 PROJECT PANEL USE—DO NOT DISTRIBUTE Final ACRP 11-02, Task 10 Estimate of National Use of Aircraft- and Airfield-Deicing Materials Prepared for Airport Cooperative Research Program December 2008 Prepared in association with Gresham, Smith and Partners Barnes & Thornburg LLP
Transcript of Estimate of National Use of Aircraft- and Airfield-Deicing ...

THIS DOCUMENT INTENDED SOLELY FOR ACRP 11-02 PROJECT PANEL USE—DO NOT DISTRIBUTE
F i n a l
ACRP 11-02, Task 10
Estimate of National Use of Aircraft- and Airfield-Deicing
Materials
Prepared for
Airport Cooperative Research Program
December 2008
Prepared in association with
Gresham, Smith and Partners Barnes & Thornburg LLP


THIS DOCUMENT INTENDED SOLELY FOR ACRP 11-02 PROJECT PANEL USE—DO NOT DISTRIBUTE III
CONTENTS
Acknowledgments....................................................................................................................... v Acronyms and Abbreviations .................................................................................................. ix 1 Introduction ..................................................................................................................... 1-1
Introduction...................................................................................................................... 1-1 Nature of the Problem..................................................................................................... 1-1 Structure of This Report.................................................................................................. 1-1
2 Estimate of Current National Aircraft and Airfield Deicer Use ............................ 2-3 Introduction...................................................................................................................... 2-3 Data Collection................................................................................................................. 2-3 Data Analysis Methods................................................................................................... 2-4
Airports with Deicing Operations ....................................................................... 2-4 Operations Data ..................................................................................................... 2-5 Available Aircraft and Pavement Deicer Use Data........................................... 2-5 Analysis of Pavement Deicer Use........................................................................ 2-5 Estimation of Aircraft Deicer Use........................................................................ 2-6 Estimation of Uncertainty on Aircraft Deicer Usage ........................................ 2-8
Results ............................................................................................................................... 2-8 Pavement Deicer Usage Results........................................................................... 2-8 Aircraft Deicer Use Results................................................................................... 2-9
3 Existing Regulatory Requirements ............................................................................. 3-1 Regulatory Drivers .......................................................................................................... 3-1
Federal Acts Effecting Airport Water Quality Regulations ............................. 3-1 Federal Stormwater Program............................................................................... 3-2 Implementation of Regulations in Different Types of Airport Discharge Permits
......................................................................................................................... 3-2 Total Maximum Daily Load (TMDL) Program Protections............................. 3-4
Data Collection................................................................................................................. 3-4 NPDES Permits Issued to Airports...................................................................... 3-5 Impaired Water Listings and Developed TMDLs............................................. 3-6
Results ............................................................................................................................... 3-7 NPDES Permit Coverage of Deicing Discharges............................................... 3-7 Deicing Discharges Subject to the TMDL Program......................................... 3-10 Deicing Discharges Regulated by Individual NPDES Permits and/or Subject to
TMDL Program .......................................................................................... 3-11 4 Summary and Conclusions ........................................................................................... 4-1
Airfield Deicer Use .......................................................................................................... 4-1 Aircraft Deicer Use .......................................................................................................... 4-1 Existing Regulatory Requirements................................................................................ 4-2 Future Trends................................................................................................................... 4-3
5 References ........................................................................................................................ 5-1

ACRP 11-02—ESTIMATE OF NATIONAL USE OF AIRCRAFT- AND AIRFIELD-DEICING MATERIALS
IV THIS DOCUMENT INTENDED SOLELY FOR ACRP 11-02 PROJECT PANEL USE—DO NOT DISTRIBUTE
Appendixes
A Airports Examined in the Analysis B Investigation of Meteorological Protocols for Predicting Deicer Use C Computational Methods D Pavement Deicer Usage E Estimated Average Annual Aircraft Deicer Usage F Deicing Airports Subject to TMDL Regulations
Tables
2-1 Unit Application Factors .................................................................................................2-7 2-2 Summary of Reported Airfield Pavement Deicer Usage............................................2-8 2-3 Distribution of Pounds of Urea Used by Hub Size Categories (Percentage of
Deicing Season Total) ......................................................................................................2-9 2-4 Distribution of Average Annual Aircraft Deicer Glycol Use Among Hub Size
Categories........................................................................................................................2-10 3-1 Permit Type Versus Hub Type.......................................................................................3-9 3-2 Distribution of Airport Subject to Regulation Under the TMDL Program............3-11
Figures
2-1 Availability of Deicer Use Data from 268 Part 139 Certificate Holder Airports .....2-6 2-2 Geographic Distribution of Annual Average Aircraft Deicing Glycol Use ...........2-10 2-3 Ranked Individual and Cumulative Average Annual Glycol Use for 184 Airports
Where Aircraft Deicing is Conducted .........................................................................2-11 2-4 Ranked Cumulative Percent Contribution from 184 Airports to the Total National
Average Annual Glycol Use .........................................................................................2-12 3-1 Distribution of Permit Types among 184 Deicing Airports .......................................3-7 3-2 Geographic Distribution of Permit Types among 184 Deicing Airports..................3-9 3-3 Distribution of Glycol Use Among NPDES Permit Types at Deicing Airports ....3-10 3-4 Distribution of Glycol Use among NPDES Permit Types and TMDL Program
Coverage..........................................................................................................................3-12 4-1 Annual Commercial Aircraft Operations Reported by FAA for the Years
1995–2005...........................................................................................................................4-2

THIS DOCUMENT INTENDED SOLELY FOR ACRP 11-02 PROJECT PANEL USE—DO NOT DISTRIBUTE V
ACKNOWLEDGMENTS
Project Research Team The ACRP 11-02 Project Team consists of CH2M HILL, Gresham, Smith & Partners, and Barnes & Thornburg LLP. Brief biographies of the team leaders are provided in the following paragraphs.
Dean Mericas, Ph.D., Principal Investigator
Dean is CH2M HILL’s aviation water resources practice leader. Since 1992, Dean’s practice area has focused on the assessment, control, permitting, and management of deicing runoff at commercial airports and Department of Defense airfields across the U.S. His research in this field includes work with ACRP and the Department of Defense on alternative aircraft and pavement deicers. Dean is an active member of ACI-NA’s Environmental Affairs Committee and Water Quality Work Group, and AAAE’s Water Quality Subcommittee.
John A. Lengel Jr., P.E.
John is a senior aviation environmental engineer and Executive Vice President with Gresham, Smith and Partners. John has nearly 20 years of environmental compliance experience specializing in aviation environmental issues, and particularly airport stormwater and deicer management system permitting, modeling, design and construction. John is actively an active member of the AAAE Environmental Services Committee, ACI-NA Environmental Affairs Committee (EAC) Steering Group and ACI-NA EAC Water Quality Working Group.
Jeffrey Longsworth, Esq.
Jeff is an attorney with Barnes & Thornburg LLP located in Washington, DC, specializing in Clean Water Act-related compliance counseling and litigation. He has more than 17 years of experience representing the airport industry on environmental matters, both on a national basis as outside counsel to ACI-NA and AAAE, and on an individual basis as outside counsel to dozens of large, medium, and small hub and general aviation airports across the country. Jeff was appointed to EPA’s Wet Weather (Stormwater) Federal Advisory Committee and is nationally recognized for work on stormwater permitting issues and effluent limitations guidelines.
Project Panel Our Project team would like to thank the members of the Project Panel for providing the opportunity to work on this important project.
•••

ACRP 11-02—ESTIMATE OF NATIONAL USE OF AIRCRAFT- AND AIRFIELD-DEICING MATERIALS
VI THIS DOCUMENT INTENDED SOLELY FOR ACRP 11-02 PROJECT PANEL USE—DO NOT DISTRIBUTE
Airport Representatives The project team would also like to thank the following airport representatives, who provided data and information valuable to the development of this document:
Mr. Steve Iachetta, Albany Airport
Mr. Kane Carpenter, Austin-Bergstrom International Airport
Mr. Mark Williams, Baltimore-Washington International Airport
Mr. Rodney Madden, Bangor International Airport
Mr. Stanley Horsley, Blue Grass Airport
Mr. Dan Reynolds, Bradley International Airport
Mr. Mark Clark, Buffalo Niagara International Airport
Mr. Jimmy Jordan, Charlotte-Douglas International Airport
Mr. Don Chapman, Cincinnati – Northern Kentucky International Airport
Ms. Kim McGreal, Cleveland Hopkins International Airport
Ms. Kris Andrews, Colorado Springs Airport
Mr. Sam Peacock, Dallas Love Field
Mr. Aaron Frame, Chicago O’Hare International Airport
Mr. Lowell Wright, Dane County Regional Airport
Mr. Keith D. Pass, P.G., Denver International Airport
Mr. Dan Bergman and Mr. Richard Reeter, Dallas/Fort Worth International Airport
Mr. Bryan Wagoner, Detroit Metropolitan Wayne County Airport
Ms. Kris DuBois, Fairbanks International Airport
Mr. Bill Prasuhn, Fort Wayne Airport
Mr. Greg Failey, General Mitchell International Airport
Mr. Ken Klomparens, Gerald R. Ford International Airport
Mr. Bob Jones and Ms. Sabrina Largen, Kansas City International Airport
Mr. Mike Cross, James M. Cox Dayton International Airport
Mr. John Hagopian, Manchester-Boston Airport
Ms. Catherine Wetherell, Massachusetts Port Authority
Mr. Alton Lanier, Memphis International Airport
Ms. Michelle Baker, Metropolitan Nashville Airport Authority

ACKNOWLEDGMENTS
THIS DOCUMENT INTENDED SOLELY FOR ACRP 02-02 PROJECT PANEL USE—DO NOT DISTRIBUTE VII
Mr. Walt Seedlock, Metropolitan Washington Airports Authority
Mr. Roy Fuhrmann, Minneapolis-St Paul International Airport
Mr. Henry Fapohunda, Philadelphia International Airport
Ms. Cynthia Parker, Phoenix Sky Harbor International Airport
Mr. Kevin Gurchak, Pittsburgh International Airport
Mr. Ed Knoesel, Port Authority of New York and New Jersey
Mr. Todd Welty, Reno-Tahoe Airport Authority
Mr. Tim Gwynette, Salt Lake City Airport
Ms. Stacy Fox, Seattle-Tacoma International Airport
Mr. Michael Clow, Tallahassee Regional Airport
Mr. Shane Serrano, Ted Stevens Anchorage International Airport
Ms. Carrie Carrithers, Tucson Airport Authority


THIS DOCUMENT INTENDED SOLELY FOR ACRP 11-02 PROJECT PANEL USE—DO NOT DISTRIBUTE IX
ACRONYMS AND ABBREVIATIONS
ACAIS Air Carrier Activity Information System ACRP Airport Cooperative Research Program ADF aircraft deicing fluid ANC Anchorage International Airport
BMP best management practice BOD biochemical oxygen demand
CWA Clean Water Act
EPA U.S. Environmental Protection Agency
FAA Federal Aviation Administration
NCDC National Climatic Data Center NPDES National Pollutant Discharge Elimination System
PCS Permit Compliance System POTW publicly owned treatment works
RAD Reach Address Database
SAE Society of Automotive Engineers SIC Standard Industrial Classification
TMDL Total Maximum Daily Load
UAF Unit Application Factor
WATERS Watershed Assessment Tracking and Environmental Results


THIS DOCUMENT INTENDED SOLELY FOR ACRP 11-02 PROJECT PANEL USE—DO NOT DISTRIBUTE 1-1
SECTION 1
INTRODUCTION
Introduction The CH2M HILL research team was contracted by the Airport Cooperative Research Program (ACRP) to develop a national assessment of aircraft and pavement deicer use and describe the extent of existing Clean Water Act regulatory requirements that directly regulate potential discharges of runoff from that use.
Nature of the Problem There is a significant amount of ongoing work (government and private) that involves some aspect of addressing potential environmental impacts associated with the use of airfield and aircraft deicers. For the most part, however, none of this work assesses or characterizes the total use of deicing materials. In 2000, the U.S. Environmental Protection Agency (EPA) published a study that relied upon limited data it had collected (scaling that to the industry at the time) and concluded that perhaps 35 million gallons of working strength aircraft deicing and anti-icing fluids where applied annually in the United States (EPA, 2000). Despite the fact that airports and other industry experts have questioned the accuracy of this value, nobody has collected appropriate data and performed a robust analysis, which in part would substantiate or rebut EPA’s estimate. In addition, EPA’s previous work did not include airfield pavement–deicing materials, which contribute to airport stormwater discharges.
The current investigation was initiated by ACRP to provide the airport industry with a key tool for future research by developing a robust estimate of what potential deicing chemical use may be today and how it may vary by geographic location or seasonal weather characteristics. In addition, ACRP sought to summarize information on the existing Clean Water Act regulatory programs that directly address the potential discharge of deicing runoff because full implementation of these existing programs has the potential to greatly reduce the potential environmental impacts of these discharges.
Structure of This Report The following sections of this report are organized as follows:
• Section 2. Estimate of Current National Aircraft and Airfield Deicer Use • Section 3. Existing Regulatory Requirements • Section 4. Summary and Conclusions • Section 5. References Cited
Comprehensive data tabulations and descriptions of technical analyses are presented in Appendices.


THIS DOCUMENT INTENDED SOLELY FOR ACRP 11-02 PROJECT PANEL USE—DO NOT DISTRIBUTE 2-3
SECTION 2
ESTIMATE OF CURRENT NATIONAL AIRCRAFT AND AIRFIELD DEICER USE
Introduction The objective of this analysis was to evaluate deicer use at airports where regularly scheduled commercial air carrier operations are conducted. The criterion selected for identifying this population of airports was possession of a Part 139 Certification, which is required for airports that (14 CFR Part 139):
• Serve scheduled and unscheduled air carrier aircraft with more than 9 seats, and • The Federal Aviation Administration (FAA) Administrator requires to have a certificate.
Military aircraft–deicing operations were explicitly excluded from the analysis because no use data were available for those activities. Military aircraft operations are significantly different from commercial operations, and extrapolation using unit application factors (see below) based on commercial carrier deicing data would be inappropriate.
Data used in this analysis are limited to the 2002-2003, 2003-2004, and 2004-2005 deicing seasons, to be consistent with the three deicing seasons for which EPA collected data for their 2006 Airport and Airline Deicing Questionnaires. The deicing season was assumed to extend from October through April, and the data analysis reflects just these months within each deicing season. Airports represented here are believed to encompass most (i.e., over 99 percent) of deicing operations within the United States.
Data Collection Data collection efforts spanned a range of sources, reflecting the diverse types of data sought for the analysis. Information on basic airport characteristics was obtained from the following sources:
• FAA’s Airport Data (5010) and Contact Information web page provided a list of 480 Part 139 certificate holders, average annual operations, contact information, and the location (latitude/longitude) of each airport used in the spatial analysis. (http://www.faa.gov/ airports_airtraffic/airports/airport_safety/airportdata_5010/).
• FAA’s Air Carrier Activity Information System (ACAIS) provided information on the hub type and service level for most of the airports in the analysis. Hub type categories were large, medium, small, and nonhub. Service types included primary, commercial service, and general aviation.
• FAA staff provided total monthly operations data for 494 airports from 2003 through 2005 by operator type, including air carrier, air taxi, general aviation, military, local military, and local general aviation.

ACRP 11-02—ESTIMATE OF NATIONAL USE OF AIRCRAFT- AND AIRFIELD-DEICING MATERIALS
2-4 THIS DOCUMENT INTENDED SOLELY FOR ACRP 11-02 PROJECT PANEL USE—DO NOT DISTRIBUTE
• The National Climatic Data Center (NCDC) website provided annual snowfall totals (in inches) for locations near most of the airports in the analysis (http://www.ncdc.noaa .gov/oa/climate/online/ccd/snowfall.html).
Deicer use data were obtained from the following sources:
• EPA Office of Water, Engineering and Analysis Division, staff provided copies of responses to their 2006 Airport Deicing Questionnaire. These data included responses from 150 airports, 78 of which reported some types and amounts of pavement-deicing materials used during one or more of the three deicing seasons (2002–2003, 2003–2004, and 2004–2005).
• Aircraft deicing and anti-icing fluid use data was collected through three primary sources: (1) existing data within the project team’s libraries and databases; (2) responses to an ACI-NA request to its membership for aircraft deicer data to be shared with the project team; and (3) direct outreach by the project team to airports deemed critical to project objectives. The use data were requested to be broken out into SAE Type (i.e., Type I and II/IV), glycol type (i.e., propylene and ethylene glycol), and reporting concentration (i.e., as applied, concentrated product, or pure glycol).
The three-letter FAA airport designation was used as the “primary key” to associate airport-specific information within the project database. A list of airport codes, their full names, hub type, average annual snowfall, and average annual deicing season operations are provided in Appendix A.
Data Analysis Methods Airports with Deicing Operations A cutoff of 9,000 commercial operations per year was chosen as the threshold for including airports in the analysis. This threshold was based on a combination of data availability on very small airports and professional judgment of the research team regarding the size of airports with potentially significant deicing operations. For comparison, in a previous evaluation EPA concluded that “airports with less than 10,000 total operations per year perform an insignificant number of aircraft deicing/anti-icing operations and, therefore, use minimal amounts of ADF [aircraft deicing fluid]” (ERG, 2000). The two criteria are roughly equivalent, especially when it is considered that EPA’s threshold included military operations, whereas the current investigation does not.
Two hundred and sixty-eight U.S. airports were identified as being Part 139 Certificate holders with average annual operations above the 9,000 operations per year threshold. A subset of these airports was identified as being likely to actually conduct deicing operations, based on an airport meeting one or more of the following criteria:
• Provided the research team with a nonzero estimate of annual aircraft glycol use for any of the three deicing seasons examined;
• Reported nonzero annual pavement deicer use for any of the three deicing seasons examined;
ACKNOWLEDGMENTS
THIS DOCUMENT INTENDED SOLELY FOR ACRP 02-02 PROJECT PANEL USE—DO NOT DISTRIBUTE 2-5
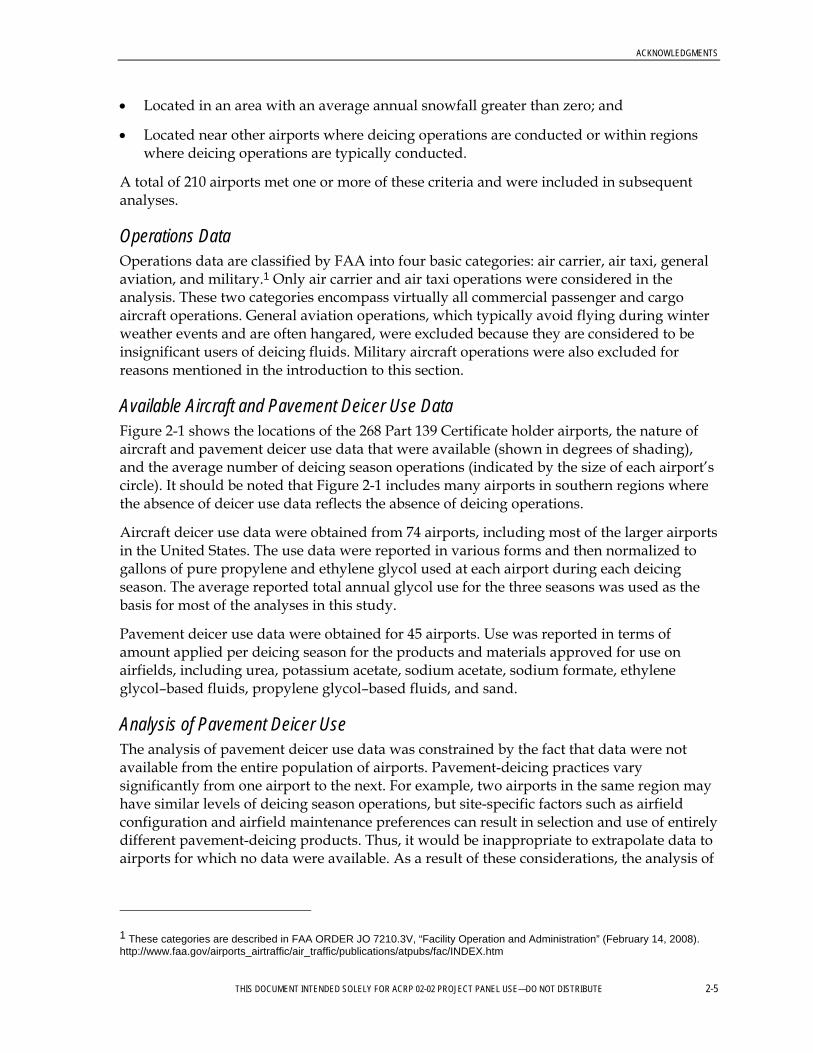
• Located in an area with an average annual snowfall greater than zero; and
• Located near other airports where deicing operations are conducted or within regions where deicing operations are typically conducted.
A total of 210 airports met one or more of these criteria and were included in subsequent analyses.
Operations Data Operations data are classified by FAA into four basic categories: air carrier, air taxi, general aviation, and military.1 Only air carrier and air taxi operations were considered in the analysis. These two categories encompass virtually all commercial passenger and cargo aircraft operations. General aviation operations, which typically avoid flying during winter weather events and are often hangared, were excluded because they are considered to be insignificant users of deicing fluids. Military aircraft operations were also excluded for reasons mentioned in the introduction to this section.
Available Aircraft and Pavement Deicer Use Data Figure 2-1 shows the locations of the 268 Part 139 Certificate holder airports, the nature of aircraft and pavement deicer use data that were available (shown in degrees of shading), and the average number of deicing season operations (indicated by the size of each airport’s circle). It should be noted that Figure 2-1 includes many airports in southern regions where the absence of deicer use data reflects the absence of deicing operations.
Aircraft deicer use data were obtained from 74 airports, including most of the larger airports in the United States. The use data were reported in various forms and then normalized to gallons of pure propylene and ethylene glycol used at each airport during each deicing season. The average reported total annual glycol use for the three seasons was used as the basis for most of the analyses in this study.
Pavement deicer use data were obtained for 45 airports. Use was reported in terms of amount applied per deicing season for the products and materials approved for use on airfields, including urea, potassium acetate, sodium acetate, sodium formate, ethylene glycol–based fluids, propylene glycol–based fluids, and sand.
Analysis of Pavement Deicer Use The analysis of pavement deicer use data was constrained by the fact that data were not available from the entire population of airports. Pavement-deicing practices vary significantly from one airport to the next. For example, two airports in the same region may have similar levels of deicing season operations, but site-specific factors such as airfield configuration and airfield maintenance preferences can result in selection and use of entirely different pavement-deicing products. Thus, it would be inappropriate to extrapolate data to airports for which no data were available. As a result of these considerations, the analysis of
1 These categories are described in FAA ORDER JO 7210.3V, “Facility Operation and Administration” (February 14, 2008). http://www.faa.gov/airports_airtraffic/air_traffic/publications/atpubs/fac/INDEX.htm

ACRP 11-02—ESTIMATE OF NATIONAL USE OF AIRCRAFT- AND AIRFIELD-DEICING MATERIALS
2-6 THIS DOCUMENT INTENDED SOLELY FOR ACRP 11-02 PROJECT PANEL USE—DO NOT DISTRIBUTE
pavement deicer use was limited to the characterization of reported use from the EPA survey data set.
FIGURE 2-1 Availability of Deicer Use Data from 268 Part 139 Certificate Holder Airports
Estimation of Aircraft Deicer Use Actual reported aircraft deicer use data were used wherever available to estimate average annual glycol use for individual airports.
A method was sought to estimate total average annual glycol use for the airports where data were not available. The initial investigation focused on trying to identify “off-the-shelf” climatology protocols or products that could be used to characterize geographic areas with similar intensities of aircraft- and airfield-deicing requirements. The intent was to use this information to develop and apply a methodology for correlating meteorological parameters such as temperature and precipitation with the magnitude of deicer usage at airports. After extensive research and personal communications with the top experts in the United States on aircraft icing, airline industry winter operations, and icing climatology, it was determined that an existing product to meet this project objective does not currently exist, and that significant effort beyond the resources of this project would be required to develop

ACKNOWLEDGMENTS
THIS DOCUMENT INTENDED SOLELY FOR ACRP 02-02 PROJECT PANEL USE—DO NOT DISTRIBUTE 2-7
such a methodology. The details of the investigation into a meteorological protocol are presented in Appendix B.
In the absence of an existing meteorological protocol to estimate total average annual glycol use for the airports where data were not available, a modified version of the Fluid Use Factors method was employed (ERG, 2000). For the current analysis, FAA hub type was used to classify the scale of operations, and total annual snowfall was represented by categories similar to those used in the ERG analysis, except a larger number of snowfall categories was defined and it was assumed that deicer usage at any airport with less than 0.1 inch of average annual snowfall would be insignificant for the purposes of this investigation. The resulting coefficient describing glycol usage as a function of deicing season operations is called the Unit Application Factor (UAF). Full details of the computational derivation of the UAFs are provided in Appendix C-1.
Table 2-1 presents the UAFs developed for each hub type–snowfall code combination. It should be noted that there were no usage data available for some of the hub–snowfall combinations, so the factors from adjacent combinations were assigned as reasonable estimates. The estimated UAFs and the UAFs on which the estimations are based are shaded; the estimated UAFs are footnoted.
TABLE 2-1 Unit Application Factors
Snowfall Hub Type
Code Range (Inches) Large Medium Small Non
1 > 60 2.37
n = 1
s.d. = n/a
3.00
n = 2
s.d. = 0.439
2.40
n = 3
s.d. = 0.504
2.40a
2 30.0–59.9 2.43
n = 4
s.d. = 1.00
2.83
n = 6
s.d. = 2.83
1.22
n = 4
s.d. = 0.861
1.22a
3 15.0–29.9 1.44
n = 6
s.d. = 0.182
1.41
n = 3
s.d. = 0.307
1.20
n = 3
s.d. = 0.408
0.40
n = 1
s.d. = n/a
4 1.0–14.9 0.16
n = 4
s.d. = 0.048
0.24
n = 5
s.d. = 0.219
0.16a 0.16a
5 0.1–0.9 0.07a 0.07
n = 1
s.d. =n/a
0.07a 0.07a
s.d., standard deviation. a Estimate based on others in snowfall group.

ACRP 11-02—ESTIMATE OF NATIONAL USE OF AIRCRAFT- AND AIRFIELD-DEICING MATERIALS
2-8 THIS DOCUMENT INTENDED SOLELY FOR ACRP 11-02 PROJECT PANEL USE—DO NOT DISTRIBUTE
The UAFs in Table 2-1 were multiplied by the average deicing season operations to obtain an estimated average annual glycol usage for each airport where usage data were not available.
Estimation of Uncertainty on Aircraft Deicer Usage An estimate of the uncertainty in the national average annual glycol usage calculation was developed using standard statistical methods, as described in Appendix C-2.
Results The results of the analyses are presented separately for pavement and aircraft deicer usage.
Pavement Deicer Usage Results Table 2-2 summarizes the pavement deicer usage data for the three deicing seasons examined during this investigation; Appendix D lists all the data.
TABLE 2-2 Summary of Reported Airfield Pavement Deicer Usage
2002–2003 2003–2004 2004–2005
Pavement Deicer
Airports Reporting
Usage (n = 74)
Total Amount
Reported
Airports Reporting
Usage (n = 77)
Total Amount Reported
Airports Reporting
Usage (n = 77)
Total Amount Reported
Urea (lbs) 24 5,909,148 26 7,611,376 26 8,054,134
Potassium acetate (gal)
60 6,913,639 63 6,051,737
64 5,897,977
Sodium acetate (lbs)
21 8,315,269 21 7,086,107
25 7,353,266
Sodium formate (lbs)
9 650,883 9 690,813
9 549,073
Ethylene glycol–based fluids (gal)
3 410,269 3 175,828
3 279,997
Propylene glycol–based fluids (gal)
9 2,824,126 9 3,238,526
10 9,636,565
Sand (lbs) 43 78,240,700 44 59,858,917 46 58,890,027
The following observations may be drawn from the pavement deicer usage data:
• Potassium acetate–based products were used by about 82 percent of the airports included in the EPA survey that reported any pavement deicer usage.
• Sand, although it is not technically a deicer, was used by approximately 58 percent of the respondents who reported pavement deicer usage as part of their toolkit of products used to maintain safe airfield wintertime operations.

ACKNOWLEDGMENTS
THIS DOCUMENT INTENDED SOLELY FOR ACRP 02-02 PROJECT PANEL USE—DO NOT DISTRIBUTE 2-9
• Urea was being used by about one-third of the airports that reported any deicer usage.
• Relatively few of the airports in the EPA survey used glycol-based pavement deicers.
Because there are particular concerns about the potential environmental impacts of urea in stormwater runoff, the distribution of urea usage was examined by airport hub category (Table 2-3). The distribution of the urea usage among the hub size categories varies between the deicing seasons. In any season, more than 80 percent of the urea usage is accounted for by five or six airports covering the spectrum of hub sizes. As might be expected, the greatest individual use was reported by large and medium hub airports. It should be noted that the n count in Table 2-3 represents the total number of airports in that hub category that reported urea usage during any of the three deicing seasons; some airports did not report urea usage in all seasons examined.
TABLE 2-3 Distribution of Pounds of Urea Used by Hub Size Categories (Percentage of Deicing Season Total)
Season
Hub Size 2002–2003 2003–2004 2004–2005
Large (n=4) 391,850 (7%) 2,486,050 (33%) 1,244,400 (16%)
Med. (n=6) 2,458,950 (42%) 1,438,750 (19%) 3,940,250 (49%)
Small (n=9) 1,686,148 (29%) 2,347,611 (31%) 1,295,404 (16%)
Non (n=9) 1,372,400 (23%) 1,338,965 (18%) 1,574,080 (20%)
Total 5,909,148 7,611,376 8,054,134
It should also be noted that a few airports reported using ethylene or propylene glycol-based pavement deicers. Some of these glycol-based products contain urea, although the available data do not allow an estimate of this potential additional use of urea.
Aircraft Deicer Use Results Appendix E summarizes relevant operational and other characteristics for the 184 airports with likely deicing operations identified in this analysis. The airports are ranked in order of estimated average annual glycol use. Figure 2-2 shows the geographic distribution of estimated average annual glycol use at airports across the United States.
The data analysis yielded an estimated average of approximately 15,103,044 gallons of pure glycol (propylene and ethylene) being used annually for aircraft deicing and anti-icing operations at 184 airports in the United States. Of this total, approximately 12,019,032 gallons (or 80 percent) is based on actual reported-use data; only 20 percent of the national total was based on estimation using the UAF approach. Uncertainty analysis indicates upper and lower 99 percent confidence intervals of approximately 13,909,444 gallons and 16,296,643 gallons, respectively, for this estimated national average. Based on the reported use data for 2003–2004 and 2004–2005, approximately 10 percent of total average annual glycol use is ethylene glycol–based fluids. The ethylene glycol use for 2002–2003 was

ACRP 11-02—ESTIMATE OF NATIONAL USE OF AIRCRAFT- AND AIRFIELD-DEICING MATERIALS
2-10 THIS DOCUMENT INTENDED SOLELY FOR ACRP 11-02 PROJECT PANEL USE—DO NOT DISTRIBUTE
significantly lower than these subsequent two seasons, at approximately 6 percent of the total.
FIGURE 2-2 Geographic Distribution of Annual Average Aircraft Deicing Glycol Use
The relative contribution of airports by size to total glycol use is shown in the distribution of use among hub size categories (Table 2-4). Large- and medium-hub airports represent approximately 80 percent of the total national average annual glycol use.
TABLE 2-4 Distribution of Average Annual Aircraft Deicer Glycol Use Among Hub Size Categories
Hub Size Total Glycol
Use (Gallons) Fraction of
National Total (%)
Large 8,655,239 57
Medium 3,412,824 23
Small 2,117,407 14
Non 917,574 6
ACKNOWLEDGMENTS
THIS DOCUMENT INTENDED SOLELY FOR ACRP 02-02 PROJECT PANEL USE—DO NOT DISTRIBUTE 2-11
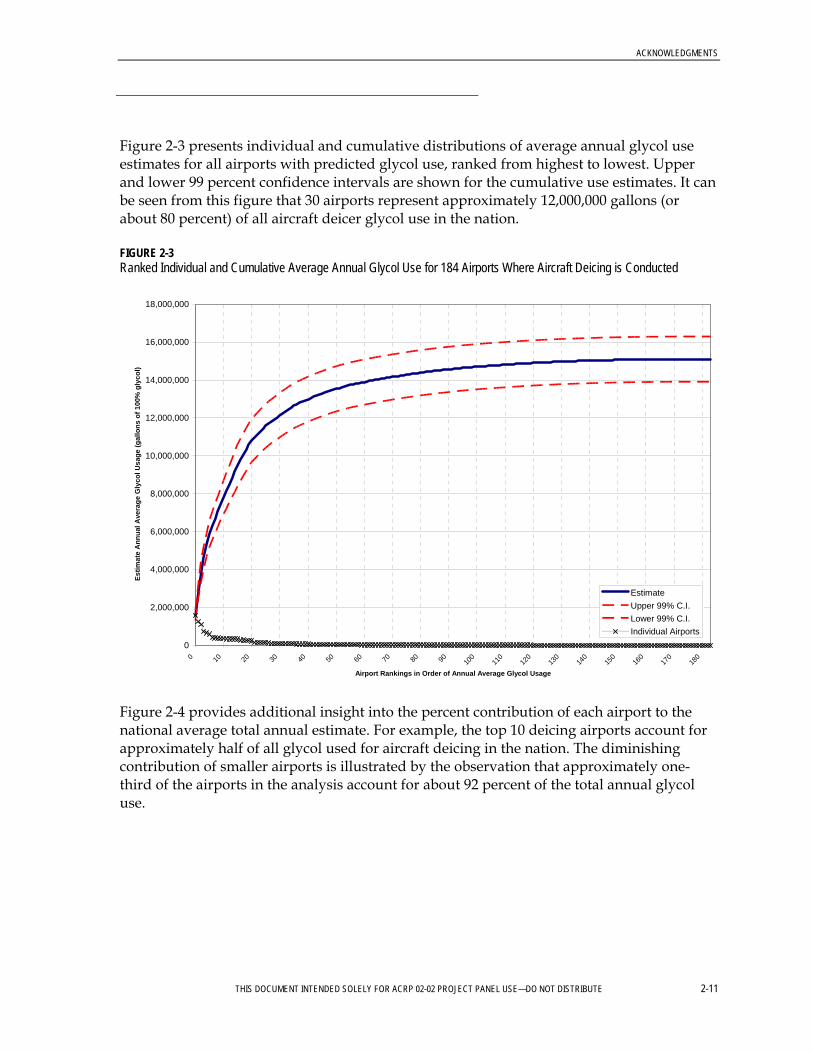
Figure 2-3 presents individual and cumulative distributions of average annual glycol use estimates for all airports with predicted glycol use, ranked from highest to lowest. Upper and lower 99 percent confidence intervals are shown for the cumulative use estimates. It can be seen from this figure that 30 airports represent approximately 12,000,000 gallons (or about 80 percent) of all aircraft deicer glycol use in the nation.
FIGURE 2-3 Ranked Individual and Cumulative Average Annual Glycol Use for 184 Airports Where Aircraft Deicing is Conducted
0
2,000,000
4,000,000
6,000,000
8,000,000
10,000,000
12,000,000
14,000,000
16,000,000
18,000,000
0 10 20 30 40 50 60 70 80 90 100
110
120
130
140
150
160
170
180
Airport Rankings in Order of Annual Average Glycol Usage
Estim
ate
Ann
ual A
vera
ge G
lyco
l Usa
ge (g
allo
ns o
f 100
% g
lyco
l)
EstimateUpper 99% C.I.Lower 99% C.I.Individual Airports
Figure 2-4 provides additional insight into the percent contribution of each airport to the national average total annual estimate. For example, the top 10 deicing airports account for approximately half of all glycol used for aircraft deicing in the nation. The diminishing contribution of smaller airports is illustrated by the observation that approximately one-third of the airports in the analysis account for about 92 percent of the total annual glycol use.

ACRP 11-02—ESTIMATE OF NATIONAL USE OF AIRCRAFT- AND AIRFIELD-DEICING MATERIALS
2-12 THIS DOCUMENT INTENDED SOLELY FOR ACRP 11-02 PROJECT PANEL USE—DO NOT DISTRIBUTE
FIGURE 2-4 Ranked Cumulative Percent Contribution from 184 Airports to the Total National Average Annual Glycol Use
0%
10%
20%
30%
40%
50%
60%
70%
80%
90%
100%
0 10 20 30 40 50 60 70 80 90 100
110
120
130
140
150
160
170
180
Airport Rankings in Order of Average Annual Glycol Usage
Estim
ated
Ave
rage
Ann
ual G
lyco
l Usa
ge (g
allo
ns o
f 100
% g
lyco
l)

THIS DOCUMENT INTENDED SOLELY FOR ACRP 11-02 PROJECT PANEL USE—DO NOT DISTRIBUTE 3-1
SECTION 3
EXISTING REGULATORY REQUIREMENTS
The objective of this component of the project was to identify and describe the various environmental regulatory mechanisms currently in place to control the impacts of deicing-runoff discharges on the environment. This identification effort focused on the National Pollutant Discharge Elimination System (NPDES) permit and total maximum daily load (TMDL) programs.
Regulatory Drivers The following discussion identifies and describes the various Clean Water Act regulatory mechanisms that control or limit the discharge of pollutants to the environment associated with deicing-related runoff. The major program that limits pollutant discharges from regulated sources is the National Pollutant Discharge Elimination System (NPDES) permit program. In addition, the Clean Water Act requires that total maximum daily load (TMDL) limitations supplement or enhance the NPDES permit program for certain “impaired” waters. This following overview of these two Clean Water Act programs will help provide some context relative to efforts to assess the impacts of existing and future controls that prevent deicing-related pollutants from reaching the nation’s waterways.
Federal Acts Affecting Airport Water Quality Regulations The CWA Section 402 creates a permitting system, known as the NPDES program, through which all facilities that discharge pollutants from a point source into a water of the U.S. must obtain a permit. The terms “pollutant,” “point source,” and “waters of the U.S.” are all very broadly defined. Point source discharges include, for example, those from publicly owned treatment works (POTWs), those from industrial facilities, and those associated with stormwater runoff.
Pollutant contributions to U.S. waters may come from direct or indirect sources. Direct sources discharge pollutants directly into receiving water bodies. Indirect sources discharge pollutants to POTWs, which in turn discharge into receiving water bodies. NPDES permits are issued only to directly discharging facilities, while indirect discharges are regulated by the CWA’s National Pretreatment Program. Airports and individual lease holders may have NPDES direct discharge permits for stormwater or for discharges of other industrial wastewaters that flow directly to receiving water bodies.
There is an additional regulatory program that pertains to airports that capture deicing operation runoff for treatment or recycling (or that have other onsite operations that generate wastewater that is captured and sent to POTWs). These facilities may have pretreatment permits or agreements with their local POTW for handling those wastewaters sent for treatment through the sewer. This regulatory program is not of specific relevance to the current analysis, but is mentioned for completeness.

ACRP 11-02—ESTIMATE OF NATIONAL USE OF AIRCRAFT- AND AIRFIELD-DEICING MATERIALS
3-2 THIS DOCUMENT INTENDED SOLELY FOR ACRP 11-02 PROJECT PANEL USE—DO NOT DISTRIBUTE
It should be noted throughout these discussions that the airport operator generally will be held responsible for compliance with limitations on discharges that leave the airport property. However, this responsibility may be shared with aircraft operators and other tenants through facility-specific arrangements that include these parties as co-permittees, or otherwise establish formal responsibilities.
Federal Stormwater Program Currently, there are three main categories of regulated stormwater discharges: industrial, municipal, and construction. EPA includes within the term “industrial” a variety of discharges, most of which are designated by narrative descriptions and Standard Industrial Classification (SIC) codes, including SIC code 45, “transportation facilities” that conduct vehicle maintenance, equipment cleaning, or airport deicing operations (40 CFR part 122.26(b)(14)(viii)). The industrial stormwater program regulates only those discharges associated with industrial activity and those otherwise unregulated stormwater discharges that are commingled with those industrial stormwater discharges.
Neither the construction nor the municipal stormwater programs focus on aircraft deicing. Hence, our focus here is on EPA’s NPDES industrial permit program.
Implementation of Regulations in Different Types of Airport Discharge Permits The NPDES permit program is implemented through two types of permits. The permitting authority may develop broader permits that allow specified groups of regulated entities to obtain NPDES permit coverage—“general” permits — or permits can be issued directly to the facility that discharges pollutants to U.S. waters—an “individual” permit. The following discussions describe these two permitting devices.
General Industrial Stormwater Permits Because of the volume of regulated entities subject to the stormwater program, EPA has used general permits to ease its administrative burden, and states have followed suit. General permits are issued for specific groups of regulated entities and thus must be drafted rather generically to ensure that they are applicable to as many of those entities as possible. General permits go through a notice and comment rulemaking process and once completed, facilities that wish to comply with the general permit typically must file a Notice of Intent (NOI) form that certifies that the permittee will comply with the terms and conditions contained in the permit.
EPA’s current general permit covering airport industrial stormwater discharges is the Multi-Sector General Permit (MSGP), which was promulgated in 1995 (and revised in 2000). [Note that a revised MSGP 2008 should be promulgated by the time of this document’s publication.]
EPA developed the “air transportation” portions of the MSGP predominantly from information submitted through the AAAE Group Stormwater Permit Application in the early 1990s. Although authorized states retain discretion regarding their own general permitting approaches, (providing they meet minimum NPDES requirements), many states have adopted general permits based on EPA’s MSGP, particularly with regard to airport discharges.

ACKNOWLEDGMENTS
THIS DOCUMENT INTENDED SOLELY FOR ACRP 02-02 PROJECT PANEL USE—DO NOT DISTRIBUTE 3-3
Individual Industrial Stormwater Permits Unlike general permits, individual permits are tailored to the actual activities occurring at the site and require a thorough analysis of site-specific conditions. For this reason, individual permits are preferred by some regulators over general permits for complex facilities or where specific environmental concerns exist. While EPA and most states have developed general permits that are broadly applicable to industrial stormwater discharges, one departure from this trend has been with regard to major hub airports, specifically due to their complexities. Several states prohibit complex sites, including some larger airports, from seeking coverage under the state’s general permit, requiring instead that such sites obtain individual permits.
There are several fundamental differences in the development of general vs. individual permits. General permits tend to provide more narrative approaches to fundamental permitting issues (for example, compliance with water quality standards and implementation of BMPs). Individual permits require a two-part analysis that first mandates implementation of appropriate technology standards (typically BMPs in stormwater permits) and next requires that the permit writer assess receiving water bodies and determine if additional compliance requirements should be imposed to maintain water quality standards. Airports that discharge to smaller, more-sensitive water bodies will generate the more-stringent analyses and requirements (larger water bodies generally assimilate conventional pollutants that are discharged from airports—including BOD and total suspended solids (TSS)—with less chance of impacting water quality of those water bodies). These requirements may be expressed as numeric limits either on the concentrations or mass loadings associated with the discharges, or in the alternative as performance metrics associated with the deicing runoff control system (for example, percent of total applied deicers either collected and treated, or contained in permitted discharges).
Either general permits or individual permits may allow airports to include major tenants as “co-permittees.” Whether to include such tenants as co-permittees, cover tenant operations through the airport’s permit without co-permittee status, or require tenants to obtain their own permits is an airport-specific decision. In both individual and general permit scenarios, airports may have to engage and manage significant interactions with tenants to ensure that appropriate controls are in place, are functioning, and lead to permit compliance. This may require relatively detailed collaboration with regard to the airport’s stormwater pollution prevention plan, deicing runoff management plan, and other compliance mandates in the permit.
In sum, one could argue that individual stormwater permits issued to airports generally would provide, at least incrementally, more specific and measurable protection for local receiving waters than general permits. For this reason, more weight may be given to those permits in this report’s overall assessment of deicing usage and related environmental exposure.
Industrial Pretreatment Permits. Not all deicing runoff is discharged directly to waters of the U.S. via general or individual stormwater permits. Deicer-laden runoff may be collected and then sent to POTWs for treatment. POTWs are allowed to accept industrial waste along with sanitary waste provided they are designed to treat the type of wastewaters entering their systems and they comply with their own NPDES direct discharge permits. Industrial users (in this case, airports) must comply with the POTWs pretreatment regulations and cannot discharge pollutants that would “pass through” or “interfere” with the POTWs treatment

ACRP 11-02—ESTIMATE OF NATIONAL USE OF AIRCRAFT- AND AIRFIELD-DEICING MATERIALS
3-4 THIS DOCUMENT INTENDED SOLELY FOR ACRP 11-02 PROJECT PANEL USE—DO NOT DISTRIBUTE
works. Again, this regulatory program is not addressed in the current analysis and mentioned here for completeness.
Total Maximum Daily Load (TMDL) Program Protections The CWA also sets forth special requirements for pollutants that are discharged to “impaired” waters. States are responsible for determining whether any of its waters are “impaired” through a process in which it first assigns a “designated uses” for each water body or segment of a water body. The most common (and one of the more protective) “designated uses” is commonly referred to as “fishable/swimmable,” because it requires both protection of human health as well as aquatic species. When a water body contains sufficient pollutant levels that it cannot meet its designated use, it is deemed to be “impaired” for whatever pollutant(s) prevents it from meeting its use.
States are required periodically to prepare and submit lists of “impaired waters” to EPA, and states must initiate efforts to ensure that the waters ultimately will meet their designated use (or actually change the use in special circumstances). In most cases, the CWA’s TMDL program mandates that the state develop a program (or TMDL) that limits the total amount of the target pollutants discharged into the impaired water body. TMDLs specifically allocate the total allowable quantities of pollutant discharges to various regulated and unregulated sources.
Unlike the NPDES program, TMDLs set allocations not only for point source discharges (termed waste load allocations or WLAs), but also for non-point sources (termed load allocations). But because there are no direct regulatory mechanisms for forcing non-point sources to limit their discharges, such sources may end up consuming all of the allowable pollutant discharges, leaving zero allocations for NPDES permit holders. In any event, WLAs (whatever is left) then are allocated to point source discharges and incorporated into their NPDES permits. Hence, TMDLs can force regulated sources to meet more stringent permit standards than a similarly situated source on an unimpaired water body.
As is the case with other discharge restrictions contained in permits, TMDL restrictions may take the form of concentration or mass-based limits or performance requirements; or in certain circumstances, they can be expressed as BMPs. The latter are more commonly found in stormwater permits, like those that may be issued to airports. BMPs are particularly applicable when numeric limits are hard to calculate or justify. In any event, TMDLs help to serve as a useful tool for this report in assessing environmental exposure of pollutants found in deicing fluids because we can predict that waters listed by states as impaired for related pollutants eventually will drive airport discharge limits to ensure recovery of that water body.
Data Collection Data collection consisted of the following:
• The EPA’s Permit Compliance System (PCS) database was searched for information on airport permits and associated discharge compliance requirements. Existing project team files, knowledge, and professional networks were also employed to address gaps or inaccuracies in the database’s coverage of airports known to perform deicing activities.

ACKNOWLEDGMENTS
THIS DOCUMENT INTENDED SOLELY FOR ACRP 02-02 PROJECT PANEL USE—DO NOT DISTRIBUTE 3-5
• A method was developed to identify airports within close proximity to water bodies either previously subject to TMDLs or on states’ Impaired Waters (303(d)) lists, and thus subject to TMDL development. This included information on the nature of impairment and any identified potential sources.
Further details are provided below. The analysis was limited to the Part 139 certificate-holding airports that had been previously identified as being likely to have significant deicing operations.
NPDES Permits Issued to Airports The EPA maintains numerous databases that are accessible through their Web site. One such database is the Permit Compliance System (PCS), which, according to the EPA, “…provides information on companies which have been issued permits to discharge waste water into rivers.” Although the EPA uses the word “companies,” note that municipal dischargers and other public-sector entities are included. Information available from this database includes the following:
• Facility name • Permit issue date • Geographic location • Permit expiration date • Standard industrial classification • Permitted discharge flow • Constituents limited in the discharge • Monitoring data
There are some noteworthy limitations to the PCS system. First, the database is subject to the quality standards employed by each state’s environmental regulatory agency. These agencies summarize the data and submit their summaries to the EPA. The methods used in preparing these summaries may differ among states. For example, a state may add extra digits to the basic permit number to denote a subcategory or other characteristic of importance. These additional digits, though, may cause the permit number to exceed the allowable size in the corresponding field in the EPA database. As a result, there can be significant variability among states in the completeness and accuracy of their reported information. Additional potential for error is introduced when the received data are combined and entered into the PCS database. Finally, the database is only as current as this data exchange and updating procedure occurs. As an example of the types of delays that may occur, the following is posted to the EPA’s PCS query form: “As of June 6th, 2006, pending migration to a new system, the data for the Permit Compliance System (PCS) will remain frozen in Envirofacts for the following states: MA, NH, RI, VI, PR, DC, MD, IN, NM, UT, HI, AK, ID.” In spite of these limitations, this database is the best available source for countrywide, existing discharge permits.
Through the PCS query form, the following queries were submitted to develop a list of the nation’s commercial airports and any information associated with corresponding NPDES permits:
• Facilities with a Standard Industrial Classification (SIC) Code of 4581 (airports, flying fields, and airport terminal services);
• Facilities with an SIC Code of 4512 (air transportation, scheduled);
• Facility names containing the word “airport”;

ACRP 11-02—ESTIMATE OF NATIONAL USE OF AIRCRAFT- AND AIRFIELD-DEICING MATERIALS
3-6 THIS DOCUMENT INTENDED SOLELY FOR ACRP 11-02 PROJECT PANEL USE—DO NOT DISTRIBUTE
• Permits with ethylene or propylene glycol parameter codes associated with them; and
• Airport facilities known to have at least 10,000 total annual operations but that were not found in the above searches.
Once the initial compilation of permit information was developed, the information was reviewed to identify any questionable entries. All such entries were researched further to resolve the apparent discrepancy. This process revealed a number of PCS listings that were found to be in error, and the corresponding project database entries were updated to reflect the most accurate information.
Impaired Water Listings and Developed TMDLs A method was sought to identify those airports that are subject to TMDLs. Unfortunately, there is no national list or database of dischargers associated with either 303(d)-listed waters or issued TMDLs. As an alternative, a GIS-based approach was developed to identify airports in close proximity to either a 303(d)-listed water body or a water body with an issued TMDL.
The EPA’s Watershed Assessment Tracking and Environmental Results (WATERS) tool was employed to identify water bodies associated with an existing TMDL. To identify current 303(d)-listed waters, the EPA’s Reach Address Database (RAD), a subset of the WATERS tool, was used. Note that, again, while these databases are the best available sources for this information, the information in these databases is neither necessarily complete nor up to date. These sources of information were supplemented with existing knowledge and queries using the WATERS Expert Query Tool. For example, the Ted Stevens Anchorage International Airport (ANC) discharges to a water body for which an official TMDL has not been developed. However, a Water Body Recovery Plan has been developed for this water body and, for the purposes of this investigation, is functionally equivalent to a TMDL.
To further reduce the list of potentially relevant water bodies, the identified water bodies were filtered to include only those where sources of impairment might be associated with deicing operations. The relevant sources of impairment consisted of the following database codes:
• Ammonia • Low dissolved oxygen • Ammonia-nitrogen • NH3-N • Ammonia (unionized) • Nonpriority organics • Aquatic toxicity • Organic enrichment/low dissolved oxygen • Biochemical oxygen demand • Organics • Biological • Oxygen demand • Biological oxygen demand • Priority organics • BOD • Propylene and ethylene glycols • BOD5 • Total toxics • CBOD • Toxics • Deicing agents • Unionized ammonia • Dissolved oxygen • Unknown toxicity • Dissolved oxygen saturation

ACKNOWLEDGMENTS
THIS DOCUMENT INTENDED SOLELY FOR ACRP 02-02 PROJECT PANEL USE—DO NOT DISTRIBUTE 3-7
Location information for all Part 139 certificate-holding airports was obtained from FAA. A radial search was conducted using GIS to identify all such airports located within 3 miles of any water body that is either on the 303(d) list or for which a TMDL has been issued. The 3-mile radius was selected based on the assumption that an airport within this proximity to an impaired water body would be subject to regulatory scrutiny to ensure adequate environmental protection.
The result of the search is a list of airports with deicing operations located within three miles of a water body that is subject to an existing TMDL or on the current 303(d) list and slated for TMDL development, and where pollutants potentially associated with deicing operations have been identified as a concern.
Results This section presents the results of the above analyses.
NPDES Permit Coverage of Deicing Discharges Figure 3-1 presents the numeric distribution of types of NPDES permits authorizing stormwater discharges from airports with deicing operations; permit information was unavailable for almost half of the 184 deicing airports examined. An unusual observation occurred. One of these airports does not have an NPDES permit for surface water discharges because it does not discharge to a water of the state; all stormwater runoff is sent to a publically-owned treatment works (POTW). That airport’s permit status has been defined as “none.”
FIGURE 3-1 Distribution of NPDES Permit Types among 184 Deicing Airports
General Permits28%
Individual Permits27%
Unknown Permits44%
No Direct Discharge1%

ACRP 11-02—ESTIMATE OF NATIONAL USE OF AIRCRAFT- AND AIRFIELD-DEICING MATERIALS
3-8 THIS DOCUMENT INTENDED SOLELY FOR ACRP 11-02 PROJECT PANEL USE—DO NOT DISTRIBUTE
Figure 3-2 presents the geographic distribution of types of NPDES permits authorizing stormwater discharges from airports with deicing operations, along with estimated average annual total glycol use. It can be seen from this figure that most of the largest users of aircraft-deicing glycol discharge impacted runoff pursuant to individual NPDES permits.
Appendix E lists the NPDES permit type found for each airport along with the water quality parameters for which any numerical limits were found associated with each permit. Of those permits found with numerical limits, 33 percent specifically name biochemical oxygen demand (BOD) as a limited parameter. The next most common limited constituent is ammonia, found in 21 percent of the permits with any limits. Ethylene glycol, chemical oxygen demand, and dissolved oxygen cumulatively occur in 36 percent of the permits with effluent limits.
Table 3-1 presents the distribution of permit types further divided by airport hub size. All but one discharge from northern tier large hub permits are covered by individual permits (the exception is Ronald Reagan Washington National Airport), as are the majority of large- and medium-hub types.

ACKNOWLEDGMENTS
THIS DOCUMENT INTENDED SOLELY FOR ACRP 02-02 PROJECT PANEL USE—DO NOT DISTRIBUTE 3-9
FIGURE 3-2 Geographic Distribution of Permit Types among 184 Deicing Airports
TABLE 3-1 Permit Type Versus Hub Type
Hub Type
No. of General Permits
No. of Individual Permits
No. of Unknown Permit Type
No. without NPDES Permit
Total Glycol Use (gals)
Large 5 16 0 1* 8,655,239
Medium 10 15 3 0 3,412,824
Small 17 14 27 0 2,117,407
Non- 19 5 52 0 917,574 * Does not have an NPDES permit because there is no direct discharge to a water of the state.
Figure 3-3 presents total glycol use distributed among NPDES permit categories. The associated glycol use and percent of the total annual average glycol use are shown. Comparing Figures 3-1 and 3-3, it is apparent that, although the airports with individual permits only constitute 27 percent of the total permits, they represent roughly 80 percent of the total glycol use. Thus, the data indicate that the stormwater discharges affected by at

ACRP 11-02—ESTIMATE OF NATIONAL USE OF AIRCRAFT- AND AIRFIELD-DEICING MATERIALS
3-10 THIS DOCUMENT INTENDED SOLELY FOR ACRP 11-02 PROJECT PANEL USE—DO NOT DISTRIBUTE
least 80 percent of the deicing glycol use in the country are controlled by individual NPDES permit requirements that have been developed specifically to protect the water quality of receiving waters. Although permit type was unidentified for 45 percent of the airports examined, these facilities represent only 8 percent of the total glycol use in the nation. Airports operating under general permits represent 28 percent of the permits and 9 percent of the total glycol use, and the remaining fractions are associated with the one deicing airport that does not have an NPDES permit because it does not discharge to a water of the state.
FIGURE 3-3 Distribution of Glycol Use Among NPDES Permit Types at Deicing Airports
No Direct Discharge369,075 Gals, 2% General Permits
1,403,867 Gals, 9%
Individual Permits12,170,518 Gals, 81%
Unknown Type,1,159,583 Gals, 8%
Deicing Discharges Subject to the TMDL Program A listing of airports with deicing activities that are likely to be subject to TMDL program regulation is contained in Appendix F. This listing includes the nature of the impairment(s) indicated by available data, as well as the potential source of impairment, if it is specifically mentioned in a TMDL.
Table 3-2 presents a summary of the distribution of airports subject to the TMDL program regulation among the two different conditions (i.e., 303(d) listed or TMDL issued) and hub sizes. It can be seen that about 44 percent of the total average annual glycol use in the nation is subject to regulation under the TMDL program.
Low dissolved oxygen issues are the most common type of impairment reported, with 16 of the 20 issued TMDLs and 25 of the 41 303(d) listed water bodies involving some sort of

ACKNOWLEDGMENTS
THIS DOCUMENT INTENDED SOLELY FOR ACRP 02-02 PROJECT PANEL USE—DO NOT DISTRIBUTE 3-11
oxygen-related impairment. Of the few listings with potential sources indentified, all included some mention of airport runoff. Toxicity, organics, and ammonia were the next most often found impairments.
TABLE 3-2 Distribution of Airport Subject to Regulation Under the TMDL Program
Hub Size Data 303(d) Listed
TMDL Issued Total
Large Number of airports 7 3 10
Estimated average annual glycol use (gal) 1,969,636 1,734,065 3,703,701
Med Number of airports 9 6 15
Estimated average annual glycol use (gal) 1,507,301 701,528 2,208,829
Small Number of airports 8 2 10
Estimated average annual glycol use (gal) 767,616 74,885 842,501
Non Number of airports 17 9 26
Estimated average annual glycol use (gal) 186,197 59,840 246,037
Totals Number of airports 41 20 61
Estimated average annual glycol use (gal) 4,430,750 2,570,319 7,001,069
Deicing Discharges Regulated by Individual NPDES Permits and/or Subject to TMDL Program Figure 3-4 combines the information above to present the distribution of glycol use among permit types and TMDL program coverage. The data show that airport stormwater discharges associated with approximately 86 percent of all glycol use in the nation are regulated by individual NPDES permits and/or the TMDL program, both of which impose site-specific limits based on maintaining water quality standards in receiving waters. The one facility without an NPDES permit is not included in this group. However, if the current strategy were changed to allow surface water discharges, this facility would be subject to the TMDL program because it is within 3 miles of a water body currently on the 303(d) list.
It is likely that some fraction of the facilities where the permit type is unknown and the permit is not potentially associated with the TMDL program actually are controlled under individual permits. Thus, conservatively, no more than 14 percent of the glycol used in the nation is not controlled under either of these two stringent regulatory programs.

ACRP 11-02—ESTIMATE OF NATIONAL USE OF AIRCRAFT- AND AIRFIELD-DEICING MATERIALS
3-12 THIS DOCUMENT INTENDED SOLELY FOR ACRP 11-02 PROJECT PANEL USE—DO NOT DISTRIBUTE
FIGURE 3-4 Distribution of Glycol Use among NPDES Permit Types and TMDL Program Coverage.
Permit Type Covered Under TMDL Program?
Annual Glycol Use(gal)
Site-Specific Water Quality-Based Regulatory Controls
Individual No 6,412,451
Individual Yes 5,758,026
General Yes 642,451
Unknown Yes 231,517
No Direct Discharge to Surface Waters
If discharge became necessary
369,075
BMP-based or Unknown Regulatory Controls
General No 761,416
Unknown No 928,066

THIS DOCUMENT INTENDED SOLELY FOR ACRP 11-02 PROJECT PANEL USE—DO NOT DISTRIBUTE 4-1
SECTION 4
SUMMARY AND CONCLUSIONS
Airfield Deicer Use This analysis of pavement deicer use was limited to the use data available from EPA’s 2006 Airport Survey Questionnaire. Among the 150 airports responding to that survey, 77 reported using airfield pavement deicers during one or more of the three seasons examined. Potassium acetate–based products were the most popular, with about 82 percent of the airports that used airfield deicers reporting its use. Sand was the second most commonly used product for maintaining safe airfield wintertime operations. Approximately one-third of the airports that used airfield pavement deicers reported using urea, with use occurring across a broad range of airports. Finally, it appears that relatively few airports use glycol-based pavement deicers.
Aircraft Deicer Use An estimated average of 15,103,044 gallons of pure glycol was used annually during the three deicing seasons between October 2002 and April 2005. Of this estimated total, approximately 12,019,032 gallons (or 80 percent) are based on actual reported use data, while only 20 percent of the national total was generated using the UAF approach. The upper and lower 99 percent confidence bounds on this national estimate are approximately 13,909,444 gallons and 16,296,643 gallons, respectively.
The vast majority (i.e., 80 percent) of the aircraft deicer glycol use in the nation occurs at large- and medium-hub airports. Just 10 of these airports account for more than half of all glycol used for aircraft deicing in the nation.
EPA previously estimated that 35,000,000 gallons of 50 percent concentration ADF was applied annually (EPA, 2000). Assuming that concentrated ADF is 88 percent glycol, this translates to approximately 15,200,000 gallons of pure glycol, which is remarkably similar to the estimate developed in the current study. However, some aspects of this earlier estimate must be considered in assessing its comparability to the results in the current report. The data used to develop EPA’s estimate were collected in a 1999 survey of 23 airports and reflected a variable number of previous deicing seasons at each of these airports. As such, reported use reflected a much smaller sampling of airports than the current analysis and operating conditions, which may have been significantly different from the 2002–2005 period. Perhaps more significantly, air traffic volumes were notably lower in the mid- to late-1990s than during the 2002–2005 period (Figure 4-1). In conclusion, although the two estimates appear consistent, it is likely that the previous EPA analysis overestimated actual use for the period examined.

ACRP 11-02—ESTIMATE OF NATIONAL USE OF AIRCRAFT- AND AIRFIELD-DEICING MATERIALS
4-2 THIS DOCUMENT INTENDED SOLELY FOR ACRP 11-02 PROJECT PANEL USE—DO NOT DISTRIBUTE
FIGURE 4-1 Annual Commercial Aircraft Operations Reported by FAA for the Years 1995–2005
22,500,000
23,000,000
23,500,000
24,000,000
24,500,000
25,000,000
25,500,000
26,000,000
26,500,000
1995 1996 1997 1998 1999 2000 2001 2002 2003 2004 2005
Year
Tota
l Com
mer
cial
Ope
ratio
ns
Existing Regulatory Requirements Existing regulatory requirements control the vast majority of deicing discharges in the nation. Stormwater discharges associated with approximately 86 percent of all aircraft deicer glycol use are covered by either an individual NPDES permit or the TMDL program or both.
Of the 34 airports using an average of more than 100,000 gallons of glycol annually, all but five are operating under individual NPDES permits. Of these five, one does not have an NPDES permit at all, and two others must manage their stormwater discharges to meet the requirements of local TMDLs. The remaining two airports are operating under general NPDES permits.
Nationally, environmental regulators are beginning to focus more attention on the impacts of nutrients and sediment, particularly as a result of stormwater pollution. For this reason, many more water bodies are likely to become designated “impaired” under the 303(d) program in the relatively near future. Because nutrient-related impairments typically include dissolved oxygen, as do impairments associated with deicing discharges, additional airports are likely to come under the scrutiny of the TMDL development process, and be subject to more stringent permit requirements in the future.

SUMMARY AND CONCLUSIONS
THIS DOCUMENT INTENDED SOLELY FOR ACRP 02-02 PROJECT PANEL USE—DO NOT DISTRIBUTE 4-3
Future Trends The data analysis presented in this report represents a snapshot in time of industry practices that are subject to change as a result of two significant factors: technological developments and climate change.
Over the past decade, aircraft and airfield pavement dicing operations and formulations have seen dramatic technological advances. While safety is always the overriding factor for deicing operations, new deicer application technologies (e.g., forced air in combination with low flow deicing fluid nozzles), and practices (e.g., blending aircraft deicing fluid mixtures to ambient temperatures) are reducing the amounts of glycol required for safe aircraft operation under a range of winter conditions. In addition, ongoing research into alternatives to the glycols by ACRP, the Department of Defense, and the private sector is resulting in new deicing products with reduced environmental impacts being introduced to the market on a regular basis. Hence, we now are witnessing reduced environmental impacts from these operations while still meeting flight safety standards.
Global climate change is starting to be considered by individual airports. Local changes are expected to vary by geographic location. Global climate change experts predict significant variations in precipitation patterns across the country. In those areas with warmer winters and less precipitation, significant reductions may occur. However, modest temperature variation coupled with significantly increased winter precipitation could result in some airports increasing deicer usage. The implications to national usage of deicers are unclear at this time.
Although a quantitative assessment of the implications of these trends is beyond the scope of the present investigation, these factors should be born in mind when interpreting the results presented herein.


THIS DOCUMENT INTENDED SOLELY FOR ACRP 11-02 PROJECT PANEL USE—DO NOT DISTRIBUTE 5-1
SECTION 5
REFERENCES
CFR (Code of Federal Regulations). Title 14, Part 139. “Certification of Airports.” February 2004.
ERG. 2000. “Final Development of Estimated Loading in Wastewater Discharges from Aircraft Deicing/Anti-icing Operations.” EPA Contract No. 68-C5-0033.
EPA. 2000. “Preliminary Data Summary: Airport Deicing Operations (Revised).” EPA Preliminary Data Summary No. EPA-821-R-00-016. Office of Water. Washington, D.C.
EPA. Envirofacts Warehouse—PCS—Water Discharge Permits Query Form. http://www .epa.gov/enviro/html/pcs/pcs_query_java.html. Accessed October 9, 2007.
EPA. Query Tool. http://www.epa.gov/waters/tmdl/expert_query.html. Accessed December 7, 2007.
EPA. Envirofacts—Water. http://www.epa.gov/enviro/html/pcs/pcs_overview.html. Accessed March 11, 2008.
EPA. Waters Data Downloads. http://www.epa.gov/waters/data/downloads.html#303d. Accessed November 28, 2007.
EPA. Development Server Home Page. http://Epamap32.epa.gov. Accessed January 8, 2008.


Appendix A


TABLE A-1List of Airports Examined in the Analysis
Airport Code State Facility Name
Average Deicing Season Relevant
Operations Hub Size
Average Annual
Snowfall (inches)
1G4 AZ Grand Canyon West - N - 1 *ABE PA Lehigh Valley Intl 22,462 S 32.1 2ABI TX Abilene Rgnl 6,923 N 4.6 4ABQ NM Albuquerque Intl Sunport 71,396 M 10.8 4ABR SD Aberdeen Rgnl - N 36.5 2ACK MA Nantucket Memorial 47,607 N - 2 *ACY NJ Atlantic City Intl 13,349 S 15.7 3AEX LA Alexandria Intl 6,199 N - 5 *AFW TX Fort Worth Alliance 6,233 - - na *AGS GA Augusta Rgnl At Bush Field 8,289 N 1.1 4AKN AK King Salmon 8,783 N 46.1 2ALB NY Albany Intl 52,557 S 63.8 1AMA TX Rick Husband Amarillo Intl 13,233 S 15 3ANC AK Ted Stevens Anchorage Intl 104,312 M 70 1APF FL Naples Muni 9,402 N - naARA LA Acadiana Rgnl 9,443 - - naASE CO Aspen-Pitkin Co/Sardy Field 9,830 N - 1 *ATL GA Hartsfield - Jackson Atlanta Intl 536,869 L 2 4ATW WI Outagamie County Rgnl 12,698 N - 2 *AUS TX Austin-Bergstrom Intl 68,453 M 0.9 5AVL NC Asheville Rgnl 11,898 N 14.9 4AVP PA Wilkes-Barre/Scranton Intl 13,199 N - 2 *AZO MI Kalamazoo/Battle Creek Intl 11,112 N - 1 *BDL CT Bradley Intl 63,673 M 47.9 2BED MA Laurence G Hanscom Fld 13,060 N - 2 *BET AK Bethel 54,969 N 49.4 2BFI WA Boeing Field/King County Intl 36,954 N 6.8 4BFL CA Meadows Field 15,462 N - naBGM NY Greater Binghamton/Edwin A Link Field 9,205 N 82.8 1BGR ME Bangor Intl 13,893 S - 1 *BHM AL Birmingham Intl 43,808 S 1.5 4BIL MT Billings Logan Intl 28,643 S 56.3 2BIS ND Bismarck Muni 7,648 N 42.7 2BKF CO Buckley Afb - - - 1 *BKL OH Burke Lakefront 9,733 - - 2 *BLI WA Bellingham Intl 8,082 N - 4 *BMI IL Central Il Regl Arpt At Bloomington-Normal 7,844 N - 2 *BNA TN Nashville Intl 99,790 M 9.9 4BOI ID Boise Air Terminal/Gowen Fld 39,942 S 20.7 3BOS MA General Edward Lawrence Logan Intl 209,301 L 41.7 2BTR LA Baton Rouge Metropolitan, Ryan Field 13,870 S 0.2 5BTV VT Burlington Intl 22,905 S 78 1BUF NY Buffalo Niagara Intl 54,861 M 91.8 1BUR CA Bob Hope 52,063 M - naBWI MD Baltimore/Washington Intl Thurgood Marshal 152,407 L 20.4 3BZN MT Gallatin Field 9,396 N - 2 *CAE SC Columbia Metropolitan 36,097 S 1.7 4CAK OH Akron-Canton Rgnl 20,027 S 47.4 2CHA TN Lovell Field 13,511 N 4.3 4CHO VA Charlottesville-Albemarle 12,619 N - 4 *CHS SC Charleston Afb/Intl 29,529 S 0.7 5CIC CA Chico Muni 3,386 N - naCID IA The Eastern Iowa 20,301 S - 2 *
Snowfall Group

TABLE A-1List of Airports Examined in the Analysis
Airport Code State Facility Name
Average Deicing Season Relevant
Operations Hub Size
Average Annual
Snowfall (inches)
Snowfall Group
CLE OH Cleveland-Hopkins Intl 138,244 M 55.7 2CLT NC Charlotte/Douglas Intl 245,352 L 5.4 4CMH OH Port Columbus Intl 98,620 M 27.9 3CMI IL University Of Illinois-Willard 7,176 N - 2 *COE ID Coeur D'Alene Air Term - N - 2 *COS CO City Of Colorado Springs Muni 28,043 S 42.3 2CPR WY Natrona County Intl 9,766 N 79.1 1CRP TX Corpus Christi Intl 12,539 S - naCRQ CA Mc Clellan-Palomar 7,743 N - naCRW WV Yeager 23,274 N 33.1 2CVG KY Cincinnati/Northern Kentucky Intl 287,189 L 23.4 3CWA WI Central Wisconsin 10,289 N - 2 *DAL TX Dallas Love Field 74,821 M 2.5 4DAY OH James M Cox Dayton Intl 49,675 S 27.7 3DCA DC Ronald Reagan Washington National 150,793 L 16.4 3DEN CO Denver Intl 301,738 L 60.3 1DFW TX Dallas/Fort Worth Intl 438,595 L 2.5 4DLG AK Dillingham - N - 2 *DRO CO Durango-La Plata County - N - 1 *DSM IA Des Moines Intl 37,552 S 33.3 2DTW MI Detroit Metropolitan Wayne County 284,203 L 41.3 2EAT WA Pangborn Memorial - N - 3 *EAU WI Chippewa Valley Rgnl - N - 2 *EGE CO Eagle County Rgnl 7,801 N - 1 *ELM NY Elmira/Corning Rgnl 7,406 N - 1 *ELP TX El Paso Intl 37,603 S 5.3 4ENA AK Kenai Muni 8,607 N - 2 *ERI PA Erie Intl/Tom Ridge Field 9,245 N 86.5 1EUG OR Mahlon Sweet Field 15,606 N 6.3 4EVV IN Evansville Rgnl 14,070 N 13.6 4EWR NJ Newark Liberty Intl 236,820 L 27.5 3EYW FL Key West Intl 22,186 N 0 naFAI AK Fairbanks Intl 30,997 S 69.5 1FAR ND Hector Intl 11,789 N 38.9 2FAT CA Fresno Yosemite Intl 28,358 S 0.1 5FAY NC Fayetteville Rgnl/Grannis Field 5,519 N - 4 *FLL FL Fort Lauderdale/Hollywood Intl 145,289 L - naFNT MI Bishop Intl 15,977 S 45.2 2FSD SD Joe Foss Field 21,249 N 40.1 2FWA IN Fort Wayne Intl 22,832 N 32.8 2GCN AZ Grand Canyon National Park 42,685 S - 1 *GEG WA Spokane Intl 36,709 S 49.5 2GFK ND Grand Forks Intl 23,226 N - 2 *GJT CO Grand Junction Regional 11,915 N 24.7 3GNV FL Gainesville Rgnl 5,910 N - naGPI MT Glacier Park Intl - N 63.9 1GPT MS Gulfport-Biloxi Intl 9,016 S - naGRB WI Austin Straubel Intl 14,755 S 46.7 2GRI NE Central Nebraska Rgnl 3,105 N 30.5 2GRR MI Gerald R. Ford Intl 33,656 S 71.8 1GSN CQ Francisco C. Ada/Saipan Intl 19,236 S - naGSO NC Piedmont Triad Intl 42,943 S - 4 *GSP SC Greenville Spartanburg Intl - 30,024 S - 4 *

TABLE A-1List of Airports Examined in the Analysis
Airport Code State Facility Name
Average Deicing Season Relevant
Operations Hub Size
Average Annual
Snowfall (inches)
Snowfall Group
GTF MT Great Falls Intl 13,105 N 58.4 2GUM GU Guam Intl 14,452 S - naHLN MT Helena Rgnl 9,151 N 47 2HNL HI Honolulu Intl 131,331 L 0 naHOM AK Homer - N 57.7 2HOU TX William P Hobby 90,235 M 0.4 5HPN NY Westchester County 40,938 S - 3 *HRL TX Valley Intl 8,704 S - naHSV AL Huntsville Intl-Carl T Jones Field 21,277 S 2.7 4HYA MA Barnstable Muni-Boardman/Polando Field 43,080 N - 2 *IAD DC Washington Dulles Intl 217,263 L 22.3 3IAH TX George Bush Intercontinental/Houston 279,238 L 0.4 5ICT KS Wichita Mid-Continent 34,286 S 15.7 3IDA ID Idaho Falls Rgnl 8,077 N - 3 *ILM NC Wilmington Intl 11,905 N 1.9 4ILN OH Airborne Airpark - N - 3 *IND IN Indianapolis Intl 103,350 M 22.9 3ISP NY Long Island Mac Arthur 20,269 S 20.5 3ITH NY Ithaca Tompkins Rgnl 5,547 N - 1 *ITO HI Hilo Intl 38,504 S 0 naJAC WY Jackson Hole 7,409 N - 1 *JAN MS Jackson-Evers Intl 18,189 S 0.9 5JAX FL Jacksonville Intl 50,102 M - 5 *JFK NY John F Kennedy Intl 178,959 L 22.9 3JNU AK Juneau Intl 24,555 S 100.7 1KOA HI Kona Intl At Keahole 23,294 S - naKTN AK Ketchikan Intl - N - 2 *LAN MI Capital City 17,232 N 49 2LAS NV Mc Carran Intl 268,780 L 1.2 4LAX CA Los Angeles Intl 361,472 L - naLBB TX Lubbock Preston Smith Intl 19,055 S 9.9 4LBF NE North Platte Rgnl Airport Lee Bird Field - N - 2 *LCK OH Rickenbacker Intl - N - 3 *LEX KY Blue Grass 21,878 S 15.8 3LFT LA Lafayette Rgnl 16,191 N - 5 *LGA NY La Guardia 220,887 L 25.8 3LGB CA Long Beach /Daugherty Field/ 20,238 S - naLIH HI Lihue 42,559 S - naLIT AR Adams Field 35,581 S 5.1 4LNK NE Lincoln 11,277 N 26.8 3LRD TX Laredo Intl 8,959 N - naLSE WI La Crosse Muni 5,697 N 42.5 2LUK OH Cincinnati Muni Airport Lunken Field 9,237 - - 3 *LWS ID Lewiston-Nez Perce County 6,127 N 15.8 3MAF TX Midland Intl 13,458 S 4.2 4MBS MI Mbs Intl 10,900 N - 2 *MCI MO Kansas City Intl 93,281 M 19.9 3MCO FL Orlando Intl 176,517 L - naMDT PA Harrisburg Intl 27,731 S 35 2MDW IL Chicago Midway Intl 152,058 L - 2 *MEM TN Memphis Intl 207,735 M 5.1 4MFE TX Mc Allen Miller Intl 5,017 N - naMFR OR Rogue Valley Intl - Medford 12,991 N 7.2 4

TABLE A-1List of Airports Examined in the Analysis
Airport Code State Facility Name
Average Deicing Season Relevant
Operations Hub Size
Average Annual
Snowfall (inches)
Snowfall Group
MGM AL Montgomery Rgnl (Dannelly Field) 7,355 N 0.4 5MGW WV Morgantown Muni-Walter L. Bill Hart Fld 5,089 N - 2 *MHT NH Manchester 41,554 M - 2 *MIA FL Miami Intl 216,937 L 0 naMKC MO Charles B. Wheeler Downtown 11,035 - - 3 *MKE WI General Mitchell Intl 107,433 M 47.2 2MKK HI Molokai 15,206 N - naMLB FL Melbourne Intl 3,462 N - naMLI IL Quad City Intl 15,453 S 30.4 2
MOB AL Mobile Rgnl 9,574 N 0.4 5MOD CA Modesto City-Co-Harry Sham Fld 6,041 N - naMRY CA Monterey Peninsula 12,665 N - naMSN WI Dane County Rgnl-Truax Field 24,728 S 43.9 2MSO MT Missoula Intl 10,985 N 45.5 2MSP MN Minneapolis-St Paul Intl/Wold-Chamberlain 281,693 L 49.5 2MSY LA Louis Armstrong New Orleans Intl 75,409 M 0.2 5MVY MA Marthas Vineyard 7,336 N - 2 *MWH WA Grant Co Intl 8,496 N - 3 *MYR SC Myrtle Beach Intl 14,447 S - 5 *OAK CA Metropolitan Oakland Intl 116,668 M - naOGG HI Kahului 72,885 M - naOKC OK Will Rogers World 34,275 S - 4 *OMA NE Eppley Airfield 48,218 M 29.8 3OME AK Nome - N 58.8 2ONT CA Ontario Intl 69,182 M - naORD IL Chicago O'Hare Intl 541,287 L 38.2 2ORF VA Norfolk Intl 45,145 M 7.4 4OTH OR Southwest Oregon Rgnl - N - 4 *OTZ AK Ralph Wien Memorial - N 47.6 2PBI FL Palm Beach Intl 62,193 M - naPDX OR Portland Intl 128,008 M 6.5 4PFN FL Panama City-Bay Co Intl 9,762 N - naPGA AZ Page Muni - N - naPGV NC Pitt-Greenville - N - 4 *PHF VA Newport News/Williamsburg Intl 13,992 S - 4 *PHL PA Philadelphia Intl 256,841 L 20.8 3PHX AZ Phoenix Sky Harbor Intl 286,001 L - 4 *PIA IL Greater Peoria Rgnl 13,775 N 24.8 3PIE FL St Petersburg-Clearwater Intl 10,587 S - naPIH ID Pocatello Rgnl 7,626 N 42.7 2PIT PA Pittsburgh Intl 177,382 M 43.5 2PNS FL Pensacola Rgnl 19,131 S 0.2 5PPG AS Pago Pago Intl 4,138 N - naPSC WA Tri-Cities 14,712 N - 3 *PSG AK Petersburg James A Johnson - N - 2 *PSP CA Palm Springs Intl 23,493 S - naPTK MI Oakland County Intl 9,486 - - 1 *PVD RI Theodore Francis Green State 47,109 M 35.9 2PWM ME Portland Intl Jetport 24,118 S 70.8 1RAP SD Rapid City Rgnl 8,548 N 39.4 2RDD CA Redding Muni 7,670 N 2.9 4RDM OR Roberts Field 8,330 N - naRDU NC Raleigh-Durham Intl 103,224 M 6.9 4

TABLE A-1List of Airports Examined in the Analysis
Airport Code State Facility Name
Average Deicing Season Relevant
Operations Hub Size
Average Annual
Snowfall (inches)
Snowfall Group
RFD IL Chicago/Rockford Intl 9,083 N 35.9 2RIC VA Richmond Intl 50,634 S 13.7 4RKD ME Knox County Rgnl - N - 1 *RNO NV Reno/Tahoe Intl 46,786 M 24.4 3ROA VA Roanoke Rgnl/Woodrum Field 20,428 N 22.5 3ROC NY Greater Rochester Intl 42,774 S 90.3 1RST MN Rochester Intl 8,493 N 48.6 2RSW FL Southwest Florida Intl 43,988 M 0 naSAN CA San Diego Intl 111,258 L - naSAT TX San Antonio Intl 69,145 M 0.7 5SAV GA Savannah/Hilton Head Intl 22,766 S 0.4 5SAW MI Sawyer Intl 4,961 N 130.6 1SBA CA Santa Barbara Muni 24,010 S 0 naSBN IN South Bend Rgnl 19,150 S 70.9 1SBP CA San Luis County Rgnl 9,000 N - naSDF KY Louisville Intl-Standiford Field 87,582 S 16.1 3SEA WA Seattle-Tacoma Intl 195,663 L 11.3 4SFB FL Orlando Sanford Intl 5,631 S - naSFO CA San Francisco Intl 185,365 L - naSGF MO Springfield-Branson National 18,522 S 17.2 3SGU UT St George Muni - N - 3 *SHV LA Shreveport Rgnl 18,367 N 1.5 4SIT AK Sitka Rocky Gutierrez - N - 2 *SJC CA Norman Y. Mineta San Jose Intl 90,677 M - naSJU PR Luis Munoz Marin Intl 100,253 M - naSLC UT Salt Lake City Intl 191,268 L 57.7 2SMF CA Sacramento Intl 70,355 M - 5 *SMX CA Santa Maria Pub/Capt G Allan Hancock Fld 7,021 N - naSNA CA John Wayne Airport-Orange County 64,494 M - naSOW AZ Show Low Rgnl - N - naSPS TX Sheppard Afb/Wichita Falls Muni - N 5.7 4SRQ FL Sarasota/Bradenton Intl 14,372 S - naSTL MO Lambert-St Louis Intl 182,827 M 19.5 3STT VI Cyril E King 37,091 S - naSTX VI Henry E Rohlsen 20,797 N - naSUN ID Friedman Memorial 7,288 N - 2 *SUS MO Spirit Of St Louis 6,436 - - 3 *SWF NY Stewart Int'L 10,409 N - 3 *SYR NY Syracuse Hancock Intl 38,742 S 114.7 1TEX CO Telluride Rgnl - N - 1 *TLH FL Tallahassee Rgnl 20,071 S - 5 *TNI CQ Tinian Intl - N - naTOL OH Toledo Express 21,801 N 37 2TPA FL Tampa Intl 122,270 L - naTRI TN Tri-Cities Rgnl Tn/Va 13,539 N 15.4 3TUL OK Tulsa Intl 30,081 S 9.4 4TUS AZ Tucson Intl 35,472 M 1.2 4TVC MI Cherry Capital 11,286 N - 1 *TWF ID Joslin Field - Magic Valley Rgnl 7,283 N - 3 *TYR TX Tyler Pounds Rgnl 5,494 N - naTYS TN Mc Ghee Tyson 35,496 S 11.6 4UNV PA University Park - N - 2 *VGT NV North Las Vegas 24,212 N - 4 *

TABLE A-1List of Airports Examined in the Analysis
Airport Code State Facility Name
Average Deicing Season Relevant
Operations Hub Size
Average Annual
Snowfall (inches)
Snowfall Group
VIS CA Visalia Muni - - - naVPS FL Eglin Afb - S - naVQS PR Antonio Rivera Rodriguez - N - naXNA AR Northwest Arkansas Rgnl 19,055 S - 4 *YIP MI Willow Run 13,020 S 41.3 2
na - Not applicable (i.e., below minimum snowfall to be assigned a snow group code)* Extrapolated based on code from nearby locations where snowfall data were available.

Appendix B


T E C H N I C A L M E M O R A N D U M
Deicing Study PREPARED FOR: Dean Mericas
PREPARED BY: Lucille Olszewski
DATE: January 29, 2008
Summary Off-the-shelf climatological products to support geographic categorization of airports for the ACRP 11-02: National Deicer Usage Estimates Project do not exist. Extensive research and personal communication with leading experts in the country was conducted with limited results. A database could be compiled using sounding and surface observation data provided by the National Climatic Data Center’s Solar and Meteorological Surface Observation Network Dataset, however, the substantial work to provide this level of support is beyond the scope of this task. Though there are many drawbacks and caveats, the least costly information that could be used for nationwide station data is that provided in the EPA Study, “ Final loadings in Wastewater Discharges from Aircraft Deicing/Anti-icing Operations” (Eastern Research Group, 2000).
Discussion The task to support the ACRP 11-02: National Deicer Usage Estimates Project consisted of trying to identify off the shelf climatology products that could be used to accurately characterize geographic areas with similar intensities of aircraft and airfield deicing requirements. Such a methodology would represent an improvement over the relatively simplistic previously applied in the EPA Study, “Final loadings in Wastewater Discharges from Aircraft Deicing/Anti-icing Operations” (Eastern Research Group, 2000).
It was determined that a reasonable basis for such as categorization scheme is the likelihood of snow/ice /temperature (and relative humidity) events that would trigger the need for deicing fluid application to aircraft. The ideal product would have been a GIS database of the annual percent of time or frequency of hours that sufficient atmospheric conditions occurred that would trigger aircraft deicing. The task proved to be significantly more difficult than anticipated for the following reasons:
• A simple atlas of icing is not readily available because ice may be defined in different ways. Icing conditions occur in three forms: freezing drizzle, freezing rain, ice pellets (sleet). Further, in order to equate snow fall with icing events the parameter needed is the “snowfall liquid equivalent” (SLE). The SLE is not a parameter that is collected at many observation stations and there seem to be data quality issues with the data that has been collected.
• The Airforce 14th Weather Squadron does have an icing atlas from 1986 and is available in hard copy only. Several contacts with the organization indicated that there might have been an update to this atlas, but it could not be obtained for this project. The
APPENDIX B - INVESTIGATION OF METEOROLOGICAL PROTOCOLS FOR PREDICTING DEICER USAGE (REVISED).DOC 1 COPYRIGHT 2008 BY CH2M HILL, INC. • COMPANY CONFIDENTIAL

DE-ICING STUDY
justifications given were that CH2M HILL is not a government contractor on this particular job, and this request would be given a low priority because the Squadron is busy supporting the war efforts in Iraq and Afghanistan.
• The main focus of the icing observations collected in recent years has been on in-flight icing conditions rather than at ground level. Pilots report the conditions as they fly through various levels in the atmosphere, especially on take-off and landing.
• Researchers working on aircraft icing are focused on the formation of supercooled large droplets. This parameter is not directly measured, but is empirically derived from sounding measurements. There were no easily accessible maps or databases of super cooled large droplets.
There are also many triggers that are not directly or easily correlated with observed weather data. For example:
• Pilots can request to be deiced based on their observations of the atmospheric conditions. “Estimation of Snowfall Rate Using Visibility” Rasmussen, Vivekarnandan, Cole, Meyers and Masters1
• Freezing fog typically occurs in the morning hours before and at sunrise.
• Frost build-up from condensation overnight.
• Some planes have different deicing requirements than others. Ex: MD80’s can still be deiced when surface temperatures are near 50 degrees F.
• Deicing can occur on quick turn-around when the temperatures are above freezing and no precipitation is occurring at the surface. For example: a plane descends through the atmosphere where temperatures can be anywhere between -50 degrees F to – 10 degrees F. The moisture in the lower atmosphere will condense particularly near the surface of the super-cooled fuel tanks. The plane will often be deiced before its next flight.
After much research and personal communication with the top experts on aircraft icing, airline industry experts and icing climatology experts in the U.S., it was determined that the product that was desired was not readily available and that significant effort would be required to get the information to develop such a product. The information would have to be compiled from hourly observation data for over 200 stations from the National Climatic Data Center for a 15 – 20 year time record. The volume of data needed to accomplish this task is beyond the level of effort authorized and included in the scope of work.
The research did lead to some graphically summarized data that offered at least partial information. Below are four graphs compiled by Ben Berstein2 that show the average number of hours that freezing precipitation potentially occurred over the period 1961 – 1990. These graphs were based on sounding data (data collected via weather balloons launched twice daily) and where the event based on surface observations lasted within +/- 3hours of the sounding launch time. The time resolution of this data is not exactly what is needed but over the 30 year period trends can be seen. Graph A represents on an annual basis, a composite of all freezing precipitation types (freezing drizzle – FZDZ, freezing rain
2 APPENDIX B - INVESTIGATION OF METEOROLOGICAL PROTOCOLS FOR PREDICTING DEICER USAGE (REVISED).DOC COPYRIGHT 2008 BY CH2M HILL, INC. • COMPANY CONFIDENTIAL

DEICING STUDY
– FZRA and ice pellets - PL. The grayest shading represents >60 hours of freezing precipitation.
There is a noticeable blank area in Pacific South West. Freezing precipitation is very rare in the region. There is the rare freezing drizzle event, but freezing rain is essentially non-existent. In general, the Southwest is less cloudy and has less precipitation, with the exception of the mountains. There, the precipitation is typically in the form of snow or rain, depending on the elevation. Freezing fog events happen at times, both in the mountains and lower elevations, but its not nearly as common as it is elsewhere in the U.S.
Separately this graph can be broken down into the individual precipitation categories. Figure B represents the percent of time that freezing drizzle may occur. For example: in Figure A, Denver represented approximately 20 total hours of freezing precipitation, greater than 80 percent of those hours were in the form of freezing drizzle – shown in Figure B.
APPENDIX B - INVESTIGATION OF METEOROLOGICAL PROTOCOLS FOR PREDICTING DEICER USAGE (REVISED).DOC 3 COPYRIGHT 2008 BY CH2M HILL, INC. • COMPANY CONFIDENTIAL

DE-ICING STUDY
Figure C represents the percent of time that freezing rain may occur. In the northwest of all freezing precipitation that occurred > 80 percent occurred as freezing rain in Portland and Spokane, WA while greater than 50 percent occurred throughout the southeast. The particular band of freezing rain in the southeast is known to shift westward to include portions of Texas, Oklahoma and Kansas based on observations by T. Riley3
2 APPENDIX B - INVESTIGATION OF METEOROLOGICAL PROTOCOLS FOR PREDICTING DEICER USAGE (REVISED).DOC COPYRIGHT 2008 BY CH2M HILL, INC. • COMPANY CONFIDENTIAL

DEICING STUDY
Figure D represents the percent of time that ice pellets may occur. In the northwest and central east coast – Massachusetts south to North Carolina, of all freezing precipitation that occurred > 70 percent occurred as freezing pellets or sleet.
Although snowfall liquid equivalent is not readily available, the number of mean days with snow falls greater than 1.0 inch as shown below is the best composite that was available from NOAA- OCS. Again, this does not incorporate snow fall intensity or liquid water equivalent, the two important parameters.
APPENDIX B - INVESTIGATION OF METEOROLOGICAL PROTOCOLS FOR PREDICTING DEICER USAGE (REVISED).DOC 5 COPYRIGHT 2008 BY CH2M HILL, INC. • COMPANY CONFIDENTIAL

DE-ICING STUDY
Conclusion There are no off-the-shelf climatology products or readily available databases that contain the information needed for categorizing airports relative to deicing conditions and requirements. Although there are drawbacks and caveats, the least costly information to use for nationwide station data appears to be that provided in the 2000 EPA Study, “Final loadings in Wastewater Discharges from Aircraft Deicing/Anti-icing Operations” prepared by the Eastern Research Group, January 6, 2000, Section 8.0 DCN T11074.
1 Rasmussen, R, M., Vivekarnandan, J., Cole, J, Meyers, B and Masters , C., “Estimation of Snowfall Rate Using Visibility” Journal of Applied Meteorology, Vol. 38, No. 10, 1999, pp 1542 – 1563.
2 Bernstein, B. C. “Regional and Local Influences on Freezing Drizzle, Freezing Rain, and Ice Pellet Events” Weather and Forecasting, Vol. 15, October 2000, pp 485 – 508.
3 Eastern Research Group, 2000. Final loadings in Wastewater Discharges from Aircraft Deicing/Anti-icing Operations. Section 8.0 DCN T11074.
4 Riley, James T. Ph.D. Federal Aviation Administration William J. Hughes Technical Center Atlantic City, NJ 08405, Personal Communication, 12/03/07, 12/28/07.
5 Underwood, Warren. Federal Aviation Administration. Atlanta, GA, Personal Communication, 12/03/07.
2 APPENDIX B - INVESTIGATION OF METEOROLOGICAL PROTOCOLS FOR PREDICTING DEICER USAGE (REVISED).DOC COPYRIGHT 2008 BY CH2M HILL, INC. • COMPANY CONFIDENTIAL

Appendix C


C-1
APPENDIX C
Computational Methods
C.1 Unit Application Factors In order to estimate total average annual glycol use for the airports where data were not available, a modified version of the ‘Fluid Use Factors’ method was employed (ERG 2000). For this analysis, hub type was used to classify the scale of operations, and total annual snowfall was represented by categories similar to those used in the ERG analysis, except it was assumed that deicer usage at any airport with less than 0.1 inches of average annual snowfall would be insignificant for the purposes of this investigation. For clarity, the coefficient describing glycol usage as a function of deicing season operations is called the “Unit Application Factor” (UAF).
A Unit Application Factor (UAF) was first determined for each airport with reported usage data using the following equation:
⎥⎦
⎤⎢⎣
⎡=
i
ix O
GAverageUAF
Where:
UAFx = Unit Application Factor for Airport x
Gi = Glycol usage in season i (gallons)
Oi = Total operations in season i (operations)
The airports were then aggregated into Group Codes representing combinations of hub size and ranges of average annual snowfall amount, as illustrated in the following matrix:
TABLE C-1 Unit Application Factor Group Codes
Hub Type
L M S N
1, >60" L1 M1 S1 N1
2, 30.0 - 59.9" L2 M2 S2 N2
3, 15.0 - 29.9" L3 M3 S3 N3
4, 1.0 - 14.9" L4 M4 S4 N4
Snow
fall
Cod
e an
d R
ange
(inc
hes)
5, 0.1 - 0.9" L5 M5 S5 N5
A UAF was then calculated for each Group Code, as follows:

APPENDIX C—COMPUTATIONAL METHODS
C-2
[ ]nz UAFUAFAverageUAF L1=
Where:
UAFz = UAF for Group Code z
UAFi = UAF for airport i in Group Code z
n = Number of airports in Group Code z
There were two adjustments that were required by lack of data or apparently anomalous results:
• There was no usage data available for some of the hub/snowfall groups, so the factors from adjacent groups were assigned as reasonable estimates.
• A few airports were censured from the analysis because their UAFs were inconsistent with the rest of the airports in their Group. The criterion used for this decision was a UAF that varied from the average for the rest of the group by a factor of two or more.
Table C-2 presents the UAFs developed in the analysis. Numbers of airports that contributed to each UAF value are shown, along with the standard deviation of the data. Boxed groups of cells indicate where UAFs from adjacent Groups were assigned as reasonable estimates. The shaded cells in each cluster have been extrapolated from the unshaded cell. Aircraft usage data for LAS and PHX was received after the unit application factor analysis was complete and thus not included in the calculation.
TABLE C-2 Unit Application Factors
Snowfall Hub Type
Code Range (Inches) Large Medium Small Non
1 > 60 2.37 n = 1
s.d. = n/a
3.00 n = 2
s.d. = 0.439
2.40 n = 3
s.d. = 0.504
2.40a
2 30.0–59.9 2.43 n = 4
s.d. = 1.00
2.83 n = 6
s.d. = 2.83
1.22 n = 4
s.d. = 0.861
1.22a
3 15.0–29.9 1.44 n = 6
s.d. = 0.182
1.41 n = 3
s.d. = 0.307
1.20 n = 3
s.d. = 0.408
0.40 n = 1
s.d. = n/a
4 1.0–14.9 0.16 n = 4
s.d. = 0.048
0.24 n = 5
s.d. = 0.219
0.16a 0.16a
5 0.1–0.9 0.07a 0.07 n = 1
s.d. =n/a
0.07a 0.07a
s.d., standard deviation. a Estimate based on others in snowfall group.

APPENDIX C—COMPUTATIONAL METHODS
C-3
C.2 Estimation of Uncertainty in Aircraft Deicer Usage This subsection describes the method used to estimate the uncertainty in the national average annual glycol usage calculation.
The calculated UAFs are based on a subset of airports in the United States where deicing is conducted. For a variety of reasons, these airports tend to be those with the largest number of operations and greatest snowfall totals, and therefore represent the greatest portion of the total national glycol usage. There is inherent year to year variability in both operations and weather that introduces uncertainty into the calculated average annual glycol usage at each airport where usage data were available. This uncertainty in calculated average glycol usage for each such airport can be described as the standard error:
nSDSE =
Where:
SD = Standard Deviation
n = sample size
After the UAFs were calculated for each airport within a given Group Code (e.g. L1, L2, L3, etc…), an average UAF was determined as the average of the calculated UAFs in each group. The error associated with a Group UAF based on the average of individual airport UAFs, X1, X2, X3,…,Xn, is calculated as:
m
XXXz n
SEn
SEn
SEm
E m
2
2
2
1
2
...1 21 +++=
Where:
Ez = statistical error in UAF for Group Code z
m = number of airports in Group Code z
n = number of airports with usage data in Group Code z
The uncertainty in the estimated average annual glycol usage for each airport where data were not available can then be calculated as:
111*22
_ −⎥⎥
⎦
⎤
⎢⎢
⎣
⎡+⎟
⎟⎠
⎞⎜⎜⎝
⎛
⎥⎥⎦
⎤
⎢⎢⎣
⎡+⎟⎟
⎠
⎞⎜⎜⎝
⎛=
Ops
t
z
zOpszEstimateGlycol t
EUAF
EtUAFE Ops
Where:
tOps = number of deicing season operations
EtOps = Standard deviation of number of deicing season operations

APPENDIX C—COMPUTATIONAL METHODS
C-4
With the uncertainties in the estimated annual average glycol use each airport defined, the error in the nationwide estimate can be calculated as:
222_ ...
21 nAirportAirportAirportEstimateNational EEEE +++=

Appendix D


TABLE D-1 2002 - 2003 Pavement Deicer Usage
ABQ M4 - 700 - - - - -ABR N2 - 4,009 - - - - -AFW N5 - 900 - - - - 600ALB S1 - 15,000 150,000 - - - 1,600,000ANC M1 2,377,200 85,442 - - - - 4,613,280ASE N1 - - 15,000 - - - -ATL L4 - 48,000 - - - - -ATW N2 - 17,500 - - - - 81,000AUS M5 - 7,756 - - - - -AVP N2 - - - - - 10,000 -AZO N1 - - - - - - 100,000BDL M2 50,250 85,500 255,000 - - - 3,860,000BET N2 178,000 - - - - - 30,000BIS N2 - - - - - - 307,340BOI S3 131,888 1,295 - - - - -BOS L2 7,500 - - - 373,185 - 4,664,000BUF M1 - - - - - - 589,200BWI N - 221,299 234,000 360,000 - - 558,000CAK S2 - 5,521 - - - - -CLE M2 - 350,000 - 1,433 - - 1,100CLT L4 60,350 - 10,000 - - - -CMH M3 - 69,980 - 9,620 - - 5,587,160COS S2 - 40,800 - - - - 4,000CRW N2 35,000 - - - - 3,983 -CVG L3 - 561,400 - 4,000 - - 10,396,100CWA N2 115,700 8,903 - - 400 - 962,400DAL M4 - 100 - - - - -DAY S3 - 21,568 - 6,600 - - 2,000,000DCA L3 124,000 57,100 57,000 - - - 298,000DEN L1 - 480,205 - - - - 2,750,000DFW L4 - - - - - - 900,000DSM S2 - 40,000 75,000 - - - -DTW L2 - 368,000 - - - - 50,000EVV N4 - 4,400 - - - - -EWR L3 - 489,500 - - - - 300FAI S1 574,000 40,180 - - - - 4,782,500
FWA N2 373,500 42,870 - - - - 1,346,000GEG S2 296,000 - - - - 110 -GRB S2 56,260 - - - - - 780,000GRR S1 - 11,370 - 13,230 - - -GSO S4 140,000 11,500 - - - - -HTS N2 48,000 - - - - - -HYA N2 - - - - - - 7,000IAD L3 - 558,000 379,020 - - - -ILM N4 - - 4,400 - - - -ILN S3 - 390,528 2,762,000 - - - -IND M3 - 222,733 894,000 - - - -JFK L3 - 39,000 3,252,600 - - 39,000 -JNU S1 452,000 - - - - - -LCK N3 - 18,660 - 24,000 - - -LGA L3 - 175,300 1,602 - - 175,300 4,482,000MCI M3 - 20,000 5,880 - - - 1,122,000
MDW L2 - 190,397 - - - - -MEM M4 - 47,422 29,767 - - - -MHT M2 25,500 45,133 - - - - 1,676,000MKE M2 - 251,000 - - - - -MSP L2 - 83,640 114,000 - - - 16,262,000OKC S4 - 6,500 4,000 - - - -OMA M3 - 20,312 10,000 - - - 102,600OME N2 - 6,000 - - - - 3,000,000ORD L2 - 12,702 - - - 1,103,233 -OTZ N2 10,000 7,500 - - - 1,350,000 -PHL L3 - - - - - 141,000 -PIT M2 - 204,000 40,000 200,000 - - -PVD M2 - 24,000 - - - - 1,462,120RAP N2 - - - - - 1,500 600,000RDM N4 - - - - - - 4,000RDU M4 - 100,000 - - - - 480,000RFD N2 488,000 50,460 - - - - -RIC S4 - 30,203 - - - - 20,000RNO M3 6,000 3,000 - - - - -ROA N3 - 17,935 - - - - -ROC S1 - 45,000 - - - - 40,000SDF S3 - 107,760 18,000 - - - -SLC L2 200,000 1,600 - - - - 278,000STL M3 - 1,100,256 - - - - 454,000SWF N3 120,000 12,000 4,000 - - - 300,000SYR S1 - 1,800 - - - - 1,190,000TOL N2 4,000 30,000 - - - - -XNA S4 36,000 - - 32,000 36,684 - -YIP S2 - - - - - - 500,000
Sand (lbs)Airport Hub/Snowfall Group Code
Urea Usage (lbs)
Potassium Acetate (gal)
Sodium Acetate (lbs)
Sodium Formate (lbs)
Ethylene Glycol Based Fluids (gal)
Propylene Glycol Based Fluids (gal)
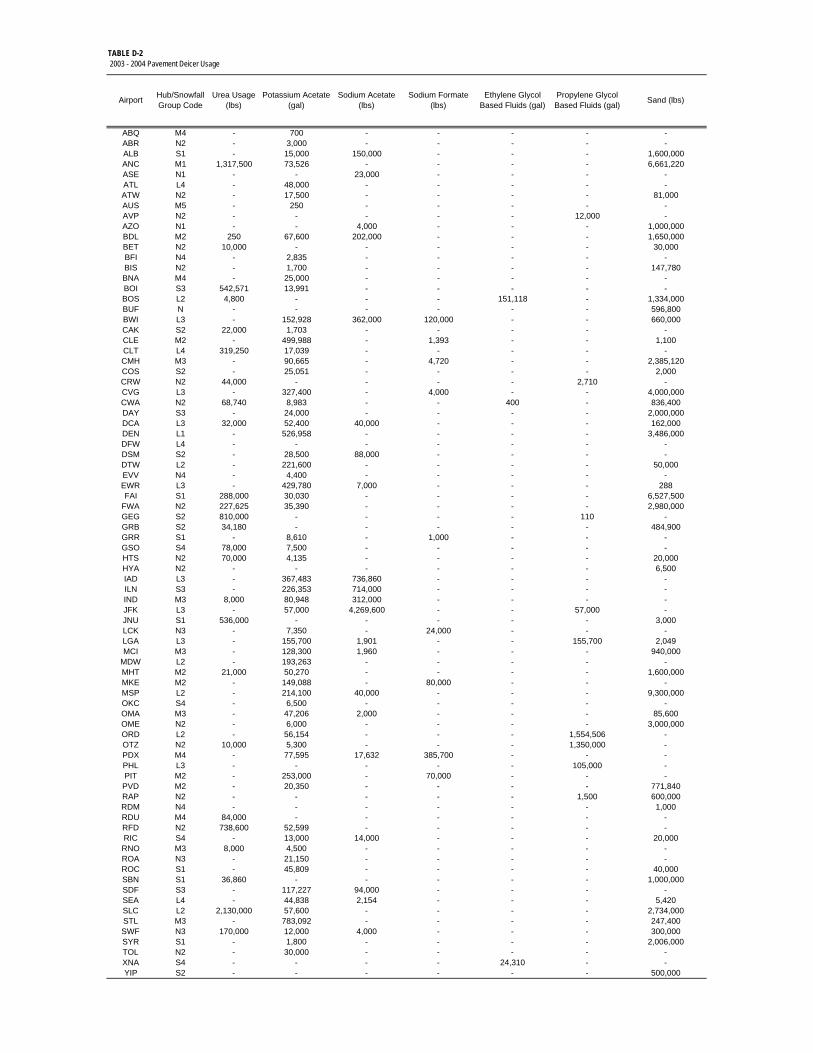
TABLE D-2 2003 - 2004 Pavement Deicer Usage
ABQ M4 - 700 - - - - -ABR N2 - 3,000 - - - - -ALB S1 - 15,000 150,000 - - - 1,600,000ANC M1 1,317,500 73,526 - - - - 6,661,220ASE N1 - - 23,000 - - - -ATL L4 - 48,000 - - - - -ATW N2 - 17,500 - - - - 81,000AUS M5 - 250 - - - - -AVP N2 - - - - - 12,000 -AZO N1 - - 4,000 - - - 1,000,000BDL M2 250 67,600 202,000 - - - 1,650,000BET N2 10,000 - - - - - 30,000BFI N4 - 2,835 - - - - -BIS N2 - 1,700 - - - - 147,780BNA M4 - 25,000 - - - - -BOI S3 542,571 13,991 - - - - -BOS L2 4,800 - - - 151,118 - 1,334,000BUF N - - - - - - 596,800BWI L3 - 152,928 362,000 120,000 - - 660,000CAK S2 22,000 1,703 - - - - -CLE M2 - 499,988 - 1,393 - - 1,100CLT L4 319,250 17,039 - - - - -CMH M3 - 90,665 - 4,720 - - 2,385,120COS S2 - 25,051 - - - - 2,000CRW N2 44,000 - - - - 2,710 -CVG L3 - 327,400 - 4,000 - - 4,000,000CWA N2 68,740 8,983 - - 400 - 836,400DAY S3 - 24,000 - - - - 2,000,000DCA L3 32,000 52,400 40,000 - - - 162,000DEN L1 - 526,958 - - - - 3,486,000DFW L4 - - - - - - -DSM S2 - 28,500 88,000 - - - -DTW L2 - 221,600 - - - - 50,000EVV N4 - 4,400 - - - - -EWR L3 - 429,780 7,000 - - - 288FAI S1 288,000 30,030 - - - - 6,527,500
FWA N2 227,625 35,390 - - - - 2,980,000GEG S2 810,000 - - - - 110 -GRB S2 34,180 - - - - - 484,900GRR S1 - 8,610 - 1,000 - - -GSO S4 78,000 7,500 - - - - -HTS N2 70,000 4,135 - - - - 20,000HYA N2 - - - - - - 6,500IAD L3 - 367,483 736,860 - - - -ILN S3 - 226,353 714,000 - - - -IND M3 8,000 80,948 312,000 - - - -JFK L3 - 57,000 4,269,600 - - 57,000 -JNU S1 536,000 - - - - - 3,000LCK N3 - 7,350 - 24,000 - - -LGA L3 - 155,700 1,901 - - 155,700 2,049MCI M3 - 128,300 1,960 - - - 940,000
MDW L2 - 193,263 - - - - -MHT M2 21,000 50,270 - - - - 1,600,000MKE M2 - 149,088 - 80,000 - - -MSP L2 - 214,100 40,000 - - - 9,300,000OKC S4 - 6,500 - - - - -OMA M3 - 47,206 2,000 - - - 85,600OME N2 - 6,000 - - - - 3,000,000ORD L2 - 56,154 - - - 1,554,506 -OTZ N2 10,000 5,300 - - - 1,350,000 -PDX M4 - 77,595 17,632 385,700 - - -PHL L3 - - - - - 105,000 -PIT M2 - 253,000 - 70,000 - - -PVD M2 - 20,350 - - - - 771,840RAP N2 - - - - - 1,500 600,000RDM N4 - - - - - - 1,000RDU M4 84,000 - - - - - -RFD N2 738,600 52,599 - - - - -RIC S4 - 13,000 14,000 - - - 20,000RNO M3 8,000 4,500 - - - - -ROA N3 - 21,150 - - - - -ROC S1 - 45,809 - - - - 40,000SBN S1 36,860 - - - - - 1,000,000SDF S3 - 117,227 94,000 - - - -SEA L4 - 44,838 2,154 - - - 5,420SLC L2 2,130,000 57,600 - - - - 2,734,000STL M3 - 783,092 - - - - 247,400SWF N3 170,000 12,000 4,000 - - - 300,000SYR S1 - 1,800 - - - - 2,006,000TOL N2 - 30,000 - - - - -XNA S4 - - - - 24,310 - -YIP S2 - - - - - - 500,000
Sand (lbs)Airport Hub/Snowfall Group Code
Urea Usage (lbs)
Potassium Acetate (gal)
Sodium Acetate (lbs)
Sodium Formate (lbs)
Ethylene Glycol Based Fluids (gal)
Propylene Glycol Based Fluids (gal)

TABLE D-32004 - 2005 Pavement Deicer Usage
ABQ M4 - 700 - - - - -ABR N2 - 1,000 - - - - -AFW N5 - 300 - - - - 200ALB S1 - 15,000 150,000 - - - 1,600,000ANC M1 3,850,000 131,000 - - - 7,400,000 -ASE N1 - 10,700 13,000 - - - -ATL L4 - 48,000 - - - - -ATW N2 - 17,500 - - - - 81,000AVP N2 - - - - - 14,000 -AZO N1 - - 8,000 - - - 200,000BDL M2 250 49,899 215,000 - - - 2,600,000BET N2 14,000 - - - - - 30,000BFI N4 - 1,861 - - - - -BIS N2 - 5,679 - - - - 282,180BOI S3 135,244 7,286 - - - - -BOS L2 18,350 - - - 261,887 - 5,062,000BUF M1 - - - 24,000 - - 276,000BWI N - 165,614 208,000 - - - 898,000CAK S2 42,000 1,968 500 - - - -CLE M2 - 275,000 - 1,985 - - 1,100CLT L4 70,050 8,000 - - - - -CMH M3 - 125,002 - 7,580 - - 4,011,780COS S2 - 37,000 - - - - 4,000CRW N2 48,000 - 8,000 - - 3,844 -CVG L3 - 508,000 - 4,000 - - 5,000,000CWA N2 185,880 9,324 - - 400 - 1,292,400DAY S3 - 34,530 - - - - 2,000,000DCA L3 78,000 36,740 5,000 - - - 211,000DEN L1 - 607,836 - - - - 3,970,000DFW L4 - 2,775 - - - - 40,000DSM S2 - 87,500 267,000 - - - -DTW L2 - 258,100 - - - - 50,000EVV N4 - 4,510 - - - - -EWR L3 - 297,470 2,000 - - - 282FAI S1 134,000 20,014 - - - - 7,770,000
FWA N2 282,000 44,820 - - - - 2,144,000GEG S2 388,000 110 - - - 110 -GRB S2 44,140 - 17,457 - - - 1,242,000GRR S1 - 10,400 - 12,000 - - -GSO S4 60,000 5,700 - - - - -HTS N2 50,000 - - - - - -HYA N2 - - - - - - 8,000IAD L3 - 187,546 743,725 - - - -ILN S3 - 260,923 2,120,000 - - - -IND M3 - 54,899 20,600 - - - -JFK L3 - 60,000 3,181,400 - - 60,000 -JNU S1 446,000 - - - - - 1,500LCK N3 - 6,924 - 67,660 - - 274,240LGA L3 - 181,037 1,680 - - 181,037 1,841MCI M3 - 125,300 5,880 - - - 1,952,000
MDW L2 - 256,200 - - - - -MEM M4 - 104,215 123,480 - - - -MHT M2 64,000 87,212 - - - - 2,000,000MKE M2 - 183,796 - 180,000 - - -MSP L2 - 285,219 94,000 - - - 5,700,000OKC S4 - 9,715 2,000 - - - -OMA M3 - 64,957 17,300 - - - 134,664OME N2 - 6,000 - - - - 3,000,000ORD L2 - 231,221 - - - 591,074 -OTZ N2 10,000 5,000 - - - 1,350,000 -PDX M4 - 39,855 13,244 247,848 - - -PHL L3 - - - - - 35,000 270,000PIT M2 - 91,800 - 4,000 - - -PVD M2 - 29,163 - - - - 823,440RAP N2 - - - - - 1,500 600,000RDM N4 - - - - - - 1,000RDU M4 6,000 - - - - - 600,000RFD N2 814,200 39,777 - - - - -RIC S4 - 22,000 20,000 - - - 20,000RNO M3 20,000 12,000 - - - - -ROA N3 - 10,850 - - - - -ROC S1 - 44,114 - - - - 40,000SBN S1 28,020 - - - - - 1,000,000SDF S3 - 123,968 112,000 - - - -SLC L2 1,078,000 20,100 - - - - 960,000STL M3 - 461,048 - - - - 35,400SWF N3 170,000 12,000 4,000 - - - 360,000SYR S1 - 1,800 - - - - 1,842,000TOL N2 - 50,000 - - - - -XNA S4 18,000 - - - 17,710 - -YIP S2 - - - - - - 500,000
Sand (lbs)Airport Hub/Snowfall Group Code
Urea Usage (lbs)
Potassium Acetate (gal)
Sodium Acetate (lbs)
Sodium Formate (lbs)
Ethylene Glycol Based Fluids (gal)
Propylene Glycol Based Fluids (gal)


Appendix E


TABLE E-1 Estimated Average Annual Aircraft Deicer Usage
Permit TypeG = GeneralI = Individial
R = General Stormwater
N = No Direct Discharge
U = Unknown1 DTW L 284,204 1,575,769 10.4% 10.4% I DO, BOD, ammonia, CBOD2 ORD L 541,287 1,270,083 8.4% 18.8% I BOD, ammonia3 MSP L 281,693 1,085,858 7.2% 26.0% I4 DEN L 301,738 713,773 4.7% 30.8% I5 EWR L 236,820 656,038 4.3% 35.1% I COD6 PIT M 177,383 593,629 3.9% 39.0% I7 CLE M 138,244 414,248 2.7% 41.8% I DO, ammonia, ethylene glycol8 CVG L 287,190 391,252 2.6% 44.4% I DO, BOD, ammonia9 LGA L 220,887 379,441 2.5% 46.9% I BOD
10 MDW L 152,058 369,075 * 2.4% 49.3% N11 SLC L 191,268 360,645 2.4% 51.7% I BOD, ethylene glycol, CBOD12 ANC M 104,312 345,166 2.3% 54.0% G13 IND M 103,350 342,170 2.3% 56.3% I ammonia, COD, propylene glycol monobuty ether14 BOS L 209,302 339,507 2.3% 58.5% I No parameters of interest15 PHL L 256,841 337,675 2.2% 60.7% I16 ILN S N/D 333,713 2.2% 63.0% I17 BDL M 63,673 279,280 1.9% 64.8% I COD18 IAD N 217,263 276,653 1.8% 66.6% I19 STL M 182,827 258,257 * 1.7% 68.4% U BOD, COD, ammonia20 JFK L 178,959 257,009 * 1.7% 70.1% I BOD, BOD % removal21 BWI L 152,407 230,508 1.5% 71.6% I22 DAY S 49,676 160,352 1.1% 72.6% I23 MCI M 93,282 158,863 1.1% 73.7% I BOD and COD24 ALB S 52,557 156,515 1.0% 74.7% I BOD, ammonia, UOD25 MKE M 107,433 150,086 1.0% 75.7% I26 BUF M 54,861 147,505 1.0% 76.7% I BOD, ammonia, ethylene glycol27 CLT L 245,352 129,616 0.9% 77.6% I28 MEM M 207,736 113,172 0.8% 78.3% I29 PVD M 47,109 111,731 0.7% 79.0% I No parameters of interest30 CMH M 98,620 107,607 0.7% 79.8% I DO, ammonia, ethylene glycol, CBOD31 SDF S 87,582 105,247 * 0.7% 80.5% I DO, BOD, ammonia, ethylene glycol32 MHT M 41,555 103,961 0.7% 81.1% G33 ROC S 42,775 102,501 * 0.7% 81.8% G34 GCN S 42,686 102,288 * 0.7% 82.5% G35 SYR S 38,743 92,839 * 0.6% 83.1% I BOD. ammonia36 DFW L 438,596 91,631 0.6% 83.7% I37 DCA L 150,793 72,732 0.5% 84.2% G38 GRR S 33,657 70,114 0.5% 84.7% I39 OMA M 48,219 68,113 * 0.5% 85.1% I BOD40 RNO M 46,786 67,538 0.5% 85.6% G41 BET N 54,970 66,980 * 0.4% 86.0% U42 ATL L 536,870 61,433 0.4% 86.4% G43 JNU S 24,555 58,841 * 0.4% 86.8% U44 ACK N 47,608 58,010 * 0.4% 87.2% U45 PWM S 24,118 57,795 * 0.4% 87.6% U46 HPN S 40,939 55,099 0.4% 87.9% I BOD, ethylene glycol, CBOD47 BTV S 22,905 54,887 * 0.4% 88.3% U48 HYA N 43,080 52,493 * 0.4% 88.6% U49 CAK S 20,027 48,834 0.3% 89.0% I DO, ammonia, ethylene glycol50 BOI S 39,943 47,999 * 0.3% 89.3% G51 SBN S 19,150 45,890 * 0.3% 89.6% G52 DSM S 37,552 45,324 0.3% 89.9% I Ethylene Glycol53 GEG S 36,709 44,730 * 0.3% 90.2% U54 ICT S 34,286 41,201 * 0.3% 90.5% U55 PDX M 128,009 38,208 0.3% 90.7% I56 BIL S 28,643 34,902 * 0.2% 90.9% G57 COS S 28,043 34,171 * 0.2% 91.2% G BOD58 MDT S 27,732 33,791 * 0.2% 91.4% U59 SEA L 195,664 33,453 0.2% 91.6% I
*Glycol usage estimated using EPA method outlined in Preliminary Data Summary Airport Deicing Operations (Revised) EPA-821-R-00-016** EstimatedN/D No Data
Percent of All Glycol Usage Nationwide
Cummulative Percent of All Glycol Usage Nationwide
Permit Parameters of Interest
Estimated Average Annual
Glycol Usage (Gals)
Ranking Airport Hub TypeAverage Annual Deicing Season
Operations


TABLE E-1 Estimated Average Annual Aircraft Deicer Usage
Permit TypeG = GeneralI = Individial
R = General Stormwater
N = No Direct Discharge
U = Unknown
Percent of All Glycol Usage Nationwide
Cummulative Percent of All Glycol Usage Nationwide
Permit Parameters of Interest
Estimated Average Annual
Glycol Usage (Gals)
Ranking Airport Hub TypeAverage Annual Deicing Season
Operations
60 BGR S 13,894 29,562 0.2% 91.8% U61 BNA M 99,790 28,628 0.2% 92.0% I DO, BOD, COD, ammonia, CBOD62 CRW N 23,274 28,359 * 0.2% 92.2% U63 GFK N 23,227 28,302 * 0.2% 92.4% U64 FWA N 22,833 27,822 * 0.2% 92.6% U65 ABE S 22,462 27,370 * 0.2% 92.7% G66 TVC N 11,286 27,045 * 0.2% 92.9% U67 AZO N 11,112 26,628 * 0.2% 93.1% G68 TOL N 21,802 26,565 * 0.2% 93.3% I69 FSD N 21,249 25,892 * 0.2% 93.4% U70 CID S 20,301 24,737 * 0.2% 93.6% U71 ISP S 20,269 24,357 * 0.2% 93.8% U72 RDU M 103,225 24,317 * 0.2% 93.9% U73 ASE N 9,831 23,557 * 0.2% 94.1% U74 CPR N 9,766 23,403 * 0.2% 94.2% G75 LEX S 21,879 23,137 0.2% 94.4% I DO, ammonia76 SGF S 18,522 22,258 * 0.2% 94.5% G BOD77 ERI N 9,245 22,154 * 0.2% 94.7% G78 BGM N 9,206 22,059 * 0.2% 94.8% U79 FAI S 30,997 21,492 0.1% 95.0% U80 LAN N 17,233 20,998 * 0.1% 95.1% G81 IAH L 279,238 19,797 * 0.1% 95.2% G82 FNT S 15,978 19,469 * 0.1% 95.4% G83 MLI S 15,454 18,830 * 0.1% 95.5% G84 EGE N 7,801 18,694 * 0.1% 95.6% U85 GRB S 14,755 17,979 * 0.1% 95.7% U86 JAC N 7,409 17,755 * 0.1% 95.9% I87 ELM N 7,406 17,748 * 0.1% 96.0% U88 ABQ M 71,396 16,819 * 0.1% 96.1% G89 MSN S 24,728 16,455 0.1% 96.2% I90 AVP N 13,199 16,083 * 0.1% 96.3% G91 ACY S 13,349 16,042 * 0.1% 96.4% I92 GTF N 13,105 15,969 * 0.1% 96.5% G93 BED N 13,060 15,914 * 0.1% 96.6% I94 AMA S 13,233 15,902 * 0.1% 96.7% U95 ATW N 12,699 15,473 * 0.1% 96.8% U96 FAR N 11,789 14,365 * 0.1% 96.9% U97 MSO N 10,985 13,385 * 0.1% 97.0% G98 ITH N 5,548 13,294 * 0.1% 97.1% I BOD and ethylene glycol99 MBS N 10,900 13,282 * 0.1% 97.2% G100 CWA N 10,290 12,538 * 0.1% 97.3% U101 SAW N 4,961 11,889 * 0.1% 97.4% G102 BZN N 9,396 11,449 * 0.1% 97.4% U103 RIC S 50,635 11,405 0.1% 97.5% I104 HLN N 9,151 11,151 * 0.1% 97.6% G105 RFD N 9,084 11,068 * 0.1% 97.7% U106 AKN N 8,783 10,702 * 0.1% 97.7% U107 ORF M 45,145 10,635 * 0.1% 97.8% I108 ENA N 8,608 10,488 * 0.1% 97.9% U109 RAP N 8,548 10,416 * 0.1% 97.9% U110 RST N 8,493 10,349 * 0.1% 98.0% U111 LCK N N/D 10,056 0.1% 98.1% U112 BHM S 43,808 9,868 * 0.1% 98.1% G No parameters of interest113 GSO S 42,943 9,673 * 0.1% 98.2% U114 BMI N 7,845 9,559 * 0.1% 98.3% U115 BIS N 7,648 9,320 * 0.1% 98.3% U116 PIH N 7,626 9,292 * 0.1% 98.4% U117 MVY N 7,336 8,939 * 0.1% 98.4% U118 SUN N 7,289 8,881 * 0.1% 98.5% U
*Glycol usage estimated using EPA method outlined in Preliminary Data Summary Airport Deicing Operations (Revised) EPA-821-R-00-016** EstimatedN/D No Data


TABLE E-1 Estimated Average Annual Aircraft Deicer Usage
Permit TypeG = GeneralI = Individial
R = General Stormwater
N = No Direct Discharge
U = Unknown
Percent of All Glycol Usage Nationwide
Cummulative Percent of All Glycol Usage Nationwide
Permit Parameters of Interest
Estimated Average Annual
Glycol Usage (Gals)
Ranking Airport Hub TypeAverage Annual Deicing Season
Operations
119 CMI N 7,176 8,744 * 0.1% 98.6% U120 ELP S 37,604 8,470 * 0.1% 98.6% U121 CAE S 36,097 8,131 * 0.1% 98.7% U122 ROA N 20,428 8,079 0.1% 98.7% U123 LIT S 35,582 8,015 * 0.1% 98.8% U124 TYS S 35,496 7,996 * 0.1% 98.8% U125 OKC S 34,275 7,721 * 0.1% 98.9% U126 YIP S 13,020 7,333 0.1% 98.9% G127 LSE N 5,697 6,942 * 0.1% 99.0% U128 TUL S 30,081 6,776 * 0.0% 99.0% I129 GSP S 30,024 6,763 * 0.0% 99.1% G130 HOU M 90,235 6,398 * 0.0% 99.1% G131 MGW N 5,089 6,201 * 0.0% 99.1% G132 BFI N 36,955 5,920 * 0.0% 99.2% G133 PSC N 14,712 5,818 * 0.0% 99.2% U134 PIA N 13,776 5,448 * 0.0% 99.3% G135 TRI N 13,540 5,355 * 0.0% 99.3% U136 MSY M 75,409 5,347 * 0.0% 99.3% U137 SMF M 70,356 4,988 * 0.0% 99.4% G138 SAT M 69,145 4,903 * 0.0% 99.4% G139 AUS M 68,453 4,853 0.0% 99.4% G140 HSV S 21,277 4,793 * 0.0% 99.5% G No parameters of interest141 GJT N 11,915 4,712 * 0.0% 99.5% U142 LNK N 11,277 4,460 * 0.0% 99.5% U143 XNA S 19,055 4,292 * 0.0% 99.5% U144 LBB S 19,055 4,292 * 0.0% 99.6% U145 SWF N 10,409 4,117 * 0.0% 99.6% I Ethylene Glycol146 VGT N 24,212 3,879 * 0.0% 99.6% U147 GRI N 3,105 3,784 * 0.0% 99.7% U148 JAX M 50,103 3,553 * 0.0% 99.7% G149 MWH N 8,496 3,360 * 0.0% 99.7% U150 IDA N 8,077 3,195 * 0.0% 99.7% U151 PHF S 13,993 3,152 * 0.0% 99.7% U152 MAF S 13,458 3,032 * 0.0% 99.8% U153 SHV N 18,367 2,943 * 0.0% 99.8% G154 TWF N 7,283 2,881 * 0.0% 99.8% U155 LAS L 268,780 2,860 0.0% 99.8% G156 EUG N 15,607 2,500 0.0% 99.8% G157 LWS N 6,127 2,423 * 0.0% 99.9% U158 EVV N 14,070 2,254 * 0.0% 99.9% U159 DAL M 74,821 2,219 0.0% 99.9% G160 CHA N 13,512 2,165 * 0.0% 99.9% U161 MFR N 12,991 2,082 * 0.0% 99.9% G162 CHO N 12,619 2,022 * 0.0% 99.9% U163 ILM N 11,905 1,908 * 0.0% 99.9% U164 AVL N 11,898 1,906 * 0.0% 99.9% U165 AGS N 8,290 1,328 * 0.0% 100.0% U166 BLI N 8,082 1,295 * 0.0% 100.0% G167 RDD N 7,670 1,229 * 0.0% 100.0% U168 ABI N 6,923 1,109 * 0.0% 100.0% U169 FAY N 5,519 885 * 0.0% 100.0% U170 TUS M 35,473 642 0.0% 100.0% U171 PHX L 286,002 440 0.0% 100.0% G172 CHS S 29,530 195 * 0.0% 100.0% U173 FAT S 28,358 187 * 0.0% 100.0% U174 SAV S 22,767 150 * 0.0% 100.0% U175 TLH S 20,072 132 0.0% 100.0% G176 PNS S 19,131 126 * 0.0% 100.0% G177 JAN S 18,190 120 * 0.0% 100.0% U
*Glycol usage estimated using EPA method outlined in Preliminary Data Summary Airport Deicing Operations (Revised) EPA-821-R-00-016** EstimatedN/D No Data


TABLE E-1 Estimated Average Annual Aircraft Deicer Usage
Permit TypeG = GeneralI = Individial
R = General Stormwater
N = No Direct Discharge
U = Unknown
Percent of All Glycol Usage Nationwide
Cummulative Percent of All Glycol Usage Nationwide
Permit Parameters of Interest
Estimated Average Annual
Glycol Usage (Gals)
Ranking Airport Hub TypeAverage Annual Deicing Season
Operations
178 LFT N 16,191 107 * 0.0% 100.0% U179 MYR S 14,448 96 * 0.0% 100.0% G180 BTR S 13,870 92 * 0.0% 100.0% U181 OTH N N/D 80 0.0% 100.0% U182 MOB N 9,574 63 * 0.0% 100.0% G No parameters of interest183 MGM N 7,355 48 * 0.0% 100.0% G No parameters of interest184 AEX N 6,199 41 * 0.0% 100.0% U
*Glycol usage estimated using EPA method outlined in Preliminary Data Summary Airport Deicing Operations (Revised) EPA-821-R-00-016** EstimatedN/D No Data


Appendix F


APPENDIX F Deicing Airports Subject to TMDL Regulations (on 303(d) Listed Water or Water Body with Issued TMDL)
Airport
Estimated Average Annual Glycol
Use (gallons) Nature of Receiving Water Impairment
Potential Sources Related to Impairment? 303(d) Listed or Issued TMDL
ORD 1,270,082 Ammonia-Nitrogen, BOD (TMDL) Dissolved Oxygen (303(d) Listed)
Issued TMDL and 303(d) Listed
PIT 593,629 Nonpriority Organics, Unionized Ammonia, Organic Enrichment/Low Do
303(d) Listed
CLE 414,247 Unknown Toxicity, Organic Enrichment/Low Do, Unionized Ammonia
303(d) Listed
CVG 391,251 CBOD, NH3-N (TMDL) Organic Enrichment/Low DO (303(d) Listed)
Deicing fluid contamination Issued TMDL and 303(d) Listed
LGA 379,440 Oxygen Demand 303(d) Listed
SLC 360,644 Dissolved Oxygen 303(d) Listed
ANC 345,166 Dissolved Oxygen Deicing runoff Issued TMDL
BOS 339,506 Priority Organics 303(d) Listed
ILN 333,712 Unknown Toxicity, Organic Enrichment/Low Do, Unionized Ammonia
303(d) Listed
BDL 279,279 Ethylene Glycol Deicing agents Issued TMDL
JFK 257,009 Oxygen Demand 303(d) Listed
BWI 230,508 Biological 303(d) Listed
DAY 160,352 Priority Organics, Organic Enrichment/Low Do 303(d) Listed
MKE 150,085 Aquatic Toxicity 303(d) Listed
MEM 113,172 Dissolved Oxygen 303(d) Listed
PVD 111,731 Low Dissolved Oxygen 303(d) Listed
F-1


APPENDIX F Deicing Airports Subject to TMDL Regulations (on 303(d) Listed Water or Water Body with Issued TMDL)
Airport
Estimated Average Annual Glycol
Use (gallons) Nature of Receiving Water Impairment
Potential Sources Related to Impairment? 303(d) Listed or Issued TMDL
SDF 105,247 Organic Enrichment/Low Do 303(d) Listed
MHT 103,961 Dissolved Oxygen, Dissolved Oxygen Saturation 303(d) Listed
DCA 72,732 BOD (TMDL) Organics (303(d) Listed)
Issued TMDL and 303(d) Listed
BTV 54,887 Toxics 303(d) Listed
CAK 48,834 Organic Enrichment/Low Do 303(d) Listed
BOI 47,998 Dissolved Oxygen 303(d) Listed
DSM 45,324 Priority Organics (TMDL) Deicing Agents, Priority Organics (303(d) Listed)
"Airport" Issued TMDL and 303(d) Listed
PDX 38,208 Dissolved Oxygen, Biological Oxygen Demand "…diurnal swings in dissolved oxygen during the summer months
are most likely the result of algal growth, while winter violations are likely due to storm water runoff,
including de-icing fluid."
Issued TMDL
SEA 33,453 Dissolved Oxygen 303(d) Listed
BGR 29,561 Propylene and ethylene glycols "Deicing Agents" Issued TMDL
BNA 28,627 Organic Enrichment/Low DO (TMDL) Dissolved Oxygen (303(d) Listed)
"Ethylene glycol (de-icer) runoff from Nashville airport impacts
Sims Branch."
Issued TMDL and 303(d) Listed
CRW 28,359 Biological 303(d) Listed
TOL 26,565 Total Toxics 303(d) Listed
FSD 25,891 Ammonia, BOD Issued TMDL
F-2


APPENDIX F Deicing Airports Subject to TMDL Regulations (on 303(d) Listed Water or Water Body with Issued TMDL)
Airport
Estimated Average Annual Glycol
Use (gallons) Nature of Receiving Water Impairment
Potential Sources Related to Impairment? 303(d) Listed or Issued TMDL
LAN 20,998 Dissolved Oxygen 303(d) Listed
EGE 18,694 Unionized Ammonia Issued TMDL
MSN 16,455 Aquatic Toxicity, BOD, Dissolved Oxygen 303(d) Listed
BED 15,914 Organic Enrichment/Low Do 303(d) Listed
FAR 14,365 Ammonia 303(d) Listed
MSO 13,385 Organic Enrichment/Low Dissolved Oxygen 303(d) Listed
HLN 11,150 Unionized Ammonia 303(d) Listed
RFD 11,068 Dissolved Oxygen 303(d) Listed
ORF 10,635 Dissolved Oxygen 303(d) Listed
RAP 10,416 Ammonia, CBOD, Dissolved Oxygen Issued TMDL
LCK 10,055 Unknown Toxicity 303(d) Listed
CMI 8,744 Dissolved Oxygen 303(d) Listed
ROA 8,078 Biochemical Oxygen Demand 303(d) Listed
MGW 6,201 Biological 303(d) Listed
MSY 5,346 Organic Enrichment/Low DO (TMDL) Dissolved Oxygen (303(d) Listed)
Issued TMDL and 303(d) Listed
SMF 4,988 Unknown Toxicity 303(d) Listed
SAT 4,902 Dissolved Oxygen Issued TMDL
AUS 4,853 Low Dissolved Oxygen 303(d) Listed
SWF 4,116 Unknown Toxicity 303(d) Listed
F-3


APPENDIX F Deicing Airports Subject to TMDL Regulations (on 303(d) Listed Water or Water Body with Issued TMDL)
Airport
Estimated Average Annual Glycol
Use (gallons) Nature of Receiving Water Impairment
Potential Sources Related to Impairment? 303(d) Listed or Issued TMDL
EUG 2,500 Biological Oxygen Demand Issued TMDL
LWS 2,423 Dissolved Oxygen 303(d) Listed
EVV 2,254 Dissolved Oxygen 303(d) Listed
MFR 2,081 Ammonia-Nitrogen, BOD5 Issued TMDL
BLI 1,295 Dissolved Oxygen 303(d) Listed
RDD 1,229 Unknown Toxicity 303(d) Listed
TLH 132 Dissolved Oxygen 303(d) Listed
LFT 106 Oxygen Demand Issued TMDL
MOB 63 CBOD (TMDL) Organic Enrichment/Low DO (303(d) Listed)
Issued TMDL and 303(d) Listed
MGM 48 CBOD (TMDL) Organic Enrichment/Low DO (303(d) Listed)
Issued TMDL and 303(d) Listed
AEX 41 Oxygen Demand Issued TMDL
F-4