esterda oda omorro - gfoa.netgfoa.net/cafr/COA2012/MissouriStateEmployeesRetirementSystemSC.pdfMSEP*...
167
Missouri State Employees’ Retirement System A Component Unit of the State of Missouri Comprehensive Annual Financial Report Fiscal Year Ended June 30, 2012 Gary Findlay Executive Director Gary Irwin Chief Finance Officer �esterda� • �oda� • �omorro�
Transcript of esterda oda omorro - gfoa.netgfoa.net/cafr/COA2012/MissouriStateEmployeesRetirementSystemSC.pdfMSEP*...

Missouri State Employees’ Retirement SystemA Component Unit of the State of Missouri
Comprehensive Annual Financial Report Fiscal Year Ended June 30, 2012
Gary FindlayExecutive Director
Gary IrwinChief Finance Officer
�esterda� • �oda� • �omorro�

INTRODUCTORY SECTIONProfessional Awards ............................................................................................................................. 5Letter of Transmittal ............................................................................................................................ 6Letter from the Board Chair .............................................................................................................. 13Board of Trustees ............................................................................................................................... 15Administrative Organization ............................................................................................................. 16About MOSERS ............................................................................................................................... 17Outside Professional Services ............................................................................................................. 19
FINANCIAL SECTIONIndependent Auditor’s Report ........................................................................................................... 21Management Discussion and Analysis ............................................................................................... 22
Basic Financial StatementsStatements of Plan Net Assets - Pension Trust Funds ......................................................................... 27Statements of Changes in Plan Net Assets - Pension Trust Funds ....................................................... 28Balance Sheets - Internal Service Funds ............................................................................................. 29Statements of Revenues, Expenses, and Changes in Plan Net Assets - Internal Service Funds ............ 29Statements of Cash Flows - Internal Service Funds ............................................................................ 30Notes to the Financial Statements ..................................................................................................... 31
Required Supplementary InformationSchedules of Funding Progress - Pension Trust Funds ........................................................................ 49Schedules of Employer Contributions - Pension Trust Funds............................................................. 50Notes to the Schedules of Required Supplementary Information - Pension Trust Funds .................... 51
Additional Financial InformationActuarial Asset Value Smoothing ....................................................................................................... 53Schedules of Investment Expenses - Pension Trust Funds .................................................................. 54Schedules of Internal Investment Activity Expenses - Pension Trust Funds ........................................ 56Schedules of Administrative Expenses - Pension Trust Funds ............................................................. 57Schedules of Administrative Expenses - Internal Service Funds .......................................................... 58Schedules of Professional/Consultant Fees ........................................................................................ 59Investment Summary - Pension Trust Funds ...................................................................................... 60Investment Summary - Internal Service Funds .................................................................................. 60
INVESTMENT SECTIONChief Investment Officer’s Report ..................................................................................................... 61Investment Consultant’s Report ........................................................................................................ 65Investment Policy Summary .............................................................................................................. 67Total Fund Review ............................................................................................................................ 73Investment Manager Fees .................................................................................................................. 77Schedule of Investment Portfolios by Asset Class ............................................................................... 79Schedule of Investment Results ......................................................................................................... 80 Public Equity Asset Class Summary ................................................................................................... 81Public Debt Asset Class Summary ..................................................................................................... 87Alternative Investments Asset Class Summary ................................................................................... 94Beta/Alpha Program ........................................................................................................................ 102Securities Lending Program ............................................................................................................. 104
�able o� �ontents

* Missouri State Employees’ Plan
ACTUARIAL SECTIONActuary’s Certification Letter ........................................................................................................... 105Summary of Actuarial Assumptions ................................................................................................. 107 Summary of Member Data Included in Valuations .......................................................................... 113Active Members by Attained Age and Years of Service ..................................................................... 114Schedules of Active Member Valuation Data - Last Six Years ........................................................... 115MSEP* Retirees and Beneficiaries Added and Removed .................................................................. 116Judicial Plan Retirees and Beneficiaries Added and Removed ........................................................... 120Short-Term Solvency Test ................................................................................................................ 122Derivation of Experience Gain (Loss) .............................................................................................. 123
Summary of Plan ProvisionsComparison of Plans for General State Employees .......................................................................... 124Comparison of Plans for Legislators ................................................................................................ 126Comparison of Plans for Elected Officials ....................................................................................... 128Comparison of Plans for Judges ....................................................................................................... 130Comparison of Plans for Uniformed Members of the Water Patrol .................................................. 132Administrative Law Judges and Legal Advisors Plan ........................................................................ 133Life Insurance Plans ........................................................................................................................ 134Long-Term Disability (LTD) Plans .................................................................................................. 135Changes in Plan Provisions .............................................................................................................. 135
Actuarial Present Values ................................................................................................................... 136
STATISTICAL SECTIONSummary ......................................................................................................................................... 137Changes in Net Assets - Last Ten Fiscal Years ................................................................................... 138Deductions from Net Assets for Benefits and Refunds by Type - Last Ten Fiscal Years ..................... 140Valuation Assets vs. Pension Liabilities - Last Ten Fiscal Years - Pension Trust Funds ....................... 142Contribution Rates as a Percent of Payroll - Last Ten Fiscal Years .................................................... 146Membership in Retirement Plans - Last Ten Fiscal Years .................................................................. 147Benefit Recipients by Type of Retirement and Option Selected ....................................................... 148Distribution of Benefit Recipients by Location ................................................................................ 150Benefits Payable June 30, 2012 - Tabulated by Option and Type of Benefit ..................................... 151Average Monthly Benefit Amounts - Ten Years Ended June 30, 2012 .............................................. 152Retirees and Beneficiaries - Tabulated by Fiscal Year of Retirement .................................................. 159Total Benefits Payable June 30, 2012 - Tabulated by Attained Ages of Benefit Recipients ................ 160

Missouri State Employees’ Retirement System • Fiscal Year 20124
INTRODUCTORY SECTION
QUALITY
Strive to exceed the expectations of internal and external customers through innovation, competence, and teamwork. Seek to “do it right” the first time.
RESPECT
Be sensitive to the needs of others, both within and outside the organization. Be courteous, considerate, responsive, and professional.
INTEGRITY
In all endeavors, act in an ethical, honest, and professional manner.
OPENNESS
Be willing to listen to, and share information with, others. Be receptive to new ideas. Be trusting of others.
ACCOUNTABILITY
Take ownership of and responsibility for actions and their results. Learn from mistakes. Control system risks and act to protect the security of member information and system assets.
To exceed customer expectations by providing outstanding benefit services through professional plan administration and sound investment practices.
�ur �ission
�ore Values

Introductory SectionProfessional Awards ............................................................................................................................. 5Letter of Transmittal ............................................................................................................................ 6Letter from the Board Chair .............................................................................................................. 13Board of Trustees ............................................................................................................................... 15Administrative Organization ............................................................................................................. 16About MOSERS ............................................................................................................................... 17Outside Professional Services ............................................................................................................. 19

Missouri State Employees’ Retirement System • Fiscal Year 2012 5
INTRODUCTORY SECTION
PROFESSIONAL AWARDS
Certificate of Achievement for Excellence in Financial ReportingMOSERS’ Comprehensive Annual Financial Report for the fiscal year ended June 30, 2011, was awarded the Certificate of Achievement for Excellence in Financial Reporting by the Government Finance Officers Association of the United States and Canada (GFOA). This was the 23rd consecutive year that MOSERS has received this prestigious award. The Certificate of Achievement is the highest form of recognition for excellence in state and local government financial reporting. To be awarded a Certificate of Achievement, a government must publish an easily readable and efficiently organized Comprehensive Annual Financial Report (CAFR). The CAFR must satisfy generally accepted accounting principles, applicable legal requirements and GFOA reporting standards.
Public Pension Standards AwardMOSERS also received the Public Pension Coordinating Council (PPCC), Public Pension Standards Award in 2011, in recognition of meeting the professional standards for plan design and administration as set forth in the Public Pension Standards. This award is presented by the PPCC, a confederation of the National Association of State Retirement Administrators (NASRA), the National Conference on Public Employee Retirement Systems (NCPERS), and the National Council on Teacher Retirement (NCTR).

Missouri State Employees’ Retirement System • Fiscal Year 20126
INTRODUCTORY SECTION
LETTER OF TRANSMITTAL
Missouri State Employees’ Retirement System
Mailing AddressPO Box 209
Jefferson City, MO 65102-0209
Building Location 907 Wildwood Drive
Jefferson City, MO
Phone: (573) 632-6100 • (800) 827-1063MO Relay: 7-1-1 (Voice) • (800) 735-2966 (TTY)
Email: [email protected] • Website: www.mosers.org
October 29, 2012The Board of Trustees Missouri State Employees’ Retirement System907 Wildwood DriveJefferson City, MO 65109
Dear Board Members:
It is my pleasure to submit the 2012 Comprehensive Annual Financial Report (CAFR) of the Missouri State Employees’ Retirement System (MOSERS). Over the years, MOSERS has enjoyed much success with respect to the continued commitment to quality customer service and cost-effective pursuit of excellence in investments and benefits administration. That being said, it is not sufficient to look toward the future fueled only by achievements of the past. As we prepare for and execute succession planning relating to the changing of the guard, we are mindful that MOSERS serves tens of thousands of present and former state employees who count on us for their personal financial security far into the future. To accomplish this task, the “Spot-On - Excellence. Always.” strategic planning initiative was implemented. This initiative strives to build on the high level of success that has been present in the past while raising the bar for the future.
In FY12, the financial markets were marked by extreme volatility yet, in spite of this turmoil, the total fund exceeded its policy benchmark and generated $158 million, a 2.24% return net of fees for the year.
Report Contents and StructureThis CAFR is designed to satisfy the reporting requirements of state law as stipulated in Sections 104.480, 104.1006, and 105.661 of the Revised Statutes of Missouri (RSMo), as amended. Management has prepared the basic financial statements of MOSERS and is responsible for the integrity and fairness of the information presented. Some amounts included in the financial statements and elsewhere may be based on estimates and judgments. These estimates and judgments were products of the best business practices available. The accounting policies followed in preparing the basic financial statements conform with U.S. generally accepted accounting principles. Financial information presented throughout the CAFR is consistent with that which is displayed in the basic audited financial statements.

Missouri State Employees’ Retirement System • Fiscal Year 2012 7
INTRODUCTORY SECTION
Ultimate responsibility for the CAFR and the basic financial statements rests with the board of trustees. The executive director and the rest of the MOSERS staff assist board members in fulfilling their responsibilities. Systems of internal controls and supporting procedures are maintained to provide assurances that transactions are authorized, assets are safeguarded, and proper records are maintained. These controls include standards in the hiring and training of employees, the establishment of an organizational structure, and the communication of policies and guidelines throughout the organization. Internal controls are reviewed through internal audit programs and all internal audit reports are submitted to the board of trustees. The concept of reasonable assurance recognizes that the cost of a control should not exceed the benefits likely to be derived and the valuation of cost and benefits requires estimates and judgments by management.
The system’s external auditor, Williams-Keepers LLC, conducted an independent audit of the basic financial statements in accordance with U.S. generally accepted auditing standards. This audit is described in the Independent Auditor’s Report on page 21 of the Financial Section. Management has provided the external auditors with full and unrestricted access to MOSERS’ staff to discuss their audit and related findings, to facilitate independent validation of the integrity of the plan’s financial reporting and the adequacy of internal controls.
The Financial Section also contains the Management Discussion and Analysis that serves as an introduction to and overview of the financial statements. MOSERS is considered a component unit of the state of Missouri for financial reporting purposes and, as such, the financial statements in this report are also included in the State of Missouri’s Comprehensive Annual Financial Report.
Profile of MOSERSMOSERS is a body corporate and an instrumentality of the state of Missouri that was established in 1957 by state law, under the management of a board of trustees, for the purpose of providing retirement benefits to most state employees. MOSERS provides for those retirement benefits through pension trust funds, in keeping with the fiduciary responsibilities of the board members and staff.
Subsequent to its creation, MOSERS was further assigned the task of providing most members of the retirement system with term life and long-term disability insurance. MOSERS operates an internal service fund for the state of Missouri and contracts with insurance companies to provide those benefits through insured defined benefit plans. MOSERS maintains membership information on those eligible for the insurance coverage and collects and remits the premiums to the insurance company. Currently, the life and long-term disability insurance plans are insured through The Standard insurance company.
The State of Missouri’s Deferred Compensation Plan is accounted for as an internal service fund and is administered by MOSERS. Investment options are made available to participants who retain responsibility for the investment of their individual accounts.
A new tier defined benefit plan (MSEP 2011) is in effect for state employees first hired on or after January 1, 2011. The MSEP 2011 defined benefit plan does not impact members of MOSERS who had service with the state prior to January 1, 2011. Highlights of the MSEP 2011 defined benefit plan can be found on page 33 in the Notes to the Financial Statements, and on page 124-131 of the Actuarial Section.

Missouri State Employees’ Retirement System • Fiscal Year 20128
INTRODUCTORY SECTION
BudgetingThe MOSERS Board of Trustees annually approves the administrative expense budgets for MOSERS’ operations and investments sections. MOSERS’ governance policy requires an exception report to the board of trustees by the executive director if expenses are expected to exceed budgeted amounts by 10% and to seek board approval in advance for any unscheduled salary increases or staff expansions not included in the budget approved by the board before the beginning of the fiscal year. There were no budget exceptions to report for the year.
Succession PlanningSuccession planning strategies were originally developed in FY10 with an emphasis on employee development and retention, as well as ways in which institutional knowledge could be captured. This program included a selection process for high potential employees who were interested in preparing for higher level positions at MOSERS. The program was designed to capitalize on the experience that current staff already possesses and prepare them to move into higher level positions. In addition to training and job shadowing, each participant is required to initiate and complete an individual capstone project that would be of benefit to MOSERS. The third group of succession planning participants is continuing to work through their development plans and the fourth group will be recruited during the first half of FY13. The importance of this type of program becomes clear when considering the fact that MOSERS presently has 12 employees who are eligible to retire and an additional 16 who will become eligible to retire between now and September 1, 2017.
Risk Management EnhancementsRisk management is a critical component of the investment management program. Charlesworth & Associates, MOSERS’ insurance risk management consultant, has reported that insurance coverage has been designed around the risks to which the system is exposed and the philosophy regarding funding of potential loss. The insurance risk management consultant helps us ensure that coverage is consistent with industry standards and that the best rates available are in place. Additionally, it is the consultant’s opinion that MOSERS continues to excel in risk management.
Business Continuity Plan ImplementationMOSERS business continuity plans are the first line of defense in the aftermath of a business interruption. After an unexpected event, properly documented and regularly exercised plans will greatly increase the chances of resuming the organization’s normal business operations with minimal interruption. This year, additional remote access capabilities were increased to improve warm-site remote access to improve business continuity readiness. If MOSERS experiences a business interruption and the building is inaccessible, employees will be able to remotely access the computer systems at the warm-site.
Deferred Compensation and College and University Retirement PlansMOSERS is responsible for oversight of the State of Missouri Deferred Compensation Plan and the College and University Retirement Plan (CURP), which includes, but is not limited to, contracting with record keepers, plan administrators and investment managers, providing communications and ensuring that the plans are in compliance with federal and state law. Deferred compensation plan participation is voluntary for eligible members, including college and university employees. As of June 30, 2012, there were 53,034 participants (34,646 active and 18,388 terminated/retired). Of those employees eligible, nearly 54% participate in the plan. Participant account assets total

Missouri State Employees’ Retirement System • Fiscal Year 2012 9
INTRODUCTORY SECTION
$1,530,949,179. The plan consists of 13 custom-designed target date investment options, a stable income fund, a new monthly valued active asset allocation fund, a brokerage window option, and 30 closed legacy mutual fund options (consisting of a variety of domestic equity, international equity, fixed income, and lifestyle/balanced mutual funds).
As of June 30, 2012, plan participation was down 1% from June 30, 2011. Total participants decreased by 2,041 during the fiscal year. This decline continues as a result of lower enrollments due to economic conditions and ceased contributions in response to the plan incentive suspension in March 2010.
A change in state law allowed for the automatic enrollment of new employees into the State of Missouri Deferred Compensation Plan beginning July 1, 2012.
On November 10, 2011, participant account records in the deferred compensation plan were transitioned to the International City/County Management Association Retirement Corporation (ICMA-RC). This transition led to improvements such as lower accounts fees, the addition of TD Ameritrade for brokerage window, fee-based planning service offerings and the option for after-tax (Roth) contributions.
The defined contribution team and investment staff at MOSERS worked with ICMA-RC, Bank of New York Mellon (MOSERS’ custodial bank) and legal advisors to create the MOSERS Investment Portfolio (MIP) fund option. The new offering became available to plan participants on July 1, 2012. This option gives plan participants the ability to purchase units of the MOSERS investment portfolio, giving them a unique, long-term investment option.
The board also has responsibility for oversight of the College and University Retirement Plan (CURP). CURP is a 401(a) defined contribution plan for education employees hired after June 30, 2002, by the regional colleges and universities that participate in MOSERS. The employer payroll contribution rate is the normal cost rate of the defined benefit plan for general state employees less 1%. TIAA-CREF is responsible for third party administration and for providing investment products and education for members in the plan. Current plan assets total $35,565,877 with 1,826 participants.
Technology UpdatesThis year, a building-wide overhaul of the network infrastructure was completed. The upgraded wiring and switching technology will increase speed and reliability in preparation for a move to Voice over Internet Protocol (VoIP) telecommunications in the future.
Cost Effectiveness Measurement (CEM)Customer service is a critical element in MOSERS’ performance objectives. One of the ways MOSERS measures overall performance is through the Cost Effectiveness Measurement, Inc. (CEM) pension administration benchmarking analysis. CEM evaluated 66 leading pension systems, including systems in the United States, Canada, Australia, the Netherlands, and Denmark. MOSERS’ peer group included 11 U.S. public pension plans that are identified as the most relevant peer group based on membership size and system assets. This year, the CEM results indicated that MOSERS’ service ranked number one again in the peer group and was the highest in CEM’s global universe of 88 plans. MOSERS’ service score was 91, well above the peer median of 77 and the all CEM average of 74. Each year, we explore improvements to service that can be made in a cost-effective manner.

Missouri State Employees’ Retirement System • Fiscal Year 201210
INTRODUCTORY SECTION
CEM measures the cost of service on an annual per participant basis (including active members and benefit recipients). MOSERS’ has 88,000 such participants while the median number within the peer group is 101,000 and the peer average is 114,000. MOSERS’ cost of $73 per active member and annuitant was equal to the peer median of $73 and well below the peer average of $94. In addition, our overall complexity score remains below the peer average (with simplicity being viewed as a positive).
Summary of Financial InformationThe following schedule is a comparative summary of the pension trust funds’ additions and deductions for the years ended June 30, 2012, and June 30, 2011.
Pension Trust Funds
Year Ended June 30, 2012 Year Ended June 30, 2011Additions $ 460,966,483 $1,708,542,321Deductions (646,164,323) (647,802,147)Net change $ (185,197,840) $1,060,740,174
The following schedule is a comparative summary of the revenues and expenses of the Internal Service Funds (insurance and deferred compensation activity) for the years ended June 30, 2012, and June 30, 2011.
Internal Service Funds
Year Ended June 30, 2012 Year Ended June 30, 2011Operating revenues $ 46,686,989 $ 84,032,268Operating expenses (46,857,332) (83,877,672) Nonoperating revenue 11,068 11,071Net change $ (159,275) $ 165,667
Additional financial information can be found in the Management Discussion and Analysis Report, the financial statements, and schedules included in the Financial Section of this report.
InvestmentsMOSERS’ investments generated a return of 2.2%, net of fees, for FY12. The total fund return exceeded its policy benchmark by 1%. The incremental return (actual return vs. policy benchmark) resulted in an additional $83 million for the fund this year.
Although volatility defined the markets this past year, MOSERS had the best 10-year investment return at June 30, 2012, in the national universe of statewide funds. The largest asset class, public equities, returned -3.0% for the year. Total public debt returned 7.4% for the fiscal year. Within the alternative investments asset class, real assets and private investments posted absolute returns of 5.6%. The table on page 73 illustrates each sub-asset classes’ contribution to the total return. Additional information regarding the investments of the pension trust funds can be found in the Investment Section of this report.

Missouri State Employees’ Retirement System • Fiscal Year 2012 11
INTRODUCTORY SECTION
Plan Financial ConditionThe funding objective of MOSERS’ pension trust funds is to meet long-term benefit promises through contributions that remain approximately level as a percent of member payroll over decades of time. Historical information relating to progress in meeting this objective is presented on pages 49-52. During the year ended June 30, 2012, the funded ratio of the Missouri State Employees’ Plan, which covers 106,674 participants, decreased from 79.2% to 73.2%, primarily the result of the unfavorable investment market experience in previous years and the strengthening of demographic assumptions. Funding of the Judicial Plan, which covers 927 participants, began on July 1, 1998. During the year ended June 30, 2012, the funded ratio of the Judicial Plan decreased from 25.0% to 24.7%. Additional information regarding the financial condition of the pension trust funds can be found in the Actuarial Section of this report.
AwardsThe Government Finance Officers Association of the United Sate and Canada (GFOA) awarded a certificate of Achievement for Excellence in Financial Reporting to MOSERS for its comprehensive annual financial report for the fiscal year ended June 30, 2011. This was the 23rd consecutive year that MOSERS has received this prestigious award. In order to be awarded a Certificate of Achievement, a government must publish an easily readable and efficiently organized comprehensive annual financial report. The report must satisfy generally accepted accounting principles and applicable legal requirements.
A Certificate of Achievement is valid for a period of one year only. We believe that our current comprehensive annual financial report continues to meet the Certificate of Achievement Program’s requirements and we are submitting it to the GFOA to determine its eligibility for another certificate.
MOSERS received the Public Pension Coordinating Council (PPCC), Public Pension Standards Award, in recognition of meeting the professional standards for plan design and administration as set forth in the Public Pension Standards. This award is presented by the PPCC, a confederation of the National Association of State Retirement Administrators (NASRA), the National Conference on Public Employee Retirement Systems (NCPERS), and the National Council on Teacher Retirement (NCTR).
These prestigious awards recognize MOSERS for financial and professional standards of excellence. Presentation of these notable awards can be found on page 5.
GFOA also presented MOSERS with an Award for Outstanding Achievement in Popular Annual Financial Reporting for the summary annual report. This was the 16th year that MOSERS received this award.
This past year, MOSERS also received the aiCIO (Asset International Chief Investment Officer) Asset-Owner Innovation Award for a public pension plan below $15 billion. This award highlights the most innovative and positive work being done for, and at, the world’s largest pensions, endowments, foundations, and sovereign wealth funds.
In June 2012, investment consultant Cliffwater, LLC released an independent report which recognized MOSERS for producing the highest ten-year investment return in the statewide public retirement fund universe for the period ending June 30, 2011.
These awards are gratifying to MOSERS’ staff and increase MOSERS’ stature as an industry leader.

Missouri State Employees’ Retirement System • Fiscal Year 201212
INTRODUCTORY SECTION
ConclusionThis report is a product of the combined efforts of MOSERS’ staff and advisors functioning under your leadership. It is intended to provide complete and reliable information that facilitates the management decision making process, serves as a means for determining compliance with legal requirements, and allows for the evaluation of responsible guardianship of system funds. As in the past, MOSERS received an unqualified opinion from our independent auditor on the financial statements included in this report. The opinion of the independent auditor is on page 21.
Copies of this report are provided to the Governor, State Auditor, the Joint Committee on Public Employee Retirement of the General Assembly, and all state agencies that form the link between MOSERS and its members. Their cooperation contributes significantly to the success of MOSERS.
I would like to take this opportunity to express my gratitude to you, the staff, the advisors, and other people who have worked so diligently to assure the continued successful operation of the system. Thank you for assisting the system in raising the bar towards “Excellence. Always.”
Respectfully submitted,
Gary Findlay Executive Director

Missouri State Employees’ Retirement System • Fiscal Year 2012 13
INTRODUCTORY SECTION
LETTER FROM THE BOARD CHAIR
Missouri State Employees’ Retirement System
Mailing AddressPO Box 209
Jefferson City, MO 65102-0209
Building Location 907 Wildwood Drive
Jefferson City, MO
Phone: (573) 632-6100 • (800) 827-1063MO Relay: 7-1-1 (Voice) • (800) 735-2966 (TTY)
Email: [email protected] • Website: www.mosers.org
October 29, 2012
Dear Members:
On behalf of the board of trustees, I am pleased to present the MOSERS Comprehensive Annual Financial Report for the fiscal year ended June 30, 2012. While the focus of this report is on information related to the financial status of your retirement system, it also highlights other changes that occurred during the year. The Financial Section of this report is prepared in accordance with generally accepted accounting principles and is appropriately attested to by the system’s independent certified public accountants.
MOSERS’ investments generated a return of $158 million, 2.2% net of fees, on behalf of our members and Missouri taxpayers this year, exceeding the policy benchmark of 1.2%. Although this return is lower than those generated the past two years (14.3% in FY10 and 21% in FY11), it reflects the volatility that the financial markets experienced throughout this fiscal year. In the national universe of statewide pension funds, MOSERS generated the best ten-year investment return as of June 30, 2012.
After long and careful discussion and following the recommendations and guidance of the system’s actuary, in June 2012, the board adopted strengthened mortality tables and revised rates of withdrawal and retirement to better reflect recent experience, as well as adopting other minor changes in demographic assumptions. In July 2012, the board voted to reduce the nominal investment return assumption from 8.5% to 8% and to adopt assumptions for wage inflation and price inflation of 3% and 2.5%, respectively.
Your retirement system continues to achieve high marks in the delivery of customer service to our members. One of the ways operational performance is measured is through the Cost-Effectiveness Measurement, Inc. (CEM) pension administration benchmarking analysis. CEM evaluated 66 leading pension systems, including systems in the U.S., Canada, the Netherlands, and Denmark. MOSERS’ peer group included 11 U.S. public pension plans that are identified as our most relevant peer group based on membership size and system assets. This year, the CEM results indicated that MOSERS’ service ranked number one again in our peer group with lower than average costs.

Missouri State Employees’ Retirement System • Fiscal Year 201214
INTRODUCTORY SECTION
Phone: (573) 632-6100 • (800) 827-1063MO Relay: 7-1-1 (Voice) • (800) 735-2966 (TTY)
Email: [email protected] • Website: www.mosers.org
The board experienced some turnover this past year. On behalf of the board, staff and members, I would like to thank the former Commissioner of the Office and Administration, Kelvin Simmons, Representative Ward Franz, Representative Thomas Flanagan, and Travis Morrison, for their hard work and contributions to the system. Trustees devote many hours in fulfilling their duties and serve with no remuneration. The board also welcomed acting Commissioner of Administration Doug Nelson, Representative Caleb Jones, and Antwaun Smith to the board this year, and we look forward to serving with them.
I wish to thank all of the MOSERS board members for their hard work and contributions to the system this year. The wide diversity and exceptional knowledge that our trustees bring to each meeting is one reason for our system’s continued success. Additionally, the board thanks MOSERS’ staff for maintaining a high level of expertise and professionalism required for excellence in our retirement system that continues to serve our membership well.
Both the board of trustees and staff look forward to meeting your future needs. If you have any questions regarding this report or any other aspect of MOSERS, please contact us at MOSERS, P.O. Box 209, Jefferson City, MO 65102 or call (800) 827-1063. Our website can also be visited at www.mosers.org.
Sincerely,
Donald Martin, ChairBoard of Trustees

Missouri State Employees’ Retirement System • Fiscal Year 2012 15
INTRODUCTORY SECTION
BOARD OF TRUSTEES
Senator Jason CrowellSenate Appointed Member
Laura DavisElected Active Member
Antwaun SmithGovernor Appointed Member
State TreasurerClint Zweifel
Ex-Officio Member
Representative Caleb JonesHouse Appointed Member
Marty DrewelElected Active Member
Acting Commissioner of AdministrationDoug Nelson
Ex-Officio Member
Representative Mike LearaHouse Appointed Member
Senator Timothy GreenSenate Appointed Member
Donald Martin - ChairElected Retired Member
Lori Neidel - Vice ChairGovernor Appointed Member

Missouri State Employees’ Retirement System • Fiscal Year 201216
INTRODUCTORY SECTION
ADMINISTRATIVE ORGANIZATION
Karen Stohlgren - Deputy Executive Director Chief Operations Officer (COO)
Stacy Gillmore - Manager of Information Technology
Gary Irwin - Chief Finance Officer
Lori Leeper - Operations Project Coordinator/Board Secretary
JoAnn Looten - Manager of Records & Facility
Krista Myer - Manager of Communications
Scott Simon - Manager of Benefit Services
Gary Findlay - Executive Director
Greg Beck - Chief Auditor
Judy Delaney - Legislative & Policy Coordinator
Jake McMahon - Chief Counsel
Lisa Verslues - Human Resources Coordinator
Rick Dahl - Deputy Executive DirectorChief Investment Officer (CIO)
Shannon Davidson - Manager of Investment Risk & Performance
Seth Kelly - Manager of Investment Research & Strategy
Jim Mullen - Manager of Public Debt
Pat Neylon - Manager of Public Equity
Scott Peppard - Manager of Alternative Investments
Christine Rackers - Manager of Investment Policy & Communications
Cindy Rehmeier - Manager of Deferred Compensation
Tricia Scrivner - Manager of Hedge Fund Investments

Missouri State Employees’ Retirement System • Fiscal Year 2012 17
INTRODUCTORY SECTION
PurposeMOSERS was established September 1, 1957, and is governed by laws of the state of Missouri.
MOSERS provides retirement, survivor, and disability benefits, as well as life insurance and deferred compensation plan management to its members.
MOSERS administers retirement benefits for most state employees, including members of the Missouri General Assembly, elected state officials, and judges. MOSERS is responsible for administering the law in accordance with the expressed intent of the Missouri General Assembly and bears a fiduciary obligation to the state employees who are its members and beneficiaries.
AdministrationState law provides that responsibility for the administration of MOSERS is vested in an 11-member board of trustees. The board is comprised of:
• Two members of the Senate appointed by the President Pro Tem of the Senate.
• Two members of the House of Representatives appointed by the Speaker of the House.
• Two members appointed by the Governor.
• The State Treasurer.
• The Commissioner of Administration.
• Three other system members: two active members elected by the active and terminated-vested members, and one retiree elected by the retired members.
The day-to-day management of MOSERS is delegated to the executive director who is appointed by the board and serves at its pleasure. The executive director acts as advisor to the board on all matters pertaining to the system, contracts for professional services, and employs the remaining staff needed to manage the system.
Organization The executive director, COO, and CIO are responsible for planning, organizing, and administering the operations of the system under the broad policy guidance and direction of the board. MOSERS’ office is divided into seven administrative sections that perform specific functions for the system.
Executive Services The executive services team provides administrative support by assisting the executive director, COO, and CIO in the major legal, operational, and oversight functions of the retirement, benefit, and communication programs.
AccountingAccounting is responsible for all financial records of the programs administered by MOSERS, including the preparation of financial and statistical reports. Accounting performs the purchasing functions for MOSERS and interfaces with the investment custodian, Office of Administration accounting, various payroll and personnel departments, life insurance companies, actuaries, banks, and the IRS on all accounting-related issues.
ABOUT MOSERS

Missouri State Employees’ Retirement System • Fiscal Year 201218
INTRODUCTORY SECTION
Benefit ServicesBenefit services is responsible for contact with the members regarding the benefit programs directly administered by MOSERS, which include retirement, life insurance, and long-term disability.
CommunicationsCommunications is responsible for providing clearly written and attractively designed publications, and conducting educational seminars to inform members about benefit programs administered by MOSERS. Communications and the information technology section are jointly responsible for MOSERS’ website.
Information TechnologyInformation technology is responsible for establishing and maintaining the automated systems that support MOSERS’ daily operations. MOSERS takes full advantage of technology to automate and integrate almost every aspect of the business. Key technologies include a document imaging system, a custom-built benefits management system and a computer-based telephone system.
InvestmentsThe primary function of the investment department is to provide internal investment management and consulting services to the board and the executive director. Other functions include hiring and terminating external investment managers, making strategic allocation decisions, analyzing the overall asset allocation, rebalancing the portfolio, and informing and advising the board and executive director on financial and economic developments which may affect the system. The investment staff also works with the general asset consultant, the hedge fund asset consultant and the executive director in selecting and monitoring external money managers. Information regarding the investment professional service providers can be found in the Investment Section.
Records and Facility ManagementRecords and facility management is responsible for establishing and maintaining all membership records including maintenance of the data on the electronic imaging system, balancing payroll deductions for insurance, and entering the payroll, service, and leave data into the system’s retirement database. This section is also responsible for mail services and general building maintenance.

Missouri State Employees’ Retirement System • Fiscal Year 2012 19
INTRODUCTORY SECTION
Actuary
• Gabriel, Roeder, Smith & Co.
Auditor
• Williams-Keepers, LLC
Legal Counsel
• Thompson Coburn, LLP
Master Custodian
• Bank of New York Mellon
Investment Management Consultants
• Blackstone Alternative Asset Management, LP Hedge Fund Asset Consultant
• Summit Strategies Group General Asset Consultant
• TimberLink, LLC Timberland Consultant
Risk Management Consultant
• Charlesworth & Associates, LC
Third-Party Administrators
• ICMA-RC Deferred Compensation Plan
• The Standard Insurance Company Disability and Life Insurance
• TIAA-CREF College & University Retirement Plan
Securities Lending Advisor
• Deutsche Bank AG, New York Branch
Information Technology Consulting
• Avtex Solutions, Inc.
• Huber & Associates, Inc.
• HyperGen, Inc.
• Qflow Systems, LLC
Human Resources Consulting
• CBIZ Benefits & Insurance Service, Inc.
• Rose International
Investment Advisors
• Actis Capital, LLP
• Alinda Capital Partners, LLC
• Alliance Bernstein Defined Contribution Investments
• American Industrial Partners
• AQR Capital Management, LLC
• Ashmore Investment Management, Ltd.
• Axiom Asia Private Capital
• Axxon Management, Ltda.
• Baillie Gifford International, LLC
• Bayview Asset Management, LLC
• BlackRock Financial Management, Inc.
• Blackstone Alternative Asset Management, LP
• Blackstone Real Estate Advisors
• Blakeney Management
• Brevan Howard Capital Management, Ltd.
• Bridgepoint Capital, Ltd.
• Bridgewater Associates, LP
• CarVal Investors, LLC
• Catalyst Capital Group, Inc.
• Catterton Partners
• Claren Road Asset Management, LLC
• COMAC Capital, LLP
• CQS, Cayman, LP
• Davidson Kempner Capital Management, LLC
• DDJ Capital Management, LLC
• Development Partners International
• Diamondback Capital Management, LLC
OUTSIDE PROFESSIONAL SERVICES
Outside Professional Services continued on page 20

Missouri State Employees’ Retirement System • Fiscal Year 201220
INTRODUCTORY SECTION
• DRI Capital, Inc.
• EIG Global Energy Partners, LLC
• Elliott International Capital Advisors, Inc.
• Eminence Capital
• Empyrean Capital Partners, LP
• Eton Park Capital Management, LP
• Farallon Capital Management, LLC
• Fortress Investment Group, LLC
• Glenview Capital Management, LLC
• Global Forest Partners, LP
• Grantham, Mayo, Van Otterloo & Co., LLC
• Harvest Fund Advisors, LLC
• HBK Investments, LP
• JLL Partners
• King Street Capital Management, LP
• Legg Mason Capital Management, Inc.
• Leuthold Weeden Capital Management
• Linden Capital Partners, LLC
• Mast Capital Management, LLC
• Merit Energy Company
• MHR Fund Management, LLC
• Millennium Technology Ventures, LP
• Moon Capital Management, LP
• Morant Wright Management, Ltd.
• New Mountain Capital, LLC
• Nippon Value Investors
• NISA Investment Advisors, LLC
• Oaktree Capital Management, LP
• Pacific Alternative Asset Management Company, LLC
• Perry Corp.
• Pershing Square Capital Management, LP
• Pharo Global Advisors Ltd.
• Resource Management Service, LLC
• Silchester International Investors
• Silver Creek Capital Management, LLC
• Silver Lake Partners
• Silver Point Capital, LP
• Stepstone Group
• State Street Global Advisors
• Stone Harbor Investment Partners, LP
• The Campbell Group, LLC
• TPG Credit Management, LP
• TPG-Axon Capital Management, LP
• Veritas Capital Fund Management, LLC
• Viking Global Investors, LP
• Visium Asset Management, LP
• Wellington Management Company, LLP
Outside Professional Services continued from page 19

Financial SectionIndependent Auditor’s Report ........................................................................................................... 21Management Discussion and Analysis ............................................................................................... 22
Basic Financial StatementsStatements of Plan Net Assets - Pension Trust Funds ......................................................................... 27Statements of Changes in Plan Net Assets - Pension Trust Funds ....................................................... 28Balance Sheets - Internal Service Funds ............................................................................................. 29Statements of Revenues, Expenses, and Changes in Plan Net Assets - Internal Service Funds ............ 29Statements of Cash Flows - Internal Service Funds ............................................................................ 30Notes to the Financial Statements ..................................................................................................... 31
Required Supplementary InformationSchedules of Funding Progress - Pension Trust Funds ........................................................................ 49Schedules of Employer Contributions - Pension Trust Funds............................................................. 50Notes to the Schedules of Required Supplementary Information - Pension Trust Funds .................... 51
Additional Financial InformationActuarial Asset Value Smoothing ....................................................................................................... 53Schedules of Investment Expenses - Pension Trust Funds .................................................................. 54Schedules of Internal Investment Activity Expenses - Pension Trust Funds ........................................ 56Schedules of Administrative Expenses - Pension Trust Funds ............................................................. 57Schedules of Administrative Expenses - Internal Service Funds .......................................................... 58Schedules of Professional/Consultant Fees ........................................................................................ 59Investment Summary - Pension Trust Funds ...................................................................................... 60Investment Summary - Internal Service Funds .................................................................................. 60
Missouri State Employees’ Retirement System • Fiscal Year 2012 21
FINANCIAL SECTION
INDEPENDENT AUDITOR’S REPORT
The Board of TrusteesMissouri State Employees’ Retirement System
We have audited the accompanying Statement of Plan Net Assets of the Missouri State Employees’ Retirement System (MOSERS), a component unit of the state of Missouri, as of and for the year ended June 30, 2012, as listed in the accompanying table of contents. These financial statements are the responsibility of MOSERS’ management. Our responsibility is to express an opinion on these financial statements based on our audits.
We conducted our audits in accordance with U.S. generally accepted auditing standards. Those standards require that we plan and perform the audits to obtain reasonable assurance about whether the financial statements are free of material misstatement. An audit includes examining, on a test basis, evidence supporting the amounts and disclosures in the financial statements. An audit also includes assessing the accounting principles used and significant estimates made by management, as well as evaluating the overall financial statement presentation. We believe that our audits provide a reasonable basis for our opinion.
In our opinion, the financial statements referred to above present fairly, in all material respects, the financial position of MOSERS, as well as MOSERS’ internal service funds, at June 30, 2012, and the respective changes in financial position and cash flows, where applicable, for the year then ended in conformity with U.S. generally accepted accounting principles.
U.S. generally accepted accounting principles require that the Management Discussion and Analysis on pages 22-26 and the Schedules of Funding Progress and Employer Contributions on pages 49-50 be presented to supplement the Basic Financial Statements. Such information, although not a part of the Basic Financial Statements, is required by the Governmental Accounting Standards Board, who considers it to be an essential part of financial reporting for placing the Basic Financial Statements in an appropriate operational, economic, or historical context. We have applied certain limited procedures to the required supplementary information in accordance with U.S. generally accepted auditing standards, which consisted of inquiries of management about the methods of preparing the information and comparing the information for consistency with management’s responses to our inquiries, the basic financial statements, and other knowledge we obtained during our audit of the basic financial statements. We do not express an opinion or provide any assurance on the information because the limited procedures do not provide us with sufficient evidence to express an opinion or provide any assurance.
Our audits were conducted for the purpose of forming opinions on the financial statements that collectively comprise MOSERS financial statements as a whole. The Introductory, Investment, Actuarial and Statistical Sections and the Additional Financial Information on pages 53-60 are presented for purposes of additional analysis and are not a required part of the financial statements. The Required Supplementary Information on pages 49-52 is the responsibility of management and was derived from and relate directly to the underlying accounting and other records used to prepare the financial statements. The information has been subjected to the auditing procedures applied in the audit of the financial statements and certain additional procedures, including comparing and reconciling such information directly to the underlying accounting and other records used to prepare the financial statements or to the financial statements themselves, and other additional procedures in accordance with U.S. generally accepted auditing standards. In our opinion, the information is fairly stated in all material respects in relation to the financial statements as a whole. The Introductory, Investment, Actuarial and Statistical Sections have not been subjected to the auditing procedures applied in the audit of the basic financial statements and, accordingly, we do not express an opinion or provide any assurance on them.
October 29, 2012

Missouri State Employees’ Retirement System • Fiscal Year 201222
FINANCIAL SECTION
MANAGEMENT DISCUSSION AND ANALYSIS
The basic financial statements contained in this section of the Comprehensive Annual Financial Report consist of:
The Statements of Plan Net Assets which report the pension trust funds’ assets, liabilities, and resulting net assets where Assets – Liabilities = Net Assets available at the end of the fiscal year. It is a snapshot of the financial position of the pension trust funds at that specific point in time.
The Statements of Changes in Plan Net Assets which summarize the pension trust funds’ financial transactions that have occurred during the fiscal year where Additions – Deductions = Net Change in Net Assets. It supports the change that has occurred to the prior year’s net asset value on the Statements of Plan Net Assets.
The Balance Sheet of the internal service funds is similar to the Statements of Plan Net Assets in that it is also a snapshot of the financial position of the internal service funds where Net Assets + Liabilities = Assets.
The Statements of Revenues, Expenses, and Changes in Net Assets of the internal service funds is similar to the Statements of Changes in Plan Net Assets in that it also reports a summary of the financial activity that occurred over the period of the fiscal year where Revenues – Expenses = Net Revenue and supports the change to the prior year’s net assets.
The Statements of Cash Flows of the internal service funds report the financial transactions of the fiscal year of the internal service funds on a cash basis. It is similar to the Statements of Revenues, Expenses and Changes in Net Assets; however, the focus of this statement is on the change to cash balances with accrued income and expense items eliminated.
The Notes to the Financial Statements are an integral part of the above financial statements and include additional information not readily evident in the statements themselves.
The required supplementary Management Discussion and Analysis information, the Required Supplementary Information, and Additional Financial Information following the Notes to the Financial Statements provide detailed historical information considered useful in evaluating the condition of the plans administered by MOSERS.
MOSERS’ overall pension fund financial condition declined during the fiscal year ended June 30, 2012 (FY12). Pension fund net assets decreased by $185,197,840 during the fiscal year, primarily as result of a decrease in investment values and their associated income. The investments of the pension trust funds generated a 2.2% return for the year, down from the prior year’s return of 21.0%.
The MSEP plan experienced a decrease in its funded status from 79.2% to 73.2% and the Judicial Plan experienced an decrease in its funded status from 25.0% to 24.7%. The change in the valuation asset market corridor adopted by the MOSERS Board of Trustees in 2009 returned to +/- 20% for FY11 and remained +/- 20% for FY12. In July 2012, the board voted to reduce the nominal investment return assumption from 8.5% to 8% and to adopt assumptions for wage inflation and price inflation of 3% and 2.5%, respectively.
The internal service funds net assets decreased by $159,275. The goals of the internal service funds are to maintain the funds at a level that enables it to meet its obligations of contracting the premiums for the life and long-term disability insurance benefits for state employees; maintain the membership data necessary to track the premiums due from the state and its employees and payable to the insurance carrier; and manage the state employees deferred compensation program.
The following schedules present summary comparative financial statements of the pension trust funds and internal service funds for FY12 and FY11. For each schedule there is a brief summary of the significant changes noted in those schedules.

Missouri State Employees’ Retirement System • Fiscal Year 2012 23
FINANCIAL SECTION
Pension Trust FundsSummary Comparative Statements of Plan Net Assets AnalysisThe largest components of the net assets of the pension trust funds are the investments, cash and short-term investments, and securities lending collateral.
The decrease in the fair value of investments is primarily attributable to the unfavorable market conditions experienced during FY12, as evidenced by a decrease in MOSERS’ total investment return from 21.0% last year to 2.2% this year. MOSERS invests in a portfolio dominated by risk assets and during the fiscal year ended June 30, 2012, the markets experienced extreme volatility. Detailed information regarding MOSERS’ investment portfolio is included in the Investment Section of this report.
Investment income payable and investment purchases payable decreased as a result of the timing of investment funding.
The increase in securities lending collateral is primarily attributable to higher utilization rates in the lending portfolio at fiscal year end. Margins were similar to the previous fiscal year resulting in similar income generation. As of fiscal year end, approximately 2% of the collateral received has been invested in asset-backed and corporate bonds, down from 10% the prior year. The invested collateral went from a shortfall of $0.8 million at the end of last fiscal year to $2 million above the liability in FY12.
Cash and short-term investments increased due to multiple factors including the timing of investment funding and gains that have occurred in the beta cash program that remained in cash account throughout the year.
Pension Trust Funds - Summary Comparative Statements of Plan Net Assets
As of June 30, 2012 As of June 30, 2011 Amount of Change Percentage Change
Cash and short-term investments $ 891,202,655 $ 807,270,837 $ 83,931,818 10.40%Receivables 59,162,673 27,244,113 31,918,560 117.16Investments 6,757,240,840 7,073,472,800 (316,231,960) (4.47)Invested securities lending collateral 692,476,483 643,085,121 49,391,362 7.68Capital assets 3,064,311 3,061,064 3,247 0.11Other assets 41,772 50,454 (8,682) (17.21)Total assets 8,403,188,734 8,554,184,389 (150,995,655) (1.77)Administrative expense payables 1,674,515 2,901,861 (1,227,346) (42.30)Investment purchase payables 12,932,642 16,139,126 (3,206,484) (19.87)Foreign currency payable 0 863,785 (863,785) (100.00)Investment income payable 0 8,218,700 (8,218,700) (100.00)Securities lending collateral 690,440,025 643,842,013 46,598,012 7.24Other liabilities 16,421,986 15,301,498 1,120,488 7.32Total liabilities 721,469,168 687,266,983 34,202,185 4.98Net assets $7,681,719,566 $7,866,917,406 $(185,197,840) (2.35)

Missouri State Employees’ Retirement System • Fiscal Year 201224
FINANCIAL SECTION
Summary Comparative Statements of Changes in Plan Net Assets AnalysisThe slight increase in contributions received is primarily attributable to an increase in the contribution rate for the general employees group from 13.81% to 13.97% and a full year of contributions received by members who contributed 4% as part of the MSEP 2011 tier.
The decrease in investment income in FY12 from FY11 is attributable to the generally unfavorable market conditions experienced by the investments of the fund. The slight increase in securities lending income is primarily due to increased utilization rates in the lending portfolio at fiscal year end. Margins were similar to the previous fiscal year resulting in similar income generation. The Investment Section of this report contains additional information regarding investments and securities lending activity.
The total benefit payments increase is due to a net increase in the number of benefit recipients plus cost-of-living adjustments provided to existing benefit recipients. Detailed schedules of these changes can be found on pages 116-121 of the Actuarial Section of this report.
Service transfers are dependent on the number of members electing to transfer their service out of MOSERS. Refunds are dependent on the number of members of the MSEP 2011 tier who have terminated employment and are eligible to request a refund, and members prior to September 1, 1972 that MOSERS locates who have contributions remaining in the system. In FY12, service transfers and refunds decreased due to a one-time transfer of $17,609,276 for those members electing to transfer under HB 1868, enacted in FY11. In FY12, 106 members (including 4 transfers to MoDOT and Patrol Employees’ Retirement System) elected to transfer their service out of MOSERS.
Pension Trust Funds - Summary Comparative Statements of Changes in Plan Net Assets
Year Ended June 30, 2012
Year EndedJune 30, 2011
Amountof Change
Percentage Change
Contributions $ 300,348,132 $ 294,737,248 $ 5,610,884 1.90%Investment income - investing activities 158,626,338 1,411,602,826 (1,252,976,488) (88.76)Investment income - securities lending activities 1,537,701 1,534,523 3,178 0.21Miscellaneous income 454,312 667,724 (213,412) (31.96)Total additions 460,966,483 1,708,542,321 (1,247,575,838) (73.02)Benefits 638,343,863 622,913,485 15,430,378 2.48Service transfers and refunds 711,889 17,745,828 (17,033,939) (95.99)Administrative expenses 7,108,571 7,142,834 (34,263) (0.48)Total deductions 646,164,323 647,802,147 (1,637,824) (0.25)Net increase (decrease) (185,197,840) 1,060,740,174 (1,245,938,014) (117.46)Net assets beginning of year 7,866,917,406 6,806,177,232 1,060,740,174 15.58Net assets end of year $7,681,719,566 $7,866,917,406 $ (185,197,840) (2.35)
Internal Service FundsSummary Comparative Balance Sheets AnalysisThe decrease in premiums receivable is attributable to normal fluctuations in the month-end balance of life and long-term disability insurance premiums receivable during the year, which are dependent on the number of members participating and amount of their coverage.
The decrease in accounts receivable-other is due to the change in the deferred compensation plan record keeper during FY12 where the quarterly credit from the record keeper and reimbursements from plan investment options now reside in an account for MOSERS with the plan record keeper. FY11 includes one quarter of revenue from the ING Stable Income investment option which MOSERS collected prior to the change to ICMA-RC.
The increase in investments is attributable to normal fluctuations in the investment in overnight repurchase agreements of the funds held pending transmission to the life and long-term disability insurance company.
The increase in premiums payable is attributable to normal fluctuations in the month-end balances of premiums payable for the year, similar to the fluctuations of the premiums receivable.

Missouri State Employees’ Retirement System • Fiscal Year 2012 25
FINANCIAL SECTION
Internal Service Funds - Summary Comparative Balance Sheets
As of June 30, 2012 As of June 30, 2011 Amount of Change Percentage Change
Cash $ 0 $ 8 $ (8) (100.00)%Premiums receivable 959,003 982,915 (23,912) (2.43)Accounts receivable - other 0 124,998 (124,998) (100.00)Investments 3,532,260 3,443,331 88,929 2.58Fixed assets 5,026 0 5,026 100.00Total assets 4,496,289 4,551,252 (54,963) (1.21)Premiums payable 3,346,314 3,220,853 125,461 3.90Other liabilities 359,313 380,462 (21,149) (5.56)Total liabilities 3,705,627 3,601,315 104,312 2.90Unrestricted net assets 790,662 949,937 (159,275) (16.77)Total liabilities and net assets $4,496,289 $4,551,252 $ (54,963) (1.21)
Summary Comparative Statements of Revenues, Expenses, and Changes in Net AssetsInternal Service Funds
Year EndedJune 30, 2012
Year EndedJune 30, 2011
Amountof Change
Percentage Change
Premium receipts $28,578,326 $28,829,638 $ (251,312) (0.87)%Deferred compensation receipts 17,500,476 54,221,226 (36,720,750) (67.72)Miscellaneous income 608,187 981,404 (373,217) (38.03)Total operating revenue 46,686,989 84,032,268 (37,345,279) (44.44)Premium disbursements 28,556,036 28,804,638 (248,602) (0.86)Deferred compensation disbursements 17,500,476 54,221,226 (36,720,750) (67.72)Premium refunds 22,291 24,999 (2,708) (10.83)Administrative expenses 778,529 826,809 (48,280) (5.84)Total operating expenses 46,857,332 83,877,672 (37,020,340) (44.14)Net operating income (loss) (170,343) 154,596 (324,939) (210.19)Investment income 11,068 11,071 (3) (0.03)Net revenues over expenses (159,275) 165,667 (324,942) (196.14)Net assets beginning of year 949,937 784,270 165,667 21.12Net assets end of year $ 790,662 $ 949,937 $ (159,275) (16.77)
Other liabilities decreased primarily as a result of the decrease in reimbursements due to the pension trust funds for the internal service fund’s portion of shared expenses which had not been transferred at year end.
Summary Comparative Statements of Revenues, Expenses, and Changes in Net Assets AnalysisPremium receipts and premium disbursements decreased slightly due to normal fluctuations in the amount of optional life insurance coverage selected by state employees.
The decrease in deferred compensation receipts and disbursements is attributable to multiple factors including a change in collection process where the third party administrator now collects deferred compensation contributions from employers directly instead of through MOSERS, and a decreased number in the workforce contributing to the plan as a result of the decline in overall economic conditions. Total participants (both active and terminated) decreased by 2,041 during the fiscal year. The state of Missouri has not contributed an employer match since March 2010.
Miscellaneous income decreased as a result of lower receipts collected directly by MOSERS from the revenue sharing arrangement with the deferred compensation plan administrator.
Premium refunds decreased slightly as a result of timing differences resulting from changes in insurance coverage.
Administrative expenses decreased primarily as a result of the decrease in reimbursements due to the pension trust funds for the internal service fund’s portion of shared expenses.
Missouri State Employees’ Retirement System • Fiscal Year 201226
FINANCIAL SECTION
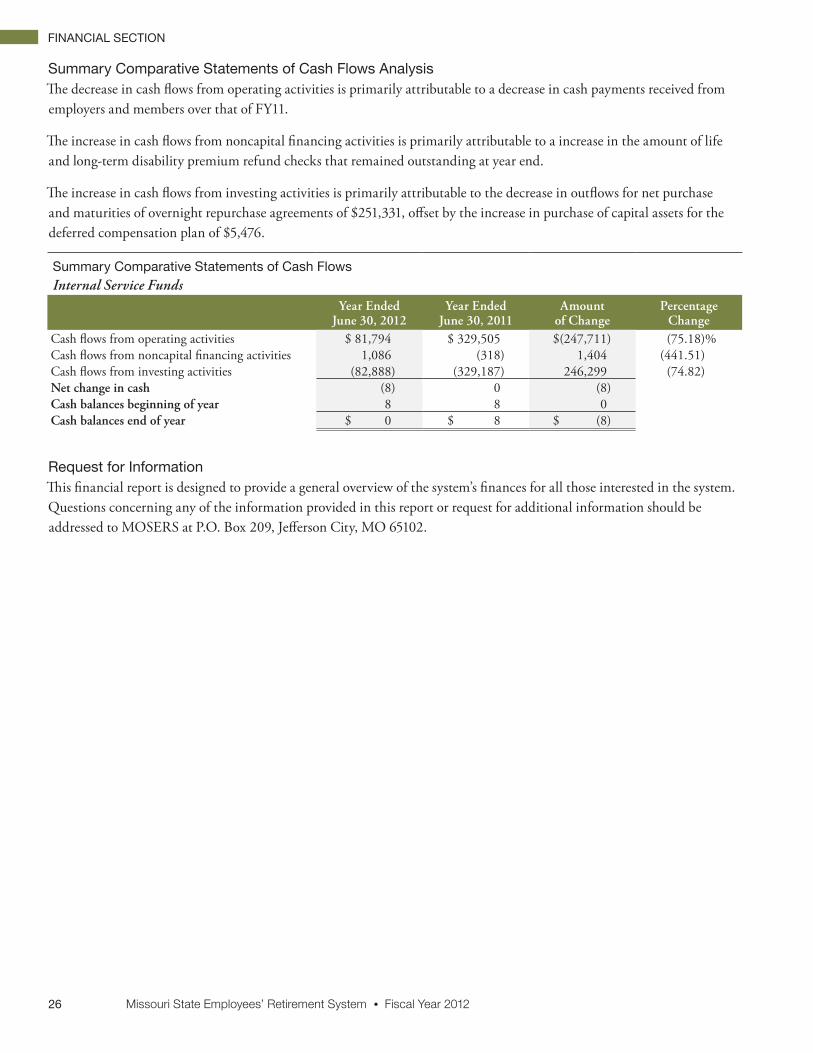
Summary Comparative Statements of Cash Flows AnalysisThe decrease in cash flows from operating activities is primarily attributable to a decrease in cash payments received from employers and members over that of FY11.
The increase in cash flows from noncapital financing activities is primarily attributable to a increase in the amount of life and long-term disability premium refund checks that remained outstanding at year end.
The increase in cash flows from investing activities is primarily attributable to the decrease in outflows for net purchase and maturities of overnight repurchase agreements of $251,331, offset by the increase in purchase of capital assets for the deferred compensation plan of $5,476.
Summary Comparative Statements of Cash FlowsInternal Service Funds
Year EndedJune 30, 2012
Year EndedJune 30, 2011
Amountof Change
Percentage Change
Cash flows from operating activities $ 81,794 $ 329,505 $(247,711) (75.18)%Cash flows from noncapital financing activities 1,086 (318) 1,404 (441.51)Cash flows from investing activities (82,888) (329,187) 246,299 (74.82)Net change in cash (8) 0 (8)Cash balances beginning of year 8 8 0 Cash balances end of year $ 0 $ 8 $ (8)
Request for InformationThis financial report is designed to provide a general overview of the system’s finances for all those interested in the system. Questions concerning any of the information provided in this report or request for additional information should be addressed to MOSERS at P.O. Box 209, Jefferson City, MO 65102.

Missouri State Employees’ Retirement System • Fiscal Year 2012 27
FINANCIAL SECTION
BASIC FINANCIAL STATEMENTS
Statements of Plan Net AssetsPension Trust Funds - As of June 30, 2012
MSEP Judicial Plan Total AssetsCash and short-term investments $ 879,729,514 $ 11,473,141 $ 891,202,655
ReceivablesState contributions 10,618,866 1,095,345 11,714,211 Investment sales 8,909,852 116,199 9,026,051 Investment income receivable 37,582,532 490,139 38,072,671 Other 345,238 4,502 349,740 Total receivables 57,456,488 1,706,185 59,162,673
Investments at fair valueU.S. treasury securities 712,349,270 9,290,224 721,639,494 Corporate bonds 100,036,101 1,304,638 101,340,739 Convertible bonds 4,042,073 52,715 4,094,788 Government bonds & gov’t mortgage-backed securities 64,233,914 837,717 65,071,631 Common stock 614,462,389 8,013,615 622,476,004 Preferred stock 4,757,365 62,044 4,819,409 Limited partnerships 3,777,665,741 49,267,067 3,826,932,808 Bank loans 74,047,490 965,703 75,013,193 Collateralized mortgage obligations 132,882,346 1,733,008 134,615,354 Foreign currency 3,388,289 44,189 3,432,478 Real estate investment trust 4,948,061 64,531 5,012,592 International equities 1,153,398,626 15,042,243 1,168,440,869 U.S. dollar-denominated international corporate bonds 24,037,986 313,495 24,351,481 Total investments 6,670,249,651 86,991,189 6,757,240,840
Invested securities lending collateral 683,561,697 8,914,786 692,476,483
Capital assetsLand 263,845 3,441 267,286 Building and building improvements 3,623,261 47,253 3,670,514 Furniture, fixtures, and equipment 1,643,331 21,432 1,664,763 Software 123,021 1,604 124,625 Total capital assets 5,653,458 73,730 5,727,188 Accumulated depreciation (2,628,596) (34,281) (2,662,877)Net capital assets 3,024,862 39,449 3,064,311 Prepaid expenses and other 41,234 538 41,772 Total assets 8,294,063,446 109,125,288 8,403,188,734
LiabilitiesAdministrative expenses payable 1,652,958 21,557 1,674,515 Investment purchases payable 12,766,150 166,492 12,932,642 Securities lending collateral 681,551,456 8,888,569 690,440,025 Investment incentive fees payable 15,649,293 204,093 15,853,386 Employee vacation and overtime liability 561,280 7,320 568,600 Total liabilities 712,181,137 9,288,031 721,469,168 Net assets held in trust for pension benefits $7,581,882,309 $ 99,837,257 $7,681,719,566
See accompanying Notes to the Financial Statements.

Missouri State Employees’ Retirement System • Fiscal Year 201228
FINANCIAL SECTION
BASIC FINANCIAL STATEMENTS
Statements of Changes in Plan Net AssetsPension Trust Funds - Year Ended June 30, 2012
MSEP Judicial Plan Total AdditionsContributionsState contributions $ 263,373,924 $26,324,526 $ 289,698,450 Employee contributions 4,955,399 149,859 5,105,258 Member purchases of service credit 2,869,085 0 2,869,085 Service transfer contributions 2,675,339 0 2,675,339 Total contributions 273,873,747 26,474,385 300,348,132
Investment incomeFrom investing activity: Net appreciation in fair value of investments 173,455,684 2,262,152 175,717,836 Interest 39,312,807 512,705 39,825,512 Dividends 29,569,523 385,636 29,955,159 Swap income (loss) (18,073,497) (235,709) (18,309,206) Other 43,599,213 568,607 44,167,820 Total investing activity income 267,863,730 3,493,391 271,357,121 Investing activity expenses: Management fees (106,123,597) (1,384,029) (107,507,626) Custody fees (407,301) (5,312) (412,613) Consultant fees (892,694) (11,642) (904,336) Performance measurement fees (437,883) (5,711) (443,594) Internal investment activity expenses (3,418,037) (44,577) (3,462,614)Total investing activity expenses (111,279,512) (1,451,271) (112,730,783)Net income from investing activity 156,584,218 2,042,120 158,626,338
From securities lending activity:Securities lending income 1,833,002 23,905 1,856,907 Securities lending expenses: Borrower rebates (44,706) (583) (45,289) Management fees (270,391) (3,526) (273,917)Total securities lending activity expenses (315,097) (4,109) (319,206)Net income from securities lending activity 1,517,905 19,796 1,537,701 Total net investment income 158,102,123 2,061,916 160,164,039
Miscellaneous income 448,463 5,849 454,312 Total additions 432,424,333 28,542,150 460,966,483
DeductionsBenefits 547,548,517 26,821,412 574,369,929 BackDROP & lump sum benefits 63,973,934 0 63,973,934 Service transfer payments 588,180 0 588,180 Contribution refunds 123,709 0 123,709 Administrative expenses 7,017,057 91,514 7,108,571 Total deductions 619,251,397 26,912,926 646,164,323 Net increase (decrease) (186,827,064) 1,629,224 (185,197,840)
Net assets held in trust for pension benefits: Beginning of year 7,768,709,373 98,208,033 7,866,917,406 End of year $7,581,882,309 $99,837,257 $7,681,719,566
See accompanying Notes to the Financial Statements.

Missouri State Employees’ Retirement System • Fiscal Year 2012 29
FINANCIAL SECTION
BASIC FINANCIAL STATEMENTS
Balance SheetsInternal Service Funds - As of June 30, 2012
Life & LTD Deferred Compensation Total AssetsPremiums receivable $ 959,003 $ 0 $ 959,003 Due to (due from) (844,728) 844,728 0 Investments at fair value 3,532,260 0 3,532,260 Capital assets (net of $450 accumulated depreciation) 0 5,026 5,026 Total assets $3,646,535 $849,754 $4,496,289
Liabilities and net assetsLiabilitiesPremiums payable $3,346,314 $ 0 $3,346,314 Checks outstanding net of deposits 2,626 0 2,626 Other 356,687 0 356,687 Total liabilities 3,705,627 0 3,705,627 Unrestricted net assets (deficit) (59,092) 849,754 790,662 Total liabilities and net assets $3,646,535 $849,754 $4,496,289 See accompanying Notes to the Financial Statements.
Statements of Revenues, Expenses, and Changes in Plan Net AssetsInternal Service Funds - Year Ended June 30, 2012
Life & LTD Deferred Compensation TotalOperating revenuesPremium receipts $28,578,326 $ 0 $28,578,326 Deferred compensation receipts 0 17,500,476 17,500,476 Miscellaneous income 480,120 128,067 608,187 Total operating revenues 29,058,446 17,628,543 46,686,989
Operating expensesPremium disbursements 28,556,036 0 28,556,036 Deferred compensation disbursements 0 17,500,476 17,500,476 Premium refunds 22,291 0 22,291 Administrative expenses 433,500 345,029 778,529 Total operating expenses 29,011,827 17,845,505 46,857,332 Operating revenues over (under) operating expenses 46,619 (216,962) (170,343)
Non-operating revenuesInvestment income 11,025 43 11,068 Net revenues over (under) expenses 57,644 (216,919) (159,275)Net assets (deficit) July 1, 2011 (116,736) 1,066,673 949,937 Net assets (deficit) June 30, 2012 $ (59,092) $ 849,754 $ 790,662
See accompanying Notes to the Financial Statements.

Missouri State Employees’ Retirement System • Fiscal Year 201230
FINANCIAL SECTION
BASIC FINANCIAL STATEMENTS
Statements of Cash FlowsInternal Service Funds - Year Ended June 30, 2012
Life & LTD Deferred Compensation Total Cash flows from operating activitiesCash received from employer and members $ 29,080,711 $ 17,753,540 $ 46,834,251 Payments to outside carriers (28,430,575) (17,550,862) (45,981,437)Refunds of premiums to members (22,291) 0 (22,291)Cash payments to employees for services (87,895) (211,024) (298,919)Cash payments to other suppliers of goods and services (211,951) (237,859) (449,810)Net cash provided (used) by operating activities 327,999 (246,205) 81,794
Cash flows from noncapital financing activitiesImplicit funding of checks outstanding net of deposits 2,626 0 2,626 Implicit repayment of prior years checks outstanding net of deposits (1,540) 0 (1,540)Net cash provided by noncapital financing activities 1,086 0 1,086
Cash flows from investing activitiesPurchase of investment securities (907,278,951) (4,085,555) (911,364,506)Proceeds from sale and maturities of investment securities 906,938,841 4,336,735 911,275,576Cash received from investment income 11,025 43 11,068 Purchase of capital assets 0 (5,026) (5,026)Net cash provided (used) by investing activities (329,085) 246,197 (82,888)Net increase (decrease) in cash 0 (8) (8)Cash balances June 30, 2011 0 8 8 Cash balances June 30, 2012 $ 0 $ 0 $ 0
Reconciliation of operating revenues over (under) operating expenses to net cash provided by operating activitiesOperating revenues over (under) operating expenses $ 46,619 $ (216,962) $ (170,343)Adjustments to reconcile operating revenues over (under) operating expenses to net cash provided (used) by operating activitiesChange in assets and liabilities:Increase in operational accounts receivable 23,912 124,996 148,908 Increase (decrease) in operational accounts payable 257,468 (154,239) 103,229 Total adjustments 281,380 (29,243) 252,137 Net cash provided (used) by operating activities $ 327,999 $ (246,205) $ 81,794
See accompanying Notes to the Financial Statements.

Missouri State Employees’ Retirement System • Fiscal Year 2012 31
FINANCIAL SECTION
(1) PLAN DESCRIPTIONS AND CONTRIBUTION INFORMATION
Missouri State Employees’ Plan (MSEP)The MSEP is a single-employer, public employee retirement plan with two benefit structures known as the MSEP (closed plan) and MSEP 2000, which are administered by the Missouri State Employees’ Retirement System (MOSERS) in accordance with Sections 104.010 and 104.312 to 104.1215 of the Revised Statutes of Missouri (RSMo). As established under Section 104.320, RSMo, MOSERS is a body corporate and an instrumentality of the state. In the system are vested the powers and duties specified in Sections 104.010 and 104.312 to 104.1215, RSMo and such other powers as may be necessary or proper to enable it, its officers, employees, and agents to carry out fully and effectively all the purposes of Sections 104.010 and 104.312 to 104.1215, RSMo.
Responsibility for the operation and administration of the system is vested in the MOSERS Board of Trustees. Due to the nature of MOSERS’ reliance on funding from the state of Missouri and the overall control of the plan document by the legislative and executive branches of state government, the MSEP is considered a component unit of the state of Missouri financial reporting entity and is included in the state’s financial reports as a pension trust fund.
The board intends to follow a financing pattern which computes and requires contribution amounts which, expressed as a percent of active member payroll, will remain approximately level from year-to-year and from one generation of citizens to the next generation.
Complete recognition of the year-to-year swings in the market value of system assets would produce contribution rate changes that would run counter to the “approximately level” goal. To address that issue, a common actuarial practice referred to as asset smoothing is used. Application of that practice results in full recognition of returns at the assumed rate and recognizing any annual investment return gain or loss relative to the assumed rate over a period of five years.
At any point in time, the actuarial value of assets will be more or less than the market value but, if the smoothing method is prudent and properly constructed, those values will converge over time.
As of June 30, 2012, and 2011, the actuarial value of assets was 104% and 103%, respectively of the market value for the MSEP.
Generally, all full-time state employees hired before July 2000, who were not covered under another state-sponsored retirement plan, are eligible for membership in the MSEP (closed plan). Full-time state employees hired after July 2000, and before January 2011, are eligible for membership in the MSEP 2000. Employees hired for the first time on or after January 2011 are eligible for membership in the MSEP 2011 tier of the MSEP 2000. MOSERS participates as an employer in the MSEP and MSEP 2000.
As of the June 30, 2012 valuation, membership in the MSEP consisted of the following:Retirees and beneficiaries currently receiving benefits 37,308Terminated employees entitled to, but not yet receiving benefits 18,034
ActiveVested 35,883Nonvested 15,449 51,332
Total membership 106,674
The MSEP provides retirement, survivor, and disability benefits.
NOTES TO THE FINANCIAL STATEMENTSYear Ended June 30, 2012

Missouri State Employees’ Retirement System • Fiscal Year 201232
FINANCIAL SECTION
MSEP (closed plan)General state employees are fully vested for benefits upon receiving 5 years of credited service. Under the MSEP (closed plan), general employees may retire with full benefits upon the earliest of attaining:
• Age 65 and active with 4 years of service;
• Age 65 with 5 years of service;
• Age 60 with 15 years of service; or
• Age 48 with age and service equaling 80 or more - “Rule of 80.”
General employees may retire early at age 55 with at least 10 years of service with reduced benefits.
The base benefit in the general employee plan is equal to 1.6% multiplied by the final average pay multiplied by years of credited service.
For members hired prior to August 28, 1997, cost-of-living adjustments (COLAs) are provided annually based on 80% of the percentage increase in the average consumer price index (CPI) from one year to the next, with a minimum rate of 4% and maximum rate of 5% until the cumulative amount of COLAs equals 65% of the original benefit. Thereafter, the 4% minimum rate is eliminated. For members hired on or after August 28, 1997, COLAs are provided annually based on 80% of the percentage increase in the average CPI from one year to the next, up to a maximum rate of 5%.
Qualified, terminated-vested members may make a one-time election to receive the present value of their benefit in a lump sum payment. To qualify, a member must have terminated with at least 5, but less than 10 years of service, be less than age 60, and have a benefit present value of less than $10,000.
Contributions are determined through annual actuarial valuations. Administration of the MSEP is financed through contributions to this plan from the state of Missouri and investment earnings.
MSEP 2000 General state employees are fully vested for benefits upon receiving 5 years of credited service. Under the MSEP 2000, general employees may retire with full benefits upon the earliest of attaining:
• Age 62 with 5 years of service; or
• Age 48 with age and service equaling 80 or more - “Rule of 80.”
General employees may retire early at age 57 with at least 5 years of service with reduced benefits.
The base benefit in the general employee plan is equal to 1.7% multiplied by final average pay multiplied by years of credited service.
For those retiring under “Rule of 80,” an additional temporary benefit equivalent to 0.8% multiplied by final average pay multiplied by years of credited service is payable until age 62.
COLAs are provided annually based on 80% of the percentage increase in the average CPI from one year to the next, up to a maximum rate of 5%.
Contributions are determined through annual actuarial valuations. Administration of the MSEP 2000 is financed through contributions to this plan from the state of Missouri and investment earnings.
The state of Missouri is required to make all contributions to the MSEP. Prior to September 1, 1972, contributions by members were required. Accumulated employee contributions made prior to that time, plus interest through August 28, 1997, are refundable to the member or designated beneficiaries upon request.

Missouri State Employees’ Retirement System • Fiscal Year 2012 33
FINANCIAL SECTION
For a more detailed summary of benefits for general employees and a description of benefits available to legislators and elected officials under the MSEP (closed plan) and the MSEP 2000, refer to the Summary of Plan Provisions contained in the Actuarial Section of this report.
MSEP 2011 TierOn July 19, 2010, a new tier defined benefit plan was signed into law for members of the Missouri State Employees’ Retirement System (MOSERS) and the MoDOT and Patrol Employees’ Retirement System (MPERS). This tier (MSEP 2011) includes all new employees first hired on or after January 1, 2011.
Under the MSEP 2011, general employees may retire with full benefits upon the earliest of attaining:
• Age 67 with 10 years of service; or
• Age 55 with age and service equaling 90 or more - “Rule of 90.”
General employees may retire early at age 62 with at least 10 years of service with reduced benefits.
The base benefit in the general employee plan is equal to 1.7% multiplied by final average pay multiplied by years of credited service.
For those retiring under “Rule of 90,” an additional temporary benefit equivalent to 0.8% multiplied by final average pay multiplied by years of credited service is payable until age 62.
COLAs are provided annually based on 80% of the percentage increase in the average CPI from one year to the next, up to a maximum rate of 5%.
Member contributions are 4% of pay. Employer contributions are determined through annual actuarial valuations. Administration of the MSEP 2000 is financed through contributions to this plan from the member, state of Missouri, and investment earnings.
For a more detailed summary of benefits for general employees and a description of benefits available to legislators and elected officials under the MSEP 2011 tier, refer to the Summary of Plan Provisions contained in the Actuarial Section of this report.
The MSEP 2011 does not impact employees employed by the state prior to January 1, 2011.
Service Transfer ContributionsOn July 8, 2011, HB 282 was enacted which allowed MOSERS and MPERS to transfer funds between the two systems in connection with service credit transfers occurring on or after September 1, 2011. The legislation also included provisions that made any full-time employee of the Missouri Development Finance Board (MDFB) who is employed on or after September 1, 2011, a state employee and member of MOSERS. Provisions further allowed MDFB employees to purchase credited service toward retirement based on their employment with MDFB prior to September 1, 2011.
Judicial Plan The Judicial Plan is a single-employer, public employee retirement plan administered in accordance with Sections 476.445 to 476.690, RSMo. Responsibility for the operation and administration of the Judicial Plan is vested in the MOSERS Board of Trustees. Due to the nature of MOSERS’ reliance on funding from the state of Missouri and the overall control of the plan document by the legislative and executive branches of state government, the Judicial Plan is considered a component unit of the state of Missouri financial reporting entity and is included in the state’s financial reports as a pension trust fund.
Judges and commissioners of the supreme court or the court of appeals, judges of the circuit court, probate court, magistrate court, court of common pleas, court of criminal corrections, justices of the peace, or commissioners or deputy

Missouri State Employees’ Retirement System • Fiscal Year 201234
FINANCIAL SECTION
commissioners of the circuit court appointed after February 29, 1972, commissioners of the juvenile division of the circuit court appointed pursuant to Section 211.023, RSMo, commissioners of the drug court pursuant to Section 478.466, RSMo, or commissioners of the family court are eligible for membership in the Judicial Plan.
As of the June 30, 2012, valuation membership in the Judicial Plan consisted of the following:Retirees and beneficiaries currently receiving benefits 488Terminated employees entitled to, but not yet receiving benefits 41
ActiveVested 398Nonvested 0 398
Total membership 927
The Judicial Plan provides retirement, survivor, and disability benefits. Members are immediately eligible for benefits.
Under the Judicial Plan, members may retire with full benefits upon the earliest of attaining:
• Age 62 with 12 years of service;
• Age 60 with 15 years of service; or
• Age 55 with 20 years of service.
Employees may retire early at age 62 with less than 12 years of service or age 60 with less than 15 years of service with a reduced benefit that is based upon years of service relative to 12 or 15 years.
In the Judicial Plan, the base benefit for members with 12 or more years of service is equivalent to 50% of compensation on the highest court served.
For members hired prior to August 28, 1997, COLAs are provided annually based on 80% of the percentage increase in the average CPI from one year to the next, with a minimum rate of 4% and maximum rate of 5% until the cumulative amount of COLAs equals 65% of the original benefit. Thereafter, the 4% minimum rate is eliminated. For members hired on or after August 28, 1997, COLAs are provided annually based on 80% of the percentage increase in the average CPI from one year to the next, up to a maximum rate of 5%.
Qualified, terminated-vested members may make a one-time election to receive the present value of their benefit in a lump sum payment. To qualify, a member must have terminated with at least 5, but less than 10 years of service, be less than age 60, and have a benefit present value of less than $10,000.
Funding of the Judicial Plan on an actuarial basis began on July 1, 1998. Contributions are determined through annual actuarial valuations. The state of Missouri is required to make all contributions to the Judicial Plan. Administration of the Judicial Plan is financed through contributions to this plan from the state of Missouri and investment earnings.
Judicial 2011 TierOn July 19, 2010, a new tier defined benefit plan was signed into law for members of the Judicial Plan. This tier (Judicial Plan 2011) includes all new judicial members first hired on or after January 1, 2011.
Under the Judicial Plan 2011, members may retire with full benefits upon the earliest of attaining:
• Age 67 with 12 years of service; or
• Age 62 with 20 years of service; or
Judicial members may retire early at age 67 with less than 12 years of service with reduced benefits; or age 62 with less than 20 years of service with a reduced benefit based on years of service.

Missouri State Employees’ Retirement System • Fiscal Year 2012 35
FINANCIAL SECTION
In July 2012, the board voted to reduce the nominal investment return assumption from 8.5% to 8% and to adopt assumptions for wage inflation and price inflation of 3% and 2.5%, respectively. See the Actuarial Section for detail in change in assumptions.
In the Judicial Plan, the base benefit for members with 12 or more years of service is equivalent to 50% of compensation on the highest court served. For a more detailed summary of benefits for members of the Judicial Plan, refer to the Summary of Plan Provisions contained in the Actuarial Section of this report.
Multi-year trend information related to the table above demonstrates whether the actuarial value of plan assets are increasing or decreasing over time relative to the actuarial accrued liabilities for benefits can be found in the required supplementary information following the Notes to the Financial Statements.
Missouri State Insured Defined Benefit Insurance PlanThe Missouri State Insured Defined Benefit Insurance Plan is accounted for as an internal service fund of the state of Missouri and is administered by MOSERS. It provides basic life insurance in an amount equal to one times annual salary while actively employed (with a $15,000 minimum) to eligible members of the MSEP, MSEP 2000 (except employees of the Missouri Department of Conservation and certain state colleges and universities), MSEP 2011, Judicial Plan, and certain members of the Public School Retirement System.
The plan also provides duty-related death benefits, optional life insurance for active employees and retirees who are eligible for basic coverage, and a long-term disability plan for certain eligible members. For a more detailed description of insurance benefits, refer to the Summary of Plan Provisions - Life Insurance Plans in the Actuarial Section of this report.
Due to the nature of MOSERS’ reliance on funding from the state of Missouri and the overall control of the plan document by the legislative and executive branches of state government, the Missouri State Insured Defined Benefit Insurance Plan is considered a component unit of the state of Missouri financial reporting entity and is included in the state’s financial reports as an internal service fund. Administration of the Missouri State Insured Defined Benefit Insurance Plan is financed through contributions to this plan from the state of Missouri.
Schedule of Funded Status
ActuarialValuation
Date
ActuarialValue of Assets
(a)
ActuarialAccrued Liability
(AAL) Entry Age
(b)
Unfunded AAL(UAAL)
(b-a)
PercentFunded
(a/b)
AnnualCoveredPayroll
(c)
UAALPercentageof Covered
Payroll((b-a)/c)
MSEP 06/30/2012 $7,897,167,203 $10,793,651,577 $2,896,484,374 73.2% $1,864,069,493 155.4% Judges 06/30/2012 102,266,706 413,332,538 311,065,832 24.7 45,835,501 678.7
MSEP Judicial PlanValuation date 6/30/2012 6/30/2012Actuarial cost method Entry age Entry ageAmortization method Level percent Level percentRemaining amortization period 30 years open 30 years openAsset valuation method 5-year smoothed market +/- 20% market corridor 5-year smoothed market +/- 20% market corridor
Actuarial assumptions:Investment rate of return 8.00% 8.00%Projected salary increases 3.2-5.9% 3.0-5.2%COLAs 4%* 4%**Price inflation 2.50% 2.50%* On a compound basis, 4% for the first 12 years, 3.06% for the 13th year, and 2.0% per year thereafter.** On a compound basis, 4% for the first 12 years, 3.06% for the 13th year, and 2.0% per year thereafter.

Missouri State Employees’ Retirement System • Fiscal Year 201236
FINANCIAL SECTION
State of Missouri’s Deferred Compensation PlanThe State of Missouri’s Deferred Compensation Plan is accounted for as an internal service fund and is administered by MOSERS.
The record keeping of individual accounts and the management of investment options are handled by external providers and paid from charges to the participants and investment option reimbursement arrangements. Participants in the plan manage individual accounts by choosing investment options from the available fund line-up. MOSERS’ role is to oversee the plan, choose external providers and investment options, and develop communication to plan participants. The State of Missouri Deferred Compensation Plan receives reimbursements from the plan’s investment option managers which are used to cover plan administration costs and a portion of participant fees. The table above illustrates actual participant charges and funds collected from investment option reimbursements under the plan record keepers during the past fiscal year.
On November 10, 2011, participant account records in the deferred compensation plan were transitioned from ING Retirement Plans (ING) to ICMA-RC. This transition to the new record keeper led to a number of plan improvements including, but not limited to, lower fees for plan participants and the addition of a Roth 457 savings option.
Due to legislation passed during the 2011 session of the Missouri State Legislature, automatic enrollment of new permanent full-time and part-time employees at 1% of pay into the State of Missouri Deferred Compensation Plan became effective July 1, 2012.
Audited financial statements for the State of Missouri Deferred Compensation Plan can be viewed on MOSERS website at www.mosers.org.
Prospective Deferred Compensation Plan Changes As of July 31, 2012, the MOSERS trust will be converted to a master trust and unitized to provide participants in the State of Missouri Deferred Compensation 457(b) Plan for public employees and the State of Missouri Deferred Compensation Incentive 401(a) Plan for public employees with an opportunity to invest in MOSERS’ investment portfolio (MIP).
(2) SUMMARY OF SIGNIFICANT ACCOUNTING POLICIES AND PLAN ASSET MATTERS
Basis of AccountingThe financial statements of the MSEP, the Judicial Plan, the Missouri State Insured Defined Benefit Insurance Plan and state of Missouri’s Deferred Compensation Plan were prepared using the accrual basis of accounting.
Contributions are recognized as revenues when due, pursuant to statutory requirements. Benefits and refunds are recognized when due and payable and expenses are recorded when the corresponding liabilities are incurred, regardless of when contributions are received or payment is made. The direct method of reporting cash flows is used.
EstimatesThe preparation of financial statements in conformity with accounting principles generally accepted in the U.S. requires management to make estimates and assumptions that affect the reported amounts of net assets held in trust for pension benefits at June 30, 2012. Actual results could differ from those estimates.
Investment Option Reimbursements
Employee ChargesInvestment OptionReimbursements Total
ING $ 600,391 $ 572,719 $1,173,110ICMA-RC 427,073 1,047,939 1,475,012Total $1,027,464 $1,620,658 $2,648,122

Missouri State Employees’ Retirement System • Fiscal Year 2012 37
FINANCIAL SECTION
Aggregate Book and Bank Balances
Cash Balances
Book Bank/Investment CustodianPension Trust Funds - investment custodian $(41,902,633) $(41,902,633) Pension Trust Funds - demand deposits (9,825,971) 27,497 Internal Service Fund - insurance plan demand deposits 2,626 73 Internal Service Fund - deferred compensation plan 0 0
Method Used to Value InvestmentsSection 104.440, RSMo allows the board of trustees to invest the trust fund assets in accordance with the prudent person rule. Investments of the pension trust funds and the internal service funds are reported on the basis of fair market value. The schedule on page 43 provides a summary of the fair values of the investments as reported on the Statements of Plan Net Assets of the pension trust funds and balance sheet of the internal service funds. Fair values for the equity real estate investments are based on appraisals. Fair values of the limited partnership investments are based on valuations of the underlying companies of the limited partnerships as reported by the general partner. Certain limited partnerships reflect values on a quarter lag basis due to the nature of those investments and the time it takes to value them. Fair value of the commingled funds is determined based on the underlying asset values. The remaining assets are primarily valued by the investment custodian using the last trade price information supplied by various pricing data vendors.
Cash
Custodial credit risk for cash deposits and investments is the risk that, in the event of a bank failure, the system and plan deposits may not be returned to them. The board adopted the following policy on June 18, 2009:
The executive director shall require that banks managing demand deposit accounts for any retirement plan associated with MOSERS (MOSERS’ defined benefit plan and the deferred compensation plan/state incentive compensation plan) to hold, at minimum, collateral security in either MOSERS’ name or the state of Missouri Deferred Compensation Plan and in an amount equal to or more than the amount on deposit that exceeds the Federal Deposit Insurance Corporation (FDIC) insured amount. The types of collateral security shall be included on a list maintained by the State Treasurer’s office in accordance with Section 30.270 RSMo, but in no case may a bank pledge collateral that does not specifically allow MOSERS to release the collateral or pledge collateral that represents securities of the pledging banks.
Cash balances represent both demand deposit accounts held at the bank and investment cash on deposit with the investment custodian. To maximize investment income, the float caused by outstanding checks is invested in an internally managed short-term investment account, thus causing a possible negative book balance. Negative book balances are reflected in the liabilities section of the balance sheet of the internal service fund and included in the cash and short-term investments on the Statements of Plan Net Assets of the pension trust funds.
The table at the bottom of this page is a schedule of the aggregate book and bank balances of all cash accounts.
Effective July 1, 2009, a repurchase agreement was amended to remove the bank’s right to substitute other appropriate securities under this agreement. Central Trust Bank pledged the following securities to MOSERS on June 30, 2012, as collateral for overnight repurchase agreements:
• $2,539,902 Small Business Administration Pool #509077 | maturity date - 06/25/2019 / fair value - $2,722,089
• $2,782,326 Small Business Administration Pool #521710 | maturity date - 10/25/2022 / fair value - $3,060,697
• $2,963,427 Small Business Administration Pool #508195 | maturity date - 08/25/2032 / fair value - $3,217,393
• $3,131,831 Small Business Administration Pool #508851 | maturity date - 05/25/2035 / fair value - $3,408,716
• $3,974,224 Small Business Administration Pool #509193 | maturity date - 04/25/2037 / fair value - $4,469,478

Missouri State Employees’ Retirement System • Fiscal Year 201238
FINANCIAL SECTION
Credit Risk Credit risk is the risk that an issuer or other counterparty to an investment will not fulfill its obligations to MOSERS. As of June 30, 2012, MOSERS’ fixed income assets that are not government guaranteed represented 54% of the fixed income portfolio. In preparing this report, credit risk associated with all fixed income holdings including collateral for repurchase agreements and securities lending collateral has been included. The tables below summarize MOSERS’ fixed income portfolio credit quality, exposure levels, and market value of credit rating levels.
As a matter of practice, there are no overarching limitations for credit risk exposures within the overall fixed income portfolio. Each individual portfolio within fixed income is managed in accordance with operational guidelines that are specific as to permissible credit quality ranges, exposure levels within individual quality tiers, and average credit quality. MOSERS is notified by the investment manager when an investment with a quality rating of CC or lower is purchased and in those circumstances of downgrades subsequent to purchase, in which case the investment manager has been given permission to hold the security, usually due to mitigating circumstances such as a very short maturity or a much higher rating from one of the other ratings agencies but may include situations in which the investment manager believes that worst case recovery values exceed market pricing.
Credit risk for derivative instruments held by the system results from counterparty risk assumed by MOSERS. This is essentially the risk that the counterparty to a MOSERS transaction will be unable to meet its obligation. Information regarding MOSERS’ credit risk related to derivatives is found under the derivatives disclosures on pages 41-42 of these notes.
Policies related to credit risk pertaining to MOSERS’ securities lending program are found under the securities lending disclosures found on page 42 of these notes.
Average Credit Quality and Exposure Levels of Nongovernment Guaranteed Securities
Fixed Income Security TypeMarket ValueJune 30, 2012
Percent of all FixedIncome Assets
Weighted AverageCredit Quality
Ratings DispersionRequiring Further Disclosure
Collateralized mortgage obligations $ 63,409,498 2.3% CCC See table belowNon-U.S. sovereign 75,354,805 2.8 BBB+ See table belowAsset backed securities 25,471,449 0.9 A See table belowCorporate bonds 214,527,551 7.9 A- See table belowBank loans 75,591,386 2.8 B+ See table belowBank deposits 275,068,752 10.1 FDIC Insured NoneRepurchase agreements 645,004,766 23.8 Not Rated NonePooled investments 90,596,562 3.3 AAA NoneTotal nongov’t guaranteed securities $1,465,024,769 53.9%Total fixed income securities $2,715,630,412
Ratings Dispersion Detail - Market Value
Credit Rating Level
CollateralizedMortgage
ObligationsNon-U.S.Sovereign
Asset-BackedSecurities
CorporateBonds Bank Loans
Pooled Investments
Agency $ 1,629,128 $15,102,324 $ 83,772,946AAA $ 1,292,072 $90,596,562AA 15,693,534 A 786,036 25,682,389 2,194,534 25,676,028 BBB 191,331 37,928,797 7,940,817 $ 879,869 BB 403,209 10,096,507 972,753 24,453,087 27,175,259 B 8,166,230 249,562 1,449,248 40,691,555 44,056,541 CCC 26,915,616 3,836,714 14,191,309 1,286,489 CC 9,608,697 1,915,876 C 9,147,237 931,483 D 6,562,014 Not Rated 105,478 1,176,792 2,193,228
$63,409,498 $75,354,805 $25,471,449 $214,527,551 $75,591,386 $90,596,562
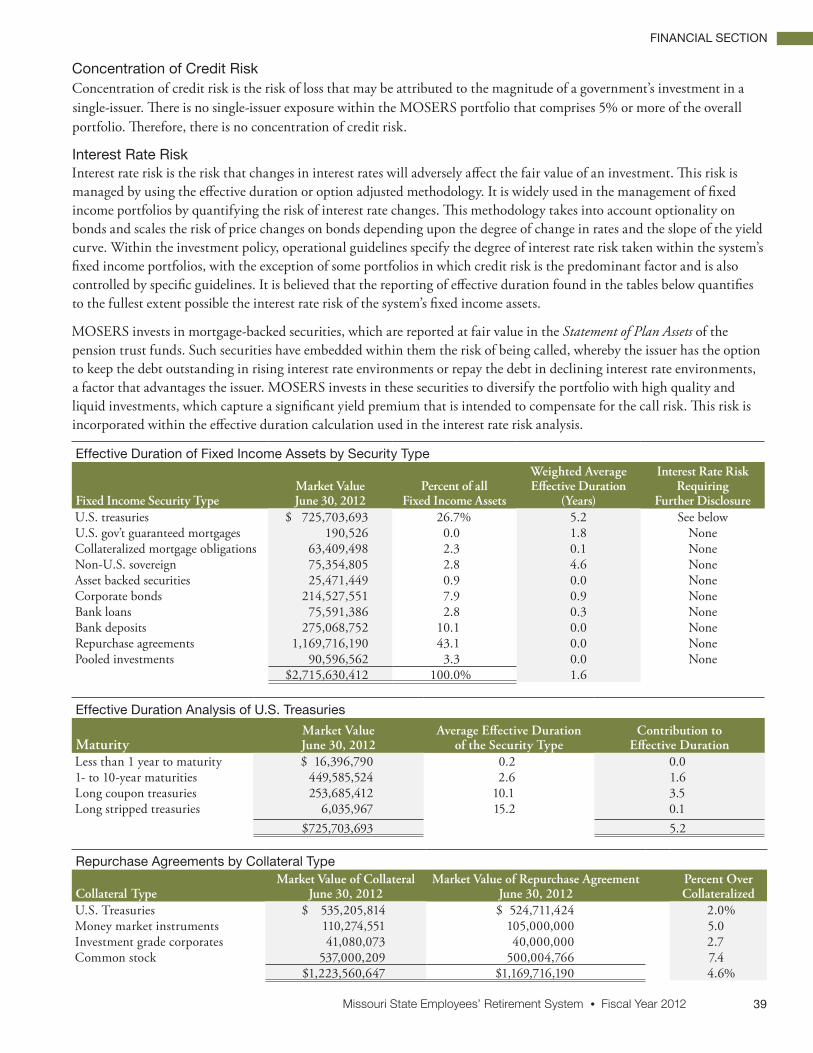
Missouri State Employees’ Retirement System • Fiscal Year 2012 39
FINANCIAL SECTION
Effective Duration Analysis of U.S. Treasuries
MaturityMarket ValueJune 30, 2012
Average Effective Durationof the Security Type
Contribution toEffective Duration
Less than 1 year to maturity $ 16,396,790 0.2 0.0 1- to 10-year maturities 449,585,524 2.6 1.6 Long coupon treasuries 253,685,412 10.1 3.5 Long stripped treasuries 6,035,967 15.2 0.1
$725,703,693 5.2
Effective Duration of Fixed Income Assets by Security Type
Fixed Income Security TypeMarket ValueJune 30, 2012
Percent of allFixed Income Assets
Weighted AverageEffective Duration
(Years)
Interest Rate Risk Requiring
Further DisclosureU.S. treasuries $ 725,703,693 26.7% 5.2 See belowU.S. gov’t guaranteed mortgages 190,526 0.0 1.8 NoneCollateralized mortgage obligations 63,409,498 2.3 0.1 NoneNon-U.S. sovereign 75,354,805 2.8 4.6 NoneAsset backed securities 25,471,449 0.9 0.0 NoneCorporate bonds 214,527,551 7.9 0.9 NoneBank loans 75,591,386 2.8 0.3 NoneBank deposits 275,068,752 10.1 0.0 NoneRepurchase agreements 1,169,716,190 43.1 0.0 NonePooled investments 90,596,562 3.3 0.0 None
$2,715,630,412 100.0% 1.6
Repurchase Agreements by Collateral Type
Collateral TypeMarket Value of Collateral
June 30, 2012Market Value of Repurchase Agreement
June 30, 2012Percent OverCollateralized
U.S. Treasuries $ 535,205,814 $ 524,711,424 2.0%Money market instruments 110,274,551 105,000,000 5.0Investment grade corporates 41,080,073 40,000,000 2.7Common stock 537,000,209 500,004,766 7.4
$1,223,560,647 $1,169,716,190 4.6%
Concentration of Credit RiskConcentration of credit risk is the risk of loss that may be attributed to the magnitude of a government’s investment in a single-issuer. There is no single-issuer exposure within the MOSERS portfolio that comprises 5% or more of the overall portfolio. Therefore, there is no concentration of credit risk.
Interest Rate RiskInterest rate risk is the risk that changes in interest rates will adversely affect the fair value of an investment. This risk is managed by using the effective duration or option adjusted methodology. It is widely used in the management of fixed income portfolios by quantifying the risk of interest rate changes. This methodology takes into account optionality on bonds and scales the risk of price changes on bonds depending upon the degree of change in rates and the slope of the yield curve. Within the investment policy, operational guidelines specify the degree of interest rate risk taken within the system’s fixed income portfolios, with the exception of some portfolios in which credit risk is the predominant factor and is also controlled by specific guidelines. It is believed that the reporting of effective duration found in the tables below quantifies to the fullest extent possible the interest rate risk of the system’s fixed income assets.
MOSERS invests in mortgage-backed securities, which are reported at fair value in the Statement of Plan Assets of the pension trust funds. Such securities have embedded within them the risk of being called, whereby the issuer has the option to keep the debt outstanding in rising interest rate environments or repay the debt in declining interest rate environments, a factor that advantages the issuer. MOSERS invests in these securities to diversify the portfolio with high quality and liquid investments, which capture a significant yield premium that is intended to compensate for the call risk. This risk is incorporated within the effective duration calculation used in the interest rate risk analysis.

Missouri State Employees’ Retirement System • Fiscal Year 201240
FINANCIAL SECTION
Repurchase AgreementsRepurchase agreements (repos) are a secured loan with the collateral held at a custodian bank. Typical collateral for repos include treasury securities, agency securities, mortgage-backed securities, investment grade corporate bonds, commercial paper, and common stock. Repos are typically done for an overnight term; however, they can be done for a longer term. MOSERS enters into repo transactions to earn interest on short-term funds.
Foreign Currency RiskForeign currency risk is the risk that changes in exchange rates will adversely impact the fair value of an investment. MOSERS’ currency risk exposures, or exchange rate risk, primarily reside within MOSERS’ international equity investment holdings. MOSERS’ implementation policy is to allow external managers to decide what action to take regarding their respective portfolio’s foreign currency exposures using currency forward contracts. MOSERS’ exposure to foreign currency risk in U.S. dollars as of June 30, 2012, is highlighted in the table below:
Currency Exposures by Asset Class
Currency Cash & Cash Equivalents Equities Fixed Income Alternatives TotalArgentine Peso $ 2 $ 178,337 $ 178,339 Australian Dollar 6,909,563 6,909,563 Brazilian Real $ 35,163 33,445,155 8,509,123 41,989,441 Canadian Dollar 24,254 15,109 39,363 Chilean Peso 1,502 2,662,556 105,873 2,769,931 Chinese Renminbi 19,497 1,351,177 1,370,674 Colombian Peso 1,447,015 4,540,809 5,987,824 Czech Koruna 2,611,715 2,611,715 Danish Krone 3,561,601 3,561,601 Egyptian Pound 2,709,014 2,709,014 Euro 117,744 147,974,108 6,491,953 $80,531,194 235,114,999 Hong Kong Dollar 83,193 69,683,759 69,766,952 Hungarian Forint 805,199 1,853,401 2,658,600 Indian Rupee 114,654 17,336,446 17,451,100 Indonesian Rupiah 94,502 11,472,650 5,657,381 17,224,533 Israeli Shekel 8 8 Japanese Yen 3,516,715 333,982,133 337,498,848 Malaysian Ringgit 7,384,319 8,453,972 15,838,291 Mexican Peso 229,074 15,328,398 7,884,008 23,441,480 Moroccan Dirham 276,633 276,633 Nigerian Naira 57,092 57,092 Norwegian Krone 3,972,743 3,972,743 Peruvian New Sol 95,691 385,386 481,077 Philippine Peso 8,984 3,251,720 3,260,704 Polish Zloty (4,464) 4,566,210 7,893,072 12,454,818 Russian Ruble 906,676 5,078,007 5,984,683 Singapore Dollar 27,267,624 27,267,624 South African Rand 7,056 17,293,527 8,900,088 26,200,671 South Korean Won 4,443 42,012,419 2,033,049 44,049,911 Sri Lankan Rupee 833 112,560 113,393 Swedish Krona 1,554,954 1,554,954 Swiss Franc 87 89,909,867 89,909,954 Taiwan New Dollar 35 33,977,522 33,977,557 Thai Baht (62,981) 18,255,393 4,280,460 22,472,872 Turkish Lira 38,302 9,165,135 8,261,950 17,465,387 Ukranian Hryvnia 58 58 British Pound Sterling 6,087 68,959,013 2,236,237 71,201,337 Venezuelan Bolivar 53,623 53,623Total $4,288,303 $980,314,764 $82,743,106 $80,531,194 $1,147,877,367

Missouri State Employees’ Retirement System • Fiscal Year 2012 41
FINANCIAL SECTION
DerivativesDerivative instruments are financial contracts whose values depend on the values of one or more underlying assets, reference rates, or financial indexes. They include futures contracts, swap contracts, options contracts, and forward foreign currency exchange. The tables below summarize the various contracts in the portfolio as of June 30, 2012.
Futures Contracts
Futures Contract 2012 Expiration Date Long/Short Notional/Fair Value Exposure U.S. Long Treasury Bond September Long $ 29,889,688 $ (371,375)U.S. 10-year Treasury Notes September Long 226,737,500 (924,766)U.S. 2-year Treasury Notes September Long 234,499,688 (32,984)U.S. Ultra Bond September Long 59,062,688 (1,004,531)S&P 500 EMini Index September Long 546,086,640 13,688,400 S&P 500 EMini Index September Long 9,698,260 100,265 Gold 100 Oz August Long 25,667,200 860,800 Total $1,131,641,664 $12,315,809
Foreign Currency Forward Contracts at June 30, 2012
Currency Net Notional Long/(Short) ExposureBrazilian Real $ 715,886 $ 11,737 Columbian Peso (952,690) (2,226)Euro (118,724,434) (262,982)British Pound Sterling (2,154,188) 34,304 Hong Kong Dollar (57,476) (13)Japanese Yen 19,942,258 (145,410)Philippine Peso 163,230 5,636 Polish Zloty 519,382 6,258 Russian Ruble 2,554,650 (148,292)U.S. Dollar 97,492,394 0 Foreign currency forward contract asset (liability) $ (500,988) $(500,988)
Swap Contracts
MOSERS ReceivesMaturity
DateNotional
Value ExposureIndex
Counterparty
Counterparty Credit Rating*
S&P 100 Total Return 03/28/2013 $ 234,099,204 $ (4,911,244) Barclays Bank A2/A+S&P 500 Financials 10/31/2012 49,104,628 (2,349,951) Goldman Sachs A3/A-S&P 500 Consumer Discretionary Total Return 01/31/2013 (60,331,661) (1,127,820) Goldman Sachs A3/A-Dow Jones U.S. Select REIT Total Return 08/09/2012 95,175,569 800,260 Goldman Sachs A3/A-S&P GSCI Total Return 09/28/2012 84,064,195 989,200 Goldman Sachs A3/A-S&P GSCI Total Return 09/28/2012 83,862,971 983,457 Goldman Sachs A3/A-S&P 100 Technology Total Return 10/31/2012 95,491,811 (4,551,637) JP Morgan Chase Aa3/A+S&P 100 Consumer Staples Total Return 10/31/2012 95,909,506 2,884,950 JP Morgan Chase Aa3/A+S&P 100 Health Care Total Return 10/31/2012 97,676,993 3,493,673 JP Morgan Chase Aa3/A+S&P 100 Energy Total Return 10/31/2012 81,761,905 (3,075,237) JP Morgan Chase Aa3/A+MSCI EAFE Total Return 08/31/2012 56,347,092 3,691,739 Deutsche Bank A2/A+MSCI EAFE ex-Japan Total Return 08/27/2012 120,363,782 6,317,956 Deutsche Bank A2/A+MSCI EAFE ex-Japan Total Return 09/17/2012 92,942,472 2,984,558 Deutsche Bank A2/A+MSCI EAFE ex-Japan Total Return 08/31/2012 113,786,303 7,979,331 Deutsche Bank A2/A+Three Month LIBOR Quarterly 12/10/2014 (10,000,000) (508,093) Deutsche Bank A2/A+Three Month LIBOR Quarterly 06/16/2014 (10,000,000) (290,273) Deutsche Bank A2/A+Total $1,220,254,770 $13,310,869
* Ratings obtained from Moody’s/S&P

Missouri State Employees’ Retirement System • Fiscal Year 201242
FINANCIAL SECTION
While the board has no formal policy specific to derivatives, the MOSERS investment implementation program, through its external managers, holds investments in futures contracts, swap contracts, and forward foreign currency exchange. MOSERS enters into these certain derivative instruments primarily to enhance the performance and reduce the volatility of its portfolio. It enters swaps and futures contracts to gain or hedge exposure to certain markets and to manage interest rate risk and enters into forward foreign exchange contracts primarily to hedge foreign currency exposure.
The notional values associated with these derivative instruments are generally not recorded on the financial statements; however, the amounts for the exposure on these instruments are recorded in the Statement of Net Plan Assets and the total changes in fair value for the year are included as investment income in the Statement of Changes in Plan Net Assets. For the year ending June 30, 2012, the change in fair value in the swap contracts resulted in a loss of $18.3 million of investment income. The change in fair value in the future contracts resulted in $119.4 million of investment income and the change in fair value of the foreign exchange contracts resulted in $9.5 million of investment income. MOSERS does not anticipate additional significant market risk from the swap arrangements.
MOSERS could be exposed to risk if the counterparties to the contracts are unable to meet the terms of the contracts. MOSERS’ investment managers seek to control this risk through counterparty credit evaluations and approvals, counterparty credit limits, and exposure monitoring procedures. MOSERS anticipates that the counterparties will be able to satisfy their obligations under the contracts. Investments in limited partnerships and commingled funds may include derivatives that are not shown in the derivative totals.
Securities Lending ProgramThe board of trustees’ investment policy permits the pension trust funds to participate in a securities lending program. Fixed income, international equity, and domestic equity securities of the pension trust funds are loaned to participating brokers who provide collateral in the form of cash, U.S. Treasury or government agency securities, or letters of credit issued by approved banks. Collateral must be provided in the amount of 102% of market value for domestic loans and 105% of market value for international loans. MOSERS does not have the authority to pledge or sell collateral securities without borrower default. Securities on loan at fiscal year end for cash collateral and on loan for noncash collateral are presented in the schedule on the following page. On June 30, 2012, MOSERS had no credit risk exposure to borrowers because the collateral amounts received exceeded amounts out on loan.
As of June 30, 2012, Deutsche Bank AG, New York Branch, served as the agent for the fixed income, domestic equity and international equity securities lending programs. In this capacity, MOSERS reduces credit risk by allowing Deutsche Bank to lend these securities to a diverse group of dealers on behalf of MOSERS. Indemnification against dealer default is provided by Deutsche Bank AG, an “A-rated” bank. With each of MOSERS’ securities lending programs, a majority of loans are open loans and can be terminated on demand by either MOSERS or the borrower. Net income from the three lending programs is split on a 90/10 basis between MOSERS and Deutsche Bank respectively.
Daily monitoring of securities that are on loan ensures proper collateralization levels and mitigates counterparty risk. Cash collateral from all three programs is commingled and invested in a separately managed short-term investment account for MOSERS. This cash collateral account is managed by Deutsche Bank. On June 30, 2012, the cash collateral account had a market value of $692,476,483 and a weighted average maturity of 1 day. For all of the securities lending operational services, the custodian is paid an annual fee, which is netted out against MOSERS’ earnings in the securities lending programs managed by Deutsche Bank.

Missouri State Employees’ Retirement System • Fiscal Year 2012 43
FINANCIAL SECTION
Investments as of June 30, 2012
Pension Trust Funds Internal Service FundsInvestmentsat Cost Value
Investmentsat Fair Value
Investmentsat Cost Value
Investmentsat Fair Value
Common stocks Out on loan $ 89,113,941 $ 127,301,450 Not on securities loan 466,656,042 495,174,554 Total 555,769,983 622,476,004 Real estate investment trusts Out on loan 993,678 1,169,628 Not on securities loan 3,674,636 3,842,964 Total 4,668,314 5,012,592 International equities Out on loan 67,115,437 68,525,850 Not on securities loan 699,248,734 1,099,915,019 Total 766,364,171 1,168,440,869 International corporate bonds Out on loan 2,663,804 2,570,081 Not on securities loan 45,787,461 21,781,400 Total 48,451,265 24,351,481 Preferred stocks Out on loan 3,358,883 2,220,066 Not on securities loan 2,979,751 2,599,343 Total 6,338,634 4,819,409 Treasury bonds, notes and bills Out on loan 395,055,837 462,617,957 Not on securities loan 227,862,873 259,021,537 Total 622,918,710 721,639,494 Corporate bonds Out on loan 11,275,921 11,262,389 Not on securities loan 104,754,886 106,694,328 Total 116,030,807 117,956,717 Convertible bonds Out on loan 128,228 113,163 Not on securities loan 4,342,555 3,981,625 Total 4,470,783 4,094,788 Government bonds and gov’t mortgage-backed securities 67,897,364 65,071,631 Repurchase agreements 9,887,144 9,887,144 $3,532,260 $3,532,260 Short-term investment funds 1,608,879,642 1,608,879,642 Collateralized mortgage obligations 131,376,607 134,615,354 Foreign currencies 4,028,124 3,432,478 Limited partnerships 2,899,946,070 3,826,932,808Bank Loans 75,022,981 75,013,193
Total Investments Out on loan 569,705,729 675,780,584 Not on securities loan 6,352,344,870 7,716,843,020 3,532,260 3,532,260 Total $6,922,050,599 $8,392,623,604 $3,532,260 $3,532,260
Reconciliation to investments on Statements of Plan Net Assets
Total from above $8,392,623,604 Less short-term investments Repurchase agreements (9,887,144) Short-term investment funds (933,019,137)Less invested securities lending collateral Short-term investment funds (675,860,505) Corporate bonds (16,615,978)Investments on Statements of Plan Net Assets $6,757,240,840
Due to space limitations and printing costs, a detailed listing of the investment holdings and transactions could not be provided in this annual report; however, the detailed reports are available for review as an appendix to this report at the MOSERS office.
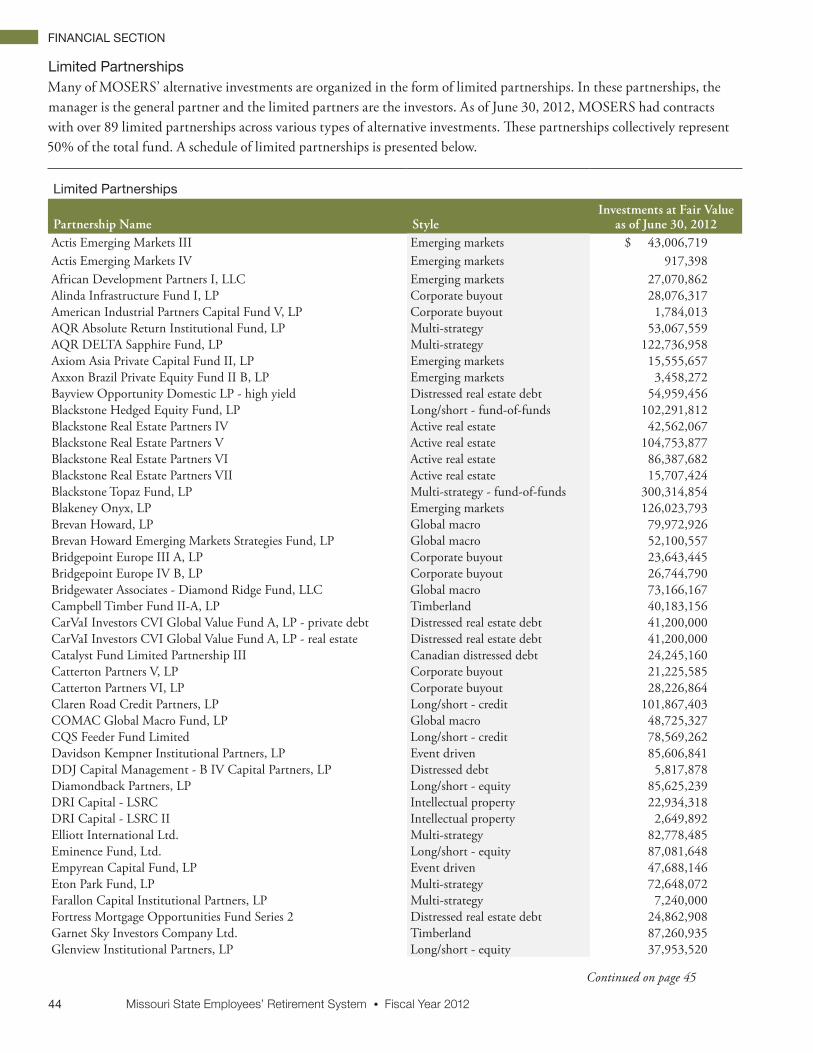
Missouri State Employees’ Retirement System • Fiscal Year 201244
FINANCIAL SECTION
Limited Partnerships
Partnership Name StyleInvestments at Fair Value
as of June 30, 2012Actis Emerging Markets III Emerging markets $ 43,006,719Actis Emerging Markets IV Emerging markets 917,398 African Development Partners I, LLC Emerging markets 27,070,862 Alinda Infrastructure Fund I, LP Corporate buyout 28,076,317 American Industrial Partners Capital Fund V, LP Corporate buyout 1,784,013 AQR Absolute Return Institutional Fund, LP Multi-strategy 53,067,559 AQR DELTA Sapphire Fund, LP Multi-strategy 122,736,958 Axiom Asia Private Capital Fund II, LP Emerging markets 15,555,657 Axxon Brazil Private Equity Fund II B, LP Emerging markets 3,458,272 Bayview Opportunity Domestic LP - high yield Distressed real estate debt 54,959,456 Blackstone Hedged Equity Fund, LP Long/short - fund-of-funds 102,291,812 Blackstone Real Estate Partners IV Active real estate 42,562,067 Blackstone Real Estate Partners V Active real estate 104,753,877 Blackstone Real Estate Partners VI Active real estate 86,387,682 Blackstone Real Estate Partners VII Active real estate 15,707,424 Blackstone Topaz Fund, LP Multi-strategy - fund-of-funds 300,314,854 Blakeney Onyx, LP Emerging markets 126,023,793 Brevan Howard, LP Global macro 79,972,926 Brevan Howard Emerging Markets Strategies Fund, LP Global macro 52,100,557 Bridgepoint Europe III A, LP Corporate buyout 23,643,445 Bridgepoint Europe IV B, LP Corporate buyout 26,744,790 Bridgewater Associates - Diamond Ridge Fund, LLC Global macro 73,166,167 Campbell Timber Fund II-A, LP Timberland 40,183,156 CarVaI Investors CVI Global Value Fund A, LP - private debt Distressed real estate debt 41,200,000 CarVaI Investors CVI Global Value Fund A, LP - real estate Distressed real estate debt 41,200,000 Catalyst Fund Limited Partnership III Canadian distressed debt 24,245,160 Catterton Partners V, LP Corporate buyout 21,225,585 Catterton Partners VI, LP Corporate buyout 28,226,864 Claren Road Credit Partners, LP Long/short - credit 101,867,403 COMAC Global Macro Fund, LP Global macro 48,725,327 CQS Feeder Fund Limited Long/short - credit 78,569,262 Davidson Kempner Institutional Partners, LP Event driven 85,606,841 DDJ Capital Management - B IV Capital Partners, LP Distressed debt 5,817,878 Diamondback Partners, LP Long/short - equity 85,625,239 DRI Capital - LSRC Intellectual property 22,934,318 DRI Capital - LSRC II Intellectual property 2,649,892 Elliott International Ltd. Multi-strategy 82,778,485 Eminence Fund, Ltd. Long/short - equity 87,081,648 Empyrean Capital Fund, LP Event driven 47,688,146 Eton Park Fund, LP Multi-strategy 72,648,072 Farallon Capital Institutional Partners, LP Multi-strategy 7,240,000 Fortress Mortgage Opportunities Fund Series 2 Distressed real estate debt 24,862,908 Garnet Sky Investors Company Ltd. Timberland 87,260,935 Glenview Institutional Partners, LP Long/short - equity 37,953,520
Limited PartnershipsMany of MOSERS’ alternative investments are organized in the form of limited partnerships. In these partnerships, the manager is the general partner and the limited partners are the investors. As of June 30, 2012, MOSERS had contracts with over 89 limited partnerships across various types of alternative investments. These partnerships collectively represent 50% of the total fund. A schedule of limited partnerships is presented below.
Continued on page 45

Missouri State Employees’ Retirement System • Fiscal Year 2012 45
FINANCIAL SECTION
Limited Partnerships
Partnership Name StyleInvestments at Fair Value
as of June 30, 2012Global Forest Partners GTI7 Institutional Investors Company Ltd. Timberland 83,166,704 HBK Offshore Fund, Ltd. Multi-strategy 85,494,379 JLL Partners Fund V, LP Corporate buyout 22,647,518 JLL Partners Fund VI, LP Corporate buyout 15,813,621 King Street Capital, LP Credit driven 81,218,181 King Street Capital, Ltd. Credit driven 1,119,114 Linden Capital Partners II, LP Corporate buyout 6,181,607 Mast Credit Opportunities I, LP Credit driven 72,401,199 Merit Energy Partners F-II, LP Energy - oil & gas 9,047,469 MHR Institutional Partners IIA, LP Distressed debt 41,997,046 MHR Institutional Partners III, LP Distressed debt 63,053,739 Millennium Technology Value Partners II, LP Direct secondaries 7,510,162 Millennium Technology Value Partners Co-investment Direct secondaries 5,082,161 Moon Capital Global Equity Offshore Fund, Ltd. Long/short - equity 822,179 New Mountain Partners III, LP Corporate buyout 33,245,233 Oaktree European Credit Opportunities Fund, LP European loans 3,072,097 OCM Opportunities Fund IVB, LP Distressed debt 12,941 OCM Opportunities Fund VIIB, LP Distressed debt 61,402,184 OCM Opportunities Fund VIIIB, LP Distressed debt 10,322,304 OCM Real Estate Opportunities Fund III, LP Active real estate 19,792,942 OCM/GFI Power Opportunities Fund II, LP Corporate buyout 2,727,295 OCM Power Opportunities Fund III, LP Corporate buyout 5,330,083 PAAMCO - Newport Pioneer, LLC Multi-strategy - fund-of-funds 6,106,986 Parish Capital Buyout Fund I, LP Corporate buyout - fund-of-funds 15,466,500 Parish Capital Buyout Fund II, LP Corporate buyout - fund-of-funds 17,435,727 Parish Opportunities Fund II, LP Private equity co-investment 8,191,970 Perry Partners, LP Multi-strategy 316,091 Pershing Square, LP Long/short - equity 43,369,744 Pharo Macro Fund, LTD Global macro 71,090,827 Resource Management Service - Wildwood Timberlands, LLC Timberland 116,844,633 Silver Creek Special Opportunities Fund I, LP Special situations - fund-of-funds 24,621,085 Silver Creek Special Opportunities Fund II, LP Special situations - fund-of-funds 32,962,898 Silver Lake Partners II, LP Corporate buyout 19,529,976 Silver Point Capital Fund, LP Credit driven 4,596,519 TCW Energy Fund XIV, LP Energy - mezzanine 39,971,443 TCW Energy Fund XV, LP Energy - mezzanine 27,396,222 TCW Energy Partners, LLC Energy - diversified 30,744,741 The Veritas Capital Fund III, LP Corporate buyout 32,851,037 The Veritas Capital Fund IV, LP Corporate buyout 22,790,411 TPG Airline Credit Opportunities II, LP Special situations 17,625,216 TPG - Axon Partners (Offshore) Ltd. Long/short - equity 47,653,510 Viking Global Equities III, Ltd. Long/short - equity 103,543,758 Visium Balanced Fund, LP Long/short - equity 50,574,697 Wellington Management - Spindrift Investors (Bermuda) Long/short - equity 944,903 Other Misc. Misc. 950,512
$3,826,932,808
Limited Partnerships continued from page 44

Missouri State Employees’ Retirement System • Fiscal Year 201246
FINANCIAL SECTION
Capital AssetsOffice building, furniture, fixtures, and equipment costing $250 or more when acquired are capitalized at cost. Improvements, which increase the useful life of the property, are also capitalized. Maintenance and repairs are charged to expense as incurred. Depreciation is computed using the straight-line method over the estimated useful life of the related assets according to the following schedule:
• 5 years for furniture, fixtures, and equipment
• 40 years for building
• 5 years for software and licensing
Below is a schedule of the capital asset account balances for the Pension Trust Funds and the Internal Service Funds – Deferred Compensation Plan as of June 30, 2011, and June 30, 2012, and changes to those account balances during the year ended June 30, 2012.
Capital Asset Account - Pension Trust Funds
Capital Assets Land Building and
Building Improvements Furniture, Fixtures,
and EquipmentSoftware
and LicensingTotal
Capital AssetsBalances June 30, 2011 $267,286 $3,568,255 $1,653,197 $ 34,326 $5,523,064 Additions 0 102,259 38,709 90,299 231,267 Deletions 0 0 (27,143) 0 (27,143)Balances June 30, 2012 267,286 3,670,514 1,664,763 124,625 5,727,188
Accumulated depreciation: Balances June 30, 2011 0 1,092,548 1,363,425 6,027 2,462,000 Depreciation expense 0 88,972 123,960 15,088 228,020 Deletions 0 0 (27,143) 0 (27,143)Balances June 30, 2012 0 1,181,520 1,460,242 21,115 2,662,877 Net capital assets June 30, 2012 $267,286 $2,488,994 $ 204,521 $103,510 $3,064,311
Capital Asset Account - Internal Service Funds Capital Assets
Furniture, Fixtures, and Equipment
Softwareand Licensing
TotalCapital Assets
Capital assets Balances June 30, 2011 $ 0 $ 0 $ 0Additions 2,828 2,648 5,476 Deletions 0 0 0Balances June 30, 2012 2,828 2,648 5,476
Accumulated depreciation: Balances June 30, 2011 0 0 0Depreciation expense 112 338 450 Deletions 0 0 0Balances June 30, 2012 112 338 450Net capital assets June 30, 2012 $2,716 $2,310 $5,026

Missouri State Employees’ Retirement System • Fiscal Year 2012 47
FINANCIAL SECTION
(3) CONTRIBUTIONS AND RESERVES
The MSEP and the Judicial Plan are pension plans covering substantially all state of Missouri employees, administrative law judges and legal advisors in the Division of Workers’ Compensation, and judges. The state of Missouri is obligated by state law to make required contributions to the plans. The required contributions are expressed as a level percentage of covered payroll and are actuarially determined using an individual entry-age actuarial cost method. The unfunded accrued liabilities are amortized over an open 30-year period. MSEP 2011 employees are required to contribute 4% of their pay. Costs of administering the plans are financed from the contributions to the pension trust funds and investment earnings.
(4) OTHER POSTEMPLOYMENT BENEFITS (OPEB)
In addition to the retirement benefits provided through MOSERS, the state of Missouri also funds, either partially or in its entirety, OPEB for eligible retirees as follows:
Retiree Life InsuranceMembers who retire on or after October 1, 1985, are eligible for $5,000 of state-sponsored basic life insurance coverage if they retire directly from active employment. As of June 30, 2012, 20,715 retirees were eligible and participating in the program. This insured defined benefit coverage is financed on a percent of payroll (.115%) and is purchased as a group policy through competitive bids and is currently administered through The Standard insurance company. The cost for year ended June 30, 2012, was $1,808,152. Premiums are contributed entirely by the state as provided for by Section 104.515, RSMo.
Retirees of the Department of Labor and Industrial Relations (DOLIR), who retired prior to January 1, 1996, are eligible for state-sponsored insured defined benefit insurance coverage in the same amount of coverage they were receiving through the DOLIR. As of June 30, 2012, 311 retirees were eligible and participating in the program. The coverage for this closed group is purchased as a group policy through competitive bids at a current cost of $2.07 per thousand dollars of coverage, per month, per eligible participant ($37,586 for the year ended June 30, 2012). Premiums are paid entirely by the DOLIR as provided for by Section 228.225, RSMo.
Retirees of the DOLIR who retired on or after January 1, 1996, are eligible for $5,000 of state-sponsored life insurance coverage if they retire directly from active employment. They are included in the group described in the preceding paragraph.
Long-Term Disability InsuranceMOSERS also provides long-term disability coverage for eligible members. Membership generally includes those active members of MOSERS’ retirement plans who do not have other disability coverage and are not yet eligible to receive normal (unreduced) retirement benefits. As of June 30, 2012, 35,295 members were eligible and covered under the program. This insured defined benefit coverage is financed on a percentage of covered payroll (.55%) and is purchased as group policy through competitive bids and is currently administered through The Standard insurance company. The cost for the year ended June 30, 2012, was $7,810,953. Premiums are contributed by the state as provided for by Section 104.515, RSMo.
Postemployment Retiree Health CareMOSERS participates in a cost-sharing multiple-employer defined benefit post-employment health care plan administered by the Missouri Consolidated Health Care Plan (MCHCP). The plan provides medical benefits to retirees of participating governmental entities. Retirees who had medical insurance coverage for six months immediately prior to termination or state-sponsored medical coverage since the effective date of the last enrollment period (or since first eligible), before they are eligible to retire, may continue coverage into retirement.
MCHCP issues a publicly available financial report that includes financial statements and required supplementary information for the postemployment health care plan. The report may be obtained by calling (800) 487-0771 or writing to MCHCP, 832 Weathered Rock Court, P.O. Box 104355, Jefferson City, MO 65110-4355.

Missouri State Employees’ Retirement System • Fiscal Year 201248
FINANCIAL SECTION
Plan funding requests are actuarially determined, approved by the MCHCP Board of Trustees, and subject to appropriation by the Missouri General Assembly. MOSERS contributed $277,645 in FY10, $240,307 in FY11 and $233,820 in FY12 in accordance with the state’s funding policy toward the annual required contributions for postemployment retiree health care, which equaled MOSERS’ required contribution each year.
(5) PLAN TERMINATION
MOSERS and its related plans are administered in accordance with Missouri statutes. Plans can only be terminated by an amendment to these statutes by the Missouri legislature.
On April 26, 2005, Senate Bill 202 was enacted, which terminated the Administrative Law Judges and Legal Advisors’ Plan (ALJLAP) for new hires only. Under this legislation, individuals who assume a position after April 26, 2005, who would have otherwise been covered by the ALJLAP, will instead participate in the MSEP or the MSEP 2000, depending on when they initially became state employees. For fiscal years 2005 and after, all liabilities and assets of the ALJLAP were transferred and combined with the MSEP. Membership totals for ALJLAP members are combined with the MSEP in all relevant sections of this report.
(6) COMMITMENTS
As of June 30, 2012, MOSERS has $546,700,462 and €24,694,959 unfunded commitments in the alternative investments asset class.
(7) CONTINGENCIES
MOSERS is a defendant in one lawsuit that, in management’s opinion, will not have a material effect on the financial statements.
The Internal Revenue Service (IRS) audited the tax qualified status of MOSERS. In a discussion draft dated August 9, 2007, the IRS raised two qualification issues but no further action has been taken by the IRS on those matters. MOSERS does not anticipate material liability for any taxes or penalties.

Missouri State Employees’ Retirement System • Fiscal Year 2012 49
FINANCIAL SECTION
REQUIRED SUPPLEMENTARY INFORMATION
Schedules of Funding ProgressPension Trust Funds - Last Six Years
MSEP
ActuarialValuation Date
Actuarial Value of Assets
(a)
Actuarial Accrued Liability
(AAL) Entry Age
(b)
Unfunded AAL (UAAL)
(b-a)
Percent Funded
(a/b)
Annual Covered Payroll
(c)
UAAL Percentage of Covered
Payroll [(b-a)/c]
06/30/2007 $7,377,289,283 $ 8,500,428,641 $1,123,139,358 86.8% $1,846,643,330 60.8% 06/30/2008 7,838,495,768 9,128,347,470 1,289,851,702 85.9 1,916,527,398 67.3 06/30/2009 7,876,079,342 9,494,806,715 1,618,727,373 83.0 2,002,402,087 80.806/30/2010 7,923,377,393 9,853,155,445 1,929,778,052 80.4 1,945,095,321 99.206/30/2011 8,022,481,408 10,123,544,043 2,101,062,635 79.2 1,875,569,816 112.006/30/2012 7,897,167,203 10,793,651,577 2,896,484,374 73.2 1,864,069,493 155.4
Judicial Plan
ActuarialValuation Date
Actuarial Value of Assets
(a)
Actuarial Accrued Liability
(AAL) Entry Age
(b)
Unfunded AAL (UAAL)
(b-a)
Percent Funded
(a/b)
Annual Covered Payroll
(c)
UAAL Percentage of Covered
Payroll [(b-a)/c]
06/30/2007 $ 61,903,516 $326,666,373 $264,762,857 19.0% $40,846,581 648.2% 06/30/2008 73,194,379 354,796,453 281,602,074 20.6 44,542,530 632.2 06/30/2009 81,337,881 369,106,841 287,768,960 22.0 45,505,512 632.406/30/2010 88,976,738 382,012,773 293,036,035 23.3 46,112,730 635.506/30/2011 98,398,628 393,484,589 295,085,961 25.0 45,888,020 643.106/30/2012 102,266,706 413,332,538 311,065,832 24.7 45,835,501 678.7
See Notes to the Schedules of Required Supplementary Information.See accompanying Independent Auditor’s Report.
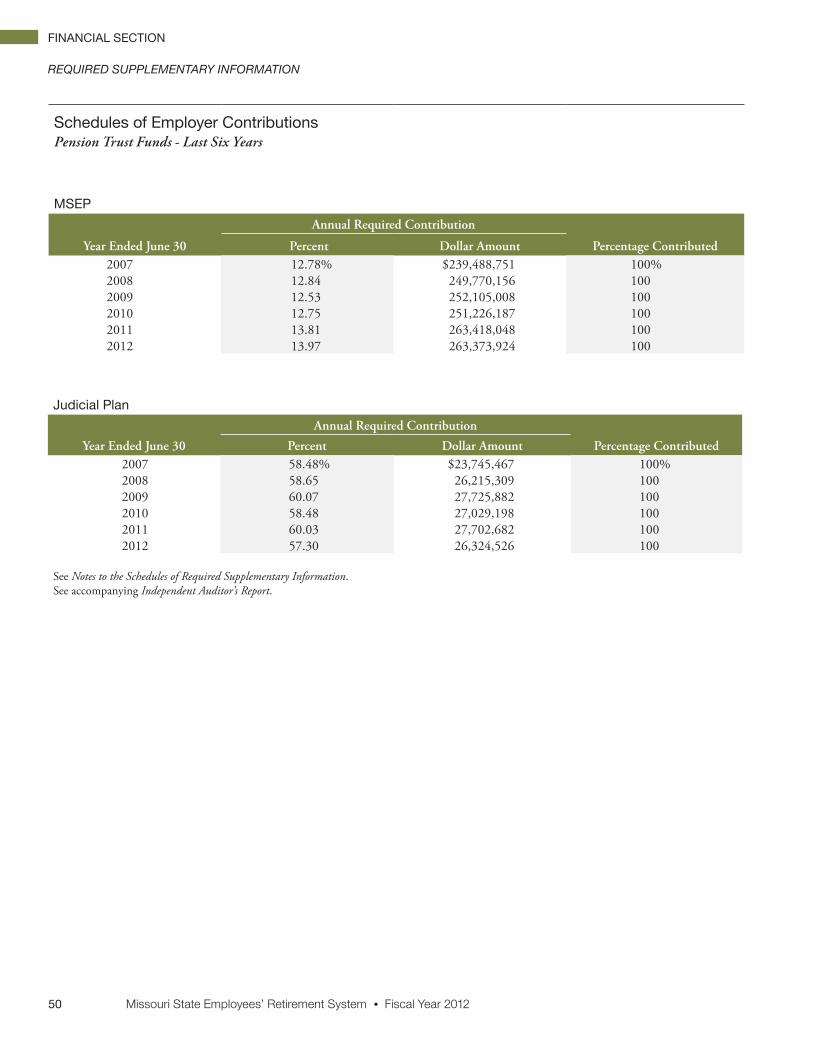
Missouri State Employees’ Retirement System • Fiscal Year 201250
FINANCIAL SECTION
REQUIRED SUPPLEMENTARY INFORMATION
Schedules of Employer ContributionsPension Trust Funds - Last Six Years
MSEP
Annual Required Contribution
Year Ended June 30 Percent Dollar Amount Percentage Contributed2007 12.78% $239,488,751 100% 2008 12.84 249,770,156 100 2009 12.53 252,105,008 100 2010 12.75 251,226,187 100 2011 13.81 263,418,048 1002012 13.97 263,373,924 100
Judicial Plan
Annual Required Contribution
Year Ended June 30 Percent Dollar Amount Percentage Contributed2007 58.48% $23,745,467 100% 2008 58.65 26,215,309 100 2009 60.07 27,725,882 100 2010 58.48 27,029,198 100 2011 60.03 27,702,682 100 2012 57.30 26,324,526 100
See Notes to the Schedules of Required Supplementary Information.See accompanying Independent Auditor’s Report.

Missouri State Employees’ Retirement System • Fiscal Year 2012 51
FINANCIAL SECTION
Actuarial Methods and Assumptions for Valuations Performed June 30, 2012The entry-age actuarial cost method of valuation is used in determining liabilities and normal cost. Differences in the past between assumed experience and actual experience (actuarial gains and losses) become part of actuarial accrued liabilities. Unfunded actuarial accrued liabilities are amortized to produce payments (principal and interest), which are expressed as a percent of payroll. An open 30-year amortization period was used for the June 30, 2012, valuations. The actuarial value of assets is based on a method that fully recognizes expected investment returns and averages unanticipated market returns over a 5-year period.
In September 2009, the board, in light of the severely negative market conditions, adopted a temporary change to the market corridor limit of the valuation assets from +/- 20% to +/- 30% for the June 30, 2009, valuation. The limit was decreased to +/- 25% for the June 30, 2010, valuation and returned to +/- 20% in FY11. The investment return rate assumption used was decreased from 8.5% to 8.0% per year, compounded annually (net of investment expenses) for June 30, 2012. The price inflation assumption used was decreased from 3.2% to 2.5% per year in 2012. Projected salary increase assumption decreased from 4% to 3% in 2012 and thereafter. The assumption used for annual post-retirement benefit increases (COLA) is 4% (on a compound basis) when a minimum COLA is in effect. When no minimum COLA is in effect, price inflation is assumed to be 2.5% and the annual COLA is assumed to be (80% of 2.5%), on a compound basis.
REQUIRED SUPPLEMENTARY INFORMATION
NOTES TO THE SCHEDULES OF REQUIRED SUPPLEMENTARY INFORMATIONPension Trust Funds - Last Six Years
2007The actuarial valuations as of June 30, 2007 reflected the following changes to the computed contribution rates for fiscal year ending June 30, 2009.
Amount Percent of PayrollMSEPChange in benefit assumptions or methods $ (369,329) (0.02)%Experience and nonrecurring items (5,355,266) (0.29)
Judicial PlanChange in benefit assumptions or methods (273,672) (0.67)Experience and nonrecurring items 853,694 2.09
2008The actuarial valuations as of June 30, 2008 reflected the following changes to the computed contribution rates for fiscal year ending June 30, 2010.
Amount Percent of PayrollMSEPChange in benefit assumptions or methods $4,791,318 0.25% Experience and nonrecurring items (574,958) (0.03)
Judicial PlanChange in benefit assumptions or methods (547,873) (1.23)Experience and nonrecurring items (160,353) (0.36)

Missouri State Employees’ Retirement System • Fiscal Year 201252
FINANCIAL SECTION
2009The actuarial valuations as of June 30, 2009 reflected the following changes to the computed contribution rates for fiscal year ending June 30, 2011.
Amount Percent of PayrollMSEPState of Missouri general pay freeze $ (4,405,285) (0.22)%Experience and nonrecurring items 55,466,538 2.77 Change in valuation asset corridor from +/- 20% to +/- 30% (29,835,791) (1.49)
Judicial PlanState of Missouri general pay freeze 350,392 0.77 Experience and nonrecurring items 496,010 1.09 Change in valuation asset corridor from +/- 20% to +/- 30% (141,067) (0.31)
2010The actuarial valuations as of June 30, 2010 reflected the following changes to the computed contribution rates for fiscal year ending June 30, 2012.
Amount Percent of PayrollMSEPState of Missouri general pay freeze $ (2,528,624) (0.13)%Addition of new tier of benefits effective 1-1-2011 (17,311,348) (0.89)Experience and nonrecurring items 25,480,749 1.31 Change in timing of contributions (2,528,624) (0.13)
Judicial PlanState of Missouri general pay freeze (308,955) (0.67)Addition of new tier of benefits effective 1-1-2011 (493,406) (1.07)Experience and nonrecurring items 438,071 0.95 Change in timing of contributions (894,587) (1.94)
2011The actuarial valuations as of June 30, 2011 reflected the following changes to the computed contribution rates for fiscal year ending June 30, 2013.
Amount Percent of PayrollMSEPState of Missouri general pay freeze $ (6,376,937) (0.34)%Experience and nonrecurring items 17,630,356 0.94 Change in normal cost due to increased participants in MSEP2011 (2,250,684) (0.12)
Judicial PlanState of Missouri general pay freeze (293,683) (0.64)Experience and nonrecurring items 289,095 0.63 Change in normal cost due to increased participants in MSEP2011 (169,786) (0.37)
2012The actuarial valuations as of June 30, 2012 reflected the following changes to the computed contribution rates for fiscal year ending June 30, 2014.
Amount Percent of PayrollMSEPChange in assumptions or methods $21,623,206 1.16% Experience and nonrecurring items 25,537,752 1.37
Judicial PlanChange in assumptions or methods 948,795 2.07 Experience and nonrecurring items 320,849 0.70

Missouri State Employees’ Retirement System • Fiscal Year 2012 53
FINANCIAL SECTION
ACTUARIAL ASSET VALUE SMOOTHING
The financing objective of the vast majority of public retirement plans is to establish contribution rates and collect contributions which remain relatively level as a percent of active member payroll over decades of time. This concept is sometimes referred to as attempting to achieve intergenerational equity, meaning that future generations will not be expected to pay more or less (in inflation adjusted terms) than the present generation contributes to support the plan.
Some critics of smoothing the actuarial value of assets suggest that pension plans are not providing “transparency” in connection with operations. Actual practice suggests otherwise. The Statements of Plan Net Assets and Changes in Plan Net Assets in this section are prepared on the basis of market values. Beyond that, all information related to asset values and results of investment activity in the Investment Section of this report is prepared on the basis of market values. This is required by the accounting and reporting standards established by the Governmental Accounting Standards Board and by the Government Finance Officers Association’s Guidelines for the Preparation of a Comprehensive Annual Financial Report. Both organizations have been long standing proponents of transparency in governmental accounting and reporting – public retirement plans commonly subscribe to the dictates of both.
Many public retirement plans have begun to emphasize use of asset classes that, by their nature, tend to be somewhat volatile in market value. This is being done with the objective of increasing long-term investment returns, thus providing increased benefit security for plan participants and lower contribution rates for taxpayers than would otherwise be the case. With market value accounting for contribution rate determination purposes, we could achieve more level contribution rates by employing lower volatility asset classes but the level contribution rate would be much higher than is the case with the higher return expectations we have as the result of taking on asset volatility risk.
When operating with a long-term time horizon, with contribution rate stability as a key objective, asset smoothing for actuarial purposes is simply a tool. Asset smoothing for actuarial purposes is a practical solution to responsibly achieving intergenerational equity, giving recognition to the fact that market cycles do not coincide with financial reporting periods. The use of the “market-related” value established through smoothing simply makes more sense for determining contribution rates than using market value. The charts above further illustrate the impact of smoothing volatility in actuarial computations.
ADDITIONAL FINANCIAL INFORMATION
Percent Change in Asset Values
-25%
-20%
-15%
-10%
-5%
0%
5%
10%
15%
20%
% Change in Actuarial Value of Assets
% Change in Market Value of Assets
2012201120102009200820072006200520042003
Percent Funded
0%
20%
40%
60%
80%
100%
Actuarial Value of Assets
Market Value of Assets
2012201120102009200820072006200520042003
Billi
ons
Asset Values
$0
$2
$4
$6
$8
$10
Market Value of Assets
Actuarial Value of Assets
2012201120102009200820072006200520042003

Missouri State Employees’ Retirement System • Fiscal Year 201254
FINANCIAL SECTION
ADDITIONAL FINANCIAL INFORMATION
Continued on page 55
MSEP Judicial Plan Total Investing activityInvestment management and administrative feesActis Emerging Markets III - private equity $ 907,225 $11,832 $ 919,057 African Development Partners I, LLC - private equity 555,769 7,248 563,017 Alinda Infrastructure Fund I, LP - private equity 418,718 5,461 424,179 American Industrial Partners V - private equity 201,536 2,628 204,164 AQR Absolute Return Institutional Fund, LP - alpha pool 489,169 6,380 495,549 AQR DELTA Sapphire Fund, LP - alpha pool 1,209,383 15,772 1,225,155 Ashmore Investment Management, Ltd. - emerging markets 501,307 6,538 507,845 Axiom Asia Private Capital Fund II, LP - private equity 326,316 4,256 330,572 Axxon Group Brazil II - private equity 571,583 7,454 579,037 Baillie Gifford EAFE Plus - international equity 580,615 7,572 588,187 Bayview Opportunity Domestic, LP - high yield 2,257,053 29,436 2,286,489 Bayview Opportunity Domestic, LP - real estate 219,142 2,858 222,000 BlackRock Financial Management Bank Loans - high yield 339,883 4,433 344,316 BlackRock Financial Management High Yield - high yield 340,698 4,443 345,141 BlackRock Financial Management Mortgage Opportunity - high yield 301,354 3,930 305,284 Blackstone Real Estate Partners V - real estate 7,047,460 91,911 7,139,371 Blackstone Real Estate Partners VI - real estate 5,744,694 74,920 5,819,614 Blackstone Real Estate Partners VII - real estate 784,324 10,229 794,553 Blackstone Hedged Equity Fundy, LP - domestic equity 983,129 12,822 995,951 Blackstone Topaz Fund, LP - alpha pool 2,863,573 37,346 2,900,919 Blackstone Real Estate Partners IV - real estate (1,434,786) (18,712) (1,453,498)Blakeney Onyx, LP - emerging markets 2,194,260 28,617 2,222,877 Brevan Howard, LP - alpha pool 3,112,538 40,593 3,153,131 Brevan Howard Emerging Markets Strategies Fund, LP - hedge fund 594,512 7,753 602,265 Bridgewater Associates Diamond Ridge Fund, LLC - alpha pool 2,732,296 35,634 2,767,930 Bridgepoint Europe III A, LP - private equity 221,851 2,893 224,744 Bridgepoint Europe IV B, LP - private equity 471,603 6,150 477,753 Campbell Timber Fund II - A, LP - timber 463,998 6,051 470,049 Catterton Partners V, LP - private equity 410,885 5,359 416,244 Catterton Partners VI, LP - private equity 4,155,212 54,191 4,209,403 CarVal Investors CVI Global Value Fund A, LP - real estate 775,494 10,114 785,608 CarVal Investors CVI Global Value Fund A, LP - private debt 775,494 10,114 785,608 Catalyst Fund Limited Partnership III - distressed debt 1,321,788 17,238 1,339,026 Claren Road Credit Partners, LP - hedge funds 2,406,199 31,381 2,437,580 COMAC Global Macro Fund, LP - hedge funds 1,093,362 14,259 1,107,621 CQS ABS Feeder Fund, Ltd. - hedge funds 898,044 11,712 909,756 Davidson Kempner Institutional Partners, LP - alpha pool 3,529,468 46,030 3,575,498 Diamondback Partners, LP - alpha pool 1,086,256 14,167 1,100,423 DRI Capital LSRC - private equity 383,542 5,002 388,544 DRI Capital LSRC II - private equity 148,067 1,931 149,998 Elliott International, Ltd. - alpha pool 1,431,683 18,672 1,450,355 Eminence Fund, Ltd. - domestic equity 3,189,793 41,600 3,231,393 Empyrean Capital Fund, LP - hedge funds 1,162,003 15,154 1,177,157 Eton Park Fund, LP - alpha pool 806,892 10,523 817,415 Farallon Capital Institutional Partners, LP - alpha pool 440,821 5,749 446,570 Garnet Sky Investors Company Limited - timber 682,262 8,898 691,160 Glenview Institutional Partners, LP - hedge funds 711,798 9,283 721,081 Global Forest Partners GTI7 Institutional Investors Company, Ltd. - timber 572,363 7,465 579,828 Grantham, May and Van Otterloo & Co, LLC - emerging markets 1,157,499 15,096 1,172,595 Harvest Fund Advisors - real estate 1,624,076 21,181 1,645,257 HBK Offshore Fund, Ltd. - alpha pool 2,292,048 29,892 2,321,940 JLL Partners V, LP - private equity (1,840) (24) (1,864)JLL Partners VI, LP - private equity 2,217,029 28,914 2,245,943 King Street Capital, Ltd. - alpha pool 1,433,163 18,691 1,451,854
Schedules of Investment ExpensesPension Trust Funds - Year Ended June 30, 2012

Missouri State Employees’ Retirement System • Fiscal Year 2012 55
FINANCIAL SECTION
Schedule of Investment Expenses continued from page 54
MSEP Judicial Plan Total Legg Mason Opportunity Trust - domestic equity 449,996 5,869 455,865 Leuthold Weeden Capital Management - domestic equity 650,231 8,480 658,711 Linden Capital Partners II - private equity 387,014 5,047 392,061 Merit Energy Partners F-II, LP - real estate 137,259 1,790 139,049 MHR Institutional Partners IIA, LP - private debt 49,506 646 50,152 MHR Institutional Partners III, LP - private debt 1,175,011 15,324 1,190,335 Millennium Technology Partners II, LP - private equity 112,554 1,468 114,022 Morant Wright Investment Management - int’l developed equity 906,377 11,821 918,198 MOSERS Inc. - alpha pool 143 2 145 New Mountain Partners III, LP - private equity 565,624 7,377 573,001 Nippon Value Investors - int’l developed equity 804,779 10,496 815,275 NISA Investment Advisors, LLC - commodities 327,887 4,276 332,163 NISA Investment Advisors, LLC - beta program domestic equity 749,102 9,770 758,872 NISA Investment Advisors, LLC - beta program fixed income 346,514 4,519 351,033 NISA Investment Advisors, LLC - beta program international equity 420,689 5,486 426,175 NISA Investment Advisors, LLC - beta program real assets 23,828 311 24,139 OCM Real Estate Opportunities Fund III, LP - real estate 7,675,725 100,100 7,775,825 OCM Opportunities Fund IVB, LP - private debt 289 4 293 OCM/GFI Power Opportunities Fund II, LP - private equity 798,538 10,414 808,952 OCM/GFI Power Opportunities Fund III, LP - private equity 444,207 5,793 450,000 OCM Opportunities Fund VIIB, LP - private debt 1,778,875 23,200 1,802,075 OCM Opportunities Fund VIIIB, LP - private debt 219,186 2,859 222,045 PAAMCO - Newport Pioneer, LLC - alpha pool 132,035 1,722 133,757 Parish Capital Buyout Fund I, LP - private equity 887,642 11,576 899,218 Parish Capital Buyout Fund II, LP - private equity 227,548 2,968 230,516 Parish Opportunities Fund II, LP - private equity 137,784 1,797 139,581 Pershing Square, LP - hedge funds 1,146,024 14,946 1,160,970 Pharo Macro Fund, Ltd. - alpha pool 1,343,080 17,516 1,360,596 Resource Management Service Wildwood Timberlands, LLC - timber 95,057 1,240 96,297 Silchester International Investors - int’l developed equity 2,744,043 35,787 2,779,830 Silver Lake Partners II, LP - private equity (437,791) (5,710) (443,501)State Street Global Advisors - emerging markets 68,268 890 69,158 Stone Harbor Investment Partners, LP - emerging markets 390,571 5,094 395,665 TPG - Axon Partners (Offshore) Ltd. - domestic equity 672,649 8,772 681,421 TPG Airline Credit Opportunities - private equity 1,132,212 14,766 1,146,978 TCW Energy Partners, LLC - real estate 8,706 114 8,820 TCW Energy Fund XIV, LP - real estate 2,880,353 37,565 2,917,918 TCW Energy Fund XV, LP - private equity 1,539,192 20,074 1,559,266 The Veritas Capital Fund III, LP - private equity 841,167 10,970 852,137 The Veritas Capital Fund IV, LP - private equity 741,484 9,670 751,154 Viking Global Equities III, Ltd. - domestic equity 2,836,946 36,999 2,873,945 Visium Balanced Fund LP - hedge funds 1,010,689 13,181 1,023,870 Total investment management fees 106,123,597 1,384,029 107,507,626
Other investment fees Investment consultant fees Summit Strategies, Inc. 892,694 11,642 904,336 Investment custodial fees BNY Mellon 407,301 5,312 412,613 Performance and risk measurement fees BNY Mellon 437,883 5,711 443,594 Internal investment activity expenses 3,418,037 44,577 3,462,614 Total investing activity expenses 111,279,512 1,451,271 112,730,783
Securities lending activity Securities lending borrower rebates 44,706 583 45,289 Securities lending management fees BNY Mellon 123,391 1,609 125,000 Deutche Bank 147,000 1,917 148,917 Total securities lending activity expenses 315,097 4,109 319,206 Total investment expenses $111,594,609 $1,455,380 $113,049,989

Missouri State Employees’ Retirement System • Fiscal Year 201256
FINANCIAL SECTION
ADDITIONAL FINANCIAL INFORMATION
Schedules of Internal Investment Activity ExpensesPension Trust Funds - Year Ended June 30, 2012
MSEP Judicial Plan Total Personnel servicesSalaries $2,339,543 $30,512 $2,370,055 Employee fringe benefits 662,061 8,634 670,695 Total personnel services 3,001,604 39,146 3,040,750
Professional servicesAttorney services 88,540 1,155 89,695 Consulting services 937 12 949 Total professional services 89,477 1,167 90,644
CommunicationsTelephone 5,440 71 5,511 Total communications 5,440 71 5,511
FacilitiesVehicle maintenance 172 2 174 Total facilities 172 2 174
Education, meetings and travelStaff travel and meetings 3,242 42 3,284 Sponsored programs 115 1 116 Due diligence 68,761 897 69,658 Total travel and meetings 72,118 940 73,058
General administrativeEducational materials 3,485 45 3,530 Office supplies 965 13 978 Subscriptions and dues 240,056 3,131 243,187 Temporary help 4,720 62 4,782 Total general 249,226 3,251 252,477 Total administrative expenses $3,418,037 $44,577 $3,462,614

Missouri State Employees’ Retirement System • Fiscal Year 2012 57
FINANCIAL SECTION
Schedules of Administrative ExpensesPension Trust Funds - Year Ended June 30, 2012
MSEP Judicial Plan TotalPersonnel servicesSalaries $3,485,052 $45,449 $3,530,501 Employee fringe benefits 1,319,137 17,204 1,336,341 Total personnel services 4,804,189 62,653 4,866,842
Professional servicesActuarial services 358,640 4,677 363,317 Attorney services 124,661 1,626 126,287 Auditing services 47,382 618 48,000 Banking services 27,832 363 28,195 Consulting services 79,960 1,043 81,003 Total professional services 638,475 8,327 646,802
CommunicationsPostage and mailing 161,101 2,101 163,202 Telephone 39,365 513 39,878 Printing 43,267 564 43,831 Video production 2,878 38 2,916 Total communications 246,611 3,216 249,827
FacilitiesDepreciation 87,827 1,145 88,972 Utilities 63,385 827 64,212 Maintenance 58,165 759 58,924 Vehicle maintenance 7,963 104 8,067 Total facilities 217,340 2,835 220,175
Software and equipmentDepreciation 137,259 1,790 139,049 Maintenance 259,981 3,391 263,372 Rental 142,356 1,857 144,213 Gain on sale of equipment (250) (3) (253)Total equipment 539,346 7,035 546,381
Education, meetings and travelBoard travel and meetings 39,013 509 39,522 Staff travel and meetings 66,345 865 67,210 Sponsored programs 66,389 866 67,255 Due diligence 3,378 44 3,422 Total education, meetings and travel 175,125 2,284 177,409
General administrativeEducational materials 18,800 245 19,045 Office supplies 60,540 790 61,330 Subscriptions and dues 178,222 2,324 180,546 Insurance 126,065 1,644 127,709 Advertising 12,344 161 12,505 Total general 395,971 5,164 401,135 Total administrative expenses $7,017,057 $91,514 $7,108,571
ADDITIONAL FINANCIAL INFORMATION

Missouri State Employees’ Retirement System • Fiscal Year 201258
FINANCIAL SECTION
Schedules of Administrative ExpensesInternal Service Funds - Year Ended June 30, 2012
Life and LTD Deferred Compensation Total Personnel services Salaries $243,251 $162,700 $405,951 Employee fringe benefits 91,572 48,323 139,895 Total personnel services 334,823 211,023 545,846
Professional services Attorney services 1,538 110,985 112,523 Auditing services 3,307 0 3,307 Banking services 840 830 1,670 Total professional services 5,685 111,815 117,500
Communications Postage and mailing 510 0 510 Telephone 2,748 0 2,748 Video production expense 201 0 201 Total communications 3,459 0 3,459
Facilities Building use charge 8,897 0 8,897 Utilities 4,424 0 4,424 Maintenance 4,060 0 4,060 Total facilities 17,381 0 17,381
Software and equipment Depreciation 0 450 450 Equipment use charge 12,493 0 12,493 Maintenance 18,049 0 18,049 Rental 9,936 0 9,936 Total software and equipment 40,478 450 40,928
Education, meetings and travel Board travel and meetings 2,723 0 2,723 Staff travel and meetings 9,501 5,778 15,279 Vehicle maintenance and operation 556 0 556 Due diligence 0 1,653 1,653 Total education, meetings and travel 12,780 7,431 20,211
General administrative Educational materials 1,312 0 1,312 Office supplies 4,226 3,317 7,543 Subscriptions and dues 3,695 2,518 6,213 Software subscriptions 0 8,475 8,475 Insurance 8,799 0 8,799 Advertising 862 0 862 Total general administrative 18,894 14,310 33,204 Total administrative expenses $433,500 $345,029 $778,529
ADDITIONAL FINANCIAL INFORMATION

Missouri State Employees’ Retirement System • Fiscal Year 2012 59
FINANCIAL SECTION
Schedules Professional/Consultant FeesYear Ended June 30, 2012
Pension Trust Funds Internal Service Funds
Professional/Consultant Nature of Service MSEPJudicial
Plan TotalLife and
LTDDeferred
Compensation TotalOperation administrative expensesAvtex Solutions, Inc. Information technology consulting $ 3,905 $ 51 $ 3,956 $ 0 $ 0 $ 0Central Bank Banking 26,240 342 26,582 676 830 1,506 Charlesworth & Associates Risk management consulting 8,144 106 8,250 0 0 0Collector Solutions, Inc. Banking 1,592 21 1,613 164 0 164 DecideSmart, LLC Strategic planning consulting 25,732 336 26,068 0 0 0Excellence in Missouri Foundation Quality assessment consulting 4,784 62 4,846 0 0 0Gabriel, Roeder, Smith & Co. Actuarial 358,640 4,677 363,317 0 0 0Huber & Associates, Inc. Information technology consulting 5,577 73 5,650 0 0 0HyperGen, Inc. Information technology consulting 2,018 26 2,044 0 0 0Pension Benefit Information Pension research services 1,974 26 2,000 0 0 0Qflow Systems, LLC Information technology consulting 22,112 288 22,400 0 0 0Rose International Human resources consulting 7,688 101 7,789 0 0 0Thompson Coburn, LLP Legal counsel 124,661 1,626 126,287 1,538 110,985 112,523 Williams Keepers, LLC Financial audit 45,408 592 46,000 3,307 0 3,307 Operation administrative expenses subtotal 638,475 8,327 646,802 5,685 111,815 117,500
Internal investment administrative expensesCBIZ Benefits & Insurance Services, Inc. Human resources consulting 296 4 300 0 0 0Rose International Human resources consulting 641 8 649 0 0 0Thompson Coburn, LLP Legal counsel 88,540 1,155 89,695 0 0 0Internal investment administrative expenses subtotal 89,477 1,167 90,644 0 0 0Total professional/consultant fees $727,952 $9,494 $737,446 $5,685 $111,815 $117,500
Information on investment management and consulting fees can be found in the Schedule of Investment Expenses on pages 54-55.
ADDITIONAL FINANCIAL INFORMATION
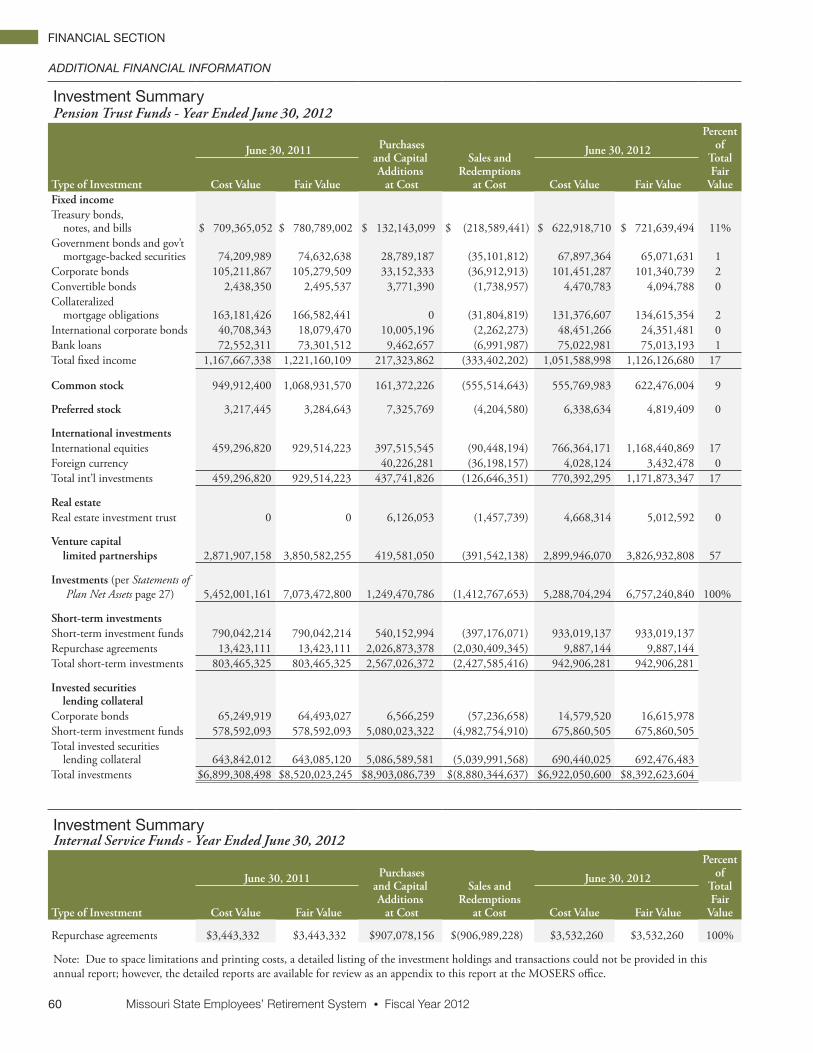
Missouri State Employees’ Retirement System • Fiscal Year 201260
FINANCIAL SECTION
Investment SummaryPension Trust Funds - Year Ended June 30, 2012
Type of Investment
June 30, 2011 Purchases
and Capital Additions at Cost
Sales and Redemptions
at Cost
June 30, 2012
Percentof
Total Fair
ValueCost Value Fair Value Cost Value Fair ValueFixed incomeTreasury bonds, notes, and bills $ 709,365,052 $ 780,789,002 $ 132,143,099 $ (218,589,441) $ 622,918,710 $ 721,639,494 11%Government bonds and gov’t mortgage-backed securities 74,209,989 74,632,638 28,789,187 (35,101,812) 67,897,364 65,071,631 1Corporate bonds 105,211,867 105,279,509 33,152,333 (36,912,913) 101,451,287 101,340,739 2Convertible bonds 2,438,350 2,495,537 3,771,390 (1,738,957) 4,470,783 4,094,788 0Collateralized mortgage obligations 163,181,426 166,582,441 0 (31,804,819) 131,376,607 134,615,354 2International corporate bonds 40,708,343 18,079,470 10,005,196 (2,262,273) 48,451,266 24,351,481 0Bank loans 72,552,311 73,301,512 9,462,657 (6,991,987) 75,022,981 75,013,193 1Total fixed income 1,167,667,338 1,221,160,109 217,323,862 (333,402,202) 1,051,588,998 1,126,126,680 17
Common stock 949,912,400 1,068,931,570 161,372,226 (555,514,643) 555,769,983 622,476,004 9
Preferred stock 3,217,445 3,284,643 7,325,769 (4,204,580) 6,338,634 4,819,409 0
International investmentsInternational equities 459,296,820 929,514,223 397,515,545 (90,448,194) 766,364,171 1,168,440,869 17Foreign currency 40,226,281 (36,198,157) 4,028,124 3,432,478 0Total int’l investments 459,296,820 929,514,223 437,741,826 (126,646,351) 770,392,295 1,171,873,347 17
Real estateReal estate investment trust 0 0 6,126,053 (1,457,739) 4,668,314 5,012,592 0
Venture capital limited partnerships 2,871,907,158 3,850,582,255 419,581,050 (391,542,138) 2,899,946,070 3,826,932,808 57
Investments (per Statements of Plan Net Assets page 27) 5,452,001,161 7,073,472,800 1,249,470,786 (1,412,767,653) 5,288,704,294 6,757,240,840 100%
Short-term investmentsShort-term investment funds 790,042,214 790,042,214 540,152,994 (397,176,071) 933,019,137 933,019,137 Repurchase agreements 13,423,111 13,423,111 2,026,873,378 (2,030,409,345) 9,887,144 9,887,144 Total short-term investments 803,465,325 803,465,325 2,567,026,372 (2,427,585,416) 942,906,281 942,906,281
Invested securities lending collateralCorporate bonds 65,249,919 64,493,027 6,566,259 (57,236,658) 14,579,520 16,615,978 Short-term investment funds 578,592,093 578,592,093 5,080,023,322 (4,982,754,910) 675,860,505 675,860,505 Total invested securities lending collateral 643,842,012 643,085,120 5,086,589,581 (5,039,991,568) 690,440,025 692,476,483Total investments $6,899,308,498 $8,520,023,245 $8,903,086,739 $(8,880,344,637) $6,922,050,600 $8,392,623,604
ADDITIONAL FINANCIAL INFORMATION
Investment SummaryInternal Service Funds - Year Ended June 30, 2012
Type of Investment
June 30, 2011 Purchases
and Capital Additions at Cost
Sales and Redemptions
at Cost
June 30, 2012
Percentof
Total Fair
ValueCost Value Fair Value Cost Value Fair Value
Repurchase agreements $3,443,332 $3,443,332 $907,078,156 $(906,989,228) $3,532,260 $3,532,260 100%
Note: Due to space limitations and printing costs, a detailed listing of the investment holdings and transactions could not be provided in this annual report; however, the detailed reports are available for review as an appendix to this report at the MOSERS office.

Investment SectionChief Investment Officer’s Report ..................................................................................................... 61Investment Consultant’s Report ........................................................................................................ 65Investment Policy Summary .............................................................................................................. 67Total Fund Review ............................................................................................................................ 73Investment Manager Fees .................................................................................................................. 77Schedule of Investment Portfolios by Asset Class ............................................................................... 79Schedule of Investment Results ......................................................................................................... 80 Public Equity Asset Class Summary ................................................................................................... 81Public Debt Asset Class Summary ..................................................................................................... 87Alternative Investments Asset Class Summary ................................................................................... 94Beta/Alpha Program ........................................................................................................................ 102Securities Lending Program ............................................................................................................. 104

Missouri State Employees’ Retirement System • Fiscal Year 2012 61
INVESTMENT SECTION
CHIEF INVESTMENT OFFICER’S REPORT
Missouri State Employees’ Retirement System
Mailing AddressPO Box 209
Jefferson City, MO 65102-0209
Building Location 907 Wildwood Drive
Jefferson City, MO
Phone: (573) 632-6100 • (800) 827-1063MO Relay: 7-1-1 (Voice) • (800) 735-2966 (TTY)
Email: [email protected] • Website: www.mosers.org
October 29, 2012
Dear Members:
I am pleased to present the Investment Section of the MOSERS Comprehensive Annual Financial Report for the fiscal year ended June 30, 2012. The following are a few highlights of the year:
• As of June 30, 2012, your pension fund had total assets of $7.7 billion.
• The investment portfolio generated $158 million in net earnings during the year representing a return of 2.2%.
• The portfolio outperformed the policy benchmark by 1% during the year, contributing $83 million of the $158 million in total earnings.
• The 2.2% return was in the top 14% of public pension funds with assets in excess of $1 billion and our ten year annualized return of 8.1% was in the 4th percentile. Over 10 years, had our return been average relative to our peers, there would be over $1.5 billion less in the fund.
• Across standard reporting periods out to 20 years, our investment results have consistently outpaced our policy benchmark and our peers while the comparative risk we have taken to generate these results has been well below average. The end result has been consistently high long-term risk adjusted returns.
Strong long-term performance is the best indicator of our success in providing the necessary funding that comes from the earnings generated by the investment portfolio. Today, over 60% of MOSERS’ funding comes from the investment portfolio. Every dollar in investment earnings is one less dollar that is needed from the state of Missouri in order to fund your promised benefits. In this regard, our investment program has served our members and the taxpayers well for many years. At the foundation of our success is a set of fundamental investment beliefs. Over nearly two decades, these investment beliefs have guided our program with very little modification and we expect them to guide us well into the future.
Our investment beliefs are:
• Diversification is critical because the future is unknown.
• Every investment should be examined in the context of its potential return from beta (market return) and alpha (value added return), the two distinct return components.
• Flexibility in investment policy implementation is critical because various asset classes will be in or out of favor at different points in the economic cycle.
• Prudent asset management must first focus on understanding and balancing risk.

Missouri State Employees’ Retirement System • Fiscal Year 201262
INVESTMENT SECTION
Looking Back at YesterdayThinking of yesterday brings memories of changes in our investment program during the past decade and how our efforts to further diversify the portfolio during that period proved to be some of the best decisions made in the management of the portfolio. Prior to 2002, approximately 75% of MOSERS’ portfolio was invested in common stock with nearly one-half of that amount invested in the S&P 500. At that time, our program looked similar to other large public funds. The portfolio structure included rigid rule-based decisions, static asset allocations, and a rather simplistic diversification model in which the other 25% of the portfolio consisted primarily of fixed income investments.
In 2002, following an asset allocation study, the MOSERS Board of Trustees adopted a new investment policy. The result of the 2002 study was to reduce public equity investments from 75% to 50%, while adding new asset classes including high yield bonds, timberland, private equity and debt, real estate, and absolute return strategies (hedge funds). In addition, investment staff was granted authority to make strategic shifts (increasing active risk) in the portfolio away from the policy benchmark within board approved ranges. The decision to move to a portfolio that included a large allocation to alternative investments did not come easily. There was discomfort with deviating from the pack of institutional investors, especially given that the strong equity returns during the decade of the 90s were still vividly entrenched in our memory. Rear view mirror investing is a far too common trait of investors. This is largely because the potential negatives associated with being different and wrong, even in the short term, are much stronger motivators than the offsetting potential positives from being different and right. Accordingly, changes to institutional investment portfolios happen very slowly, look very similar, and miss opportunities to produce exceptional performance. MOSERS’ decision in 2002 to step away from the pack to pursue an unconventional approach, reflected the high level of trust that was in place among the MOSERS board, staff and asset consultant. Our investment success over the ensuing decade has largely been the result of those governance policy changes and our willingness to deviate from the norm.
Focusing on Fiscal Year 2012In the last few years, the markets have been completely focused on macro events and, as a result, have flipped back and forth between risk-on and risk-off over relatively short periods and this past fiscal year continued that pattern. Depending upon which month or quarter we were in, the financial markets were either terrible or great during FY12. Risk assets, such as stocks, commodities and real estate fell for the first three months of the year while assets viewed as “safe or non-risk” like U.S. Treasuries were up strongly over that same period. In the winter and spring that trend reversed itself and stocks and other risk assets were up and treasuries were down. The last quarter of the fiscal year looked a lot like the first with the exception of the last day of June when markets soared higher. Because of the volatility taking place as markets battled between debt reduction and its deflationary forces and the offsetting Fed-driven stimulus and its inflationary impact on growth oriented assets, the importance of a well balanced portfolio became even more evident.
The best performing sub-asset class in the portfolio for the year was the inflation indexed bond portfolio which advanced 11.3%. Other notable positive contributors to return included real estate at 9.5%, core fixed income at 8.7%, private market investments at 7.5% and U.S. equities at 6.2%. Sub-asset classes that detracted from the overall return included emerging market equities down 14.3%, developed international equities falling 9.8% and commodities falling 5.9%. For complete performance attribution details see page 73 of the report.

Missouri State Employees’ Retirement System • Fiscal Year 2012 63
INVESTMENT SECTION
Navigating to TomorrowImmediately following the end of the fiscal year, at the July 2012 meeting, the board made the decision to lower the nominal investment return assumption from 8.5% to 8.0% commencing in FY13. This decision is reflective of the current low interest rate environment and the expectation that economic growth may remain muted for several years as debt levels come down.
At the same meeting, the board also made, what I believe will be viewed in the years ahead as a seminal decision regarding the investment program, a decision to move away from returns-based allocation to risk-based allocation. This decision will shape the direction of the portfolio well into the future and will likely be the primary driver of future investment performance. Very much like the decision to materially alter the allocation in 2002, which moved MOSERS away from its institutional peers, the changes adopted in July will have a similar impact. As a result, the changes will be viewed as radical by the masses; however, it is our belief that over the next several years the masses will see that the direction we are headed is simply a better foundation from which to manage the portfolio in an uncertain world. For several years now, forward-thinking investors have been exploring the concept of allocating capital based on risk as opposed to today’s standard methodology of allocating capital based on returns. Returns-based allocation models, geared to generate returns typical of what MOSERS and other pension fund investors are trying to achieve (6.5% to 8.5% annually), end up concentrating heavily on equities or equity-like assets to produce the preponderance of the investment return while using “diversifiers” to marginally reduce risk. Concentrated equity risk is a benefit when the economy is growing strongly and inflation is under control, like it was through the majority of the 20-year period ended 1999. However, in today’s more uncertain economic environment, a portfolio built upon an equal risk-weighted set of core assets with different fundamental economic drivers is expected to substantially mitigate the risks associated with this uncertainty.
Risk-based allocation modeling reduces the concentration in equities and increases the allocation to diversifiers such as nominal bonds, inflation indexed bonds, commodities and alternative risk factors found in hedge fund strategies. Because many of these asset classes have lower expected returns than equities, a modest amount of leverage must be utilized on them in in order for them to pull their share of the weight from an investment return perspective. While we believe that a risk balanced portfolio will produce a better risk adjusted return over time, there will certainly be periods where the equity centric portfolio produces better results. Additionally, one should expect the new portfolio to lose money during crisis periods when fearful investors favor cash to all other forms of investments. In those environments, no portfolio built around an expectation of producing returns well in excess of cash over the long-term will completely protect capital in the short-term.
A risk-balanced portfolio presents its own unique set of challenges which must be managed. Unlike a more conventional mainstream portfolio, where the volatility of stocks will subject the portfolio to unacceptable losses like those experienced in 2008, the primary risk of a risk balanced portfolio is that our estimates of risk and correlations change materially during crisis periods and the modest amount of leverage being utilized will result in losses that exceed expectations. Risk mitigators include limits on aggregate leverage, intense monitoring, flexibility and, most importantly, a large liquid cash buffer. Recognizing the need to control risks, the board adopted policies that require judicious application of risk mitigators.

Missouri State Employees’ Retirement System • Fiscal Year 201264
INVESTMENT SECTION
It is my hope that this has given you a basic understanding of the direction MOSERS’ portfolio management will take over the next several years. I will get into more detail regarding actual positioning in next year’s annual report. We will be transitioning the portfolio as opportunities present themselves, therefore details will develop over time. It is important to keep in mind that the future is unpredictable and, because of this, we must be willing to adapt.
The great Albert Einstein once said, “Learn from yesterday, live for today, hope for tomorrow. The important thing is not to stop questioning.” MOSERS has never been reluctant to question our investment approach and to recommend change, if change made sense. Our views and opinions about making the best returns for you have not, and will not, be impeded by concerns about other’s perceptions of our unconventional strategies. It is my belief that this is a direct result of the exceptional governance model in place at MOSERS, a culture of hard work, ethics and, most importantly, our board of trustees and executive director. Without their willingness to stand up to the criticism of challengers and remain steadfast in the long-term vision of the organization, MOSERS would be just another lemming and the benefits you have been promised would be less secure than they are today and will be in the future.
Best regards,
Rick DahlChief Investment Officer

Missouri State Employees’ Retirement System • Fiscal Year 2012 65
INVESTMENT SECTION
INVESTMENT CONSULTANT’S REPORT
October 29, 2012
The Board of TrusteesMissouri State Employees’ Retirement System907 Wildwood DriveJefferson City, MO 65109
Dear Board Members,
What a difference one circling of the sun makes. In my letter from last year’s annual report, I talked about the FY11 results of 21% being the best annual return year in MOSERS’ history. Now, one year later, I write to you about a much more modest return of 2.2%, which is still positive but lower than average by historical standards. We have said consistently and repeatedly in these annual letters that the markets will do what they are going to do and we cannot control them. These last two years have once again proven this to be true.
However, we are very pleased about the results of the things we can control, and that’s relative performance. My analogy is, we can’t control the currents or the direction of the wind but we are racing other boats, and there are winners; our collective goal is to win the race. The “fastest boats” in the investment world earn higher absolute returns because of successful relative results, reducing the burden on the taxpayers who ultimately pay the tab.
While 2.2% is a lower-than-average absolute long-term return and a fraction of the previous year’s return, it is an impressive outcome given the results of the market. In our sample of public pension plans with more than $1 billion in assets, MOSERS’ annual return ranks in the top 14%. This means MOSERS outperformed more than 85% of the large public funds who are also “racing” to be the best. What the investment staff at MOSERS, as well as all of us at Summit Strategies Group, spend a great deal of time on and take an enormous amount of pride in, is that outstanding relative results at MOSERS are the norm, not the exception. For the respective annualized periods from two years to ten, MOSERS’ relative rankings were: 10th, 9th, 26th, 15th, 9th, 5th, 4th, 7th, and 4th. Forget about best-in-state, these are best-in-the-country kinds of results!
I believe the consistency of excellence is the most important aspect of MOSERS’ operation, and this should be important to you as board members for two critical reasons. Consistency of results over multi-year periods gives you a very strong indication that the risk side of the investment equation is being given the proper attention. The second critical reason is the culture that expects success.
8182 Maryland Avenue, 6th Floor • St. Louis, Missouri 63105 • 314.727.7211, 314.727.6068 (fax)

Missouri State Employees’ Retirement System • Fiscal Year 201266
INVESTMENT SECTION
Anyone can make a huge “bet” and if the market happens to reward that position in that year, they will have a great relative result. But in order to reach the top year after year, especially in the incredibly volatile investment world of the last decade, you must believe in broad diversification, timely tactical calls, possess an eye for genuine investment talent, and maintain a consistent edge over the rest of the field. The latitude given to staff and Summit by the board more than 14 years ago, when it was unheard of in the public sector, is the edge we’ve needed. The dedication and skill of an extremely stable group of investment professionals internally is what has taken that edge and turned it into “dollars and cents” results.
Over the past decade, MOSERS’ ability to be “above average” (relative results) has meant returns almost 30% higher than “average” and a pension system (and ultimately the state) that is $1.5 billion better funded than the “average” public pension fund. Thank you for allowing Summit to be a part of this story.
Sincerely,
Stephen P. Holmes, CFAPresident

Missouri State Employees’ Retirement System • Fiscal Year 2012 67
INVESTMENT SECTION
INVESTMENT POLICY SUMMARY
Guiding PrinciplesCritical to the financial security of present and future benefit recipients is the effectiveness and efficiency of the system’s asset management program. The MOSERS Board of Trustees, charged with the responsibility for investing the assets of the system in a manner consistent with fiduciary standards set forth in the prudent person rule, has adopted the following fundamental principles to guide all investment-related decisions:
• Preserve the long-term corpus of the fund.
• Maximize total return within prudent risk parameters.
• Act in the exclusive interest of the members of the system.
The investment policy summary serves as a reference point for management of system assets and outlines MOSERS’ investment philosophy and practices. Investments within this report are presented on the basis of fair market value using a variety of sources such as appraisals, valuations of underlying companies and assets for limited partnerships and commingled funds, and through market values obtained from the investment custodian.
Investment ObjectiveIn keeping with the three guiding principles, the board has adopted the following broad investment objectives:
• Develop a real return objective (RRO)1 that will keep contribution rates reasonably level over long periods of time, absent changes in actuarial assumptions.
• Establish an asset allocation policy that is expected to meet the RRO over long periods of time, while minimizing volatility.
• Minimize the costs associated with implementation of the asset allocation through the efficient use of internal and external resources.
Investment BeliefsMOSERS’ internal investment staff and external asset consultant have arrived at investment beliefs, which are the foundation for implementation of the investment portfolio to achieve the board’s objectives. These beliefs help to form the basis of every decision made within MOSERS’ portfolio. They are the fundamental concepts underlying the MOSERS’ investment program. These beliefs are as follows:
• Diversificationiscriticalbecausethefutureisunknown. MOSERS’ investment portfolio has been built upon the premise that very little is known about what the future holds and, as a result, the portfolio is structured to combat a variety of economic outcomes.
As a result, the portfolio will have significant diversification to provide risk reduction in a variety of markets. The chart above reflects the various economic environments and the types of investments that should be expected to perform well in those environments.
1 The RRO is the rate by which the total return exceeds the inflation rate as measured by the CPI, U.S. City Average for all Urban Consumers (CPI-U). MOSERS’ real return is the excess return over the CPI utilizing the formula: Real = (1+Nominal) ÷ (1+CPI). As of June 30, 2012, the RRO was 5.3%.
EconomicDiversification
Rising Growth• Equities• Corporate/mortgage bonds• Emerging markets• Timber• Real estate• Commodities
Falling Growth• Treasuries• TIPS
Rising Inflation• Timber• Real estate• Emerging markets• Commodities• TIPS
Falling Inflation• Equities• Corporate bonds• Treasuries
Deflation• Long treasuries

Missouri State Employees’ Retirement System • Fiscal Year 201268
INVESTMENT SECTION
• Everyinvestmentshouldbeexaminedinthecontextofthetwodistinctreturncomponents–betaandalpha. Beta is the return which is expected to be earned by investing passively within a specific asset class. Exposures to beta can be purchased very cheaply and, over long periods of time, it is expected that returns from beta should be positive and coincide with the risk associated with a given asset class. In contrast, alpha is the return generated through a manager’s ability to select particular investments that perform better than the asset class as a whole. Alpha is a zero-sum game. For every winner, there is a loser on the other side. Historically, MOSERS’ portfolio has been heavily weighted towards investments that provided mainly beta returns.
MOSERS made a decision in 2002, after a formal asset/liability study, to place a greater emphasis on generating alpha returns within the portfolio. At that time, it was expected that returns strictly from beta would not generate the returns necessary to fund the liabilities of the system. That decision was confirmed in the most recent formal asset/liability study completed in July 2007. As reflected in the chart above, several alpha-generating strategies are in place within the portfolio today.
• Assetclasseswillbeinandoutoffavoratdifferenttimesandtheyalltendtobecyclical,thusflexibilityiskey. This belief acknowledges that economies are cyclical; thus, it is only logical that certain investments will fair better than others depending upon the current economic environment. In order to make a “good” investment, the price one pays for an investment must be considered. No investment offers the birthright of a high return. In order to capitalize on potential opportunities that may arise due to asset classes being “cheap” or “expensive” relative to their historical norms, the board has granted the CIO the ability to make strategic sub-asset class allocation decisions subject to predefined ranges.
• Prudentassetmanagementmustfirstfocusonanunderstandingandbalancingofrisk. While it is easy to focus attention on expected investment returns, understanding the fundamental economic drivers of risk taken to generate those returns, should come first. As a result, balancing risk will produce stronger risk-adjusted returns, thus more stability if the contribution rate for the employer.
Roles and ResponsibilitiesBoard of TrusteesThe board of trustees bears the ultimate fiduciary responsibility for the investment of system assets. Members of the board must adhere to state law and prudent standards of diligence with respect to their duties as investment fiduciaries. Accordingly, they are required to discharge their duties in the interest of plan participants. They must also “act with the same care, skill, prudence, and diligence under prevailing circumstances that a prudent person, acting in a similar capacity and familiar with those matters, would use in the conduct of a similar enterprise with similar aims.”2
Specifically related to investments, the board is charged with the duties of establishing and maintaining broad policies and objectives for the investment program along with the recommendations of staff and the external asset consultant.
Continuum of Beta vs. Alpha Components
Private DebtCore Fixed Income
InternationalEquity
TIPS
DomesticEquity
High Yield
Real Estate Private Equity Market Neutral
Timber
EmergingMarkets Hedged Equity
Commodities
ALPHABETA
2 Section 105.688, RSMo - Investment Fiduciaries, Duties.
Missouri State Employees’ Retirement System • Fiscal Year 2012 69
INVESTMENT SECTION
Executive DirectorThe executive director is appointed by and serves at the pleasure of the board. The board has given the executive director broad authority for planning, organizing, and administering the operations and investments of the system under broad policy guidance from the board. Specifically with regard to investments, the executive director is broadly responsible for the oversight of the investment program. The executive director must ensure that system assets are invested in accordance with the board’s policies and that internal controls are in place to safeguard system assets. The executive director must also certify that all manager hiring and termination decisions were made in accordance with the board’s governance policy. In addition, the executive director certifies strategic allocation decisions made by the CIO and external asset consultant.
Chief Investment Officer and Internal StaffThe CIO serves at the pleasure of the executive director, yet has a direct line of communication with the board on investment-related issues. The CIO has primary responsibility for the overall direction of the investment program. The CIO works with the external asset consultant and executive director in advising the board on policies related to the investment program. The CIO has primary responsibility to make hiring and termination decisions related to money managers with the approval of the external asset consultant. The CIO is also charged with the responsibility of making strategic allocation decisions with the approval of the external asset consultant. Other responsibilities of the CIO include monitoring the investment of system assets, oversight of external money managers and the internally managed portfolios, and keeping the board apprised of situations which merit their attention. The internal investment staff is accountable to the CIO.
External Asset ConsultantsSummit Strategies Group of St. Louis, Missouri serves as the system’s external asset consultant and at the pleasure of the board. The primary duties of the external asset consultant are to:
• Advise the board on policies related to the investment program.
• Provide a third-party perspective and level of oversight to the system’s investment program.
The external asset consultant must approve all manager hiring and termination decisions and strategic allocation decisions made by the CIO. The external asset consultant provides advice and input to the CIO and internal investment staff on investment-related issues and money manager searches.
Blackstone Alternative Asset Management serves as the system’s external hedge fund consultant at the pleasure of the board. The primary duties of the external hedge fund consultant are to:
• Advise the board on policies related to the hedge fund program.
• Provide a third-party perspective and level of oversight to the system’s hedge fund investment program.
The external hedge fund consultant must approve all hedge fund manager hiring and termination decisions. The external hedge fund consultant provides advice and input to the CIO and internal investment staff on hedge fund program issues and manager searches.
Chief AuditorThe chief auditor reports directly to the executive director and if, in the opinion of the chief auditor circumstances warrant, may report directly to the board. The chief auditor is independent of the system’s investment operations and, among other things, is responsible for providing objective audit and review services for the investment operations. It is the chief auditor’s objective to promote adequate and effective internal controls at a reasonable cost, which results in suggested improvements that will lead to economies and efficiencies in the system’s investment operations.
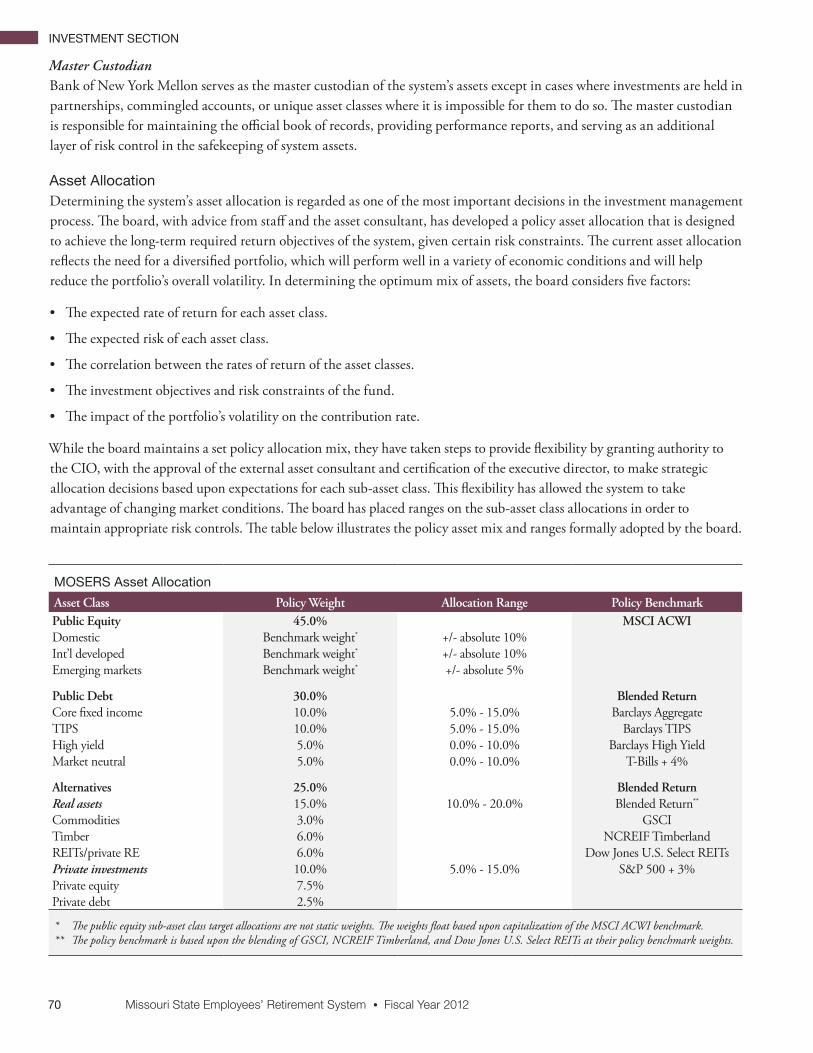
Missouri State Employees’ Retirement System • Fiscal Year 201270
INVESTMENT SECTION
Master CustodianBank of New York Mellon serves as the master custodian of the system’s assets except in cases where investments are held in partnerships, commingled accounts, or unique asset classes where it is impossible for them to do so. The master custodian is responsible for maintaining the official book of records, providing performance reports, and serving as an additional layer of risk control in the safekeeping of system assets.
Asset AllocationDetermining the system’s asset allocation is regarded as one of the most important decisions in the investment management process. The board, with advice from staff and the asset consultant, has developed a policy asset allocation that is designed to achieve the long-term required return objectives of the system, given certain risk constraints. The current asset allocation reflects the need for a diversified portfolio, which will perform well in a variety of economic conditions and will help reduce the portfolio’s overall volatility. In determining the optimum mix of assets, the board considers five factors:
• The expected rate of return for each asset class.
• The expected risk of each asset class.
• The correlation between the rates of return of the asset classes.
• The investment objectives and risk constraints of the fund.
• The impact of the portfolio’s volatility on the contribution rate.
While the board maintains a set policy allocation mix, they have taken steps to provide flexibility by granting authority to the CIO, with the approval of the external asset consultant and certification of the executive director, to make strategic allocation decisions based upon expectations for each sub-asset class. This flexibility has allowed the system to take advantage of changing market conditions. The board has placed ranges on the sub-asset class allocations in order to maintain appropriate risk controls. The table below illustrates the policy asset mix and ranges formally adopted by the board.
MOSERS Asset Allocation
AssetClass PolicyWeight AllocationRange PolicyBenchmarkPublicEquity 45.0% MSCIACWIDomestic Benchmark weight* +/- absolute 10%Int’l developed Benchmark weight* +/- absolute 10%Emerging markets Benchmark weight* +/- absolute 5%
PublicDebt 30.0% BlendedReturnCore fixed income 10.0% 5.0% - 15.0% Barclays AggregateTIPS 10.0% 5.0% - 15.0% Barclays TIPSHigh yield 5.0% 0.0% - 10.0% Barclays High YieldMarket neutral 5.0% 0.0% - 10.0% T-Bills + 4%
Alternatives 25.0% BlendedReturnReal assets 15.0% 10.0% - 20.0% Blended Return** Commodities 3.0% GSCITimber 6.0% NCREIF TimberlandREITs/private RE 6.0% Dow Jones U.S. Select REITsPrivate investments 10.0% 5.0% - 15.0% S&P 500 + 3%Private equity 7.5%Private debt 2.5%
* The public equity sub-asset class target allocations are not static weights. The weights float based upon capitalization of the MSCI ACWI benchmark.** The policy benchmark is based upon the blending of GSCI, NCREIF Timberland, and Dow Jones U.S. Select REITs at their policy benchmark weights.
Missouri State Employees’ Retirement System • Fiscal Year 2012 71
INVESTMENT SECTION
RebalancingIt is the responsibility of staff to ensure that the asset allocation adheres to the system’s rebalancing policy. Staff has engaged NISA Investment Advisors, LLC of St. Louis, Missouri, to assist in the oversight and implementation of the rebalancing policy. MOSERS utilizes a combination of cash market and exchange traded futures transactions to maintain the total fund’s allocation at the broad policy level. Month-end reviews are conducted to bring the portfolio back within allowable ranges of the broad policy targets.
Risk ControlsMOSERS’ investment program faces numerous risks; however, the primary risk to MOSERS is that the assets will not support the liabilities over long periods of time. In order to control this risk and numerous other risks that face the system, the board has taken the following steps, on an ongoing basis, to help protect the system:
• Actuarial valuations are performed each year to ensure the system is on track to meet the funding objectives of the plan. In addition, every five years an external audit of the actuary is conducted to ensure that the assumptions being made and calculation methods being utilized are resulting in properly computed liabilities.
• Asset/liability studies are conducted at least once every five years. The purpose of these studies is to ensure that the current portfolio design is structured to meet the system’s liabilities. During these studies, investment expectations are also reexamined in more detail.
• A governance policy, which incorporates investment limitations, is in place to ensure that board policies are clearly identified. Within these documents, desired outcomes are identified, responsibilities for individuals are identified in relation to particular areas of the portfolio’s management, and details are provided for measuring outcomes. Reporting requirements are clearly identified to ensure appropriate checks and balances are in place. In addition, annual performance audits are conducted to ensure the performance measurement tools and methodologies being utilized are proper.
Performance Objectives and Monitoring ProcessGenerating returns net of expenses equaling the RRO of 5.3% plus inflation remains the primary performance objective for the total fund over the long term.
The reason for the long-term focus on this objective is to preclude the temptation to overreact to events in the marketplace that have no relevance in the management of the relationship between the system’s assets and liabilities. The resulting dilemma is the conflicting need to evaluate investment policy implementation decisions over shorter time frames while maintaining the longer-term focus necessary to manage and measure the fund’s performance relative to the RRO. To address this problem, the board evaluates performance relative to policy and strategy benchmarks. This helps to evaluate the board’s broad policy decisions and the staff and external consultant’s implementation decisions. Policy benchmarks measure broad investment opportunities of each sub-asset class in which MOSERS has chosen to invest. The strategy benchmarks represent decisions made by the CIO to strategically deviate from the policy asset allocation for each sub-asset class. The return of the strategy benchmarks are determined based upon the actual weight of the asset class multiplied by the appropriate benchmark.
The policy and strategy benchmarks are used in the following manner to evaluate board and staff decisions:
• BoardDecisions: The value added through board policy decisions is measured by the difference between the total fund policy benchmark return and the RRO. This difference captures the value added by the board through their policy asset allocation decisions relative to the return necessary to fund the system’s liabilities. A policy benchmark return greater than the RRO reflects value added through board decisions. A policy benchmark return less than the RRO reflects losses or shortfalls in performance in funding the liabilities. These policy decisions are measured over long periods of time.
• CIOandExternalConsultants’Decisions: There are two components to decisions made by the CIO and external consultants, which are monitored by the board on an ongoing basis. They are: 1) strategic sub-asset class allocation decisions, and 2) implementation decisions.

Missouri State Employees’ Retirement System • Fiscal Year 201272
INVESTMENT SECTION
Strategy decisions are sub-asset class allocation choices made by the CIO with the approval of the external asset consultant and the certification of the executive director to deviate from the policy benchmark weight. The value added through these decisions to overweight or underweight these sub-asset classes is measured by the difference between the strategy benchmark return and the policy benchmark return. This difference captures the value added by the CIO through sub-asset class strategic decisions relative to the board’s broad policy allocation decisions. A strategy benchmark return greater than the policy benchmark return reflects value added through the sub-asset class allocation decisions. A strategy benchmark return less than the policy benchmark return reflects losses to the fund’s performance based upon strategy decisions. Strategy decisions should be measured over all periods of time with majority weight placed on outcomes that have occurred over a market cycle.
Implementation decisions are money manager selection choices made by the CIO with the approval of the appropriate external consultant and the certification of the executive director that the decision was made in accordance within the board’s adopted governance policy. The value added through these decisions is measured by the difference between the actual portfolio return and the strategy benchmark return. This difference captures the value added through these external manager selection decisions. An actual portfolio return greater than the strategy benchmark return reflects value added through these external manager selection decisions. An actual portfolio return less than the strategy benchmark return reflects losses to the fund’s performance based upon implementation decisions. Implementation decisions should be measured over all periods of time with a majority weight placed on outcomes that have occurred over a market cycle.
The board receives performance information on a quarterly basis to help ensure adequate monitoring of the fund’s overall performance objectives.
Asset ClassesAt the broad asset class level, policy and strategy benchmarks have been established to measure board, strategic, and implementation decisions. At the manager level, performance is measured against appropriate benchmarks for each particular investment mandate. Investment guidelines have been established for each manager outlining specific expectations for each portfolio. Many external managers are employed with performance-based fee structures, which help to align the manager’s interest with the total fund objectives.

Missouri State Employees’ Retirement System • Fiscal Year 2012 73
INVESTMENT SECTION
TOTAL FUND REVIEW
3 CPI Source: United States Department of Labor, Bureau of Labor Statistics (not seasonally adjusted).
As of June 30, 2012, the MOSERS investment portfolio had a market value of $7.7 billion. The graph to the right illustrates the growth of MOSERS’ portfolio since the system’s inception.
• • • •
Investment PerformanceMOSERS’ investments generated a return of 2.2%, net of fees, for FY12. The total fund return exceeded the 1-year policy benchmark of 1.2%. This additional 1% investment return produced $83 million over what would have been earned if the fund had been invested passively. The public debt asset class performance generated the highest return (7.4%) of the three major asset classes, contributing 2% to the total fund return. The global public equity return was -3% and alternative investments return was 5.6%. The table to the right illustrates the contribution to the total return from each sub-asset class.
Investment Performance vs. the Required Rate of ReturnThe total fund investment return is compared to a required rate of return. The required rate of return is established by the board to determine how well the fund is performing over the long term in order to meet future plan obligations after accounting for inflation. This funding objective for FY12 is equal to the RRO (5.3%) plus inflation. The best known measure of inflation is the Consumer Price Index (CPI).3
Given the unpredictability of the investment markets, the portfolio should not be expected to meet the required rate of every year. A review of long periods of time is best to evaluate whether or not the total return has kept pace with the system’s funding objectives.
Sub-Asset Class Returns for Fiscal Year Ended June 30, 2012
AssetClass FiscalYearReturnContributiontoTotalReturn
Totalpublicequity (3.0)% (1.2)%Domestic equity 6.2% 1.2%International developed equity (9.8)% (1.5)%Emerging markets (14.3)% (0.9)%
Totalpublicdebt 7.4% 2.0%Core fixed income 8.7% 0.8%TIPS 11.3% 1.0%High yield bonds 4.9% 0.2%Market neutral 0.6% 0.0%
Totalalternativesinvestments 5.6% 1.4%Real assets 4.3% 0.6%Commodities (5.9)% (0.2)%Real estate 9.5% 0.7%Timber 3.1% 0.1%Private investments 7.5% 0.8%Private equity 9.0% 0.6%Private debt 5.3% 0.2%
Totalfund 2.2%
$0
$2
$4
$6
$8
20121957
Total Fund Growth
Billi
ons
$7.7

Missouri State Employees’ Retirement System • Fiscal Year 201274
INVESTMENT SECTION
The bar chart to the right reflects that MOSERS’ investment returns have exceeded the required rate of return by 1.4% over the 20-year period ended June 30, 2012.4
Investment Performance vs. Benchmark ComparisonsIn addition to measuring performance relative to the required rate of return, the board also compares fund returns to the following two market benchmarks: the policy benchmark and the strategy benchmark.
The policy benchmark provides an indication of the returns that have been achieved (excluding transaction costs) by a portfolio invested passively in the broad market with percentage weights allocated to each asset class in MOSERS’ policy asset allocation. Comparison of the total return to the policy benchmark is a reflection of the extent to which the asset allocation (beta) kept pace with the system’s funding objectives. The total fund 1-year actual performance exceeded its policy benchmark by 1%, with the actual 3-, 5-, 10-, 15-, and 20-year returns also exceeding the policy benchmarks by 0.5%, 1%, 1.2%, 1.3% and 0.7%, respectively. The strategy benchmark is more narrowly defined and focuses on sub-asset class allocation decisions made by the CIO. By comparing the policy benchmark to the strategy benchmark, the board is able to determine the value added through strategic decisions (active management) made by the CIO. Value is created when the strategy benchmark returns exceed the policy benchmark returns.
Returns for the total fund versus these benchmarks are displayed in the bottom bar chart.
Similarly, by comparing the actual return to the strategy benchmark, the board will, over the long term, be able to judge the success or failure of the staff and the consultant in implementing the CIO’s strategic decisions. The primary implementation decision is in determining which managers the fund should employ. Value is added from manager selection when the total fund return exceeds the strategy benchmark return.
0%
3%
6%
9%
12%
15%
2.2
12.3
3.1
8.17.1
8.5
7.0 7.4 7.3 7.6 7.2 7.1
Total Fund Return (Nominal)Required Rate of Return
20 Year15 Year10 Year5 Year3 Year1 Year
Total Fund Return vs. Required Rate of Return
0%
2%
4%
6%
8%
10%
12%
14%
2.2
12.3
3.1
8.17.1
8.5
2.4
10.6
3.7
7.9
6.5
1.2
11.8
2.1
6.95.8
7.8
Total Fund Actual Return
Strategy Benchmark Return**
Policy Benchmark Return*
20 Year15 Year10 Year5 Year3 Year1 Year
Total Fund Actual Return vs. Benchmark Returns
* As of 6/30/12, the policy benchmark was comprised of the following components: 45% total public equity policy benchmark, 30% total public debt policy benchmark, and 25% total alternative investments policy benchmark.
** As of 6/30/12, the strategy benchmark was comprised of the following components: 45.4% total public equity strategy benchmark, 28.8% total public debt strategy benchmark, and 25.8% total alternative investments strategy benchmark. A strategy benchmark for the 20-year period is not available.
4 Performance returns are calculated using a time-weighted rate of return on market values.

Missouri State Employees’ Retirement System • Fiscal Year 2012 75
INVESTMENT SECTION
Investment Performance vs. Peer UniverseTo a lesser extent, the board compares total fund performance to the returns generated by a peer group of public pension funds and compiled by BNY Mellon Master Trust, a diverse global investment solutions firm with clients worldwide. Long-term performance is the best indicator of success. For the past 20-year period ended June 30, 2012, MOSERS’ total fund return outperformed 83% of the public pension funds in the BNY Mellon Master Trust universe of public pension plans with assets in excess of $1 billion. MOSERS’ total fund performance within the BNY Mellon Master Trust universe is provided in the graph above.
Total Fund Asset Allocation OverviewAs of June 30, 2012, the board’s broad policy allocation mix was 45% public equity, 30% public debt, and 25% alternative investments. The policy target as of June 30, 2012, for each sub-asset class, along with the actual strategic allocation to each type of investment is shown in the bar graph to the right.
The board has granted authority to the CIO to make strategic decisions related to the allocation subject to predefined sub-asset class ranges. A strategic decision should be thought of as any decision that might cause MOSERS’ actual portfolio to differ from the policy asset allocation.
This has allowed MOSERS to capitalize on investment opportunities at the margin by overweighting asset classes that are viewed as “cheap” relative to their historical norm and underweighting asset classes that are
16%
1 Year
14%
12%10%
8%
6%
4%
2%0%
-2%
-4%3 Year 5 Year 10 Year 15 Year 20 Year
Total Fund Return vs. BNY Mellon Universe*
* BNY Mellon master trust is a global investment solutions �rm with clients worldwide. �is universe data re�ects performance data of funds with assets in excess of $1 billion.
Percentile Rank 14th 9th 15th 4th 11th 17thObservations 74 70 69 61 47 37
BYN Mellon Universe Median Fund ReturnActual Total Fund Return
BYN Mellon Master Trust Universe
0% 5% 10% 15% 20% 25%
22.5
16.3
7.6
9.6
8.6
4.8
15.0
10.3
21.5
17.8
5.7
10.0
10.0
5.0
5.0
15.0
10.0
Actual - 46.4% Policy - 45%
PrivateInvestments
Real Assets
Market Neutral
High Yield
TIPS
Core FixedIncome
EmergingMarkets
InternationalDeveloped
Domestic
Total Fund Asset AllocationPolicy vs. Actual by Sub-Asset Class (As a Percentage of the Total Fund)*
PUBLIC EQUITY
PUBLIC DEBT
ALTERNATIVE INVESTMENTS
Actual - 28% Policy - 30%
Actual - 25.3% Policy - 25%
* Actual does not include 0.3% of cash.
5.0
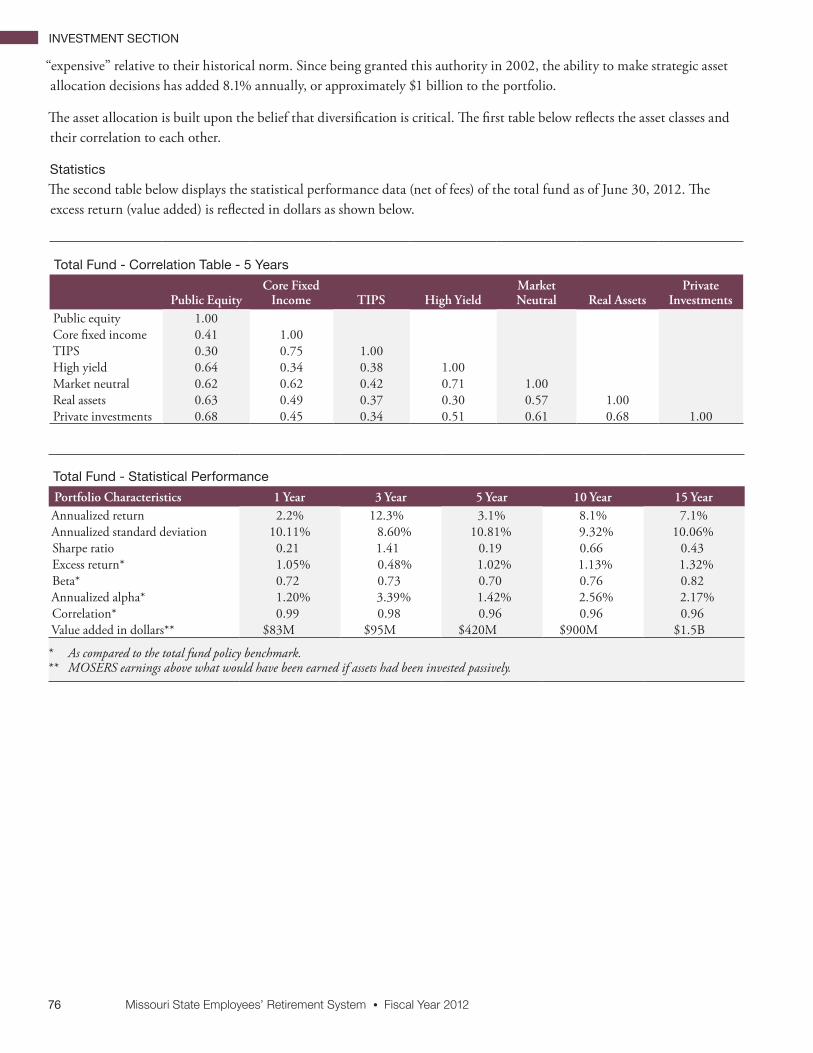
Missouri State Employees’ Retirement System • Fiscal Year 201276
INVESTMENT SECTION
“expensive” relative to their historical norm. Since being granted this authority in 2002, the ability to make strategic asset allocation decisions has added 8.1% annually, or approximately $1 billion to the portfolio.
The asset allocation is built upon the belief that diversification is critical. The first table below reflects the asset classes and their correlation to each other.
Statistics
The second table below displays the statistical performance data (net of fees) of the total fund as of June 30, 2012. The excess return (value added) is reflected in dollars as shown below.
Total Fund - Correlation Table - 5 Years
PublicEquityCoreFixedIncome TIPS HighYield
MarketNeutral RealAssets
PrivateInvestments
Public equity 1.00Core fixed income 0.41 1.00TIPS 0.30 0.75 1.00High yield 0.64 0.34 0.38 1.00Market neutral 0.62 0.62 0.42 0.71 1.00Real assets 0.63 0.49 0.37 0.30 0.57 1.00Private investments 0.68 0.45 0.34 0.51 0.61 0.68 1.00
Total Fund - Statistical Performance
PortfolioCharacteristics 1Year 3Year 5Year 10Year 15YearAnnualized return 2.2% 12.3% 3.1% 8.1% 7.1%Annualized standard deviation 10.11% 8.60% 10.81% 9.32% 10.06%Sharpe ratio 0.21 1.41 0.19 0.66 0.43Excess return* 1.05% 0.48% 1.02% 1.13% 1.32%Beta* 0.72 0.73 0.70 0.76 0.82Annualized alpha* 1.20% 3.39% 1.42% 2.56% 2.17%Correlation* 0.99 0.98 0.96 0.96 0.96Value added in dollars** $83M $95M $420M $900M $1.5B
* As compared to the total fund policy benchmark.** MOSERS earnings above what would have been earned if assets had been invested passively.

Missouri State Employees’ Retirement System • Fiscal Year 2012 77
INVESTMENT SECTION
TotalFees ManagerFeesPaid/Accrued
PerformanceFeesPublicequitymanagersBaillie Gifford EAFE Plus $ 588,187 $ 588,187 $ 0Blackstone Hedged Equity Fund, LP 995,951 995,951 0Blakeney Onyx, LP 2,222,877 2,222,877 0Eminence Fund, Ltd. 3,231,393 980,536 2,250,857Glenview Institutional Partners, LP 721,081 764,148 (43,067)Grantham, Mayo, and Van Otterloo & Company 1,172,595 1,172,595 0Legg Mason Opportunity Trust 455,865 455,865 0Leuthold Weeden Capital Management 658,711 658,711 0Morant Wright Investment Management 918,198 918,198 0Nippon Value Investors 815,275 815,275 0Pershing Square, LP 1,160,970 691,277 469,693Silchester International Investors 2,779,830 2,779,830 0SSGA Emerging Markets 69,158 69,158 0TPG - Axon Partners, Ltd. 681,421 465,133 216,288Viking Global Equities III, Ltd. 2,873,946 1,200,768 1,673,178Total public equity managers 19,345,458 14,778,509 4,566,949
PublicdebtmanagersAshmore Emerging Markets Debt and Currency Fund 507,845 507,845 0Bayview Opportunity Domestic, LP 2,286,489 1,111,622 1,174,867BlackRock Financial Management Mortgage Opportunities 305,284 305,284 0BlackRock Financial Management Bank Loans 344,316 344,316 0BlackRock Financial Management High Yield 345,141 345,141 0Stone Harbor Investment Partners 395,665 395,665 0Total public debt managers 4,184,740 3,009,873 1,174,867
AlternativeinvestmentmanagersActis Emerging Markets III 919,057 919,057 0African Development Partners I, LLC 563,017 563,017 0Alinda Infrastructure Fund I, LP 424,179 424,179 0American Industrial Partners Capital Fund V, LP 204,164 204,164 0Axiom Asia Private Capital Fund II, LP 330,572 400,000 (69,428)Axxon Brazil Private Equity Fund II B, LP 579,037 579,037 0Bayview Opportunity Domestic LP 222,000 118,908 103,092Blackstone Real Estate Partners IV (1,453,498) 625,587 (2,079,085)Blackstone Real Estate Partners V 7,139,371 1,202,210 5,937,161Blackstone Real Estate Partners VI 5,819,614 1,001,422 4,818,192Blackstone Real Estate Partners VII 794,553 624,167 170,386Bridgepoint Europe III A, LP 224,744 224,744 0Bridgepoint Europe IV B, LP 477,753 477,753 0Campbell Timber Fund II A, LP 470,049 470,049 0CarVal Investors CVI Global Value Fund A, LP 1,571,216 1,571,216 0Catalyst Fund Limited Partnership III 1,339,026 857,500 481,526Catterton Partners V, LP 416,244 246,644 169,600Catterton Partners VI, LP 4,209,403 459,335 3,750,068DRI Capital - LSRC 388,543 122,671 265,872DRI Capital - LSRC II 149,998 149,998 0Garnet Sky Investors Company, Ltd. 691,160 594,880 96,280Global Forest Partners GTI7 Institutional Investors Company, Ltd. 579,828 579,828 0Harvest Fund Advisors, LLC 1,645,257 396,239 1,249,018JLL Partners Fund V, LP (1,864) 250,285 (252,149)JLL Partners Fund VI, LP 2,245,943 1,088,544 1,157,399
Continued on page 78
Investment Manager FeesFor the Year Ended Ended June 30, 2012

Missouri State Employees’ Retirement System • Fiscal Year 201278
INVESTMENT SECTION
TotalFees ManagerFeesPaid/Accrued
PerformanceFeesLinden Capital Partners II, LP 392,061 392,061 0Merit Energy Partners F II, LP 139,049 139,049 0MHR Institutional Partners II A, LP 50,152 369,027 (318,875)MHR Institutional Partners III, LP 1,190,335 1,190,335 0Millennium Technology Value Partners II 114,022 114,022 0New Mountain Partners III, LP 573,001 573,001 0NISA Investment Advisors 332,163 332,163 0OCM/GFI Power Opportunities Fund II, LP 808,952 25,779 783,173OCM Opportunities Fund IVB, LP 293 0 293OCM Opportunities Fund VII B, LP 1,802,075 1,218,200 583,875OCM Opportunities Fund VIII B, LP 222,045 222,045 0OCM Power Opportunities III, LP 450,000 450,000 0OCM Real Estate Opportunities Fund III, LP 7,775,825 28,578 7,747,247Parish Capital Buyout Fund I, LP 899,218 232,397 666,821Parish Capital Buyout Fund II, LP 230,516 230,516 0Parish Opportunities Fund II, LP 139,581 118,716 20,865Resource Management Service - Wildwood Timberlands, LLC 96,297 751,535 (655,238)Silver Lake Partners II, LP (443,501) 140,630 (584,131)TCW Energy Partners, LLC 8,820 7,800 1,020TCW Energy Fund XIV, LP 2,917,918 549,060 2,368,858TCW Energy Fund XV, LP 1,559,266 498,191 1,061,075TPG Airline Credit Opportunities, LP 1,146,978 599,928 547,050The Veritas Capital Fund III, LP 852,137 0 852,137The Veritas Capital Fund IV, LP 751,154 751,154Total alternative investment managers 51,957,723 23,085,621 28,872,102
AlphapoolmanagersAQR Absolute Return Institutional Fund, LP 495,549 495,549 0AQR DELTA Sapphire Fund, LP 1,225,155 1,225,155 0Blackstone Topaz Fund, LP 2,900,919 2,900,919 0Brevan Howard, LP 3,153,131 1,054,766 2,098,365Brevan Howard Emerging Market Strategies Fund, LP 602,265 339,439 262,826Bridgewater Associates - Diamond Ridge Fund, LLC 2,767,930 2,767,930 0Claren Road Credit Partners, LP 2,437,580 1,562,813 874,767COMAC Global Macro Fund, LP 1,107,621 827,132 280,489CQS ABS Feeder Fund, Ltd. 909,756 341,349 568,407Davidson Kempner Institutional Partners, LP 3,575,498 1,040,876 2,534,622Diamondback Partners, LP 1,100,423 1,100,423 0Elliott International, Ltd. 1,450,355 897,921 552,434Empyrean Capital Fund, LP 1,177,157 1,177,157 0Eton Park Fund, LP 817,415 893,041 (75,626)Farallon Capital Institutional Partners, LP 446,570 309,096 137,474HBK Offshore Fund, Ltd. 2,321,940 1,244,018 1,077,922King Street Capital, LP 1,305,655 1,195,684 109,971King Street Capital, Ltd. 146,199 22,256 123,943PAAMCO - Newport Pioneer, LLC 133,757 384,187 (250,430)Pharo Macro Fund, Ltd. 1,360,596 1,328,406 32,190Visium Balanced Fund, LP 1,023,870 880,196 143,674Total alpha pool managers 30,459,341 21,988,313 8,471,028
OthermanagersNISA Investment Advisors 1,560,219 1,560,219 0MOSERS Inc. 145 145 0Total other managers 1,560,364 1,560,364 0
Grandtotals $107,507,626 $64,422,680 $43,084,946
Investment Manager Fees continued from page 77

Missouri State Employees’ Retirement System • Fiscal Year 2012 79
INVESTMENT SECTION
Schedule of Investment Portfolios by Asset ClassAs of June 30, 2012
FairValuePercentageof
InvestmentsatFairValuePublicglobalequityDomestic equity $1,724,696,266 22.5%International developed equity 1,251,600,067 16.3Emerging markets equity 584,117,000 7.6Total public global equity 3,560,413,333 46.4
PublicdebtCore fixed income 732,714,918 9.6High yield bonds 367,916,056 4.8TIPS 660,448,998 8.6Market neutral 386,921,233 5.0Total public debt 2,148,001,205 28.0
AlternativeinvestmentsReal assets 1,146,561,549 15.0Private investments 787,985,716 10.3Total alternative investments 1,934,547,265 25.3
Cashandothermiscellaneousinvestments 21,901,926 0.3
Grand total $7,664,863,729 100.0%
Reconciliation to Statements of Plan Net AssetsTotal portfolio value 7,664,863,729 STIF (933,019,137)Uninvested cash 41,902,633 Interest and dividend receivable (26,262,959)Variation margin (12,315,809)AR securities sold (9,026,051)AP securities purchased 12,932,642 Incentive fees payable 15,853,386 Securities lending liability 2,330,804 Miscellaneous adjustment (18,398)Investments per Statements of Plan Net Assets (page 27) $6,757,240,840

Missouri State Employees’ Retirement System • Fiscal Year 201280
INVESTMENT SECTION
Schedule of Investment Results*1-, 3-, 5-, 10- , 15 - and 20-Year Periods
1Year 3Year 5Year 10Year 15Year 20YearTotalFundMOSERS 2.2% 12.3% 3.1% 8.1% 7.1% 8.5%Composite total return benchmark 1.2% 11.8% 2.1% 6.9% 5.8% 7.8%
PublicequityMOSERS (3.0)% 12.5% 0.3% 7.6% 6.4% 8.8%Public equity composite benchmark (6.5)% 10.8% (2.9)% 5.3% 4.3% 7.3%
PublicdebtMOSERS 7.4% 10.6% 6.2% 7.1% 7.6% 7.6%Public debt composite benchmark 8.3% 8.9% 7.5% 7.3% 7.7% 7.5%
AlternativesMOSERS 5.6% 12.7% 3.8% 9.9% N/A N/AAlternatives composite benchmark 5.8% 15.8% 3.4% 8.9% N/A N/A
* Time weighted rates of return, net of all investment fees and expenses, on market values adjusted for cash flows.
TotalFund - As of 6/30/12, the total fund policy benchmark was comprised of the following components: 45% total public equity policy benchmark, 30% total public debt policy benchmark, and 25% total alternative investments policy benchmark. The individual asset class benchmarks, as listed below are used to generate the total fund policy benchmark.
• PublicEquity - As of 6/30/12, the policy benchmark was based on the capitalization of the MSCI ACWI benchmark which at that date was 39.5% MSCI World Ex U.S. Net, 47.9% MSCI U.S. Net, and 12.6% MSCI Emerging Markets Net. Similar benchmarks were used in previous years.
• PublicDebt - As of 6/30/12, the public debt policy benchmark was comprised of 33.3% Barclays Aggregate, 33.3% Barclays U.S. TIPS,16.7% Barclays High Yield, and 16.7% T-Bills + 4%. Similar benchmarks were used in previous years.
• AlternativeInvestments - As of 6/30/12, the alternative investments policy benchmark was comprised of the following components: 40% S&P 500 + 3%, 24% Dow Jones U.S. Select REIT Index, 24% NCREIF Timber, and 12% S&P GSCI Total Return Index. This program did not begin until July 2002. Similar benchmarks were used in previous years.

Missouri State Employees’ Retirement System • Fiscal Year 2012 81
INVESTMENT SECTION
PUBLIC EQUITYAsset Class Summary
As of June 30, 2012, the public equity portfolio had a market value of $3.6 billion, representing 46.4% of the total fund. Performance for the fiscal year was -3.0%, net of fees and expenses.
• • • •
HighlightsThere were some strategic changes in the make-up of the public equity portion of the portfolio; one manager was removed and some allocations were altered. Here are the highlights:
• A domestic equity manager was terminated due to unsatisfactory investment returns. The assets were split among existing managers.
• An overweight to large multi-national U.S. companies concentrated in technology, health care, consumer staples and energy sectors was maintained and was a significant contributor to outperforming the benchmark.
• Within emerging equity, significant exposure to frontier markets was maintained in an effort to capture the best growth opportunities with attractive valuations.
• Within international developed, an overweight to Japanese equities that has been in place for several years added meaningful diversification to the portfolio and contributed value to the portfolio.
Portfolio StructureThe public equity portfolio has a target allocation of 45% of the total fund. This portfolio is considered global equity and therefore benchmarked against the MSCI All Country World Net Index (ACWI).
As of June 30, 2012, the portfolio includes domestic equity, international developed equity, and emerging markets equity. The policy allocations to each component are not static weights. The weights float based upon capitalization of the MSCI ACWI benchmark. As part of the implementation plan, hedged equity managers are utilized as a risk reducing tool. The bar chart above illustrates the actual allocation relative to the board’s policy benchmark. Differences reflect the CIO’s strategic decisions to overweight or underweight as of June 30, 2012.
Market OverviewThe MSCI ACWI returned -6.5% for the fiscal year. The disappointing performance was due to the international equity markets providing a return of -14.6%. Nearly 4% of this negative performance was due to the strength of the U.S. dollar. The debt situation in Europe continues to be a drag on the equity markets. The uncertainty surrounding the Euro zone adds to the U.S. dollar strength as investors seek safety in the U.S. equity and bond markets. While the domestic equity market returned over 4% for the year, the slow economy and global uncertainty kept markets in check in spite of strong profits and clean balance sheets. The U.S. housing market is starting to show signs of life but high unemployment and low growth continue to provide resistance.
The emerging markets were a disappointment during the fiscal year. The MSCI emerging markets index was down 16% for the year. China’s economic growth could continue to slow from its second-quarter of calendar 2012 rate of 7.6%, which was already the slowest in three years. Some of the other emerging markets continue to show a growing consumer economy
0% 5% 10% 15% 20% 25%
22.5
16.3
7.6
21.5
17.8
5.7Actual
Policy Emerging
Markets
InternationalDeveloped
Domestic
Public Equity AllocationPolicy vs. Actual (As a Percentage of the Total Fund)
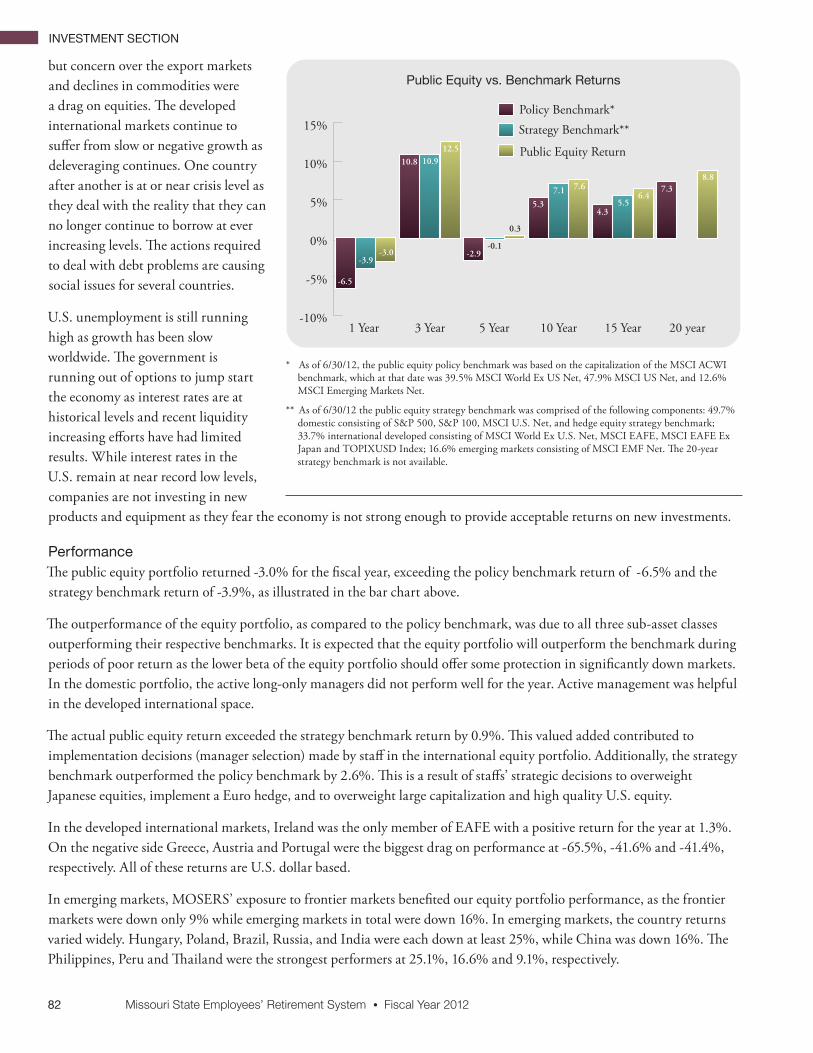
Missouri State Employees’ Retirement System • Fiscal Year 201282
INVESTMENT SECTION
but concern over the export markets and declines in commodities were a drag on equities. The developed international markets continue to suffer from slow or negative growth as deleveraging continues. One country after another is at or near crisis level as they deal with the reality that they can no longer continue to borrow at ever increasing levels. The actions required to deal with debt problems are causing social issues for several countries.
U.S. unemployment is still running high as growth has been slow worldwide. The government is running out of options to jump start the economy as interest rates are at historical levels and recent liquidity increasing efforts have had limited results. While interest rates in the U.S. remain at near record low levels, companies are not investing in new products and equipment as they fear the economy is not strong enough to provide acceptable returns on new investments.
PerformanceThe public equity portfolio returned -3.0% for the fiscal year, exceeding the policy benchmark return of -6.5% and the strategy benchmark return of -3.9%, as illustrated in the bar chart above.
The outperformance of the equity portfolio, as compared to the policy benchmark, was due to all three sub-asset classes outperforming their respective benchmarks. It is expected that the equity portfolio will outperform the benchmark during periods of poor return as the lower beta of the equity portfolio should offer some protection in significantly down markets. In the domestic portfolio, the active long-only managers did not perform well for the year. Active management was helpful in the developed international space.
The actual public equity return exceeded the strategy benchmark return by 0.9%. This valued added contributed to implementation decisions (manager selection) made by staff in the international equity portfolio. Additionally, the strategy benchmark outperformed the policy benchmark by 2.6%. This is a result of staffs’ strategic decisions to overweight Japanese equities, implement a Euro hedge, and to overweight large capitalization and high quality U.S. equity.
In the developed international markets, Ireland was the only member of EAFE with a positive return for the year at 1.3%. On the negative side Greece, Austria and Portugal were the biggest drag on performance at -65.5%, -41.6% and -41.4%, respectively. All of these returns are U.S. dollar based.
In emerging markets, MOSERS’ exposure to frontier markets benefited our equity portfolio performance, as the frontier markets were down only 9% while emerging markets in total were down 16%. In emerging markets, the country returns varied widely. Hungary, Poland, Brazil, Russia, and India were each down at least 25%, while China was down 16%. The Philippines, Peru and Thailand were the strongest performers at 25.1%, 16.6% and 9.1%, respectively.
-10%
-5%
0%
5%
10%
15%
-3.0
12.5
0.3
7.66.4
8.8
-3.9
10.9
-0.1
7.15.5
-6.5
10.8
-2.9
5.34.3
7.3
Public Equity Return
Strategy Benchmark**Policy Benchmark*
20 year15 Year10 Year5 Year3 Year1 Year
Public Equity vs. Benchmark Returns
* As of 6/30/12, the public equity policy benchmark was based on the capitalization of the MSCI ACWI benchmark, which at that date was 39.5% MSCI World Ex US Net, 47.9% MSCI US Net, and 12.6% MSCI Emerging Markets Net.
** As of 6/30/12 the public equity strategy benchmark was comprised of the following components: 49.7% domestic consisting of S&P 500, S&P 100, MSCI U.S. Net, and hedge equity strategy benchmark; 33.7% international developed consisting of MSCI World Ex U.S. Net, MSCI EAFE, MSCI EAFE Ex Japan and TOPIXUSD Index; 16.6% emerging markets consisting of MSCI EMF Net. �e 20-year strategy benchmark is not available.

Missouri State Employees’ Retirement System • Fiscal Year 2012 83
INVESTMENT SECTION
Additional Portfolio InformationThe tables as titled below show the top ten publicly traded separate account holdings, the brokerage activity, and the soft dollar expenditures that occurred within the public equity portfolio in FY12.
Public Equity - Top Ten Publicly Traded Separate Account Holdings
TenLargestHoldingsasofJune30,2012* MarketValue PercentoftheTotalPublicEquityPortfolioSanofi-Aventis $22,372,069 0.62%Novaritis AG 18,965,433 0.53Kao Corporation 17,921,941 0.50Roche Holding AG 17,059,676 0.48UBS AG 14,770,185 0.41Wolters Kluwer N.V. 13,548,803 0.38Credit Suisse Group 13,464,380 0.38Total SA 13,239,144 0.37Vodafone Group PLC 12,099,051 0.34BAE Systems PLC 12,032,521 0.34
* For a complete list of holdings contact the Manager of Investment Policy & Communications
Public Equity - Brokerage Activity
Commissions
BrokerageFirm SharesTraded DollarVolumeofTrades DollarAmount ValuePerShareWeeden & Company 7,004,621 $237,442,115 $137,518 $0.02 RBC Capital Markets, LLC 5,145,567 122,708,899 26,435 0.01 Bernstein Sandford C & Co. 4,463,934 44,291,279 69,836 0.02 Raymond James & Associaties, Inc. 2,884,977 21,221,126 89,805 0.03 Fidelity Cap Markets 2,802,572 74,895,941 55,837 0.02 BNY Convergex 1,798,797 41,252,665 35,976 0.02 Barclays Capital LE 1,748,693 25,841,648 49,428 0.03 Credit Suisse 1,509,760 14,057,857 49,224 0.03 Knight Equity Markets, LP 1,056,625 15,254,254 5,402 0.01 Investment Technology Group 963,635 8,033,827 9,466 0.01 Citigroup Global Markets, Inc. 930,960 16,384,550 28,298 0.03 UBS Securities, LLC 852,584 8,162,303 9,471 0.01 Jefferies & Company, Inc. 755,975 5,924,835 19,507 0.03 Merrill Lynch Pierce Fenner Smith, Inc. 737,974 15,568,140 20,034 0.03 UBS Equities 646,141 4,586,723 2,293 0.00 CSI 614,350 7,731,659 20,125 0.03 Morgan Stanley & Company, Inc. 603,053 18,660,208 17,316 0.03 Goldman Sachs & Company 545,765 8,607,536 19,684 0.04 Deutsche Bank 431,024 2,051,354 4,284 0.01 Liquidnet, Inc. 429,600 9,709,699 8,506 0.02 Others (88, each contributing less than 1%) 6,870,102 87,249,908 170,415 0.02 Total 42,796,709 $789,636,526 $848,860 $0.02
Public Equity - Soft Dollar Expenditures* TypesofServiceAcquired CommissionsUsed PercentageofTotalMarket research $ 13,094 7.4%Consulting/benchmarks 5,466 3.1Research services 156,290 89.0Trading/analytic services 827 0.5Total $175,677 100.0%
* These expendable excess commissions are permitted under current Securities Exchange Commission (SEC) guidelines and represent less than 20.7% of MOSERS’ agency commissions.

Missouri State Employees’ Retirement System • Fiscal Year 201284
INVESTMENT SECTION
DOMESTIC EQUITY
Market ValueThe domestic equity allocation was $1.7 billion, or 22.5% of the total fund as of June 30, 2012.
Summary of PortfolioMOSERS’ domestic equity portfolio maintains a significant allocation to publicly traded shares of corporations based in the U.S. domestic equity exposure is achieved through broadly diversified portfolios representing a variety of styles, sectors, market capitalizations, and an allocation to the beta/alpha program (see pages 102-103 for further details). This portfolio is expected to contribute significantly to the fund’s achievement of a long-term real return in excess of the 5.3% objective set by the board. It is expected that this portfolio will perform well in periods of falling inflation and rising growth and offer income potential through dividend payments. MOSERS’ allocation to domestic equity of 22.5% was overweight to the policy MSCI ACWI weightings to domestic equity of 21.5% at June 30, 2012.
Additional Portfolio InformationMOSERS had contracts with eight external investment advisors who manage assets that comprise 40.5% of the domestic equity portfolio. The remaining 59.5% of the portfolio is in the beta/alpha program described on pages 102-103. One domestic equity manager was terminated in FY12. Management fees can be found on pages 77-78.
The tables as titled below show the investment advisors and statistical performance for the domestic equity portfolio as of June 30, 2012.
Domestic Equity - Statistical Performance
PortfolioCharacteristics 1Year 3Year 5Year 10YearAnnualized return 6.2% 16.6% 1.2% 6.5%Annualized standard deviation 17.59% 14.77% 17.10% 15.28%Sharpe ratio 0.35 1.12 0.02 0.31Excess return* 1.79% 0.83% 1.55% 1.02%Beta* 0.95 0.90 0.86 0.93Annualized alpha* 1.85% 2.06% 1.35% 1.32%Correlation* 1.00 0.99 0.97 0.97
* As compared to the domestic equity policy benchmark.
Domestic Equity - Investment Advisors
InvestmentAdvisorsName Style PortfolioMarketValueBeta/alpha - program Active $1,026,633,438 Blackstone Alternative Asset Management Hedged equity 102,291,812 Eminence Capital Hedged equity 87,081,648 Glenview Capital Hedged equity 37,953,520 Legg Mason Opportunity Trust Active all-cap growth 110,451,011 Leuthold Weeden Active all-cap growth 165,717,825 Pershing Square Hedged equity 43,369,744 TPG-Axon Hedged equity 47,653,510 Viking Global Investors Hedged equity 103,543,758
$1,724,696,266

Missouri State Employees’ Retirement System • Fiscal Year 2012 85
INVESTMENT SECTION
INTERNATIONAL DEVELOPED EQUITY
Market ValueAs of June 30, 2012, the international developed equity allocation was $1.3 billion, or 16.3% of the total fund.
Summary of PortfolioThe international developed equity portfolio consists of publicly traded shares of corporations based in non-U.S developed countries. Equity exposure is achieved through broadly diversified portfolios representing a variety of styles; sectors, market capitalizations, and an allocation to the beta/alpha program (see pages 102-103 for further details). This portfolio is expected to contribute significantly to the fund’s achievement of a long-term real return in excess of the 5.3% objective set by the board. It is expected that this portfolio will perform well in periods of falling inflation and rising growth and offer income potential through dividend payments. As of June 30, 2012, MOSERS’ allocation of 16.3% was underweight to the policy MSCI ACWI weighting of 17.8% for international developed countries.
Additional Portfolio InformationMOSERS had contracts with four external investment advisors who manage assets that comprise 68.9% of the international developed equity portfolio. The remaining 31.1% of the portfolio is in the beta/alpha program described on pages 102-103. There were no managers hired or terminated in the international developed equity portfolio in FY12. Management fees can be found on pages 77-78.
The tables as titled below show the investment advisors and statistical performance for the domestic equity portfolio as of June 30, 2012.
International Developed Equity - Statistical Performance
PortfolioCharacteristics 1Year 3Year 5Year 10YearAnnualized return (9.8)% 8.6% 0.3% 8.4%Annualized standard deviation 19.46% 16.53% 18.33% 15.57%Sharpe ratio (0.51) 0.52 (0.03) 0.43Excess return* 4.29% 2.40% 5.99% 3.05%Beta* 0.81 0.81 0.75 0.79Annualized alpha* 1.57% 3.13% 4.24% 3.73%Correlation* 0.98 0.99 0.97 0.97
* As compared to the international developed equity policy benchmark.
International Developed Equity - Investment Advisors
InvestmentAdvisors Style PortfolioMarketValueBaillie Gifford Active growth int’l developed $ 112,556,962 Beta/alpha program Active 388,774,855 Morant Wright Management Active Japan 92,756,420 Nippon Value Investors Active Japan 93,962,118 Silchester International Investors Active growth int’l developed 563,522,911 Miscellaneous international equity Active growth int’l developed 26,801
$1,251,600,067

Missouri State Employees’ Retirement System • Fiscal Year 201286
INVESTMENT SECTION
EMERGING MARKET
Market ValueAs of June 30, 2012, the emerging market equity portfolio was $584 million, or 7.6% of the total fund.
Summary of PortfolioThe emerging market equity allows for participation in publicly traded shares of corporations based in the emerging economies across the globe. This equity exposure is achieved through broadly diversified portfolios representing a variety of styles; sectors, market capitalizations, and an allocation to the beta/alpha program (see pages 102-103 for further details). The emerging markets equity portfolio is expected to contribute significantly to the fund’s achievement of a long-term real return in excess of the 5.3% objective set by the board. As of June 30, 2012, MOSERS’ allocation of 7.6% was overweight to the policy MSCI ACWI weighting of 5.7% for emerging market countries. This portfolio provides diversification associated with holding non-dollar assets and offers some of the best fundamental valuations available from equity markets around the globe.
Additional Portfolio InformationMOSERS had contracts with three external investment advisors who manage assets that comprise 76.1% of the emerging market equity portfolio. The remaining 23.9% of the portfolio is in the beta/alpha program described on pages 102-103. There were no managers hired and or terminated in the emerging markets portfolio in FY12. Management fees can be found on pages 77-78.
The tables as titled below show the investment advisors and statistical performance for the domestic equity portfolio as of June 30, 2012.
Emerging Market Equity - Statistical Performance
PortfolioCharacteristics 1Year 3Year 5Year 10YearAnnualized return (14.3)% 9.6% 2.1% 15.9%Annualized standard deviation 25.16% 20.66% 26.04% 21.47%Sharpe ratio (0.57) 0.46 0.04 0.65Excess return* 1.34% (0.54)% 1.95% 1.55%Beta* 0.83 0.88 0.84 0.84Annualized alpha* (1.78)% 0.45% 1.50% 3.21%Correlation* 0.99 0.98 0.97 0.97* As compared to the emerging market equity policy benchmark.
Emerging Market Equity - Investment AdvisorsInvestmentAdvisors Style PortfolioMarketValueBeta/alpha program Index $139,314,228 Blakeney Management Active value frontier markets 126,023,793 GMO Active growth 147,479,616 State Street Global Advisors Index 170,860,199 Miscellaneous emerging markets Index 439,164
$584,117,000

Missouri State Employees’ Retirement System • Fiscal Year 2012 87
INVESTMENT SECTION
0% 2% 4% 6% 8% 10%
9.6
8.6
4.8
5.0
10.0
10.0
5.0
5.0 Actual Policy
MarketNeutral
High Yield
TIPS
Core FixedIncome
Public Debt AllocationPolicy vs. Actual (As a Percentage of the Total Fund)
PUBLIC DEBTAsset Class Summary
As of the fiscal year ending June 30, 2012, the public debt allocation had a market value of $2.2 billion, representing 28% of the total fund. Performance for the fiscal year was 7.4%, net of fees and expenses.
• • • •
HighlightsThere were some modest tactical changes made to the public debt portfolio during the fiscal year:
• The substantial overweight to treasuries initiated in 2007 was maintained, with the offsetting underweight coming primarily from investment grade corporate securities and government guaranteed mortgages.
• The emerging market debt exposure added in 2011 was increased in the core portfolio and maintained in the high yield portfolio, adding significantly to portfolio yield and non-dollar currency exposure.
• The overweight to high yield was reduced throughout the year as credit spreads were no longer at compelling levels. The high yield allocation diminished from 5.3% to a 4.8% weight, which is almost a neutral position compared to the policy weight of 5%.
• Within high yield, significant exposure continued to be maintained in security classes carrying attributes of high yield that are not represented within the benchmark, namely bank loans and mortgage securities/whole loans. These non-index securities are generally believed to carry more protection in downside scenarios and, in some cases, offer inflation protection in the form of floating rate coupons.
Portfolio StructureThe public debt portfolio has a target allocation of 30% of the total fund. This portfolio is comprised of four sub-asset classes which include core fixed income, high yield bonds, treasury inflation protected securities (TIPS) and market neutral. The bar chart above illustrates the actual sub-asset allocations relative to the board’s policy allocation for each of these sub-asset classes. Differences reflect the CIOs strategic decisions to overweight or underweight sub-asset classes as of fiscal year end.
Market OverviewA recovery in the financial markets and economic activity that began in the first half of calendar year 2009, continued throughout most of FY12 with some signs of fading due, in part, to the end of stimulus programs, both perceived and actual, as well as economic and financial issues worsening in Europe. As of the end of FY12, the federal funds target rate was zero to 0.25% and the Federal Reserve Board (Fed) stated that the economy was “expanding moderately” and was expected to continue at that pace over the near term and gradually to pick up over time. The Fed “expects to maintain a highly accommodative stance” as “strains in global financial markets continue to pose significant downside risks to the economic outlook.”
The Fed completed its second round of quantitative easing at the end of FY11, but continued to reinvest principal payments and extend the average maturity of its security holdings so as to “put downward pressure on longer-term interest rates and help to make broader financial conditions more accommodative.” The Fed has maintained its zero interest rate policy since December 2008.

Missouri State Employees’ Retirement System • Fiscal Year 201288
INVESTMENT SECTION
Long treasury prices rallied substantially during the fiscal year as long-term interest rates declined sharply from the beginning of the period from 4.37% to 2.75% at the end of the fiscal year. Short-term rates remained low as the Fed maintained the federal funds rate constant, and market participants continued to show a strong interest in the short-end of the yield curve, seeking liquidity and safety. The curve flattened significantly during the fiscal year, moving closer to its historical average.
The broad debt market as represented by the Barclays Capital Aggregate Index experienced a return of 7.5% during the fiscal year. The three major components of the Aggregate Index, in order of their size contributions to the index, are treasuries, the securitized segment (largely mortgage-backed securities), and corporates. Fiscal year returns for these broad market components were 9.0%, 5.1% and 9.7%, respectively. Apart from the Aggregate Index are three other important segments of the bond market, TIPS, high yield and external emerging markets debt (as distinguished from local currency denominated or internal debt). Fiscal year returns for these bond market segments were 11.7%, 7.3% and 9.0%, respectively. As the fiscal year progressed, yield premiums for credit risk increased commensurate with the general economic slowing and increased risk to the economy from European weakness. The degree of credit deterioration is best measured by investment grade corporate spreads, which widened by 44 basis points over the fiscal year with high yield spreads having widened by 88 basis points.
Overall, the general theme for FY12 was financial markets and the economy continuing to recover from the turmoil experienced in 2008, albeit modestly. World government intervention through monetary and fiscal stimulus helped improve the global economy, but the overhang of large debt burdens in several developed countries (with European sovereigns being of particular focus in FY12) continues to cause financial stress in the global financial markets and economies. Global growth has been muted, as over-indebted countries implement austerity programs and governments have de-escalated the monetary and fiscal stimulus that was implemented during the crisis. The timing and solution to the European debt issues will have a significant impact on global growth and market conditions over the next several years.
PerformanceThe public debt portfolio returned 7.4% for the fiscal year, significantly underperforming the policy benchmark return of 8.3% and the strategy benchmark return of 8.3%. The bar chart at the top of the page illustrates performance over longer periods of time.
During the fiscal year, the underperformance relative to the policy benchmark was attributable to the implementations primarily within market neutral and high yield. The portfolio is currently positioned with less interest rate risk than is the policy benchmark, a factor that may enable better long-term performance relative to the benchmark as interest rates are at historical lows and likely will rise in the event of a more sustained economic recovery, although imminent recovery may not be attainable over the next several quarters due, in large part, to the headwinds of the European debt crisis and its collateral impact upon the global economy and banking system.
0%
2%
4%
6%
8%
10%
12%
7.4
10.6
6.27.1
7.6 7.68.3 8.3
7.2 7.37.7
8.38.9
7.5 7.37.7 7.5
Public Debt Return
Strategy Benchmark**
Policy Benchmark*
20 Year15 Year10 Year5 Year3 Year1 Year
Public Debt vs. Benchmark Returns
* As of 6/30/12, the public debt policy benchmark was comprised of the following components: 33.3% Barclays Aggregate Index; 33.3% Barclays U.S. TIPS Index; 16.7% Barclays High Yield Index; and 16.7% T-Bills + 4%.
** As of 6/30/12, the public debt strategy benchmark was comprised of the following components: 34.4% core bonds consisting of various components of debt indices; 30.8% Barclays U.S. TIPS Index; 16.6% high yield bonds consisting of various components of debt indices and actual portfolio returns; and 18.2% market neutral consisting of T-Bills + 4%. �e 20-year strategy benchmark is not available.

Missouri State Employees’ Retirement System • Fiscal Year 2012 89
INVESTMENT SECTION
Additional Portfolio InformationThe tables as titled below show the top ten publicly traded separate account holdings and the brokerage activity that occurred within the public debt portfolio in FY12.
Public Debt - Top Ten Publicly Traded Separate Account Holdings
TenLargestHoldingasofJune30,2012* MarketValuePercentofTotalMOSERSPublicDebtPortfolio
U.S. Treasury Inflation Index Note - 2.000%, 2014 $80,581,491 3.8%U.S. Treasury Inflation Index Note - 0.125%, 2016 74,917,711 3.5U.S. Treasury Inflation Index Bond - 2.375%, 2027 64,929,448 3.1U.S. Treasury Inflation Index Bond - 2.375%, 2025 63,884,017 3.0U.S. Treasury Inflation Index Note - 0.500%, 2015 47,189,874 2.2U.S. Treasury Inflation Index Note - 0.625%, 2021 45,532,429 2.1U.S. Treasury Inflation Index Note - 2.625%, 2017 43,436,533 2.0U.S. Treasury Inflation Index Note - 0.125%, 2022 43,066,614 2.0U.S. Treasury Inflation Index Note - 2.375%, 2017 34,267,719 1.6U.S. Treasury Inflation Index Bond - 1.750%, 2028 32,622,818 1.5
*For a complete list of holdings contact the Manager of Investment Policy & Communications
Brokerage Activity
Broker/DealerFirm ParAmountTraded MarketValueTraded
PercentofTotalTradingVolumebyMarketValue
Barclays $216,219,708 $224,551,621 27.6%Citigroup 101,265,809 116,082,316 14.2Bank of Nova Scotia 106,194,866 104,111,758 12.8Credit Suisse 66,252,430 72,046,130 8.8JP Morgan 41,097,233 52,138,131 6.4Merrill Lynch 46,608,188 50,110,362 6.2Jefferies 28,236,955 27,767,799 3.4Deutsche Bank 50,873,412 27,148,231 3.3HSBC 18,910,385 22,770,781 2.8Goldman Sachs 21,132,311 22,531,871 2.8Morgan Stanley 22,432,142 18,194,353 2.2UBS 14,166,434 17,966,033 2.2Santander 8,307,162 12,281,930 1.5Other (Includes 33, each contributing less than 1%) 46,636,202 47,544,940 5.8Totals $788,333,237 $815,246,256 100.0%

Missouri State Employees’ Retirement System • Fiscal Year 201290
INVESTMENT SECTION
CORE FIXED INCOME
Market ValueThe core fixed income allocation was $732.7 million as of fiscal year end, or 9.6% of the total fund.
Summary of PortfolioThe core fixed income sub-asset class gives the total fund exposure to high quality fixed income instruments which, in turn, provides stable cash flows and excellent liquidity to the portfolio. Types of fixed income securities that may be held within this portfolio include U.S. Treasuries, mortgage-backed securities, asset-backed securities, agency securities, investment-grade corporate securities and international investment grade securities. Core fixed income is also one portfolio within the public debt asset class that can be efficiently implemented synthetically due to the wide availability of treasury futures and swaps and their acceptance as mainstream instruments of portfolio management. Synthetic implementation of core exposure has been widely used since the addition of the beta/alpha program in FY05. Beta/alpha within the core fixed income portfolio is expected to be an efficient means of achieving superior risk adjusted returns over an entire economic cycle. Refer to the beta/alpha on pages 102-103 for a more complete description of the program and its rationale. The core fixed income portfolio provides meaningful diversification to the fund in a variety of different economic scenarios. Core fixed income performs well, but would typically lag equities in periods of good economic growth and falling inflation. One should also expect adequate performance from this portfolio in periods of falling growth and stable inflation. As of June 30, 2012, MOSERS’ allocation was below the 10% policy target allocation to core fixed income.
Additional Portfolio InformationMOSERS had one contract with an external investment advisor for the management of a separate fixed income portfolio of investment grade emerging markets debt. The core fixed income portfolio also participates in the beta/alpha program. In the program, beta and alpha are completely separated such that the beta exposure is gained through synthetic replication of the core components and the alpha is gained through the alpha pool managers. Management fees can be found on pages 77-78.
The tables as titled below shows the investment advisor and statistical performance for the core fixed income portfolio as of June 30, 2012.
Core Fixed Income - Investment Advisor
InvestmentAdvisor Style PortfolioMarketValueBeta/alpha program Active $653,593,092Stone Harbor Investment Partners Emerging markets debt 79,121,826Total $732,714,918
Core Fixed Income - Statistical Performance
PortfolioCharacteristics 1Year 3Year 5Year 10YearAnnualized return 8.7% 12.8% 8.1% 6.7%Annualized standard deviation 3.67% 4.16% 5.63% 4.82%Sharpe ratio 2.34 3.04 1.25 0.98Excess return* 1.18% 5.84% 1.30% 1.03%Beta* 1.29 1.27 1.26 1.11Annualized alpha* (0.99)% 3.60% (0.41)% 0.41%Correlation* 0.83 0.84 0.79 0.84*As compared to the core fixed income policy benchmark.

Missouri State Employees’ Retirement System • Fiscal Year 2012 91
INVESTMENT SECTION
HIGH YIELD BONDS
Market ValueThe high yield bond allocation was $367.9 million as of fiscal year end, or 4.8% of the total fund.
Summary of PortfolioThe high yield bond portfolio invests in debt securities whose credit ratings are below investment grade quality. Relative to the core fixed income portfolio, this sub-asset class provides superior coupon cash flow, as well as some diversification benefit due to a reduced sensitivity to changes in interest rates. MOSERS views this allocation as one that is likely to be variable and very much dependent upon the particular stage of the economic cycle being experienced at the time of the allocation decision. As of fiscal year end, MOSERS was slightly under the 5% policy target allocation to high yield bonds.
Additional Portfolio InformationMOSERS had contracts with six external investment advisors for the management of the high yield bond portfolio. Management fees can be found on pages 77-78.
The tables as titled below show the investment advisors and statistical performance for the high yield bond portfolio as of June 30, 2012.
High Yield Bonds - Investment Advisors
InvestmentAdvisors Style PortfolioMarketValueAshmore Investment Management, Ltd. Emerging markets debt $ 52,227,814Bayview Asset Management, LLC Opportunistic mortgages 54,959,456BlackRock Financial Management, Inc. Active high yield bonds, loans and non-agency MBS 232,844,180Fortress Investment Group, LLC Opportunistic mortgages 24,862,908NISA Investment Advisors, LLC EURO currency hedge (50,501)OCM Capital Management, LLC Opportunistic European loans 3,072,199 Total $367,916,056
High Yield Bonds - Statistical Performance
PortfolioCharacteristics 1Year 3Year 5Year 10YearAnnualized return 4.9% 13.0% 2.8% 7.5%Annualized standard deviation 5.76% 5.23% 11.31% 8.64%Sharpe ratio 0.84 2.46 0.16 0.64Excess return* (2.36)% (3.32)% (5.63)% (2.64)%Beta* 0.54 0.59 0.67 0.67Annualized alpha* 0.92% 3.26% (2.64)% 0.70%Correlation* 0.94 0.93 0.84 0.85
* As compared to the high yield bond policy benchmark.

Missouri State Employees’ Retirement System • Fiscal Year 201292
INVESTMENT SECTION
TREASURY INFLATION PROTECTED SECURITIES (TIPS)
Market ValueThe TIPS allocation was $660.4 million, or 8.6% of the total fund as of fiscal year end.
Summary of PortfolioTIPS are fixed income securities issued and guaranteed by the U.S. government. The yield on these securities is specifically tied to inflation, as measured by the U.S. consumer price index, plus a predetermined yield in relation to inflation (real yield). The TIPS allocation provides an excellent match relative to the system’s liabilities in terms of its ability to provide inflation protection. As of June 30, 2012, MOSERS’ allocation was below the 10% policy target allocation to TIPS.
Additional Portfolio InformationThe tables as titled below shows the investment advisor and statistical performance for the domestic equity portfolio as of June 30, 2012.
TIPS - Statistical Performance
PortfolioCharacteristics 1Year 3Year 5Year 10YearAnnualized return 11.3% 9.7% 8.6% 8.0%Annualized standard deviation 5.08% 4.89% 7.52% 8.48%Sharpe ratio 2.20 1.96 1.00 0.72Excess return* (0.40)% 0.05% 0.14% 0.17%Beta* 1.00 1.02 1.01 1.01Annualized alpha* (0.41)% (0.09)% 0.08% 0.08%Correlation* 1.00 1.00 1.00 1.00* As compared to the TIPS policy benchmark.
TIPS - Investment Advisor
InvestmentAdvisor Style PortfolioMarketValue
Internal staff Passive $660,448,998

Missouri State Employees’ Retirement System • Fiscal Year 2012 93
INVESTMENT SECTION
MARKET NEUTRAL
Market ValueAs of fiscal year end, the market neutral allocation was $386.9 million, or 5.0% of the total fund.
Summary of PortfolioThe market neutral portfolio consists of a variety of managers who utilize skill-based investment strategies, which allow them to take advantage of periodic inefficiencies that may exist within the market. The expectation for this sub-asset class is to produce consistent absolute returns in various economic environments. More directly, it is expected that this portfolio will generate returns of 4% in excess of returns on 90-day Treasury bills with similar volatility to what is expected from the core fixed income portfolio. Market neutral investments also provide diversification and downside protection to the portfolio. MOSERS utilizes its beta/alpha program described on pages 102-103 to gain exposure to this sub-asset class. This allows MOSERS to invest in an extremely diversified pool comprised of a variety of different types of strategies that provide additional risk protection and alpha that has minimal exposure to both the stock and the bond markets. As of fiscal year end, MOSERS was at the 5% policy target allocation to market neutral.
Additional Portfolio InformationMOSERS’ market neutral exposure is captured through the managers comprising the alpha program, which is detailed on pages 102-103.
The tables as titled below shows the investment advisor (alpha program) and statistical performance for the market neutral portfolio as of June 30, 2012.
Market Neutral - Investment Advisor
InvestmentAdvisor Style PortfolioMarketValue
Beta/alpha program Market neutral $386,921,233
Market Neutral - Statistical Performance
PortfolioCharacteristics 1Year 3Year 5YearSinceInception(Dec.2002)
Annualized return 0.6% 6.5% 2.1% 4.5%Annualized standard deviation 1.81% 2.78% 4.87% 3.86%Sharpe ratio 0.28 2.31 0.21 0.67Excess return* (3.47)% 2.43% (2.79)% (1.23)%Beta as compared to S&P 500 0.04 0.10 0.14 0.13Beta as compared to Barclays Aggregate 0.23 0.35 0.53 0.39
* As compared to the market neutral policy benchmark.

Missouri State Employees’ Retirement System • Fiscal Year 201294
INVESTMENT SECTION
ALTERNATIVE INVESTMENTSAsset Class Summary
As of June 30, 2012, the alternative investments portfolio had a market value of approximately $1.9 billion, which accounted for 25.3% of the total fund. For the fiscal year, the asset class returned 5.6%, net of fees and expenses.
• • • •
HighlightsDuring the 2012 fiscal year there were a number of significant events that occurred. Below are a few highlights from this diverse portfolio:
• The alternative investments portfolio invests across a broad set of markets. For the recent fiscal year, these markets experienced returns that ranged from -10.7% for commodities to 13.3% for publicly traded Real Estate Investment Trusts (REITs).
• The private investments portion of the alternative investments portfolio reached a milestone having completed a decade as part of the total fund. The portfolio has been built over the last ten years and in FY12 distributions from the portfolio exceeded the contributions that were necessary to sustain its targeted allocation.
• MOSERS committed capital to three existing managers as well as to one new relationship. Commitments were made in both the private investments and real assets portfolios. These investments represent distinct strategies that offer the potential for attractive returns as well as further diversification.
Portfolio StructureThe alternative investments portfolio, as set forth by the asset allocation policy, is targeted to comprise 25% of the total fund. The alternative investments portfolio is divided into two sub-asset classes: real assets and private investments. The real assets portfolio has a policy target allocation of 15%, and is further divided into three segments: commodities, timber and real estate. The private investments sub-asset class has a target allocation of 10%, and is focused in two areas: private equity and private debt.
At June 30, 2012, the alternative investments portfolio accounted for 25.3% of the total fund, slightly above the target allocation. The overweight relative to the target allocation is held in the private investments portfolio, 10.3% versus 10.0%. The real assets allocation is at its 15.0% target. The bar chart above illustrates the actual allocations relative to the board’s policy allocation.
The alternative investments portfolio is invested in a broad group of assets and geographies. Each asset type has a set of characteristics which leads to an expected rate of return and risk profile. These characteristics are combined in a portfolio that is designed to provide additional diversification to the total fund. The table above shows the five investment components and their correlation to each other.
0% 3% 6% 9% 12% 15%
15.0
10.3
15.0
10.0
Actual Policy Private
Investments
Real Assets
Alternative Investments AllocationPolicy vs. Actual (As a Percentage of the Total Fund)
Alternative Investments Correlation Table - 5 Year Period
Sub-AssetClassReal
Estate Commodities TimberPrivateEquity
PrivateDebt
Real estate 1.00Commodities 0.34 1.00Timber 0.00 (0.08) 1.00Private equity 0.59 0.36 0.21 1.00Private debt 0.43 0.61 0.00 0.52 1.00

Missouri State Employees’ Retirement System • Fiscal Year 2012 95
INVESTMENT SECTION
Market OverviewThe alternative investments portfolio covers a number of asset types that vary greatly in terms of expected return and risk. The paragraphs that follow provide a high level description of each market and some return data on how each performed during the past year.
Commodities represent a group of tangible assets that are typically used as inputs to produce an end product. These inputs can serve a variety of purposes; such as making up part of the food supply (as is the case with wheat or corn), or they can be used in the production of end-products (like oil and industrial metals). Commodities, as an asset class, refers to a broad group of inputs each of which has a specific use as well as a specific set of supply and demand characteristics.
One of the major indexes used to track the performance of commodities is the Standard & Poor’s GSCI (GSCI). This particular index contains 24 individual commodities in such areas as energy, industrial metals, precious metals, agriculture and livestock. The GSCI assigns each commodity a weight based on world production statistics. Given this methodology, and the important role energy plays in the economy, the index has a large allocation to the energy sector which is represented by six of the 24 commodities. Over the fiscal year, the GSCI returned -10.7%, on a total return basis. The industrial metals component experienced the largest loss during this period, declining 23.2%. While industrial metals declined the most its impact on the index was relatively small given its 7% weight. The primary driver of the negative return can be attributed to the energy component which declined by 11.7% and accounts for about 68% of the index.
The universe of real estate is large and includes assets that are differentiated by a number of characteristics including: geography, property type, stage of development, use of leverage and whether or not it is publicly traded. The institutional real estate market, a sub-set of the real estate universe, focuses on a variety of property types: office, industrial, retail, multi-family and hotel. One gauge of real estate performance is the Dow Jones REIT (Real Estate Investment Trust) Index. This index tracks the performance of publicly traded REIT securities in the U.S. These individual REITs typically invest in large institutional quality properties within a specific property-type. For year ended June 30, 2012, the Dow Jones REIT Index returned 13.3%, which was the highest among the benchmarks used to measure performance of the sub-asset classes within the alternative investments portfolio.
The third and final component within real assets is timber. From an investment perspective, timber possesses a number of characteristics that differentiate it from other assets. Timber has a long-term investment horizon and can generate significant cash flows over time. To a certain extent, these cash flows can be adjusted to meet the liquidity needs of the investor. For example, once timberland reaches a certain level of maturity harvests can be planned to generate a targeted amount of cash. Also, harvest schedules can be altered to take advantage of strong markets or to avoid weak markets. Another benefit is that if a harvest is postponed the tree can be left on the stump where it continues to grow and add volume. The NCREIF Timberland Index is used to measure performance. This index is maintained by NCREIF (The National Council of Real Estate Investment Fiduciaries) to track the return of private timberlands in the south, northwest and northeast regions of the U.S. Over the most recent fiscal year the index returned 1.1%.
Private equity and private debt are the two components included in the private investments sub-asset class. Benchmarking this sub-asset class has always been a challenge. In order for a benchmark to be valid it needs to satisfy a number of criteria. Meaningful benchmarks are: identifiable in advance, investable, able to be calculated frequently and consistent with the manager’s investment style. When dealing with assets in private markets these criteria are not consistency met. This lack of consistency leads private market investors to use a variety of other methods to benchmark performance. One that is typically used is to add an illiquidity risk premium to an index of publicly traded equities, such as the S&P 500 Index. The rationale behind this method is that an investor in private securities should expect to receive a return premium above the return provided by the public market alternative because they forfeit the ability to sell these assets on demand. This incremental return is expected to compensate investors for the added risk and illiquidity associated with private investments. For the fiscal year, the private investments benchmark, calculated using the methodology described above, returned 8.5%.

Missouri State Employees’ Retirement System • Fiscal Year 201296
INVESTMENT SECTION
PerformanceThe alternative investments portfolio returned 5.6% for the fiscal year, which was just below the policy benchmark return of 5.8%. The portfolio also trailed the 1-year strategy benchmark return of 7.1%.
The performance of the alternative investments portfolio reflects the blended performance of the real assets (real estate, timber and commodities) and private investments (private equity and private debt) portfolios. For the fiscal year, the real assets portfolio returned 4.3%, while the private investments portfolio returned 7.5%. The 1-year returns of the five components ranged from +9.5% to -5.9%. These 1-year results all fall within the expected range of outcomes for assets of this type.
Results for the alternative investment portfolio and its benchmarks, for the latest 1-, 3-, 5-, and 10-year periods, are illustrated in the bar chart above.
The policy benchmark for the alternative investments portfolio is a weighted average of the allocation mix and the policy benchmark of each component. In order to determine the amount of value-added, the actual return is compared with the policy benchmark. During FY12, the alternative investments portfolio underperformed the policy benchmark by 0.2%. The primary reason for the shortfall can be attributed to the real estate component of the real assets sub-asset class, which returned 9.5% compared to the 13.3% return of the Dow Jones REIT Index. Over a longer time frame, like the latest 5-year period, the portfolio returned 3.8%, which outperformed the policy benchmark return of 3.4%. The outperformance relative to the policy benchmark can be attributed to the real assets sub-asset class. Since inception the portfolio has returned 9.9%, annualized, compared to the policy benchmark return of 8.9%.
As described in the total fund review section, the strategy benchmark attributes performance to decisions made by staff. These decisions to either deviate, within parameters, from the policy asset allocation or to make specific investment manager selections are tracked on an ongoing basis. The strategy benchmark utilizes a set of indexes that are appropriate given the characteristics of the underlying investments. During FY12, the return of the portfolio trailed the strategy benchmark by 1.6%. This underperformance was due to the real estate component and both the private equity and private debt components of the alternative investments portfolio. While each 1-year return is meaningful, given the long-term nature of the asset class, measurement over longer periods is more relevant. Since inception (10 years), the portfolio has achieved a return of 9.9%, which outperformed the strategy benchmark return of 9.5%.
0%
5%
10%
15%
20%
5.6
12.7
3.8
9.9
7.1
11.9
5.0
9.5
5.8
15.8
3.4
8.9
Alternative Investments Return
Strategy Benchmark**Policy Benchmark*
10 Year 5 Year3 Year1 Year
Alternative Investments Return vs. Benchmark Returns
* As of 6/30/12, the alternative investment policy benchmark was comprised of the following components: 40% S&P 500+3%, 24% Dow Jones U.S. Select REIT, 24% NCREIF Timber, and 12% Goldman Sachs Commodity.
** As of 6/30/12, the alternative investment strategy benchmark was comprised of the following components: 40.3% S&P 500 + 3%; 28.9% real estate consisting of NCREIF, STIF Return, S&P MLP TR Index, actual return of Bayview; 19.6% NCREIF Timber; and 11.2% commodities consisting of S&P GSCI TR Index and S&P GSCI Gold Excess Return Index.

Missouri State Employees’ Retirement System • Fiscal Year 2012 97
INVESTMENT SECTION
Additional Portfolio InformationThe tables as titled below show the top ten publicly traded separate account holdings and the brokerage activity that occurred within the alternative investments portfolio in FY12. The brokerage activity resulted from trading in the real assets publicly traded MLP accounts. There were no commissions directed for soft dollar credits for this portfolio during the fiscal year ended June 30, 2012.
Alternative Investments - Top Ten Publicly Traded Separate Account Holdings
TenLargestHoldingsasofJune30,2012* MarketValuePercentofTotalMOSERS
AlternativeInvestmentsPortfolioEnterprise Products Partners LP $21,343,356 1.1%U.S. Treasury Bond - 5.00, 2037 16,582,770 0.9U.S. Treasury Bill, 2012 16,396,393 0.8U.S. Treasury Bond - 5.375, 2031 15,019,505 0.8Missouri Active Reserve 14,633,438 0.8Plains All American Pipeline LP 14,590,003 0.7NCUA Guaranteed Notes - R2 2a, 2020 12,114,743 0.6U.S. Treasury Bond - 5.50, 2028 11,139,717 0.6NCUA Guaranteed Notes - R1 1a, 2020 10,770,348 0.6NCUA Guaranteed Notes - R3 1a, 2020 10,655,453 0.5NCUA Guaranteed Notes - R4 1a, 2020 10,485,927 0.5Kinder Morgan Management LLC 10,379,459 0.5* For a complete list of holdings contact the Manager of Investment Policy & Communications
Alternative Investments - Brokerage Activity
Commissions
Brokerage Firm Shares TradedDollar Volume
of Trades Dollar Amount Cents Per ShareBaird, Robert W & Co., Inc. 30,164 $ 542,934 $ 905 0.03 Barclays Capital 184,339 5,520,231 5,530 0.03 Cititgroup Global Markets, Inc. 616,660 18,465,181 18,418 0.03 Global Hunter Securities, LLC 269,802 5,700,822 8,094 0.03 Goldman Sachs 1,078 44,899 5 0.00 Instinet Corp. 1,064,600 41,922,252 10,646 0.01 J. P. Morgan Securities, Inc. 9,947 362,897 298 0.03 Jones Trading Institutional Services, LLC 132,594 4,155,709 3,978 0.03 Madison Williams & Co. 175,031 6,847,587 5,251 0.03 Merlind Securities, LLC 1,245,060 36,158,004 16,401 0.01 Morgan Stanley & Co., Inc. 9,046 164,943 134 0.01 National Financial Services, Corp. 24,174 204,750 725 0.03 Pershing, LLC 66,981 2,451,152 1,178 0.02 Pickering Energy Partners 3,357 131,239 101 0.03 Raymond James & Associates, Inc. 52,617 1,688,470 1,579 0.03 RBC Capital Markets, LLC 87,688 2,467,678 2,631 0.03 USCA Securites, LLC 129,270 4,973,133 3,878 0.03 Wells Fargo Securities, LLC 118,746 3,691,459 3,155 0.03 Total 4,221,154 $135,493,340 $82,907 0.02
Missouri State Employees’ Retirement System • Fiscal Year 201298
INVESTMENT SECTION
REAL ASSETS
Market ValueAt the end of FY12, the value of the real assets sub-asset class was $1.1 billion, representing 15% of the total fund.
Summary of PortfolioThe policy allocation target for real assets is 15% of the total fund. The actual allocation can move within a range of 10% to 20%. As previously discussed, the portfolio is made up of three separate and distinct components with the following market values and percentages of the total fund: commodities, $193.5 million or 2.53%; timber, $377.0 million or 4.92%; and real estate, $576.0 million or 7.51%. Compared to their individual policy target allocations, real estate is overweight while timber and commodities are underweight.
The real assets portfolio has been part of the total fund for the past decade. Over this period the portfolio has been successful in exceeding its return objective. Since inception the real assets portfolio has returned an annualized 9.8%. This return has outperformed the policy and strategy benchmark returns of 8.0% and 8.6%, respectively. It is also worth noting that each segment of the portfolio (commodities, timber and real estate) exceeded their individual policy and strategy benchmarks over this period.
MOSERS obtains its exposure to commodities through an account managed by an external investment advisor. The manager implements the strategy through the use of exchange-traded futures contracts and/or swap agreements. Together the futures/swaps and the underlying cash make up a portfolio that is benchmarked against the GSCI. From time to time, the manager or MOSERS will attempt to add incremental return as market opportunities are identified.
The timber portfolio consists of timberlands situated around the globe. The portfolio holds assets in the southeast and northwest regions of the U.S., as well as in Australia, New Zealand and South America. The portfolio is diversified by geography, age-class and species. The strategy is implemented through three Timber Investment Management Organizations (TIMOs). Timber is expected to provide economic diversification over the long term through its growth characteristics and its ability to protect against rising inflation.
MOSERS’ real estate portfolio contains investments in private real estate partnerships as well as select strategies that have characteristics that are similar to those of real estate. The real estate portion consists of a number of private assets. These assets should, over an investment cycle, provide returns that are higher than those provided by publicly-traded REIT securities that comprised the benchmark. The incremental return is expected to come from strategies pursued by the manager, the value added by the manager through their specialized skill and the illiquidity premium associated with owning private assets. The remainder of the portfolio is held in income producing assets that have the potential to provide moderate capital appreciation. These assets include Master Limited Partnerships (MLPs), oil and gas assets and private debt investments.

Missouri State Employees’ Retirement System • Fiscal Year 2012 99
INVESTMENT SECTION
Real Assets - Investment Advisors
InvestmentAdvisor Style PortfolioMarketValueBlackstone Real Estate Advisors Active real estate $ 249,411,050 The Campbell Group Northwestern U.S. timber 40,183,156CarVal Investors Distressed investments 41,200,000EIG Global Energy Partners Mezzanine debt, diversified energy 98,112,406Global Forest Partners International timber 170,427,639Harvest Fund Advisors Active MLP 87,184,508Internal Staff* Active duration U.S. Treasuries 49,582,033Internal Staff Passive MLP 79,657,333Merit Energy Oil & gas 9,047,469NISA Investment Advisors Commodities 168,111,202Oaktree Capital Management Active real estate 10,638,998Resource Management Service Southeastern U.S. timber 116,844,633Total $1,120,400,427
* Temporary place holders for future capital drawdowns to fund managers.
Real Assets - Statistical Performance
PortfolioCharacteristics 1Year 3Year 5Year 10YearAnnualized return 4.3% 10.5% 5.1% 9.8%Annualized standard deviation 7.33% 7.03% 8.44% 8.50%Sharpe ratio 0.57 1.48 0.48 0.92Excess return* 0.27% (2.86)% 2.01% 1.77%Beta* 0.50 0.37 0.30 0.41Annualized alpha* 2.03% 5.34% 3.99% 6.19%Correlation* 0.92 0.59 0.61 0.66*As compared to the real assets policy benchmark.
Additional Portfolio InformationMOSERS’ exposure to real assets is held in portfolios managed by 11 external investment firms and staff. During the fiscal year, no new managers were added however; additional capital was committed to one of the system’s long-standing real estate managers. Management fees can be found on pages 77-78.
The tables as titled below shows the investment advisor and statistical performance for the real assets portfolio as of June 30, 2012.

Missouri State Employees’ Retirement System • Fiscal Year 2012100
INVESTMENT SECTION
PRIVATE INVESTMENTS
Market ValueThe private investments portfolio had a value of $788.0 million, representing 10.3% of the total fund at the end of the fiscal year.
Summary of PortfolioAs of June 30, 2012, the private investments allocation was slightly above its 10% policy target and near the middle of the designated range of 5% to 15%. During FY12, the private investments portfolio received distributions of almost $63 million in excess of capital contributed. While the size and timing of future distributions will be impacted by a number of exogenous factors, being in a position where distributions exceed contributions demonstrates that MOSERS’ private investments program has reached a significant level of maturity. Private investments include: the private equity portfolio, valued at $546.6 million, or 7.13% of the total fund, and the private debt portfolio, valued at $241.4 million, or 3.15% of the total fund.
The private investments portfolio, as it exists today, began after the 2002 fiscal year. In each of the past ten years, commitments have been made in an effort to build a program that is diversified by investment type, investment strategy and geography.
The objective of the private investments portfolio is to achieve a high level of return by capturing the illiquidity premium associated with private markets. The portfolio is expected to produce returns in excess of those achieved by public equities and is proxied by the S&P 500 Index plus 3%. Since the public equity markets can be quite volatile, especially over shorter time periods, performance is best viewed over a longer time frame which is in line with the long-term nature of this sub-asset class. Since inception the private investments portfolio has returned an annualized 11.9%, slightly below the policy and strategy benchmark which returned 12.2%.
During FY12, three commitments were made within the private investments portfolio. Two of the three commitments were made to firms that currently manage assets on MOSERS’ behalf. These two managers specialize in identifying and investing in a variety of opportunities within a number of rapidly growing emerging markets. The one new commitment made during the year was to a group that focuses on companies within the industrial sector. Collectively, these strategies are additive for a number of reasons: 1) they provide exposure to areas and strategies where MOSERS has limited exposure, 2) they possess an attractive risk-return profile, and 3) they provide additional diversification.
The private investments portfolio provides return and economic diversification to the overall investment portfolio during periods of rising growth and during periods when inflation, both expected and unexpected, is changing.

Missouri State Employees’ Retirement System • Fiscal Year 2012 101
INVESTMENT SECTION
Private Investments - Statistical Performance
PortfolioCharacteristics 1Year 3Year 5YearSinceInception(Sept.2002)
Annualized return 7.5% 16.2% 1.4% 11.9%Annualized standard deviation 5.52% 6.62% 10.83% 11.50%Sharpe ratio 1.35 2.44 0.03 0.86Excess return* (0.93)% (3.17)% (2.10)% (0.29)%Beta* 0.13 0.19 0.40 0.53Annualized alpha* 6.18% 11.79% (0.08)% 5.16%Correlation* 0.41 0.45 0.69 0.69
* As compared to the private investments policy benchmark.
Private Investments
InvestmentAdvisor Style PortfolioMarketValueActis Emerging markets $ 43,924,117 Alinda Capital Partners Corporate buyout 28,076,317American Industrial Partners Corporate buyout 1,784,013Axiom Asia Private Capital Emerging markets 15,555,657Axxon Group Emerging markets 3,458,272Bridgepoint Capital Partners Corporate buyout; Europe 50,388,247CarVal Investors Distressed investments 41,200,000Catalyst Capital Group Distressed debt 24,245,160Catterton Partners Corporate buyout 49,452,449DDJ Capital Management Distressed debt 5,817,878Development Partners International Emerging markets 27,070,876DRI Capital Royalties 25,584,210JLL Partners Corporate buyout 38,461,139Linden Capital Corporate buyout 6,181,607MHR Fund Management Distressed debt 98,353,931Millennium Technology Ventures Direct secondary 12,592,323New Mountain Capital Corporate buyout 33,245,233NISA Investment Advisors* Cash equitization 11,327,248Oaktree Capital Management Distressed debt/corporate buyout 71,734,841Oaktree Capital Management/GFI Corporate buyout 8,057,378StepStone Corporate buyout; fund-of-funds 41,094,197Silver Creek Management Special situations 57,583,983Silver Lake Partners Corporate buyout 19,529,976TPG Credit Management Special situations 17,625,216Veritas Capital Partners Corporate buyout 55,641,448Total $787,985,716
* Temporary place holder for future capital drawdowns to private equity managers.
Additional Portfolio InformationMOSERS’ private investments sub-asset class was invested in a broad and diverse group of strategies. These strategies are managed by 24 external investment firms and represent exposure to U.S. corporate buyout, European corporate buyout, emerging market private equity, distressed debt, royalties and special situation strategies. MOSERS will continue to search for high quality managers that offer compelling strategies. Investments will be made in order to maintain exposure as outlined by the asset allocation policy. Management fees can be found on pages 77-78.
The tables as titled below show the investment advisors and statistical performance for the private investments portfolio as of June 30, 2012.

Missouri State Employees’ Retirement System • Fiscal Year 2012102
INVESTMENT SECTION
BETA/ALPHA PROGRAM
The beta/alpha program began as a result of MOSERS’ investment belief that returns from these two components should be managed separately.
The beta portion of the program is managed by NISA Investment Advisors. NISA uses futures, total return swaps, and/or Exchange-Traded Funds (EFTs) to gain market exposure to various predefined asset classes. The alpha program is a group of active managers with minimal systematic beta exposure. The objective of the alpha component is to provide a net of fees alpha return of cash plus 4% with similar to slightly higher volatility. This return can then be applied to various asset classes. The combination of the two components produces an efficient total return and also provides MOSERS a great deal of flexibility in the management of the fund.
BETA PROGRAM
Market ValueThe total notional exposure was $2.19 billion as of June 30, 2012.
Summary of ProgramThe beta component was added to the total fund in FY05. The beta component contained total return swaps and futures as of June 30, 2012. MOSERS is utilizing the beta component within the domestic equity, international equity, commodities and core fixed income sub-asset classes. The beta manager seeks market exposure in the most cost efficient manner. The beta manager seeks to produce a market return gross of the financing cost to gain beta exposure. The manager’s goal is to provide market exposure.
ALPHA PROGRAM
Market ValueThe alpha program allocation was $2.45 billion, or 32.05% of the total fund, as of June 30, 2012.
Summary of PortfolioThe alpha program portfolio was added to the total fund in FY05 with an initial investment in a fund-of-fund manager. MOSERS’ hedge fund program is currently comprised of multiple direct hedge fund investments and one customized fund-of-funds vehicle. Alpha program managers utilize skill-based investment strategies, which allow them to take advantage of periodic inefficiencies that may exist within the market. Alpha program managers seek to produce consistent returns in various economic environments.
The ultimate goal within the alpha program is to provide consistent alpha with little correlation to other areas of the fund. MOSERS utilizes several different strategies within the alpha program including global macro, event driven, credit related value, multi-strategy, and long/short equity. This portfolio targets the return of cash plus 4% net of fees over long periods of time.

Missouri State Employees’ Retirement System • Fiscal Year 2012 103
INVESTMENT SECTION
Beta Program - Investment Advisor
InvestmentAdvisor Style TotalNotionalValue
NISA Investment Advisors Synthetic beta exposure $2,194,320,403
Additional Beta/Alpha Program InformationThe tables as titled below show the beta/alpha program investment advisors and the statistical performance for the alpha program as of June 30, 2012. The impact of the beta exposures is contained in the portfolios where the beta resides. Futher information regarding futures contracts and swap contracts can be found on page 41. Management fees can be found on pages 77-78.
Alpha Program - Statistical Performance
PortfolioCharacteristics 1Year 3Year 5YearSinceInception(Oct.2004)
Annualized return 0.3% 6.2% 1.3% 2.8%Annualized standard deviation 1.79% 2.76% 4.94% 4.20%Sharpe ratio* 1.18 2.25 0.26 0.67Beta as compared to S&P 500 0.04 0.10 0.14 0.14Beta as compared to Barclays Aggregate 0.04 0.05 0.17 0.02
* Sharpe ratio equals the annualized alpha program returns less the risk free rate divided by the annualized standard deviation. Fees related to the beta program also reflect the risk-free rate; therefore, the risk-free rate is not considered in this calculation.
Alpha Program - Investment Advisors
InvestmentAdvisor Style PortfolioMarketValueAQR Capital Management Multi-strategy $ 175,804,517Blackstone Alternative Asset Management Fund-of-funds 300,314,854Brevan Howard Capital Management Global macro 132,073,483Bridgewater Associates Global macro 73,170,136Claren Road Asset Management Long/short credit 101,867,402COMAC Capital Global macro 48,725,327CQS Long/short credit 78,569,262Davidson Kempner Capital Management Event driven 85,606,841Diamondback Capital Management Long/short equity 85,625,239Elliott International Capital Advisors Multi-strategy 82,778,485Empyrean Capital Partners Event driven 47,688,146Eton Park Capital Management Multi-strategy 72,648,072Farallon Capital Management Multi-strategy 7,240,000HBK Investments Multi-strategy 85,494,379King Street Capital Management Credit driven 82,337,295Mast Capital Management Credit driven 72,401,199Moon Capital Management Long/short equity 822,179Pacific Alternative Asset Management Co. Fund-of-funds 6,108,387Perry Capital Multi-strategy 316,091Pharo Global Advisors Global macro 71,090,827Silver Point Capital Credit driven 4,596,519Wellington Hedge Management Long/short equity 944,903Visium Asset Management Long/short equity 50,574,697Alpha program cash Short-term cash 789,844,509Total $2,456,642,749

Missouri State Employees’ Retirement System • Fiscal Year 2012104
INVESTMENT SECTION
SECURITIES LENDING PROGRAM
During the fiscal year ending June 30, 2012, MOSERS earned net income of $1,537,701 through its securities lending program. MOSERS lends its domestic equity, international equity, and fixed income securities through Deutsche Bank which manages the program in an agent capacity. In an agent lending program, the agent lender is responsible for making the loans to various broker-dealers, investing the cash collateral associated with the loaned securities, marking the loans and collateral to market on a daily basis, and, in most cases, indemnifying the lender against the default of a broker-dealer to whom they have loaned securities on behalf of the beneficial owner.
In FY12, domestic equity income increased due to an increase in the lending margin and utilization, international equity income decreased stemming from a decrease in the average on loan balance, lending margin and utilization rate, and the income from fixed income decreased due to a decrease in the lending margin. The tables as titled below show the activity for the securities lending program including domestic equity, international equity, and fixed income.
Domestic Equity
Year AverageLendable AverageonLoan AverageUtilization LendingMargin(basispoints) NetIncomeFY12 $ 424,041,044 $145,373,164 34.3% 19.1 $ 810,972FY11 376,047,357 111,263,248 29.6 16.5 619,648FY10 321,114,801 83,944,408 26.1 26.9 864,401FY09 307,082,718 114,261,769 37.2 52.0 1,596,245FY08 440,025,347 195,971,154 44.5 36.6 1,611,536FY07 711,856,029 281,338,681 39.5 14.0 994,416FY06 856,712,658 377,314,359 44.0 14.2 1,218,245FY05 775,821,287 247,175,198 31.9 8.4 648,218 FY04 1,552,186,713 176,626,818 11.4 7.2 1,114,144 FY03 1,420,413,446 234,776,497 16.5 10.6 1,504,152
Fixed Income
Year AverageLendable AverageonLoan AverageUtilization LendingMargin(basispoints) NetIncomeFY12 $ 776,256,144 $ 516,553,974 66.5% 6.4 $ 496,074FY11 805,579,308 505,690,676 62.8 7.2 581,875FY10 836,242,270 190,547,907 22.8 2.8 230,031FY09 859,512,525 517,356,516 60.2 43.3 3,722,523FY08 1,082,813,165 894,372,380 82.6 56.4 6,104,526FY07 950,069,746 695,743,093 73.2 15.5 1,469,860FY06 1,183,366,350 776,959,063 65.7 15.7 1,853,181FY05 1,091,262,589 776,038,981 71.1 19.5 2,126,695 FY04 1,231,730,491 1,043,891,521 84.7 20.1 2,475,630 FY03 969,156,824 757,537,477 78.2 17.6 1,707,400
International Equity
Year AverageLendable AverageonLoan AverageUtilization LendingMargin(basispoints) NetIncomeFY12 $309,052,299 $47,666,253 15.4% 7.5 $230,655FY11 320,082,404 88,623,017 27.7 10.4 333,000FY10 277,251,343 19,736,528 7.1 4.0 109,946FY09 342,215,198 32,267,851 9.4 14.9 510,622FY08 467,893,205 56,944,925 12.2 15.5 726,565FY07 485,230,034 41,033,858 8.5 8.1 395,017FY06 483,512,648 48,077,237 9.9 12.9 605,315FY05 360,790,809 39,881,555 11.1 13.2 476,226 FY04 462,783,570 53,655,836 11.6 9.7 446,880 FY03 544,976,709 36,820,686 6.8 13.7 744,985

Actuarial SectionActuary’s Certification Letter ........................................................................................................... 105Summary of Actuarial Assumptions ................................................................................................. 107 Summary of Member Data Included in Valuations .......................................................................... 113Active Members by Attained Age and Years of Service ..................................................................... 114Schedules of Active Member Valuation Data - Last Six Years ........................................................... 115MSEP Retirees and Beneficiaries Added and Removed .................................................................... 116Judicial Plan Retirees and Beneficiaries Added and Removed ........................................................... 120Short-Term Solvency Test ................................................................................................................ 122Derivation of Experience Gain (Loss) .............................................................................................. 123
Summary of Plan ProvisionsComparison of Plans for General State Employees .......................................................................... 124Comparison of Plans for Legislators ................................................................................................ 126Comparison of Plans for Elected Officials ....................................................................................... 128Comparison of Plans for Judges ....................................................................................................... 130Comparison of Plans for Uniformed Members of the Water Patrol .................................................. 132Administrative Law Judges and Legal Advisors Plan ........................................................................ 133Life Insurance Plans ........................................................................................................................ 134Long-Term Disability (LTD) Plans .................................................................................................. 135Changes in Plan Provisions .............................................................................................................. 135
Actuarial Present Values ................................................................................................................... 136

Missouri State Employees’ Retirement System • Fiscal Year 2012 105
ACTUARIAL SECTION
ACTUARY’S CERTIFICATION LETTER
October 29, 2012
The Board of TrusteesMissouri State Employees’ Retirement System907 Wildwood DriveJefferson City, Missouri 65102
Dear Board Members:
The basic financial objective of the Missouri State Employees’ Retirement System (MOSERS) is to establish and receive contributions which:
(1) when expressed in terms of percent of active member payroll will remain approximately level from generation to generation of Missouri citizens, and which
(2) when combined with present assets and future investment returns will be sufficient to meet the present and future financial obligations of MOSERS.
In order to measure progress toward this fundamental objective, MOSERS and the Judges Retirement Plan (Judges) annual actuarial valuations are performed. The purposes of the valuations are to (i) measure present financial position, (ii) establish contribution rates that provide for the normal cost and level percent of payroll amortization of unfunded actuarial accrued liabilities over a reasonable period, and (iii) to determine the actuarial information for Governmental Accounting Standards Board (GASB) Statement No. 25. The latest completed actuarial valuations were based upon data and assumptions as of June 30, 2012 presented to the board in separate reports. These valuations indicate that the contribution rates for the fiscal year ending June 30, 2014, adopted by the board of trustees for the benefits scheduled to be in effect on and after July 1, 2012, meet the basic financial objective. These contribution rates are 16.98% of payroll for 51,332 general state employees, and 59.69% of payroll for 398 judges.
The actuarial valuations are based upon financial and participant data which is prepared by retirement system staff, assumptions regarding future rates of investment return, salary increases, and inflation, and assumptions regarding rates of retirement, turnover, death, and disability among MOSERS’ members and their beneficiaries. The data is reviewed by us for internal and year-to-year consistency as well as general reasonableness prior to its use in the actuarial valuations. It is also summarized and tabulated for the purpose of analyzing trends.

Missouri State Employees’ Retirement System • Fiscal Year 2012106
ACTUARIAL SECTION
We are not responsible for the accuracy or completeness of the data. The demographic assumptions were adopted by the board of trustees on June 20, 2012 based upon recommendations made in an experience study covering the period from 2007 to 2012. The economic assumptions were adopted by the board of trustees on July 19, 2012. The assumptions and methods used in this valuation, in our opinion, meet the parameters established by Governmental Accounting Standards Board Statement No. 25.
The benefit structure is outlined in this section of the annual report. We provided the information used in the supporting schedules in the Actuarial Section and the Schedules of Funding Progress in the Financial Section, as well as the employer contribution rates shown in the Schedule of Employer Contributions in the Financial Section.
Based upon the valuation results, it is our opinion that the Missouri State Employees’ Retirement System and the Judicial Plan continue to operate in accordance with actuarial principles of level percent of payroll financing. To the best of our knowledge the information contained in this report is accurate and fairly presents the actuarial position of the plans as of the valuation date. All calculations have been made in conformity with generally accepted actuarial principles and practices, with the Actuarial Standards of Practice issued by the Actuarial Standards Board and with applicable statutes.
Future actuarial measurements may differ significantly from the current measurements presented in this report due to such factors as the following: plan experience differing from that anticipated by the economic or demographic assumptions; changes in economic or demographic assumptions; increases or decreases expected as part of the natural operation of the methodology used for these measurements (such as the end of an amortization period or additional cost or contribution requirements based on the plan’s funded status); and changes in plan provisions or applicable law.
This report should not be relied on for any purpose other than the purposes described. Determinations of the financial results associated with the benefits described in this report in a manner other than the intended purpose may produce significantly different results.
The undersigned actuaries are independent of the plan sponsor and members of the American Academy of Actuaries and meet the Qualification Standards of the American Academy of Actuaries to render the actuarial opinions contained herein.
Respectfully submitted,
David T. Kausch, F.S.A., E.A., M.A.A.A Brad Lee Armstrong, A.S.A., E.A., M.A.A.A Senior Consultant & Actuary Senior Consultant & Actuary

Missouri State Employees’ Retirement System • Fiscal Year 2012 107
ACTUARIAL SECTION
Economic AssumptionsThe investment return rate used in the valuations was 8% per year, compounded annually (net after investment expenses).This assumption is used to account for the fact that equal amounts of money payable at different points in time in the future do not have the same value presently.
Pay increase assumptions for individual active members are shown for sample ages on page 109-110. Part of the assumption for each age is for merit and/or seniority increase, and the other 3% recognizes wage inflation. This assumption is used to project a member’s current salary to the salaries upon which benefits will be based.
The active member payroll is assumed to increase 3% annually, which is the portion of the individual pay increase assumptions attributable to wage inflation. The annual cost-of-living adjustment (COLA) is assumed to be 4%, on a compounded basis, when a minimum COLA of 4% is in effect. When no minimum COLA is in effect, price inflation is assumed to be 2.5% and the annual COLA is assumed to be 2% (80% of 2.5%), on a compounded basis.
Non-Economic AssumptionsThe mortality table, for post-retirement mortality, used in evaluating allowances to be paid was the RP 2000 mortality table, projected to 2016 with Scale AA. Related values are shown on page 109. This assumption is used to measure the probabilities of each benefit payment being made after retirement. The pre-retirement mortality rates used were 100% of the post-retirement mortality rates for males and 80% of the post-retirement mortality for females. The mortality tables include a margin of 15% for men and 17% for women for mortality improvements based on the four year experience study from June 30, 2007 to June 30, 2011. The mortality assumption was first used in the June 30, 2012 valuation.
The probabilities of age and service retirement are shown on page 108 and 110. It was assumed that each member will be granted one half year (4 months for 2011 plan members) of service credit for unused leave upon retirement and military service purchases. The probabilities of withdrawal from service, disability and death-in-service are shown for sample ages on page 109-110. For disability retirement, impaired longevity was recognized by use of special mortality tables.
The entry age normal actuarial cost method of valuation was used in determining liabilities and normal cost. Each member’s normal cost was based on the benefit provisions applicable to that member. The normal cost is projected to the applicable fiscal year. Differences in the past between assumed experience and actuarial experience (“actuarial gains and losses”) become part of actuarial accrued liabilities. Unfunded actuarial accrued liabilities are amortized to produce payments (principal & interest), which are level percents of payroll contributions.
The amortization of the unfunded actuarial accrued liability is based on a 30-year amortization period, level percent of payroll amortization. The amortization is based on the projected unfunded actuarial accrued liability at the beginning of the fiscal year. This method was first used in the June 30, 2010 valuation.
Employer contribution dollars were assumed to be paid in equal installments throughout the employer’s fiscal year.
Actuarial value of assets. Valuation assets recognize assumed investment return fully each year. Differencesbetween actual and assumed investment return are phased-in over a closed five-year period. Valuation assets arenot permitted to deviate from the market value by more than 20%.
The data about persons now covered and about present assets were furnished by the system’s administrative staff. Although examined for general reasonableness, the data was not audited by the actuary.
It is assumed that among active members 75% are married at retirement, 70% of those dying in active service are married, and men are three years older than their spouses for MSEP and four years older than their spouses for the Judicial Plan.
SUMMARY OF ACTUARIAL ASSUMPTIONS

Missouri State Employees’ Retirement System • Fiscal Year 2012108
ACTUARIAL SECTION
The liabilities for active members hired on or after July 1, 2011 were based on MSEP 2011 benefits. The liabilities for active members hired on or after July 1, 2000 (April 26, 2005 for administrative law judges) were based on MSEP 2000 benefits. The liabilities for active members hired before July 1, 2000 for elected officials, general assembly, and uniformed water patrol were based on MSEP benefits. The liabilities for all other active members hired before July 1, 2000 were based on the assumption that members would elect MSEP 2000 prior to age 62 and MSEP on or after age 62.
The actuarial valuation computations were made by or under the supervision of a Member of the American Academy of Actuaries (M.A.A.A.).
MSEP - Separations From Active Employment Before Service Retirement and Individual Pay Increase Assumptions - June 30, 2012
Percent of Active MembersSeparating Within the Next Year
Pay Increase Assumptionsfor an Individual Employee
Withdrawal Death* Disability
SampleAges
Years ofService Men Women Men Women Men Women
Merit and Seniority**
Base (Economy)
Increase Next Year
0 23.0% 26.9%
1 18.0 20.52 15.0 15.43 13.0 12.54 11.0 10.9
25 5+ 13.0 13.3 0.03% 0.01% 0.17% 0.30% 2.9% 3.0% 5.9%30 10.2 10.5 0.04 0.02 0.17 0.30 2.2 3.0 5.235 7.9 8.1 0.07 0.03 0.21 0.30 1.6 3.0 4.640 5.6 5.7 0.09 0.04 0.26 0.32 1.2 3.0 4.245 4.2 4.3 0.12 0.07 0.34 0.38 0.9 3.0 3.950 2.8 2.9 0.16 0.10 0.49 0.57 0.7 3.0 3.755 2.8 2.9 0.27 0.19 1.07 0.89 0.5 3.0 3.560 2.8 2.9 0.52 0.37 1.50 1.50 0.4 3.0 3.465 2.8 2.9 1.02 0.72 1.60 1.70 0.3 3.0 3.370 2.8 2.9 1.74 1.24 1.60 1.70 0.2 3.0 3.2
* 2% of the deaths in active service are assumed to be duty-related** Does not apply to members of the General Assembly
MSEP - Retirement Values - June 30, 2012Present Value of $1/Month the First Year (with 50% Joint & Survivor) Increasing
4.0%/2.0% YearlyPresent Value of $1/Month the First Year
Increasing 2.0% Yearly Future Life Expectancy (Years)
Sample Attained
Ages
Service Disability Service Disability Service Disability
Men Women Men Women Men Women Men Women Men Women Men Women40 $224.11 $224.12 $212.76 $211.89 $184.40 $186.75 $169.01 $172.32 41.95 44.10 32.39 34.4345 217.22 217.01 202.65 201.39 177.68 180.43 157.94 162.08 37.15 39.24 27.68 29.6950 208.28 207.81 190.14 188.39 169.01 172.32 144.49 149.76 32.39 34.43 23.13 25.1355 196.76 196.07 175.18 172.83 157.94 162.08 128.94 135.56 27.68 29.69 18.87 20.8460 182.48 181.61 157.88 154.80 144.49 149.76 111.76 119.87 23.13 25.13 14.96 16.9065 165.46 164.49 138.11 134.44 128.94 135.56 92.72 102.82 18.87 20.84 11.39 13.3270 145.94 144.91 116.94 112.03 111.76 119.87 73.10 84.62 14.96 16.90 8.29 10.1275 123.90 123.17 96.04 88.83 92.72 102.82 55.15 66.19 11.39 13.32 5.83 7.3780 100.55 100.10 76.52 68.15 73.10 84.62 40.28 50.49 8.29 10.12 4.03 5.3185 78.09 77.41 59.89 52.82 55.15 66.19 30.32 40.10 5.83 7.37 2.91 4.05

Missouri State Employees’ Retirement System • Fiscal Year 2012 109
ACTUARIAL SECTION
MSEP - Percent of Eligible Active Members Retiring Next Year - June 30, 2012Normal Retirement Pattern Early Retirement Pattern
MSEP and MSEP 2000* MSEP 2011** MSEP* MSEP 2011**
Retirement AgePercent Eligible
Percent Eligible Retirement Age Percent Eligible Percent Eligible1st Year 2nd Year 3rd Year48 22%49 22 10%50 22 10 21%51 22 10 2152 22 10 2153 22 10 1854 22 10 1855 22 12 26 45%56 22 12 25 4557 22 12 22 35 57 2.5%58 22 12 22 35 58 3.559 22 12 20 30 59 3.560 21 12 22 35 60 561 20 12 20 25 61 662 19 22 30 40 62 6 10%63 15 18 25 30 63 6 1064 15 20 17 20 64 6 1065 20 20 27 30 65 6 5066 22 20 26 25 66 6 5067 15 25 22 20 67 668 15 20 22 20 68 669 15 20 22 20 69 670 25 20 22 20 70 671 25 20 22 20 71 672 25 20 22 20 72 673 25 20 22 20 73 674 25 20 22 20 74 675 50 50 22 50 75 676 50 50 22 50 76 677 75 75 22 75 77 678 100 100 100 100 78 100
* For Members Hired Prior to January 1, 2011** For Members Hired On or After January 1, 2011
SUMMARY OF ACTUARIAL ASSUMPTIONS
Elected Officials and Legislators - Separations From Active Employment Before Service Retirement and Individual Pay Increase Assumptions - June 30, 2012
Withdrawal Withdrawal
Years of Service Men/Women Years of Service Men/Women
1 8.0% 5 12.0%2 8.0 6 12.03 8.0 7 12.04 8.0 8+ 35.0
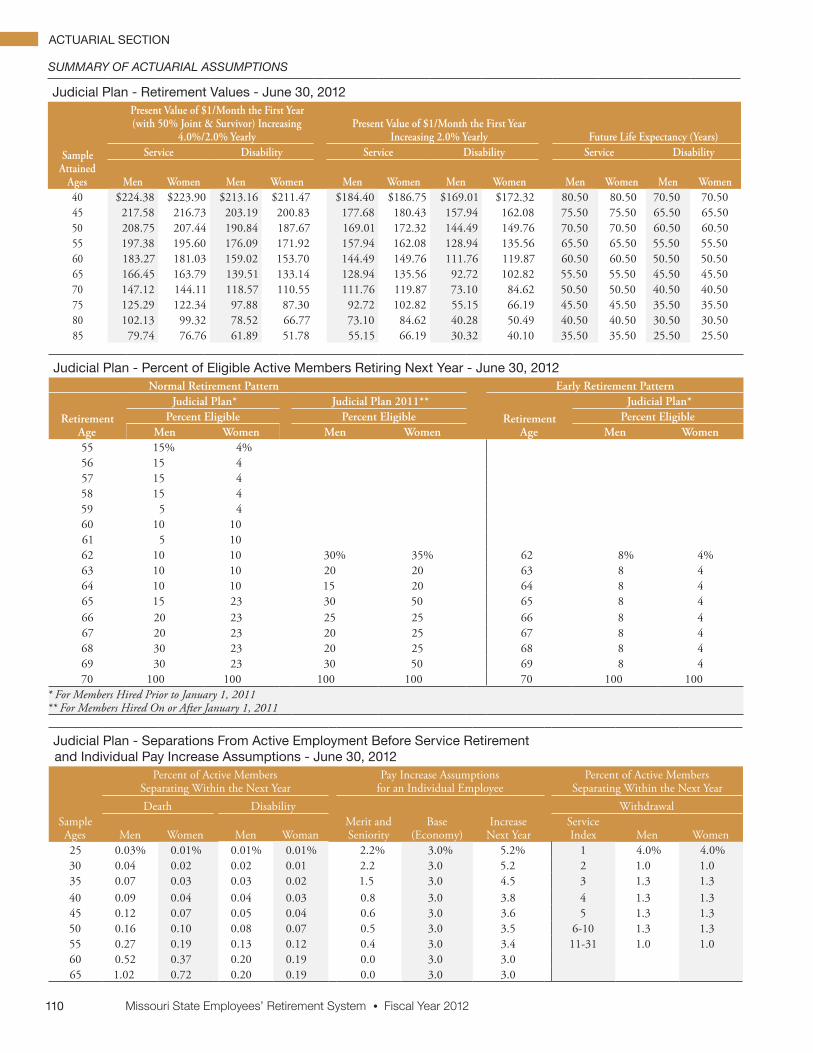
Missouri State Employees’ Retirement System • Fiscal Year 2012110
ACTUARIAL SECTION
Judicial Plan - Percent of Eligible Active Members Retiring Next Year - June 30, 2012Normal Retirement Pattern Early Retirement Pattern
Judicial Plan* Judicial Plan 2011** Judicial Plan*Retirement
AgePercent Eligible Percent Eligible Retirement
AgePercent Eligible
Men Women Men Women Men Women55 15% 4%56 15 457 15 458 15 459 5 460 10 1061 5 1062 10 10 30% 35% 62 8% 4%63 10 10 20 20 63 8 464 10 10 15 20 64 8 465 15 23 30 50 65 8 466 20 23 25 25 66 8 467 20 23 20 25 67 8 468 30 23 20 25 68 8 469 30 23 30 50 69 8 470 100 100 100 100 70 100 100
* For Members Hired Prior to January 1, 2011 ** For Members Hired On or After January 1, 2011
SUMMARY OF ACTUARIAL ASSUMPTIONS
Judicial Plan - Separations From Active Employment Before Service Retirement and Individual Pay Increase Assumptions - June 30, 2012
Percent of Active Members Separating Within the Next Year
Pay Increase Assumptionsfor an Individual Employee
Percent of Active Members Separating Within the Next Year
Sample Ages
Death DisabilityMerit and Seniority
Base (Economy)
Increase Next Year
Withdrawal
Men Women Men WomanService Index Men Women
25 0.03% 0.01% 0.01% 0.01% 2.2% 3.0% 5.2% 1 4.0% 4.0%30 0.04 0.02 0.02 0.01 2.2 3.0 5.2 2 1.0 1.035 0.07 0.03 0.03 0.02 1.5 3.0 4.5 3 1.3 1.340 0.09 0.04 0.04 0.03 0.8 3.0 3.8 4 1.3 1.345 0.12 0.07 0.05 0.04 0.6 3.0 3.6 5 1.3 1.350 0.16 0.10 0.08 0.07 0.5 3.0 3.5 6-10 1.3 1.355 0.27 0.19 0.13 0.12 0.4 3.0 3.4 11-31 1.0 1.060 0.52 0.37 0.20 0.19 0.0 3.0 3.065 1.02 0.72 0.20 0.19 0.0 3.0 3.0
Judicial Plan - Retirement Values - June 30, 2012Present Value of $1/Month the First Year (with 50% Joint & Survivor) Increasing
4.0%/2.0% YearlyPresent Value of $1/Month the First Year
Increasing 2.0% Yearly Future Life Expectancy (Years)
Sample Attained
Ages
Service Disability Service Disability Service Disability
Men Women Men Women Men Women Men Women Men Women Men Women40 $224.38 $223.90 $213.16 $211.47 $184.40 $186.75 $169.01 $172.32 80.50 80.50 70.50 70.5045 217.58 216.73 203.19 200.83 177.68 180.43 157.94 162.08 75.50 75.50 65.50 65.5050 208.75 207.44 190.84 187.67 169.01 172.32 144.49 149.76 70.50 70.50 60.50 60.5055 197.38 195.60 176.09 171.92 157.94 162.08 128.94 135.56 65.50 65.50 55.50 55.5060 183.27 181.03 159.02 153.70 144.49 149.76 111.76 119.87 60.50 60.50 50.50 50.5065 166.45 163.79 139.51 133.14 128.94 135.56 92.72 102.82 55.50 55.50 45.50 45.5070 147.12 144.11 118.57 110.55 111.76 119.87 73.10 84.62 50.50 50.50 40.50 40.5075 125.29 122.34 97.88 87.30 92.72 102.82 55.15 66.19 45.50 45.50 35.50 35.5080 102.13 99.32 78.52 66.77 73.10 84.62 40.28 50.49 40.50 40.50 30.50 30.5085 79.74 76.76 61.89 51.78 55.15 66.19 30.32 40.10 35.50 35.50 25.50 25.50

Missouri State Employees’ Retirement System • Fiscal Year 2012 111
ACTUARIAL SECTION
Pay Increase TimingBeginning of fiscal year.
Decrement TimingDecrements of all types are assumed to occur mid-year.
Eligibility TestingEligibility for benefits is determined based upon the age nearest birthday and service nearest whole year on the date the decrement is assumed to occur.
Benefit ServiceExact fractional service is used to determine the amount of the benefit payable.
Decrement RelativityDecrement rates are used directly from the experience study, without adjustment for multiple decrement table effects.
Decrement OperationDisability and mortality decrements do not operate during the first five years of service. Disability and withdrawal do not operate during normal retirement eligibility.
Normal Form of BenefitThe assumed normal form of benefit is the straight life form for MSEP 2000 with 50% continuing to an eligible surviving spouse for MSEP. No adjustment has been made for post-retirement option election changes.
For judges, the assumed normal form of benefit is the straight life form, with 50% continuing to an eligible surviving spouse for members hired prior to January 1, 2011.
Other Liability AdjustmentsMSEP 2000 benefits for active employees option elections were studied for MSEP 2000 retirees and the normal and early retirement alternate forms of payment assumption are slightly negatively subsidized. The actuarial accrued liability and normal cost have been adjusted by a factor of 0.99 for MSEP 2000 and MSEP 2011 retirements and by .995 for MSEP retirements based on the current rate of form of payment elections.
Pre-Retirement Survivor Benefits for Spouse of Terminated-Vested Member
Age Male Female<30 2.15 1.85
30-39 1.46 1.3440-49 1.16 1.12>50 1.04 1.03
Incidence of ContributionsContributions are assumed to be received continuously throughout the year based upon the computed percent of payroll shown in this report, and the actual payroll payable at the time contributions are made. New entrant normal cost contributions are applied to the funding of new entrant benefits.
SUMMARY OF ACTUARIAL ASSUMPTIONS
MISCELLANEOUS AND TECHNICAL ASSUMPTIONSJune 30, 2012

Missouri State Employees’ Retirement System • Fiscal Year 2012112
ACTUARIAL SECTION
MSEP 2000 ElectionAll regular state employees hired on or before June 30, 2000 are assumed to elect MSEP 2000 prior to age 62 and MSEP on or after age 62. Elected officials, General Assembly, and uniformed water patrol members hired before July 1, 2000 and administrative law judges hired before April 26, 2005 are assumed to elect MSEP at retirement.
Service AdjustmentIt is assumed that each member will be granted one half year of service credit, 3 months for unused leave upon retirement and 3 months for military service purchases. For members hired on or after January 1, 2011 it is assumed that each member will be granted 4 months for unused leave.
ForfeituresFor those hired on or after January 1, 2011, 50% of state employees terminating at first vesting eligibility are assumed to take a refund and forfeit their deferred pension. This percentage decreases to 0% at first retirement eligibility.
For judges, vested members are assumed not to take a refund of member contributions and forfeit their benefit upon separation from service.
Data AdjustmentsActive and retired member data was reported as of May 31, 2012. It was brought forward to June 30, 2012, by adding one month of service for all active members and the June COLA for certain retired members. It is expected that this procedure resulted in a slight overstatement of total liabilities as of June 30, 2012. Financial information continues to be reported as of June 30, 2012. This procedure was instituted to provide sufficient time for the board of trustees to certify the appropriate contribution rate prior to the October 1 statutory deadline. It is assumed for valuation purposes that there is no turnover among members and no new entrants during the month of June. New entrant assumed demographic patterns are based on the demographics of active members hired within the last five years.

Missouri State Employees’ Retirement System • Fiscal Year 2012 113
ACTUARIAL SECTION
Summary of Member Data Included in ValuationsPension Trust Funds - June 30, 2012
Active Members
Group Averages
Valuation Group Number Payroll Salary Age (Yrs.) Service (Yrs.)MSEPRegular state employees 48,084 $1,687,755,845 $ 35,100 45.6 11.0 Elected officials 6 659,978 109,996 50.6 6.8 Legislative clerks 29 917,553 31,640 59.2 20.8 Legislators 197 7,087,518 35,977 51.3 4.5 Uniformed water patrol 16 935,899 58,494 39.6 14.3 Conservation department 1,419 58,295,925 41,082 44.2 13.8 School-term salaried employees 1,551 105,475,392 68,005 55.6 19.9 Administrative law judges 30 2,941,383 98,046 56.4 18.3 Total MSEP group 51,332 $1,864,069,493 $ 36,314 45.9 11.3
Judicial Plan 398 $ 45,835,501 $115,165 56.5 12.5
Retired Lives
Group Averages
Type of Benefit Payment Number Annual Benefits Benefit Age (Yrs.)MSEPRetirement 33,124 $514,639,941 $15,537 69.2 Disability 8 29,712 3,714 60.8 Survivor of active member 1,474 14,594,888 9,902 61.6 Survivor of retired member 2,702 29,346,482 10,861 75.1 Total MSEP group 37,308 $558,611,023 $14,973 69.3
Judicial Plan 488 $ 26,964,555 $55,255 75.5
Others
Group Terminated Vested Leave of Absence Long-Term DisabilityMSEP 18,034 241 1,085 Judicial Plan 41 0 0

Missouri State Employees’ Retirement System • Fiscal Year 2012114
ACTUARIAL SECTION
Active Members by Attained Age and Years of ServiceJune 30, 2012
MSEP
Years of Service to Valuation Date Totals
Attained Age 0-4 5-9 10-14 15-19 20-24 25-29 30 Plus No. Valuation Payroll15-19 35 35 $ 705,204 20-24 1,377 13 1,390 34,426,087 25-29 3,339 726 13 4,078 120,841,818 30-34 2,545 1,985 582 7 5,119 165,890,661 35-39 1,759 1,529 1,599 399 8 5,294 183,157,259 40-44 1,614 1,313 1,704 1,460 347 24 6,462 232,733,876 45-49 1,481 1,296 1,479 1,271 1,110 576 29 7,242 272,967,723 50-54 1,394 1,281 1,586 1,202 1,103 1,080 517 8,163 313,620,415 55-59 1,071 1,128 1,411 1,139 1,060 733 552 7,094 278,098,454
60 151 211 282 198 171 93 110 1,216 48,040,182 61 170 190 231 164 148 110 86 1,099 42,651,555 62 130 149 219 157 140 80 83 958 37,501,128 63 103 135 166 136 113 61 57 771 31,822,724 64 82 116 140 93 85 39 39 594 23,437,418 65 66 111 128 89 60 38 45 537 22,849,433 66 45 76 94 57 45 36 45 398 17,625,156 67 17 41 49 43 31 16 18 215 9,710,853 68 17 24 43 30 18 15 19 166 7,023,666 69 10 15 42 24 6 8 18 123 5,285,080
70 & Over 43 71 86 60 43 20 55 378 15,680,801 Totals 15,449 10,410 9,854 6,529 4,488 2,929 1,673 51,332 $1,864,069,493
While not used in the financial computations, the following group averages are computed and shown because of their general interest.Group Averages: Age - 45.9 years • Service - 11.3 years • Annual pay - $36,314
Judicial Plan
Years of Service to Valuation Date Totals
Attained Age 0-4 5-9 10-14 15-19 20-24 25-29 30 Plus No. Valuation Payroll 35-39 5 4 9 $ 984,296 40-44 11 10 2 23 2,578,732 45-49 21 16 11 1 49 5,628,732 50-54 15 13 20 11 3 1 63 7,245,736 55-59 14 18 18 23 9 6 3 91 10,470,584
60 2 6 3 5 3 2 21 2,444,394 61 2 3 11 7 1 1 25 2,842,842 62 1 6 4 1 1 1 14 1,605,554 63 1 6 7 2 5 2 23 2,656,556 64 1 5 5 4 2 3 1 21 2,426,706 65 2 2 6 5 2 1 18 2,120,845 66 1 3 4 2 1 1 12 1,420,176 67 2 1 3 3 3 12 1,446,738 68 1 3 2 2 2 10 1,115,896 69 3 1 4 470,818 70 1 2 3 376,896
Totals 75 91 96 69 29 25 13 398 $45,835,501
While not used in the financial computations, the following group averages are computed and shown because of their general interest.Group Averages: Age - 56.5 years • Service - 12.5 years • Annual pay - $115,165
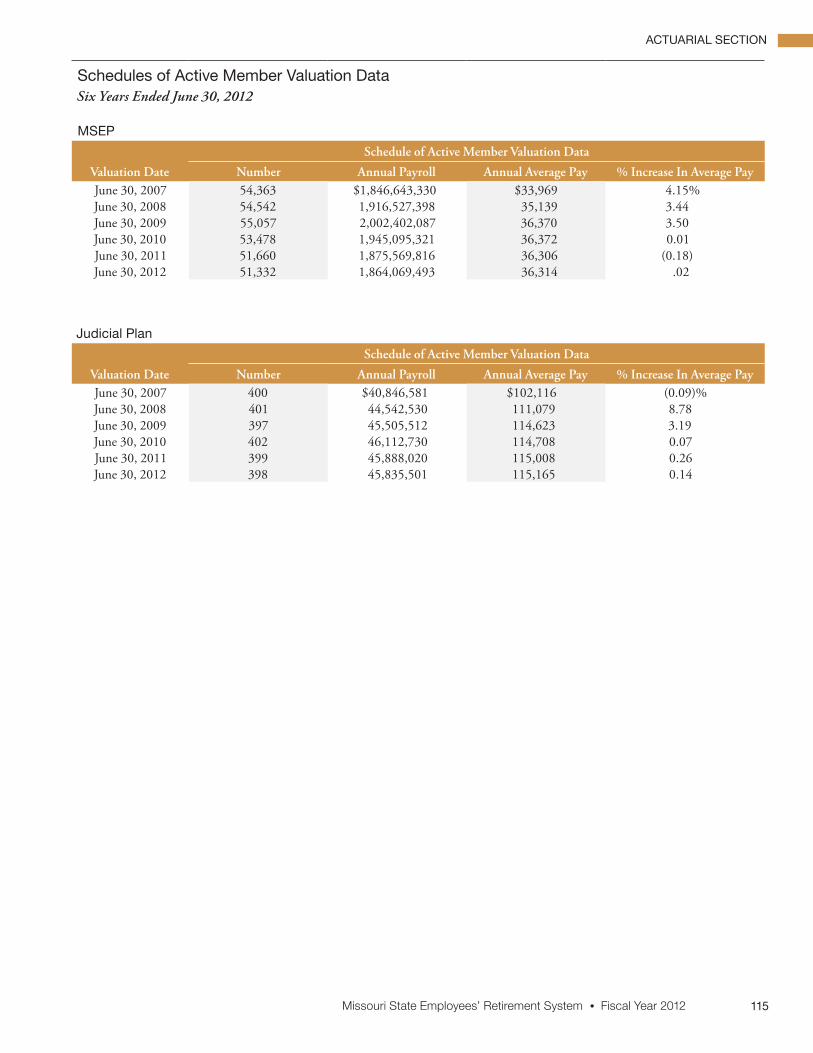
Missouri State Employees’ Retirement System • Fiscal Year 2012 115
ACTUARIAL SECTION
Schedules of Active Member Valuation DataSix Years Ended June 30, 2012
MSEP
Schedule of Active Member Valuation Data
Valuation Date Number Annual Payroll Annual Average Pay % Increase In Average PayJune 30, 2007 54,363 $1,846,643,330 $33,969 4.15% June 30, 2008 54,542 1,916,527,398 35,139 3.44 June 30, 2009 55,057 2,002,402,087 36,370 3.50 June 30, 2010 53,478 1,945,095,321 36,372 0.01 June 30, 2011 51,660 1,875,569,816 36,306 (0.18) June 30, 2012 51,332 1,864,069,493 36,314 .02
Judicial Plan
Schedule of Active Member Valuation Data
Valuation Date Number Annual Payroll Annual Average Pay % Increase In Average PayJune 30, 2007 400 $40,846,581 $102,116 (0.09)% June 30, 2008 401 44,542,530 111,079 8.78 June 30, 2009 397 45,505,512 114,623 3.19 June 30, 2010 402 46,112,730 114,708 0.07 June 30, 2011 399 45,888,020 115,008 0.26 June 30, 2012 398 45,835,501 115,165 0.14

Missouri State Employees’ Retirement System • Fiscal Year 2012116
ACTUARIAL SECTION
Retirees and Beneficiaries Added and Removed Six Years Ended June 30, 2012
MSEPSource of Data: MOSERS benefit payment database as of June 30, 2012.
Other Actuarial Section information reported based on MOSERS data as of May 31, 2012.
Added to Rolls Removed from Rolls Rolls at End of Year
Fiscal Year Ended Classification Benefit Type NumberAnnual
Allowances NumberAnnual
Allowances NumberAnnual
Allowances
Percentage Increase (Decrease) in
Annual AllowancesAverage Annual
Allowances
Percentage Increase (Decrease) in Average Annual Allowances
June 30, 2007
General employees Retirement 2,211 $37,839,159 740 $8,391,528 25,293 $371,145,149 8.62 $14,674 2.30 Survivor of active 89 897,874 39 281,916 1,304 10,777,493 6.06 8,265 2.00 Survivor of retired 213 2,630,107 106 810,074 2,021 18,489,454 10.92 9,149 5.05 Disability 0 1,104 4 18,658 12 39,590 (30.72) 3,299 (7.64)Occupational disability 0 0 0 0 0 0 0.00 0 0.00
Lincoln university - vested Retirement 0 0 0 0 11 50,475 0.00 4,589 0.00 Survivor of active 0 0 0 0 1 2,624 0.00 2,624 0.00
Legislators Retirement 19 303,741 7 178,306 250 4,735,015 2.72 18,940 (2.21)Survivor of active 1 8,157 0 0 14 150,712 5.72 10,765 (1.83)Survivor of retired 5 95,976 0 0 52 618,929 18.35 11,902 6.97
Elected officials Retirement 0 0 0 0 12 477,190 0.00 39,766 0.00 Survivor of active 0 2,771 0 0 1 72,045 4.00 72,045 4.00 Survivor of retired 0 1,178 0 0 1 30,618 4.00 30,618 4.00
ALJs Retirement 0 35,846 0 0 25 1,090,746 3.40 43,630 3.40 Survivor of active 0 0 0 0 0 0 0.00 0 0.00 Survivor of retired 0 6,071 0 0 9 215,092 2.90 23,899 2.90
June 30, 2008
General employees Retirement 2,159 36,365,696 853 9,745,552 26,599 397,765,293 7.17 14,954 1.91 Survivor of active 91 971,449 59 259,787 1,336 11,489,155 6.60 8,600 4.05 Survivor of retired 234 2,715,274 137 916,500 2,118 20,288,228 9.73 9,579 4.70 Disability 0 900 1 4,074 11 36,416 (8.02) 3,311 0.36 Occupational disability 0 0 0 0 0 0 0.00 0 0.00
Lincoln university - vested Retirement 2 5,478 0 0 13 55,953 10.85 4,304 (6.21)Survivor of active 0 0 0 0 1 2,624 0.00 2,624 0.00
Legislators Retirement 9 147,136 10 300,216 249 4,581,935 (3.23) 18,401 (2.85)Survivor of active 0 4,489 0 0 14 155,201 2.98 11,086 2.98 Survivor of retired 5 114,053 3 24,638 54 708,344 14.45 13,117 10.21
Elected officials Retirement 0 37,804 0 0 12 514,994 7.92 42,916 7.92 Survivor of active 0 2,882 0 0 1 74,927 4.00 74,927 4.00 Survivor of retired 0 1,225 0 0 1 31,843 4.00 31,843 4.00
ALJs Retirement 2 102,631 2 94,035 25 1,099,342 0.79 43,974 0.79 Survivor of active 0 0 0 0 0 0 0.00 0 0.00 Survivor of retired 1 30,876 0 0 10 245,968 14.35 24,597 2.92
June 30, 2009
General employees Retirement 2,195 37,338,992 852 9,903,887 27,942 425,200,398 6.90 15,217 1.76 Survivor of active 82 996,258 54 390,167 1,364 12,095,246 5.28 8,867 3.10 Survivor of retired 251 3,077,466 110 827,564 2,259 22,538,130 11.09 9,977 4.15 Disability 0 876 1 4,237 10 33,055 (9.23) 3,306 (0.15)Occupational disability 0 0 0 0 0 0 0.00 0 0.00
Lincoln university - vested Retirement 0 0 0 0 13 55,953 0.00 4,304 0.00 Survivor of active 0 0 0 0 1 2,624 0.00 2,624 0.00
Legislators Retirement 21 746,414 8 120,396 262 5,207,953 13.66 19,878 8.03 Survivor of active 0 5,137 1 14,128 13 146,210 (5.79) 11,247 1.45 Survivor of retired 4 84,108 2 20,473 56 771,979 8.98 13,785 5.09
Elected officials Retirement 2 105,141 0 0 14 620,135 20.42 44,295 3.21 Survivor of active 0 2,997 0 0 1 77,924 4.00 77,924 4.00 Survivor of retired 0 1,274 0 0 1 33,117 4.00 33,117 4.00
ALJs Retirement 3 168,517 2 90,337 26 1,177,522 7.11 45,289 2.99 Survivor of active 0 0 0 0 0 0 0.00 0 0.00 Survivor of retired 2 57,238 1 27,354 11 275,852 12.15 25,077 1.95

Missouri State Employees’ Retirement System • Fiscal Year 2012 117
ACTUARIAL SECTION
Retirees and Beneficiaries Added and Removed Six Years Ended June 30, 2012
MSEPSource of Data: MOSERS benefit payment database as of June 30, 2012.
Other Actuarial Section information reported based on MOSERS data as of May 31, 2012.
Added to Rolls Removed from Rolls Rolls at End of Year
Fiscal Year Ended Classification Benefit Type NumberAnnual
Allowances NumberAnnual
Allowances NumberAnnual
Allowances
Percentage Increase (Decrease) in
Annual AllowancesAverage Annual
Allowances
Percentage Increase (Decrease) in Average Annual Allowances
June 30, 2007
General employees Retirement 2,211 $37,839,159 740 $8,391,528 25,293 $371,145,149 8.62 $14,674 2.30 Survivor of active 89 897,874 39 281,916 1,304 10,777,493 6.06 8,265 2.00 Survivor of retired 213 2,630,107 106 810,074 2,021 18,489,454 10.92 9,149 5.05 Disability 0 1,104 4 18,658 12 39,590 (30.72) 3,299 (7.64)Occupational disability 0 0 0 0 0 0 0.00 0 0.00
Lincoln university - vested Retirement 0 0 0 0 11 50,475 0.00 4,589 0.00 Survivor of active 0 0 0 0 1 2,624 0.00 2,624 0.00
Legislators Retirement 19 303,741 7 178,306 250 4,735,015 2.72 18,940 (2.21)Survivor of active 1 8,157 0 0 14 150,712 5.72 10,765 (1.83)Survivor of retired 5 95,976 0 0 52 618,929 18.35 11,902 6.97
Elected officials Retirement 0 0 0 0 12 477,190 0.00 39,766 0.00 Survivor of active 0 2,771 0 0 1 72,045 4.00 72,045 4.00 Survivor of retired 0 1,178 0 0 1 30,618 4.00 30,618 4.00
ALJs Retirement 0 35,846 0 0 25 1,090,746 3.40 43,630 3.40 Survivor of active 0 0 0 0 0 0 0.00 0 0.00 Survivor of retired 0 6,071 0 0 9 215,092 2.90 23,899 2.90
June 30, 2008
General employees Retirement 2,159 36,365,696 853 9,745,552 26,599 397,765,293 7.17 14,954 1.91 Survivor of active 91 971,449 59 259,787 1,336 11,489,155 6.60 8,600 4.05 Survivor of retired 234 2,715,274 137 916,500 2,118 20,288,228 9.73 9,579 4.70 Disability 0 900 1 4,074 11 36,416 (8.02) 3,311 0.36 Occupational disability 0 0 0 0 0 0 0.00 0 0.00
Lincoln university - vested Retirement 2 5,478 0 0 13 55,953 10.85 4,304 (6.21)Survivor of active 0 0 0 0 1 2,624 0.00 2,624 0.00
Legislators Retirement 9 147,136 10 300,216 249 4,581,935 (3.23) 18,401 (2.85)Survivor of active 0 4,489 0 0 14 155,201 2.98 11,086 2.98 Survivor of retired 5 114,053 3 24,638 54 708,344 14.45 13,117 10.21
Elected officials Retirement 0 37,804 0 0 12 514,994 7.92 42,916 7.92 Survivor of active 0 2,882 0 0 1 74,927 4.00 74,927 4.00 Survivor of retired 0 1,225 0 0 1 31,843 4.00 31,843 4.00
ALJs Retirement 2 102,631 2 94,035 25 1,099,342 0.79 43,974 0.79 Survivor of active 0 0 0 0 0 0 0.00 0 0.00 Survivor of retired 1 30,876 0 0 10 245,968 14.35 24,597 2.92
June 30, 2009
General employees Retirement 2,195 37,338,992 852 9,903,887 27,942 425,200,398 6.90 15,217 1.76 Survivor of active 82 996,258 54 390,167 1,364 12,095,246 5.28 8,867 3.10 Survivor of retired 251 3,077,466 110 827,564 2,259 22,538,130 11.09 9,977 4.15 Disability 0 876 1 4,237 10 33,055 (9.23) 3,306 (0.15)Occupational disability 0 0 0 0 0 0 0.00 0 0.00
Lincoln university - vested Retirement 0 0 0 0 13 55,953 0.00 4,304 0.00 Survivor of active 0 0 0 0 1 2,624 0.00 2,624 0.00
Legislators Retirement 21 746,414 8 120,396 262 5,207,953 13.66 19,878 8.03 Survivor of active 0 5,137 1 14,128 13 146,210 (5.79) 11,247 1.45 Survivor of retired 4 84,108 2 20,473 56 771,979 8.98 13,785 5.09
Elected officials Retirement 2 105,141 0 0 14 620,135 20.42 44,295 3.21 Survivor of active 0 2,997 0 0 1 77,924 4.00 77,924 4.00 Survivor of retired 0 1,274 0 0 1 33,117 4.00 33,117 4.00
ALJs Retirement 3 168,517 2 90,337 26 1,177,522 7.11 45,289 2.99 Survivor of active 0 0 0 0 0 0 0.00 0 0.00 Survivor of retired 2 57,238 1 27,354 11 275,852 12.15 25,077 1.95
Continued on pages 118-119

Missouri State Employees’ Retirement System • Fiscal Year 2012118
ACTUARIAL SECTION
Retirees and Beneficiaries Added and Removed Six Years Ended June 30, 2012
MSEPSource of Data: MOSERS benefit payment database as of June 30, 2012.
Other Actuarial Section information reported based on MOSERS data as of May 31, 2012.
Added to Rolls Removed from Rolls Rolls at End of Year
Fiscal Year Ended Classification Benefit Type NumberAnnual
Allowances NumberAnnual
Allowances NumberAnnual
Allowances
Percentage Increase (Decrease) in
Annual AllowancesAverage Annual
Allowances
Percentage Increase (Decrease) in Average Annual Allowances
June 30, 2010
General employees Retirement 2,298 $34,755,192 833 $9,979,318 29,407 $449,976,272 5.83% $15,302 0.56% Survivor of active 83 1,054,292 49 276,401 1,398 12,873,137 6.43 9,208 3.85 Survivor of retired 246 3,080,424 117 1,078,265 2,388 24,540,289 8.88 10,277 3.01 Disability 0 830 1 2,985 9 30,900 (6.52) 3,433 3.84 Occupational disability 0 0 0 0 0 0 0.00 0 0.00
Lincoln university - vested Retirement 1 5,671 0 0 14 61,624 10.14 4,402 2.28 Survivor of active 0 0 0 0 1 2,624 0.00 2,624 0.00
Legislators Retirement 12 201,562 12 239,880 262 5,169,635 (0.74) 19,731 (0.74)Survivor of active 0 3,975 1 16,709 12 133,476 (8.71) 11,123 (1.10)Survivor of retired 5 78,765 0 0 61 850,744 10.20 13,947 1.18
Elected officials Retirement 0 0 1 66,911 13 553,224 (10.79) 42,556 (3.93)Survivor of active 0 3,117 0 0 1 81,041 4.00 81,041 4.00 Survivor of retired 1 34,780 0 0 2 67,897 105.02 33,949 2.51
ALJs Retirement 3 113,877 1 46,794 28 1,244,605 5.70 44,450 (1.85)Survivor of active 0 0 0 0 0 0 0.00 0 0.00 Survivor of retired 0 7,332 0 0 11 283,184 2.66 25,744 2.66
June 30, 2011
General employees Retirement 2,850 41,203,358 892 10,670,476 31,365 480,509,154 6.79 15,320 0.12 Survivor of active 65 914,689 46 261,503 1,417 13,526,323 5.07 9,546 3.67 Survivor of retired 298 3,059,195 176 1,670,990 2,510 25,928,494 5.66 10,330 0.52 Disability 0 79 1 1,732 8 29,247 (5.35) 3,656 6.50 Occupational disability 0 0 0 0 0 0 0.00 0 0.00
Lincoln university - vested Retirement 1 1,780 0 0 15 63,404 2.89 4,227 (3.98) Survivor of active 0 0 0 0 1 2,624 0.00 2,624 0.00
Legislators Retirement 41 601,171 10 185,635 293 5,585,171 8.04 19,062 (3.39)Survivor of active 0 2,903 1 19,612 11 116,767 (12.52) 10,615 (4.57)Survivor of retired 5 73,841 2 16,628 64 907,957 6.73 14,187 1.72
Elected officials Retirement 0 0 0 0 13 553,224 0.00 42,556 0.00 Survivor of active 0 3,242 0 0 1 84,283 4.00 84,283 4.00 Survivor of retired 0 1,053 0 0 2 68,950 1.55 34,475 1.55
ALJs Retirement 4 212,519 0 0 32 1,457,124 17.08 45,535 2.44 Survivor of active 0 0 0 0 0 0 0.00 0 0.00 Survivor of retired 0 2,599 1 27,724 10 258,059 (8.87) 25,806 0.24
June 30, 2012
General employees Retirement 2,637 39,423,910 895 11,116,063 33,107 508,817,001 5.89 15,369 0.32 Survivor of active 82 1,129,634 34 197,452 1,465 14,458,505 6.89 9,869 3.38 Survivor of retired 282 3,665,503 158 1,416,283 2,634 28,177,714 8.67 10,698 3.56 Disability 0 458 0 0 8 29,705 1.57 3,713 1.56 Occupational disability 0 0 0 0 0 0 0.00 0 0.00
Lincoln university - vested Retirement 0 0 2 11,032 13 52,372 (17.40) 4,029 (4.68) Survivor of active 0 0 0 0 1 2,624 0.00 2,624 0.00
Legislators Retirement 13 229,979 8 139,545 298 5,675,605 1.62 19,046 (0.08)Survivor of active 0 3,531 0 0 11 120,298 3.02 10,936 3.02 Survivor of retired 4 80,142 3 52,550 65 935,549 3.04 14,393 1.45
Elected officials Retirement 2 86,431 0 0 15 639,655 15.62 42,644 0.21 Survivor of active 0 3,371 0 0 1 87,654 4.00 87,654 4.00 Survivor of retired 0 1,336 0 0 2 70,286 1.94 35,143 1.94
ALJs Retirement 3 124,248 3 158,072 32 1,423,300 (2.32) 44,478 (2.32)Survivor of active 1 25,592 0 0 1 25,592 0.00 25,592 0.00 Survivor of retired 2 57,704 0 0 12 315,763 22.36 26,314 1.97
Continued from pages 116 - 117

Missouri State Employees’ Retirement System • Fiscal Year 2012 119
ACTUARIAL SECTION
Retirees and Beneficiaries Added and Removed Six Years Ended June 30, 2012
MSEPSource of Data: MOSERS benefit payment database as of June 30, 2012.
Other Actuarial Section information reported based on MOSERS data as of May 31, 2012.
Added to Rolls Removed from Rolls Rolls at End of Year
Fiscal Year Ended Classification Benefit Type NumberAnnual
Allowances NumberAnnual
Allowances NumberAnnual
Allowances
Percentage Increase (Decrease) in
Annual AllowancesAverage Annual
Allowances
Percentage Increase (Decrease) in Average Annual Allowances
June 30, 2010
General employees Retirement 2,298 $34,755,192 833 $9,979,318 29,407 $449,976,272 5.83% $15,302 0.56% Survivor of active 83 1,054,292 49 276,401 1,398 12,873,137 6.43 9,208 3.85 Survivor of retired 246 3,080,424 117 1,078,265 2,388 24,540,289 8.88 10,277 3.01 Disability 0 830 1 2,985 9 30,900 (6.52) 3,433 3.84 Occupational disability 0 0 0 0 0 0 0.00 0 0.00
Lincoln university - vested Retirement 1 5,671 0 0 14 61,624 10.14 4,402 2.28 Survivor of active 0 0 0 0 1 2,624 0.00 2,624 0.00
Legislators Retirement 12 201,562 12 239,880 262 5,169,635 (0.74) 19,731 (0.74)Survivor of active 0 3,975 1 16,709 12 133,476 (8.71) 11,123 (1.10)Survivor of retired 5 78,765 0 0 61 850,744 10.20 13,947 1.18
Elected officials Retirement 0 0 1 66,911 13 553,224 (10.79) 42,556 (3.93)Survivor of active 0 3,117 0 0 1 81,041 4.00 81,041 4.00 Survivor of retired 1 34,780 0 0 2 67,897 105.02 33,949 2.51
ALJs Retirement 3 113,877 1 46,794 28 1,244,605 5.70 44,450 (1.85)Survivor of active 0 0 0 0 0 0 0.00 0 0.00 Survivor of retired 0 7,332 0 0 11 283,184 2.66 25,744 2.66
June 30, 2011
General employees Retirement 2,850 41,203,358 892 10,670,476 31,365 480,509,154 6.79 15,320 0.12 Survivor of active 65 914,689 46 261,503 1,417 13,526,323 5.07 9,546 3.67 Survivor of retired 298 3,059,195 176 1,670,990 2,510 25,928,494 5.66 10,330 0.52 Disability 0 79 1 1,732 8 29,247 (5.35) 3,656 6.50 Occupational disability 0 0 0 0 0 0 0.00 0 0.00
Lincoln university - vested Retirement 1 1,780 0 0 15 63,404 2.89 4,227 (3.98) Survivor of active 0 0 0 0 1 2,624 0.00 2,624 0.00
Legislators Retirement 41 601,171 10 185,635 293 5,585,171 8.04 19,062 (3.39)Survivor of active 0 2,903 1 19,612 11 116,767 (12.52) 10,615 (4.57)Survivor of retired 5 73,841 2 16,628 64 907,957 6.73 14,187 1.72
Elected officials Retirement 0 0 0 0 13 553,224 0.00 42,556 0.00 Survivor of active 0 3,242 0 0 1 84,283 4.00 84,283 4.00 Survivor of retired 0 1,053 0 0 2 68,950 1.55 34,475 1.55
ALJs Retirement 4 212,519 0 0 32 1,457,124 17.08 45,535 2.44 Survivor of active 0 0 0 0 0 0 0.00 0 0.00 Survivor of retired 0 2,599 1 27,724 10 258,059 (8.87) 25,806 0.24
June 30, 2012
General employees Retirement 2,637 39,423,910 895 11,116,063 33,107 508,817,001 5.89 15,369 0.32 Survivor of active 82 1,129,634 34 197,452 1,465 14,458,505 6.89 9,869 3.38 Survivor of retired 282 3,665,503 158 1,416,283 2,634 28,177,714 8.67 10,698 3.56 Disability 0 458 0 0 8 29,705 1.57 3,713 1.56 Occupational disability 0 0 0 0 0 0 0.00 0 0.00
Lincoln university - vested Retirement 0 0 2 11,032 13 52,372 (17.40) 4,029 (4.68) Survivor of active 0 0 0 0 1 2,624 0.00 2,624 0.00
Legislators Retirement 13 229,979 8 139,545 298 5,675,605 1.62 19,046 (0.08)Survivor of active 0 3,531 0 0 11 120,298 3.02 10,936 3.02 Survivor of retired 4 80,142 3 52,550 65 935,549 3.04 14,393 1.45
Elected officials Retirement 2 86,431 0 0 15 639,655 15.62 42,644 0.21 Survivor of active 0 3,371 0 0 1 87,654 4.00 87,654 4.00 Survivor of retired 0 1,336 0 0 2 70,286 1.94 35,143 1.94
ALJs Retirement 3 124,248 3 158,072 32 1,423,300 (2.32) 44,478 (2.32)Survivor of active 1 25,592 0 0 1 25,592 0.00 25,592 0.00 Survivor of retired 2 57,704 0 0 12 315,763 22.36 26,314 1.97

Missouri State Employees’ Retirement System • Fiscal Year 2012120
ACTUARIAL SECTION
Retirees and Beneficiaries Added and Removed Six Years Ended June 30, 2012
Judicial PlanSource of Data: MOSERS benefit payment database as of June 30, 2012.
Other Actuarial Section information reported based on MOSERS data as of May 31, 2012.
Added to Rolls Removed from Rolls Rolls at End of Year
Fiscal Year Ended Benefit Type Number Annual Allowances Number Annual Allowances Number Annual Allowances
Percentage Increase (Decrease) in Annual
AllowancesAverage Annual
Allowances
Percentage Increase (Decrease) in Average Annual Allowances
June 30, 2007Retirement 47 $2,802,873 15 $967,969 307 $18,052,462 11.31% $58,803 (0.29)%Survivor of active 1 64,452 2 40,742 40 1,018,949 2.38 25,474 4.94 Survivor of retired 13 526,008 4 91,948 93 2,577,100 20.25 27,711 8.62 Disability 0 0 1 54,000 0 0 (100.00) 0 (100.00)
June 30, 2008
Retirement 21 1,554,013 17 946,602 311 18,659,873 3.36 60,000 2.04 Survivor of active 0 31,650 4 53,658 36 996,941 (2.16) 27,693 8.71 Survivor of retired 11 387,194 8 181,387 96 2,782,907 7.99 28,989 4.61 Disability 0 0 0 0 0 0 0.00 0 0.00
June 30, 2009
Retirement 30 1,922,615 15 957,943 326 19,624,545 5.17 60,198 0.33 Survivor of active 1 59,484 0 0 37 1,056,425 5.97 28,552 3.10 Survivor of retired 9 418,266 2 61,344 103 3,139,829 12.83 30,484 5.16Disability 0 0 0 0 0 0 0.00 0 0.00
June 30, 2010
Retirement 12 1,137,305 13 750,021 325 20,011,829 1.97 61,575 2.29 Survivor of active 0 32,700 2 32,399 35 1,056,726 0.03 30,192 5.74 Survivor of retired 11 436,312 5 130,920 109 3,445,221 9.73 31,608 3.69 Disability 0 0 0 0 0 0 0.00 0 0.00
June 30, 2011
Retirement 36 2,501,248 9 563,214 352 21,949,863 9.68 62,358 1.27 Survivor of active 0 14,893 1 35,792 34 1,035,827 (1.98) 30,466 0.91 Survivor of retired 4 167,535 9 206,465 104 3,406,291 (1.13) 32,753 3.62 Disability 0 0 0 0 0 0 0.00 0 0.00
June 30, 2012
Retirement 18 1,490,554 14 1,074,572 356 22,365,845 1.90 62,825 0.75 Survivor of active 0 22,717 0 0 34 1,058,544 2.19 31,134 2.19 Survivor of retired 8 371,622 6 218,310 106 3,559,603 4.50 33,581 2.53 Disability 0 0 0 0 0 0 0.00 0 0.00

Missouri State Employees’ Retirement System • Fiscal Year 2012 121
ACTUARIAL SECTION
Retirees and Beneficiaries Added and Removed Six Years Ended June 30, 2012
Judicial PlanSource of Data: MOSERS benefit payment database as of June 30, 2012.
Other Actuarial Section information reported based on MOSERS data as of May 31, 2012.
Added to Rolls Removed from Rolls Rolls at End of Year
Fiscal Year Ended Benefit Type Number Annual Allowances Number Annual Allowances Number Annual Allowances
Percentage Increase (Decrease) in Annual
AllowancesAverage Annual
Allowances
Percentage Increase (Decrease) in Average Annual Allowances
June 30, 2007Retirement 47 $2,802,873 15 $967,969 307 $18,052,462 11.31% $58,803 (0.29)%Survivor of active 1 64,452 2 40,742 40 1,018,949 2.38 25,474 4.94 Survivor of retired 13 526,008 4 91,948 93 2,577,100 20.25 27,711 8.62 Disability 0 0 1 54,000 0 0 (100.00) 0 (100.00)
June 30, 2008
Retirement 21 1,554,013 17 946,602 311 18,659,873 3.36 60,000 2.04 Survivor of active 0 31,650 4 53,658 36 996,941 (2.16) 27,693 8.71 Survivor of retired 11 387,194 8 181,387 96 2,782,907 7.99 28,989 4.61 Disability 0 0 0 0 0 0 0.00 0 0.00
June 30, 2009
Retirement 30 1,922,615 15 957,943 326 19,624,545 5.17 60,198 0.33 Survivor of active 1 59,484 0 0 37 1,056,425 5.97 28,552 3.10 Survivor of retired 9 418,266 2 61,344 103 3,139,829 12.83 30,484 5.16Disability 0 0 0 0 0 0 0.00 0 0.00
June 30, 2010
Retirement 12 1,137,305 13 750,021 325 20,011,829 1.97 61,575 2.29 Survivor of active 0 32,700 2 32,399 35 1,056,726 0.03 30,192 5.74 Survivor of retired 11 436,312 5 130,920 109 3,445,221 9.73 31,608 3.69 Disability 0 0 0 0 0 0 0.00 0 0.00
June 30, 2011
Retirement 36 2,501,248 9 563,214 352 21,949,863 9.68 62,358 1.27 Survivor of active 0 14,893 1 35,792 34 1,035,827 (1.98) 30,466 0.91 Survivor of retired 4 167,535 9 206,465 104 3,406,291 (1.13) 32,753 3.62 Disability 0 0 0 0 0 0 0.00 0 0.00
June 30, 2012
Retirement 18 1,490,554 14 1,074,572 356 22,365,845 1.90 62,825 0.75 Survivor of active 0 22,717 0 0 34 1,058,544 2.19 31,134 2.19 Survivor of retired 8 371,622 6 218,310 106 3,559,603 4.50 33,581 2.53 Disability 0 0 0 0 0 0 0.00 0 0.00

Missouri State Employees’ Retirement System • Fiscal Year 2012122
ACTUARIAL SECTION
Short-Term Solvency TestTen Years Ended June 30, 2012
MSEP
Actuarial Accrued Liabilities for
FiscalYear
MemberContributions
CurrentRetirees andBeneficiaries
Active and InactiveMembers, Employer
Financed Portion Actuarial Value of AssetsAvailable for Benefits
Percentage of Actuarial Liabilities
Covered by Actuarial Value of Assets Available for
(1) (2) (3) (1) (2) (3)2003 $ 0 $3,016,029,050 $3,646,262,356 $6,057,329,072 100.0% 100.0% 83.4%2004 0 3,405,053,804 3,824,957,124 6,118,214,495 100.0 100.0 70.9 2005 0 3,629,506,014 3,948,522,003 6,435,344,102 100.0 100.0 71.1 2006 0 3,876,349,145 4,136,856,269 6,836,567,188 100.0 100.0 71.6 2007 0 4,208,621,537 4,291,807,104 7,377,289,283 100.0 100.0 73.8 2008 0 4,408,682,437 4,719,665,033 7,838,495,768 100.0 100.0 72.7 2009 0 4,737,859,976 4,756,946,739 7,876,079,342 100.0 100.0 66.0 2010 0 5,012,677,769 4,840,477,676 7,923,377,393 100.0 100.0 60.1 2011 67,126 5,357,794,617 4,765,682,300 8,022,481,408 100.0 100.0 55.9 2012 706,422 5,748,985,566 5,043,959,589 7,897,167,203 100.0 100.0 42.6
ALJLAP*
Actuarial Accrued Liabilities for
FiscalYear
MemberContributions
CurrentRetirees andBeneficiaries
Active and InactiveMembers, Employer
Financed Portion Actuarial Value of AssetsAvailable for Benefits
Percentage of Actuarial Liabilities
Covered by Actuarial Value of Assets Available for
(1) (2) (3) (1) (2) (3)2003 $0 $9,709,096 $10,237,391 $15,626,461 100.0% 100.0% 57.8%2004 0 9,188,086 11,196,127 16,238,804 100.0 100.0 63.0
* Assets and liabilities transferred to the MSEP during fiscal year 2005
Judicial Plan
Actuarial Accrued Liabilities for
FiscalYear
MemberContributions
CurrentRetirees andBeneficiaries
Active and InactiveMembers, Employer
Financed Portion Actuarial Value of AssetsAvailable for Benefits
Percentage of Actuarial Liabilities
Covered by Actuarial Value of Assets Available for
(1) (2) (3) (1) (2) (3)2003 $ 0 $157,923,805 $109,126,052 $ 34,566,516 100.0% 21.9% 0.0%2004 0 162,539,486 117,857,978 39,120,142 100.0 24.1 0.0 2005 0 168,703,822 123,600,064 44,223,509 100.0 26.2 0.0 2006 0 171,677,032 137,325,720 51,652,867 100.0 30.1 0.0 2007 0 199,489,503 127,176,870 61,903,516 100.0 31.0 0.0 2008 0 216,369,879 138,426,574 73,194,379 100.0 33.8 0.0 2009 0 231,505,591 137,601,250 81,337,881 100.0 35.1 0.0 2010 0 236,113,077 145,899,696 88,976,738 100.0 37.7 0.0 2011 284 251,532,354 141,951,951 98,398,628 100.0 39.1 0.0 2012 795 258,642,149 154,689,594 102,266,706 100.0 39.5 0.0

Missouri State Employees’ Retirement System • Fiscal Year 2012 123
ACTUARIAL SECTION
Derivation of Experience Gain (Loss)Year Ended June 30, 2012
MSEP
Actual experience will never coincide exactly with assumed experience (except by coincidence). Gains and losses may offset each other over a period of years, but sizeable year-to-year variations from assumed experience are common. Detail on the derivation of the experience gain (loss) is shown below.
Valuation Date
June 30
Actuarial Gain (Loss) As a % of
Beginning Accrued Liabilities
$ Millions 2003 (6.4)(1) Unfunded actuarial accrued liability (UAAL) at beginning of year $2,101.1 2004 (6.0)(2) Normal cost from last valuation 159.2 2005 (3.4)(3) Actual employer contributions 273.9 2006 (0.1)(4) Interest accrual: (1)x.085+[(2)-(3)]x(.085/2) 173.7 2007 1.0 (5) Expected UAAL before changes: (1)+(2)-(3)+(4) 2,160.1 2008 0.1 (6) Change from any changes in benefits, assumptions, or methods 259.1 2009 (5.2)(7) Expected UAAL after changes: (5)+(6) 2,419.2 2010 (4.0)(8) Actual UAAL at end of year 2,896.5 2011 (2.4)(9) Gain (loss) (7)-(8) (477.3) 2012 (4.7)
(10) Gain (loss) as a percent of actuarial accrued liabilities at start of year ($10,124) (4.7)%
Judicial Plan
The actuarial gains or losses realized in the operation of the retirement system provide an experience test. Gains and losses often cancel each other over a period of years, but sizable year-to-year fluctuations are common. Detail on the derivation of the actuarial gain (loss) is shown below, along with a year-by-year comparative schedule.
Valuation Date
June 30
Actuarial Gain (Loss) As a % of
Beginning Accrued Liabilities
$ Millions 2003 (1.6)(1) Unfunded actuarial accrued liability (UAAL) at beginning of year $295.1 2004 (1.0)(2) Employer normal cost middle of year 8.7 2005 (0.1)(3) Employer contributions 26.3 2006 (1.1)(4) Interest 2007 (0.6)
a. on (1) 25.1 2008 (3.0)b. on (2) 0.3 2009 (1.8)c. on (3) 1.1 2010 (1.1)d. total [a+b-c] 24.3 2011 (0.4)
(5) Expected UAAL end of year before changes 301.8 2012 (0.6)(6) Change in UAAL end of year
a. amendments 0.0b. assumptions 7.0c. methods 0.0d. total 7.0
(7) Expected UAAL after changes: (5)+(6d.) 308.7(8) Actual UAAL at end of year 311.1(9) Gain (loss) (7)-(8) (2.3)
(10) Gain (loss) as a percent of actuarial accrued liabilities at start of year ($393.5) (0.6)%

Missouri State Employees’ Retirement System • Fiscal Year 2012124
ACTUARIAL SECTION
SUMMARY OF PLAN PROVISIONS
Comparison of Plans for General State EmployeesJune 30, 2012 G
MSEP • MSEP 2000 • MSEP 2011 ENERAL STATE EMPLOYEES
Benefit Provisions MSEP MSEP 2000 MSEP 2011Membership eligibility • Members who work in a permanent position normally requiring at
least 1,040 hours of work a year.• Members hired for the first time on or after July 1, 2000, in a
permanent position normally requiring at least 1,040 hours of work a year.
• Members who left state employment prior to becoming vested and returned to work on or after July 1, 2000, in a permanent position normally requiring at least 1,040 hours of work a year.
• Members hired for the first time on or after January 1, 2011, in a permanent position normally requiring at least 1,040 hours of work a year.
Vesting • 5 years • 5 years • 10 yearsBase benefit formula • .016 x FAP x service
In the past, formula increases have been passed along to MSEP retirees.• .017 x FAP x service Future formula increases, if any, will not be passed along to retirees.
• .017 x FAP x service Future formula increases, if any, will not be passed along to retirees.
Temporary benefit formula • Not available • .008 x FAP x service Available to those who retire under the “Rule of 80.”
• .008 x FAP x service Available to those who retire under the “Rule of 90.”
Benefit payment options • Life income annuity• Unreduced joint & 50% survivor• Joint & 100% survivor• Life income with 60 guaranteed payments• Life income with 120 guaranteed payments
• Life income annuity• Joint & 50% survivor• Joint & 100% survivor• Life income with 120 guaranteed payments• Life income with 180 guaranteed payments
• Life income annuity• Joint & 50% survivor• Joint & 100% survivor• Life income with 120 guaranteed payments• Life income with 180 guaranteed payments
Cost-of-living adjustment (COLA) • If hired before August 28, 1997, will receive 4-5% each year until reaching the 65% cap. After COLA cap, the rate is based on 80% of the percentage increase in the CPI (0-5%).
• If hired on or after August 28, 1997, annual COLA will be based on 80% of the percentage increase in the CPI (0-5%).
• Based on 80% of the percentage increase in the CPI (0-5%). • Based on 80% of the percentage increase in the CPI (0-5%).
Normal retirement eligibility • Age 65 and active with 4 years of service• Age 65 with 5 years of service• Age 60 with 15 years of service• “Rule of 80”- at least age 48 with age and service
equaling 80 or more• Age 50 if first became eligible prior to August 28, 2003
• Age 62 with 5 years of service• “Rule of 80” - at least age 48 with age and service equaling 80
or more• Age 50 if first became eligible prior to August 28, 2003
• Age 67 with 10 years of service• “Rule of 90” - at least age 55 with age and service equaling 90
or moreTerminated-vested members not eligible for “Rule of 90.”
Early retirement eligibility • Age 55 with 10 years of serviceBase benefit will be reduced 1/2 of 1% (.005) for each month member’s age is younger than normal retirement.
• Age 57 with 5 years of serviceBase benefit will be reduced 1/2 of 1% (.005) for each month member’s age is younger than normal retirement.
• Age 62 with 10 years of service; base benefit will be reduced 1/2 of 1% (.005) for each month member’s age is younger than normal retirement.Terminated-vested members are not eligible.
Death before retirement • Non duty-related death (vested members) – Survivor benefit to eligible spouse calculated using the joint
& 100% survivor option or 80% of the member’s life income annuity paid to eligible children.
• Duty-related death (no minimum service requirement). – Survivor benefit to eligible spouse or children no less than 50%
of average compensation.
• Survivor benefit to eligible spouse calculated using the joint & 100% survivor option or 80% of the member’s life income annuity paid to eligible children.
• Survivor benefit to eligible spouse or children no less than 50% of average compensation (no service requirement).
• Survivor benefit to eligible spouse calculated using the joint & 100% survivor option or 80% of the member’s life income annuity paid to eligible children.
• Survivor benefit to eligible spouse or children no less than 50% of average compensation (no service requirement).
In-service COLA • COLA given for service beyond age 65. COLA provisions are determined by employment date.
• Not available • Not available
BackDROP • Must work at least two years beyond normal retirement eligibility to be eligible for BackDROP.
• Must work at least two years beyond normal retirement eligibility to be eligible for BackDROP..
• Not available
Service purchases • May purchase up to 4 years of active-duty military service or qualifying public sector service at subsidized rate. May also purchase public sector service at full actuarial cost.
• May purchase up to 4 years of active-duty military service or qualifying public sector service at subsidized rate. May also purchase public sector service at full actuarial cost.
• May purchase qualifying public sector service at full actuarial cost.
Service transfers • May transfer state service to other positions covered by MOSERS under 104.800.
• May transfer service under 104.1090 from other systems with written agreements to transfer required funds.
• Not available
Member contributions • None • None • 4% of pay

Missouri State Employees’ Retirement System • Fiscal Year 2012 125
ACTUARIAL SECTION
Comparison of Plans for General State EmployeesJune 30, 2012 G
MSEP • MSEP 2000 • MSEP 2011 ENERAL STATE EMPLOYEES
Benefit Provisions MSEP MSEP 2000 MSEP 2011Membership eligibility • Members who work in a permanent position normally requiring at
least 1,040 hours of work a year.• Members hired for the first time on or after July 1, 2000, in a
permanent position normally requiring at least 1,040 hours of work a year.
• Members who left state employment prior to becoming vested and returned to work on or after July 1, 2000, in a permanent position normally requiring at least 1,040 hours of work a year.
• Members hired for the first time on or after January 1, 2011, in a permanent position normally requiring at least 1,040 hours of work a year.
Vesting • 5 years • 5 years • 10 yearsBase benefit formula • .016 x FAP x service
In the past, formula increases have been passed along to MSEP retirees.• .017 x FAP x service Future formula increases, if any, will not be passed along to retirees.
• .017 x FAP x service Future formula increases, if any, will not be passed along to retirees.
Temporary benefit formula • Not available • .008 x FAP x service Available to those who retire under the “Rule of 80.”
• .008 x FAP x service Available to those who retire under the “Rule of 90.”
Benefit payment options • Life income annuity• Unreduced joint & 50% survivor• Joint & 100% survivor• Life income with 60 guaranteed payments• Life income with 120 guaranteed payments
• Life income annuity• Joint & 50% survivor• Joint & 100% survivor• Life income with 120 guaranteed payments• Life income with 180 guaranteed payments
• Life income annuity• Joint & 50% survivor• Joint & 100% survivor• Life income with 120 guaranteed payments• Life income with 180 guaranteed payments
Cost-of-living adjustment (COLA) • If hired before August 28, 1997, will receive 4-5% each year until reaching the 65% cap. After COLA cap, the rate is based on 80% of the percentage increase in the CPI (0-5%).
• If hired on or after August 28, 1997, annual COLA will be based on 80% of the percentage increase in the CPI (0-5%).
• Based on 80% of the percentage increase in the CPI (0-5%). • Based on 80% of the percentage increase in the CPI (0-5%).
Normal retirement eligibility • Age 65 and active with 4 years of service• Age 65 with 5 years of service• Age 60 with 15 years of service• “Rule of 80”- at least age 48 with age and service
equaling 80 or more• Age 50 if first became eligible prior to August 28, 2003
• Age 62 with 5 years of service• “Rule of 80” - at least age 48 with age and service equaling 80
or more• Age 50 if first became eligible prior to August 28, 2003
• Age 67 with 10 years of service• “Rule of 90” - at least age 55 with age and service equaling 90
or moreTerminated-vested members not eligible for “Rule of 90.”
Early retirement eligibility • Age 55 with 10 years of serviceBase benefit will be reduced 1/2 of 1% (.005) for each month member’s age is younger than normal retirement.
• Age 57 with 5 years of serviceBase benefit will be reduced 1/2 of 1% (.005) for each month member’s age is younger than normal retirement.
• Age 62 with 10 years of service; base benefit will be reduced 1/2 of 1% (.005) for each month member’s age is younger than normal retirement.Terminated-vested members are not eligible.
Death before retirement • Non duty-related death (vested members) – Survivor benefit to eligible spouse calculated using the joint
& 100% survivor option or 80% of the member’s life income annuity paid to eligible children.
• Duty-related death (no minimum service requirement). – Survivor benefit to eligible spouse or children no less than 50%
of average compensation.
• Survivor benefit to eligible spouse calculated using the joint & 100% survivor option or 80% of the member’s life income annuity paid to eligible children.
• Survivor benefit to eligible spouse or children no less than 50% of average compensation (no service requirement).
• Survivor benefit to eligible spouse calculated using the joint & 100% survivor option or 80% of the member’s life income annuity paid to eligible children.
• Survivor benefit to eligible spouse or children no less than 50% of average compensation (no service requirement).
In-service COLA • COLA given for service beyond age 65. COLA provisions are determined by employment date.
• Not available • Not available
BackDROP • Must work at least two years beyond normal retirement eligibility to be eligible for BackDROP.
• Must work at least two years beyond normal retirement eligibility to be eligible for BackDROP..
• Not available
Service purchases • May purchase up to 4 years of active-duty military service or qualifying public sector service at subsidized rate. May also purchase public sector service at full actuarial cost.
• May purchase up to 4 years of active-duty military service or qualifying public sector service at subsidized rate. May also purchase public sector service at full actuarial cost.
• May purchase qualifying public sector service at full actuarial cost.
Service transfers • May transfer state service to other positions covered by MOSERS under 104.800.
• May transfer service under 104.1090 from other systems with written agreements to transfer required funds.
• Not available
Member contributions • None • None • 4% of pay

Missouri State Employees’ Retirement System • Fiscal Year 2012126
ACTUARIAL SECTION
Comparison of Plans for LegislatorsJune 30, 2012 G
MSEP • MSEP 2000 • MSEP 2011Benefit Provisions MSEP MSEP 2000 MSEP 2011Membership eligibility • Elected to the General Assembly • Elected to the General Assembly on or after July 1, 2000 • Elected to the General Assembly on or after January 1, 2011Vesting • 3 full-biennial assemblies (6 years) • 3 full-biennial assemblies (6 years) • 3 full-biennial assemblies (6 years)Base benefit formula • Biennial assemblies x $150
In the past, formula increases have been passed along to MSEP retirees.• (Active legislator’s pay ÷ 24) x service
Capped at 100% of pay; future formula increases, if any, will not be passed along to retirees.
• (Active legislator’s pay ÷ 24) x serviceCapped at 100% of pay; future formula increases, if any, will not be passed along to retirees.
Temporary benefit formula • Not available • Not available • Not availableBenefit payment options • Life income annuity
• Unreduced joint & 50% survivor• Joint & 100% survivor• Life income with 60 guaranteed payments• Life income with 120 guaranteed payments
• Life income annuity• Joint & 50% survivor• Joint & 100% survivor• Life income with 120 guaranteed payments• Life income with 180 guaranteed payments
• Life income annuity• Joint & 50% survivor• Joint & 100% survivor• Life income with 120 guaranteed payments• Life income with 180 guaranteed payments
Cost-of-living adjustment (COLA) • If sworn in before August 28, 1997, will receive 4-5% each year until reaching 65% cap. After COLA cap, the rate is based on 80% of the percentage increase in the CPI (0-5%).
• If sworn in on or after August 28, 1997, COLA will be based on 80% of the percentage increase in the CPI (0-5%).
• Benefit adjustment based on increase in pay for an active member of the general assembly.
• Benefit adjustment based on increase in pay for an active member of the general assembly.
Normal retirement eligibility • Age 55 with 3 full-biennial assemblies or• “Rule of 80” - at least age 48 with age and service equaling 80
or more
• Age 55 with 3 full-biennial assemblies or• “Rule of 80” - at least age 50 with age and service
equaling 80 or more
• Age 62 with 3 full-biennial assemblies or• “Rule of 90” - at least age 55 with age and service equaling 90
or moreEarly retirement eligibility • Not available • Not available • Not available
Death before retirement • Non duty-related death (vested members) – Survivor benefit to eligible spouse calculated using the joint & 100% survivor option or 80% of the member’s life income annuity paid to eligible children.
• Duty-related death (no minimum service requirement) – Survivor benefit to eligible spouse or children no less than 50% of the rate of compensation.
• Non duty-related death (vested members) – Survivor benefit to eligible spouse calculated using the joint & 100% survivor option or 80% of the member’s life income annuity paid to eligible children.
• Duty-related death (no minimum service requirement) – Survivor benefit to eligible spouse or children no less than 50% of rate of compensation.
In-service COLA • COLA given for service beyond age 65. COLA provisions are determined by employment date.
• Not available • Not available
BackDROP • Not available • Not available • Not availableService purchases • May purchase up to 4 years of active-duty military service or
qualifying public sector service at subsidized rate. May also purchase public sector service at full actuarial cost.
• May purchase up to 4 years of active-duty military service or qualifying public sector service at subsidized rate. May also purchase public sector service at full actuarial cost.
• May purchase qualifying public sector service at full actuarial cost.
Service transfers • May transfer state service to other positions covered by MOSERS under 104.800.
• May transfer service under 104.1090 from other systems with written agreements to transfer required funds.
• Not available
Member contributions • None • None • 4% of pay
SUMMARY OF PLAN PROVISIONS

Missouri State Employees’ Retirement System • Fiscal Year 2012 127
ACTUARIAL SECTION
Comparison of Plans for LegislatorsJune 30, 2012 G
MSEP • MSEP 2000 • MSEP 2011Benefit Provisions MSEP MSEP 2000 MSEP 2011Membership eligibility • Elected to the General Assembly • Elected to the General Assembly on or after July 1, 2000 • Elected to the General Assembly on or after January 1, 2011Vesting • 3 full-biennial assemblies (6 years) • 3 full-biennial assemblies (6 years) • 3 full-biennial assemblies (6 years)Base benefit formula • Biennial assemblies x $150
In the past, formula increases have been passed along to MSEP retirees.• (Active legislator’s pay ÷ 24) x service
Capped at 100% of pay; future formula increases, if any, will not be passed along to retirees.
• (Active legislator’s pay ÷ 24) x serviceCapped at 100% of pay; future formula increases, if any, will not be passed along to retirees.
Temporary benefit formula • Not available • Not available • Not availableBenefit payment options • Life income annuity
• Unreduced joint & 50% survivor• Joint & 100% survivor• Life income with 60 guaranteed payments• Life income with 120 guaranteed payments
• Life income annuity• Joint & 50% survivor• Joint & 100% survivor• Life income with 120 guaranteed payments• Life income with 180 guaranteed payments
• Life income annuity• Joint & 50% survivor• Joint & 100% survivor• Life income with 120 guaranteed payments• Life income with 180 guaranteed payments
Cost-of-living adjustment (COLA) • If sworn in before August 28, 1997, will receive 4-5% each year until reaching 65% cap. After COLA cap, the rate is based on 80% of the percentage increase in the CPI (0-5%).
• If sworn in on or after August 28, 1997, COLA will be based on 80% of the percentage increase in the CPI (0-5%).
• Benefit adjustment based on increase in pay for an active member of the general assembly.
• Benefit adjustment based on increase in pay for an active member of the general assembly.
Normal retirement eligibility • Age 55 with 3 full-biennial assemblies or• “Rule of 80” - at least age 48 with age and service equaling 80
or more
• Age 55 with 3 full-biennial assemblies or• “Rule of 80” - at least age 50 with age and service
equaling 80 or more
• Age 62 with 3 full-biennial assemblies or• “Rule of 90” - at least age 55 with age and service equaling 90
or moreEarly retirement eligibility • Not available • Not available • Not available
Death before retirement • Non duty-related death (vested members) – Survivor benefit to eligible spouse calculated using the joint & 100% survivor option or 80% of the member’s life income annuity paid to eligible children.
• Duty-related death (no minimum service requirement) – Survivor benefit to eligible spouse or children no less than 50% of the rate of compensation.
• Non duty-related death (vested members) – Survivor benefit to eligible spouse calculated using the joint & 100% survivor option or 80% of the member’s life income annuity paid to eligible children.
• Duty-related death (no minimum service requirement) – Survivor benefit to eligible spouse or children no less than 50% of rate of compensation.
• Non duty-related death (vested members) – Survivor benefit to eligible spouse calculated using the joint & 100% survivor option or 80% of the member’s life income annuity paid to eligible children.
• Duty-related death (no minimum service requirement) – Survivor benefit to eligible spouse or children no less than 50% of rate of compensation.
In-service COLA • COLA given for service beyond age 65. COLA provisions are determined by employment date.
• Not available • Not available
BackDROP • Not available • Not available • Not availableService purchases • May purchase up to 4 years of active-duty military service or
qualifying public sector service at subsidized rate. May also purchase public sector service at full actuarial cost.
• May purchase up to 4 years of active-duty military service or qualifying public sector service at subsidized rate. May also purchase public sector service at full actuarial cost.
• May purchase qualifying public sector service at full actuarial cost.
Service transfers • May transfer state service to other positions covered by MOSERS under 104.800.
• May transfer service under 104.1090 from other systems with written agreements to transfer required funds.
• Not available
Member contributions • None • None • 4% of pay
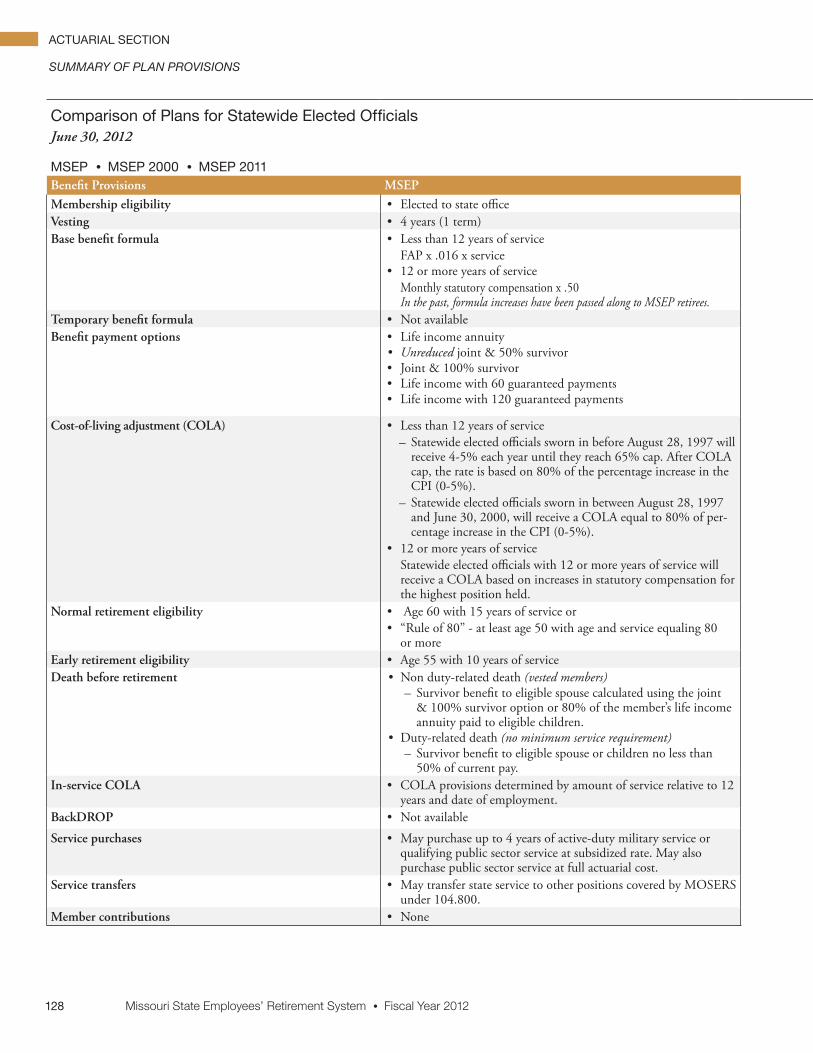
Missouri State Employees’ Retirement System • Fiscal Year 2012128
ACTUARIAL SECTION
Comparison of Plans for Statewide Elected OfficialsJune 30, 2012 G
MSEP • MSEP 2000 • MSEP 2011 STATEWIDE ELECTED OFFICIALS
Benefit Provisions MSEP MSEP 2000 MSEP 2011Membership eligibility • Elected to state office • Elected to state office on or after July 1, 2000 • Elected to state office on or after January 1, 2011Vesting • 4 years (1 term) • 4 years (1 term) • 4 years (1 term)Base benefit formula • Less than 12 years of service
FAP x .016 x service• 12 or more years of service
Monthly statutory compensation x .50 In the past, formula increases have been passed along to MSEP retirees.
• (Active elected official’s pay ÷ 24) x serviceCapped at 12 years of service or 50% of pay; future formula increases, if any, will not be passed along to retirees.
• (Active elected official’s pay ÷ 24) x serviceCapped at 12 years of service or 50% of pay; future formula increases, if any, will not be passed along to retirees.
Temporary benefit formula • Not available • Not available • Not availableBenefit payment options • Life income annuity
• Unreduced joint & 50% survivor• Joint & 100% survivor• Life income with 60 guaranteed payments• Life income with 120 guaranteed payments
• Life income annuity• Joint & 50% survivor• Joint & 100% survivor• Life income with 120 guaranteed payments• Life income with 180 guaranteed payments
• Life income annuity• Joint & 50% survivor• Joint & 100% survivor• Life income with 120 guaranteed payments• Life income with 180 guaranteed payments
Cost-of-living adjustment (COLA) • Less than 12 years of service – Statewide elected officials sworn in before August 28, 1997 will receive 4-5% each year until they reach 65% cap. After COLA cap, the rate is based on 80% of the percentage increase in the CPI (0-5%).
– Statewide elected officials sworn in between August 28, 1997 and June 30, 2000, will receive a COLA equal to 80% of per-centage increase in the CPI (0-5%).
• 12 or more years of service Statewide elected officials with 12 or more years of service will receive a COLA based on increases in statutory compensation for the highest position held.
• Benefit adjustment based on increase in pay for an active statewide elected official.
• Benefit adjustment based on increase in pay for an active statewide elected official.
Normal retirement eligibility • Age 60 with 15 years of service or • “Rule of 80” - at least age 50 with age and service equaling 80
or more
• Age 55 with 4 years of service or “Rule of 80” - at least age 50 with age and service equaling 80 or more
• Age 62 with 4 years of service or “Rule of 90” - at least age 55 with age and service equaling 90 or more
Early retirement eligibility • Age 55 with 10 years of service • Not available • Not availableDeath before retirement • Non duty-related death (vested members)
– Survivor benefit to eligible spouse calculated using the joint & 100% survivor option or 80% of the member’s life income annuity paid to eligible children.
• Duty-related death (no minimum service requirement) – Survivor benefit to eligible spouse or children no less than 50% of current pay.
• Non duty-related death (vested members) – Survivor benefit to eligible spouse calculated using the joint & 100% survivor option or 80% of the member’s life income annuity paid to eligible children.
• Duty-related death (no minimum service requirement) – Survivor benefit to eligible spouse or children no less than 50% of current pay.
In-service COLA • COLA provisions determined by amount of service relative to 12 years and date of employment.
• Not available • Not available
BackDROP • Not available • Not available • Not available
Service purchases • May purchase up to 4 years of active-duty military service or qualifying public sector service at subsidized rate. May also purchase public sector service at full actuarial cost.
• May purchase up to 4 years of active-duty military service or qualifying public sector service at subsidized rate; may also purchase public sector service at full actuarial cost.
• May purchase qualifying public sector service at full actuarial cost.
Service transfers • May transfer state service to other positions covered by MOSERS under 104.800.
• May transfer service under 104.1090 from other systems with written agreements to transfer required funds.
• Not available
Member contributions • None • None • 4% of pay
SUMMARY OF PLAN PROVISIONS

Missouri State Employees’ Retirement System • Fiscal Year 2012 129
ACTUARIAL SECTION
Comparison of Plans for Statewide Elected OfficialsJune 30, 2012 G
MSEP • MSEP 2000 • MSEP 2011 STATEWIDE ELECTED OFFICIALS
Benefit Provisions MSEP MSEP 2000 MSEP 2011Membership eligibility • Elected to state office • Elected to state office on or after July 1, 2000 • Elected to state office on or after January 1, 2011Vesting • 4 years (1 term) • 4 years (1 term) • 4 years (1 term)Base benefit formula • Less than 12 years of service
FAP x .016 x service• 12 or more years of service
Monthly statutory compensation x .50 In the past, formula increases have been passed along to MSEP retirees.
• (Active elected official’s pay ÷ 24) x serviceCapped at 12 years of service or 50% of pay; future formula increases, if any, will not be passed along to retirees.
• (Active elected official’s pay ÷ 24) x serviceCapped at 12 years of service or 50% of pay; future formula increases, if any, will not be passed along to retirees.
Temporary benefit formula • Not available • Not available • Not availableBenefit payment options • Life income annuity
• Unreduced joint & 50% survivor• Joint & 100% survivor• Life income with 60 guaranteed payments• Life income with 120 guaranteed payments
• Life income annuity• Joint & 50% survivor• Joint & 100% survivor• Life income with 120 guaranteed payments• Life income with 180 guaranteed payments
• Life income annuity• Joint & 50% survivor• Joint & 100% survivor• Life income with 120 guaranteed payments• Life income with 180 guaranteed payments
Cost-of-living adjustment (COLA) • Less than 12 years of service – Statewide elected officials sworn in before August 28, 1997 will receive 4-5% each year until they reach 65% cap. After COLA cap, the rate is based on 80% of the percentage increase in the CPI (0-5%).
– Statewide elected officials sworn in between August 28, 1997 and June 30, 2000, will receive a COLA equal to 80% of per-centage increase in the CPI (0-5%).
• 12 or more years of service Statewide elected officials with 12 or more years of service will receive a COLA based on increases in statutory compensation for the highest position held.
• Benefit adjustment based on increase in pay for an active statewide elected official.
• Benefit adjustment based on increase in pay for an active statewide elected official.
Normal retirement eligibility • Age 60 with 15 years of service or • “Rule of 80” - at least age 50 with age and service equaling 80
or more
• Age 55 with 4 years of service or “Rule of 80” - at least age 50 with age and service equaling 80 or more
• Age 62 with 4 years of service or “Rule of 90” - at least age 55 with age and service equaling 90 or more
Early retirement eligibility • Age 55 with 10 years of service • Not available • Not availableDeath before retirement • Non duty-related death (vested members)
– Survivor benefit to eligible spouse calculated using the joint & 100% survivor option or 80% of the member’s life income annuity paid to eligible children.
• Duty-related death (no minimum service requirement) – Survivor benefit to eligible spouse or children no less than 50% of current pay.
• Non duty-related death (vested members) – Survivor benefit to eligible spouse calculated using the joint & 100% survivor option or 80% of the member’s life income annuity paid to eligible children.
• Duty-related death (no minimum service requirement) – Survivor benefit to eligible spouse or children no less than 50% of current pay.
• Non duty-related death (vested members) – Survivor benefit to eligible spouse calculated using the joint & 100% survivor option or 80% of the member’s life income annuity paid to eligible children.
• Duty-related death (no minimum service requirement) – Survivor benefit to eligible spouse or children no less than 50% of current pay.
In-service COLA • COLA provisions determined by amount of service relative to 12 years and date of employment.
• Not available • Not available
BackDROP • Not available • Not available • Not available
Service purchases • May purchase up to 4 years of active-duty military service or qualifying public sector service at subsidized rate. May also purchase public sector service at full actuarial cost.
• May purchase up to 4 years of active-duty military service or qualifying public sector service at subsidized rate; may also purchase public sector service at full actuarial cost.
• May purchase qualifying public sector service at full actuarial cost.
Service transfers • May transfer state service to other positions covered by MOSERS under 104.800.
• May transfer service under 104.1090 from other systems with written agreements to transfer required funds.
• Not available
Member contributions • None • None • 4% of pay
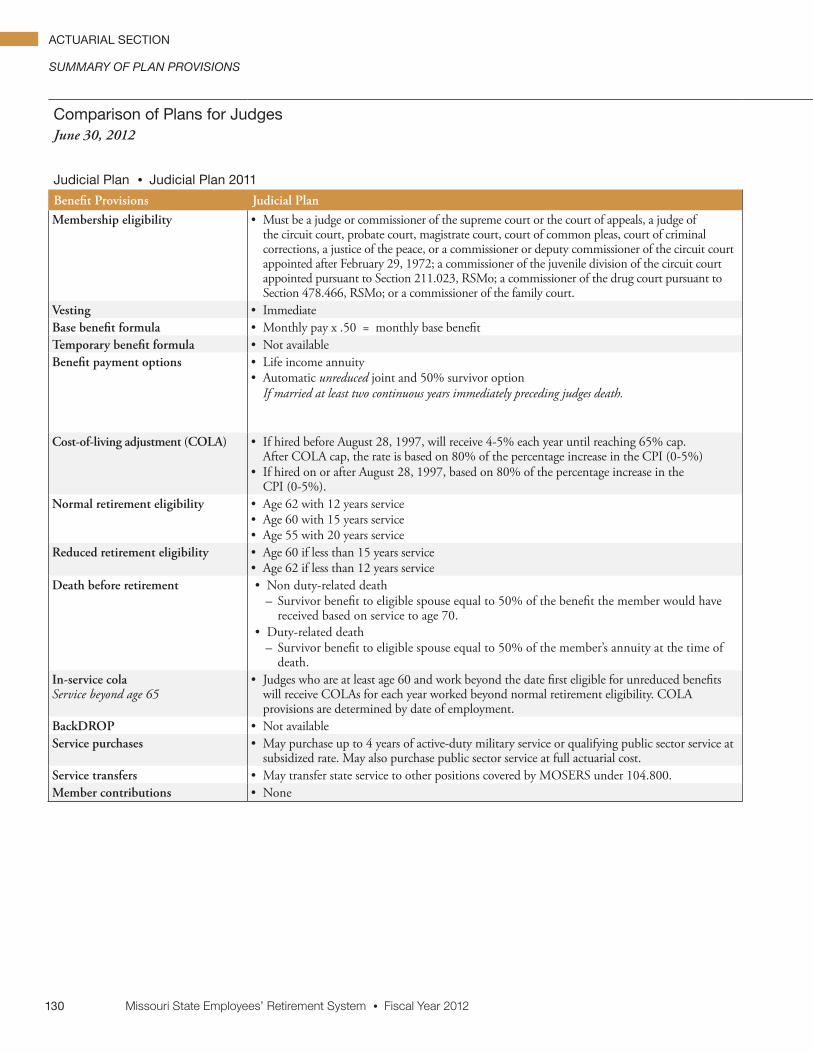
Missouri State Employees’ Retirement System • Fiscal Year 2012130
ACTUARIAL SECTION
Comparison of Plans for JudgesJune 30, 2012 G
Judicial Plan • Judicial Plan 2011JUDGES
Benefit Provisions Judicial Plan Judicial Plan 2011Membership eligibility • Must be a judge or commissioner of the supreme court or the court of appeals, a judge of
the circuit court, probate court, magistrate court, court of common pleas, court of criminal corrections, a justice of the peace, or a commissioner or deputy commissioner of the circuit court appointed after February 29, 1972; a commissioner of the juvenile division of the circuit court appointed pursuant to Section 211.023, RSMo; a commissioner of the drug court pursuant to Section 478.466, RSMo; or a commissioner of the family court.
• Must be a judge or commissioner of the supreme court or the court of appeals, a judge of the circuit court, probate court, magistrate court, court of common pleas, court of criminal corrections, a justice of the peace, or a commissioner or deputy commissioner of the circuit court; a commissioner of the juvenile division of the circuit court appointed pursuant to Section 211.023, RSMo; a commissioner of the drug court pursuant to Section 478.466, RSMo; or a commissioner of the family court appointed or elected a judge for the first time on or after January 1, 2011.
Vesting • Immediate • ImmediateBase benefit formula • Monthly pay x .50 = monthly base benefit • Monthly pay x .50 = monthly base benefitTemporary benefit formula • Not available • Not availableBenefit payment options • Life income annuity
• Automatic unreduced joint and 50% survivor optionIf married at least two continuous years immediately preceding judges death.
• Life income annuity• Joint & 50% survivor• Joint & 100% survivor• Life income with 120 guaranteed payments• Life income with 180 guaranteed payments
Cost-of-living adjustment (COLA) • If hired before August 28, 1997, will receive 4-5% each year until reaching 65% cap. After COLA cap, the rate is based on 80% of the percentage increase in the CPI (0-5%)
• If hired on or after August 28, 1997, based on 80% of the percentage increase in the CPI (0-5%).
• Based on 80% of the percentage increase in the CPI (0-5%)
Normal retirement eligibility • Age 62 with 12 years service• Age 60 with 15 years service• Age 55 with 20 years service
• Age 67 with 12 years service• Age 62 with 20 years service
Reduced retirement eligibility • Age 60 if less than 15 years service• Age 62 if less than 12 years service
• Age 67 if less than 12 years service• Age 62 if less than 20 years service
Death before retirement • Non duty-related death – Survivor benefit to eligible spouse equal to 50% of the benefit the member would have received based on service to age 70.
• Duty-related death – Survivor benefit to eligible spouse equal to 50% of the member’s annuity at the time of death.
• Non duty-related death – Survivor benefit to eligible spouse equal to 50% of the benefit the member would have received based on service to age 70.
• Duty-related death – Survivor benefit to eligible spouse equal to 50% of the member’s annuity at the time of death.
In-service cola Service beyond age 65
• Judges who are at least age 60 and work beyond the date first eligible for unreduced benefits will receive COLAs for each year worked beyond normal retirement eligibility. COLA provisions are determined by date of employment.
• Not available
BackDROP • Not available • Not availableService purchases • May purchase up to 4 years of active-duty military service or qualifying public sector service at
subsidized rate. May also purchase public sector service at full actuarial cost.• May purchase qualifying public sector service at full actuarial cost.
Service transfers • May transfer state service to other positions covered by MOSERS under 104.800. • May transfer state service to other positions covered by MOSERS under 104.800.Member contributions • None • 4% of pay
SUMMARY OF PLAN PROVISIONS

Missouri State Employees’ Retirement System • Fiscal Year 2012 131
ACTUARIAL SECTION
Comparison of Plans for JudgesJune 30, 2012 G
Judicial Plan • Judicial Plan 2011JUDGES
Benefit Provisions Judicial Plan Judicial Plan 2011Membership eligibility • Must be a judge or commissioner of the supreme court or the court of appeals, a judge of
the circuit court, probate court, magistrate court, court of common pleas, court of criminal corrections, a justice of the peace, or a commissioner or deputy commissioner of the circuit court appointed after February 29, 1972; a commissioner of the juvenile division of the circuit court appointed pursuant to Section 211.023, RSMo; a commissioner of the drug court pursuant to Section 478.466, RSMo; or a commissioner of the family court.
• Must be a judge or commissioner of the supreme court or the court of appeals, a judge of the circuit court, probate court, magistrate court, court of common pleas, court of criminal corrections, a justice of the peace, or a commissioner or deputy commissioner of the circuit court; a commissioner of the juvenile division of the circuit court appointed pursuant to Section 211.023, RSMo; a commissioner of the drug court pursuant to Section 478.466, RSMo; or a commissioner of the family court appointed or elected a judge for the first time on or after January 1, 2011.
Vesting • Immediate • ImmediateBase benefit formula • Monthly pay x .50 = monthly base benefit • Monthly pay x .50 = monthly base benefitTemporary benefit formula • Not available • Not availableBenefit payment options • Life income annuity
• Automatic unreduced joint and 50% survivor optionIf married at least two continuous years immediately preceding judges death.
• Life income annuity• Joint & 50% survivor• Joint & 100% survivor• Life income with 120 guaranteed payments• Life income with 180 guaranteed payments
Cost-of-living adjustment (COLA) • If hired before August 28, 1997, will receive 4-5% each year until reaching 65% cap. After COLA cap, the rate is based on 80% of the percentage increase in the CPI (0-5%)
• If hired on or after August 28, 1997, based on 80% of the percentage increase in the CPI (0-5%).
• Based on 80% of the percentage increase in the CPI (0-5%)
Normal retirement eligibility • Age 62 with 12 years service• Age 60 with 15 years service• Age 55 with 20 years service
• Age 67 with 12 years service• Age 62 with 20 years service
Reduced retirement eligibility • Age 60 if less than 15 years service• Age 62 if less than 12 years service
• Age 67 if less than 12 years service• Age 62 if less than 20 years service
Death before retirement • Non duty-related death – Survivor benefit to eligible spouse equal to 50% of the benefit the member would have received based on service to age 70.
• Duty-related death – Survivor benefit to eligible spouse equal to 50% of the member’s annuity at the time of death.
• Non duty-related death – Survivor benefit to eligible spouse equal to 50% of the benefit the member would have received based on service to age 70.
• Duty-related death – Survivor benefit to eligible spouse equal to 50% of the member’s annuity at the time of death.
In-service cola Service beyond age 65
• Judges who are at least age 60 and work beyond the date first eligible for unreduced benefits will receive COLAs for each year worked beyond normal retirement eligibility. COLA provisions are determined by date of employment.
• Not available
BackDROP • Not available • Not availableService purchases • May purchase up to 4 years of active-duty military service or qualifying public sector service at
subsidized rate. May also purchase public sector service at full actuarial cost.• May purchase qualifying public sector service at full actuarial cost.
Service transfers • May transfer state service to other positions covered by MOSERS under 104.800. • May transfer state service to other positions covered by MOSERS under 104.800.Member contributions • None • 4% of pay

Missouri State Employees’ Retirement System • Fiscal Year 2012132
ACTUARIAL SECTION
SUMMARY OF PLAN PROVISIONS
Comparison of Plans for Uniformed Members of the Water PatrolJune 30, 2012 G
MSEP • MSEP 2000JUDGES
Benefit Provisions MSEP MSEP 2000Membership eligibility • Members who work in a permanent position
normally requiring at least 1,040 hours of work a year.
• Members hired for the first time on or after July 1, 2000, in a permanent position normally requiring at least 1,040 hours of work a year.
• Members who left state employment prior to becoming vested and returned to work on or after July 1, 2000, in a permanent position normally requiring at least 1,040 hours of work a year.
Vesting • 5 years of service • 5 years of serviceBase benefit formula • 1.6% x FAP x service increased by 33.3% • 1.7% x FAP x service
Temporary benefit formula • Not available • 0.8% x FAP x service (must retire under “Rule of 80”)
Benefit payment options • Life income annuity • Unreduced joint and 50% survivor • Joint & 100% survivor• 120 Or 180 guaranteed payments
• Life income annuity• Joint & 50% survivor• Joint & 100% survivor• 120 Or 180 guaranteed payments
Cost-of-living adjustment (COLA) • If hired before August 28, 1997, will receive 4-5% each year until reaching 65% cap. After COLA cap, the rate is based on 80% of the percentage increase in the CPI (0-5%).
• If hired on or after August 28, 1997, based on 80% of the percentage increase in the CPI (0-5%).
• Based on 80% of the percentage increase in the CPI (0-5%).
Normal retirement eligibility • Age 55 and active with 4 years of service• Age 55 with 5 years of service• “Rule of 80”- minimum age 48
• Age 62 with 5 years of service• “Rule of 80” - minimum age 48
Early retirement eligibility • Not available • Age 57 with 10 years of serviceDeath before retirement • Non duty-related death (vested members)
– Survivor benefit to eligible spouse calculated using the joint & 100% survivor option or 80% of the member’s life income annuity paid to eligible children.
• Duty-related death (no minimum service requirement)
– Survivor benefit to eligible spouse or children no less than 50% of current pay.
• Non duty-related death (vested members) – Survivor benefit to eligible spouse calculated using the joint & 100% survivor option or 80% of the member’s life income annuity paid to eligible children.
• Duty-related death (no minimum service requirement)
– Survivor benefit to eligible spouse or children no less than 50% of current pay.
In-service COLA • COLA given for service beyond age 65. COLA provisions are determined by employment date.
• Not available
BackDROP • Not available • Not availableService purchases • May purchase up to 4 years of active-duty
military service or qualifying public sector service at subsidized rate. May also purchase public sector service at full actuarial cost.
• May purchase qualifying public sector service at full actuarial cost.
Service transfers • May transfer state service to other positions covered by MOSERS under 104.800.
• Not available
Member contributions • None • None
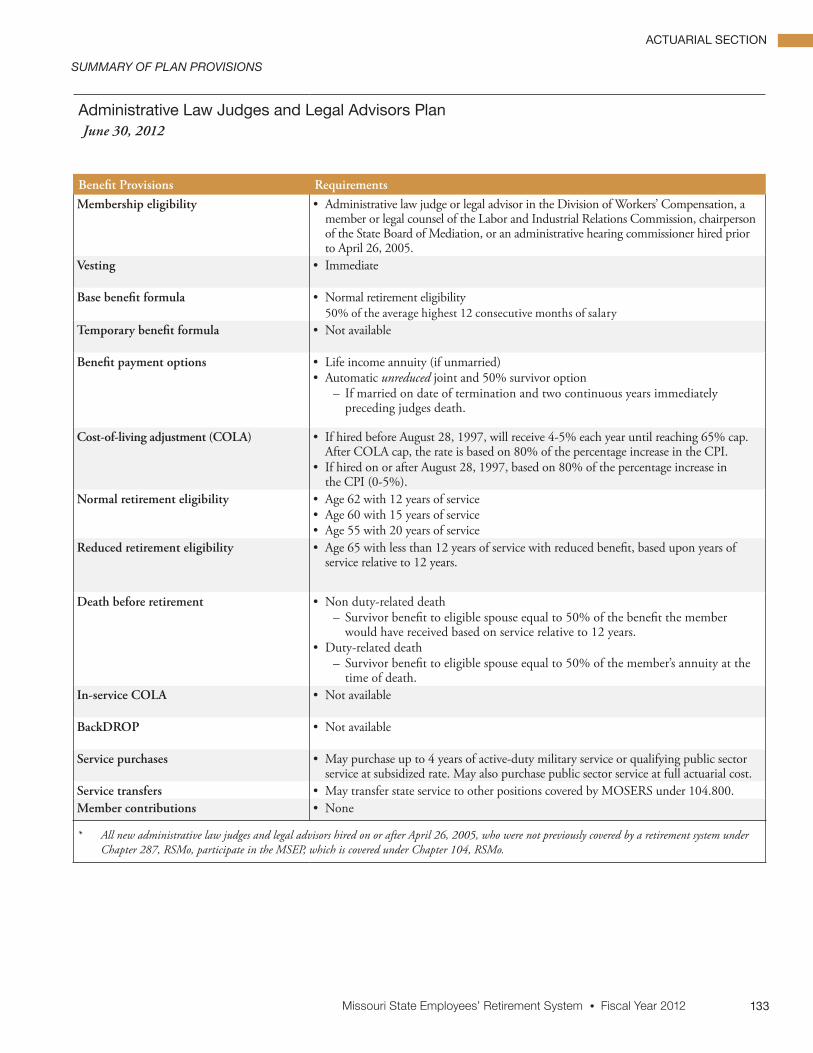
Missouri State Employees’ Retirement System • Fiscal Year 2012 133
ACTUARIAL SECTION
Administrative Law Judges and Legal Advisors Plan June 30, 2012 GDGES
Benefit Provisions RequirementsMembership eligibility • Administrative law judge or legal advisor in the Division of Workers’ Compensation, a
member or legal counsel of the Labor and Industrial Relations Commission, chairperson of the State Board of Mediation, or an administrative hearing commissioner hired prior to April 26, 2005.
Vesting • Immediate
Base benefit formula • Normal retirement eligibility50% of the average highest 12 consecutive months of salary
Temporary benefit formula • Not available
Benefit payment options • Life income annuity (if unmarried)• Automatic unreduced joint and 50% survivor option
– If married on date of termination and two continuous years immediately preceding judges death.
Cost-of-living adjustment (COLA) • If hired before August 28, 1997, will receive 4-5% each year until reaching 65% cap. After COLA cap, the rate is based on 80% of the percentage increase in the CPI.
• If hired on or after August 28, 1997, based on 80% of the percentage increase in the CPI (0-5%).
Normal retirement eligibility • Age 62 with 12 years of service• Age 60 with 15 years of service• Age 55 with 20 years of service
Reduced retirement eligibility • Age 65 with less than 12 years of service with reduced benefit, based upon years of service relative to 12 years.
Death before retirement • Non duty-related death – Survivor benefit to eligible spouse equal to 50% of the benefit the member would have received based on service relative to 12 years.
• Duty-related death – Survivor benefit to eligible spouse equal to 50% of the member’s annuity at the time of death.
In-service COLA • Not available
BackDROP • Not available
Service purchases • May purchase up to 4 years of active-duty military service or qualifying public sector service at subsidized rate. May also purchase public sector service at full actuarial cost.
Service transfers • May transfer state service to other positions covered by MOSERS under 104.800.Member contributions • None
* All new administrative law judges and legal advisors hired on or after April 26, 2005, who were not previously covered by a retirement system under Chapter 287, RSMo, participate in the MSEP, which is covered under Chapter 104, RSMo.
SUMMARY OF PLAN PROVISIONS

Missouri State Employees’ Retirement System • Fiscal Year 2012134
ACTUARIAL SECTION
Life Insurance PlansJune 30, 2012 G
MOSERS administers basic and optional term life insurance plans for eligible state employees and retirees.
Active Members*
Plan Provision Requirement
• Basic life insurance - An amount equal to one times annual salary (with a minimum of $15,000) while actively employed.
• Actively employed in an eligible state position resulting in membership in MOSERS.
• Duty-related death benefit - Duty-related death benefit equivalent to two times the annual salary the member was earning at the time of death in addition to the basic life insurance amount of one times annual salary.
• Actively employed in an eligible state position resulting in membership in MOSERS.
• Optional life insurance - Additional life insurance may be purchased in a flat amount in multiples of $10,000 not to exceed the maximum (lesser of six times annual salary or $800,000). Spouse coverage may be purchased in multiples of $10,000 up to a maximum of $100,000; however, the amount of spouse coverage cannot exceed the amount of optional life insurance coverage the member has purchased. Coverage for children is available in a flat amount of $10,000 per child.
• Actively employed in an eligible state position resulting in membership in MOSERS.
* Terminating employees may convert coverage up to the amount they had as an active employee at individual rates.
Retired Members
Plan Provision Requirement
• Basic life insurance at retirement - $5,000 basic life insurance during retirement.
• Must retire directly from active employment.
• Optional life insurance at retirement (MSEP) - An employee may retain up to the lesser of $60,000 or the amount of optional life insurance coverage held at the time of retirement at the group rate and may convert any remaining basic and optional life insurance at individual rates.
• Must retire directly from active employment.
• Optional life insurance at retirement (MSEP 2000) - Under “Rule of 80”, an employee may retain the current amount of coverage prior to retirement until age 62 at which time coverage is reduced to $60,000, and may convert any remaining basic and optional life insurance at individual rates. Coverage for spouse ends at member’s retirement and may be converted at individual rates.
• Must retire directly from active employment.
• Optional life insurance at retirement (MSEP 2011) - Under “Rule of 90”, an employee may retain the current amount of coverage prior to retirement until age 62 at which time coverage is reduced to $60,000, and may convert any remaining basic and optional life insurance at individual rates. Coverage for spouse ends at member’s retirement and may be converted at individual rates.
• Must retire directly from active employment.
SUMMARY OF PLAN PROVISIONS

Missouri State Employees’ Retirement System • Fiscal Year 2012 135
ACTUARIAL SECTION
Long-Term Disability (LTD) PlansJune 30, 2012
MOSERS administers the LTD Plan for eligible state employees who become disabled during active employment.G
Active Members
Classification Requirement
• General state employees, legislators, and elected state officials - Members of MOSERS in a position normally requiring 1,040 hours of work a year are covered under the LTD plan, unless they work for a state agency which has its own LTD plan.
• Eligible participants receive 60% of their compensation minus primary social security, workers’ compensation, and employer provided income. Benefits commence after 90 days of disability or after sick leave expires, whichever occurs last. LTD benefits cease upon the earliest of (i) when disability ends, (ii) when the member is first eligible for normal retirement benefits or is receiving early retirement benefits, (iii) when the member returns to work, or (iv) upon a member’s death.
• Water patrol • Uniformed members who are eligible for statutory occupational disability receive benefits equal to 50% of compensation with no offset for social security at the time of disability. For nonoccupational disabilities, eligible participants receive the same benefit as general employees.
• Judges • In addition to the disability benefits provided to general employees, judges also receive benefits under the state constitution. Participants receive 50% of salary until the current term expires.
SUMMARY OF PLAN PROVISIONS
Changes in Plan ProvisionsOn July 10, 2012, Senate Bill 625 was signed into law and contained provisions relating to the transfer of service and assets between MOSERS and the Missouri Department of Transportation and Highway Patrol Employees’ Retirement System (MPERS) and also changed the interest rate used in calculating employee refunds.
Transfers of Service and Assets between MOSERS and MPERSPrior to August 28, 2011, service transfers between MOSERS and MPERS involved only transfers of service credit – that is, the receiving system took on the liabilities for any transferred service without receiving the accompanying assets. After August 28, 2011, transfers of service credit also included the transfer of assets. The provision is necessary cleanup that will address service credit transferred before and after August 28, 2011. Specifically, this provision will exclude the asset transfer requirement for any service transfer that occurred prior to August 28, 2011, when the asset transfer requirement in section 104.603 became effective. If any assets were transferred after August 28, 2011, for service that was transferred prior to the date, the system that received the asset transfer would be required to return the assets transferred to the sending system. These changes are necessary because prior to August 28, 2011, no assets were required to be transferred. The intention of the provision enacted on August 28, 2011, was that it would apply only to prospective transfers after that date.
Interest Rate Used in Calculating Employee RefundsThe legislation also includes provisions that change the interest rate used in calculating employee refunds from 4% to the investment rate that is published by the U.S. Department of Treasury, or any successor agency, for 52-week treasury bills for the relevant auction that is nearest to the to the preceding July first, or a successor treasury bill investment rate approved by the board if the 52-week treasury bill is no longer issued. In addition, the legislation clarified that such interest credits would cease upon retirement or death. Lastly, the bill clarified that refunds due a beneficiary upon the member death would include interest credited thereon.

Missouri State Employees’ Retirement System • Fiscal Year 2012136
ACTUARIAL SECTION
Actuarial Present ValuesJune 30, 2012
MSEP
Actuarial Present Value June 30, 2012 forActuarial
Present Value
Portion Covered by Future
Normal Cost Contributions
Actuarial Accrued
LiabilitiesActive membersService retirement benefits based on services rendered before and likely to be rendered after valuation date $4,723,202,252 $657,426,610 $ 4,065,775,642 Disability benefits likely to be paid to present active members who become totally and permanently disabled 139,757,505 86,609,170 53,148,335 Survivor benefits likely to be paid to widows and children of present active members who die before retiring 93,690,228 21,815,025 71,875,203 Separation benefits likely to be paid to present active members 422,810,397 199,410,351 223,400,046
Refunds likely to be paid to present active members 13,763,945 13,057,523 706,422 Active member totals $5,393,224,327 $978,318,679 4,414,905,648
Members on leave of absence & LTDService retirement benefits based on service rendered before the valuation date 130,424,203Terminated-vested membersService retirement benefits based on service rendered before the valuation date 498,910,658Retired lives 5,748,985,566 BackDROP installment payments incurred, but not yet paid 425,502 Total actuarial accrued liability 10,793,651,577 Actuarial value of assets 7,897,167,203 Unfunded actuarial accrued liability $ 2,896,484,374 Funded Ratio 73.2%
Judicial Plan
Actuarial Present Value June 30, 2012 forActuarial
Present Value
Portion Covered by Future
Normal Cost Contributions
Actuarial Accrued
LiabilitiesActive membersService retirement benefits based on services rendered before and likely to be rendered after valuation date $192,213,158 $51,794,147 $140,419,011
Disability benefits likely to be paid to present active members who become totally and permanently disabled 805,789 849,646 (43,857)
Survivor benefits likely to be paid to widows and children of present active members who die before retiring 4,175,393 2,199,954 1,975,439
Refunds likely to be paid to present active members 26,741 25,946 795 Active member totals $197,221,081 $54,869,693 142,351,388
Retired lives 258,642,149 Terminated-vested members 12,339,001 Total actuarial accrued liability 413,332,538 Actuarial value of assets 102,266,706 Unfunded actuarial accrued liability $311,065,832 Funded Ratio 24.7%

Statistical SectionSummary ......................................................................................................................................... 137Changes in Net Assets - Last Ten Fiscal Years ................................................................................... 138Deductions from Net Assets for Benefits and Refunds by Type - Last Ten Fiscal Years ..................... 140Valuation Assets vs. Pension Liabilities - Last Ten Fiscal Years - Pension Trust Funds ....................... 142Contribution Rates as a Percent of Payroll - Last Ten Fiscal Years .................................................... 146Membership in Retirement Plans - Last Ten Fiscal Years .................................................................. 147Benefit Recipients by Type of Retirement and Option Selected ....................................................... 148Distribution of Benefit Recipients by Location ................................................................................ 150Benefits Payable June 30, 2012 - Tabulated by Option and Type of Benefit ..................................... 151Average Monthly Benefit Amounts - Ten Years Ended June 30, 2012 .............................................. 152Retirees and Beneficiaries - Tabulated by Fiscal Year of Retirement .................................................. 159Total Benefits Payable June 30, 2012 - Tabulated by Attained Ages of Benefit Recipients ................ 160

Missouri State Employees’ Retirement System • Fiscal Year 2012 137
STATISTICAL SECTION
Plan MembershipMembership in the pension trusts administered by MOSERS increased by 1,984. Active members decreased by 329, retired members and their beneficiaries increased by 1,995, and terminated-vested members increased by 318. Membership data for the last ten years ended June 30, 2012, can be found on page 147. Page 150 depicts the location of benefit recipients, showing that the majority remain in the state of Missouri after retirement.
Net Assets vs. LiabilitiesThe charts on pages 142-145 graphically represent the funding progress of the pension plans for the ten years ended June 30, 2012. The area charts in the middle of the pages show the portion of the pension liabilities that are unfunded compared to the portion covered by assets in the trust funds. The charts on the bottom of the pages illustrate the funded ratio of the plans for the ten years ended June 30, 2012.
The existence of the unfunded actuarial accrued liabilities is not necessarily an indication of financial problems, but the fluctuations are important and must be monitored and controlled.
The remainder of this section contains various statistical and historical data considered useful in evaluating the condition of the plans.
All nonaccounting data is taken from MOSERS’ internal sources except for that information which is derived from the actuarial valuations (pages 142-147, 151, and 160-161). Member data may differ between some schedules since the valuations are performed using data as of May 31 each year.
SUMMARY

Missouri State Employees’ Retirement System • Fiscal Year 2012138
STATISTICAL SECTION
Changes in Net AssetsLast Ten Fiscal Years
2003 2004 2005 2006 2007 2008 2009 2010 2011 2012MSEPAdditionsEmployer contributions $156,576,150 $ 164,691,836 $194,524,059 $227,233,195 $ 239,488,751 $ 249,770,156 $ 252,105,008 $ 251,226,187 $ 263,418,048 $ 263,373,924 Employee contributions 0 0 0 0 0 0 0 0 599,761 4,955,399 Member service purchases 3,690,820 3,426,367 4,122,001 3,072,315 3,460,923 3,085,133 3,235,999 3,576,954 2,814,551 2,869,085 Service transfers in 53,119 166,510 29,397 161,613 172,936 38,069 28,075 10,009 142,248 2,675,339 Investment income (net of expenses) 332,901,027 873,793,645 727,341,314 728,526,971 1,283,573,438 110,627,355 (1,508,376,715) 859,898,512 1,395,677,299 158,102,123 Other 437,574 469,959 1,231,658 501,512 542,266 572,274 619,060 639,901 659,474 448,463 Total additions to plan net assets 493,658,690 1,042,548,317 927,248,429 959,495,606 1,527,238,314 364,092,987 (1,252,388,573) 1,115,351,563 1,663,311,381 432,424,333 DeductionsBenefits 319,607,447 367,248,099 367,431,297 400,169,563 447,240,771 479,853,891 511,466,555 543,284,289 597,424,954 611,522,451 Refunds 4,019 8,585 0 1,341 0 0 0 3,106 0 123,709 Service transfers out 2,191,487 529,177 199,201 133,866 51,980 251,443 0 462,970 17,745,828 588,180 Administrative expenses 5,954,365 5,694,082 6,228,609 6,486,597 6,689,710 6,950,878 7,088,483 7,064,544 7,054,581 7,017,057 Total deductions from plan net assets 327,757,318 373,479,943 373,859,107 406,791,367 453,982,461 487,056,212 518,555,038 550,814,909 622,225,363 619,251,397 Transfer from ALJLAP plan 0 0 18,157,148 0 0 0 0 0 0 0 Change in net assets $165,901,372 $ 669,068,374 $571,546,470 $552,704,239 $1,073,255,853 $(122,963,225) $(1,770,943,611) $ 564,536,654 $1,041,086,018 $(186,827,064)
ALJLAPAdditionsEmployer contributions $ 951,023 $ 945,950 $ 1,124,924 $ 0 $ 0 $ 0 $ 0 $ 0 $ 0 $ 0 Investment income (net of expenses) 862,381 2,344,262 2,057,375 0 0 0 0 0 0 0 Other 1,134 1,261 3,484 0 0 0 0 0 0 0 Total additions to plan net assets 1,814,538 3,291,473 3,185,783 0 0 0 0 0 0 0 DeductionsBenefits 969,918 1,003,355 749,197 0 0 0 0 0 0 0 Administrative expenses 15,425 15,276 17,618 0 0 0 0 0 0 0 Total deductions from plan net assets 985,343 1,018,631 766,815 0 0 0 0 0 0 0 Transfer to MSEP plan 0 0 (18,157,148) 0 0 0 0 0 0 0 Change in net assets $ 829,195 $ 2,272,842 $(15,738,180) $ 0 $ 0 $ 0 $ 0 $ 0 $ 0 $ 0
Judicial PlanAdditionsEmployer contributions $ 20,802,140 $ 20,636,314 $ 21,852,985 $ 22,401,569 $ 23,745,467 $ 26,215,309 $ 27,725,882 $ 27,029,198 $ 27,702,682 $ 26,324,526 Employee contributions 0 0 0 0 0 0 0 0 59,958 149,859 Investment income (net of expenses) 1,932,815 5,800,076 5,409,107 5,933,531 11,356,312 1,043,940 (15,847,382) 9,909,718 17,460,050 2,061,916 Other 2,541 3,119 9,160 4,085 4,798 5,506 6,504 7,374 8,250 5,849 Total additions to plan net assets 22,737,496 26,439,509 27,271,252 28,339,185 35,106,577 27,264,755 11,885,004 36,946,290 45,230,940 28,542,150 DeductionsBenefits 16,870,011 17,658,269 18,396,397 19,091,587 20,595,504 22,058,085 23,232,088 24,230,545 25,488,531 26,821,412 Administrative expenses 34,571 37,796 46,321 52,830 59,187 66,880 74,473 81,414 88,253 91,514 Total deductions from plan net assets 16,904,582 17,696,065 18,442,718 19,144,417 20,654,691 22,124,965 23,306,561 24,311,959 25,576,784 26,912,926 Change in net assets $ 5,832,914 $ 8,743,444 $ 8,828,534 $ 9,194,768 $ 14,451,886 $ 5,139,790 $ (11,421,557) $ 12,634,331 $ 19,654,156 $ 1,629,224
Internal Service FundOperating revenuesPremium receipts $ 25,223,043 $ 25,771,703 $ 27,305,305 $ 26,415,236 $ 27,101,931 $ 27,957,666 $ 28,990,057 $ 29,098,799 $ 28,829,638 $ 28,578,326 Deferred compensation receipts 0 0 0 0 0 60,393,973 75,661,047 69,143,267 54,221,226 17,500,476 Miscellaneous income 436,494 436,489 436,489 436,501 436,502 536,493 1,027,380 1,039,369 981,404 608,187 Total operating revenues 25,659,537 26,208,192 27,741,794 26,851,737 27,538,433 88,888,132 105,678,484 99,281,435 84,032,268 46,686,989 Operating expensesPremium disbursements 25,169,883 25,736,083 27,271,948 26,379,919 27,063,815 27,927,265 28,968,981 29,077,825 28,804,638 28,556,036 Deferred compensation disbursements 0 0 0 0 0 60,371,802 75,683,218 69,143,267 54,221,226 17,500,476 Premium refunds 53,160 35,620 33,357 35,317 38,116 30,401 21,076 20,974 24,999 22,291 Administrative expenses 421,507 474,040 466,531 487,699 527,040 708,100 819,581 797,020 826,809 778,529 Total operating expenses 25,644,550 26,245,743 27,771,836 26,902,935 27,628,971 89,037,568 105,492,856 99,039,086 83,877,672 46,857,332 Non-operating revenuesInvestment income 31,179 24,353 49,326 85,124 117,729 77,396 20,755 9,816 11,071 11,068 Change in net assets $ 46,166 $ (13,198) $ 19,284 $ 33,926 $ 27,191 $ (72,040) $ 206,383 $ 252,165 $ 165,667 $ (159,275)

Missouri State Employees’ Retirement System • Fiscal Year 2012 139
STATISTICAL SECTION
Changes in Net AssetsLast Ten Fiscal Years
2003 2004 2005 2006 2007 2008 2009 2010 2011 2012MSEPAdditionsEmployer contributions $156,576,150 $ 164,691,836 $194,524,059 $227,233,195 $ 239,488,751 $ 249,770,156 $ 252,105,008 $ 251,226,187 $ 263,418,048 $ 263,373,924 Employee contributions 0 0 0 0 0 0 0 0 599,761 4,955,399 Member service purchases 3,690,820 3,426,367 4,122,001 3,072,315 3,460,923 3,085,133 3,235,999 3,576,954 2,814,551 2,869,085 Service transfers in 53,119 166,510 29,397 161,613 172,936 38,069 28,075 10,009 142,248 2,675,339 Investment income (net of expenses) 332,901,027 873,793,645 727,341,314 728,526,971 1,283,573,438 110,627,355 (1,508,376,715) 859,898,512 1,395,677,299 158,102,123 Other 437,574 469,959 1,231,658 501,512 542,266 572,274 619,060 639,901 659,474 448,463 Total additions to plan net assets 493,658,690 1,042,548,317 927,248,429 959,495,606 1,527,238,314 364,092,987 (1,252,388,573) 1,115,351,563 1,663,311,381 432,424,333 DeductionsBenefits 319,607,447 367,248,099 367,431,297 400,169,563 447,240,771 479,853,891 511,466,555 543,284,289 597,424,954 611,522,451 Refunds 4,019 8,585 0 1,341 0 0 0 3,106 0 123,709 Service transfers out 2,191,487 529,177 199,201 133,866 51,980 251,443 0 462,970 17,745,828 588,180 Administrative expenses 5,954,365 5,694,082 6,228,609 6,486,597 6,689,710 6,950,878 7,088,483 7,064,544 7,054,581 7,017,057 Total deductions from plan net assets 327,757,318 373,479,943 373,859,107 406,791,367 453,982,461 487,056,212 518,555,038 550,814,909 622,225,363 619,251,397 Transfer from ALJLAP plan 0 0 18,157,148 0 0 0 0 0 0 0 Change in net assets $165,901,372 $ 669,068,374 $571,546,470 $552,704,239 $1,073,255,853 $(122,963,225) $(1,770,943,611) $ 564,536,654 $1,041,086,018 $(186,827,064)
ALJLAPAdditionsEmployer contributions $ 951,023 $ 945,950 $ 1,124,924 $ 0 $ 0 $ 0 $ 0 $ 0 $ 0 $ 0 Investment income (net of expenses) 862,381 2,344,262 2,057,375 0 0 0 0 0 0 0 Other 1,134 1,261 3,484 0 0 0 0 0 0 0 Total additions to plan net assets 1,814,538 3,291,473 3,185,783 0 0 0 0 0 0 0 DeductionsBenefits 969,918 1,003,355 749,197 0 0 0 0 0 0 0 Administrative expenses 15,425 15,276 17,618 0 0 0 0 0 0 0 Total deductions from plan net assets 985,343 1,018,631 766,815 0 0 0 0 0 0 0 Transfer to MSEP plan 0 0 (18,157,148) 0 0 0 0 0 0 0 Change in net assets $ 829,195 $ 2,272,842 $(15,738,180) $ 0 $ 0 $ 0 $ 0 $ 0 $ 0 $ 0
Judicial PlanAdditionsEmployer contributions $ 20,802,140 $ 20,636,314 $ 21,852,985 $ 22,401,569 $ 23,745,467 $ 26,215,309 $ 27,725,882 $ 27,029,198 $ 27,702,682 $ 26,324,526 Employee contributions 0 0 0 0 0 0 0 0 59,958 149,859 Investment income (net of expenses) 1,932,815 5,800,076 5,409,107 5,933,531 11,356,312 1,043,940 (15,847,382) 9,909,718 17,460,050 2,061,916 Other 2,541 3,119 9,160 4,085 4,798 5,506 6,504 7,374 8,250 5,849 Total additions to plan net assets 22,737,496 26,439,509 27,271,252 28,339,185 35,106,577 27,264,755 11,885,004 36,946,290 45,230,940 28,542,150 DeductionsBenefits 16,870,011 17,658,269 18,396,397 19,091,587 20,595,504 22,058,085 23,232,088 24,230,545 25,488,531 26,821,412 Administrative expenses 34,571 37,796 46,321 52,830 59,187 66,880 74,473 81,414 88,253 91,514 Total deductions from plan net assets 16,904,582 17,696,065 18,442,718 19,144,417 20,654,691 22,124,965 23,306,561 24,311,959 25,576,784 26,912,926 Change in net assets $ 5,832,914 $ 8,743,444 $ 8,828,534 $ 9,194,768 $ 14,451,886 $ 5,139,790 $ (11,421,557) $ 12,634,331 $ 19,654,156 $ 1,629,224
Internal Service FundOperating revenuesPremium receipts $ 25,223,043 $ 25,771,703 $ 27,305,305 $ 26,415,236 $ 27,101,931 $ 27,957,666 $ 28,990,057 $ 29,098,799 $ 28,829,638 $ 28,578,326 Deferred compensation receipts 0 0 0 0 0 60,393,973 75,661,047 69,143,267 54,221,226 17,500,476 Miscellaneous income 436,494 436,489 436,489 436,501 436,502 536,493 1,027,380 1,039,369 981,404 608,187 Total operating revenues 25,659,537 26,208,192 27,741,794 26,851,737 27,538,433 88,888,132 105,678,484 99,281,435 84,032,268 46,686,989 Operating expensesPremium disbursements 25,169,883 25,736,083 27,271,948 26,379,919 27,063,815 27,927,265 28,968,981 29,077,825 28,804,638 28,556,036 Deferred compensation disbursements 0 0 0 0 0 60,371,802 75,683,218 69,143,267 54,221,226 17,500,476 Premium refunds 53,160 35,620 33,357 35,317 38,116 30,401 21,076 20,974 24,999 22,291 Administrative expenses 421,507 474,040 466,531 487,699 527,040 708,100 819,581 797,020 826,809 778,529 Total operating expenses 25,644,550 26,245,743 27,771,836 26,902,935 27,628,971 89,037,568 105,492,856 99,039,086 83,877,672 46,857,332 Non-operating revenuesInvestment income 31,179 24,353 49,326 85,124 117,729 77,396 20,755 9,816 11,071 11,068 Change in net assets $ 46,166 $ (13,198) $ 19,284 $ 33,926 $ 27,191 $ (72,040) $ 206,383 $ 252,165 $ 165,667 $ (159,275)

Missouri State Employees’ Retirement System • Fiscal Year 2012140
STATISTICAL SECTION
Deductions from Net Assets for Benefits and Refunds by TypeLast Ten Fiscal Years
MSEP
FY03 FY04 FY05 FY06 FY07Type of benefitRetirement $257,883,204 $295,200,937 $314,623,851 $338,449,307 $366,185,990 Survivors 19,689,766 21,930,438 24,251,854 26,944,984 29,340,464 Disability 118,279 102,696 82,246 62,324 42,273 Lump sum 1,384,599 320,267 342,720 459,398 556,568 BackDROP 40,531,599 49,693,761 28,130,626 34,253,550 51,115,476 Total benefits $319,607,447 $367,248,099 $367,431,297 $400,169,563 $447,240,771
Refunds $4,019 $8,585 $ 0 $ 1,341 $ 0
FY08 FY09 FY10 FY11 FY12Type of benefitRetirement $393,328,057 $421,847,017 $448,880,110 $476,841,741 $504,555,055 Survivors 31,894,702 34,615,979 37,718,898 39,968,601 42,963,959 Disability 36,825 33,812 33,403 29,191 29,503 Lump sum 454,643 272,189 409,787 293,147 229,650 BackDROP 54,139,664 54,697,557 56,242,091 80,292,274 63,744,284 Total benefits $479,853,891 $511,466,554 $543,284,289 $597,424,954 $611,522,451
Refunds $ 0 $ 0 $ 3,106 $ 0 $ 123,709
ALJLAP*
FY03 FY04 FY05 FY06 FY07Type of benefitRetirement $808,124 $ 840,963 $616,370 $0 $0 Survivors 161,794 162,392 132,827 0 0 Total benefits $969,918 $1,003,355 $749,197 $0 $0
*ALJLAP Plan transitioned to the MSEP Plan in fiscal year 2005
Judicial Plan
FY03 FY04 FY05 FY06 FY07Type of benefitRetirement $14,256,361 $14,913,678 $15,513,182 $15,989,341 $17,135,426 Survivors 2,613,650 2,744,591 2,883,215 3,070,746 3,433,078 Disability 0 0 0 31,500 27,000 Total benefits $16,870,011 $17,658,269 $18,396,397 $19,091,587 $20,595,504
FY08 FY09 FY10 FY11 FY12Type of benefitRetirement $18,342,676 $19,143,753 $19,784,720 $21,025,904 $22,284,844 Survivors 3,715,409 4,088,335 4,445,825 4,462,627 4,536,569 Disability 0 0 0 0 0 Total benefits $22,058,085 $23,232,088 $24,230,545 $25,488,531 $26,821,412

Missouri State Employees’ Retirement System • Fiscal Year 2012 141
STATISTICAL SECTION
$0
$100
$200
$300
$400
$500
$600
$700
$800
Lump sum and BackDROPSurvivorsRetirement
2012201120102009200820072006200520042003
MSEP
Mill
ions
Disability bene�ts are included, but amounts are too minimal to display visually in graph.
$0
$2
$4
$6
$8
$10
$12
SurvivorsRetirement
2012201120102009200820072006200520042003
ALJLAP
Mill
ions
�e ALJLAP was transitioned to the MSEP during FY05.
$0
$5
$10
$15
$20
$25
$30
Survivors
Retirement
2012201120102009200820072006200520042003
Judicial Plan
Mill
ions
Disability bene�ts are included, but amounts are too minimal to display visually in graph.
Deductions from Net Assets for Benefits and Refunds by TypeLast Ten Fiscal Years

Missouri State Employees’ Retirement System • Fiscal Year 2012142
STATISTICAL SECTION
Valuation Assets (Smoothed Market) vs. Pension LiabilitiesPension Trust Funds - Last Ten Fiscal Years
All Plans Combined
Dollars in BillionsFiscal Year Valuation Assets Unfunded Liabilities Accrued Liabilities Funded Ratios
2003 $6.1075 $0.8417 $ 6.9492 87.9%2004 6.1735 1.3573 7.5308 82.02005 6.4795 1.3908 7.8703 82.32006 6.8883 1.4339 8.3222 82.82007 7.4392 1.3879 8.8271 84.32008 7.9117 1.5714 9.4831 83.42009 7.9574 1.9065 9.8639 80.72010 8.0124 2.2228 10.2352 78.32011 8.1210 2.3960 10.5170 77.22012 7.9994 3.2076 11.2070 71.4
Actuarial Accrued LiabilitiesAll Plans Combined
Billi
ons
$0
$2
$4
$6
$8
$10
$12 Unfunded LiabilitiesValuation Assets
2012201120102009200820072006200520042003
0%
20%
40%
60%
80%
100%
87.982.0 82.3 82.8 84.3 83.4 80.7 78.3 77.2
71.4
Funded Ratios
2012201120102009200820072006200520042003
Valuation Assets as Percents of Pension LiabilitiesAll Plans Combined

Missouri State Employees’ Retirement System • Fiscal Year 2012 143
STATISTICAL SECTION
Valuation Assets (Smoothed Market) vs. Pension LiabilitiesTen Years Ended June 30, 2012
MSEP
Dollars in Billions
Fiscal Year Valuation Assets Unfunded Liabilities Accrued Liabilities Funded Ratios2003 $6.0573 $0.6050 $ 6.6623 90.9%2004 6.1182 1.1118 7.2300 84.62005 6.4353 1.1427 7.5780 84.92006 6.8366 1.1766 8.0132 85.32007 7.3773 1.1231 8.5004 86.82008 7.8385 1.2898 9.1283 85.92009 7.8761 1.6187 9.4948 83.02010 7.9234 1.9298 9.8532 80.42011 8.0225 2.1010 10.1240 79.22012 7.8972 2.8965 10.7937 73.2
Actuarial Accrued LiabilitiesMSEP
Billi
ons
$0
$2
$4
$6
$8
$10
$12 Unfunded LiabilitiesValuation Assets
2012201120102009200820072006200520042003
0%
20%
40%
60%
80%
100%
90.984.6 84.9 85.3 86.8 85.9 83.0 80.4 79.2
73.2
Funded Ratios
2012201120102009200820072006200520042003
Valuation Assets as Percents of Pension LiabilitiesMSEP

Missouri State Employees’ Retirement System • Fiscal Year 2012144
STATISTICAL SECTION
Valuation Assets (Smoothed Market) vs. Pension LiabilitiesPension Trust Funds - Last Ten Fiscal Years
ALJLAP*
Dollars in BillionsFiscal Year Valuation Assets Unfunded Liabilities Accrued Liabilities Funded Ratios
2003 $0.0156 $0.0043 $0.0199 78.4%2004 0.0162 0.0042 0.0204 79.4
* Assets and liabilities transferred to MSEP during fiscal year 2005.
Actuarial Accrued LiabilitiesALJLAP
Billi
ons
$0.000
$0.005
$0.010
$0.015
$0.020
$0.025 Unfunded LiabilitiesValuation Assets
20042003
0%
10%
20%
30%
40%
50%
60%
70%
80%78.4 79.4 Funded Ratios
20042003
Valuation Assets as Percents of Pension LiabilitiesALJLAP

Missouri State Employees’ Retirement System • Fiscal Year 2012 145
STATISTICAL SECTION
Valuation Assets (Smoothed Market) vs. Pension LiabilitiesTen Years Ended June 30, 2012
Judicial Plan
Dollars in Billions
Fiscal Year Valuation Assets Unfunded Liabilities Accrued Liabilities Funded Ratios2003 $0.0346 $0.2324 $0.2670 13.0%2004 0.0391 0.2413 0.2804 13.92005 0.0442 0.2481 0.2923 15.12006 0.0517 0.2573 0.3090 16.72007 0.0619 0.2648 0.3267 19.02008 0.0732 0.2816 0.3548 20.72009 0.0813 0.2878 0.3691 22.02010 0.0890 0.2930 0.3820 23.32011 0.0984 0.2951 0.3935 25.02012 0.1023 0.3111 0.4133 24.7
Actuarial Accrued LiabilitiesJudicial Plan
Billi
ons
$0.0
$0.1
$0.2
$0.3
$0.4
$0.5 Unfunded LiabilitiesValuation Assets
2012201120102009200820072006200520042003
0%
5%
10%
15%
20%
25%
13.013.9
15.116.7
19.020.7
22.023.3
25.0 24.7Funded Ratios
2012201120102009200820072006200520042003
Valuation Assets as Percents of Pension LiabilitiesJudicial Plan
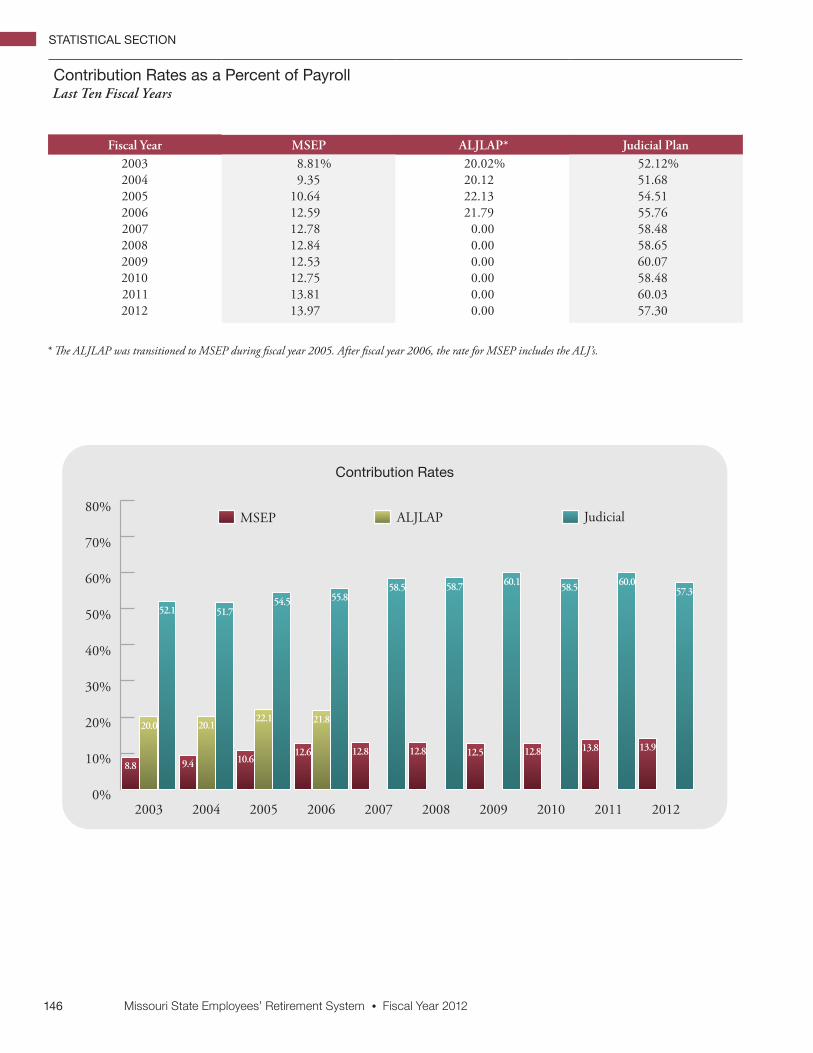
Missouri State Employees’ Retirement System • Fiscal Year 2012146
STATISTICAL SECTION
Contribution Rates as a Percent of PayrollLast Ten Fiscal Years
Fiscal Year MSEP ALJLAP* Judicial Plan2003 8.81% 20.02% 52.12% 2004 9.35 20.12 51.68 2005 10.64 22.13 54.51 2006 12.59 21.79 55.76 2007 12.78 0.00 58.48 2008 12.84 0.00 58.65 2009 12.53 0.00 60.07 2010 12.75 0.00 58.48 2011 13.81 0.00 60.03 2012 13.97 0.00 57.30
* The ALJLAP was transitioned to MSEP during fiscal year 2005. After fiscal year 2006, the rate for MSEP includes the ALJ’s.
Contribution Rates
0%
10%
20%
30%
40%
50%
60%
70%
80%
52.1 51.754.5 55.8
58.5 58.7 60.1 58.5 60.057.3
20.0 20.122.1 21.8
8.8 9.4 10.612.6 12.8 12.8 12.5 12.8 13.8 13.9
2012201120102009200820072006200520042003
ALJLAP JudicialMSEP

Missouri State Employees’ Retirement System • Fiscal Year 2012 147
STATISTICAL SECTION
Membership in Retirement PlansLast Ten Fiscal Years
Fiscal Year Active Retired/Beneficiaries Terminated-Vested Totals2003 58,007 23,292 13,073 94,3722004 56,362 25,179 13,898 95,4392005 56,336 26,177 14,789 97,3022006 54,887 27,450 15,829 98,1662007 54,763 29,129 16,578 100,4702008 54,943 30,572 17,123 102,6382009 55,454 32,100 17,304 104,8582010 53,880 33,716 17,441 105,0372011 52,059 35,801 17,757 105,6172012 51,730 37,796 18,075 107,601
Membership in Retirement Plans
0%
10,000
20,000
30,000
40,000
50,000
60,000
2012201120102009200820072006200520042003
Retired/Bene�ciaries Terminated-VestedActive

Missouri State Employees’ Retirement System • Fiscal Year 2012148
STATISTICAL SECTION
Benefit Recipients by Type of Retirement and Option SelectedJune 30, 2012
MSEP
Type of Retirement Option Selected
Amount of Monthly Benefit
Number of Benefit Recipients A B C D E F G 1 2 3 4 5 6 7 8 9 10
1-250 4,506 1,670 2,042 280 457 2 0 55 0 17 156 138 245 0 916 541 41 2,452 251-500 6,429 3,066 2,267 372 660 6 0 58 7 37 191 112 312 4 1,300 1,058 21 3,387 501-750 4,845 2,985 1,066 280 482 0 0 32 8 34 105 55 223 2 1,051 1,124 5 2,238
751-1000 4,178 3,214 459 170 312 0 0 23 11 21 61 36 272 0 889 985 4 1,899 1001-1250 3,427 2,894 208 105 210 0 0 10 10 17 52 27 305 1 711 714 1 1,589 1251-1500 2,790 2,483 87 78 137 0 0 5 9 9 40 22 348 0 575 463 0 1,324 1501-1750 2,311 2,109 49 44 107 0 0 2 10 7 26 15 316 1 472 346 0 1,118 1751-2000 1,971 1,822 29 40 78 0 0 2 8 2 31 17 303 1 412 231 1 965 Over 2000 7,208 6,782 45 110 270 0 0 1 69 19 75 31 1,001 0 1,960 1,003 0 3,050
Total 37,665 27,025 6,252 1,479 2,713 8 0 188 132 163 737 453 3,325 9 8,286 6,465 73 18,022
Judicial Plan
Type of Retirement Option Selected Amount of
Monthly Benefit Number of
Benefit Recipients A B C D E F G 1 2 3 4 5 6 7 8 9 10 1-250 3 0 2 0 1 0 0 0 3 0 0 0 0 0 0 0 0 0
251-500 10 0 8 0 0 0 0 2 8 0 0 0 0 0 0 0 0 2 501-750 7 0 3 0 3 0 0 1 5 0 0 0 1 0 0 0 0 1
751-1000 9 0 2 1 6 0 0 0 4 0 0 0 2 0 0 0 0 3 1001-1250 6 1 3 1 0 0 0 1 4 0 0 0 0 0 0 0 0 2 1251-1500 4 0 4 0 0 0 0 0 4 0 0 0 0 0 0 0 0 0 1501-1750 8 0 4 2 1 0 0 1 5 0 0 0 0 0 0 0 0 3 1751-2000 8 0 4 1 3 0 0 0 5 0 0 0 1 0 0 0 0 2 Over 2000 441 273 45 29 92 0 0 2 406 0 0 0 27 0 0 0 1 7
Total 496 274 75 34 106 0 0 7 444 0 0 0 31 0 0 0 1 20
Type of Retirement A - Normal retirement B - Early retirement C - Survivor of active D - Survivor of retired E - Disability F - Occupational disability (Water Patrol) G - Ex-spouse
Option Selected 1 - Automatic 50% joint & survivor 2 - 60 guaranteed payments 3 - 120 guaranteed payments 4 - 180 guaranteed payments 5 - 50% joint & survivor 6 - 75% joint & survivor 7 - 100% joint & survivor 8 - Unreduced 50% joint & survivor 9 - Automatic minor survivor 10 - No survivor option (includes pop-ups)

Missouri State Employees’ Retirement System • Fiscal Year 2012 149
STATISTICAL SECTION
Benefit Recipients by Type of Retirement and Option SelectedJune 30, 2012
MSEP
Type of Retirement Option Selected
Amount of Monthly Benefit
Number of Benefit Recipients A B C D E F G 1 2 3 4 5 6 7 8 9 10
1-250 4,506 1,670 2,042 280 457 2 0 55 0 17 156 138 245 0 916 541 41 2,452 251-500 6,429 3,066 2,267 372 660 6 0 58 7 37 191 112 312 4 1,300 1,058 21 3,387 501-750 4,845 2,985 1,066 280 482 0 0 32 8 34 105 55 223 2 1,051 1,124 5 2,238
751-1000 4,178 3,214 459 170 312 0 0 23 11 21 61 36 272 0 889 985 4 1,899 1001-1250 3,427 2,894 208 105 210 0 0 10 10 17 52 27 305 1 711 714 1 1,589 1251-1500 2,790 2,483 87 78 137 0 0 5 9 9 40 22 348 0 575 463 0 1,324 1501-1750 2,311 2,109 49 44 107 0 0 2 10 7 26 15 316 1 472 346 0 1,118 1751-2000 1,971 1,822 29 40 78 0 0 2 8 2 31 17 303 1 412 231 1 965 Over 2000 7,208 6,782 45 110 270 0 0 1 69 19 75 31 1,001 0 1,960 1,003 0 3,050
Total 37,665 27,025 6,252 1,479 2,713 8 0 188 132 163 737 453 3,325 9 8,286 6,465 73 18,022
Judicial Plan
Type of Retirement Option Selected Amount of
Monthly Benefit Number of
Benefit Recipients A B C D E F G 1 2 3 4 5 6 7 8 9 10 1-250 3 0 2 0 1 0 0 0 3 0 0 0 0 0 0 0 0 0
251-500 10 0 8 0 0 0 0 2 8 0 0 0 0 0 0 0 0 2 501-750 7 0 3 0 3 0 0 1 5 0 0 0 1 0 0 0 0 1
751-1000 9 0 2 1 6 0 0 0 4 0 0 0 2 0 0 0 0 3 1001-1250 6 1 3 1 0 0 0 1 4 0 0 0 0 0 0 0 0 2 1251-1500 4 0 4 0 0 0 0 0 4 0 0 0 0 0 0 0 0 0 1501-1750 8 0 4 2 1 0 0 1 5 0 0 0 0 0 0 0 0 3 1751-2000 8 0 4 1 3 0 0 0 5 0 0 0 1 0 0 0 0 2 Over 2000 441 273 45 29 92 0 0 2 406 0 0 0 27 0 0 0 1 7
Total 496 274 75 34 106 0 0 7 444 0 0 0 31 0 0 0 1 20
Type of Retirement A - Normal retirement B - Early retirement C - Survivor of active D - Survivor of retired E - Disability F - Occupational disability (Water Patrol) G - Ex-spouse
Option Selected 1 - Automatic 50% joint & survivor 2 - 60 guaranteed payments 3 - 120 guaranteed payments 4 - 180 guaranteed payments 5 - 50% joint & survivor 6 - 75% joint & survivor 7 - 100% joint & survivor 8 - Unreduced 50% joint & survivor 9 - Automatic minor survivor 10 - No survivor option (includes pop-ups)

Missouri State Employees’ Retirement System • Fiscal Year 2012150
STATISTICAL SECTION
13 Alaska
8 Hawaii
5 Army Post Office
2 Australia
10 Canada
1 Colombia, South America
1 Costa Rica
1 Germany
1 Guam
1 India
2 Ireland
2 Israel
2 Italy
3 Mexico
1 Marshall Islands
1 Nigeria
1 P. R. China
1 Panama
1 Puerto Rico
1 Spain
1 Sri Lanka
1 Sweden
1 Thailand
1 The Netherlands
2 United Arab Emirates
2 United Kingdom
2 Virgin Islands
1 Wales UK
Distribution of Benefit Recipients by LocationJune 30, 2012
Benefit Recipients Outside the Continental United States

Missouri State Employees’ Retirement System • Fiscal Year 2012 151
STATISTICAL SECTION
Benefits Payable June 30, 2012Tabulated by Option and Type of Benefit
MSEP
Type of Benefit Number Annual Benefits Average
Annual Benefits Service retirementLife annuity 5,079 $ 63,429,949 $12,489 50% joint and survivor 5,390 87,717,538 16,274 100% joint and survivor 2,688 51,312,740 19,090 5-year certain and life 125 1,336,221 10,690 10-year certain and life 135 1,294,811 9,591 Survivor beneficiary 2,205 24,639,020 11,174 Total 15,622 229,730,279 14,706
Disability retirement 8 29,712 3,714
Death-in-service 1,393 14,330,683 10,288
Grand totals 17,023 $244,090,674 14,339
MSEP 2000
Type of Benefit Number Annual Benefits Average
Annual Benefits Service retirementLife annuity 12,536 $182,602,844 $14,566 50% joint and survivor 3,033 61,734,134 20,354 100% joint and survivor 3,198 55,370,367 17,314 5-year certain and life 34 512,071 15,061 10-year certain and life 519 5,809,321 11,193 15-year certain and life 387 3,519,945 9,095 Survivor beneficiary 497 4,707,462 9,472 Total 20,204 314,256,144 15,554
Death-in-service 81 264,205 3,262
Grand totals 20,285 $314,520,349 15,505
Judicial Plan
Type of Benefit Number Annual Benefits Average
Annual Benefits Service retirement50% joint and survivor 347 $22,287,941 $64,230 Survivor beneficiary 107 3,614,258 33,778 Total 454 25,902,199 57,053
Death-in-service 34 1,062,356 31,246
Grand totals 488 $26,964,555 55,255

Missouri State Employees’ Retirement System • Fiscal Year 2012152
STATISTICAL SECTION
Average Monthly Benefit AmountsTen Years Ended June 30, 2012
MSEP
Years Credited Service by Category
Members RetiringDuring Fiscal Year <5 5-10 10-15 15-20 20-25 25-30 30+
All Members
2003 Average monthly benefit $ 111 $ 275 $ 509 $ 768 $ 1,065 $ 1,464 $ 1,811 $ 1,067 Average final average salary $ 1,533 $ 2,211 $ 2,417 $ 2,622 $ 2,741 $ 3,073 $ 3,268 $ 2,779 Number of retirees 5 198 234 219 279 428 252 1,615
2004 Average monthly benefit $ 125 $ 283 $ 423 $ 693 $ 1,037 $ 1,450 $ 1,650 $ 1,013 Average final average salary $ 1,837 $ 2,404 $ 2,264 $ 2,581 $ 2,704 $ 3,051 $ 3,033 $ 2,732 Number of retirees 6 295 285 304 377 587 346 2,200
2005 Average monthly benefit $ 281 $ 287 $ 466 $ 685 $ 1,190 $ 1,571 $ 1,955 $ 946 Average final average salary $ 4,085 $ 2,369 $ 2,282 $ 2,585 $ 3,084 $ 3,354 $ 3,488 $ 2,816 Number of retirees 4 300 257 269 258 325 126 1,539
2006 Average monthly benefit $ 426 $ 283 $ 440 $ 691 $ 1,044 $ 1,567 $ 1,870 $ 913 Average final average salary $ 3,520 $ 2,448 $ 2,333 $ 2,662 $ 2,756 $ 3,319 $ 3,473 $ 2,790 Number of retirees 3 337 288 278 282 350 153 1,691
2007 Average monthly benefit $ 150 $ 276 $ 484 $ 689 $ 1,123 $ 1,570 $ 1,841 $ 951 Average final average salary $ 2,613 $ 2,348 $ 2,512 $ 2,644 $ 2,965 $ 3,318 $ 3,396 $ 2,837 Number of retirees 1 415 308 324 334 436 204 2,022
2008 Average monthly benefit $ 0 $ 263 $ 466 $ 721 $ 1,106 $ 1,587 $ 2,043 $ 933 Average final average salary $ 0 $ 2,349 $ 2,437 $ 2,772 $ 2,942 $ 3,364 $ 3,689 $ 2,850 Number of retirees 0 397 380 324 344 370 189 2,004
2009 Average monthly benefit $ 111 $ 291 $ 491 $ 754 $ 1,236 $ 1,640 $ 2,173 $ 980 Average final average salary $ 1,596 $ 2,420 $ 2,468 $ 2,875 $ 3,238 $ 3,469 $ 3,961 $ 2,973 Number of retirees 1 443 374 308 401 377 174 2,078
2010 Average monthly benefit $ 442 $ 285 $ 490 $ 778 $ 1,184 $ 1,608 $ 2,128 $ 943 Average final average salary $ 6,215 $ 2,529 $ 2,550 $ 2,891 $ 3,167 $ 3,460 $ 3,829 $ 2,974 Number of retirees 2 483 435 347 384 333 218 2,202
2011 Average monthly benefit $ 367 $ 335 $ 491 $ 820 $ 1,222 $ 1,653 $ 2,147 $ 1,007 Average final average salary $ 1,442 $ 2,632 $ 2,501 $ 3,068 $ 3,238 $ 3,528 $ 3,892 $ 3,065 Number of retirees 4 593 493 439 489 489 277 2,784
2012 Average monthly benefit $ 126 $ 303 $ 521 $ 818 $ 1,232 $ 1,624 $ 2,271 $ 939 Average final average salary $ 7,854 $ 2,572 $ 2,648 $ 3,050 $ 3,295 $ 3,488 $ 4,109 $ 3,055 Number of retirees 5 592 537 407 473 373 196 2,583
Ten Years Ended June 30, 2012 Average monthly benefit $ 224 $ 292 $ 482 $ 748 $ 1,153 $ 1,567 $ 1,969 $ 969 Average final average salary $ 3,460 $ 2,459 $ 2,466 $ 2,804 $ 3,042 $ 3,327 $ 3,579 $ 2,903 Number of retirees 31 4,053 3,591 3,219 3,621 4,068 2,135 20,718
Note: COLA increases and temporary benefits payable under MSEP 2000 until age 62 are excluded from the above for comparison purposes.

Missouri State Employees’ Retirement System • Fiscal Year 2012 153
STATISTICAL SECTION
Average Monthly Benefit AmountsTen Years Ended June 30, 2012
General Employees in the MSEP
Years Credited Service by Category
Members Retiring During Fiscal Year <5 5-10 10-15 15-20 20-25 25-30 30+
All Members
2003 Average monthly benefit $ 111 $ 248 $ 466 $ 670 $ 1,039 $ 1,460 $ 1,807 $ 1,048 Average final average salary $ 1,533 $ 2,178 $ 2,389 $ 2,538 $ 2,737 $ 3,073 $ 3,270 $ 2,767 Number of retirees 5 190 223 205 274 427 251 1,575
2004 Average monthly benefit $ 125 $ 272 $ 420 $ 680 $ 1,037 $ 1,450 $ 1,650 $ 1,012 Average final average salary $ 1,837 $ 2,392 $ 2,261 $ 2,577 $ 2,704 $ 3,050 $ 3,033 $ 2,730 Number of retirees 6 289 284 301 377 586 346 2,189
2005 Average monthly benefit $ 229 $ 262 $ 412 $ 678 $ 1,142 $ 1,571 $ 1,907 $ 923 Average final average salary $ 4,449 $ 2,343 $ 2,190 $ 2,581 $ 3,038 $ 3,354 $ 3,510 $ 2,792 Number of retirees 3 288 251 267 251 325 122 1,507
2006 Average monthly benefit $ 95 $ 270 $ 429 $ 691 $ 1,044 $ 1,553 $ 1,862 $ 906 Average final average salary $ 1,362 $ 2,415 $ 2,327 $ 2,662 $ 2,756 $ 3,296 $ 3,465 $ 2,774 Number of retirees 2 333 285 278 282 347 152 1,679
2007 Average monthly benefit $ 0 $ 259 $ 479 $ 682 $ 1,123 $ 1,566 $ 1,841 $ 949 Average final average salary $ 0 $ 2,331 $ 2,509 $ 2,642 $ 2,965 $ 3,319 $ 3,396 $ 2,836 Number of retirees 0 404 306 322 334 435 204 2,005
2008 Average monthly benefit $ 0 $ 257 $ 452 $ 711 $ 1,106 $ 1,587 $ 2,043 $ 930 Average final average salary $ 0 $ 2,343 $ 2,425 $ 2,756 $ 2,942 $ 3,364 $ 3,689 $ 2,846 Number of retirees 0 393 375 323 344 370 189 1,994
2009 Average monthly benefit $ 111 $ 265 $ 471 $ 745 $ 1,218 $ 1,638 $ 2,156 $ 969 Average final average salary $ 1,596 $ 2,387 $ 2,444 $ 2,874 $ 3,213 $ 3,467 $ 3,938 $ 2,958 Number of retirees 1 429 370 306 398 376 173 2,053
2010 Average monthly benefit $ 60 $ 282 $ 477 $ 774 $ 1,184 $ 1,603 $ 2,102 $ 936 Average final average salary $ 4,258 $ 2,526 $ 2,534 $ 2,891 $ 3,167 $ 3,461 $ 3,798 $ 2,965 Number of retirees 1 480 432 346 384 332 216 2,191
2011 Average monthly benefit $ 39 $ 302 $ 471 $ 803 $ 1,218 $ 1,644 $ 2,130 $ 996 Average final average salary $ 925 $ 2,614 $ 2,480 $ 3,057 $ 3,238 $ 3,523 $ 3,870 $ 3,057 Number of retirees 3 565 486 435 488 486 275 2,738
2012 Average monthly benefit $ 126 $ 290 $ 502 $ 805 $ 1,232 $ 1,617 $ 2,271 $ 932 Average final average salary $ 7,854 $ 2,557 $ 2,626 $ 3,036 $ 3,295 $ 3,475 $ 4,109 $ 3,045 Number of retirees 5 584 532 404 473 372 196 2,566
Ten Years Ended June 30, 2012 Average monthly benefit $ 119 $ 275 $ 463 $ 733 $ 1,145 $ 1,563 $ 1,958 $ 961 Average final average salary $ 3,179 $ 2,441 $ 2,445 $ 2,793 $ 3,036 $ 3,323 $ 3,572 $ 2,894 Number of retirees 26 3,955 3,544 3,187 3,605 4,056 2,124 20,497
Note: COLA increases and temporary benefits payable under MSEP 2000 until age 62 are excluded from the above for comparison purposes.
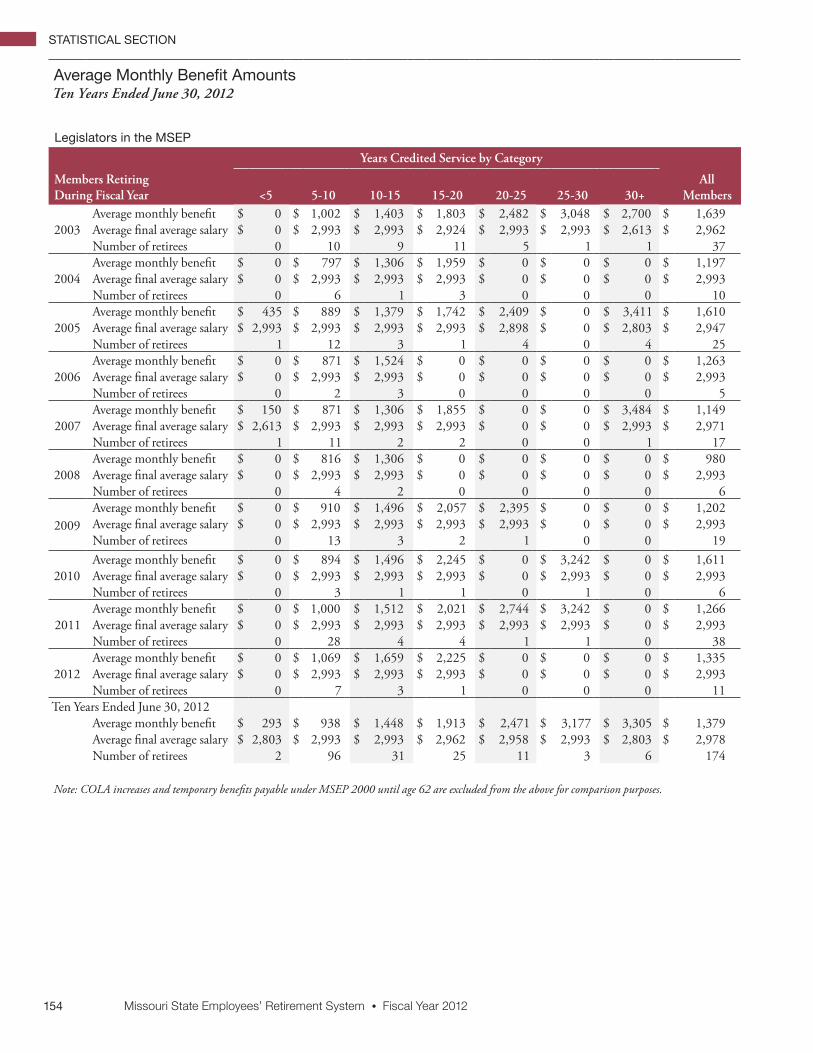
Missouri State Employees’ Retirement System • Fiscal Year 2012154
STATISTICAL SECTION
Average Monthly Benefit AmountsTen Years Ended June 30, 2012
Legislators in the MSEP
Years Credited Service by Category
Members RetiringDuring Fiscal Year <5 5-10 10-15 15-20 20-25 25-30 30+
All Members
2003 Average monthly benefit $ 0 $ 1,002 $ 1,403 $ 1,803 $ 2,482 $ 3,048 $ 2,700 $ 1,639 Average final average salary $ 0 $ 2,993 $ 2,993 $ 2,924 $ 2,993 $ 2,993 $ 2,613 $ 2,962 Number of retirees 0 10 9 11 5 1 1 37
2004 Average monthly benefit $ 0 $ 797 $ 1,306 $ 1,959 $ 0 $ 0 $ 0 $ 1,197 Average final average salary $ 0 $ 2,993 $ 2,993 $ 2,993 $ 0 $ 0 $ 0 $ 2,993 Number of retirees 0 6 1 3 0 0 0 10
2005 Average monthly benefit $ 435 $ 889 $ 1,379 $ 1,742 $ 2,409 $ 0 $ 3,411 $ 1,610 Average final average salary $ 2,993 $ 2,993 $ 2,993 $ 2,993 $ 2,898 $ 0 $ 2,803 $ 2,947 Number of retirees 1 12 3 1 4 0 4 25
2006 Average monthly benefit $ 0 $ 871 $ 1,524 $ 0 $ 0 $ 0 $ 0 $ 1,263 Average final average salary $ 0 $ 2,993 $ 2,993 $ 0 $ 0 $ 0 $ 0 $ 2,993 Number of retirees 0 2 3 0 0 0 0 5
2007 Average monthly benefit $ 150 $ 871 $ 1,306 $ 1,855 $ 0 $ 0 $ 3,484 $ 1,149 Average final average salary $ 2,613 $ 2,993 $ 2,993 $ 2,993 $ 0 $ 0 $ 2,993 $ 2,971 Number of retirees 1 11 2 2 0 0 1 17
2008 Average monthly benefit $ 0 $ 816 $ 1,306 $ 0 $ 0 $ 0 $ 0 $ 980 Average final average salary $ 0 $ 2,993 $ 2,993 $ 0 $ 0 $ 0 $ 0 $ 2,993 Number of retirees 0 4 2 0 0 0 0 6
2009 Average monthly benefit $ 0 $ 910 $ 1,496 $ 2,057 $ 2,395 $ 0 $ 0 $ 1,202 Average final average salary $ 0 $ 2,993 $ 2,993 $ 2,993 $ 2,993 $ 0 $ 0 $ 2,993 Number of retirees 0 13 3 2 1 0 0 19
2010 Average monthly benefit $ 0 $ 894 $ 1,496 $ 2,245 $ 0 $ 3,242 $ 0 $ 1,611 Average final average salary $ 0 $ 2,993 $ 2,993 $ 2,993 $ 0 $ 2,993 $ 0 $ 2,993 Number of retirees 0 3 1 1 0 1 0 6
2011 Average monthly benefit $ 0 $ 1,000 $ 1,512 $ 2,021 $ 2,744 $ 3,242 $ 0 $ 1,266 Average final average salary $ 0 $ 2,993 $ 2,993 $ 2,993 $ 2,993 $ 2,993 $ 0 $ 2,993 Number of retirees 0 28 4 4 1 1 0 38
2012 Average monthly benefit $ 0 $ 1,069 $ 1,659 $ 2,225 $ 0 $ 0 $ 0 $ 1,335 Average final average salary $ 0 $ 2,993 $ 2,993 $ 2,993 $ 0 $ 0 $ 0 $ 2,993 Number of retirees 0 7 3 1 0 0 0 11
Ten Years Ended June 30, 2012 Average monthly benefit $ 293 $ 938 $ 1,448 $ 1,913 $ 2,471 $ 3,177 $ 3,305 $ 1,379 Average final average salary $ 2,803 $ 2,993 $ 2,993 $ 2,962 $ 2,958 $ 2,993 $ 2,803 $ 2,978 Number of retirees 2 96 31 25 11 3 6 174
Note: COLA increases and temporary benefits payable under MSEP 2000 until age 62 are excluded from the above for comparison purposes.

Missouri State Employees’ Retirement System • Fiscal Year 2012 155
STATISTICAL SECTION
Average Monthly Benefit AmountsTen Years Ended June 30, 2012
Elected Officials in the MSEP
Years Credited Service by Category
Members RetiringDuring Fiscal Year <5 5-10 10-15 15-20 20-25 25-30 30+
All Members
2003 Average monthly benefit $ 0 $ 0 $ 0 $ 0 $ 0 $ 0 $ 0 $ 0 Average final average salary $ 0 $ 0 $ 0 $ 0 $ 0 $ 0 $ 0 $ 0 Number of retirees 0 0 0 0 0 0 0 0
2004 Average monthly benefit $ 0 $ 0 $ 0 $ 0 $ 0 $ 0 $ 0 $ 0 Average final average salary $ 0 $ 0 $ 0 $ 0 $ 0 $ 0 $ 0 $ 0 Number of retirees 0 0 0 0 0 0 0 0
2005 Average monthly benefit $ 0 $ 0 $ 4,218 $ 0 $ 0 $ 0 $ 0 $ 4,218 Average final average salary $ 0 $ 0 $ 10,065 $ 0 $ 0 $ 0 $ 0 $ 10,065 Number of retirees 0 0 2 0 0 0 0 2
2006 Average monthly benefit $ 0 $ 2,009 $ 0 $ 0 $ 0 $ 0 $ 0 $ 2,009 Average final average salary $ 0 $ 8,979 $ 0 $ 0 $ 0 $ 0 $ 0 $ 8,979 Number of retirees 0 1 0 0 0 0 0 1
2007 Average monthly benefit $ 0 $ 0 $ 0 $ 0 $ 0 $ 0 $ 0 $ 0 Average final average salary $ 0 $ 0 $ 0 $ 0 $ 0 $ 0 $ 0 $ 0 Number of retirees 0 0 0 0 0 0 0 0
2008 Average monthly benefit $ 0 $ 0 $ 0 $ 0 $ 0 $ 0 $ 0 $ 0 Average final average salary $ 0 $ 0 $ 0 $ 0 $ 0 $ 0 $ 0 $ 0 Number of retirees 0 0 0 0 0 0 0 0
2009 Average monthly benefit $ 0 $ 3,336 $ 4,852 $ 0 $ 0 $ 0 $ 0 $ 4,094 Average final average salary $ 0 $ 8,979 $ 9,703 $ 0 $ 0 $ 0 $ 0 $ 9,341 Number of retirees 0 1 1 0 0 0 0 2
2010 Average monthly benefit $ 0 $ 0 $ 0 $ 0 $ 0 $ 0 $ 0 $ 0 Average final average salary $ 0 $ 0 $ 0 $ 0 $ 0 $ 0 $ 0 $ 0 Number of retirees 0 0 0 0 0 0 0 0
2011 Average monthly benefit $ 0 $ 0 $ 0 $ 0 $ 0 $ 0 $ 0 $ 0 Average final average salary $ 0 $ 0 $ 0 $ 0 $ 0 $ 0 $ 0 $ 0 Number of retirees 0 0 0 0 0 0 0 0
2012 Average monthly benefit $ 0 $ 0 $ 3,781 $ 0 $ 0 $ 0 $ 0 $ 3,781 Average final average salary $ 0 $ 0 $ 8,093 $ 0 $ 0 $ 0 $ 0 $ 8,093 Number of retirees 0 0 2 0 0 0 0 2
Ten Years Ended June 30, 2012 Average monthly benefit $ 0 $ 2,673 $ 4,170 $ 0 $ 0 $ 0 $ 0 $ 3,742 Average final average salary $ 0 $ 8,979 $ 9,204 $ 0 $ 0 $ 0 $ 0 $ 9,140 Number of retirees 0 2 5 0 0 0 0 7
Note: COLA increases are excluded from the above for comparison purposes.

Missouri State Employees’ Retirement System • Fiscal Year 2012156
STATISTICAL SECTION
Average Monthly Benefit AmountsTen Years Ended June 30, 2012
Uniformed Water Patrol in the MSEP
Years Credited Service by Category
Members RetiringDuring Fiscal Year <5 5-10 10-15 15-20 20-25 25-30 30+
All Members
2003 Average monthly benefit $ 0 $ 0 $ 0 $ 0 $ 0 $ 0 $ 0 $ 0 Average final average salary $ 0 $ 0 $ 0 $ 0 $ 0 $ 0 $ 0 $ 0 Number of retirees 0 0 0 0 0 0 0 0
2004 Average monthly benefit $ 0 $ 0 $ 0 $ 0 $ 0 $ 1,743 $ 0 $ 1,743 Average final average salary $ 0 $ 0 $ 0 $ 0 $ 0 $ 3,628 $ 0 $ 3,628 Number of retirees 0 0 0 0 0 1 0 1
2005 Average monthly benefit $ 0 $ 0 $ 0 $ 1,267 $ 0 $ 0 $ 0 $ 1,267 Average final average salary $ 0 $ 0 $ 0 $ 3,254 $ 0 $ 0 $ 0 $ 3,254 Number of retirees 0 0 0 1 0 0 0 1
2006 Average monthly benefit $ 0 $ 0 $ 0 $ 0 $ 0 $ 2,848 $ 3,090 $ 2,969 Average final average salary $ 0 $ 0 $ 0 $ 0 $ 0 $ 4,657 $ 4,710 $ 4,684 Number of retirees 0 0 0 0 0 1 1 2
2007 Average monthly benefit $ 0 $ 0 $ 0 $ 0 $ 0 $ 0 $ 0 $ 0 Average final average salary $ 0 $ 0 $ 0 $ 0 $ 0 $ 0 $ 0 $ 0 Number of retirees 0 0 0 0 0 0 0 0
2008 Average monthly benefit $ 0 $ 0 $ 750 $ 0 $ 0 $ 0 $ 0 $ 750 Average final average salary $ 0 $ 0 $ 2,541 $ 0 $ 0 $ 0 $ 0 $ 2,541 Number of retirees 0 0 1 0 0 0 0 1
2009 Average monthly benefit $ 0 $ 0 $ 0 $ 0 $ 0 $ 2,351 $ 5,113 $ 3,732 Average final average salary $ 0 $ 0 $ 0 $ 0 $ 0 $ 4,173 $ 7,902 $ 6,037 Number of retirees 0 0 0 0 0 1 1 2
2010 Average monthly benefit $ 0 $ 0 $ 0 $ 0 $ 0 $ 0 $ 4,886 $ 4,886 Average final average salary $ 0 $ 0 $ 0 $ 0 $ 0 $ 0 $ 7,184 $ 7,184 Number of retirees 0 0 0 0 0 0 2 2
2011 Average monthly benefit $ 0 $ 0 $ 721 $ 0 $ 0 $ 3,086 $ 4,553 $ 3,200 Average final average salary $ 0 $ 0 $ 2,964 $ 0 $ 0 $ 5,077 $ 6,912 $ 5,388 Number of retirees 0 0 1 0 0 2 2 5
2012 Average monthly benefit $ 0 $ 0 $ 0 $ 959 $ 0 $ 0 $ 0 $ 959 Average final average salary $ 0 $ 0 $ 0 $ 2,794 $ 0 $ 0 $ 0 $ 2,794 Number of retirees 0 0 0 1 0 0 0 1
Ten Years Ended June 30, 2012 Average monthly benefit $ 0 $ 0 $ 735 $ 1,113 $ 0 $ 2,623 $ 4,514 $ 2,926 Average final average salary $ 0 $ 0 $ 2,753 $ 3,024 $ 0 $ 4,522 $ 6,801 $ 4,998 Number of retirees 0 0 2 2 0 5 6 15
Note: COLA increases and temporary benefits payable under MSEP 2000 until age 62 are excluded from the above for comparison purposes.

Missouri State Employees’ Retirement System • Fiscal Year 2012 157
STATISTICAL SECTION
Average Monthly Benefit AmountsTen Years Ended June 30, 2012
Administrative Law Judges and Legal Advisors in the MSEP
Years Credited Service by Category
Members RetiringDuring Fiscal Year <5 5-10 10-15 15-20 20-25 25-30 30+
All Members
2003 Average monthly benefit $ 0 $ 0 $ 0 $ 3,615 $ 0 $ 0 $ 0 $ 3,615 Average final average salary $ 0 $ 0 $ 0 $ 7,231 $ 0 $ 0 $ 0 $ 7,231 Number of retirees 0 0 0 3 0 0 0 3
2004 Average monthly benefit $ 0 $ 0 $ 0 $ 0 $ 0 $ 0 $ 0 $ 0 Average final average salary $ 0 $ 0 $ 0 $ 0 $ 0 $ 0 $ 0 $ 0 Number of retirees 0 0 0 0 0 0 0 0
2005 Average monthly benefit $ 0 $ 0 $ 3,750 $ 0 $ 3,584 $ 0 $ 0 $ 3,626 Average final average salary $ 0 $ 0 $ 7,500 $ 0 $ 7,169 $ 0 $ 0 $ 7,251 Number of retirees 0 0 1 0 3 0 0 4
2006 Average monthly benefit $ 1,088 $ 1,669 $ 0 $ 0 $ 0 $ 3,333 $ 0 $ 2,356 Average final average salary $ 7,836 $ 5,933 $ 0 $ 0 $ 0 $ 6,667 $ 0 $ 6,776 Number of retirees 1 1 0 0 0 2 0 4
2007 Average monthly benefit $ 0 $ 0 $ 0 $ 0 $ 0 $ 0 $ 0 $ 0 Average final average salary $ 0 $ 0 $ 0 $ 0 $ 0 $ 0 $ 0 $ 0 Number of retirees 0 0 0 0 0 0 0 0
2008 Average monthly benefit $ 0 $ 0 $ 2,040 $ 3,968 $ 0 $ 0 $ 0 $ 2,683 Average final average salary $ 0 $ 0 $ 4,081 $ 7,936 $ 0 $ 0 $ 0 $ 5,366 Number of retirees 0 0 2 1 0 0 0 3
2009 Average monthly benefit $ 0 $ 0 $ 0 $ 0 $ 4,200 $ 0 $ 0 $ 4,200 Average final average salary $ 0 $ 0 $ 0 $ 0 $ 8,400 $ 0 $ 0 $ 8,400 Number of retirees 0 0 0 0 2 0 0 2
2010 Average monthly benefit $ 823 $ 0 $ 2,827 $ 0 $ 0 $ 0 $ 0 $ 2,159 Average final average salary $ 8,172 $ 0 $ 5,851 $ 0 $ 0 $ 0 $ 0 $ 6,625 Number of retirees 1 0 2 0 0 0 0 3
2011 Average monthly benefit $ 0 $ 0 $ 3,236 $ 4,101 $ 0 $ 0 $ 0 $ 3,524 Average final average salary $ 0 $ 0 $ 6,433 $ 8,202 $ 0 $ 0 $ 0 $ 7,023 Number of retirees 0 0 2 1 0 0 0 3
2012 Average monthly benefit $ 0 $ 2,493 $ 0 $ 4,378 $ 0 $ 4,204 $ 0 $ 3,692 Average final average salary $ 0 $ 8,756 $ 0 $ 8,756 $ 0 $ 8,408 $ 0 $ 8,640 Number of retirees 0 1 0 1 0 1 0 3
Ten Years Ended June 30, 2012 Average monthly benefit $ 956 $ 2,081 $ 2,851 $ 3,882 $ 3,831 $ 3,624 $ 0 $ 3,174 Average final average salary $ 8,004 $ 7,345 $ 5,747 $ 7,764 $ 7,661 $ 7,247 $ 0 $ 7,102 Number of retirees 2 2 7 6 5 3 0 25
Note: COLA increases are excluded from the above for comparison purposes.

Missouri State Employees’ Retirement System • Fiscal Year 2012158
STATISTICAL SECTION
Average Monthly Benefit AmountsTen Years Ended June 30, 2012
Judicial Plan
Years Credited Service by Category
Members RetiringDuring Fiscal Year <5 5-10 10-15 15-20 20-25 25-30 30+
All Members
2003 Average monthly benefit $ 756 $ 1,946 $ 4,042 $ 3,849 $ 4,000 $ 4,500 $ 4,250 $ 3,379 Average final average salary $ 8,000 $ 6,317 $ 8,333 $ 7,697 $ 8,000 $ 9,000 $ 8,500 $ 7,807 Number of retirees 2 3 3 6 3 1 2 20
2004 Average monthly benefit $ 855 $ 3,028 $ 4,500 $ 4,061 $ 4,597 $ 0 $ 4,500 $ 3,952 Average final average salary $ 5,129 $ 8,000 $ 9,000 $ 8,121 $ 9,194 $ 0 $ 9,000 $ 8,350 Number of retirees 1 1 2 4 3 0 1 12
2005 Average monthly benefit $ 0 $ 0 $ 4,388 $ 4,500 $ 4,142 $ 4,306 $ 4,396 $ 4,309 Average final average salary $ 0 $ 0 $ 9,000 $ 9,000 $ 8,284 $ 8,600 $ 8,792 $ 8,649 Number of retirees 0 0 2 1 3 5 2 13
2006 Average monthly benefit $ 592 $ 1,946 $ 4,500 $ 4,000 $ 0 $ 4,396 $ 0 $ 2,930 Average final average salary $ 5,875 $ 6,564 $ 9,000 $ 8,000 $ 0 $ 8,792 $ 0 $ 7,496 Number of retirees 2 2 1 2 0 2 0 9
2007 Average monthly benefit $ 207 $ 2,121 $ 3,995 $ 4,243 $ 4,335 $ 4,071 $ 4,250 $ 3,778 Average final average salary $ 5,875 $ 7,889 $ 7,990 $ 8,486 $ 8,714 $ 8,143 $ 8,500 $ 8,226 Number of retirees 2 5 5 14 7 7 4 44
2008 Average monthly benefit $ 592 $ 2,045 $ 4,120 $ 4,828 $ 5,132 $ 4,593 $ 5,186 $ 3,908 Average final average salary $ 5,821 $ 6,203 $ 8,276 $ 9,656 $ 10,264 $ 9,186 $ 10,373 $ 8,537 Number of retirees 2 2 6 3 3 2 1 19
2009 Average monthly benefit $ 524 $ 1,786 $ 3,663 $ 4,627 $ 5,286 $ 5,127 $ 5,020 $ 3,398 Average final average salary $ 6,103 $ 7,469 $ 7,811 $ 9,195 $ 10,572 $ 10,255 $ 10,040 $ 8,323 Number of retirees 6 2 7 5 3 3 1 27
2010 Average monthly benefit $ 458 $ 1,333 $ 4,507 $ 4,557 $ 0 $ 5,181 $ 4,973 $ 4,064 Average final average salary $ 6,597 $ 8,000 $ 9,577 $ 9,114 $ 0 $ 10,362 $ 9,946 $ 9,343 Number of retirees 1 1 2 1 0 2 3 10
2011 Average monthly benefit $ 0 $ 2,188 $ 4,615 $ 4,566 $ 4,869 $ 4,866 $ 4,650 $ 4,379 Average final average salary $ 0 $ 7,994 $ 9,299 $ 9,132 $ 9,738 $ 9,732 $ 9,299 $ 9,189 Number of retirees 0 4 9 10 4 3 5 35
2012 Average monthly benefit $ 1,740 $ 2,353 $ 4,561 $ 4,621 $ 0 $ 5,020 $ 0 $ 3,684 Average final average salary $ 9,114 $ 7,797 $ 10,179 $ 9,241 $ 0 $ 10,040 $ 0 $ 9,055 Number of retirees 1 5 4 4 0 1 0 15
Ten Years Ended June 30, 2012 Average monthly benefit $ 617 $ 2,115 $ 4,233 $ 4,351 $ 4,588 $ 4,533 $ 4,588 $ 3,818 Average final average salary $ 6,388 $ 7,433 $ 8,728 $ 8,696 $ 9,188 $ 9,065 $ 9,175 $ 8,510 Number of retirees 17 25 41 50 26 26 19 204
Note: COLA increases are excluded from the above for comparison purposes.
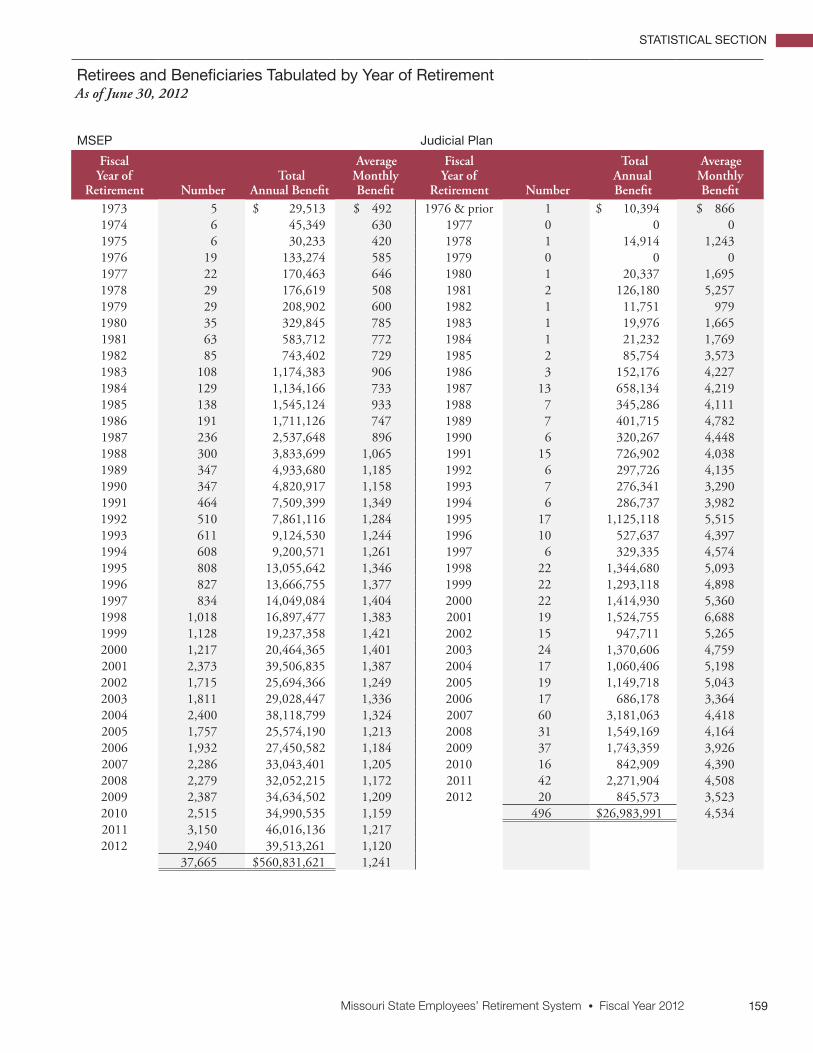
Missouri State Employees’ Retirement System • Fiscal Year 2012 159
STATISTICAL SECTION
Retirees and Beneficiaries Tabulated by Year of RetirementAs of June 30, 2012
MSEP Judicial Plan
Fiscal Year of
Retirement Number Total
Annual Benefit
Average Monthly Benefit
Fiscal Year of
Retirement Number
Total Annual Benefit
Average Monthly Benefit
1973 5 $ 29,513 $ 492 1976 & prior 1 $ 10,394 $ 866 1974 6 45,349 630 1977 0 0 0 1975 6 30,233 420 1978 1 14,914 1,243 1976 19 133,274 585 1979 0 0 0 1977 22 170,463 646 1980 1 20,337 1,695 1978 29 176,619 508 1981 2 126,180 5,257 1979 29 208,902 600 1982 1 11,751 979 1980 35 329,845 785 1983 1 19,976 1,665 1981 63 583,712 772 1984 1 21,232 1,769 1982 85 743,402 729 1985 2 85,754 3,573 1983 108 1,174,383 906 1986 3 152,176 4,227 1984 129 1,134,166 733 1987 13 658,134 4,219 1985 138 1,545,124 933 1988 7 345,286 4,111 1986 191 1,711,126 747 1989 7 401,715 4,782 1987 236 2,537,648 896 1990 6 320,267 4,448 1988 300 3,833,699 1,065 1991 15 726,902 4,038 1989 347 4,933,680 1,185 1992 6 297,726 4,135 1990 347 4,820,917 1,158 1993 7 276,341 3,290 1991 464 7,509,399 1,349 1994 6 286,737 3,982 1992 510 7,861,116 1,284 1995 17 1,125,118 5,515 1993 611 9,124,530 1,244 1996 10 527,637 4,397 1994 608 9,200,571 1,261 1997 6 329,335 4,574 1995 808 13,055,642 1,346 1998 22 1,344,680 5,093 1996 827 13,666,755 1,377 1999 22 1,293,118 4,898 1997 834 14,049,084 1,404 2000 22 1,414,930 5,360 1998 1,018 16,897,477 1,383 2001 19 1,524,755 6,688 1999 1,128 19,237,358 1,421 2002 15 947,711 5,265 2000 1,217 20,464,365 1,401 2003 24 1,370,606 4,759 2001 2,373 39,506,835 1,387 2004 17 1,060,406 5,198 2002 1,715 25,694,366 1,249 2005 19 1,149,718 5,043 2003 1,811 29,028,447 1,336 2006 17 686,178 3,364 2004 2,400 38,118,799 1,324 2007 60 3,181,063 4,418 2005 1,757 25,574,190 1,213 2008 31 1,549,169 4,164 2006 1,932 27,450,582 1,184 2009 37 1,743,359 3,926 2007 2,286 33,043,401 1,205 2010 16 842,909 4,390 2008 2,279 32,052,215 1,172 2011 42 2,271,904 4,508 2009 2,387 34,634,502 1,209 2012 20 845,573 3,523 2010 2,515 34,990,535 1,159 496 $26,983,991 4,534 2011 3,150 46,016,136 1,217 2012 2,940 39,513,261 1,120
37,665 $560,831,621 1,241

Missouri State Employees’ Retirement System • Fiscal Year 2012160
STATISTICAL SECTION
Total Benefits Payable June 30, 2012Tabulated by Attained Ages of Benefit Recipients
MSEP
ServiceRetirement
DisabilityRetirement
Survivors andBeneficiaries Totals
Attained Ages No. Annual Benefits No.
Annual Benefits No.
Annual Benefits No. Annual Benefits
Under 20 60 $ 207,099 60 $ 207,099 20-24 29 131,812 29 131,812 25-29 4 9,180 4 9,180 30-34 21 125,425 21 125,425 35-39 35 247,981 35 247,981 40-44 74 518,995 74 518,995 45-49 3 $ 88,716 97 711,809 100 800,525 50-54 557 15,875,773 192 1,623,532 749 17,499,305 55-59 3,724 79,864,356 2 $ 6,660 317 3,267,989 4,043 83,139,005 60-64 7,988 121,789,383 6 23,052 489 5,088,065 8,483 126,900,500 65-69 7,770 101,472,687 509 5,968,964 8,279 107,441,651 70-74 5,254 78,479,426 567 7,536,104 5,821 86,015,530 75-79 3,488 54,946,764 634 6,900,159 4,122 61,846,923 80-84 2,309 36,100,809 584 6,091,503 2,893 42,192,312 85-89 1,380 18,525,426 384 3,788,734 1,764 22,314,160 90-94 511 6,098,939 144 1,450,139 655 7,549,078
95 38 393,594 8 80,664 46 474,258 96 35 387,604 9 41,711 44 429,315 97 23 226,033 11 86,640 34 312,673 98 18 168,437 3 10,440 21 178,877 99 9 94,123 3 47,328 12 141,451
100 10 68,712 1 4,488 11 73,200 101 4 32,771 4 32,771 102 2 22,392 2 22,392 103 1 3,996 1 3,996 104 1 2,609 1 2,609
Totals 33,124 $514,639,941 8 $29,712 4,176 $43,941,370 37,308 $558,611,023
Average age at retirement: 60.2 years • Average age now: 69.3 years
$0
$5,000
$10,000
$15,000
$20,000
$25,000
$30,000
Disability Bene�ts
Survivor Bene�ts
Service Bene�ts
>9590-9485-8980-8475-7970-7465-6960-6455-5950-5445-4940-44<40
Bene
�ts
Average Annual BenefitsMSEP

Missouri State Employees’ Retirement System • Fiscal Year 2012 161
STATISTICAL SECTION
Total Benefits Payable June 30, 2012Tabulated by Attained Ages of Benefit Recipients
Judicial Plan
ServiceRetirement
Survivors andBeneficiaries Totals
Attained Ages No. Annual Benefits No.Annual Benefits No. Annual Benefits
50-54 0 $ 0 3 $ 114,540 3 $ 114,540 55-59 19 1,154,876 3 97,254 22 1,252,13060-64 66 3,254,899 8 287,286 74 3,542,18565-69 71 4,178,755 18 552,044 89 4,730,799 70-74 70 4,764,175 11 370,644 81 5,134,819 75-79 46 3,570,890 12 387,552 58 3,958,442 80-84 39 2,863,284 42 1,404,214 81 4,267,498 85-89 23 1,655,194 25 861,082 48 2,516,276 90-94 9 574,992 18 564,745 27 1,139,737>95 4 270,876 1 37,253 5 308,129
Totals 347 $22,287,941 141 $4,676,614 488 $26,964,555
Average age at retirement: 65.2 years • Average age now: 75.5 years
$0
$10,000
$20,000
$30,000
$40,000
$50,000
$60,000
$70,000
$80,000Survivor Bene�ts
Service Bene�ts
>9590-9485-8980-8475-7970-7465-6960-6455-5950-5445-49
Bene
�ts
Average Annual BenefitsJudicial

Missouri State Employees’ Retirement System • Fiscal Year 2012162
STATISTICAL SECTION
This publication may be provided in alternative formats.
To obtain accessible formats, please contact MOSERS at (573) 632-6100 or (800) 827-1063.
Missouri Relay numbers are 7-1-1 (Voice) or (800) 735-2966 (TTY).
MOSERS is an equal opportunity employer.