Estee Lauder Companies Strategic Audit PowerPoint
25
Bringing the Best to Everyone We Touch Corporate and Strategic Analysis Joshua Dopkowski Sonoma State University October 24, 2014 Bringing The Best To Everyone We Touch
-
Upload
joshua-dopkowski -
Category
Business
-
view
1.147 -
download
1
description
Strategic Business Audit / Analysis of The Estee Lauder Companies following FY14.
Transcript of Estee Lauder Companies Strategic Audit PowerPoint
Bringing the Best to Everyone We Touch
Corporate and Strategic Analysis
Joshua Dopkowski
Sonoma State University
October 24, 2014
Bringing The Best To Everyone We Touch

Bringing the Best to Everyone We Touch
General Motors Building, New York City
Corporate Snapshot

Bringing the Best to Everyone We Touch
Executive Management
Corporate Snapshot
William Lauder
ChairmanCedric Prouvé
Group PresidentJohn Demsey
Group President
Fabrizio Freda
President & CEO
Sara Moss
General Councel
Michael O’ Hare
EVP HR
Greg Polcer
EVP Supply Chain
Tracey T. Travis
CFO
$31.5 Million $9.9 Million $7.9 Million $7.6 Million
$6.6 Million

Bringing the Best to Everyone We Touch
Corporate Snapshot
Bringing the Best to Everyone We Touch
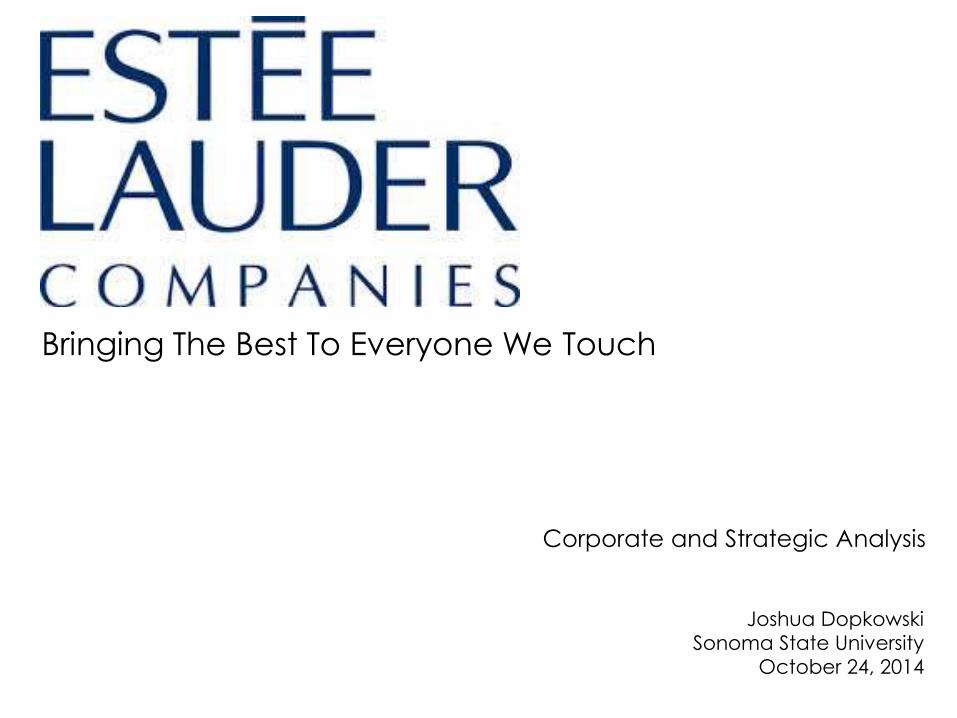
The Driving Force
Marketing
• Single greatest expense for the company.
• Marketing departments part of Brand Business Unit.
• Regional marketing groups in USA.
• Domestic Marketing teams report into Brand Business Unit.
• Regional Marketing groups service subsidiaries.
• All Global Marketing teams report into Brand Business Unit.
• In house creative teams report into Brand leadership.

Bringing the Best to Everyone We Touch
Logistics
Supply Chain
• Multiple production facilities allow for country of origin to be on
the same continent as the customer.
• Suppliers are global, with the majority having operations in the
New York/New Jersey region.

Bringing the Best to Everyone We Touch
Packaging
Supply Chain
• Vital aspect of cosmetic product production.
• Most expensive aspect of inventory and COGS.
• Entire corporate division dedicated to the development of
product packaging and other materials.
• Separate Corporate Business Unit, broken out by departments
that service the brands (client/agent relationship).
• Heavily regulated and requirements vary greatly between
different countries.

Bringing the Best to Everyone We Touch
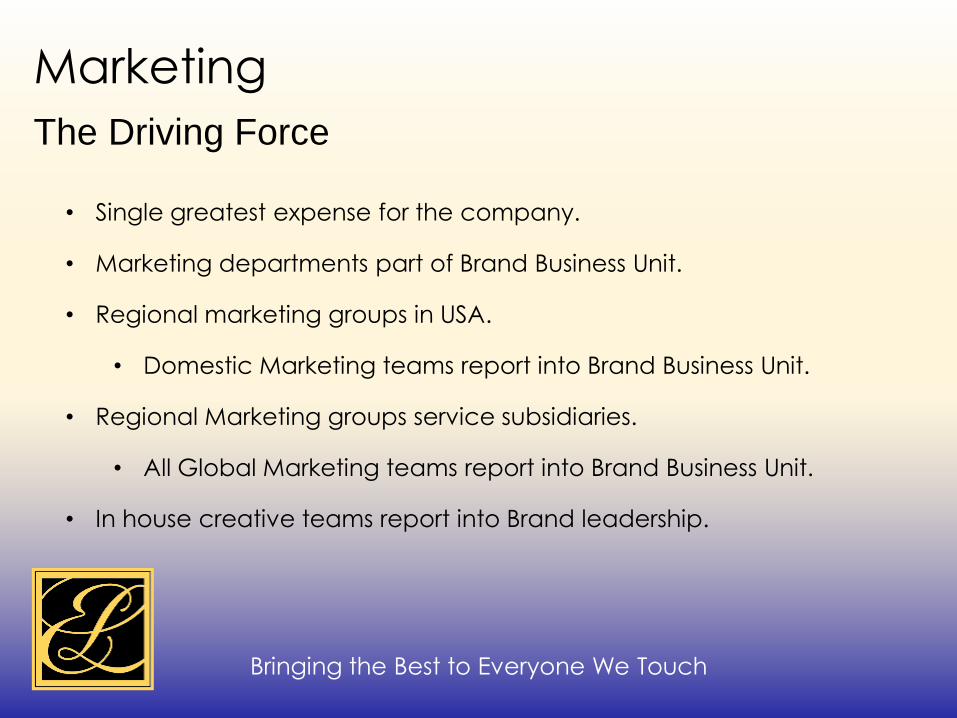
Competitive Analysis
• Largely consolidated, however many small players exist.
• Estimated to exceed $600 Billion USD Globally.
• Cosmetic/Beauty sector $57 Billion USD in United States.
• USA Cosmetics/Beauty industry employs more than 56,000 people.
• L’Oréal is the largest horizontally integrated player at €23 Billion.
• Loosely regulated in USA.
• EU and Canada regulations much stricter.
Personal Care Industry
Bringing the Best to Everyone We Touch
Competitive Analysis
• L’Oréal (Nestle has controlling share)
• Proctor & Gamble
• LVMH
• Unilever
• Coty
• Chanel
• Revlon
• Avon
• Elizabeth Arden
• L Brands Inc
• Johnson & Johnson
Largest Competitors
Bringing the Best to Everyone We Touch
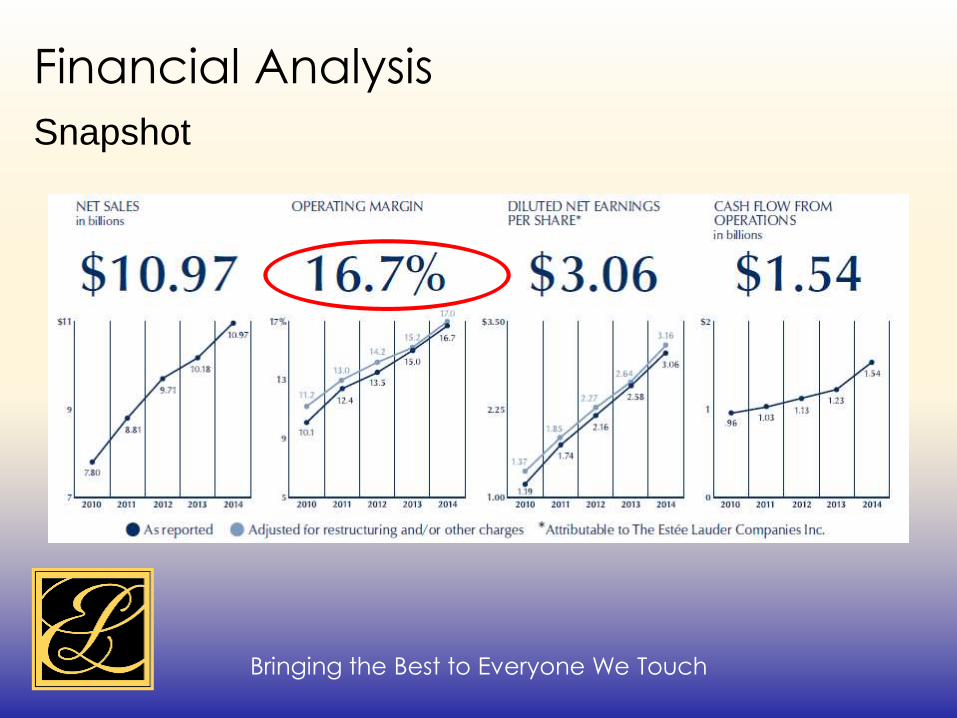
Snapshot
Financial Analysis
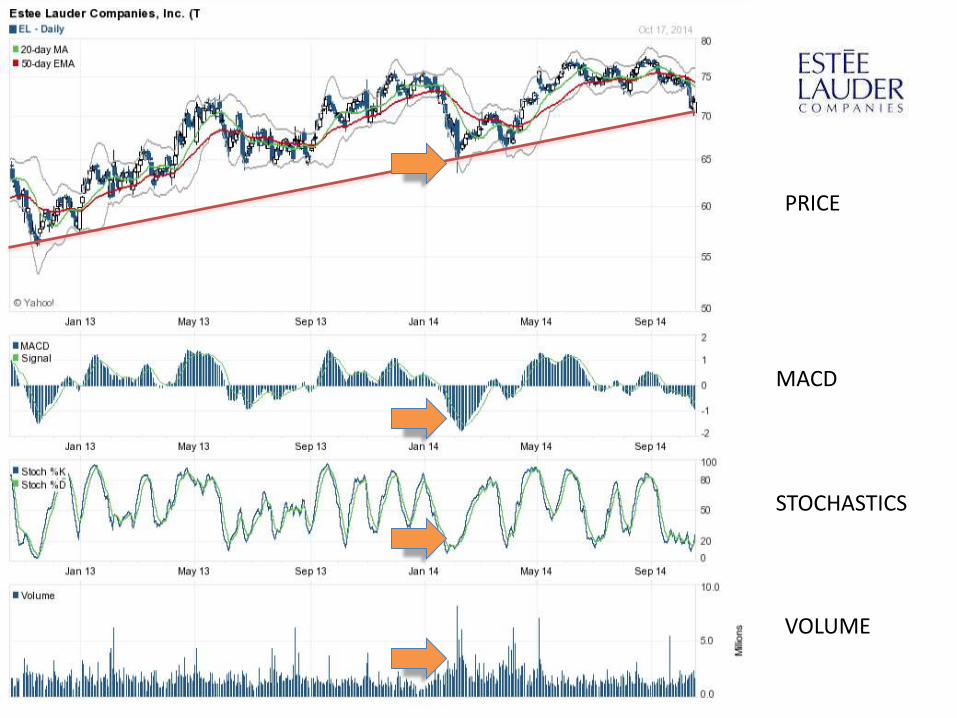
MACD
STOCHASTICS
VOLUME
PRICE
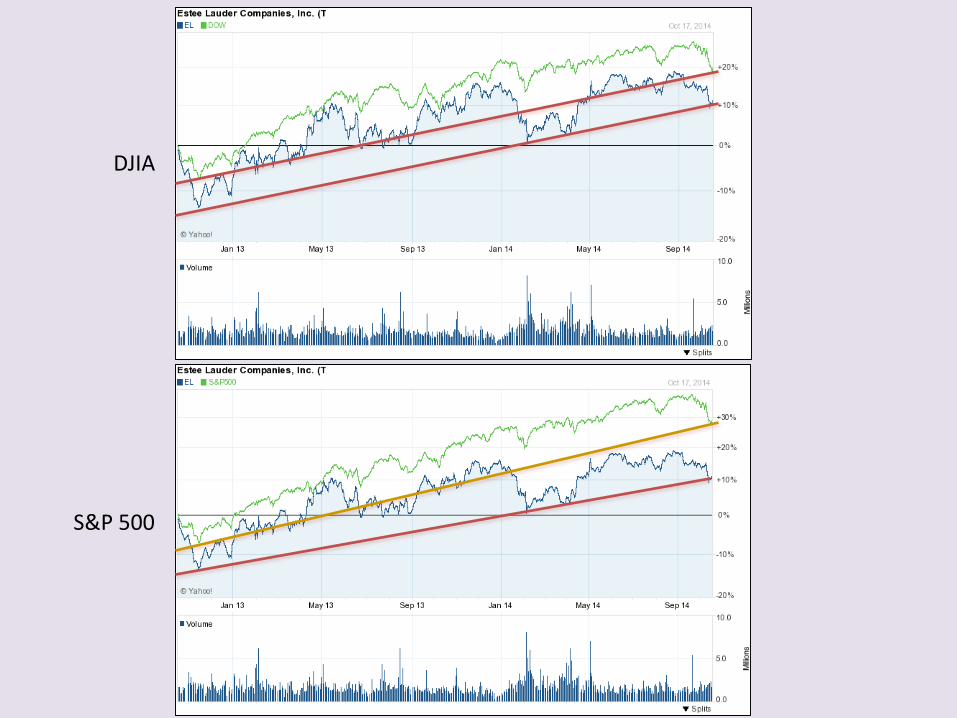
DJIA
S&P 500

Financial AnalysisConsolidated Statement of Earnings

Financial AnalysisConsolidated Earnings as Percentage of Net Sales

Financial AnalysisYear-Over-Year Comparisons
SELECTED FINANCIAL DATA 2014 2013 2012
Cash and equivalents $1,629.1 $1,495.7 $1,347.7
Accounts receivable $1,379.3 $1,171.7 $1,060.3
Inventory $1,294.0 $1,113.9 $983.6
Current assets $4,825.2 $4,297.2 $3,855.1
Total assets $7,868.0 $7,145.2 $6,593.0
Current liabilities $2,056.7 $1,934.6 $2,125.8
Total liabilities $3,999.4 $3,843.3 $3,845.5
Stockholders' equity $3,869.4 $3,301.9 $2,733.2
Total liabilities & equity $7,868.8 $7,145.2 $6,578.7
Sales $10,968.8 $10,181.7 $9,713.6
Cost of goods sold $2,158.2 $2,025.9 $1,995.8
Gross profit $8,810.6 $8,155.8 $7,717.8
SG&A $6,985.9 $6,597.0 $6,324.8
Operating income $1,827.6 $1,526.0 $1,311.7
Interest expense $50.8 $54.8 $61.1
Income taxes $567.7 $451.4 $400.6
Net income $1,209.1 $1,019.8 $856.9
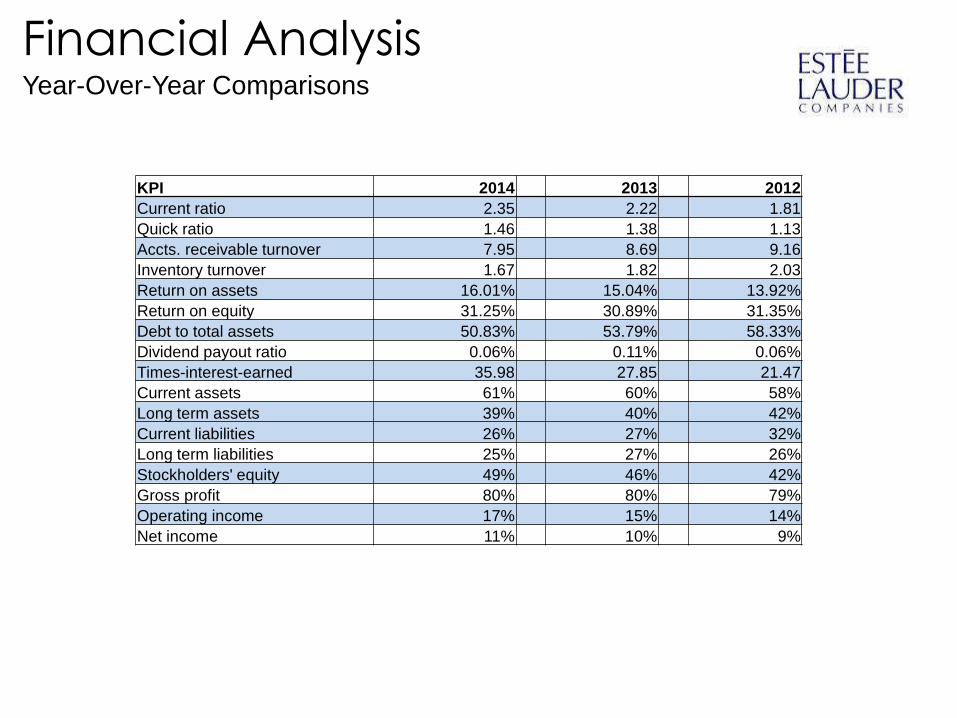
Financial AnalysisYear-Over-Year Comparisons
KPI 2014 2013 2012
Current ratio 2.35 2.22 1.81
Quick ratio 1.46 1.38 1.13
Accts. receivable turnover 7.95 8.69 9.16
Inventory turnover 1.67 1.82 2.03
Return on assets 16.01% 15.04% 13.92%
Return on equity 31.25% 30.89% 31.35%
Debt to total assets 50.83% 53.79% 58.33%
Dividend payout ratio 0.06% 0.11% 0.06%
Times-interest-earned 35.98 27.85 21.47
Current assets 61% 60% 58%
Long term assets 39% 40% 42%
Current liabilities 26% 27% 32%
Long term liabilities 25% 27% 26%
Stockholders' equity 49% 46% 42%
Gross profit 80% 80% 79%
Operating income 17% 15% 14%
Net income 11% 10% 9%
Bringing the Best to Everyone We Touch
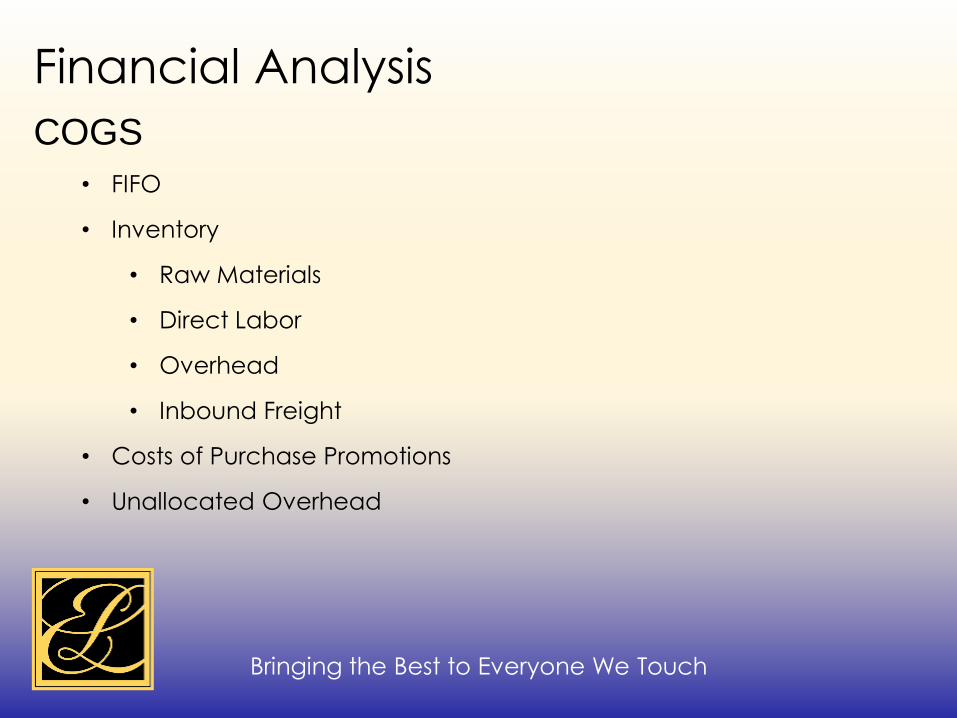
COGS
Financial Analysis
• FIFO
• Inventory
• Raw Materials
• Direct Labor
• Overhead
• Inbound Freight
• Costs of Purchase Promotions
• Unallocated Overhead

Bringing the Best to Everyone We Touch
SG&A
Financial Analysis
SG&A BREAKDOWN $ 2014 $ 2013 $ 2012
Advertising and Promotion 2618.1 2754.8 2614.5
Payments to Customers 1410 1412 1343
PP&E Depreciation & Amoritzation 378.1 329.8 286.9
Shipping & Handling 373.6 337.9 312.4
Rent 356.1 332.4 304.9
R&D 157.9 146.8 137.8
Currency Translation Transactions 95.1 -25.6 -154.2
Measurement Charge 38.3 0 0
Foreign Currency Forward Contracts 0.8
Derivatives (AOCI) -2.7
Unaccounted 1470.6
TOTA SG&A 6985.9
Bringing the Best to Everyone We Touch
PESTLERPOLITICAL ECONOMIC SOCIAL
• Environmental law regarding CPG waste streams
• “Blood” minerals/materials
• Exchange rates
• Income disparity and rising costs of living
• Cultural view of cosmetics and animal testing
• Youthful brands
• Health Conscious Society
TECHNOLOGICAL LEGAL ENVIRONMENTAL
• Digital Marketing
• Supply Chain
• Allows for start ups and small producers.
• Minimal regulation in USA
• Trademark, IP
• M&A
• Raw materials for Product Development
• Waste streams• Marketing opportunities • Different laws exist
globally
GLOBAL REGULATORY
• Extreme disparities between various global regulations leads to highly complex supply chain strategies

Bringing the Best to Everyone We Touch
SWOTSTRENGTHS WEAKNESSES
• Best skin care products.
• Global supply chain, distribution and market presence.
• Brand equity and reputation.
• Financial and largely recession proof.
• All luxury cosmetic CPG, no vertical integration.
• Inflated SG&A.
• Overpaid executives and culture of Nepotism.
• Political corporate culture.
• Gross Margin not holistic.
OPPORTUNITIES THREATS
• Restructure SG&A and COGS.
• Vertical integration in luxury.
• Enter new markets.
• Industry fragmentation & Wellness trend.
• Digital Marketing.
• Income disparity.
Bringing the Best to Everyone We Touch
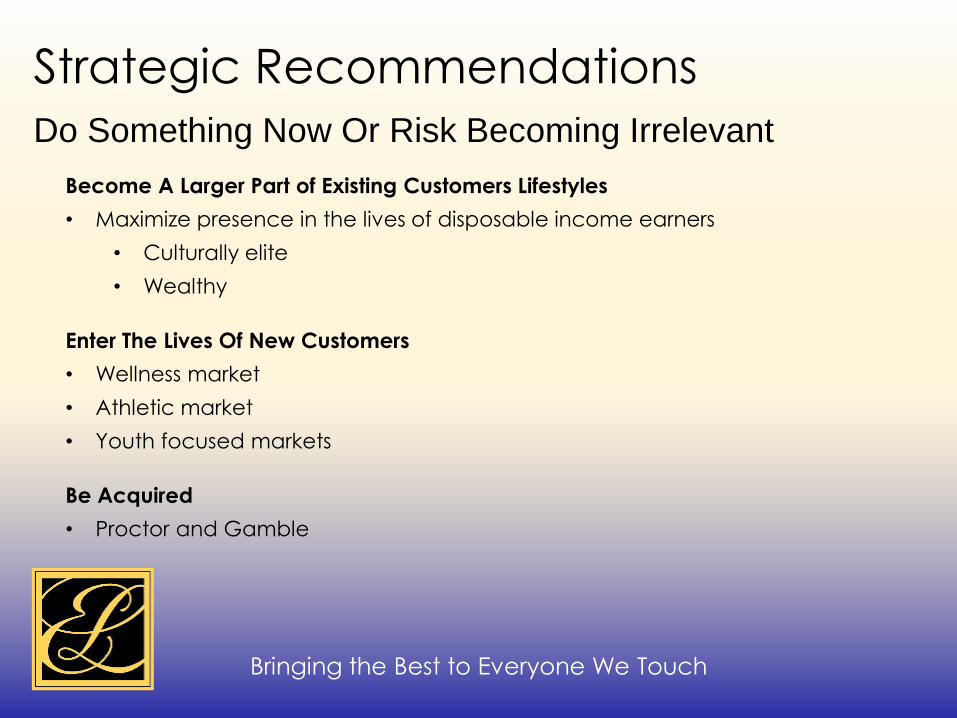
Do Something Now Or Risk Becoming Irrelevant
Strategic Recommendations
Become A Larger Part of Existing Customers Lifestyles
• Maximize presence in the lives of disposable income earners
• Culturally elite
• Wealthy
Enter The Lives Of New Customers
• Wellness market
• Athletic market
• Youth focused markets
Be Acquired
• Proctor and Gamble
Bringing the Best to Everyone We Touch
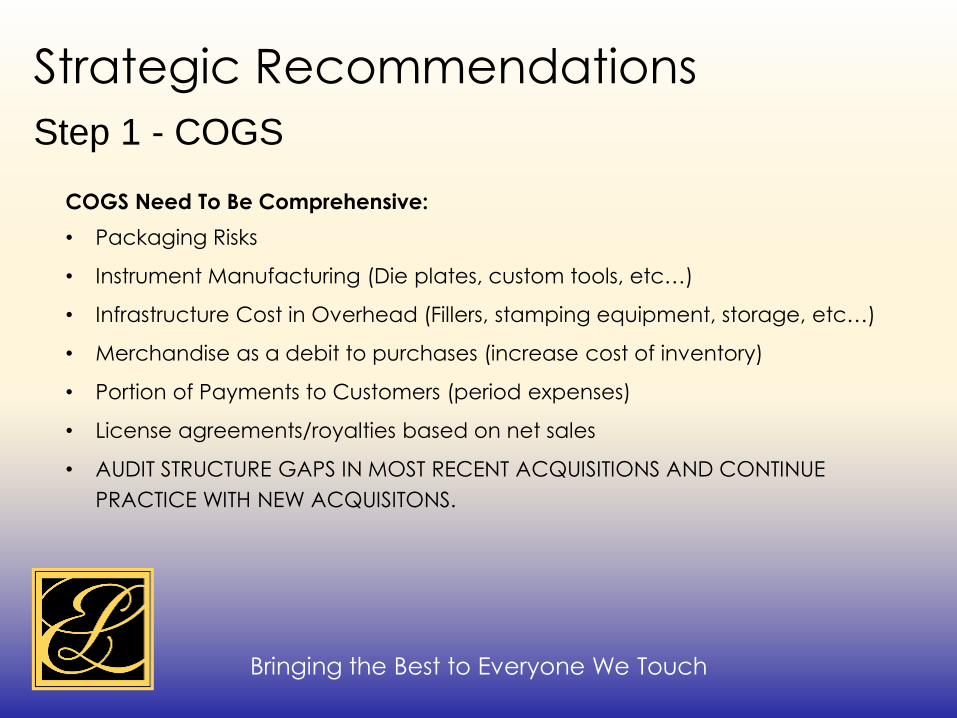
Step 1 - COGS
Strategic Recommendations
COGS Need To Be Comprehensive:
• Packaging Risks
• Instrument Manufacturing (Die plates, custom tools, etc…)
• Infrastructure Cost in Overhead (Fillers, stamping equipment, storage, etc…)
• Merchandise as a debit to purchases (increase cost of inventory)
• Portion of Payments to Customers (period expenses)
• License agreements/royalties based on net sales
• AUDIT STRUCTURE GAPS IN MOST RECENT ACQUISITIONS AND CONTINUE
PRACTICE WITH NEW ACQUISITONS.

Bringing the Best to Everyone We Touch
Step 2 - SG&A
Strategic Recommendations
SG&A Needs To Be Precise
• Clear breakdown.
• Routine and methodical analysis to identify value opportunities in SG&A.
• Cost reductions.
• Leverage opportunities.
• Synergies.
• Invest in Digital Marketing space.
• Identify more efficient and cost reducing promotional strategies.

Bringing the Best to Everyone We Touch
Step 3 - Vertical Integration Through Acquisition.
Strategic Recommendations
Acquire Business Unit:
• Holistic Beauty & Lifestyle
• Products and services that support a lifestyle
• Do not price out new customers!
Other Possible BU’s:
• Luxury furniture
• Boutique fashion/apparel
• Wine & Spirits
• Jewelry
Bringing the Best to Everyone We Touch
Corporate and Strategic Analysis
Joshua Dopkowski
Sonoma State University
October 24, 2014
THANK YOU