
Establishment of a Pilot Manufacturing Line for Lithium ...
135
California Energy Commission Clean Transportation Program FINAL PROJECT REPORT Establishment of a Pilot Manufacturing Line for Lithium Ion Modules for Use as Building Blocks for Battery Systems in Electric Vehicle Applications Prepared for: California Energy Commission Prepared by: Vic Sistos, Grantee Program Manager Gavin Newsom, Governor December 2020 | CEC-600-2020-053
Transcript of Establishment of a Pilot Manufacturing Line for Lithium ...

California Energy Commission Clean Transportation Program
FINAL PROJECT REPORT
Establishment of a Pilot Manufacturing Line for Lithium Ion Modules for Use as Building Blocks for Battery Systems in Electric Vehicle Applications
Prepared for: California Energy Commission
Prepared by: Vic Sistos, Grantee Program Manager
Gavin Newsom, Governor December 2020 | CEC-600-2020-053

California Energy Commission
Vic Sistos Jung Park Kevin Pope Michael Tomcsi Joao Yanez Michael Escobar Primary Authors
Quallion, LLC 12744 San Fernando Road Sylmar, CA 91342 (818) 833-3248
Agreement Number: ARV-10-010
Akasha Kaur Khalsa Commission Agreement Manager
Elizabeth John Office Manager ADVANCED FUELS AND VEHICLE TECHNOLOGIES
John P. Butler II Acting Deputy Director FUELS AND TRANSPORTATION
Drew Bohan Executive Director
DISCLAIMER This report was prepared as the result of work sponsored by the California Energy Commission (CEC). It does not necessarily represent the views of the CEC, its employees, or the State of California. The CEC, the State of California, its employees, contractors, and subcontractors make no warrant, express or implied, and assume no legal liability for the information in this report; nor does any party represent that the use of this information will not infringe upon privately owned rights. This report has not been approved or disapproved by the CEC nor has the CEC passed upon the accuracy or adequacy of the information in this report.
i
ACKNOWLEDGEMENTS
Quallion, LLC wishes to acknowledge Akasha Kaur Khalsa of the California Energy Commission. Her support and guidance were invaluable during this project, and Quallion, LLC welcomes the opportunity to work with her again.
Acknowledgement also goes to Land Systems Corporation for teaming with Quallion and providing their RailScout electric vehicle as the test platform onto which the Quallion Battery Module System and Battery Management Electronics were integrated and deployed for field data collection.
Quallion, LLC also wishes to acknowledge Clean Fuel Connection, Incorporated for providing support in generating the emissions reductions projections and environmental impact analysis included in this report.

ii
PREFACE
Assembly Bill 118 (Núñez, Chapter 750, Statutes of 2007) created the Clean Transportation Program, formerly known as the Alternative and Renewable Fuel and Vehicle Technology Program. The statute authorizes the California Energy Commission (CEC) to develop and deploy alternative and renewable fuels and advanced transportation technologies to help attain the state’s climate change policies. Assembly Bill 8 (Perea, Chapter 401, Statutes of 2013) reauthorizes the Clean Transportation Program through January 1, 2024, and specifies that the CEC allocate up to $20 million per year (or up to 20 percent of each fiscal year’s funds) in funding for hydrogen station development until at least 100 stations are operational.
The Clean Transportation Program has an annual budget of about $100 million and provides financial support for projects that:
• Reduce California’s use and dependence on petroleum transportation fuels and increasethe use of alternative and renewable fuels and advanced vehicle technologies.
• Produce sustainable alternative and renewable low-carbon fuels in California.• Expand alternative fueling infrastructure and fueling stations.• Improve the efficiency, performance and market viability of alternative light-, medium-,
and heavy-duty vehicle technologies.• Retrofit medium- and heavy-duty on-road and nonroad vehicle fleets to alternative
technologies or fuel use.• Expand the alternative fueling infrastructure available to existing fleets, public transit,
and transportation corridors.• Establish workforce-training programs and conduct public outreach on the benefits of
alternative transportation fuels and vehicle technologies.
To be eligible for funding under the Clean Transportation Program, a project must be consistent with the CEC’s annual Clean Transportation Program Investment Plan Update. The CEC issued PON-09-605 to provide funding opportunities for the development and expansion of manufacturing and assembly plants in California that produce electric vehicles, batteries, and component parts for alternative fuel vehicles. In response to PON-09-605, the recipient submitted an application which was proposed for funding in the CEC’s notice of proposed awards March 10, 2011 and the agreement was executed as ARV-10-010 on June 21, 2011.

iii
ABSTRACT
Quallion, LLC performed major construction of a set of low-humidity rooms within existing facilities for the installation of the equipment needed for the pilot lithium ion module automated assembly line. Quallion defined, procured, installed and validated the equipment required to fabricate and assemble industry leading 18650 lithium ion battery cells. Multiple battery cells were assembled with a unique design into Battery Modules for use in electric vehicle platforms. To support battery module operations and testing, the Battery Management System electronics were designed and built under a separate CEC Grant (ARV-12-010).
Quallion’s battery modules and Battery Management System electronics were integrated into the RailScout electric vehicle provided by Land Systems Corporation for field deployment. The RailScout is an unmanned, battery powered railroad track inspection vehicle developed as an alternative to the gasoline and diesel fueled rail track inspection vehicles currently in use. The unmanned RailScout is expected to provide higher efficiency and safer inspection capabilities compared to existing operator manned inspection vehicles.
Light duty and medium duty electric vehicles are expected to reduce toxic and criteria pollutant emissions continually by using battery power instead of gasoline or diesel fuel. The greenhouse gas emission reduction is estimated to be 4 - 19 metric tons carbon dioxide equivalent per year per vehicle, depending on implementation. Additionally, the project increases awareness of electric vehicles as alternatives to non-traditional vehicles that use hydrocarbon fuels.
Keywords: California Energy Commission, Quallion, LLC, Battery Modules, BMS electronics, EV integration, petroleum displacement, greenhouse gas emission reduction, rail safety
Please use the following citation for this report:
Sistos, Vic, Jung Park, Kevin Pope, Michael Tomcsi, Joao Yanez, Michael Escobar. December 2020. Quallion, LLC. Establishment of a Pilot Manufacturing Line for Lithium Ion Modules for Use as Building Blocks for Battery Systems in Electric Vehicle Applications . California Energy Commission. Publication Number: CEC-600-2020-053.

iv

v
TABLE OF CONTENTS Page
Acknowledgements .............................................................................................................. i Preface ............................................................................................................................... ii Abstract ............................................................................................................................ iii Table of Contents................................................................................................................ v
List of Figures .................................................................................................................... vi List of Tables ...................................................................................................................... x
Executive Summary ............................................................................................................. 1
CHAPTER 1: Purpose and Approach ..................................................................................... 3 1.1 Project Goals .............................................................................................................. 3 1.2 Project Objectives ....................................................................................................... 4
CHAPTER 2: Battery Design and Function ............................................................................. 5 2.1 Lithium Ion Battery Electrochemistry and Function ....................................................... 5
2.1.1 Anode and Cathode Material Consideration ....................................................................................................... 7 2.1.2 Cylindrical vs Prismatic Cell Design Tradeoffs .................................................................................................... 9
2.2 Battery Module Design Approach ............................................................................... 11 2.2.1 Safety Considerations ................................................................................................................................... 12
CHAPTER 3: Production Facilities – Dry Room, Formation and Pack Assembly ....................... 13 3.1 Manufacturing and Assembly Facilities Design ............................................................ 13 3.2 Manufacturing and Assembly Facilities Construction .................................................... 14 3.3 Problems Encountered and Resolved ......................................................................... 20
CHAPTER 4: Automated Manufacturing Equipment .............................................................. 22 4.1 Equipment Specifications .......................................................................................... 22
4.1.1 Kaido Winder ............................................................................................................................................... 23 4.1.2 Hibar Equipment .......................................................................................................................................... 26 4.1.3 Formation and Test Equipment ...................................................................................................................... 33
4.2 Machine Vision Approach and Implementation ............................................................ 36 4.2.1 Part Serial Number / Bar Code Tracking.......................................................................................................... 36
4.3 Manufacturing Equipment Installation ........................................................................ 38 4.4 Operator Training ..................................................................................................... 38 4.5 Manufacturing Equipment Validation .......................................................................... 39
4.5.1 Kaido Winder Validation ................................................................................................................................ 40 4.5.2 Hibar Resistance Welding Module Validation ................................................................................................... 43 4.5.3 Hibar Beading Module Validation .................................................................................................................... 47 4.5.4 Hibar Sealant Dispensing Module Validation .................................................................................................... 52 4.5.5 Hibar Electrolyte Filling Module Validation ....................................................................................................... 55 4.5.6 Hibar Electrolyte Filling System Performance Validation .................................................................................... 56 4.5.7 Hibar Top Tab Welding and Taping Module Validation...................................................................................... 58
vi
4.5.8 Hibar Crimping System Validation .................................................................................................................. 62 4.6 Problems Encountered and Resolved ......................................................................... 67
CHAPTER 5: Battery Module System Fabrication and Testing ............................................... 68 5.1 Cell Screening .......................................................................................................... 68 5.2 Battery Module Fabrication ........................................................................................ 69 5.3 Battery Module Testing ............................................................................................. 73 5.4 Battery Management System Electronics Fabrication ................................................... 74 5.5 Battery Module Integration Testing ............................................................................ 77 5.6 Problems Encountered and Resolved ......................................................................... 87
CHAPTER 6: Module and RailScout Electric Vehicle Integration ............................................ 89 6.1 RailScout Deployment and Operational Data Collected ................................................ 89
6.1.1 RailScout Electric Vehicle ............................................................................................................................... 89 6.1.2 Vehicle Field Data Deployment Site Description and Test Objectives.................................................................. 91 6.1.3 Vehicle Field Data Collection and Analysis ....................................................................................................... 94
CHAPTER 7: Project Results, Benefits and Cost Effectiveness ............................................... 99 7.1 ARV-10-010 Grant Scope of Work Essay Topics .......................................................... 99 7.2 Environmental Benefits ............................................................................................. 99
7.2.1 Toxic Air Pollutant Emissions Reduction Projections ......................................................................................... 99 7.2.2 Projected Emission Reductions .................................................................................................................... 102 7.2.3 Carbon Intensity ........................................................................................................................................ 105 7.2.4 Speculative GHG Cost-Effectiveness ............................................................................................................. 107
7.3 Economic Benefits .................................................................................................. 108 7.3.1 Pilot Battery Module Assembly Line Cost Savings ........................................................................................... 108 7.3.2 Ancillary Project Benefits ............................................................................................................................. 109
7.4 Building Energy Efficiency Benefits .......................................................................... 116
CHAPTER 8: Conclusions and Recommendations ............................................................... 117 8.1 Achievement of Goals and Objectives ...................................................................... 117 8.2 Results Obtained .................................................................................................... 117 8.3 Conclusions ............................................................................................................ 118 8.4 Recommendations .................................................................................................. 118
Glossary ......................................................................................................................... 119
LIST OF FIGURES Page
Figure 1: Schematic Representation of a Battery ................................................................... 5
Figure 2: Energy Storage Capabilities of Various Secondary Chemistries ................................. 6
Figure 3: Schematic Representative of a Li-Ion Cell ............................................................... 7

vii
Figure 4: Voltage vs. Capacity for Materials in Use or Under Investigation for Li-ion Batteries .. 8
Figure 5: Cathode Material Trade-Offs .................................................................................. 8
Figure 6: Schematic of Cylindrical and Prismatic Cell Form Factor ........................................... 9
Figure 7: Battery Cell in 18650 Form Factor and Modular Construction ................................. 10
Figure 8: Battery Module Design ........................................................................................ 11
Figure 9: Battery Module Weight and Dimensions ............................................................... 12
Figure 10: Site of Lithium Ion Battery Pilot Manufacturing Line in Quallion’s Sylmar, CA Facility........................................................................................................................................ 13
Figure 11: Lithium Ion Battery Pilot Manufacturing Line Building Utilization and Material Flow 14
Figure 12: New Concrete Floor Construction in Pilot Manufacturing Line Site ........................ 15
Figure 13: New Concrete Floor and Wall Construction in Pilot Manufacturing Line Site ........... 15
Figure 14: New Drywall Construction in Pilot Manufacturing Line Site ................................... 16
Figure 15: Upgrades to Building Air and Access Hallways to Meet California Building Codes ... 16
Figure 16: Dehumidifier Equipment and Electrical Modifications for Dry Room ...................... 17
Figure 17: Dehumidifier Equipment Installation Structural Upgrades .................................... 18
Figure 18: Dehumidifier Equipment Mounting Platform Construction .................................... 18
Figure 19: Completed Dry Room Ready for Equipment Installation ....................................... 19
Figure 20: Dehumidifier as Installed on Roof ...................................................................... 20
Figure 21: Equipment Functional Design & Product Flow ..................................................... 23
Figure 22: Kaido Winder .................................................................................................... 23
Figure 23: Jelly Roll Output from Winder ............................................................................ 25
Figure 24: Main Components of the Kaido Automated Jelly Roll Winding Machine, Viewed from the Front .......................................................................................................................... 25
Figure 25: Hardware Processing in Preparation for Bottom Tab Welding ............................... 26
Figure 26: Jelly Roll Insertion into Case and Loading into Bottom Tab Welding Station for Resistance Welding of Bottom Tab to Case ......................................................................... 27
Figure 27: Center Pin and Top Insulator Installation Prior to Loading into Beading/Grooving Station ............................................................................................................................. 28
Figure 28: Cell Housing Processing Results from the Beading/Grooving Station ..................... 28
Figure 29: Cell Processing for Sealant Application by the Sealant Dispensing Station ............. 29
Figure 30: Cells Loaded into 5-up Carriers in Preparation for Processing by the Filling Station 30
Figure 31: Cells Loaded into 5-up Carriers for Processing by the Filling Machine ................... 30
Figure 32: Installation of Cap Assembly onto Cell Assembly prior to Processing by the Top Tab Welding and Taping Station ............................................................................................... 31

viii
Figure 33: Cell Processing for Ultrasonic Welding of Top Tab and Tape Application by the Top Tab Welding and Taping Station ........................................................................................ 31
Figure 34: Installation of the Cap into the Cell Casing Groove in Preparation for Crimping ..... 32
Figure 35: Cell Processing for Crimping of Cell Casing over the Cap by the Crimping Station .. 32
Figure 36: Formation System Diagram ............................................................................... 33
Figure 37: Open Circuit Voltage and Alternating Current Internal Resistance Machine & Loading Cart ................................................................................................................................. 34
Figure 38: Weight/Ranking System .................................................................................... 35
Figure 39: Fully Loaded Ranting Tray Ready for Processing ................................................. 35
Figure 40: Cell Assembly Process Flow Chart ...................................................................... 37
Figure 41: Dry Room Layout .............................................................................................. 40
Figure 42: Jelly Roll Production Process .............................................................................. 40
Figure 43: Jellyroll Weight Process Capability Analysis Results ............................................. 42
Figure 44: Cell Assembly Process Flow Diagram Highlighting the Tab Welding Process Step .. 44
Figure 45: Cell Case Bottom with Tabs Welded in Place ....................................................... 45
Figure 46: Bottom Tab Welder Samples Undergoing Pull Test .............................................. 46
Figure 47: Process Capability Analysis Results for Bottom Tab Welding Station ..................... 47
Figure 48: Cell Assembly Process Flow Diagram Highlighting the Can Beading Process Step .. 48
Figure 49: Detailed View of Beader Validation Parameters ................................................... 49
Figure 50: Close-up of a Cell Case after the Beading Process ............................................... 50
Figure 51: Cross-Section of Beaded Cell Case for Bead Dimensional Verification .................... 51
Figure 52: Bead Process Capability Analysis Data ................................................................ 52
Figure 53: Cell Assembly Process Flow Diagram Highlighting Adhesive Application Process Step........................................................................................................................................ 53
Figure 54: Cell Showing Post Adhesive Application Condition ............................................... 54
Figure 55: Adhesive Sealant Application Process Capability Analysis Results .......................... 55
Figure 56: Cell Assembly Process Flow Diagram Highlighting Electrolyte Filling Process Step .. 56
Figure 57: Electrolyte Filling System Process Capability Analysis Results ............................... 57
Figure 58: Cell Assembly Process Flow Highlighting Top Tab Welding Process Step ............... 59
Figure 59: Typical Top Tab Welder Validation Product Output .............................................. 60
Figure 60: Welded Top Tab Pull Strength Test .................................................................... 61
Figure 61: Top Tab Welder System Process Capability Analysis Results ................................ 62
Figure 62: Cell Assembly Process Flow Diagram Highlighting Crimping Process Step.............. 63
Figure 63: Post Crimp Feature Specification Requirements Detail ......................................... 64

ix
Figure 64: Crimp Sample Cross Sectioned for Dimensional Measurement .............................. 65
Figure 65: Crimper System Process Capability Analysis Results ............................................ 66
Figure 66: Statistical Analysis of Cell Weight ....................................................................... 69
Figure 67: Empty Cell Holder ............................................................................................. 70
Figure 68: 4 Virtual Cells in Series in Cell Holder ................................................................. 70
Figure 69: Adhesive on the Cell Holder ............................................................................... 70
Figure 70: Nickel Tabs Secured on Cell Holder .................................................................... 71
Figure 71: Automated Welding Line ................................................................................... 71
Figure 72: Automated Sight Recognition for Welding ........................................................... 72
Figure 73: Welded Module with Front Plate ......................................................................... 72
Figure 74: Wire Harness Attached to Module ...................................................................... 72
Figure 75: Testing of Engineering Module ........................................................................... 73
Figure 76: Capacity Curves for all 31 Modules ..................................................................... 74
Figure 77: Control Board (top), Interface Board (bottom left) and Single Board Computer (bottom right) ................................................................................................................... 75
Figure 78: BMS Control Board Functional, Configuration and Physical Design Parameters ...... 76
Figure 79: BMS Gateway Electronics Board and Single Board Computer Functional, Configuration and Physical Design Parameters .................................................................... 77
Figure 80: Integrated BMS Electronics and Battery Modules Test Instrumentation Setup ....... 79
Figure 81: Testing BMS Electronics Integrated with Six Battery Modules ............................... 79
Figure 82: Pre-Integration Measurements ........................................................................... 80
Figure 83: Battery Module Testing Prior to Installation into RailScout EV .............................. 81
Figure 84: Layout for Modules and BMS Integration in Battery Box ...................................... 82
Figure 85: Fiberglass Base Plate with BMS Electronics Mounted in Place ............................... 83
Figure 86: RailScout Shunt Resistor .................................................................................... 83
Figure 87: RailScout Fuse .................................................................................................. 84
Figure 88: Final Battery Assembly as Installed in the RailScout Battery Box .......................... 85
Figure 89: Thermal Image of Battery Being Discharged at 180 Amps ................................... 86
Figure 90: Battery Modules and BMS Electronics in RailScout EV Chassis .............................. 87
Figure 91: Example Image Captured by RailScout Sensors ................................................... 89
Figure 92: Example Control Capability of RailScout .............................................................. 90
Figure 93: Quallion Battery Powering the RailScout ............................................................. 91
Figure 94: Powering on the RailScout at the Fillmore Test Site ............................................. 92
Figure 95: RailScout on Site in New Orleans, LA. ................................................................. 93

x
Figure 96: View of Huey P. Long Bridge Test Site in New Orleans, LA................................... 93
Figure 97: Another View of Huey P. Long Bridge Test Site Showing 4 Mile Bridge Span ......... 94
Figure 98: Preparing to Lower the RailScout onto Fillmore Railroad Tracks ........................... 94
Figure 99: RailScout in Full Automated Operation ................................................................ 95
Figure 100: BMS Distance, Speed and Current Measurement ............................................... 96
Figure 101: High Rail Vehicle Example 1 ........................................................................... 112
Figure 102: High Rail Vehicle Example 2 ........................................................................... 113
Figure 103: East Yard Communities for Environmental Justice: Diesel Cancer Risk .............. 115
LIST OF TABLES Page
Table 1: Trade Study of 18650 and Prismatic Cell Design .................................................... 10
Table 2: Documentation Generated and Released for the Manufacturing of 18650 Cells ........ 39
Table 3: Validation Specifications for Kaido Winder Jelly Rolls .............................................. 41
Table 4: Process Capability Metrics Analysis Results ............................................................ 43
Table 5: Bottom Tab Welder Baseline Weld Schedule Used for Validation ............................. 45
Table 6: Bottom Tab Welder Validation Parameter Requirements ......................................... 45
Table 7: Beader System Monitored Parameters Requirements .............................................. 49
Table 8: Beading Process Capabilities Based on Data from 100 Samples ............................... 52
Table 9: Verification Adhesive Dispensing Baseline Parameters ............................................ 54
Table 10: Adhesive Dispensing Verification Parameter Requirements .................................... 54
Table 11: Electrolyte Filling System Monitored Parameters Requirements ............................. 57
Table 12: Top Tab Welder Validation Monitored Parameter Requirement .............................. 60
Table 13: Crimp Process Validation Monitored Parameters Requirements .............................. 64
Table 14: Crimper System Process Capabilities Analysis Results ........................................... 67
Table 15: Battery Test Sequence ....................................................................................... 85
Table 16: RailScout Vehicle Performance Parameters .......................................................... 97
Table 17: RailScout Acceleration Performance Parameters ................................................... 97
Table 18: RailScout Cruising Speed Performance Parameters ............................................... 97
Table 19: Baseline Factors based on California Fleet Average for 2015 Derived Using CARB’s EMFAC2014 Model .......................................................................................................... 101

xi
Table 20: Emission and Fuel Consumption Reduction Estimates for the Field Demonstration (288 miles) for Four Different Baseline Vehicle-Type Scenarios .......................................... 102
Table 21: Estimated Annual Emissions and Fuel Consumption Reduction Benefits of Inspection of All U.S. Railroad Track with Zero Emission RailScout Vehicles ......................................... 103
Table 22: Benefits of Replacing 10 Percent of Existing Gasoline Vehicles with Zero-Emission Vehicles .......................................................................................................................... 104
Table 23: Greenhouse Gas Reduction by Carbon Intensity Method ..................................... 106
Table 24: Ten Year Benefit-Cost Ratio 5,700 Metric Ton (MT) CO2e/Million Dollars ............. 107
Table 25: Labor Reduction Realized from Semi-Automatic Module Assembly ....................... 109
Table 26: Required Frequency of Inspection ..................................................................... 111

xii

1
EXECUTIVE SUMMARY
This project establishes Quallion’s pilot manufacturing line for lithium ion modules for use as building blocks for battery systems in electric vehicle propulsion applications to meet California’s growing demand for clean fuel alternative vehicles. The project leverages Quallion’s extensive intellectual property and technical know-how related to lithium ion batteries with an expanded production capability to achieve consistent and reliable battery modules that can be produced in a reasonable timeframe and with a lower price point for incorporation into battery systems for alternative fuel vehicles.
The Establishment of a Pilot Manufacturing Line for Lithium Ion Modules for Use as Building Blocks for Battery Systems in Electric Vehicle Applications project budget was $6,914,072 from the California Energy Commission with a Quallion match share of $6,950,265 for a total budget of $13,864,337. This project enabled the major construction modification and upgrade of existing facilities for the installation of the equipment needed for the pilot lithium ion module assembly line. This specialized equipment required to fabricate and assemble Li-ion batteries was defined, procured, installed and validated. This capability was used to design, build and test the battery module system for use on potential electric vehicle platform candidates.
Quallion partnered with Land Systems Corporation (formerly Trexa Corporation which CEC funded under Grant ARV-13-005) who provided the prototype RailScout electric vehicle platform onto which a Quallion battery module and battery management system was installed for field evaluation. The objective of the field evaluation was to collect and analyze a minimum of two months of field use data on a target application.
The RailScout electric vehicle has seen field evaluation at a railway test site in Fillmore, California and in New Orleans, Louisiana, on the New Orleans Public Belt Railroad Yard Track #2 adjacent to the Huey P. Long Bridge. The RailScout monitored (via remote control) the condition of a span of tracks over periodic runs during the deployment period at up to the eleven miles per hour maximum speed. Sensors on board the RailScout monitored the condition of the tracks. From the data collected, the battery system performance at different speeds and settings was evaluated. The field evaluation demonstrated the viability of the RailScout electric vehicles as a clean fuel replacement option to the hydrocarbon fueled track inspection vehicles currently in use. Additionally, the field evaluation has provided insight into the Quallion battery system real world operation, helping to identify potential new applications and opportunities to refine design and operational parameters for future optimization consideration.

2

3
CHAPTER 1: Purpose and Approach
Lithium ion batteries are crucial components to electric vehicles, and in conjunction with battery management systems (BMS) electronics, must operate safely and meet the performance needs and pricing targets of electric vehicles. This project demonstrated the advancement in lithium ion battery technology and the capabilities of Quallion designed and built battery modules and BMS to safely meet the needs of a high voltage (>300V) battery system for electric vehicle (EV) applications.
Such advances in lithium ion (Li-ion) BMS technology can help enable widespread deployment of electric vehicles and reduce pollution and greenhouse gas (GHG) emission targets in California.
The Establishment of a Pilot Manufacturing Line for Lithium Ion Modules for Use as Building Blocks for Battery Systems in Electric Vehicle Applications project, together with other related programs including the Expansion of Manufacturing Capacity for High Volume Integration of Battery Management System Electronics into Electric Vehicle Batteries Project under the CEC’s ARV-12-010 Grant, the Title III Phase IV Technology Investment Agreement FA8650-06-2-5514 and the MDA Double Layer Electrode Small Business Innovative Research Contract HQ147-13-C-7131, enhance Quallion’s significant technical experience with lithium ion batteries. These endeavors established a pilot manufacturing line for lithium ion battery systems that yields consistent, reliable modules that can be produced in a reasonable timeframe and a lower price point for incorporation into battery systems for alternative fuel vehicles.
The resulting facilities and equipment enhancements facilitated the design, fabrication and testing of battery modules which were integrated into a prototype EV which was deployed for a field demonstration period of two months. During this demonstration period, data was collected and analyzed to help quantify the long-term performance of the battery system as well as the potential environmental and economic benefits of an EV replacement to its hydrocarbon fueled vehicle counterpart currently in use.
1.1 Project Goals The goals of this project were to establish a guideline and process for a pilot Li-ion module assembly and manufacturing line, and to lay out requirements critical points, and a means to quantify and assess Quallion progress during development of the aforementioned line. The project enhances Quallion’s capacity to produce, and test advanced lithium ion battery systems and to incorporate them into EVs to meet the growing California demand for EV applications. This project leverages Quallion’s extensive intellectual property and technical know-how related to lithium ion batteries with appropriately scaled facilities that expand the company’s production capacity for larger vehicle systems.

4
1.2 Project Objectives Through the execution of this project, Quallion succeeded in achieving the key objectives of this project including:
• Establishing the feasibility of a battery module manufacturing assembly line. • Quantifying the cost-savings of an automated production line. • Determining trade-offs among manufacturing equipment design and cost, module cost,
module performance, system reliability. • Quantifying the environmental benefits of using modules in green technology
applications, such as electric and hybrid vehicles.
5
CHAPTER 2: Battery Design and Function
Chapter 2 provides an overview of the lithium ion battery technology and key cell design parameters and describes the battery’s electrochemistry and how all these elements come into play in the function of a battery as a power source for electric vehicle applications.
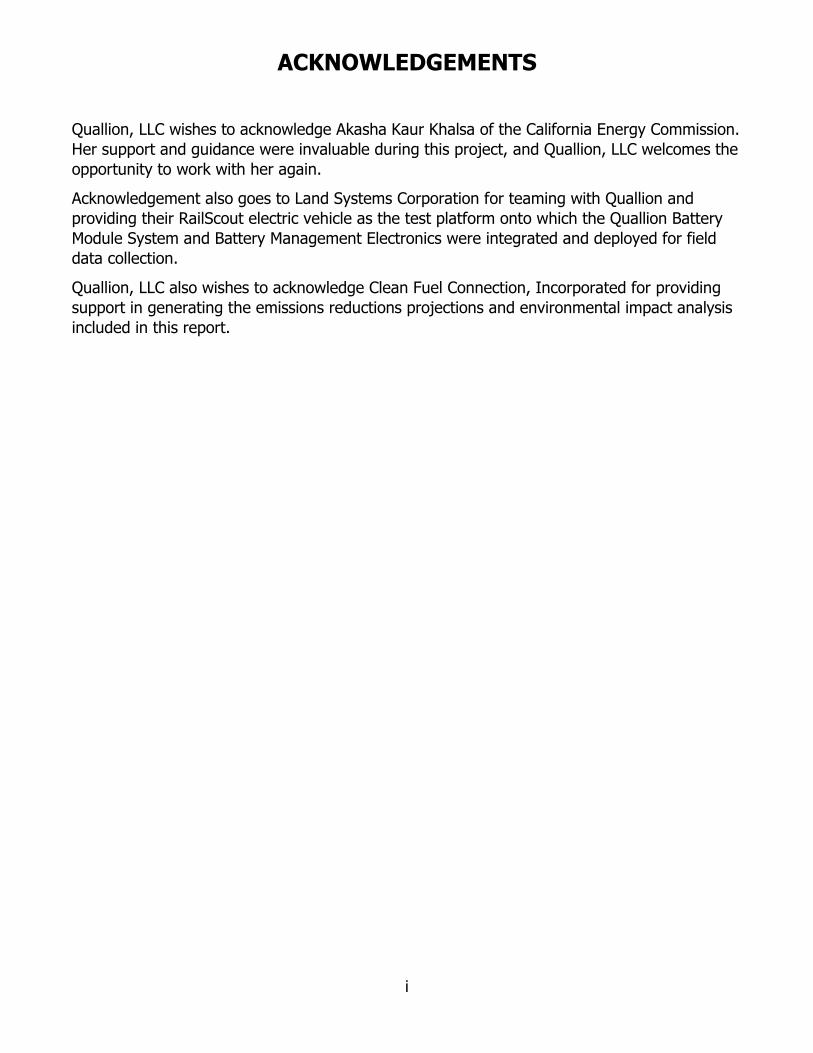
2.1 Lithium Ion Battery Electrochemistry and Function Batteries are devices where electrical energy is generated through the conversion of chemical energy. The chemical conversions occur between the anode and cathode (Figure 1) through a conductive media (electrolyte) and a porous barrier (separator) which keeps the anode and cathode from experiencing a short. The different battery components have different electron and ion conduction requirements, which are shown in Figure 1. This schematic is representative of both primary (non-rechargeable) and secondary (rechargeable) batteries.
Figure 1: Schematic Representation of a Battery
Source: Quallion, LLC staff assessment
There are a number of secondary battery chemistries that are currently in use, including nickel-metal hydride, nickel-cadmium, lead acid, and lithium ion (Li-ion). Today, Li-ion is the leading secondary battery chemistry, particularly for consumer applications. The most attractive feature of Li-ion cells is their inherently high specific energy, 150 kilowatt hours/kg (on average) and higher (Figure 2), which is achieved through utilization of a lightweight charge carrier with high electromotive force. Li-ion cells typically have a higher nominal voltage (3.7 V) when compared to alternative secondary chemistries, which allow for fewer cells to be used to reach the desired pack-level voltage. The high nominal cell voltage also

6
yields a high energy density (≥400 kilowatt hours/L). Nickel-cadmium cells have a specific energy of 40 kilowatt hours/kg and energy density of 100 kilowatt hour/L, while Ni-metal-hydride cells show 75 kilowatt hours/kg and 240 kilowatt hours/L, with a nominal cell voltage of 1.2 V, all which are significantly lower than Li-ion.
Figure 2: Energy Storage Capabilities of Various Secondary Chemistries
Source: Quallion, LLC staff assessment
Li-ion cells operate through “shuttling” of the Li ions between the cathode and anode. The Li ions are inserted between layers in the crystal structure (intercalated) of the cathode active material during discharge and of the negative active material during charge (Figure 3), in this case represented by a metal oxide and graphite for the cathode and anode, respectively. The reduction/oxidation potentials of these active materials are what give Li-ion cells their high nominal voltage, which, in turn, imparts their high specific energy and energy densities.

7
Figure 3: Schematic Representative of a Li-Ion Cell
Source: Quallion, LLC staff
2.1.1 Anode and Cathode Material Consideration One advantage of Li-ion batteries is the choice of a number of different materials (Figure 4) that can be used for the anode and cathode active materials. The various compounds allow for tailoring the chemistry to give optimum performance for a desired application. Currently, a number of metal oxides and carbon-based materials (red shaded areas) are used in commercial applications.

8
Figure 4: Voltage vs. Capacity for Materials in Use or Under Investigation for Li-ion Batteries
Source: Quallion, LLC staff assessment
Additionally, within the various cathode materials, there are performance and costs trade-offs that must be taken into consideration (Figure 5).
Figure 5: Cathode Material Trade-Offs
Source: Quallion, LLC staff assessment
9
Quallion currently manufactures long life cells for medical and aerospace applications utilizing graphite as the anode active material and lithium nickel-cobalt-aluminum oxide as the cathode active material. Nickel-cobalt-aluminum oxide has an excellent balance of specific energy, specific power, and cycle life. The nickel-cobalt-aluminum oxide/Graphite redox couple was chosen for development as part of this project.
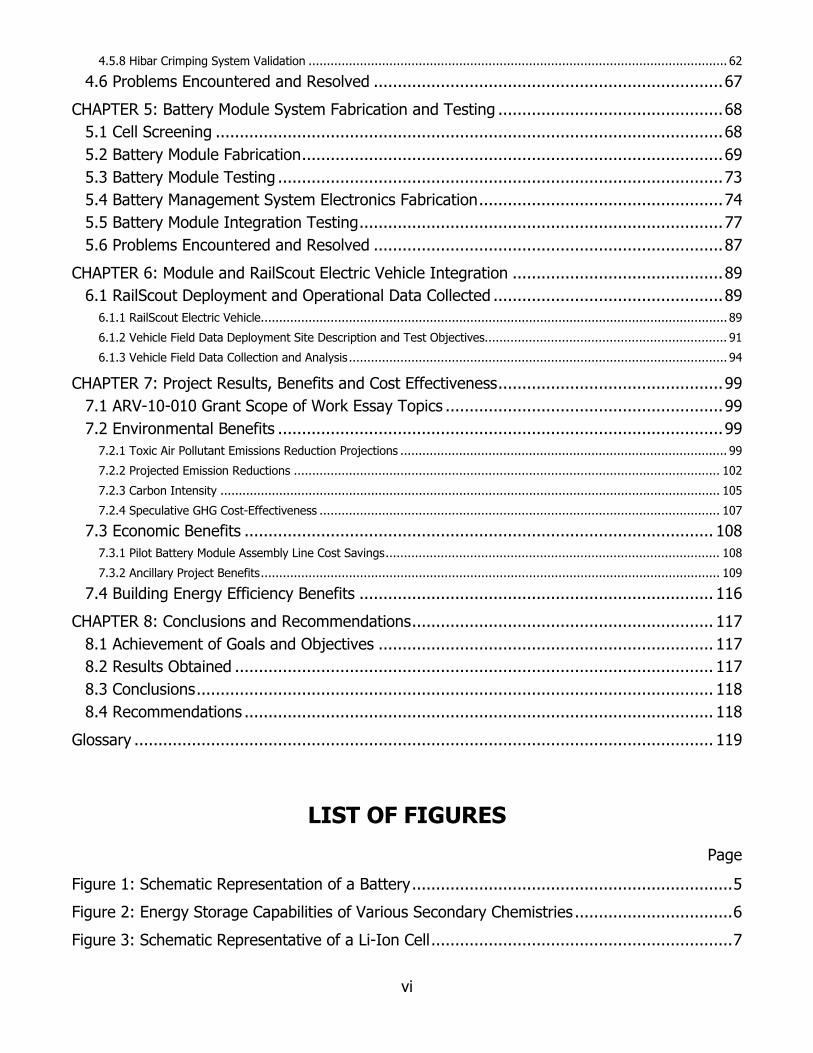
2.1.2 Cylindrical vs Prismatic Cell Design Tradeoffs There are two major form factors used for Li-ion cells—cylindrical and prismatic (Figure 6). Prismatic cells can be manufactured with a metal can (shown in Figure 6) or with a soft laminate aluminum pouch as the case. Within each of these form factors, a number of different sizes and capacities can be manufactured. A common cylindrical form factor used in many consumer applications is 18650-sized cells (referring to 18mm average diameter (18650) and 65mm average length (18650), and the 18650 form factor is the focus of the trade study (Table 1) between cylindrical and prismatic form factors. Based on the various pros and cons assessed, Quallion decided to target an 18650 cell form factor and a modular construction for the battery packs for use in this program as shown in Figure 7.
Figure 6: Schematic of Cylindrical and Prismatic Cell Form Factor
Source: Quallion, LLC staff assessment

10
Table 1: Trade Study of 18650 and Prismatic Cell Design Form Factor Pro Con
18650 (Cylindrical)
• Standard size • High specific energy • Parts mass produced • Manufacturing equipment
readily available • High efficiency manufacturing
is possible • High mechanical stability • Ease in integration in current
Quallion battery pack designs
• Require high quality coatings
• Growing obsolesce for consumer markets
Prismatic
• High cell packing efficiency at pack level
• Very thin designs possible • Extremely high specific energy
and energy density possible
• No standard format • More expensive to
manufacture • Less efficient thermal
management • Swelling concerns • Lower cycle life
Source: Quallion, LLC staff assessment
Figure 7: Battery Cell in 18650 Form Factor and Modular Construction
Photo Credit: Quallion, LLC
11
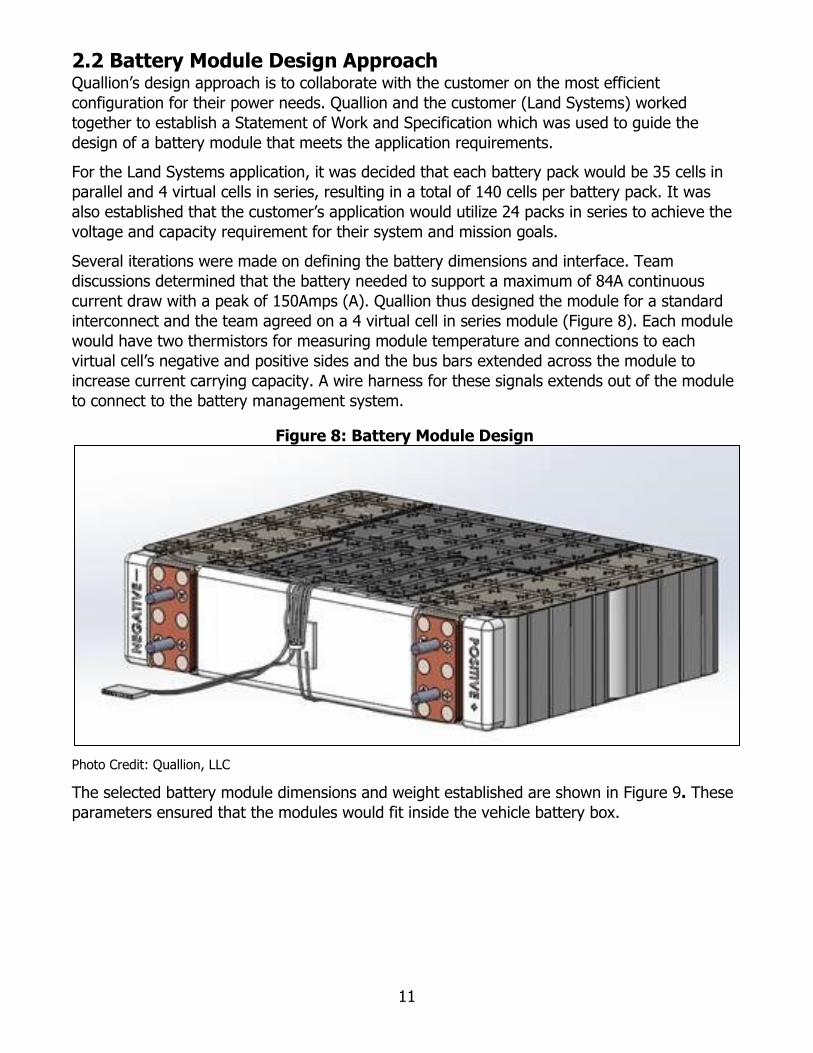
2.2 Battery Module Design Approach Quallion’s design approach is to collaborate with the customer on the most efficient configuration for their power needs. Quallion and the customer (Land Systems) worked together to establish a Statement of Work and Specification which was used to guide the design of a battery module that meets the application requirements.
For the Land Systems application, it was decided that each battery pack would be 35 cells in parallel and 4 virtual cells in series, resulting in a total of 140 cells per battery pack. It was also established that the customer’s application would utilize 24 packs in series to achieve the voltage and capacity requirement for their system and mission goals.
Several iterations were made on defining the battery dimensions and interface. Team discussions determined that the battery needed to support a maximum of 84A continuous current draw with a peak of 150Amps (A). Quallion thus designed the module for a standard interconnect and the team agreed on a 4 virtual cell in series module (Figure 8). Each module would have two thermistors for measuring module temperature and connections to each virtual cell’s negative and positive sides and the bus bars extended across the module to increase current carrying capacity. A wire harness for these signals extends out of the module to connect to the battery management system.
Figure 8: Battery Module Design
Photo Credit: Quallion, LLC
The selected battery module dimensions and weight established are shown in Figure 9. These parameters ensured that the modules would fit inside the vehicle battery box.

12
Figure 9: Battery Module Weight and Dimensions
Photo Credit: Quallion, LLC
2.2.1 Safety Considerations The battery module was designed with safety in mind given the general public’s concern for lithium ion batteries. Quallion’s design took those concerns into consideration and implemented the following safety measures:
The outer portion of the nickel tab of each module was insulated with a Mylar sheet and then covered with a Kapton tape, both materials being excellent electrical insulators. This prevents accidental short from occurring from unintentional contacts with the nickel tabs.
Quallion insured that there was sufficient distance between the positive and negative terminals to reduce the chance of accidental shorting of the module. Additionally, the individual cells are housed in a honeycomb structure of heat absorbing material to provide for localized heat dissipation during battery operation.
Connections to voltages and thermistors enable the battery management system to detect over-voltage, over-current and over-temperature conditions. When a safety issue is detected by the battery management system, the battery is disconnected from the load.
Precautions were taken during vehicle integration to mechanically isolate the battery modules with rubber isolators to minimize vibration and shock effects. The vehicle design allowed for adequate battery module cooling during operation to ensure safe battery operation and long-term reliability.

13
CHAPTER 3: Production Facilities – Dry Room, Formation and Pack Assembly
3.1 Manufacturing and Assembly Facilities Design Prior to undertaking this project, Quallion’s facilities had been primarily focused on the needs of low voltage batteries for medical, military and aerospace applications, such as batteries for implantable devices, satellite batteries and unmanned aerial vehicle batteries. In order to accommodate the increased workload Quallion anticipates from electric vehicle projects and the large high voltage equipment needed to support these projects, major updates to existing facilities were implemented.
A key output of this project was the expansion of Quallion’s capabilities to produce and test advanced lithium ion battery systems and the ability to integrate these modules to meet the growing demands of electric vehicle applications. This project sought to match Quallion’s extensive intellectual property and technical know-how related to lithium ion technology with appropriately scaled facilities that will expand the company’s production capacity for larger vehicle systems.
Quallion identified available space in its existing facility, shown in Figure 10, to house the expanded lithium ion pilot manufacturing line. To facilitate efficient flow of the product during manufacturing, the pilot manufacturing line was designed to be laid out in accordance with the cell manufacturing process.
Figure 10: Site of Lithium Ion Battery Pilot Manufacturing Line in Quallion’s Sylmar, CA Facility
Source: Quallion, LLC staff assessment
14
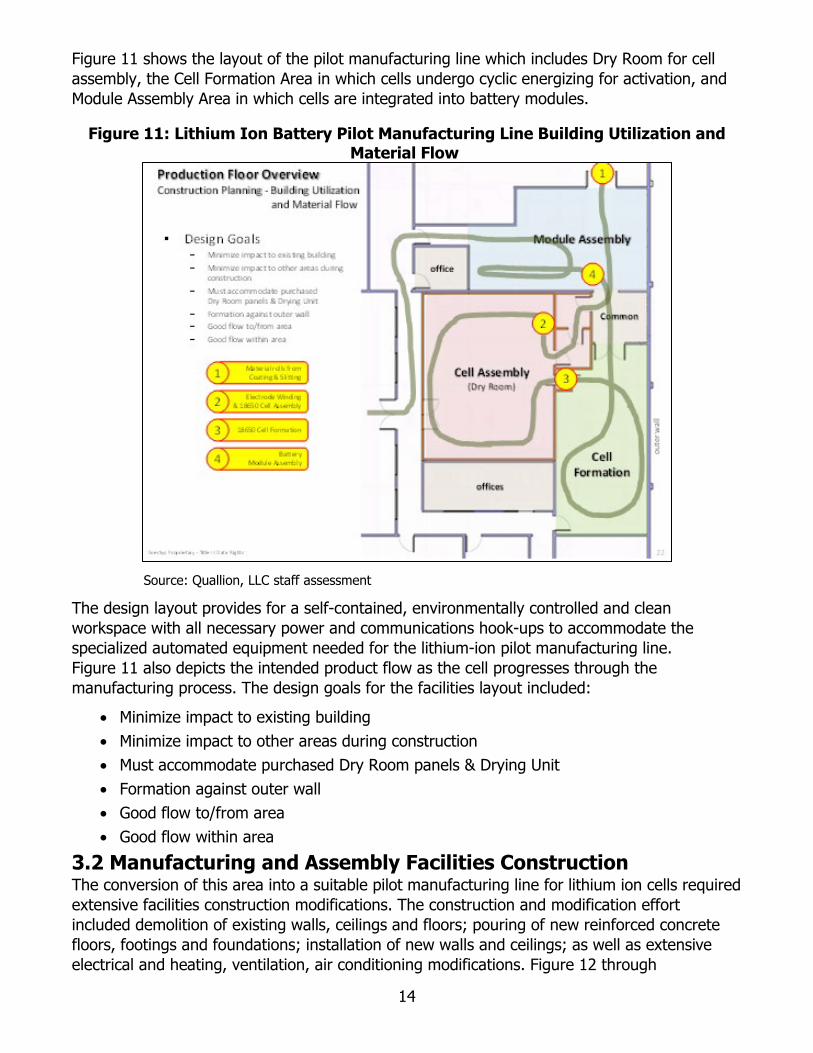
Figure 11 shows the layout of the pilot manufacturing line which includes Dry Room for cell assembly, the Cell Formation Area in which cells undergo cyclic energizing for activation, and Module Assembly Area in which cells are integrated into battery modules.
Figure 11: Lithium Ion Battery Pilot Manufacturing Line Building Utilization and Material Flow
Source: Quallion, LLC staff assessment
The design layout provides for a self-contained, environmentally controlled and clean workspace with all necessary power and communications hook-ups to accommodate the specialized automated equipment needed for the lithium-ion pilot manufacturing line. Figure 11 also depicts the intended product flow as the cell progresses through the manufacturing process. The design goals for the facilities layout included:
• Minimize impact to existing building • Minimize impact to other areas during construction • Must accommodate purchased Dry Room panels & Drying Unit • Formation against outer wall • Good flow to/from area • Good flow within area
3.2 Manufacturing and Assembly Facilities Construction The conversion of this area into a suitable pilot manufacturing line for lithium ion cells required extensive facilities construction modifications. The construction and modification effort included demolition of existing walls, ceilings and floors; pouring of new reinforced concrete floors, footings and foundations; installation of new walls and ceilings; as well as extensive electrical and heating, ventilation, air conditioning modifications. Figure 12 through

15
Figure 15 depict the major construction and facility upgrades that were performed for the pilot manufacturing line under this project. All construction was in accordance with applicable Los Angeles, California Building Codes with appropriate inspections performed and Building Permits secured throughout the construction process.
Figure 12: New Concrete Floor Construction in Pilot Manufacturing Line Site
Photo Credit: Quallion, LLC
Figure 13: New Concrete Floor and Wall Construction in Pilot Manufacturing Line Site
Photo Credit: Quallion, LLC

16
Figure 14: New Drywall Construction in Pilot Manufacturing Line Site
Photo Credit: Quallion, LLC
Figure 15: Upgrades to Building Air and Access Hallways to Meet California Building Codes
Photo Credit: Quallion, LLC

17
Unique to the Li-ion manufacturing process is the Dry Room which provides the required clean and environmentally controlled facilities needed to produce cells consistently to the necessary quality and performance standards. To satisfy the requirement for an environmentally controlled Dry Room, a dehumidifier as shown in Figure 16 was procured.
Figure 16: Dehumidifier Equipment and Electrical Modifications for Dry Room
Photo Credit: Quallion, LLC
Installation of the humidifier required extensive electrical and structural modifications to the building including column supports anchored to the foundation as shown in Figure 17 and the dehumidifier mounting platform on the roof as shown in Figure 18.

18
Figure 17: Dehumidifier Equipment Installation Structural Upgrades
Photo Credit: Quallion, LLC
Figure 18: Dehumidifier Equipment Mounting Platform Construction
Photo Credit: Quallion, LLC

19
While some schedule delays were encountered, the construction effort was successfully completed with all design goals achieved. Figure 19 shows the completed Dry Room ready for installation of the cell automated manufacturing equipment and Figure 20 shows the dehumidifier installed on the roof and ready for operation.
Figure 19: Completed Dry Room Ready for Equipment Installation
Photo Credit: Quallion, LLC

20
Figure 20: Dehumidifier as Installed on Roof
Photo Credit: Quallion, LLC
3.3 Problems Encountered and Resolved Given that the construction effort was quite extensive and involved a broad range of construction trades, the services of a dedicated construction manager was required to oversee the entire project, manage the various subcontractors and secure the appropriate construction permits as the construction effort progressed. Unfortunately, due to a variety of reasons, the project saw two outside construction managers specifically hired for the project come and go. This resulted in a discontinuity in the planning and coordination effort which in turn caused program delays. The issue was resolved by allocating dedicated internal facilities personnel to complete the construction coordination. This provided improved oversight and control. While this addressed the immediate issues, schedule delays were nonetheless encountered. The resulting program schedule delay was resolved with the acceptance by CEC of Quallion’s request for a no cost schedule extension as executed by Grant Amendment 3 to the contract.
The high expense of the required dehumidifier exceeded original estimates and would have required reallocation of budgets from other equipment, negatively impacting the program. This was resolved by the purchase of a used dehumidifier which brought the cost more in line with the original estimates. The dehumidifier required only minor maintenance and tune-up to bring it to the operational readiness level required.

21
The requirement for prevailing wages increased construction labor rates and resulted in quotes higher than the original estimates. To resolve this, Quallion performed value engineering to better match requirements to available budgets. Requirements tradeoffs included line throughput capabilities, data collection needs, and physical size constraints. Additionally, Quallion sought out multiple vendor quotes which offered a wider variety of option combinations that were reviewed and down selected against available budgets.

22
CHAPTER 4: Automated Manufacturing Equipment
The sections that follow describe the requirements for the customized automated equipment that was specified, procured, installed and validated to support the lithium-ion pilot manufacturing line.
4.1 Equipment Specifications Quallion researched and defined the equipment required to fabricate and assemble 18650 lithium ion batteries. The cell assembly process includes all the operations that are performed from winding of the jellyroll to formation of the finished cell. While several of the processes remain manual operations, the majority were sourced to be automated. Under this project, automated equipment was developed and installed to perform the following operations:
• Winding the jellyroll, including anode and cathode tab welding and taping, center reforming and mega-ohm test
• Resistance welding the anode tab to the bottom of the case • Beading/Grooving the top of the case • Appling adhesive to the inside groove • Filling the cell with electrolyte • Ultrasonic welding and taping the cathode tab to cap assembly • Crimping the cell closed
Throughout several iterations and discussions with suppliers regarding equipment design and functional layout of each system, Quallion structured the assembly process into an electrode winding operation and 6 integrated stations, arranged into 3 subgroups, to perform the remaining operations. Each subgroup communicated with a common control panel and electrical interface. In order to optimize available space, all power, air and communication lines were directed from the top of each equipment station to the ceiling. Quallion also added ingoing and outgoing countertops to each station to provide additional desk space for work in progress. Figure 21 shows the resulting floor plan of the dry room, including the winding machine for jellyroll production and the six stations for processing the jellyroll into a completed battery cell. Also shown are the drying ovens and quality control workstations. Depicted by the arrows in Figure 21 is the product flow as material is processed through each of the workstations. The product flow begins with rolls of dielectric material coming into the winder for the production of jelly rolls and the natural progression of the product as it is processed to increasingly higher levels of cell assembly, testing and inspection, with the ultimate product output being a completed battery cell ready for formation.
Suppliers experienced with automated cell manufacturing equipment were identified to design and manufacture the necessary equipment per the mutually developed procurement specifications. The manufacturer selected for the Winder was Kaido from Japan, and the other 6 stations were manufactured by the Canadian firm, Hibar.

23
Figure 21: Equipment Functional Design & Product Flow
Source: Quallion, LLC staff assessment
4.1.1 Kaido Winder The automated winding machine shown in Figure 22 produces complete and tested 18650-size jellyrolls by combining all necessary parts, performing the necessary tab welding and taping functions, and executing the final mega-ohm test.
Figure 22: Kaido Winder
Photo Credit: Quallion, LLC

24
All raw materials (positive and negative electrodes, tabs, separator film, and covering and sealing tapes) mount on spools that are fed into the machine from each end in a continuous ribbon. Separator film feeds into the machine from above and below, interweaving with the positive and negative electrodes at the jellyroll winding location near the center of the machine.
The winder consists of the following basic elements:
• Welders – Ultrasonic welders join tab material to the uncoated sections of the electrode foil.
• Taping mechanisms – Tapes are applied automatically to cover the welded tabs and to seal the finished jellyroll.
• Cutting mechanisms – Various cutters located throughout the machine cut the raw materials into appropriately sized pieces.
• Clamping mechanisms – Clamps are activated when certain operations require the material to be held steady.
• Rollers – Active rollers, which are motorized, help transport materials within the machine or control tension in the material. Most rollers are passive, having no driving mechanism, and serve only to provide a longer path and hold more material within the machine.
• Sensors – located throughout the machine; sensors detect the position of materials, check for missing materials, provide feedback to other parts of the machine, and provide warnings and error conditions messages to the operator in the form of indicator lamps, or messages on the display panel.
• Insertion mechanisms – These are used to grip or pull various materials to position them for pending operations.
The winding mechanism, located at the center of the machine and consisting of three individual spindles, grasps the positive and negative electrodes and the two layers of separator film. It then rotates a specified number of turns to create a jellyroll. The entire winding mechanism (three individual spindles) then rotates to the next position, where tape is applied to prevent the roll from unwinding. Finally, it rotates to the third position, where a robotic arm removes the jellyroll from the winding unit and places it on a conveyor belt in preparation for the next operation. Figure 23 shows the resulting jelly roll output product from the winder.

25
Figure 23: Jelly Roll Output from Winder
Source: Quallion, LLC
Figure 24 shows the main components of the Kaido automated jellyroll winding machine, as viewed from the front.
Figure 24: Main Components of the Kaido Automated Jelly Roll Winding Machine, Viewed from the Front
Source: Quallion, LLC

26
4.1.2 Hibar Equipment The sections that follow provide an overview of each of the fabrication modules which constitute the remaining six stations consisting of the Hibar cell production equipment. 4.1.2.1 Module 1: Bottom Tab Welding System During the cell assembly process, once a jellyroll is received from the winding machine, it is manually prepared before entering the bottom tab welding station. An insulator is installed on the bottom of the jellyroll and the negative tabs are folded down around the insulator as shown in Figure 25.
Figure 25: Hardware Processing in Preparation for Bottom Tab Welding
Source: Quallion, LLC staff assessment
The jellyroll assembly is then inserted into its outer case and manually loaded into the bottom tab welding station as shown in Figure 26. Once the operator triggers cycle start, the equipment access door closes and the negative tabs are resistance welded to the bottom of the case.

27
Figure 26: Jelly Roll Insertion into Case and Loading into Bottom Tab Welding Station for Resistance Welding of Bottom Tab to Case
Photo Credit: Quallion, LLC
4.1.2.2 Module 2: Beading/Grooving System After the bottom tab is welded, a center pin and top insulator is installed in the assembly (as shown in Figure 27) for the beading process.

28
Figure 27: Center Pin and Top Insulator Installation Prior to Loading into Beading/Grooving Station
Source: Quallion, LLC staff assessment
The case and jellyroll assembly is manually inserted into the collet of the beading station. Once the operator triggers cycle start, the equipment access door closes and the case are beaded along the top of the case. Figure 28 illustrates the resulting beading/grooving processing on the cell outer case that the Beading/Grooving Station performs.
Figure 28: Cell Housing Processing Results from the Beading/Grooving Station
Photo Credit: Quallion, LLC

29
4.1.2.3 Module 3: Sealant Dispensing System After the cell has been beaded, it is manually inserted into the collet of the sealant dispensing station. Once the operator triggers cycle start, the equipment access door closes and the sealant is applied to the groove of the case. Figure 29 shows the pre and post sealant processing resulting in a uniform and continuous fillet of sealant applied between the top insulator and cell case.
Figure 29: Cell Processing for Sealant Application by the Sealant Dispensing Station
Photo Credit: Quallion, LLC
4.1.2.4 Module 4: Electrolyte Filling System After the sealant has been applied to the cell, it undergoes curing in a vacuum oven before proceeding with the assembly. Figure 30 shows the cells loaded into 5-up carriers in preparation for processing by the Filling Station.

30
Figure 30: Cells Loaded into 5-up Carriers in Preparation for Processing by the Filling Station
Photo Credit: Quallion, LLC
The carriers are then inserted into the filling machine as illustrated in Figure 31. Once the operator triggers cycle start, each cell undergoes the electrolyte filling process, including pre and post filled weighing.
Figure 31: Cells Loaded into 5-up Carriers for Processing by the Filling Machine
Photo Credit: Quallion, LLC

31
4.1.2.5 Module 5: Top Tab Welding and Taping System After the cells have been filled, they are prepared for top tab welding (see Figure 32).
Figure 32: Installation of Cap Assembly onto Cell Assembly prior to Processing by the Top Tab Welding and Taping Station
Source: Quallion, LLC staff assessment
The operator will manually install the cells and cap assemblies into the rotary stage fixture of the station. Once the operator triggers cycle start, the equipment access door closes and the cell assembly will be ultrasonically welded together, and tape is applied over the welded area as illustrated in Figure 33.
Figure 33: Cell Processing for Ultrasonic Welding of Top Tab and Tape Application by the Top Tab Welding and Taping Station
Photo Credit: Quallion, LLC
32
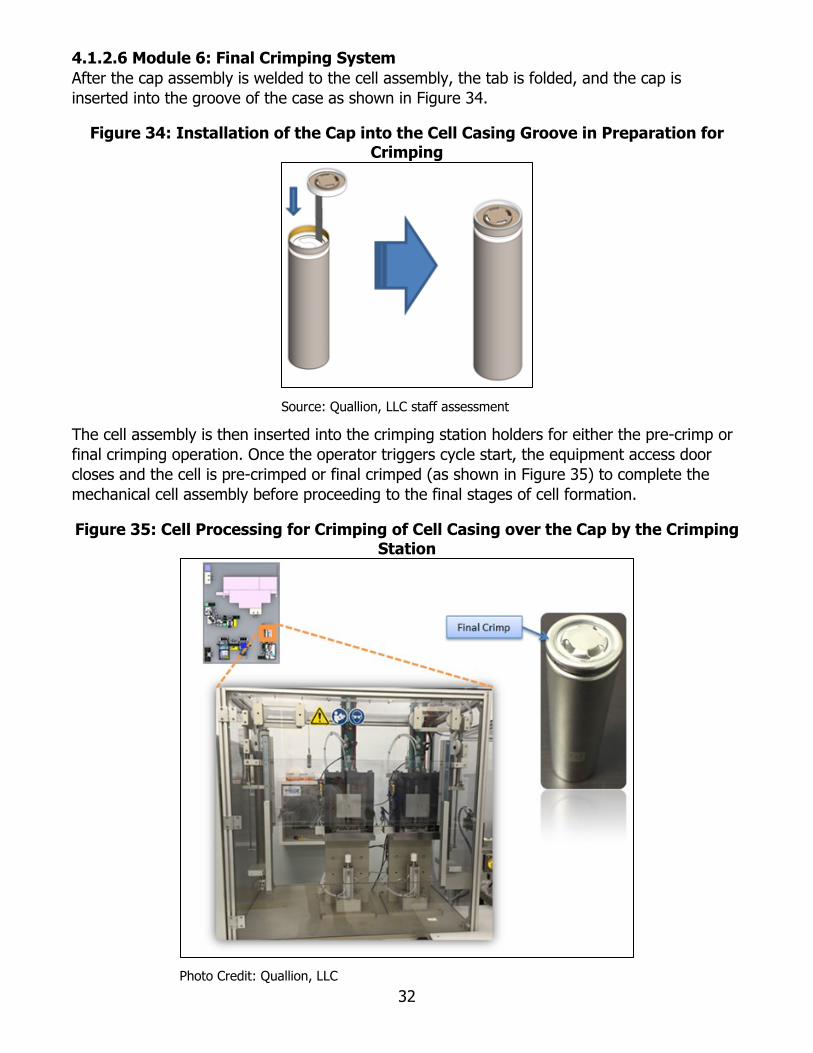
4.1.2.6 Module 6: Final Crimping System After the cap assembly is welded to the cell assembly, the tab is folded, and the cap is inserted into the groove of the case as shown in Figure 34.
Figure 34: Installation of the Cap into the Cell Casing Groove in Preparation for Crimping
Source: Quallion, LLC staff assessment
The cell assembly is then inserted into the crimping station holders for either the pre-crimp or final crimping operation. Once the operator triggers cycle start, the equipment access door closes and the cell is pre-crimped or final crimped (as shown in Figure 35) to complete the mechanical cell assembly before proceeding to the final stages of cell formation.
Figure 35: Cell Processing for Crimping of Cell Casing over the Cap by the Crimping Station
Photo Credit: Quallion, LLC
33
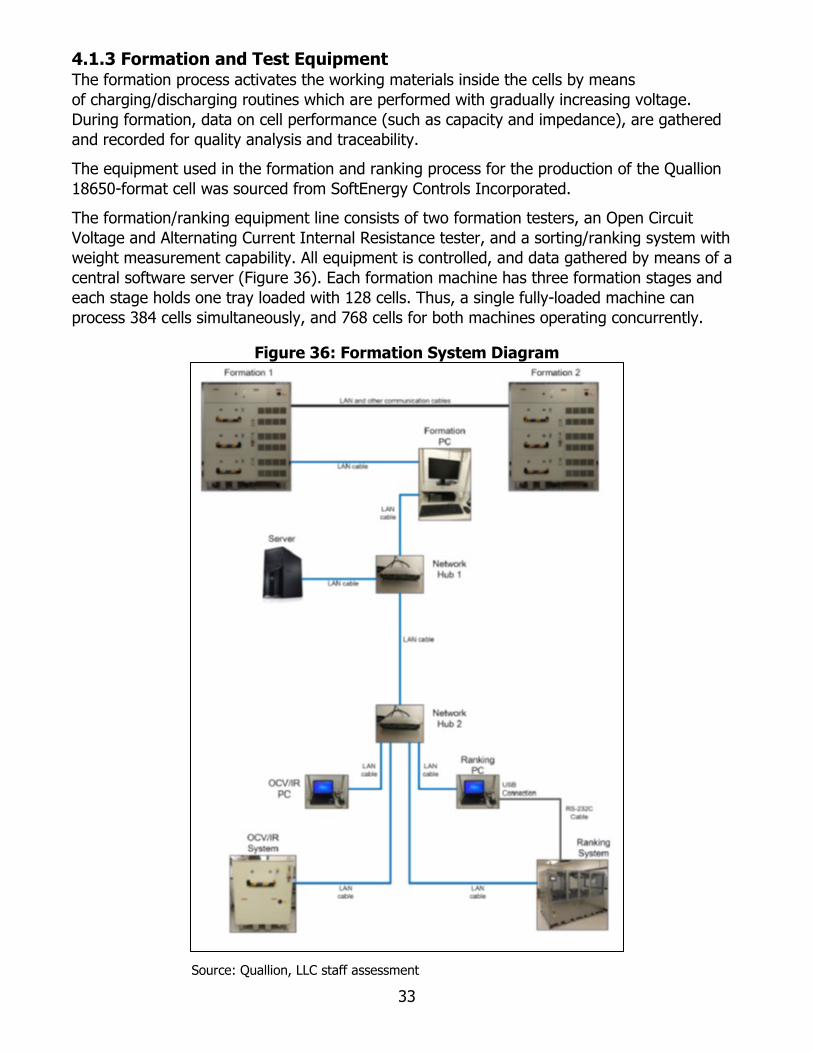
4.1.3 Formation and Test Equipment The formation process activates the working materials inside the cells by means of charging/discharging routines which are performed with gradually increasing voltage. During formation, data on cell performance (such as capacity and impedance), are gathered and recorded for quality analysis and traceability.
The equipment used in the formation and ranking process for the production of the Quallion 18650-format cell was sourced from SoftEnergy Controls Incorporated.
The formation/ranking equipment line consists of two formation testers, an Open Circuit Voltage and Alternating Current Internal Resistance tester, and a sorting/ranking system with weight measurement capability. All equipment is controlled, and data gathered by means of a central software server (Figure 36). Each formation machine has three formation stages and each stage holds one tray loaded with 128 cells. Thus, a single fully-loaded machine can process 384 cells simultaneously, and 768 cells for both machines operating concurrently.
Figure 36: Formation System Diagram
Source: Quallion, LLC staff assessment

34
The Open Circuit Voltage and Alternating Current Internal Resistance machine (Figure 37) performs automated testing of Open Circuit Voltage and Alternating Current Internal Resistance on trays of 18650 cells. The high-speed automated process tests all 128 cells in a tray in approximately four minutes. This machine can be used as a stand-alone piece of test equipment when required.
A tray of cells is loaded into the machine using a loading cart. At the beginning of the Open Circuit Voltage and Alternating Current Internal Resistance sequence, the tray is raised into the operating position, causing each cell to make contact with spring-loaded pins within the machine. The cells maintain contact with the pins for the duration of the Open Circuit Voltage and Alternating Current Internal Resistance tests. Once testing is complete, the tray returns to its initial (lower) position and is ready for removal. A barcode system tracks the location and Open Circuit Voltage and Alternating Current Internal Resistance parameters of each cell within the tray. This information is then stored in the central database and used later by the Ranking system.
Figure 37: Open Circuit Voltage and Alternating Current Internal Resistance Machine & Loading Cart
Photo Credit: Quallion, LLC
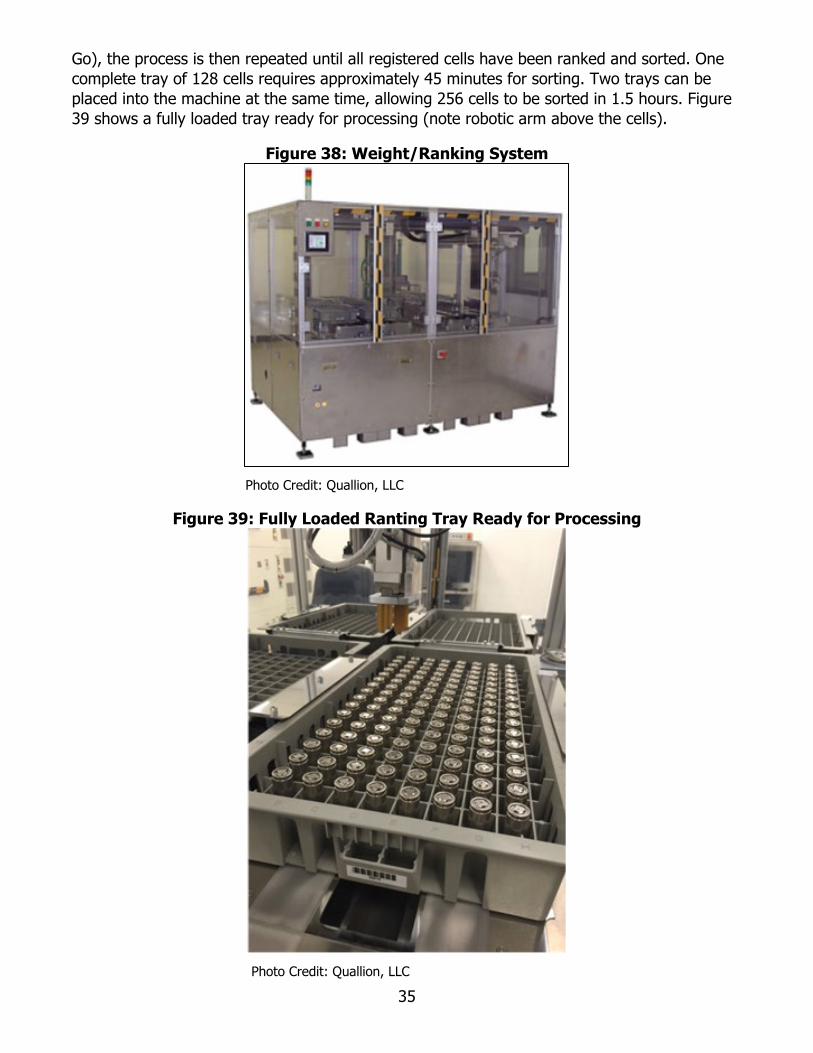
The Weight/Ranking machine (Figure 38) performs automated sorting of 18650 cells based on each cell’s formation, Open Circuit Voltage and Alternating Current Internal Resistance, and weight data. Sorting based on rank is the final step in a three-step process in conjunction with the Formation and Open Circuit Voltage and Alternating Current Internal Resistance machines. Up to five different ranks can be established; each rank is assigned to a unique tray, with a sixth tray, the No-Go tray, dedicated to any cells that fall outside the established ranks. Automated sorting is done by a robotic arm that picks up each cell from its tray and places it into the weight measurement system; once this step is complete, the central server ranks the cell immediately and the robotic arm places the cell in the corresponding tray (rank 1-5 or No-
35
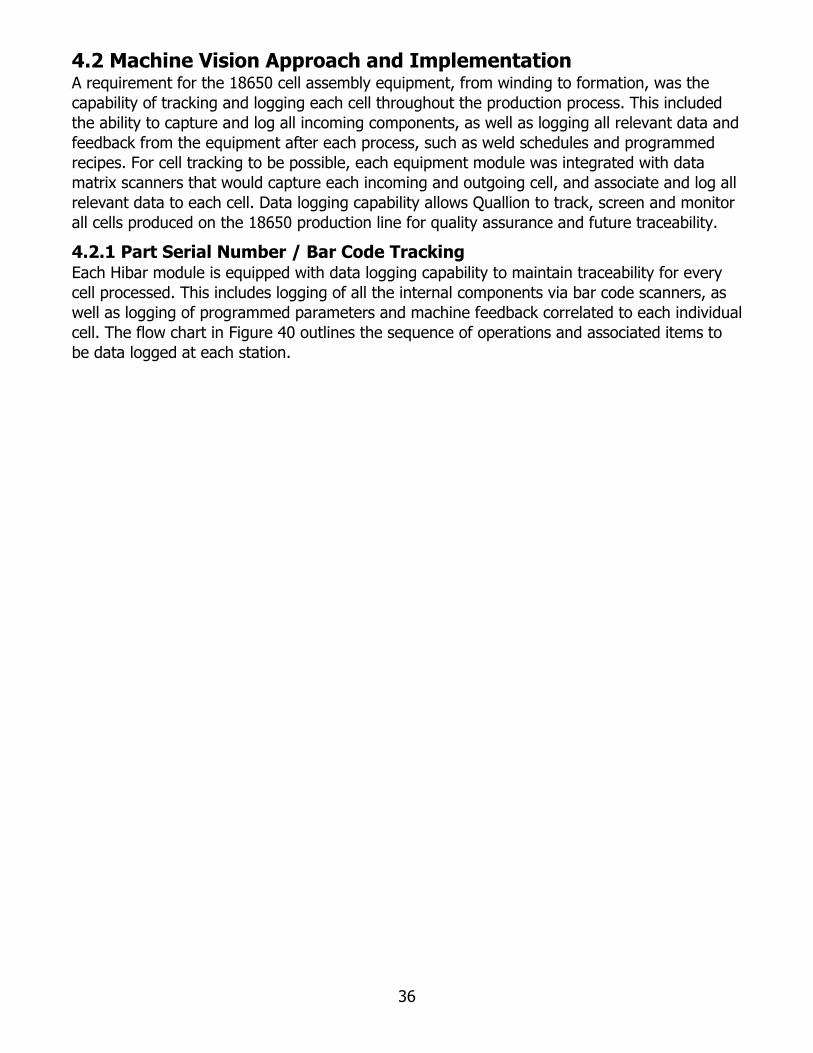
Go), the process is then repeated until all registered cells have been ranked and sorted. One complete tray of 128 cells requires approximately 45 minutes for sorting. Two trays can be placed into the machine at the same time, allowing 256 cells to be sorted in 1.5 hours. Figure 39 shows a fully loaded tray ready for processing (note robotic arm above the cells).
Figure 38: Weight/Ranking System
Photo Credit: Quallion, LLC
Figure 39: Fully Loaded Ranting Tray Ready for Processing
Photo Credit: Quallion, LLC
36
4.2 Machine Vision Approach and Implementation A requirement for the 18650 cell assembly equipment, from winding to formation, was the capability of tracking and logging each cell throughout the production process. This included the ability to capture and log all incoming components, as well as logging all relevant data and feedback from the equipment after each process, such as weld schedules and programmed recipes. For cell tracking to be possible, each equipment module was integrated with data matrix scanners that would capture each incoming and outgoing cell, and associate and log all relevant data to each cell. Data logging capability allows Quallion to track, screen and monitor all cells produced on the 18650 production line for quality assurance and future traceability.
4.2.1 Part Serial Number / Bar Code Tracking Each Hibar module is equipped with data logging capability to maintain traceability for every cell processed. This includes logging of all the internal components via bar code scanners, as well as logging of programmed parameters and machine feedback correlated to each individual cell. The flow chart in Figure 40 outlines the sequence of operations and associated items to be data logged at each station.

37
Figure 40: Cell Assembly Process Flow Chart
Source: Quallion, LLC staff assessment
38
4.3 Manufacturing Equipment Installation Once manufacturing of the equipment was completed by Kaido and Hibar, acceptance testing was performed at the respective supplier facility for each system prior to shipping to Quallion. The same acceptance testing was repeated once the equipment was delivered and installed. The acceptance testing of each piece of equipment was guided by very detailed checklists which outlined the specific parameter to be evaluated per the applicable equipment requirements, the sample size of product needed for each equipment output and the acceptance criteria. The acceptance testing, while very labor intensive, was crucial to ensure that the equipment would perform per the requirements in a consistent and reliable manner. The acceptance testing was jointly performed by a Quallion and supplier team at each location, thus ensuring consistent results.
The cell assembly equipment from Hibar arrived at Quallion on May 26, 2015. Each system was situated and mounted in the dry room according to the original layout as previously shown in Figure 21. All applicable power, ventilation, exhaust, and utility hookups which were previously defined for each piece of equipment were installed and checked to verify operational readiness.
All the equipment from the selected suppliers, Kaido and Hibar, for the automated cell assembly of the 18650 cell was successfully installed and accepted. All items on each acceptance checklist were verified and deemed acceptable. Each station has been proven to operate consistently and perform all the expected operations needed to fabricate a complete 18650 cell, and thus demonstrate a production readiness capability for 18650 cells.
4.4 Operator Training As part of Quallion’s standard practices, all operators are required to complete formal training on several universal quality, inspection and data collection procedures, as well as, any specific assembly procedures that apply to the processes they may be performing.
During the installation of the Kaido winder and each Hibar equipment module, the Machine Instructions, Travelers, and Assembly Procedures as outlined in Table 2 were created and released by a Quallion technical writer and reflects the documentation required for the production of the 18650 cell assembly on the pilot production line equipment.

39
Table 2: Documentation Generated and Released for the Manufacturing of 18650 Cells
DOCUMENT TITLE DOCUMENT # Formation, CEC, Automated MI 278 Open Circuit Voltage and Alternating Current Internal Resistance, CEC, Automated MI 279
Cell Sorting, CEC, Automated MI 280 Bottom Tab Welder, Beader, & Sealant Applicator MI 291 Electrolyte Filler, Automated 18650 Cells MI 292 Top Tab Welder/Taper, Crimper, Automated 18650 Cells MI 293 Winder, Automated, 18650 Cells MI 284 Jellyroll Winding, Automated, 18650 TR 807 Final Assembly, Automated 18650 Cells TR 810 Jellyroll Winding, Automated, 18650 AP 740 Final Assembly, Automated 18650 Cells AP 742
Source: Quallion, LLC staff assessment
Manufacturing details from these documents were incorporated into the Kaido and Hibar equipment validation plans. Within the validation as well as during the equipment operation qualification, three operators were thoroughly trained on each relevant document associated with the processes they were designated to perform during production. Each operator successfully completed the training (as provided by the respective equipment supplier) and demonstrated acceptable proficiency during the manufacturing of each 18650 cell processed during the performance of the qualification of the equipment.
4.5 Manufacturing Equipment Validation Once acceptance testing was complete on the Kaido winder and each Hibar equipment module, a performance validation was performed for each cell build process. The validation ensured that each equipment module would consistently meet the specifications and requirements as specified for the Kaido winder and each piece of Hibar equipment. The Hibar equipment has 6 modules divided into 3 control panels that Hibar integrated to construct an automated line of equipment to perform all the operations of the 18650 cell assembly from post winding to pre-formation. This includes resistance welding the bottom negative tab to the case, grooving the assembly, applying sealant to the groove, electrolyte filling, ultrasonic welding the positive tab to cap tab and crimping the final assembly. The equipment is arranged and grouped in the dry room as illustrated in Figure 41. Control Panel 1 regulates the operations which include the bottom tab welder, beader and sealant applicator. Control Panel 2 regulates the electrolyte filling machine. Control Panel 3 regulates the top tab and taping station and the crimping station.

40
Figure 41: Dry Room Layout
Source: Quallion, LLC staff assessment
4.5.1 Kaido Winder Validation This validation is for each operation performed by the automated winder. This includes the winding of the jelly roll, positive and negative tab welding to the positive and negative electrode substrates, taping of the tabs and jellyroll winding, cutting the separator and electrodes to length, center reforming and hi-pot testing.
Figure 42 depicts the Winder Jelly Roll production processes and shows the associated parts that constitute the completed jellyroll.
Figure 42: Jelly Roll Production Process
Source: Quallion, LLC staff assessment

41
The Performance Validation for the Kaido Automated Winder system consisted of processing 100 samples through the equipment using the parameters established during operation qualification testing and monitoring all dimensional characteristics as required in the assembly drawing for the 18650 jellyroll.
The parameter dimensions of the jellyroll monitored for validating the Kaido Winder are shown in Table 3: Validation Specifications for Kaido Winder Jelly Rolls.
Table 3: Validation Specifications for Kaido Winder Jelly Rolls
Designation Specification Dimension Type
Jellyroll Weight 26.6±0.8g Monitored Jellyroll Diameter 17.0±0.4mm Monitored Jellyroll Length 60.2±0.2mm Monitored Tab Alignment (Negative) ≤11 Monitored Tab Extension (Negative) 13.25±2.0mm Monitored Tab Extension (Positive) 19.5±2.0mm Monitored Pull Test Strength (Inner Negative) 25N Minimum Monitored Pull Test Strength (Outer Negative) 25N Minimum Monitored Pull Test Strength (Positive) 25N Minimum Monitored
Source: Quallion, LLC staff assessment
All 100 samples produced for this validation effort passed visual inspection per established acceptance criteria and were within the established specification limits. A complete data set of the recorded measurements from the 100 samples was included in the Equipment Validation Report previously submitted under Task 4 of ARV-10-010 Statement of Work.
Data analysis was performed using the Mini Tab Statistical Software tool. Process capability was established for each process output. The parameters evaluated included:
• Diameter, Length • Tab Alignment • Negative Tab Extension • Positive Tab Extension • Tab Pull Strength: Inner Negative • Tab Pull Strength: Outer Negative • Tab Pull Strength: Positive
An example of the resulting capability analysis is shown in Figure 43 which shows the data distribution for the measured weights of the 100 jellyroll samples wound to help establish the process capability metrics (Cp) and process capability index (Cpk) for each of the respective processes.

42
Figure 43: Jellyroll Weight Process Capability Analysis Results
Source: Quallion, LLC staff assessment
Similar process capability analysis was performed on the Winder for the other jellyroll parameters noted above and the results were included in the Equipment Validation Report previously submitted under Task 4 of Grant ARV-10-010 Statement of Work.
Table 4 summarizes the process capability results for each of the Kaido Winder Jelly Roll validation parameter dimensions. Process Capability Analysis determines whether a process is capable of meeting product specifications. Cp compares the design tolerance range with the process range in a ratio format. If Cp =1, the process is just capable. If Cp< 1, the process is deemed incapable of performing its function reliably. If Cp is >1, the process is capable. Cpk determines whether the mean of the process is centered between the specification limits. If Cpk <1, the mean is off-center, and defects will occur. If Cpk >1, the mean may be off-center, but it is still capable of meeting product specs.
Based on the capability metrics analysis, the automated jellyroll winding process was determined to be capable of producing assemblies with an expected minimum yield of 82.63 percent for Negative Tab Alignment and a maximum of 99.99 percent for Negative Tab Extension and Positive Tab Pull Strengths.

43
Table 4: Process Capability Metrics Analysis Results
Dimension Cp Cpk Percentage Yield
Jellyroll Weight 1.13 1.12 99.92% Jellyroll Diameter 1.18 1.09 99.88% Jellyroll Length 1.27 1.17 99.94% Tab Alignment (Negative) 1.53 0.58 82.63% Tab Extension (Negative) 1.42 1.41 99.99% Tab Extension (Positive) 1.22 1.21 99.97% Pull Test Strength (Inner Negative) 1.56 0.88 87.76% Pull Test Strength (Outer Negative) 1.11 0.85 84.77% Pull Test Strength (Positive) 12.16 2.76 99.99%
Source: Quallion, LLC staff assessment
All samples produced during the performance qualification passed visual inspection and met all the required acceptance criteria. The Kaido Winding System was deemed validated and ready for production.
4.5.2 Hibar Resistance Welding Module Validation The next process capability assessment performed was for the bottom tab resistance welding process. During the cell assembly process, once a jellyroll is received from the winding machine it is manually prepared before entering the bottom tab welding station.
This validation verified the resistance welding module of the Hibar assembly line of equipment. The resistance welding module is designed to connect the 2 negative nickel tabs of the jellyroll to the bottom of the case. This module is part of the “Control Panel 1” set of equipment and is considered part of a complete system for installation qualification. Testing was performed to evaluate the consistency and capability of this equipment.
The flow diagram of Figure 44 illustrates where the Hibar Bottom Tab Welder is used in the overall production process. Also noted in the process flow are the respective component part numbers that come together to form the cell assembly at this level.

44
Figure 44: Cell Assembly Process Flow Diagram Highlighting the Tab Welding Process Step
Source: Quallion, LLC staff assessment
The overall process to resistance weld the negative nickel tabs of the jellyroll to the bottom of the case includes several manual operations before performing the welding operation. The operator takes a jellyroll assembly and places an undercover insulator over the negative tabs and then bends the tabs over each other across the center of the jellyroll. This assembly is then inserted into a case to be resistance welded.
The Performance Validation for the Hibar Bottom Tab Welding system involved processing 100 samples consisting of tabs welded onto cell case bottom covers through the equipment using the parameters established during acceptance testing and monitoring weld pull strength. Figure 45 shows a cell bottom cover with tabs welded in place.

45
Figure 45: Cell Case Bottom with Tabs Welded in Place
Photo Credit: Quallion, LLC
The baseline weld schedule used for consistency testing is shown in Table 5 and the validation parameter that was to be monitored is shown in Table 6.
Table 5: Bottom Tab Welder Baseline Weld Schedule Used for Validation
Squeeze
Pulse 1 Cool
Pulse 2 Hold
Up Weld Down Up Weld Down 0.400 kiloamps 1.700 kiloamps
Ms 150 0.3 0.6 0.2 0.5 0.8 0.5 0.8 050
Source: Quallion, LLC staff assessment
Table 6: Bottom Tab Welder Validation Parameter Requirements Designation Specification Dimension Type Pull Test ≥7.5N Monitored
Source: Quallion, LLC staff assessment
For validation, one hundred (100) samples were welded per the above guidelines. All samples produced passed visual inspection per the established criteria and were within the established specification limits.
To verify that the samples met the tab pull strength required for successful validation, pull tests were conducted on each of the 100 samples. Figure 46 shows a welded sample undergoing tension testing to verify tab pull strength22. A complete data set of the recorded tension test results for the 100 validation samples was included in the Equipment Validation Report previously submitted under Task 4 of Grant ARV-10-010 Statement of Work.
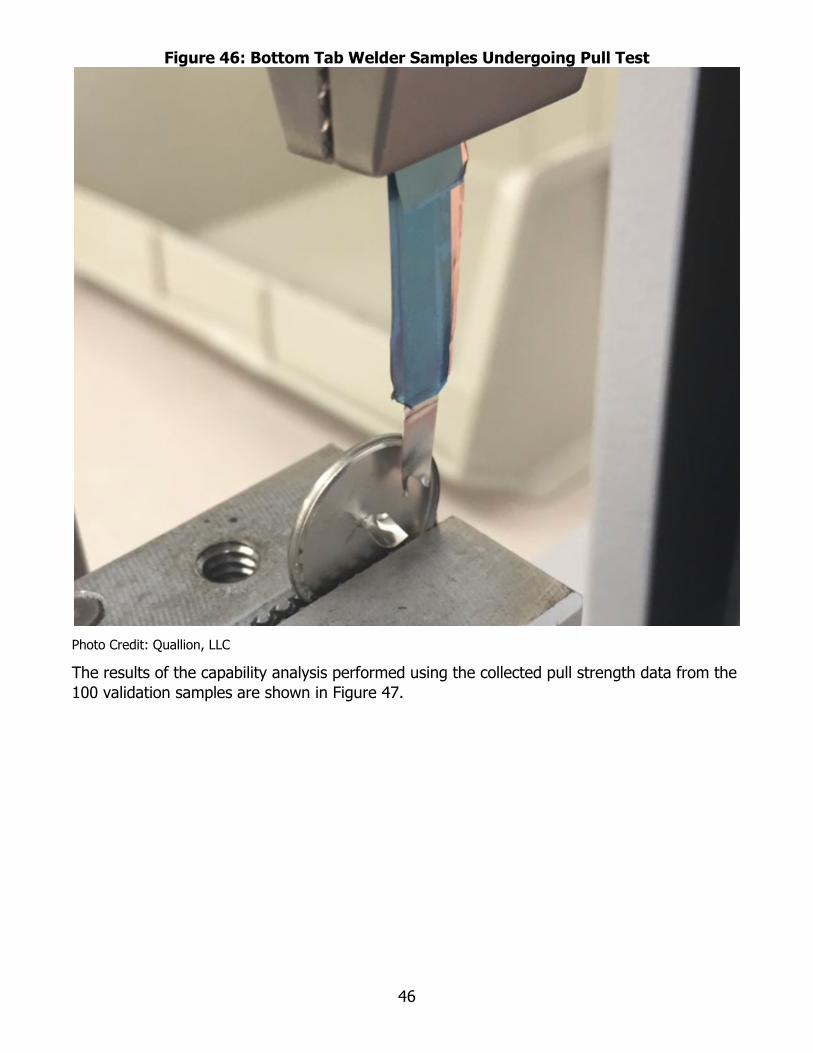
46
Figure 46: Bottom Tab Welder Samples Undergoing Pull Test
Photo Credit: Quallion, LLC
The results of the capability analysis performed using the collected pull strength data from the 100 validation samples are shown in Figure 47.

47
Figure 47: Process Capability Analysis Results for Bottom Tab Welding Station
Source: Quallion, LLC staff assessment
Based on the capability metrics analysis, the Hibar Bottom Tab Welding process was determined to be capable of producing assemblies with an expected minimum yield of 99.86 percent. All samples produced during the performance qualification passed visual inspection and met all the required acceptance criteria. The Hibar Bottom Tab Welding System with the established baseline equipment parameter settings was deemed validated and ready for production.
4.5.3 Hibar Beading Module Validation This validation is of the beading/grooving module of the Hibar assembly line of equipment. The beading module is designed to create a groove/bead along the top portion of the cell case, just above the jellyroll. This module is part of the “Control Panel 1” set of equipment and is considered part of a complete system for installation qualification. Testing was performed to evaluate the consistency and capability of this equipment.
The flow diagram shown in Figure 48 illustrates where the Hibar Beader System is used in the overall production process.

48
Figure 48: Cell Assembly Process Flow Diagram Highlighting the Can Beading Process Step
Source: Quallion, LLC staff assessment
The overall process to bead the case includes several manual operations before performing the beading operation. To begin the beading/grooving operation, the operator takes the welded cell assembly (with inserted center pin and installed top insulator) and folds the positive tab into place for grooving. The case assembly is then grooved by the Hibar system using a combination of forces from the three Iris Heads and upward motion from the collet.
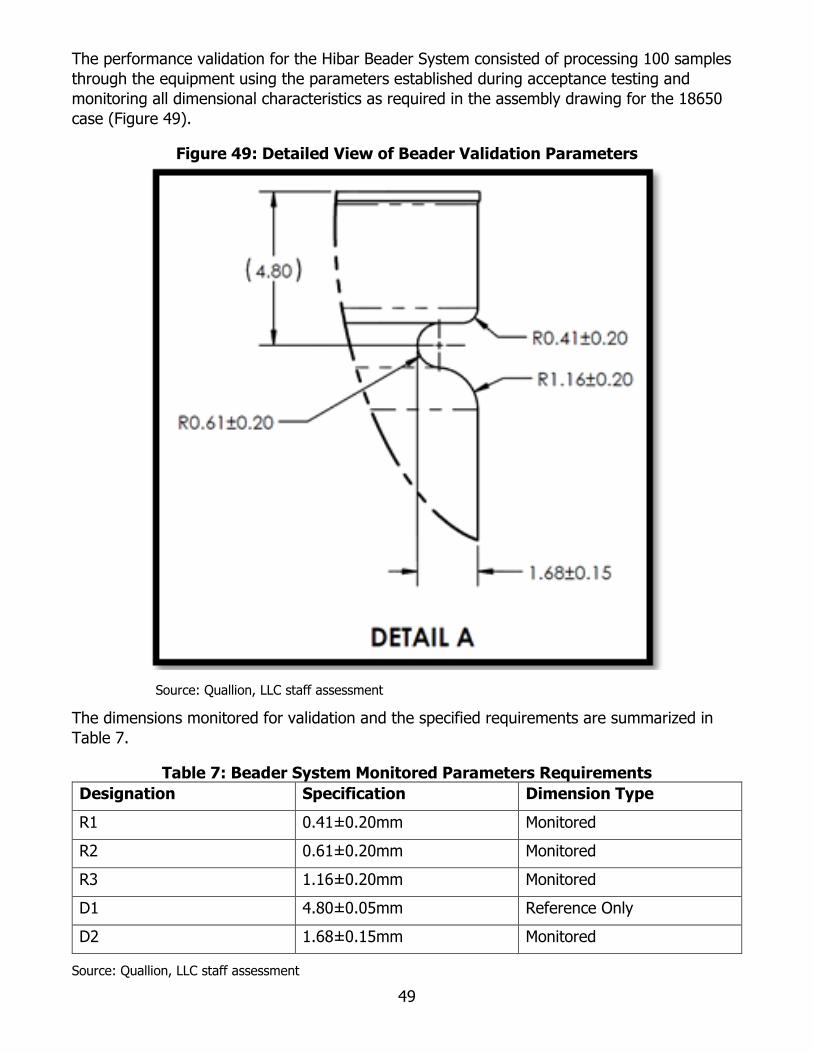
49
The performance validation for the Hibar Beader System consisted of processing 100 samples through the equipment using the parameters established during acceptance testing and monitoring all dimensional characteristics as required in the assembly drawing for the 18650 case (Figure 49).
Figure 49: Detailed View of Beader Validation Parameters
Source: Quallion, LLC staff assessment
The dimensions monitored for validation and the specified requirements are summarized in Table 7.
Table 7: Beader System Monitored Parameters Requirements Designation Specification Dimension Type R1 0.41±0.20mm Monitored R2 0.61±0.20mm Monitored R3 1.16±0.20mm Monitored D1 4.80±0.05mm Reference Only D2 1.68±0.15mm Monitored
Source: Quallion, LLC staff assessment

50
All 100 validation samples produced passed visual inspection per established and underwent measurements of the bead profile for evaluation. Figure 50 shows a close-up of a cell case after beading.
Figure 50: Close-up of a Cell Case after the Beading Process
Photo Credit: Quallion, LLC
To facilitate verification that the key dimensional parameters were met, the beaded cell cases were cross-sectioned and inspected. Figure 51 shows a sectioned, beaded case magnified for bead feature dimensional verification.

51
Figure 51: Cross-Section of Beaded Cell Case for Bead Dimensional Verification
Photo Credit: Quallion, LLC
A full data set of all recorded measurements from the 100 validation samples was included in the Equipment Validation Report previously submitted under Task 4 of Grant ARV-10-010 Statement of Work. There were two (2) data points per sample for each characteristic in order to provide a more accurate representation of the overall measurements for a cylindrical cell.
An example of the results of the process capability analysis performed using the collected bead dimensional data for the geometric radius R1 feature is shown in Figure 52. Similar process capability analysis was performed on the other dimensional parameters for the beaded feature and the results were included in in the Equipment Validation Report previously submitted under Task 4 of ARV-10-010 Statement of Work.

52
Figure 52: Bead Process Capability Analysis Data
Source: Quallion, LLC staff assessment
Based on the capability analysis metrics, the case beading process is capable of producing assemblies with an expected minimum yield of 99.75 percent based on the process metrics established for the process and the results are summarized in Table 8.
Table 8: Beading Process Capabilities Based on Data from 100 Samples Dimension Cp Cpk Percentage Yield R1 2.57 1.61 99.95 R2 8.50 8.44 100.0 R3 1.47 1.08 99.75 D2 2.38 1.88 99.99
Source: Quallion, LLC staff assessment
All samples produced during the performance qualification passed visual inspection and met the required dimensions established for the cell assembly per applicable documentation, with minimal thinning of the case walls. The Hibar Beading System with the vendor’s pre-programmed parameters was deemed validated and ready for production.
4.5.4 Hibar Sealant Dispensing Module Validation The Hibar Sealant Dispensing Module validation is intended to verify that the equipment is capable of consistently dispensing sealant around the inside of the cell case along the upper

53
portion of the bead/groove as performed by the previous process. This module is part of the “Control Panel 1” set of equipment and is considered part of a complete system for installation qualification. Testing was performed to evaluate the consistency and capability of this equipment. The flow diagram for the process is illustrated in Figure 53 and highlights where the Hibar Sealant Application System is used in the overall production process.
Figure 53: Cell Assembly Process Flow Diagram Highlighting Adhesive Application Process Step
Source: Quallion, LLC staff assessment
The overall process to apply the sealant does not involve any additional manual operations. The operator only loads and unloads the cell assemblies. The sealant is applied to the case assembly using a dispensing nozzle that pumps the sealant from a reservoir.

54
The Performance Validation for the Hibar Sealant application system consisted of processing 100 samples through the equipment using the parameters established during operation qualification testing and monitoring the differential cell weight. The sealant application parameters shown in Table 9 were used for consistency testing. The parameter which was to be monitored during the verification process and the associated requirement are shown in Table 10.
Table 9: Verification Adhesive Dispensing Baseline Parameters Dispensing Time(s) Sealant Spin (Hz)
7.0 30.00
Source: Quallion, LLC staff assessment
Table 10: Adhesive Dispensing Verification Parameter Requirements Designation Specification Dimension Type
Weight Delta 0.05±0.005g Monitored
Source: Quallion, LLC staff assessment
A sample of a cell post the adhesive application process is shown in Figure 54. One hundred (100) samples were processed through the Adhesive Dispensing System. All samples produced passed visual inspection per the established criteria outlined and were deemed to be within the established specification limits.
Figure 54: Cell Showing Post Adhesive Application Condition
Photo Credit: Quallion, LLC
A full data set of the recorded weight measurements from the 100 validation samples was included in in the Equipment Validation Report submitted under Task 4 of Grant ARV-10-010.
The results of the capability analysis performed using the collected Adhesive Dispensing sample weight data are shown in Figure 55.

55
Figure 55: Adhesive Sealant Application Process Capability Analysis Results
Source: Quallion, LLC staff assessment
Based on the capability metrics, the sealant application process is capable of producing assemblies with an expected minimum yield of 99.99 percent. All samples produced during the performance qualification passed visual inspection and met all the required acceptance criteria. The Hibar Sealant Application System with the established adhesive sealant application parameters was deemed validated and ready for production.
4.5.5 Hibar Electrolyte Filling Module Validation This validation was for the electrolyte filling module of the Hibar assembly line of equipment. The electrolyte filling module is designed to fill the cell assemblies with electrolyte to a specific weight using automated pre and post weighing stations. To expedite cycle time, the equipment is designed to fill 5 cells at a time. This module is part of the “Control Panel 2” set of equipment. Figure 56 shows the cell manufacturing flow diagram with the electrolyte fill process step highlighted to illustrate where the Hibar Filling System is used in the overall production process.

56
Figure 56: Cell Assembly Process Flow Diagram Highlighting Electrolyte Filling Process Step
Source: Quallion, LLC staff assessment
4.5.6 Hibar Electrolyte Filling System Performance Validation The Performance Validation for the Hibar Electrolyte Filling system consisted of one hundred (100) samples process through the equipment using the baseline parameters established during acceptance testing and process optimization effort.
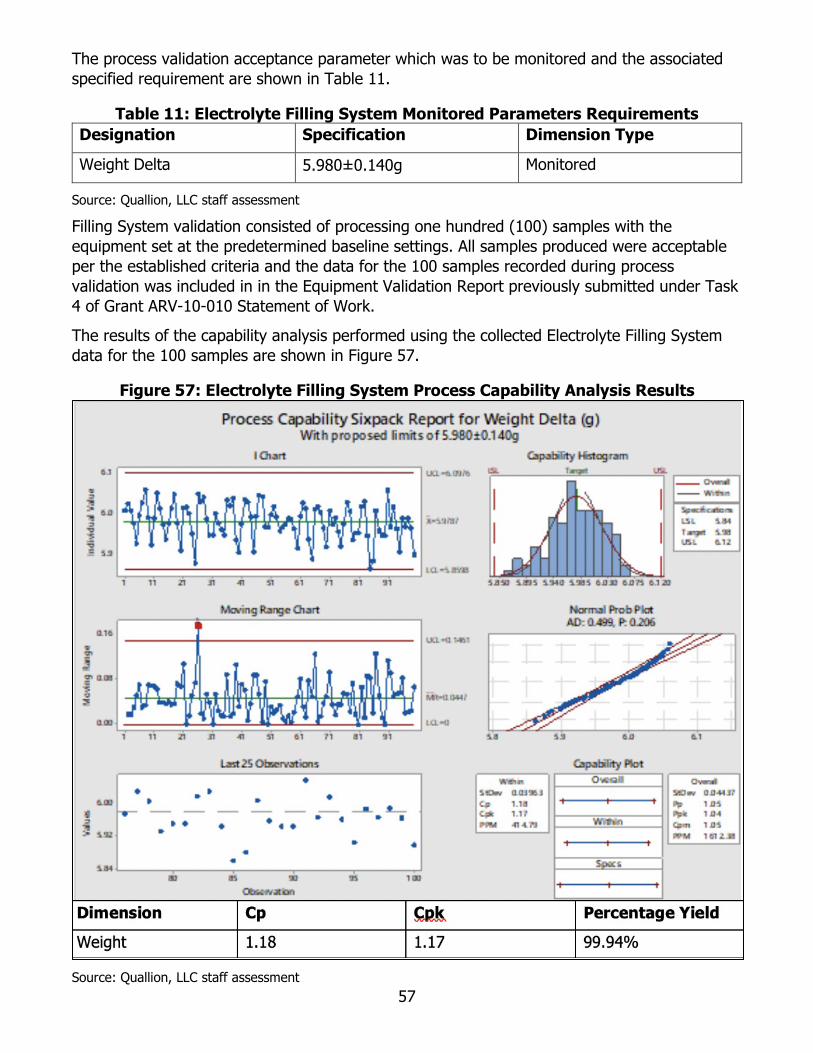
57
The process validation acceptance parameter which was to be monitored and the associated specified requirement are shown in Table 11.
Table 11: Electrolyte Filling System Monitored Parameters Requirements Designation Specification Dimension Type
Weight Delta 5.980±0.140g Monitored
Source: Quallion, LLC staff assessment
Filling System validation consisted of processing one hundred (100) samples with the equipment set at the predetermined baseline settings. All samples produced were acceptable per the established criteria and the data for the 100 samples recorded during process validation was included in in the Equipment Validation Report previously submitted under Task 4 of Grant ARV-10-010 Statement of Work.
The results of the capability analysis performed using the collected Electrolyte Filling System data for the 100 samples are shown in Figure 57.
Figure 57: Electrolyte Filling System Process Capability Analysis Results
Source: Quallion, LLC staff assessment

58
Based on the resulting capability metrics, the electrolyte filling process is capable of producing assemblies with an expected minimum yield of 99.94 percent.
All samples produced during the performance qualification passed visual inspection and met all the required acceptance criteria. The Hibar Electrolyte Filling System with the established baseline process parameters settings was deemed validated and ready for production.
4.5.7 Hibar Top Tab Welding and Taping Module Validation This validation is for the operation of the top tab welding and taping module of the Hibar assembly line of equipment. The top tab welding and taping module is designed to ultrasonically weld the positive aluminum tab from the jellyroll to the aluminum tab from the cap, and then apply tape around the exposed portion of the welded tab assembly. This module is part of the “Control Panel 3” set of equipment and is considered part of a complete system for installation qualification. Testing was performed to evaluate the consistency and capability of this equipment. Figure 58 shows the manufacturing process flow and where the Top Tab Welder and Taping System are used in the overall production process.

59
Figure 58: Cell Assembly Process Flow Highlighting Top Tab Welding Process Step
Source: Quallion, LLC staff assessment

60
The overall process to ultrasonic weld the aluminum tab of the jellyroll to the aluminum tab of the cap assembly includes several manual operations before performing the welding operation. The operator takes the filled cell housing and jellyroll assembly and straightens, flattens and cleans the aluminum tab prior to inserting the assembly into the case holder on the dial table and a cap assembly inserted into the cap holder of the dial table. Once the jellyroll and cap tabs are aligned, the assembly is ready for welding. Performance Validation for the Hibar Top Tab Welder system consisted of processing 100 samples through the equipment using the baseline parameters previously established during acceptance testing and ultrasonic weld optimization trials and the performance of pull testing on all welded tab samples to verify that the validation characteristic of welded tab pull strength were per the requirement shown in Table 12 was met.
Table 12: Top Tab Welder Validation Monitored Parameter Requirement Designation Specification Dimension Type Pull Test Strength 30±5N Tested
Source: Quallion, LLC staff assessment
For the Top Tab Welder Validation, one hundred (100) samples were processed per the established weld schedule baseline. All samples produced passed visual inspection per criteria previously established. Figure 59 shows a typical representative of the product output of the Top Tab Welder. Each of the 100 welded samples underwent welded tab pull strength testing in a tension tester as shown in Figure 60.
Figure 59: Typical Top Tab Welder Validation Product Output
Photo Credit: Quallion, LLC

61
Figure 60: Welded Top Tab Pull Strength Test
Photo Credit: Quallion, LLC
Complete data sets of the recorded welded tab pull strength measurements from the 100 samples were included in the Equipment Validation Report previously submitted under Task 4 of Grant ARV-10-010 Statement of Work.
The results of the process capability analysis performed using the collected Top Tab Welder System data for the 100 test samples are shown in Figure 61.

62
Figure 61: Top Tab Welder System Process Capability Analysis Results
Source: Quallion, LLC staff assessment
Based on the capability metrics, the top tab welding process is capable of producing assemblies with an expected yield of 100 percent. All samples produced during the performance qualification passed visual inspection and met all the required acceptance criteria. The Hibar Top Tab Welding System with the established baseline weld schedule parameter settings was deemed validated and ready for production.
4.5.8 Hibar Crimping System Validation This validation was for the crimping module of the Hibar assembly line of equipment. The crimping module is designed to preform and final crimp the case and cap assembly. This module is part of the “Control Panel 3” set of equipment and is considered part of a complete system for installation qualification. Testing was performed to evaluate the consistency and capability of this equipment.
Figure 62 illustrates the cell manufacturing process and highlights where the Hibar Crimping System is used in the overall production process.

63
Figure 62: Cell Assembly Process Flow Diagram Highlighting Crimping Process Step
Source: Quallion, LLC staff assessment

64
The Performance Validation for the Hibar Crimping System consisted of processing 100 samples through the equipment using the parameters established during acceptance testing and monitoring all dimensional characteristics as required in the assembly drawing for the 18650 case as detailed in Figure 63.
The acceptance criteria for performance validation of the Crimper System were based on inspection for the following conditions:
• No cracking or holes • No flaking or pealing • No scratches or dimpling along the groovs • No significant thinning of the wall thickness • Measure the bead profile using an optical comparator
In order to be acceptable, it was required that the profile of the crimp meet the dimensions per drawing 304247-300 DETAIL B (see Figure 63). Key parameters include crimp geometric diameters D1, D2 and geometric radiuses R1, R2, and R3.
Figure 63: Post Crimp Feature Specification Requirements Detail
Source: Quallion, LLC staff assessment
The dimensional limits which were monitored for crimping process validation are shown in Table 13.
Table 13: Crimp Process Validation Monitored Parameters Requirements Designation Specification Dimension Type R1 0.41±0.20mm Monitored R2 0.61±0.20mm Monitored R3 1.16±0.20mm Monitored D1 3.13±0.20mm Monitored D2 1.68±0.15mm Monitored
Source: Quallion, LLC staff assessment

65
All samples produced passed visual inspection per the established criteria and were submitted for measurements of the crimp profile to evaluate for validation. In order to facilitate measurements, the samples were cross-sectioned as shown in Figure 64.
Figure 64: Crimp Sample Cross Sectioned for Dimensional Measurement
Photo Credit: Quallion, LLC
A full data set of the recorded measurements from the 100 validation samples was included in in the Equipment Validation Report previously submitted under Task 4 of Grant ARV-10-010 Statement of Work.
There were 2 sets of data points per sample for each characteristic in order to give a more accurate representation of the overall measurements for a cylindrical cell. The ‘Before’ data set represents the measurement of the monitored parameters of cells previously processed to incorporate the Bead feature prior to Crimping. The ‘After’ data set represents the measurements of the monitored parameters of the cell (with the Bead feature) after being processed to incorporate the Crimp feature to verify that there was no excessive thinning or distortion of the cell housing.
An example of the results of the capability analysis performed using the collected Crimp Process data for the 100 validation samples for the geometric radius monitored parameter R1 are shown in Figure 65.
The process capability analysis results for the other monitored parameters referenced above for the Crimper System were included in in the Equipment Validation Report previously submitted under Task 4 of Grant ARV-10-010 Statement of Work.

66
Figure 65: Crimper System Process Capability Analysis Results
Source: Quallion, LLC staff assessment

67
Based on the capability analysis metrics, the crimping process is capable of producing assemblies with an expected minimum yield of 99.8 percent as summarized in Table 14.
Table 14: Crimper System Process Capabilities Analysis Results Dimension Cp Cpk Percentage Yield R1 3.15 2.98 ~100% R2 8.54 7.40 ~100% R3 1.43 1.02 ~99.8% D1 3.56 1.73 ~100% D2 3.11 2.54 ~100%
Source: Quallion, LLC staff assessment
All samples produced during the performance qualification passed visual inspection and met the required dimensions per the applicable drawing, with minimal thinning of the case walls. The Hibar Crimping System with the vendor’s pre-programmed parameters was deemed validated and ready for production.
4.6 Problems Encountered and Resolved Close coordination of equipment requirements definition, delivery and installation was needed to ensure equipment was available upon completion of facilities construction to minimize delays. Unfortunately, the equipment suppliers nonetheless experienced delays due to the complexity of the equipment and the requirement for Acceptance Testing of the equipment prior to shipment to Quallion. To mitigate the issue, Quallion Engineering supported on-site Acceptance Testing of the equipment at the respective manufacturer’s facilities. This helped expedite the process by having Quallion Engineers on-site to review data and make design and/or requirement adjustments on the spot as needed.
Validation of the pilot manufacturing line equipment required not only the verification of a large number of 18650 cell design features but also that the output of each piece of equipment was proven to be uniform and consistent over time. To address this, several runs of proof of concept cells (totaling over 2000 cells) were manufactured. These cells were used for the acceptance testing of the equipment at the supplier’s facility prior to shipment to Quallion and for the validation of the equipment once it was delivered and installed in the Quallion production facility.

68
CHAPTER 5: Battery Module System Fabrication and Testing
This chapter describes the cell processing performed on individual cells prior to their integration into battery modules and the methodology and procedures used to fabricate the individual modules that made up the Battery System destined for the EV application. Additionally, a brief description of the BMS design and construction processes is provided. Finally, an overview is given of the test methodology used for the battery system prior to and after EV integration.
5.1 Cell Screening Cell screening is the process through which Quallion ensures that all 18650 cells destined for assembly into battery packs share the same characteristics in order to maximize battery performance.
When cells are assembled into packs, depending on the configuration of the connections, the battery performance can be affected if even one cell has values that are significantly different from the rest. Quallion uses statistical analysis to ensure that all battery assemblies have the best possible performance based on how much the cells deviate from the statistical mean (average) of the measured population. Cells measurements include Open Circuit Voltage, Alternating Current Internal Resistance, Direct Current Internal Resistance, Weight and Pulse Delta Voltage.
A sample of typical data statistical analysis is shown in Figure 66. This graph describes the distribution of the cell weight measurements. Standard deviation is then used to calculate the limits for the population based on 3σ (Sigma), which is a statistical term for ±3 times the standard deviation from the average measurement. This process is repeated for each of the cell characteristics.
The cell screening process was used for the cells that were designated for integration into the Land Systems RailScout EV to ensure optimal battery performance.

69
Figure 66: Statistical Analysis of Cell Weight
Source: Quallion, LLC staff assessment
5.2 Battery Module Fabrication Fabrication of the battery modules was performed by Quallion in-house. Fabricated battery modules followed fully documented fabrication processes and underwent the appropriate level of inspection and testing to ensure that all performance and physical requirements were met prior to use. A total of 31 battery modules were produced from this production line.
The construction of the battery module encompassed several steps.
The first step in the assembly process was to assemble the cell holders and populate them with cells in the proper configuration (Figure 67).

70
Figure 67: Empty Cell Holder
Source: Quallion, LLC staff assessment
The polarity of the cells was flipped across the module to obtain 4 virtual cells in series module (Figure 68).
Figure 68: 4 Virtual Cells in Series in Cell Holder
Source: Quallion, LLC staff assessment
Quallion then applied adhesive to secure the nickel plate during welding (Figure 69).
Figure 69: Adhesive on the Cell Holder
Source: Quallion, LLC staff assessment
Once the nickel tab was secured, Quallion used the automated Calmation Welder (Figure 70) to securely weld the nickel tabs onto the cell holder.

71
Figure 70: Nickel Tabs Secured on Cell Holder
Source: Quallion, LLC staff assessment
The modules were then placed on the automated line, moving the modules to the welder (Figure 71).
Figure 71: Automated Welding Line
Photo Credit: Quallion, LLC
Once the welder was programmed with the module configuration, the module underwent automated welding.
Through the automated sight recognition, the welder finds the weld locations on the nickel tab (Figure 72) and proceeds with the weld process.

72
Figure 72: Automated Sight Recognition for Welding
Photo Credit: Quallion, LLC
Once the top side of the module is welded, the battery module is flipped, and the steps are repeated for the bottom side of the module.
With a completely welded module, the front plate and bus bars are riveted together and screwed in place (Figure 73).
Figure 73: Welded Module with Front Plate
Source: Quallion, LLC staff assessment
Finally, the wire harnesses for temperature and voltage monitoring were installed on the module (Figure 74).
Figure 74: Wire Harness Attached to Module
Source: Quallion, LLC staff assessment

73
After battery modules assembly is completed, the assemblies undergo the necessary testing prior to the next level of integration.
5.3 Battery Module Testing Testing of the battery modules was performed in-house. Test procedures documented the steps for verifying the battery module voltages and capacities. A total of 31 battery modules underwent the test procedure. In July 2015, 24 modules were delivered to Land Systems for integration into the RailScout EV. The remaining seven modules were designated for engineering use. The first module produced was an engineering unit to develop the testing process (Figure 75). An infrared camera was used to monitor the thermal characteristics of the first engineering unit during test. The testing confirmed that the battery was more than capable of handling the current rates expected in the EV application.
Figure 75: Testing of Engineering Module
Photo Credit: Quallion, LLC
All modules underwent 3 charge and discharge cycles. Quallion charged each module at 56A (C/2) and discharged at 84A (0.75C). All modules met the 105Ah capacity requirement across all three cycles (Figure 76).

74
Figure 76: Capacity Curves for all 31 Modules
Source: Quallion, LLC staff assessment
Once battery modules completed testing, they were readied for integration with the BMS electronics.
5.4 Battery Management System Electronics Fabrication The primary objectives for the BMS electronics design, which was undertaken under separate CEC Grant ARV-12-010, were to provide safety monitoring of a high voltage battery pack, to perform communications and to record captured data.
The BMS electronics design is composed of three boards shown in Figure 77: a Control Board, an Interface Board and a Single Board Computer. The Control Board performs the monitoring and safety control for the battery. Four (4) of these boards were used in the final battery system, with each board assigned monitoring duty over 6 modules (for a system total of 24 modules).

75
Figure 77: Control Board (top), Interface Board (bottom left) and Single Board Computer (bottom right)
Photo Credit: Quallion, LLC
The Interface board is the intermediary between the Control Board, Single Board Computer and external systems. The Interface Board filters voltages and is the Controller Area Network (CAN) bus junction. The Single Board Computer receives and records the messages from the Control Board. This data is saved locally and sent to Universal Serial Bus memory at the completion of test for future reference.
Figure 78 provides the specific functional, configuration and physical design parameters for the BMS Control Board.

76
Figure 78: BMS Control Board Functional, Configuration and Physical Design Parameters
Source: Quallion, LLC staff assessment
Similarly, Figure 79 provides the specific functional, configuration and physical design parameters for the BMS Gateway Electronics Board and the Single Board Computer. The BMS Gateway Electronics interfaces the BMS Control Board to the Single Board Computer for data logging and to the RailScout vehicle system.

77
Figure 79: BMS Gateway Electronics Board and Single Board Computer Functional, Configuration and Physical Design Parameters
Source: Quallion, LLC staff assessment
Fabrication of the BMS electronics boards was outsourced to local suppliers. Quallion’s purchasing organizations flowed down all appropriate procurement clauses on the Purchase Orders to ensure full traceability and conformance certification. All hardware received from suppliers underwent incoming inspection and where applicable, acceptance testing, prior to it being issued to the production floor.
The Battery Management System Printed Circuit Board was manufactured to IPC-6011 and 6012 standards and also to meet the requirements of IPC-A-600, Class2, Level C. The Printed Circuit Board is approximately 15.4 inches long and 2.7 inches wide. The Printed Circuit Board is 4 layers thick consisting of 1.0 oz. and 2.0 oz. copper layers.
5.5 Battery Module Integration Testing Under separate CEC Grant ARV-12-010, Quallion upgraded facilities to install and bring on-line a BMS electronics laboratory to facilitate battery module testing. This effort included the procurement, installation and validation of associated BMS test equipment to facilitate the design, fabrication and test of battery modules and BMS electronics hardware. This integrated BMS and battery system was subsequently integrated into an electric vehicle prototype for verification testing prior to deployment and field data collection.
The test methodology used to validate the environmental, safety and performance parameters of integrated battery modules and BMS electronics system involved testing at three levels of

78
assembly: BMS electronics testing, battery module-electronics testing, and vehicle installed BMS and battery modules testing. Key metrics such as voltages, currents, temperatures and power were captured and compared to the specified design parameters. All lower level testing was conducted in the BMS electronics lab, with testing of the BMS electronics and battery system integrated into the RailScout conducted at the Land Systems facility in San Pedro and in the field on tracks at test sites in the cities of Fillmore, California and New Orleans, Louisiana.
Testing of the battery modules included individual cell testing for safety and electrical characteristics, and final testing of the assembled modules to ensure they met the battery specifications set by Quallion engineering and Land Systems.
Once the BMS lower level board performance parameters had been validated, the BMS electronics were integrated with the engineering battery modules for module-electronics testing. The objective of this testing was to verify the system-level performance of the integrated BMS electronics and modules using the newly developed BMS electronics lab capabilities. For the module-electronics test, the BMS was connected directly to six battery modules and the AV900 high voltage cycler, data acquisition computer and current clamps. Figure 80 illustrates how the integrated BMS electronics and module test was instrumented. Figure 81 shows the actual test setup with the BMS electronics boards connected to the six battery modules which are in turn connected to the AV900 HV Cycler. Note the forward-looking infrared thermal imaging camera on the tripod in the background transmitting the thermal images captured from the battery modules to the PC. The six modules were interconnected to each other using power cables to form a six-module battery with a shunt resistor connected to the most negative end. Sense cables were wired to the BMS Control Board and the Single Board Computer and Interface Board and were then powered on. Once it was verified that the BMS electronics were communicating and producing data, battery charging, and discharging was performed using the AV900 Cycler.
With the data acquisition computer and LabVIEW Battery Data Acquisition and Test Software, Quallion successfully ran AV900 charge and discharge cycles on the battery. During the execution of the discharge or charge test program, the AV900 was remotely set to the programmed parameters and automatically ran the test profile. During the module-electronics testing, the ability to capture data through the Universal Serial Bus memory stick was verified.

79
Figure 80: Integrated BMS Electronics and Battery Modules Test Instrumentation Setup
Source: Quallion, LLC staff assessment
Figure 81: Testing BMS Electronics Integrated with Six Battery Modules
Photo Credit: Quallion, LLC

80
Having validated all the lower level module and BMS electronics operations, integration of the BMS electronics with the 24 battery modules of the RailScout EV followed. Prior to integrating the 24 modules into the EV battery, Quallion performed a series of measurements to verify the state of the modules before integration. Figure 82 shows the pre-integration measurement results.
Figure 82: Pre-Integration Measurements
Source: Quallion, LLC staff assessment
Figure 83 shows this testing being conducted on the twenty-four battery modules at the Land Systems facility in San Pedro, California. These pre-integration measurements were used to prevent virtual cell imbalances between modules once integrated, which could lead to decreased battery performance in the long term. Module state verification was performed using a breakout connector box that allowed Quallion to capture readings directly from the individual sense lines for each of the virtual cells.

81
Figure 83: Battery Module Testing Prior to Installation into RailScout EV
Photo Credit: Quallion, LLC
As a precursor to integrating the BMS electronics and battery modules into the RailScout, the electronics were installed in the vehicle battery box and connected to the modules as illustrated in Figure 84. Note the designated module group numbers and corresponding board serial numbers. Each Control electronics board controls six modules or one group. There are four groups, each group consisting of six battery modules for a total of 24 battery modules. After connecting the modules to the BMS electronics, the electronics were powered on to verify BMS measurements. Measurements were taken from CAN bus readings through the Single Board Computer.
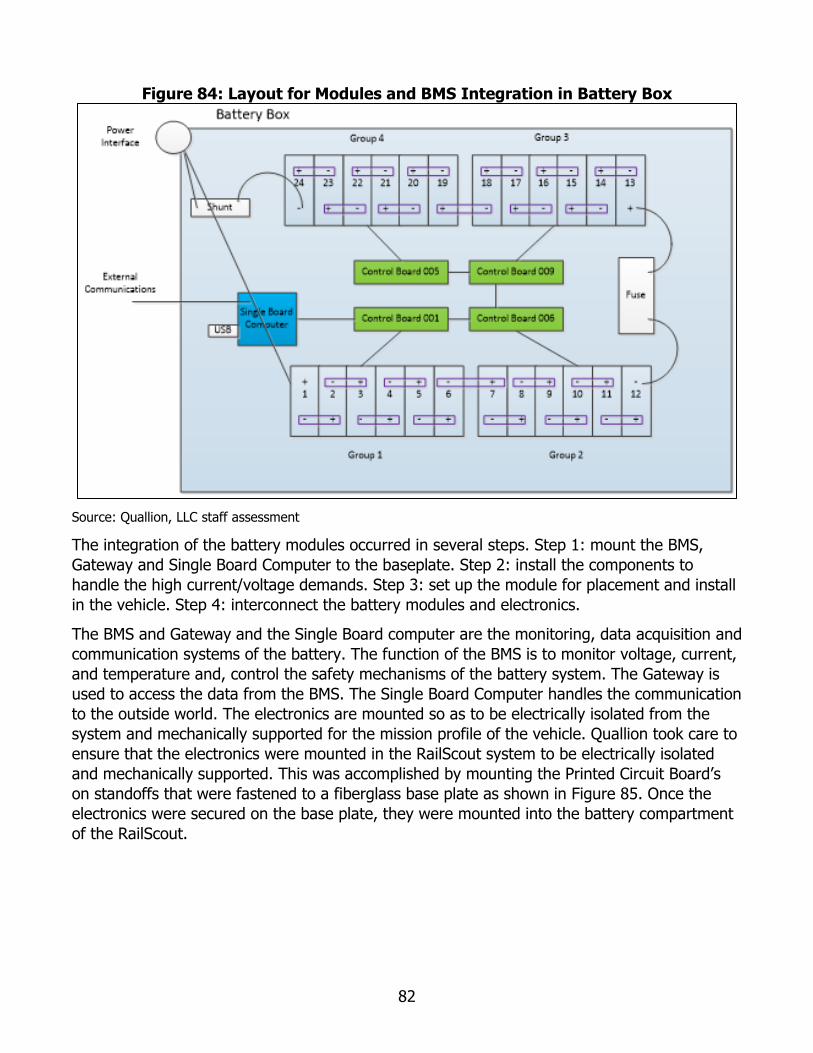
82
Figure 84: Layout for Modules and BMS Integration in Battery Box
Source: Quallion, LLC staff assessment
The integration of the battery modules occurred in several steps. Step 1: mount the BMS, Gateway and Single Board Computer to the baseplate. Step 2: install the components to handle the high current/voltage demands. Step 3: set up the module for placement and install in the vehicle. Step 4: interconnect the battery modules and electronics.
The BMS and Gateway and the Single Board computer are the monitoring, data acquisition and communication systems of the battery. The function of the BMS is to monitor voltage, current, and temperature and, control the safety mechanisms of the battery system. The Gateway is used to access the data from the BMS. The Single Board Computer handles the communication to the outside world. The electronics are mounted so as to be electrically isolated from the system and mechanically supported for the mission profile of the vehicle. Quallion took care to ensure that the electronics were mounted in the RailScout system to be electrically isolated and mechanically supported. This was accomplished by mounting the Printed Circuit Board’s on standoffs that were fastened to a fiberglass base plate as shown in Figure 85. Once the electronics were secured on the base plate, they were mounted into the battery compartment of the RailScout.

83
Figure 85: Fiberglass Base Plate with BMS Electronics Mounted in Place
Photo Credit: Quallion, LLC
In designing a high current high voltage battery system there are several components that require special consideration. The Shunt resistor (Figure 86) is an electronic device that allows measurement of current values that are too high for the electronics in the battery system. The shunt resistor was mounted in close proximity to the motor and isolated on a fiberglass base plate. The other component is the fuse. The fuse must be properly sized and isolated from accidental contact with electrically conductive materials. The fuse in the RailScout is rated for 250 amps 500v. The fuse was electrically isolated in a plastic enclosure and mounted to the BMS base plate as shown in Figure 87.
Figure 86: RailScout Shunt Resistor
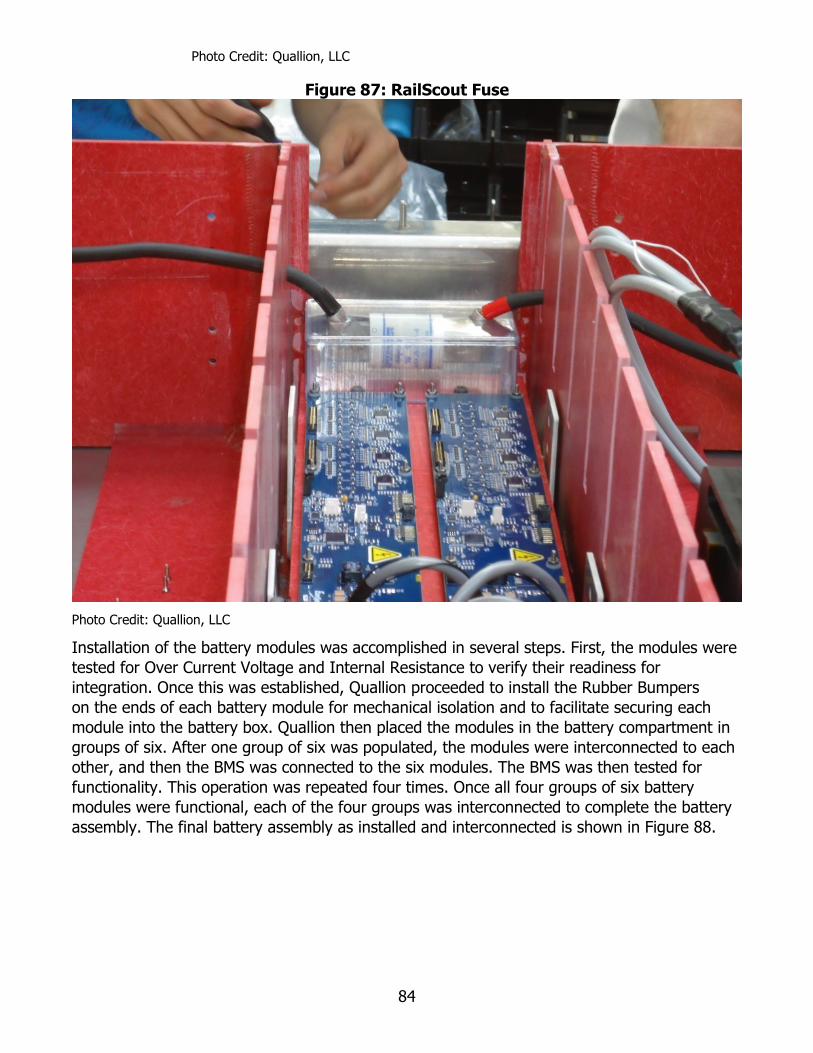
84
Photo Credit: Quallion, LLC
Figure 87: RailScout Fuse
Photo Credit: Quallion, LLC
Installation of the battery modules was accomplished in several steps. First, the modules were tested for Over Current Voltage and Internal Resistance to verify their readiness for integration. Once this was established, Quallion proceeded to install the Rubber Bumpers on the ends of each battery module for mechanical isolation and to facilitate securing each module into the battery box. Quallion then placed the modules in the battery compartment in groups of six. After one group of six was populated, the modules were interconnected to each other, and then the BMS was connected to the six modules. The BMS was then tested for functionality. This operation was repeated four times. Once all four groups of six battery modules were functional, each of the four groups was interconnected to complete the battery assembly. The final battery assembly as installed and interconnected is shown in Figure 88.

85
Figure 88: Final Battery Assembly as Installed in the RailScout Battery Box
Photo Credit: Quallion, LLC
Once the battery was assembled, Quallion performed battery level tests using a high voltage cycler to perform several charge and discharge test sequences as summarized in Table 15. These tests were conducted to evaluate how the battery would perform at certain charge and discharge rates.
Table 15: Battery Test Sequence
Sequence 1 Perform discharge at -20A for ~5 minute, charge at 20A for ~5 minute and charge at 60A for ~5 minutes
Sequence 2 Set to discharge of -70A for ~1 minute, then ramp up to -180A and stay for 5 seconds. Ramp down to -80.7A for ~10 minutes
Sequence 3 Perform charge at 20A for ~10 minutes, charge at 40A for ~20 minutes
Source: Quallion, LLC staff assessment
From the collected data, Quallion determined that the BMS was accurately recording the current, voltage and temperature measurements. The voltage drop after a discharge and the rise after a charge were within expected ranges. The battery temperature, as measured by the thermistors, gradually increased, but did not exceed 41˚C.
During Sequence 2 test of Table 15 (above), Quallion used the forward-looking infrared camera to monitor external battery temperature. Should the electronics detect discharge current greater than -150 amps for 20 seconds, Quallion designed in safety measures will stop the discharge. The forward-looking infrared image allowed the localization of potential temperature hot spots with the external bus bar to module bus

86
bar interface appearing to be the hottest as shown in Figure 89. Quallion has identified this as a design improvement opportunity for future implementation to lower the resistance and thus reduce the potential for high temperatures in this region of the battery module.
Figure 89: Thermal Image of Battery Being Discharged at 180 Amps
Photo Credit: Quallion, LLC
With battery testing complete and observed results as expected, Quallion installed the modules into the battery box inside the RailScout vehicle as shown in Figure 90. Quallion performed testing with the battery and vehicle motor to verify that the battery was integrated properly. The motor was energized to spin and stop the wheels with the vehicle suspended. Quallion collected data of the battery in operation. Quallion captured battery current, speed and odometer readings and verified that these measurements were consistent with expectations. The majority of battery test miles were run on a rack in the Land Systems Corporation assembly area.
The amount of energy to charge the battery modules was approximately 38.7 kilowatt-hours which provides an estimated range of 182 miles per charge. This industrial vehicle has a much higher range than electric passenger cars available in 2015.
The RailScout was now ready for field testing.

87
Figure 90: Battery Modules and BMS Electronics in RailScout EV Chassis
Photo Credit: Quallion, LLC
5.6 Problems Encountered and Resolved A challenge faced during the first year of development was the slow progress in finalizing the battery design. This was due to poor quality of product from the anode and cathode deposition process. The coating on the electrodes would flake off during winding. To resolve this, experiments were designed to isolate and correct the root cause of the problem. Several coating equipment settings required numerous test runs to optimize. This was accomplished by producing high volumes of concept cells for continued refinement to yield higher fidelity proof of concept cells, which in turn informed the approach to the automated cell assembly process and the final battery design.
During the BMS and battery assembly development and integration, Quallion encountered and resolved several EV integration related issues:
• Various harness connectors lacked a locking feature which could impact the interconnect robustness.
• Sub-stack voltage had larger than expected variance. During the integration of the battery and electronics, it became apparent that several of the harness connectors which lacked a locking feature needed to be addressed to ensure system robustness. Because the BMS electronics and battery would be operating in a vibration inducing environment, Quallion needed to ensure that the cables and connectors were firmly fixed and secured. To resolve this, Quallion applied room temperature vulcanization (RTV) silicone to the male and female connectors to effectively fix and secure the interconnection. In

88
the next revision of the board, Quallion intends to upgrade all connectors to have a mechanical locking feature.
Another problem Quallion discovered with the electronics was that the six-module voltage (sub-stack voltage) measurement had a larger than expected variance. The reason for the larger variance was attributed to the tolerance on Quallion’s voltage dividing resistors which was deemed too large. For the current design iteration, Quallion used the sum of virtual cell voltages to represent the overall pack voltage. Quallion plans to address this voltage variance in a future revision by using tighter voltage dividing resistor tolerances.

89
CHAPTER 6: Module and RailScout Electric Vehicle Integration
Chapter 6 discusses the field deployment of the RailScout, and the results of the data obtained during the deployment period. The data collection effort involved coordination with the Land Systems team that was on site during the deployment period.
6.1 RailScout Deployment and Operational Data Collected 6.1.1 RailScout Electric Vehicle Quallion partnered with Land Systems Corporation who provided the prototype RailScout EV platform for integrating the Quallion battery modules and BMS electronics for field evaluation. The RailScout is an electric vehicle that evaluates, and diagnoses track and track bed conditions to ensure the safety and efficiency of railroads. RailScout automates the inspection and maintenance processes which are currently performed manually.
A wide range of sensor technologies are utilized by the RailScout (Figure 91). Lasers and inertial measurement systems inspect track geometry, rail defects, ties, clips and ballast. Obstacle detection sensors and software enable RailScout to slow down to a safe stopping point when an obstacle is detected and await operator intervention. Cameras capture the action as the vehicle is in motion.
Figure 91: Example Image Captured by RailScout Sensors
Source: Land Systems Corporation
The RailScout is operable in 3 different modes. In remote control mode, an operator controls RailScout through line-of-sight controls and a handheld remote. In teleoperation mode,

90
RailScout uses sensors and control software to operate semi-autonomously and compensate for radio transmission and network latency. In full autonomous mode, the operator remotely monitors the vehicle, while RailScout leverages sensors and simultaneous localization and mapping to move throughout the network without any guided assistance (Figure 92).
Figure 92: Example Control Capability of RailScout
Source: Land Systems Corporation
The Quallion battery module produces low voltage for the sensors and other peripherals (Figure 93) plus high voltage to drive the motor turning the 28 inch steel wheels. With the Quallion battery, the RailScout is able to carry heavy payloads or travel long distances. The RailScout has a designed maximum speed of 100 miles per hour and range of 180 miles at 25 miles per hour.

91
Figure 93: Quallion Battery Powering the RailScout
Source: Land Systems Corporation
6.1.2 Vehicle Field Data Deployment Site Description and Test Objectives Field testing was performed on tracks at two test sites, one owned by Fillmore & Western Railways, located in Fillmore, California, in September 2015, the other near the Huey P. Long Bridge over the Mississippi River in New Orleans, Louisiana in October 2015. The intent was to exercise the RailScout in real-world conditions to verify vehicle remote operation, communications, control, battery performance at different speeds and settings, and refine parameters for future system optimization.
Figure 94 shows the RailScout being prepared for testing at the Fillmore site.

92
Figure 94: Powering on the RailScout at the Fillmore Test Site
Photo Credit: Quallion, LLC
The Fillmore testing was intended to provide a preliminary vehicle operational evaluation and overall system communication and control check-out. The longer term field test planned on the Huey P. Long Bridge in New Orleans was intended to better characterize vehicle field performance as it executed its intended rail inspection function. For this longer term testing, the plan was for the RailScout to run (via remote control) across the four mile span of tracks of this historical bridge once a day, three to five times a week. During each run, numerous sensors on board the RailScout were to automatically monitor the condition of the tracks.
The goal of this field demonstration was to perform an 8 mile round trip run at up to its 11 miles per hour maximum inspection speed over a period of time and collect vehicle data to characterize and assess the performance of the various vehicle systems including power, communication and control.
From the data collected of battery state at different speeds and settings, Quallion expected to be better able to refine parameters for future optimization for this BMS application as well as other potential EV platform applications.
Figure 95 shows the RailScout on site at the public belt railroad yard adjacent to the Huey P. Long Bridge in New Orleans, Louisiana.

93
Figure 95: RailScout on Site in New Orleans, LA.
Photo Credit: Land Systems Corporation
Figure 96 and Figure 97 show two views of the Huey P. Long Bridge and the tracks which were to be monitored by the RailScout during its field deployment.
Figure 96: View of Huey P. Long Bridge Test Site in New Orleans, LA.
Photo Credit: Land Systems Corporation

94
Figure 97: Another View of Huey P. Long Bridge Test Site Showing 4 Mile Bridge Span
Photo Credit: Land Systems Corporation
6.1.3 Vehicle Field Data Collection and Analysis 6.1.3.1 Fillmore Test Site For the initial field testing, the RailScout was transported to the Fillmore test site via trailer as shown in Figure 98. Upon lowering the vehicle onto the tracks, the first step was to verify that the vehicle was powering-up properly. With the push of a button, the BMS and vehicle electronics was activated. Then, via remote control, the RailScout vehicle was commanded to move forwards and backwards on the tracks.
Figure 98: Preparing to Lower the RailScout onto Fillmore Railroad Tracks
Photo Credit: Quallion, LLC

95
After confirming all RailScout systems operational, the Quallion and Land Systems team performed several higher speed fully automated runs as shown in Figure 99.
Figure 99: RailScout in Full Automated Operation
Photo Credit: Quallion, LLC
After completing the field testing, the Universal Serial Bus memory stick was extracted from the Single Board Computer to analyze the captured data. During one of RailScout’s excursions, it traveled approximately 64.5 feet for two short runs. For this test, the RailScout reached a speed of approximately 7 feet per second, less than its maximum speed, and discharged to approximately 28 amps as depicted in the data plots shown in Figure 100.

96
Figure 100: BMS Distance, Speed and Current Measurement
Source: Quallion, LLC staff assessment
During the field testing, the battery voltage decreased, and temperature increased slightly over time. This was expected because the short track length and only approximately a dozen lengthy runs were conducted. The virtual cell voltages ranged from 3.8 to 3.85 volts and the measured temperatures ranged from 33 to 36˚C.
After Land Systems implemented several software upgrades including data formatting and making final adjustments to the electric vehicle, the RailScout was packed for transport to its long-term test site in New Orleans, Louisiana. 6.1.3.2 New Orleans Test Site Once on site in New Orleans, the RailScout underwent a detailed operational checkout. Several intermittent issues involving systems communications required control software modifications and harnessing modifications which Land Systems implemented. After system operational verification, the RailScout was deemed ready for testing.
While the plan had been to run the RailScout on the Huey P. Long Bridge, due to the inability to gain access to the bridge because of railway operational conflicts, the RailScout was only able to run along 1000 ft. of track at the New Orleans Public Belt Railroad Yard Track #2. The vehicle was used for 6 days from October 1, 2015 to October 28, 2015. On average, 10 runs were made each day. Each run consisted of accelerating to approximately 17.75 km/h, sustaining speed and decelerating towards end of range. These runs were performed at 80-85˚F ambient temperature and the unit was stored indoors at 72˚F overnight. Table 16 summarizes the performance of the vehicle during this time period.

97
Table 16: RailScout Vehicle Performance Parameters Electric Vehicle Performance Days of Use 6.00 Average Runs per Day 10.00
Max Speed 17.75 11.00
km/hr mi/hr
Range per Run 0.33 0.20
km mi
Total Range 19.80 12.28
km mi
Estimated Total Time in Motion (hours) 1.12 hr Source: Land Systems Corporation staff assessment
Table 17 shows battery performance as the vehicle accelerated to speed. The typical average current that was observed during accelerating to speed was 21.05 amps. At roughly 2.5 seconds, it is estimated that the total energy from the battery equaled 0.88 Amp-hour.
Table 17: RailScout Acceleration Performance Parameters Acceleration Typical Average Pack Current Accelerating to Speed 21.05 A Time to Speed (s) 2.50 sec Typical Consumption Accelerating to Speed in 2.5 sec 0.015 Ah Total Number of Accelerations 60.00 Total Energy Accelerating to Speed (Ah) 0.88 Ah
Source: Land Systems Corporation staff assessment
Similarly, Table 18 shows battery performance as the vehicle cruised at speed. The typical average current that was observed during cruising speed was 4.44 amps. At roughly 90 seconds, Quallion estimates that the total energy from the battery equaled 6.66 amp-hour.
Table 18: RailScout Cruising Speed Performance Parameters Cruising Typical Total Pack Current at Speed (Continuous) 4.44 A Estimated Non-Traction Pack Current (Accessories, etc., for Test Duration) 1.00 A
Estimated Traction Pack Current 3.44 A Time at Speed 90.00 Sec Typical Consumption at Speed 0.11 Ah Total Number of Cruises 60.00 Total Energy at Cruising Speed 6.66 Ah
Source: Land Systems Corporation staff assessment

98
During this period, the RailScout vehicle consumed approximately 7.54 amp-hours energy from the Quallion battery pack. With a battery capacity of approximately 105 to 115 amp-hours, the energy consumed represents less than 7.5 percent of total capacity; no recharged was needed.
Thus far, Quallion’s partner Land Systems has commented “at this early stage, the Quallion pack provided performance within expectations.”
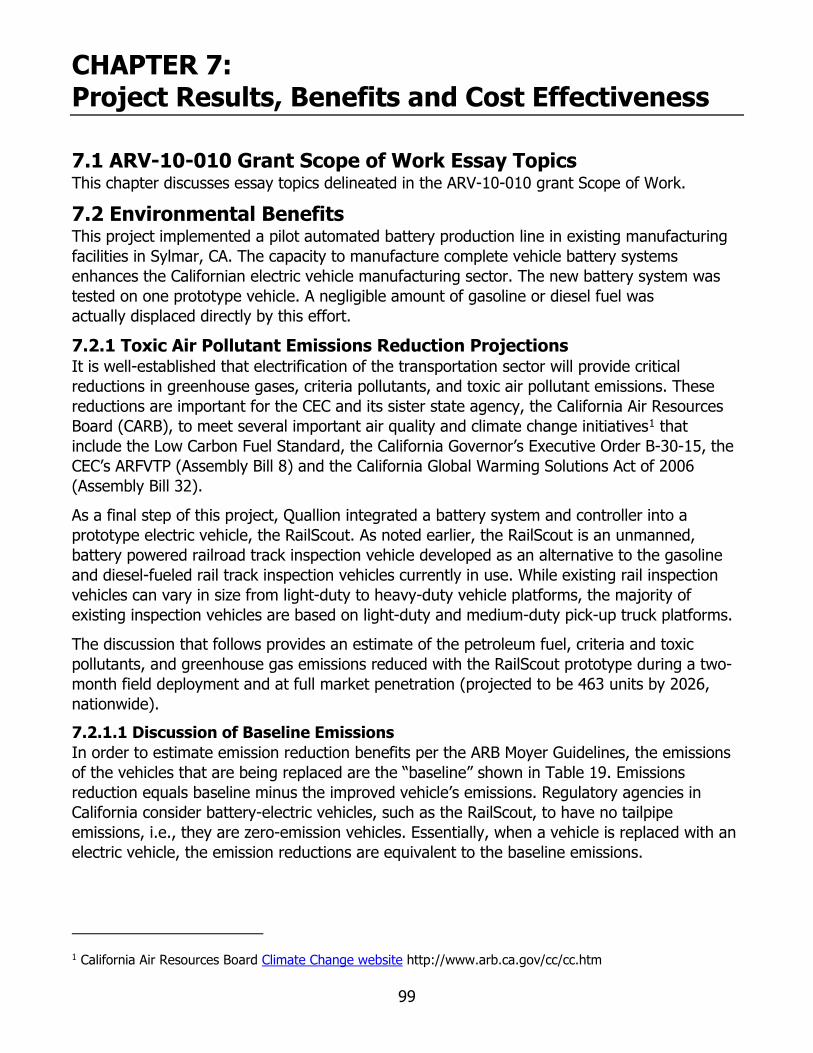
99
CHAPTER 7: Project Results, Benefits and Cost Effectiveness
7.1 ARV-10-010 Grant Scope of Work Essay Topics This chapter discusses essay topics delineated in the ARV-10-010 grant Scope of Work.
7.2 Environmental Benefits This project implemented a pilot automated battery production line in existing manufacturing facilities in Sylmar, CA. The capacity to manufacture complete vehicle battery systems enhances the Californian electric vehicle manufacturing sector. The new battery system was tested on one prototype vehicle. A negligible amount of gasoline or diesel fuel was actually displaced directly by this effort.
7.2.1 Toxic Air Pollutant Emissions Reduction Projections It is well-established that electrification of the transportation sector will provide critical reductions in greenhouse gases, criteria pollutants, and toxic air pollutant emissions. These reductions are important for the CEC and its sister state agency, the California Air Resources Board (CARB), to meet several important air quality and climate change initiatives1 that include the Low Carbon Fuel Standard, the California Governor’s Executive Order B-30-15, the CEC’s ARFVTP (Assembly Bill 8) and the California Global Warming Solutions Act of 2006 (Assembly Bill 32).
As a final step of this project, Quallion integrated a battery system and controller into a prototype electric vehicle, the RailScout. As noted earlier, the RailScout is an unmanned, battery powered railroad track inspection vehicle developed as an alternative to the gasoline and diesel-fueled rail track inspection vehicles currently in use. While existing rail inspection vehicles can vary in size from light-duty to heavy-duty vehicle platforms, the majority of existing inspection vehicles are based on light-duty and medium-duty pick-up truck platforms.
The discussion that follows provides an estimate of the petroleum fuel, criteria and toxic pollutants, and greenhouse gas emissions reduced with the RailScout prototype during a two-month field deployment and at full market penetration (projected to be 463 units by 2026, nationwide). 7.2.1.1 Discussion of Baseline Emissions In order to estimate emission reduction benefits per the ARB Moyer Guidelines, the emissions of the vehicles that are being replaced are the “baseline” shown in Table 19. Emissions reduction equals baseline minus the improved vehicle’s emissions. Regulatory agencies in California consider battery-electric vehicles, such as the RailScout, to have no tailpipe emissions, i.e., they are zero-emission vehicles. Essentially, when a vehicle is replaced with an electric vehicle, the emission reductions are equivalent to the baseline emissions.
1 California Air Resources Board Climate Change website http://www.arb.ca.gov/cc/cc.htm
100
For this project, criteria pollutant and PM emissions reduction are based on vehicle exhaust emissions (tank-to-wheel).2 The baseline gasoline and diesel vehicles are characterized utilizing CARB’s Emissions Factor 2014 inventory model, or EMFAC20143. CARB provides a straight-forward web-based user interface to obtain model results based on user-selected inputs. In the tables that follow, there are four baseline vehicle configurations used to characterize the emissions benefits of this project and its technology development efforts:
• Gasoline-fueled LDT2, representing gasoline-fueled light-duty trucks with a gross vehicle weight rating (GVWR) of between 3,751 and 5,750 pounds.
• Diesel-fueled LDT2, representing diesel-fueled light-duty trucks with a GVWR of between 3,751 and 5,750 pounds.
• Gasoline-fueled medium-duty vehicle, representing gasoline-fueled medium-duty vehicles with a GVWR of between 5,751 and 8,500 pounds.
• Diesel-fueled medium-duty vehicle, representing diesel-fueled medium-duty vehicles with a GVWR of between 5,751 and 8,500 pounds.
Both vehicle classes include gasoline- and diesel- fueled internal combustion engine configurations. Results are provided in this analysis for all four baseline configurations (each vehicle class operating on gasoline or diesel), since these options are the most common type of rail inspection vehicles in operation today.
Gallons per mile and grams of emissions per mile factors presented in Table 19 were developed based on the output of EMFAC2014 for the year 2015 average statewide fleet inventory. EMFAC2104 output includes a breakdown by vehicle class of the daily vehicle miles travelled, tons of emission per day and the daily fuel consumption by vehicle class. Simple arithmetic operation of the EMFAC output allows development of the factors used to estimate project benefits in Table 19. For example, EMFAC reports the total tons per day of a pollutant and the total miles per day travelled by all vehicles in the specified weight category. Tons per day divided by miles per day and converted by unit analysis results in grams per mile. Table 19 presents the calculated emission factors (grams per mile) and fuel consumption factors (gallons per mile) for each of the four baseline configurations for the fleet average emissions in the year 2015.
Four baseline configurations are considered in order to show the range of potential benefits that might be realized with wider scale implementation of the zero-emission technology. To calculate the benefits of replacing one of the four types of baseline vehicles with zero-emission technology, simply multiply the number of miles by the factors in the table.
2 Cost-Effectiveness Calculation Methodology, https://ww3.arb.ca.gov/msprog/moyer/guidelines/2011gl/2011cmp_appc_20151218.pdf
3 California Air Resources Board EMFAC2014 website http://www.arb.ca.gov/emfac/2014/

101
Table 19: Baseline Factors based on California Fleet Average for 2015 Derived Using CARB’s EMFAC2014 Model
Vehicle Class Light-Duty Truck (3,751 to 5,750 lb. GVWR) (gram/mile)
Medium-Duty Vehicle (5,751 to 8,500 lb. GVWR) (gram/mile)
Fuel Type Gasoline Diesel Gasoline Diesel
Reactive Organic Gases (ROG) 0.27 0.0254 0.36 0.0226
Carbon Monoxide (CO) 2.32 0.1792 3.44 0.2549
Oxides of Nitrogen (NOX) 0.28 0.1091 0.44 0.1036
Carbon Dioxide (CO2) 461.15 392.70 600.55 517.26
Particulate Matter 10 micron (PM10) 0.0024 0.0115 0.0026 0.0126
Particulate Matter 2.5 micron (PM2.5) 0.0022 0.0110 0.0024 0.0120
Sulfur Oxides (SOX) 0.0046 0.0037 0.0061 0.0049
Fuel Consumption (miles per gallon) 18.31 25.64 14.04 10.49
Fuel Consumption (gallons per mile) 0.0546 0.0390 0.0712 0.0953
NOTE: PM2.5 is a subset of PM10, these are not additive.
Source: Clean Fuel Connection, Inc. staff derivation of fuel consumption and emission factors using EMFAC2014.
7.2.1.2 Project Emission Reductions: Actual Field Demonstration Results The factors detailed in Table 20 are applied to the 288 miles traveled to estimate the actual criteria pollutant emissions in pounds instead of grams and fuel consumption reduction for the project demonstration.
It is important to understand that Table 20 provides four estimates of the demonstration project reductions for four different baseline scenarios. For example, if one assumes the baseline truck being replaced by the RailScout is a light-duty gasoline truck, then an estimate of the reduction benefits is shown in the first data column. Similarly, if it is assumed that the baseline truck being replaced by the RailScout is a medium-duty diesel vehicle, then the estimated reduction benefits are shown in the last data column. Although Table 20 includes CO2, which is a GHG, a more thorough analysis of potential GHG reductions is provided in a later section.

102
Table 20: Emission and Fuel Consumption Reduction Estimates for the Field Demonstration (288 miles) for Four Different Baseline Vehicle-Type Scenarios
Vehicle Class Light-Duty Truck (pounds)
Medium-Duty Vehicle (pounds)
Fuel Type Gasoline Diesel Gasoline Diesel ROG 0.17 0.02 0.23 0.01 CO 1.47 0.11 2.18 0.16 NOx 0.18 0.07 0.28 0.07 CO2 292.79 249.33 381.3 328.42 PM10 0.002 0.0073 0.0016 0.0080 PM2.5 0.001 0.0070 0.0015 0.0076 SOx 0.003 0.002 0.004 0.003 Fuel Use Reduction (total gallons reduced) 15.73 11.23 20.51 27.45
NOTE: PM2.5 is a subset of PM10; they are not additive.
Source: Clean Fuel Connection, Inc. staff calculations.
Below are two examples to assist data interpretation for Table 21 (above):
• If the RailScout replaced a gasoline-fueled light-duty truck for the 288-mile, two-month deployment period, then 15.73 gallons of gasoline, 0.18 pounds of NOx and 0.002 pounds of PM10 were reduced, respectively.
• If the RailScout replaced a diesel-fueled medium-duty truck for the 288-mile, two-month deployment period, then 27.45 gallons of diesel, 0.07 pounds of NOx and 0.008 pounds of PM10 were reduced, respectively.
The estimated deployment emissions reductions for the prototype unit were minor, since they were evaluated over such a low number of miles. Thus, in order to more effectively assess the potential project benefits, it is necessary to consider larger scale implementation of the technology. The estimated projected benefits that follow assume a wider-scale implementation.
7.2.2 Projected Emission Reductions This section provides benefits projections for two scenarios. The first is a projection of the commercialized RailScout and the second looks beyond the RailScout to the large scale manufacture (and therefore sales) of Quallion’s battery system, the primary subject of this project. 7.2.2.1 Projected Emission Reductions for the Commercialized RailScout According to the Federal Rail Administration, there are approximately 220,000 miles4 of railroad track throughout the U.S. For this analysis, it is assumed that this entire track is inspected three times per month, or 36 times per year, for a total of 7.92 million “track inspection” miles per year.
4 “Federal Railroad Administration: Railroad Security System,” presentation by William J. Fagan. https://rsac.fra.dot.gov/radcms.rsac/File/DownloadFile?id=678. Accessed November 3, 2015

103
Table 21 shows the benefits of conducting all railroad track inspections with zero-emission vehicles such as the RailScout converted to tons per year.
Table 21: Estimated Annual Emissions and Fuel Consumption Reduction Benefits of Inspection of All U.S. Railroad Track with Zero Emission RailScout Vehicles
Vehicle Class Light-Duty Truck (3,751 to 5,750 lb. GVWR) tons per year
Medium-Duty Vehicle (5,751 to 8,500 lb. GVWR) tons per year
Fuel Type Gasoline Diesel Gasoline Diesel
ROG (tpy) 2.37 0.22 3.13 0.20
CO 20.26 1.56 30.04 2.23
NOx 2.43 0.95 3.83 0.90
CO2 4,026 3,428 5,243 4,516
PM10 0.021 0.01 0.023 0.11
PM2.5 0.019 0.096 0.021 0.105
SOx 0.04 0.03 0.05 0.04
Fuel Use Reduction (gallons per year)
432,347 308,548 563,777 755,000
NOTE: PM2.5 is a subset of PM10, these are not additive.
Source: Clean Fuel Connection, Inc. staff calculations.
The Table 21 (above) results are a function of the baseline technology that the RailScout would replace. Examples of how these results can be interpreted include:
• If the zero-emission rail inspection equipment, such as the RailScout, replace light-duty diesel trucks (which are assumed in this case to conduct all the rail track inspections), then 0.95 tons of NOx and over 308,500 gallons of diesel fuel consumption would be reduced in one year, respectively.
• If the zero-emission rail inspection equipment, such as the RailScout, replace medium-duty gasoline vehicles (which are assumed in this case to conduct all the rail track inspections), then 3.83 tons of NOx and over 563,000 gallons of gasoline fuel consumption would be reduced in one year, respectively.
Land Systems Corporation projects that upon exiting the prototype demonstration phase, they will place 60 units in service each year over the following ten years, for a total fleet implementation in the U.S. of 600 units by about 2025. This fleet implementation would provide more than adequate capacity to meet the needs in the above projection. 7.2.2.2 Projected Emission Reductions of Battery-Electric Vehicles Since the primary objective of this project was to establish a pilot manufacturing line for lithium-ion batteries, with the goal to manufacture battery systems in California to support a wider variety of zero-emission transportation platforms, the project team also considered a

104
more generic approach to evaluate project benefits. This approach assumes the State of California is successful in meeting its Low Carbon Fuel Standard (LCFS) regulation. This regulation requires5 that the State of California achieve a ten percent reduction in carbon intensity (CI) of transportation fuels by the year 2020. There are a variety of methods that California will meet this goal to reduce CI by ten percent, including battery-electric technology. Since battery technology is needed for all electric vehicles, Quallion’s battery manufacturing facility will support successful implementation of zero-emission vehicles as a contributing strategy to meet the LCFS.
To illustrate the significant potential benefits of zero-emission vehicles, a benefits analysis that assumes ten percent replacement of gasoline vehicles in the light-duty truck and medium-duty vehicle categories is summarized in Table 22. The same baseline factors derived from EMFAC that are provided in Table 22 are used for this analysis. Essentially, ten percent of the vehicle miles travelled in the two weight classes is assumed to be replaced with zero-emission propulsion technology, providing a substantial reduction in emissions and fuel consumption.
Table 22: Benefits of Replacing 10 Percent of Existing Gasoline Vehicles with Zero-Emission Vehicles
Vehicle Class Light-Duty Truck tons per year
Medium-Duty Vehicle tons per year
Fuel Type Gasoline Gasoline
ROG (tpy) 1,892 1,792
CO 16,185 17,192
NOx 1,943 2,193
CO2 3,126,987 3,000,325
PM10 16.78 12.93
PM2.5 15.46 11.92
SOx 32.39 30.25
Fuel Use Reduction (gal/yr) 345,000,000 322,000,000
PM2.5 is a subset of PM10; these are not additive. The columns in this table are not additive.
Source: Clean Fuel Connection, Inc. staff calculations.
Each column represents the reductions that result from replacing ten percent of current vehicles in the specified weight class and fuel type with zero-emission technology. This analysis does not assume the replacement of a mix of vehicle class/fuel. The analysis is provided to illustrate the importance of zero-emission technology development and implementation. Replacement of just ten percent of gasoline or diesel fueled vehicles in these
5 California Air Resources Board LCFS Final Regulation Order https://ww2.arb.ca.gov/sites/default/files/classic//fuels/lcfs/fro_oal_approved_clean_unofficial_010919.pdf

105
vehicle weight classes provides significant air emission and petroleum fuel consumption reductions.
7.2.3 Carbon Intensity The various criteria pollutants and GHG released while a fuel burns in an internal combustion engine are not the only source of air pollution from transportation. Under the LCFS regulation, the California ARB defined6 a life cycle analysis technique to consider a sum of the GHG emissions from all aspects of bringing a fuel to market i.e., production, refining, and transportation, in addition to the vehicle emissions. Carbon intensity can be compared among unlike transportation modes because it is a ratio of grams of carbon dioxide equivalent GHG emission per megajoule chemical energy (carbon dioxide equivalent (CO2e) /megajoule), adjusted for efficiency. The carbon intensity of any battery electric light-duty or medium-duty vehicle is 36.5 gCO2e/ megajoule. Gasoline vehicle carbon intensity is 99.78 gCO2e/ megajoule. Using these carbon intensity factors provided by LCFS, GHG emission reduction benefits are estimated in Table 23 below when:
• The amount of energy to charge the battery modules times the estimated range per charge is how the uniqueness of the design is included.
• When commercialized, the RailScout is projected to operate 120 miles per day, five days per week, 52 weeks per year, for 31,200 annual miles.
Per the LCFS methodology, the GHG reduction for this scenario is almost 19.5 metric tons of CO2e in one year for a single zero-emission RailScout that replaces a gasoline truck when 1700 gallons of gasoline are replaced.
Using the equations in Table 23, during the 288 miles of actual operation, 15.7 gallons of gasoline were estimated to have been replaced by electricity to power the prototype vehicle and 0.18 metric tons of CO2e were reduced.
6 Staff Report: Initial Statement of Reasons for Proposed Rulemaking for the Proposed Re-Adoption of the Low Carbon Fuel Standard, California Air Resources Board, December 2014. http://www.arb.ca.gov/regact/2015/lcfs2015/lcfs15isor.pdf

106
Table 23: Greenhouse Gas Reduction by Carbon Intensity Method
This assessment of GHG emission reductions considers light duty, gasoline fueled trucks as the single baseline vehicle configuration. This technique is from 2015 LCFS by the ARB.
Source: Akasha Kaur Khalsa

107
7.2.4 Speculative GHG Cost-Effectiveness A ten year “cost-benefit” has been incorporated into the ARFVT Program7 since Assembly Bill 8 reauthorization. The “benefit” is an estimate of potential greenhouse gas emissions reduction benefits from all these vehicles over 10 years as shown in Table 24.
Table 24: Ten Year Benefit-Cost Ratio 5,700 Metric Ton (MT) CO2e/Million Dollars
Technique from 2014 Integrated Energy Policy Report by the CEC
Source: Akasha Kaur Khalsa
If the battery modules produced by the automated manufacturing system were used for RailScouts or some equivalent electric vehicles, they would operate for years after delivery too, accumulating 2,040 years of service. Assume (from above) 19.46 MT CO2e/vehicle-year of greenhouse gas emissions were prevented. The “cost” is the ARFVTP funding amount of
7 2014 Integrated Energy Policy Report. CEC. p 59-60. https://www.energy.ca.gov/data-reports/reports/integrated-energy-policy-report

108
almost 7 million. Dividing the benefit by the cost produces a benefit-cost ratio8 of 5,700 MT CO2e/million dollars of grant funding. Inversely, this speculative math yields $174/MT CO2e.
Another way to look at “Cost-effectiveness” is defined by the Carl Moyer CARB methodology as the annualized incremental cost of a technology, divided by the annual emission reductions in units of tons per year. Incremental cost is the extra cost of the advanced technology that is over and above the cost of the baseline (i.e., conventional) technology. The incremental cost for the RailScout is estimated at $75,000. A discount factor of two percent is estimated to determine the annualized cost. For GHG cost effectiveness, 13 metric tons of CO2e are used as the emissions reduction unit of measure.
Assuming a ten-year project life and 31,200 miles of operation per year the project cost-effectiveness is $595 per metric ton of CO2e.
To place this in some context, the 2010 Los Angeles County Metropolitan Transportation Authority report entitled “Greenhouse Gas Emissions Cost Effectiveness Study9” considers $300 to $900 per ton to have moderate cost-effectiveness; while projects at greater than $1,000 per ton GHG are considered to have poor cost-effectiveness. Note that this cost-effectiveness does not take into account the fuel cost savings that will be achieved by powering an industrial vehicle with less expensive electric power.
The project’s primary objective was to expand manufacturing of battery technology in California. Any method of examining cost-effectiveness is difficult because a whole battery automation line was created from scratch, not just power for one prototype electric vehicle. Because of the great uncertainty in predicting future benefit, a low $174/MT CO2e and high $595/MT CO2e range was estimated.
7.3 Economic Benefits 7.3.1 Pilot Battery Module Assembly Line Cost Savings Quallion produced thirty-one (31) modules on the validated semi-automatic module assembly equipment, as well as control modules using Quallion’s current hand-built process. The produced modules contained 140 18650 cells embedded into 14 pieces (10 cells each) of heat absorbing material, acting as cell holders, and five Ni plates used as cell interconnects. Both the semi-automated and hand-built processes consisted of four different steps:
1. Assembly of the heat absorbing material, population of the heat absorbing material honeycomb with cells and installation of nickel tabs for side 1 of the module
2. Weld side 1 of the module
3. Installation of nickel tabs for side 2 of the module
4. Weld side 2 of the module
8 2016-2017 Investment Plan Update for the Alternative and Renewable Fuel and Vehicle Technology Program. Jacob Orenberg. https://ww2.energy.ca.gov/2015publications/CEC-600-2015-014/CEC-600-2015-014-CMF.pdf page 22
9 Greenhouse Gas Emission Cost Effectiveness Study http://media.metro.net/projects_studies/sustainability/images/GHGCE_2010_0818.pdf, accessed 11/3/15, p. 59

109
Assembling these packs using Quallion’s the hand-built methodology is very labor intensive. Step 1 involves building up the honeycomb, populating it with cells and then adding the nickel tab, and holding it in place with tape. An operator must take 14 of the individual heat absorbing material pieces and arrange them in the proper configuration. Each honeycomb cavity has a cell inserted and pushed into the heat absorbing material. The nickel interconnect is then added and lined up with one side of the pack. This first step takes approximately 60 minutes when done by hand. When using the semi-automated equipment, heat absorbing material pieces can be populated individually, with the cells fully inserted via pneumatic press, followed by assembly of the populated heat absorbing material pieces into the final module configuration. Through use of this technique, the total process time for the first step can be reduced by 50 percent to 30 minutes per module.
Step 2 requires each cell/tab junction to be welded and aligned manually. With a total of 140 weld locations done individually, step 2 takes approximately 60 minutes of labor. Steps 3 and 4, which are identical to the final process of step 1 and the entire process of step 2, takes approximately 15 minutes and 75 minutes, respectively. When steps 2 through 4 are performed on the module assembly automated equipment, the labor time involved is reduced to 30, 10, and 20 minutes for steps 2 through 4, respectively (Table 25). An additional benefit obtained through use of the automated module assembly equipment beyond increased throughput is the realization of higher per step yields. Both reduced run time and increased yield allow for significant cost reductions.
Table 25: Labor Reduction Realized from Semi-Automatic Module Assembly
Assembly Time (minutes) Estimated Yield (%)
Old Method New Method Old Method New Method
OP 10 60 30 100 100
Op 20 60 30 90 99
Op 30 15 10 100 100
OP 40 75 20 90 99
Total 210 90 81 98
Source: Quallion, LLC staff assessment
Quallion has enhanced its capacity to design, produce, and test advanced lithium-ion battery modules and to incorporate these modules along with BMS electronics into powerful battery systems, both of major economic benefit to the State of California.
7.3.2 Ancillary Project Benefits The potential ancillary economic benefit of this project to the State of California comes from two sources. The first is the direct benefit from the commercialization of the RailScout battery-powered rail inspection equipment; the second is rail safety.
California has 8,600 miles of rail that require safety inspection. Assuming bi-weekly inspections for most of these miles, that is over 223,000 miles of track inspection annually. With the growth of subways, light rail and commuter rail in Northern and Southern California, the demand for inspection vehicles will only grow.

110
Market growth is expected worldwide. The genesis of the RailScout concept was a request from the High Speed Rail Authority in Spain for a clean, low cost rail inspection option. In Spain, the tracks for the High Speed train must be inspected every day before rail service begins. Since the Rail Authority does not own any rail inspection equipment, it must rent a locomotive to inspect the tracks every day. This is an expensive solution that results in additional vehicle emissions. The Spanish Rail Authority was interested in the development of a lower cost and less polluting option. The RailScout could be used for the daily track inspection, saving money and reducing emissions in any urban or rural setting around the globe, because freight by rail is efficient and widely prevalent.
The RailScout is also designed to fulfill the need for cost-effective track inspection in the U.S. According to the Federal Rail Administration10, there are over 220,000 miles of train track in the U.S. These tracks fall into Track Classes 1 to 9 based on the speed of the trains and whether they run passenger or freight service.
Rail safety has come under increased scrutiny as a result of a number of high profile derailments around the country in 2015. Most of these involve the transportation of oil. The Federal Railroad Administration in response issued new safety guidelines. These proposed regulations should only increase the demand for clean inspection vehicles such as the RailScout.
Federal regulations require routine track inspections every two weeks or more frequently.11
The inspection procedure for Class 1 to 5 tracks is described below.
Each inspection shall be made on foot or by riding over the track in a vehicle at a speed that allows the person making the inspection to visually inspect the track structure for compliance with this part…. If a vehicle is used for visual inspection, the speed of the vehicle may not be more than 5 miles per hour when passing over track crossings and turnouts, otherwise, the inspection vehicle speed shall be at the sole discretion of the inspector, based on track conditions and inspection requirements. When riding over the track in a vehicle, the inspection will be subject to the following conditions –
(1) One inspector in a vehicle may inspect up to two tracks at one time provided that the inspector’s visibility remains unobstructed by any cause and that the second track is not centered more than 30 feet from the track upon which the inspector is riding; (2) Two inspectors in one vehicle may inspect up to four tracks at a time provided that the inspector’s visibility remains unobstructed by any cause and that each track being inspected is centered within 39 feet from the track upon which the inspectors are riding. Section 213.365 of 49 CFR contains similar language for track classes 6–9. For Classes 6 to 9 automated inspections via special rail cars is also required.
10 “Federal Railroad Administration: Railroad Security System,” presentation by William J. Fagan. https://rsac.fra.dot.gov/radcms.rsac/File/DownloadFile?id=678 Accessed November 3, 2015.
11 Track Safety Standards (TSS). Subpart F (49 CFR § 213.233) addresses the requirements for track classes 1–5, while Subpart G (49 CFR § 213.365) addresses track classes 6–9, passenger operations.

111
Table 26 lists the required frequency of inspection by Class of Track and type of rail service.
Table 26: Required Frequency of Inspection
Source: U.S. Department of Transportation, Federal Railroad Administration, Track Inspection Time Study July 2011. https://rsac.fra.dot.gov/radcms.rsac/task/GetDocument/19 p. 21.
The Federal Rail Administration’s “Track Inspection Time Study” July 2011 studied a sample of track inspections and found that the largest number were done by vehicles with some on-foot inspections. The vehicles averaged 65 track miles of inspection per day.
The California High Speed Rail project will add another several hundred miles of tracks. Since the system will run from San Francisco to the Los Angeles basin in under three hours at speeds of over 200 miles per hour by 202912, old manual inspection speeds will not be feasible. Battery-powered, automated inspection will be necessary to achieve the environmental benefit of the high speed rail program.
This project advances technology for electric vehicles in the California supply chain. ARFVTP is installing thousands of public electric vehicle chargers in California. Californians purchased or leased more than 100,000 zero emission vehicles by October 2014.13 Generally, Quallion will promote the sale of its battery modules for the zero emission vehicles marketplace and specifically in rail inspection and mining vehicles. This project does not influence vessels or engines.
12 California High-Speed Rail Authority http://www.hsr.ca.gov/About/index.html
13 California Air Resources Board New Release http://www.arb.ca.gov/newsrel/newsrelease.php?id=670

112
Rail inspections are provided by a variety of vehicles that fall into the light-duty truck and medium-duty truck categories. On-road light and medium duty vehicles such as Ford 350 trucks (Figure 101) or Chevy Silverado (Figure 102) are up-fitted with special equipment that allow the truck to drive on the rails and check the width of the gauge. These up-fitted vehicles are called High Rail Vehicles and are the ones that the RailScout would replace.
Figure 101: High Rail Vehicle Example 1
Photo source: Loram Maintenance of Way, Inc.

113
Figure 102: High Rail Vehicle Example 2
Photo source: ENSCO, Inc. https://www.ensco.com/rail/track-inspection-vehicles
This project is a big advancement for manufacturing battery modules suitable for electric vehicles in California. Another possible market is the broader application of battery systems to other high voltage applications. Battery-powered electric drive motors are already being used in light duty on-road vehicles, in light duty forklifts and airport ground support equipment and for power take-off (PTO) and mileage enhancement in hybrid work trucks. There is potential for battery technology in other medium and heavy horsepower applications such forklifts, marine vessels, port operations, refrigerated trucks and commercial buses. Each of these large scale applications will require a battery system to optimize performance for each type of operation. Every battery system that replaces a diesel powered system in transportation allows the victory of the California Renewables Portfolio Standard Program and the 2003 Integrated Energy Policy Report14, both with the bold sustainability goals to increase the percentage of renewable energy in the state's electricity mix.
14 California Energy Commission Renewable Energy Website http://www.energy.ca.gov/renewables/

114
Quallion’s battery systems are targeted to be used in various applications including hybrid electrical vehicles, Advanced Start-Stop Vehicles (with battery charging braking), and underground mining vehicles.
In the underground mining industry energy supply is one of the biggest challenges, as mines all over the world try to cut costs and increase efficiency. The price of diesel to fuel underground equipment is the biggest “villain”, closely followed by the soaring cost of energy to power large scale ventilation systems which commonly represent as much as 30 percent of a mine’s total running costs. Human miners are dependent on a constant supply of clean air in order to breathe and carry out their duties underground without risking their health. This means that the toxic emissions from diesel powered equipment have to be constantly evacuated by ventilation systems which require significant amounts of energy, irrespective of the size and complexity of the mine structure.
By replacing diesel powered equipment with electric powered equivalents, mines can realize huge potential savings at the same time as they improve the environment, increase sustainability, and reduce personnel turnover, with the spin-off effect of increased job satisfaction.
Quallion’s project designed the modular high voltage battery system with lithium-ion batteries appropriate for these vehicles. By providing more energy and the ability to charge on board the vehicle (due to fast charging capability), the mining operation can increase its productivity. Once the mining industry accepts the use of lithium-ion batteries in underground operations, new opportunities arise for battery and hybrid drive vehicles that traditionally rely on diesel engines emerge, such as loaders, bolters and feeder breakers. 7.3.2.1 Jobs Created This project to establish a pilot manufacturing line for lithium ion modules for use as building blocks for battery systems in electric vehicle applications created a dozen temporary jobs and 2 ½ permanent jobs in Southern California. The temporary jobs created included:
• 1 planning and permitting for ¾ year • 6 construction for ½ year • 1 engineering for ½ year • 1 operations and maintenance for 1 year • 2 skilled labor for ½ year • 1 administrative (clerical) for ¾ year
The permanent jobs created included:
• 1 engineering • 1 skilled labor • ½ operations and maintenance
Additionally, work continues for permanent positions in the pilot manufacturing line created by this project to fabricate and test proof of concept cells in support of business development’s pursuit of new potential opportunities for Quallion produced batteries:
• 2 cell assemblers • 1 battery assembler

115
• 1 technician The potential future production of Quallion’s EV vehicle batteries in California for domestic and international commercialized applications postulated above would easily double the number of permanent new jobs in the areas of engineering, cell assembler, battery assembler, technician, and operations and maintenance personnel. 7.3.2.2 Health, Safety and Quality of Life Benefits In addition to the economic and safety benefits of this project, there are additional health and quality of life benefits. Diesel emissions have already proven to be a carcinogen and a major cause of air pollution. The health impacts of air pollution in terms of lost workdays, respiratory illnesses and even normal developmental growth are well documented. This is particularly true for the rail yard workers who would benefit from the RailScout EV by being indoors inspecting rails by high tech remote control and avoiding exposure to the exhaust fumes of the manned inspection vehicles currently in use.
Just to cite one example, a recent study by East Yard Communities for Environmental Justice (Figure 103) documents the increased cancer risk for neighborhoods near rail yards.15
Figure 103: East Yard Communities for Environmental Justice: Diesel Cancer Risk
Photo source: Multidisciplinary Digital Publishing Institute http://www.mdpi.com/1660-4601/11/2/1914
15 East Yard Communities Website http://eycej.org/new-study-examines-race-and-income-near-californias-18-major-railyards/

116
The impacted areas also parallel rail lines and highways. By replacing gasoline or diesel high rail inspection vehicles, the RailScout will reduce the amount of toxic emissions in these already heavily impacted, typically disadvantaged, communities adjacent to the rail lines.
The Quallion facility is in close proximity to railroad lines in Sylmar, CA, in northern Los Angeles County. The area has the very high 95 percent hazardous waste score and 69 percent ozone, with the overall CalEnviroScreen Score of 71-75 percent.16
It is important to note that the Quallion facility has 6 on-site charging stations for use at no cost to its employees and local residents, so the resulting improvement in air quality due to the use of EVs by Quallion employees and its neighbors is a direct quality of life benefit to the local community. They were not funded by the grant.
7.4 Building Energy Efficiency Benefits During manufacturing, battery materials require extremely low humidity. Lithium can burst into flames if it comes into contact with water. The renovations in the Quallion manufacturing facility to enable anode and cathode spools to be exposed to the room air for winding on the new manufacturing machinery demanded air control separated from the rest of the building, by a dedicated dehumidifier and building features like air-flow-impervious walls and ceilings.
All California Energy Code17 energy conservation standards were met for “clean room” and “dry room” manufacturing conditions. This construction was in accordance with applicable Los Angeles County and state California Building Standard Codes with appropriate building permit inspections throughout the construction process. The construction did not exceed Title 24.
16 Office of Environmental Health Hazard Assessment (OEHHA), California Communities Environmental Health Screening Tool: CalEnviroScreen Version 2.0 http://oehha.ca.gov/ej/ces2.html accessed 4/14/16.
17 California Energy Code https://www.energy.ca.gov/programs-and-topics/programs/building-energy-efficiency-standards

117
CHAPTER 8: Conclusions and Recommendations
8.1 Achievement of Goals and Objectives Through the establishment of a Pilot Manufacturing Line for Lithium Ion Modules for Use as Building Blocks for Battery Systems in Electric Vehicle Applications, Quallion has enhanced its capacity to design, produce, and test advanced lithium ion battery module systems and to successfully integrate these battery module systems into electric vehicle applications.
This project has improved Quallion’s ability to respond to new and larger business opportunities that are arising given the increasing demand for electric power vehicles in response to reduce pollution and GHG emission targets in California and nationwide.
8.2 Results Obtained The successful design, construction, and equipment validation of the Pilot Manufacturing Line for Lithium Ion Modules for Use as Building Blocks for Battery Systems in Electric Vehicle Applications and its implementation to develop, fabricate and integrate a battery module and BMS system into the RailScout EV demonstrated the excellent work of the project team. As discussed earlier, the project met original project goals and key results summarized below:
• Quallion has enhanced its capacity to design, produce, and test advanced lithium-ion battery modules and to incorporate these modules along with BMS electronics into vehicle systems to meet the growing demand for electric vehicles in California.
• A pilot manufacturing line for lithium ion modules for use as building blocks for battery systems in electric vehicle applications was implemented.
• State of the art manufacturing and test equipment was procured, installed and validated.
• The design, fabrication, tests and integration of modules and BMS electronics into the RailScout EV were successfully completed.
• The RailScout was successfully deployed for field demonstration at railroad sites in Fillmore, California and New Orleans, Louisiana.
• The emissions reductions resulting from a two-month field demonstration period of a pilot device were calculated.
• A projected RailScout commercial implementation was used to estimate possible pollutant emission reduction per year and the potential GHG Cost-Effectiveness of the project.
• To illustrate the significant potential benefits of zero-emission vehicles, a benefits analysis that assumes electric vehicles replace ten percent of diesel vehicles in the light-duty truck and medium-duty vehicle categories suggests that the potential savings of diesel fuel usage are 300,000 gallons/year and 2,300,000 gallons/year, respectively. Assuming a retail price for diesel fuel of $2.33/gallon higher than the electric “fuel” (Ref. U.S. Energy Information Administration), the corresponding potential annual savings are $715K and $5.4M, respectively. Since each year 1.5 billion gallons of diesel fuel are sold in California, 0.15 percent diesel sales could be reduced.
118
• A key expectation of the pilot manufacturing line was to determine whether mass production of Quallion designed cells was feasible. Accordingly, the automated processes capabilities goals were established for the pilot manufacturing line in anticipation of future production demands. Subsequent production process capability validation demonstrated that the pilot manufacturing line was capable of mass producing 200,000 cells per year, meeting the established goal which represented twice the combined forecasts from all EnerSys business area leads as of March 2014.
8.3 Conclusions Quallion is pleased with the results of this project. The success of this project could not have been achieved without Quallion’s and Land System’s committed project teams and the railway customer’s cooperation. The process of establishing a state-of-the art Pilot Manufacturing Line for Lithium Ion Modules for Use as Building Blocks for Battery Systems in Electric Vehicle Applications for a non-traditional EV application such as the RailScout posed unique challenges, key of which were the successful development and integration of a lithium-ion battery system and BMS electronics into a specialized vehicle that was being developed concurrently in a short period of time.
8.4 Recommendations Quallion recommends that future upgrade and follow-on projects include sufficient planning time to coordinate with local railway customers to expand and facilitate access to local railroad track test sites. This will improve test and demonstration logistics and also broaden the exposure and public awareness of this exciting EV application.
In order to enhance the battery system operational reliability particularly in severe environments, modifications are recommended for improved thermal transfer in the battery pack (i.e. redesign of bus bar/nickel tab components configuration) to increase heat dissipation during high-current discharges.
Quallion believes that through continuous improvement efforts and the implementation of the latest technology and processes into the lithium-ion pilot manufacturing line for lithium-ion modules for use as building blocks for battery systems in electric vehicle applications, significant improvements in the energy efficiency, cost effectiveness and reliability of battery modules can be achieved. This would enable Quallion’s battery systems to be an attractive option for EV customers for integration into a wider range of electric vehicles.
Quallion appreciates the CEC’s support, especially the agreement manager, Akasha Kaur Khalsa, whose guidance facilitated the successful execution of this project on-time and within budget.

119
GLOSSARY
ALTERNATIVE AND RENEWABLE FUELS AND VEHICLE TECHNOLOGY PROGRAM (ARFVTP)—Now known as the Clean Transportation Program, created by Assembly Bill 118 (Nunez, Chapter 750, Statutes of 2007), with an annual budget of about $100 million. Supports projects that develop and improve alternative and renewable low-carbon fuels, improve alternative and renewable fuels for existing and developing engine technologies, and expand transit and transportation infrastructures. Also establishes workforce training programs, conducts public education and promotion, and creates technology centers, among other tasks.
BATTERY MANAGEMENT SYSTEM (BMS)—Systems encompassing not only the monitoring and protection of the battery but also methods for keeping it ready to deliver full power when called upon and methods for prolonging its life. This includes everything from controlling the charging regime to planned maintenance.
CALIFORNIA AIR RESOURCES BOARD (ARB)—The "clean air agency" in the government of California whose main goals include attaining and maintaining healthy air quality, protecting the public from exposure to toxic air contaminants, and providing innovative approaches for complying with air pollution rules and regulations.
CALIFORNIA ENERGY COMMISSION (CEC)—The state agency established by the Warren-Alquist State Energy Resources Conservation and Development Act in 1974 (Public Resources Code, Sections 25000 et seq.) responsible for energy policy. The CEC's five major areas of responsibilities are:
1. Forecasting future statewide energy needs.
2. Licensing power plants sufficient to meet those needs.
3. Promoting energy conservation and efficiency measures.
4. Developing renewable and alternative energy resources, including providing assistance to develop clean transportation fuels.
5. Planning for and directing state response to energy emergencies.
Funding for the CEC's activities comes from the Energy Resources Program Account, Federal Petroleum Violation Escrow Account, and other sources.
CARBON DIOXIDE (CO2)—A colorless, odorless, nonpoisonous gas that is a normal part of the air. Carbon dioxide is exhaled by humans and animals and is absorbed by green growing things and by the sea. CO2 is the greenhouse gas whose concentration is being most affected directly by human activities. CO2 also serves as the reference to compare all other greenhouse gases (see carbon dioxide equivalent).
CARBON DIOXIDE EQUIVALENT (CO2e)—A metric used to compare emissions of various greenhouse gases. It is the mass of carbon dioxide that would produce the same estimated radiative forcing as a given mass of another greenhouse gas. Carbon dioxide equivalents are computed by multiplying the mass of the gas emitted by its global warming potential.

120
CARBON INTENSITY (CI)—The amount of carbon by weight emitted per unit of energy consumed. A common measure of carbon intensity is weight of carbon per British thermal unit (Btu) of energy. When there is only one fossil fuel under consideration, the carbon intensity and the emissions coefficient are identical. When there are several fuels, carbon intensity is based on their combined emissions coefficients weighted by their energy consumption levels.
CARBON MONOXIDE (CO)—A colorless, odorless, highly poisonous gas made up of carbon and oxygen molecules formed by the incomplete combustion of carbon or carbonaceous material, including gasoline. It is a major air pollutant on the basis of weight.
CONTROLLER AREA NETWORK (CAN)—A serial network technology that was originally designed for the automotive industry, especially for European cars, but has also become a popular bus in industrial automation as well as other applications. The CAN bus is primarily used in embedded systems, and as its name implies, is a network technology that provides fast communication among microcontrollers up to real-time requirements.28
ELECTRIC VEHICLE (EV)—A broad category that includes all vehicles that are fully powered by electricity or an electric motor.
GREENHOUSE GAS (GHG)—Any gas that absorbs infrared radiation in the atmosphere. Greenhouse gases include water vapor, carbon dioxide (CO2), methane (CH4), nitrous oxide (NOx), halogenated fluorocarbons (HCFCs), ozone (O3), perfluorinated carbons (PFCs), and hydrofluorocarbons (HFCs).
GROSS VEHICLE WEIGHT RATING (GVWR)—The maximum weight of the vehicle as specified by the manufacturer. Includes total vehicle weight plus fluids, passengers, and cargo.53
LITHIUM-ION (Li-Ion) BATTERY—A type of rechargeable battery. In the batteries lithium ions move from the negative electrode to the positive electrode during discharge and back when charging.
LOW CARBON FUEL STANDARD (LCFS)—A set of standards designed to encourage the use of cleaner low-carbon fuels in California, encourage the production of those fuels, and therefore reduce greenhouse gas emissions. The LCFS standards are expressed in terms of the carbon intensity of gasoline and diesel fuel and their respective substitutes. The LCFS is a key part of a comprehensive set of programs in California that aim cut greenhouse gas emissions and other smog-forming and toxic air pollutants by improving vehicle technology, reducing fuel consumption, and increasing transportation mobility options.
METRIC TON (MT)—A unit of mass equal to 1,000 kilograms.
NITROGEN OXIDES (OXIDES OF NITROGEN, NOx)—A general term pertaining to compounds of nitric oxide (NO), nitrogen dioxide (NO2), and other oxides of nitrogen. Nitrogen oxides are typically created during combustion processes and are major contributors to smog formation and acid deposition. NO2 is a criteria air pollutant and may result in numerous adverse health effects.
PARTICULATE MATTER (PM)—Unburned fuel particles that form smoke or soot and stick to lung tissue when inhaled. A chief component of exhaust emissions from heavy-duty diesel engines.
121
POWER TAKEOFF (PTO) - Secondary engine shaft (or equivalent) that provides substantial auxiliary power for purposes unrelated to vehicle propulsion or normal vehicle accessories such as air conditioning, power steering, and basic electrical accessories. A typical PTO uses a secondary shaft on the engine to transmit power... to a hydraulic pump that powers auxiliary equipment, such as a boom on a bucket truck. You may ask us to consider other equivalent auxiliary power configurations (such as those with hybrid vehicles) as power take-off systems.
PROCESS CAPABILITY (Cp)— Estimates what the process is capable of producing if the process mean were to be centered between the specification limits.18
PROCESS CAPABILITY INDEX (Cpk)— Estimates what the process is capable of producing, considering that the process mean may not be centered between the specification limits.19
REACTIVE ORGANIC GASSES (ROG)— A photochemically reactive chemical gas, composed of non-methane hydrocarbons, that may contribute to the formation of smog. Also sometimes referred to as Non-Methane Organic Gases (NMOGs).20
SULFUR OXIDES (SOx)—Pungent, colorless gases (sulfates are solids) formed primarily by the combustion of sulfur-containing fossil fuels, especially coal and oil. Considered major air pollutants, sulfur oxides may impact human health and damage vegetation.
VOLT (V)—A unit of electromotive force. It is the amount of force required to drive a steady current of one ampere through a resistance of one ohm. Electrical systems of most homes and offices have 120 volts.
18 Process Capability Wikipedia https://en.wikipedia.org/wiki/Process_capability
19 Process Capability Index Wikipedia https://en.wikipedia.org/wiki/Process_capability_index
20 Reactive Organic Gasses, California ARB Glossary https://ww2.arb.ca.gov/about/glossary?f%5B0%5D=name%3AR#search_anchor


![A pilot trial on lithium disilicate partial crowns using a novel … · 2019. 12. 9. · lithium disilicate material (Initial LiSi press, GC) has been reported [8]. Only few clinical](https://static.fdocuments.in/doc/165x107/611d4130777ab743257f5b01/a-pilot-trial-on-lithium-disilicate-partial-crowns-using-a-novel-2019-12-9.jpg)


