ESTABLISHMENT AND EXTENSION OF … ESTABLISHMENT AND EXTENSION OF INFORMATION SYSTEM FOR IRRIGATION...
8
1 ESTABLISHMENT AND EXTENSION OF INFORMATION SYSTEM FOR IRRIGATION WATER QUALITY MONITORING AND MANAGEMENT Chih Hung Tan Information Division, Agricultural Engineering Research Center (AERC) No. 196-1, Chung-Yuan Rd. Chungli 32084, Taiwan ROC ABSTRACT Water quality data collection and analysis are major tasks of irrigation water management among irrigation associations. With Geographic Information System (GIS) and web browser, regular water quality monitoring data can now be uploaded, browsed, traced, and analyzed more efficiently. In Taiwan, more than 2500 monitoring points are located along irrigation canals, recording water quality data such as temperature, acidity, and electrical conductivity every other month, producing a great amount of data spatially and temporally. To manage voluminous irrigation water sampling data, an integrated system, including data input, quality assurance/control and index calculation, is necessary for each character in this work. The traditional once every two-month water quality sampling practice is not enough to monitor the nightly discharge of polluted wastewater by some irresponsible factories. The field automatic sampling instrument and GIS continuously report the readings and locations of the water quality condition, thus enhancing the efficiency of water quality monitoring. In addition, the source tracing, irrigation subject and the affected area analysis approaches can assist the complicated mission of pollution source location and polluted area delineation. However, the above-mentioned function has to work with a complete irrigation canal GIS and a comprehensive pollution source database. Completion of the irrigation GIS and database is one of the future objectives of the Agricultural Engineering Research Center (AERC) of Taiwan. Key words: Irrigation water quality, Geographic Information System (GIS), database, Taiwan INTRODUCTION Irrigation provides water to crops effectively and continuously. The quantity and quality of water are equally important. Irrigation water in Taiwan mainly comes from river or surface sources and transmitted by open channels that are susceptible to various pollutions. More than 3000 water quality checkpoints were established along the irrigation canals in 17 irrigation associations to check water quality every other month. Water temperature, electric conductivity (EC) and acidity (pH) are sampled at the water quality check points by the staff of the irrigation association. The Agricultural Engineering Research Center (AERC) with financial support from the Council of Agriculture (COA), Taiwan has established a Farmland Irrigation Water Quality Monitoring and Management System, which collects water quality data from each of the irrigation association, manages those data in internet connected databases, and provides user interface for querying and displaying water quality information. GIS AND WATER QUALITY MANAGEMENT SYSTEM Geographic Information System GIS is a computer tool used to address new and existing water quality problems. GIS uses a computer database to store large quantities of spatial and temporal data. This allows for the integration of diverse types of information into a form that makes it possible to consider different approaches to land management and environmental problems before making management decisions. Spatial data describes how a specific feature is located or distributed in space. This type of information includes irrigation boundaries, soil type, channel
-
Upload
truongkhuong -
Category
Documents
-
view
227 -
download
1
Transcript of ESTABLISHMENT AND EXTENSION OF … ESTABLISHMENT AND EXTENSION OF INFORMATION SYSTEM FOR IRRIGATION...

1
ESTABLISHMENT AND EXTENSION OF INFORMATION SYSTEM FOR IRRIGATION
WATER QUALITY MONITORING AND MANAGEMENT
Chih Hung TanInformation Division, Agricultural Engineering Research Center (AERC)
No. 196-1, Chung-Yuan Rd.Chungli 32084, Taiwan ROC
ABSTRACT
Water quality data collection and analysis are major tasks of irrigation water management among irrigation associations. With Geographic Information System (GIS) and web browser, regular water quality monitoring data can now be uploaded, browsed, traced, and analyzed more efficiently. In Taiwan, more than 2500 monitoring points are located along irrigation canals, recording water quality data such as temperature, acidity, and electrical conductivity every other month, producing a great amount of data spatially and temporally. To manage voluminous irrigation water sampling data, an integrated system, including data input, quality assurance/control and index calculation, is necessary for each character in this work. The traditional once every two-month water quality sampling practice is not enough to monitor the nightly discharge of polluted wastewater by some irresponsible factories. The field automatic sampling instrument and GIS continuously report the readings and locations of the water quality condition, thus enhancing the efficiency of water quality monitoring. In addition, the source tracing, irrigation subject and the affected area analysis approaches can assist the complicated mission of pollution source location and polluted area delineation. However, the above-mentioned function has to work with a complete irrigation canal GIS and a comprehensive pollution source database. Completion of the irrigation GIS and database is one of the future objectives of the Agricultural Engineering Research Center (AERC) of Taiwan.
Key words: Irrigation water quality, Geographic Information System (GIS), database, Taiwan
INTRODUCTION
Irrigation provides water to crops effectively and continuously. The quantity and quality of water are equally important. Irrigation water in Taiwan mainly comes from river or surface sources and transmitted by open channels that are susceptible to various pollutions. More than 3000 water quality checkpoints were established along the irrigation canals in 17 irrigation associations to check water quality every other month. Water temperature, electric conductivity (EC) and acidity (pH) are sampled at the water quality check points by the staff of the irrigation association. The Agricultural Engineering Research Center (AERC) with financial support from the Council of Agriculture (COA), Taiwan has established a Farmland Irrigation Water Quality Monitoring and Management System, which collects water quality data from each of the irrigation association, manages those data in
internet connected databases, and provides user interface for querying and displaying water quality information.
GIS AND WATER QUALITY MANAGEMENT SYSTEM
Geographic Information System
GIS is a computer tool used to address new and existing water quality problems. GIS uses a computer database to store large quantities of spatial and temporal data. This allows for the integration of diverse types of information into a form that makes it possible to consider different approaches to land management and environmental problems before making management decisions. Spatial data describes how a specific feature is located or distributed in space. This type of information includes irrigation boundaries, soil type, channel

2
location, water quality checkpoints, and land use/land cover. The use of GIS allows people to process and evaluate this large amount of data. Information stored in a GIS will come from various sources. The greater the quantity and quality of the information, the more complete the GIS database will be. Sources of information include satellite images, aerial photographs, and soil maps from agricultural experimental station. Data is entered in the GIS database and the software builds a map of the area. Actually, the computer builds what are called layers — separate maps of the same area —
each of which contains different sets of information or themes. These maps are built by providing the computer with geographic coordinates identifying the location of various features (spatial data). GIS maps can contain information on ownership boundaries and the location of man-made features such as roads, houses, and developed areas. They may also contain information on soil type, slope, land use, land cover, and the location of streams, rivers, lakes, and other bodies of water. Land use information from different points in time is entered into the database. This temporal data allows the GIS user to track changes in land use that have occurred over time (temporal changes). Information on water quality can be entered into the database, and, if the location of sample sites is known, these data can be linked to specific locations. This allows the GIS user to make connections between the type
of land use and various physical properties and the quality of water within the area of interest.
Integrated Irrigation Water Quality System
The Integrated Irrigation Water Quality System was developed by the Agricultural Engineering Research Center (AERC) to assist the 17 irrigation associations to key-in, upload and manage water quality data using web browser. The database-driven program was designed to check data right after the users key-in their numbers and carry out a series of checks to prevent typing errors or unrealistic numbers. The basic records of water quality checkpoints need to be verified before uploading field data in order to prevent inconsistency of checkpoints. A staff of the irrigation association completes this task. Field sampling is performed at the working station every other month. The uploaded data are then verified by the water quality task manager of irrigation association and kept in the database. Fig. 1 demonstrates the work of irrigation water quality report in three sections: irrigation working stations, irrigation associations, and water quality laboratories.
Irrigation Water Quality Checkpoints and GIS
Water quality checkpoints are crucial since they present not only the water quality data but also the
Fig. 1. The operation of irrigation water quality report was divided in three units: irrigation working stations, irrigation associations and water quality laboratories.

3
spatial distribution of pollution sources (Figs. 2 and 3). The AERC has completed the location survey by GPS and created water quality checkpoints layer with 2606 points and discharge points layer with 4116 points in GIS. Other related GIS map layers include: irrigation association administrator boundary maps, irrigation and drainage canal maps, location of surface water intake, groundwater wells, and irrigation structures. The
water quality related map layers are distribution of checkpoints, discharge locations, EPA river water quality checkpoints, EPA reservoir water quality checkpoints, and EPA groundwater points. There are also project-derived maps of severely polluted irrigation area, heavy metal polluted soils, level-5 heavily polluted farmlands, and possible pollution sources. In addition, basic map layers include roads, city boundary, county boundary, township
Fig. 2. Basic browser page of water quality checkpoints data inquiry.
Fig. 3. Water quality of routine sampling, including water temperature, pH, EC, and DO values.

4
boundary, highways, state roads, county roads, rivers, railroads, and tags of road names. The above-mentioned map layers can be selected as necessary to add to the GIS system. In the GIS system, functions of fast addressing, text to map query, map to text query, neighborhood analysis are provided. The water quality GIS is capable of displaying checkpoints and discharge points for a single irrigation association. Figures 5 and 6 demonstrate water quality checkpoints and discharge points for the Changhua Irrigation Association.
Irrigation Water Quality Monitoring and Early Warning
The water quality database, uploaded from each of the irrigation association and kept in disk array in the AERC, can be inspected, queried, and displayed in real time. Historical water quality variation of specific location can be easily displayed. Fig. 7 shows the inquiry web-page of routine sampling results of the Changhua Irrigation Association. Each discharge unit has various information in the database, including code of the point, discharge category, name of the point, associated water quality
Fig. 4. Irrigation water quality GIS map layers selection and buttons of control functions.
Fig. 5. Water quality checkpoints of the Changhua Irrigation Association, with overlaid map layers of administrative boundary and rivers.
Fig. 6. Discharge points of the Changhua Irrigation Association, with overlaid map layers of administrative boundary and rivers.
5
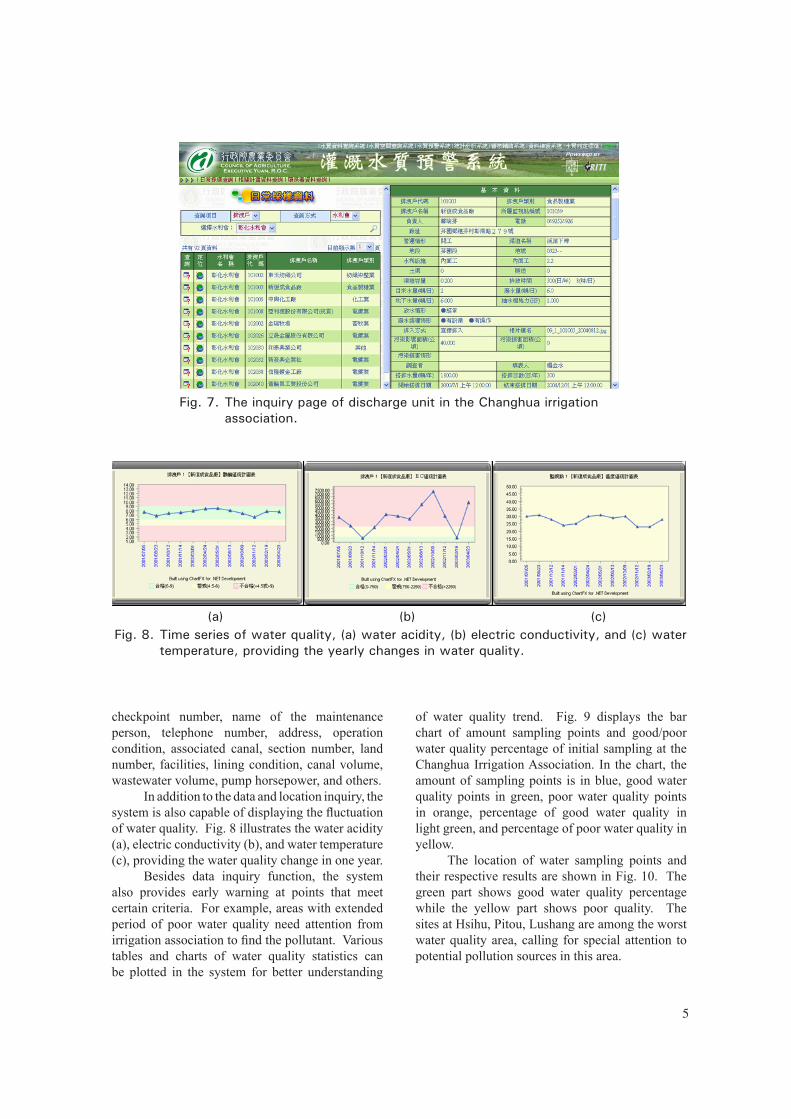
checkpoint number, name of the maintenance person, telephone number, address, operation condition, associated canal, section number, land number, facilities, lining condition, canal volume, wastewater volume, pump horsepower, and others. In addition to the data and location inquiry, the system is also capable of displaying the fluctuation of water quality. Fig. 8 illustrates the water acidity (a), electric conductivity (b), and water temperature (c), providing the water quality change in one year. Besides data inquiry function, the system also provides early warning at points that meet certain criteria. For example, areas with extended period of poor water quality need attention from irrigation association to find the pollutant. Various tables and charts of water quality statistics can be plotted in the system for better understanding
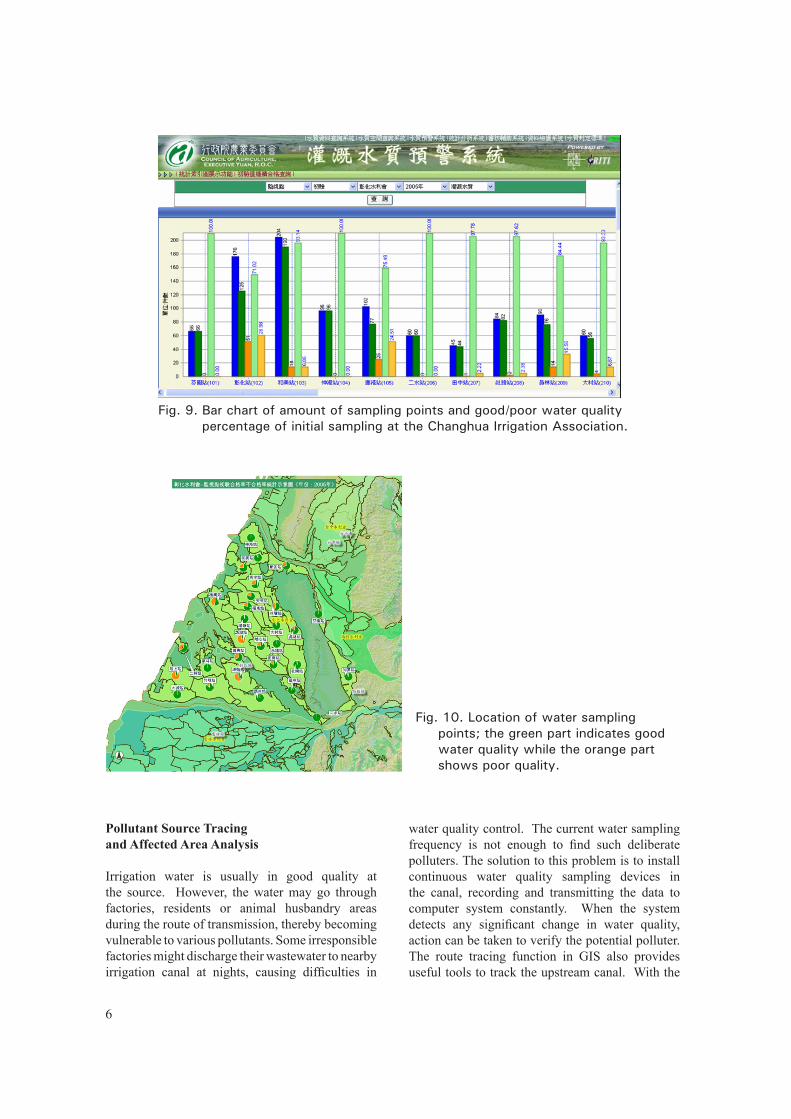
of water quality trend. Fig. 9 displays the bar chart of amount sampling points and good/poor water quality percentage of initial sampling at the Changhua Irrigation Association. In the chart, the amount of sampling points is in blue, good water quality points in green, poor water quality points in orange, percentage of good water quality in light green, and percentage of poor water quality in yellow. The location of water sampling points and their respective results are shown in Fig. 10. The green part shows good water quality percentage while the yellow part shows poor quality. The sites at Hsihu, Pitou, Lushang are among the worst water quality area, calling for special attention to potential pollution sources in this area.
Fig. 7. The inquiry page of discharge unit in the Changhua irrigation association.
Fig. 8. Time series of water quality, (a) water acidity, (b) electric conductivity, and (c) water temperature, providing the yearly changes in water quality.
(a) (b) (c)
6
Pollutant Source Tracing and Affected Area Analysis
Irrigation water is usually in good quality at the source. However, the water may go through factories, residents or animal husbandry areas during the route of transmission, thereby becoming vulnerable to various pollutants. Some irresponsible factories might discharge their wastewater to nearby irrigation canal at nights, causing difficulties in
water quality control. The current water sampling frequency is not enough to find such deliberate polluters. The solution to this problem is to install continuous water quality sampling devices in the canal, recording and transmitting the data to computer system constantly. When the system detects any significant change in water quality, action can be taken to verify the potential polluter. The route tracing function in GIS also provides useful tools to track the upstream canal. With the
Fig. 10. Location of water sampling points; the green part indicates good water quality while the orange part shows poor quality.
Fig. 9. Bar chart of amount of sampling points and good/poor water quality percentage of initial sampling at the Changhua Irrigation Association.

7
database of all factories along the upstream canal, the irrigation association is able to find the possible source of polluter. In contrast with the source tracing, the affected area analysis determines the area that will be affected/polluted by a certain pollution case. An example is when an accident happens in a chemical factory resulting in the discharge of poisonous water into neighboring irrigation canal. The farms located in downstream of the canal in a certain distance will be affected or polluted and have to be controlled in the future. The GIS system is useful in determining the polluted area, with land parcel layer and canal layer overlaid to each other. The land section and land number of the polluted area can be linked to the land owner database, so that the owners of the lands can be informed of the accident. The related polluted land number, owners list, addresses, telephone number and so on can be listed for future reference by using the system. Fig. 11 illustrates the source tracing of a polluted land to upstream factories.
Automatic Monitoring and Geographic Information System
In highly industrialized counties in Taiwan, the agricultural area is usually situated within residential or industrial areas. As such, irrigation water is sometimes polluted by urban and industrial wastewater because of inadequate urban sewage system and wastewater treatment facility. It is important to monitor irrigation water quality efficiently and solve pollution problem early on. The
automatic and continuous monitoring technology can be applied to inspect irrigation water quality with the establishment of field equipment in recent years. Field water sensors are capable of detecting many water parameters such as water temperature, turbidity, dissolved oxygen, COD, EC, pH, and others. Data transmission is through many options such as direct cable link, modem dial-up, WAP link, GPRS link, and so on, depending on the field condition and cost effective consideration. For example, multi-sensor water quality monitor instruments were installed at three irrigation ponds in the Taoyuan Irrigation Association to monitor the water temperature, EC, and pH every 15 minutes. The data are transmitted to the database in Taoyuan Irrigation Association by GPRS link. Fig. 12 shows the equipment installed in the field for data collection and transmission. Fig. 13 shows the multi-sensor water quality instrument capable of monitoring water temperature, EC, pH, and turbidity simultaneously.
RESULTS AND DISCUSSION
Water quality monitoring is one of the most important tasks in irrigation management. The web-based database and GIS are valuable tools for irrigation water quality management. According to this research, maintaining water quality within the irrigated area in Taiwan will depend on the maintenance of ever-updated potential polluter database and adequate GIS map layers of irrigation canals, land parcels, land ownerships and so on. The automatic monitoring
Fig. 11. Schematic diagram of source tracing of a polluted land to upstream factories.

8
technology is particularly useful for areas with complex land uses because of high pollution potential in agricultural lands. The source tracing and affected area analyses are useful tools in finding the polluter and identifying the land being polluted. Since the establishment of the water quality information system, our ability to manage water quality data and to trace polluter in such a way that water quality is maintained, has improved dramatically. As technological advances continue and the tools become easier to use, water quality monitoring will likewise become easier. With continued research efforts, maintaining a safe, reliable, and abundant supply of water for irrigation, recreation, and environment is possible. Realizing this potential will require the concerted efforts of all irrigation managers.
Fig. 12. Field server and transmission equipment.
Fig. 13. Multi-sensor water quality instrument capable of monitoring water temperature, EC, pH, turbidity simultaneously.
REFERENCES
JAIA, 2001. "Manual of Irrigation Water Management" published by the Joint Association of Irrigation Associations. (in Chinese).
Tan, Chih Hung, 2001, Design and Establishment of Water Quality Data Center, Agricultural Engineering Research Center report no. AERC-01-RR-10. (in Chinese).
Tan, Chih Hung , 2003, Integration of Water Quality Monitoring Network, Agricultural Engineering Research Center report no. AERC-03- RR-06. (in Chinese).
Tan, Chih Hung, 2004, Evaluation and Management System of Irrigation Water Quality, Agricultural Engineering Research Center report no. AERC-04- RR-35. (in Chinese).