Establishing the underlying causes of pleurisy to enable...
52
Establishing the underlying causes of pleurisy to enable the development of effective prevention and treatment measures. 2C-115 Report prepared for the Co-operative Research Centre for High Integrity Australian Pork By Conny Turni [email protected] February 2016
-
Upload
truongcong -
Category
Documents
-
view
217 -
download
3
Transcript of Establishing the underlying causes of pleurisy to enable...

Establishing the underlying causes of pleurisy
to enable the development of effective
prevention and treatment measures.
2C-115
Report prepared for the Co-operative Research Centre for High Integrity Australian Pork
By
Conny Turni
February 2016

i
Executive Summary
Introduction
Studies overseas have shown us that pleurisy does not only has an enormous impact on the
production but also at slaughter. Studies linking the observed pleurisy at slaughter back to the
farm have shown post-weaning mortality rates are around 3.3% higher for farms with a > 10%
pleurisy at slaughter than farms that are not affected. Models for pleurisy have predicted that
in increase of 1% pleurisy relates to a reduction of 1.55-2.5g/day average daily lifetime
weight gain at batch level. At the abattoir, pleurisy slows down the line speed and leads to
more waste and compromised carcass weights. In recent years, an increase of pleurisy at the
abattoir has been observed worldwide. This observed increase in pleurisy, which has been
noted in abattoirs in Australia, and the fact that no knowledge of the bacterial and viral
species associated with pleurisy at the abattoir existed in Australia has led to this study.
The study was undertaken at an abattoir in Queensland that had information about the pleurisy
observed for different farms and contributed that information for the farms sampled. This
situation allowed us to sample high and low pleurisy farms and determine which pathogens
were found in pigs with pleurisy.
Method
A total of 46 batches of pigs representing 46 Queensland farms were sampled. Five lungs
affected with pleurisy were sampled from most of these farms. At the abattoir the sex, weight
and back fat measure of each pig sampled was taken and the average weight and back fat from
the sampled batch was recorded. In the laboratory, all lungs were photographed, scored and
samples taken from pleurisy affected areas and the underlying bacterial species cultured from
these samples. All growth on the plates was scored to provide a crude estimate of the level of
bacteria found in the lungs. Lungs were also tested for Mycoplasma hyopneuomiae by testing
the trachea and the apical lobes. The bronchial lymph node was tested for PCV2. All
respiratory associated bacterial species were identified via PCR or sequencing. For some of
the species further analysis was undertaken, such as serotyping.
One species present on most of the farms was used to test for the antimicrobial sensitivity.

ii
Results
The outcome was a large list of respiratory pathogens found with the most prevalent being M.
hyopneumoniae and Streptococcus suis, found on 34 and 38 farms, respectively. PCV2 was
found in high concentration in samples from 29 farms. The other pathogens found were
Pasteurella multocida (24 farms), Actinobacillus species (29 farms), Actinobacillus
pleuropneumoniae (7 farms), M. hyorhinis (4 farms), M. flocculare (9 farms), Streptococcus
porcinus (1 farm), S. minor (1 farm), Haemophilus parasuis (1 farm) and Bisgaard Taxon 10
(1 farm). Most farms had more than one species of bacteria.
When taking into consideration the level of bacteria found in the affected lungs, which was
determined by the plate score, most bacteria were there in only low numbers. However, some
species, such as S. suis, P. multocida and A. pleuropneumoniae, were in high numbers,
indicating that they were potentially the causative agents of the pleurisy.
Estimation of the univariable odds ratio showed the crude risk of a positive result for M.
hyopneumoniae was higher for pigs coming from batches with a batch pleurisy score greater
than ten percent compared to those from batches with pleurisy scores less than ten percent.
Discussion
It is probably not surprising that no single infectious cause for all instances of pleurisy was
found in this study, as chronic pleurisy is supposed to be attributed to a variety of pathogens.
A variety of pathogens were found with only four being regarded as primary important
respiratory pathogens - M. hyopneumoniae, A. pleuropneumoniae, H. parasuis and PCV2.
Of these primary pathogens, only M. hyopneumoniae and PCV2 were found on a large
percent of farms with M. hyopneumoniae associated with the farm pleurisy status. These two
pathogens are regarded as pathogens that act synergistically, which means that these two low
pathogenic agents in combination with another low pathogenic agent can cause severe
respiratory disease. All other bacterial species found are typically regarded as secondary
pathogens, ie pathogens with low virulence, another point that makes the observation of high
prevalence of M. hyopneumoniae and PCV2 an important observation.

iii
The surprising results were the high prevalence of S. suis in the lung of pigs at slaughter with
this species being the most common species detected. All S. suis found were type 1 and no
type 2 was found, which is the most common cause of disease in humans. It is known that
most pigs are carriers of S. suis, and that it can cause issues throughout the production cycle,
but most outbreaks occur between three and 12 weeks. Therefore, finding it in large numbers
in the lungs of apparently healthy slaughter age animals is surprising.
The recommendation from this research are that a revisit of the protocols in place for the
control of M. hyopneumoniae and PCV2 is necessary. A further look at the levels of S. suis
on farms might also be advisable.

iv
Table of Contents
Executive Summary ............................................................................................................................................. i
1. Introduction ................................................................................................................................................ 5
2. Methodology……………………………………………………………………………………………......7
3. Outcomes .................................................................................................................................................. 13
4. Application of Research ......................................................................................................................... 40
5. Conclusion ................................................................................................................................................. 40
6. Limitations/Risks ..................................................................................................................................... 45
7. Recommendations ........................................................................................... 46
8. Acknowledgements…………………………………………………………………………………………………………………….47
9. References ................................................................................................................................................ 48

5
1. Introduction
Surveillance of animal disease at abattoirs is an intrinsic part of the quality control performed
by the abattoir. It is also used by veterinarians to obtain a picture of the health status of a
particular farms. The two predominant respiratory disease condition found during routine
abattoir surveillance are lung consolidation most likely cause by enzootic pneumonia seen as
confluent consolidation affecting the cranioventral regions of the lungs and pleurisy (Eze et
al, 2015; Fabley et al, 2012). Pleurisy (pleuritis), which is a finding not characteristic for a
particular disease denoting inflammation of the pleura seen as fibrous or fibrinous adhesions
on the lung or between the lung and the chest wall, which has a considerable impact on the
cost of pig production due to reduction in growth performance and feed efficiency with 8 to
12 days delay to slaughter (Christensen et al 1999; Merialdi et al 2011). As well, chronic
pleurisy has been associated with increased time for slaughter due to the extra time required
for trimming the carcass and slower production line speed. It also brings with it more waste
and compromised carcass weights and grades (Jaeger et al. 2012). In England the cost of
pleurisy has been estimated to be as high as £ (Sterling) 2.30 for every single pig slaughtered
(http://www.pigprogress.net/Health-Diseases/2013/2/Pleurisy).
Pleurisy has been reported to be on the increase, with a rise from 16 to 20.8% of individual
affected pigs from 2000 to 2009 in Belgium, from 14 to 24% from 1987 to 1998 in Denmark,
and from 12 to 22.5% individual affected pigs from 1990 to 2004 in the Netherlands (Jaeger
et al 2012). Fablet et al (2012a) reported 3.8 to 62% of pigs as being affected by pleurisy
depending on the country and the lung lesion scoring system used. The increase of pleurisy
has been noted in slaughterhouses in Australia and recently at Swickers, Kingaroy (personal
communication).
Respiratory disease can be split up into acute and chronic. The acute form if not fatal leads to
speedy recovery, while the chronic form is presentative of a long standing problem, which
leads to a prolonged or permanent damage from which the pig never recovers. Chronic
disease in a population is more complex involving several agents, among them bacteria and
viruses, which might act synergistically. Of the viruses, only Porcine Circovirus type 2 is
relevant to Australia. The bacteria associated with chronic respiratory disease are
Mycoplasma hyopneumoniae, Mycoplasma hyorhinis, Haemophilus parasuis, Actinobacillus
pleuropneumoniae, Actinobacillus suis, Streptococcus suis, Pasteurella multocida, Bordetella
bronchiseptica and Arcanobacter pyogenes (www.nadis.org.uk). The frequency of the
bacterial strains present appears to differ from country to country. A survey of pleuritis and
6
pulmonary lesions in pigs at an abattoir in Italy revealed that 25.1% of the lungs had
dorsocaudal pleuritis with a high percentage of these lungs affected by dorsocaudal pleuritis
being associated with A. pleuropneumoniae according to blood samples and herd health
history (Merialdi et al. 2011). In Spain, pleuritis and cranio-ventral pulmonary consolidation
lesions were recorded in 26.8% and 55.7% of pigs at slaughter, respectively, with a total of
82% of the farms sending the pigs to slaughter testing positive to A. pleuropneumoniae and
M. hyopneumoniae (Fraile et al 2010). In Canada, a study sampled the tonsils from 180
normal carcasses and from 215 carcasses diverted to the hold rail, the latter representing
carcasses with identified concerns or visible defects that require a closer inspection by
veterinary officials (O’Sullivan et al 2011). The most common bacterial species found were
S. suis (53.7%), A. pyogenes (29.9%), P. multocida (27.3%) and S. porcinus (19.5%)
(O’Sullivan et al 2011). A study in France revealed 69.3% of lungs at slaughter had
pneumonia and 15% had pleuritis and M. hyopneumoniae, P. multocida, A.
pleuropneumoniae, S. suis and H. parasuis were detected in the lungs (69.3, 36.9, 20.7, 6.4
and 0.99%, respectively) (Fablet et al 2012b). In a Danish study looking at pigs at slaughter
(pigs with and without pleurisy), a strong association was found between chronic pleurisy and
M. hyopneumoniae, A. pleuropneumoniae, P. multocida and H. parasuis (Enoe et al 2002).
A Norwegian study that examined 855 pig lungs at slaughter recovered P. multocida, A.
pleuropneumoniae and Streptococcus spp. from pneumonic lesions (54, 11 and 14%,
respectively) (Høie et al 1991). In the Netherlands, the increase in pleuritis in slaughter pigs
over the last twenty years prompted a study that revealed 45% pleuritis, 14%
pleuropneumonia and 38% catarrhal pneumonia. While A. pleuropneumoniae and P.
multocida were found, no single infectious cause of pleuritis was found, rather a variety of
infectious agents together with environmental factors were considered the cause of pleuritis
(Jirawattanapong et al 2011). A review on polymicrobial respiratory disease in Iowa stated
that, despite widespread vaccination, M. hyopneumoniae is still a major concern for pig
producers (Opriessnig et al 2011). The veterinary Diagnostic Laboratory at Iowa State
University noted that in 2010 P. multocida and M. hyopneumoniae were the main bacterial
pathogens recovered from respiratory disease cases (Opriessnig et al 2011).
A study to determine the influence of PCV2 on pleuritis and lung lesions found that the
detection of IgM antibodies against PCV2 in piglets 20 – 22 weeks of age correlated with a
reduced rate of pleuritis or lung lesions at slaughter (Wellenberg et al 2010). In 58% of herds
with a high level of lung lesions, the level of PCV2 DNA was above 10,000 PCV2 DNA
copies/mg lung tissue (which they defined as a high level) compared to 29% in herds with

7
low level of lung lesions. Eleven out of the 19 affected lungs from herds with high level of
lung lesions had a high PCV2 DNA load in combination with one or more other lung
pathogens, while this combination was only found in five out 17 affected lungs from herds
with low levels of lung lesions (Wellenberg et al 2010). The observation of PCV2
underpinning pleurisy was also noted in the large English Pleurisy study by BPEX (Tucker et
al 2000).
Summary
In summary, there seems to be no doubt that there is an overall increase of pleurisy at
slaughter in a number of countries, and possible including Australia. The bacterial species
associated with pleurisy and their prevalence is dependent on the country where the research
was undertaken. The bacterial species seen in several countries were M. hyopneumoniae, P.
multocida and A. pleuropneumoniae, followed by S. suis and H. parasuis in at least two
studies. PCV2 infection is increasingly being recognised as an important factor contributing
to pleurisy and lung disease. The knowledge of bacterial/virus species contributing to this
increase in pleurisy, the antimicrobial sensitivity status of the contributing bacterial species is
needed not only for the development of effective treatment on the farm, but also for effective
preventative measures to be implemented. Combining lung scoring, bacterial load,
knowledge of bacterial/viral species, antibiotic sensitivity patterns, abattoir data for farm and
farm management, farm vaccination programs and farm health status, will help to define
addition risk factors besides the management risk factors already defined by Colin Cargill
(Health Welfare Production and Housing Optimisation Program – DAS 1616 PRDC 2001).
2. Methodology
Lung at Abattoir
Lungs were collected from an abattoir in Queensland. The abattoir (via the work of Kingsley
Krefford) had monitored the pleurisy of batches (pigs send in from a farm to slaughter on a
particular day) of pigs from farms over the years and had rated the farms as low, intermediate
and high pleurisy. Monitored pigs were given an abattoir pleurisy score of one if one side of
the lung attached to the parietal pleura and a score of two if both sides of the lungs were
attached. A farm was described as a low pleurisy farm if consistently less than 10% of pigs
8
in monitored batches had a score of either one or two. A farm was described as a high
pleurisy farm if consistently more than 20% of pigs in each batch had a score of either one or
two. A farm that either had between 10 and 20%, or was varying between low and > 10% or
high and < 20% was considered variable.
One batch of pigs per farm was sampled with a target of five lungs per batch. Lungs, this
included the left and right side of the lung with trachea and lymph nodes attached (referred to
as lung throughout), were collected from pigs with a score of either 1 or 2 using a systematic
sampling process with a sampling interval of 1, 2, 3, 4 or 5; the interval depended on the
batch size and the pleurisy category of the farm. From most farms, five lungs were collected.
However, from the low pleurisy farms collecting five lungs was not always possible and
lower numbers of lungs were collected from some farms.
Each lung was placed into a zip lock freezer bag labelled with the farm brand (which was
later on coded to avoid identification of the farm) and lung number and put on ice. The
laboratory was three hours away from the laboratory and lung sampled in the morning were
held in the cold room at the abattoir before the travel back to the laboratory. The ice was
topped up in the eskies before the drive back. At the laboratory, the lungs were held overnight
on ice before processing the following day.
For each pig that had a lung sampled, the weight, sex and back fat was recorded. The
average weight (calculated from the HSC (hot standards carcass weight) of each pig) and
back fat of the pigs in the total batch were recorded.
The lungs were collected every second week over a period of nine months (July 2014 to
March 2015). A total of 210 lungs were collected from 46 farms associated with 24 owners
and 7 pork supply chains. Each farm in this trial was coded with a four digital number. The
first number presented the pork supply chain with a number being from 01 to 11. The next
digit presented the farm owner and the fourth number presents the farm of that owner. Some
owners owned up to eight farms, run by different managers.
At the first, blood was collected from the axillary vessels for PCV testing from pigs of two
farms, but not enough blood could be collected and the line speed was interrupted.
Therefore, the tracheobronchial lymph nodes were collected from pigs from all subsequent
farms and used to test for PCV2.
At the laboratory the lungs were photographed and then scored. The cranio-ventral
pneumonia scoring described by Pointon et al. (1999) was used. Each lung lobe was scored
for the percent of lesions and consolidation with the highest total score awarded being 55.
This indicated the proportion of consolidated lung tissue in the following sites: a maximum

9
score of 10 was assigned to each of the apical and cardiac lobes, 5 for each intermediate lobe
and 5 for the caudal lobes.
Cranio-ventral pneumonia lesions were classified as either acute or chronic and the absence
or presence of pleuropneumonia lesions associated with Actinobacillus pleuropneumoniae
were recorded. A lung pleurisy score was also given ranging from 0 to 3 with lung pleurisy
score 1 being small amount fibrin on lung surface, lung pleurisy score 2 being fibrin over
extensive area of lung, lung pleurisy score 3 being lung lobes stuck together or lung stuck to
rib cage
Culture
Plates were labelled with the farm code, lung number and sample number. Both sides of the
lung were sampled and cultured separately. The samples taken where from sites of adhesion.
If no adhesion were observed on one side, then that side was sampled at the equivalent
position as the side with the adhesions. Four cultures plates were used per sample: BA/SN
agar plate (consisting of blood agar based medium, BBLTM Blood Agar Base (BD),
supplemented with 0.0025% of NADH, 0.0005% of thiamine HCl, 1% of heat inactivated
horse serum and 5% of oleic acid bovine albumin complex (consisting of 4.75% bovine
serum albumin in normal saline (containing 0.06% oleic acid and 5% 0.05 N NaOH)), blood
agar plate, Streptococcus selective media plate and McConkey agar plate. All plates were
incubated for a minimum of 48 hours under aerobic conditions at 37oC. An additional swab
was taken from each sample site for DNA extraction directly from the swab. Additionally, a
500 µl of fluid from the zip lock bag that had held the lung overnight was taken for DNA
analysis.
Two samples were collected from each pig for Mycoplasma spp analysis. A swab inserted
deep into the trachea was taken and processed by PCR. For the other sample, one apical lobe
was cut off and stored in a plastic bag with 3 ml of added phosphate buffered saline (PBS)
overnight at 4ºC. The next day 500 µl of fluid was taken off and used for PCR analysis.
Culture analysis
The BA/SN plates, which were the first ones to be inoculates, were scored according to the
following scoring system:
0 = no growth
1 = colonies growing only in directly swabbed area
2 = colonies growing directly in swabbed area and in first streak only

10
3 = colonies growing in directly swabbed area and in first and second streaks
4 = colonies growing in directly swabbed area and in first, second and third
streaks
Colonies of suspect respiratory pathogens (such as members of the Pasteurellaceae family)
were picked and re-plated for identification. From the BA/SN agar plates nicotinamide
adenine dinucleotide (NAD) dependent species were recovered, while from the blood agar
plate P. multocida and other bacteria were collected. Streptococcus-like bacteria were
collected from the Streptococcus selective agar plate. The McConkey agar plate was used to
help in the selection of respiratory pathogens compared to environmental bacteria and to help
in the isolation and identification of E. coli.
Potentially different bacterial species were selected according to their colony appearance and
plated onto fresh plates. The DNA was extracted after overnight incubation and the isolate
was stored at -70ºC.
DNA extraction
DNA extraction from swab
The cotton end of the swab was placed into a 1.5 ml tube. To this swab tip, 500 ul of PBS was
added and the tube vortexed for 15 seconds. After being allowed to stand for 10 mins, the tube
was vortexed again. (Depending on work load, the second vortexing was performed after
overnight storage). The swab was removed from the tube by releasing as much liquid as
possible from the swab. The remaining suspension was centrifuged for 5 mins at 13000 x g.
The DNA was then extracted with the Qiagen DNeasy blood & Tissue Kit (cat no 69504). The
first step was to add 180 l Buffer ATL and then 20 µl proteinase K was added and the mixture
vortexed thoroughly. The method was then followed according to instructions given in the
manufacturer’s instructions.
DNA extraction from lung fluid
To a 1.5 ml tube 500 l of lung tissue fluid was added and spun at 1,000 g for 3min. The
supernatant was transferred to another tube and spun for 5 min at 13,000 rpm. After discarding
of the supernatant, 180 l of Buffer ATL was added and the DNA was extracted according to
the manufacturer’s instructions of the Qiagen DNeasy Blood & Tissue Kit (Qiagen, Hilden,
Germany).

11
DNA extraction for cultured bacteria
The DNA of gram-positive bacteria was extracted with the Generation Capture Column kit of
Qiagen (Qiagen, Maryland, USA). The DNA of gram-negative bacteria species was extracted
via the boiling and cooling process according to the PCR protocol (see identification
paragraph below).
Identification
The suspect A. pleuropneumoniae were identified and serotyped with a multiplex A.
pleuropneumoniae PCR for serovars 1, 5, 7 and 15 (Turni et al., 2014). This multiplex PCR
both identifies at the species level (i.e. confirms as A. pleuropneumoniae) and identifies if the
isolate is serovar 1, 5, 7 or 15.
Suspect Streptococcus suis isolates were identified with a PCR based on the glutamate
dehydrogenase gene (Okwumabua et al., 2003), as well as a PCR based on the 23S rDNA,
which identifies down to species level as well as type 1 or 2 (Kawata et al 2004). Other
Streptococcus spp isolated from the selective medium were tested with another PCRs. The
PCR of Kawata et al (2004), which can identify eight streptococcal species relevant to animal
infections (Streptococcus agalactiae, S. bovis, S. canis, S. dysgalactiae, S. equi, S. porcinus,
S. suis and S. uberis), was used.
Mycoplasmas were identified in the lung tissue fluid and from the tracheal swab with a
multiplex PCR for M. hyopneumoniae, M. hyorhinis and M. flocculare according to the
protocol of Stakenborg et al (2006). P. multocida was identified with a species specific PCR
(Townsend at al 1998) and then the LPS genotype established by PCR (Harper et al, 2015).
All other potential pathogens were identified by16S rDNA sequencing (Blackall et al. 2003).
Antibiotic sensitivity
Sixty-six S. suis isolates from 38 farms were tested by the disc diffusion method according to
the Clinical and Laboratory Standards Institute guidelines (CLSI, 2013) for antimicrobial
susceptibility to nine antimicrobials (ampicillin, ceftiorfur, erythromycin, florfenicol,
penicillin, cotrimoxazole (trimethoprim/sulfamethoxazole), tetracycline, tilmicosin and
tulathromycin). The interpretation guidelines were taken from Streptococcus spp from
humans in the case of ampicillin, erythromycin, penicillin, cotrimoxazole and tetracycline
and for S. suis for ceftiorfur and florfenicol– all were as provided by the Clinical and
Laboratory Standards Institute (CLSI, 2015).

12
PCV2
One gram of lymph node was used to extract DNA with the QIAGEN tissue kit (Qiagen,
Maryland, USA). The real time PCR was run according to the protocol of Olvera et al
(2004). Unfortunately, while shifting the lymph nodes to another laboratory one box of the
samples, representing 5 farms, went missing and therefore only lymph nodes from 39 farms
were tested.
Data management and statistical analyses
Sample size was dictated by logistics with the recognition that the study would have limited
power to detect an association between identification of a pathogen and batch/farm pleurisy
categories.
Data for two samples from each lung were combined for each bacteria species meaning if
one sample was positive the lung was considered positive for the bacteria species. The
results for the apical and tracheal mycoplasma results were also combined and a positive
result for one sampling site meant the lung was positive. If the results for one test were
missing and the tested location was negative then no overall result was recorded. A total
pathogen count was calculated based on the number of the following pathogens to which the
pig was positive: M. hyopneumoniae, M. hyorhinis, A. pleuropneumoniae, S. suis, P,
multocida L3, P. multocida L6, P. multocida NT and PCV2. Dichotomous variables were
then created for whether the pathogen count was (i) 0/≥1, (ii) <2/≥2, (iii) <3/≥3.
Dichotomous plate score variables were also created by first determining the greater of the
plate scores for the two samples for each pig, then categorizing that as (i) <2/≥2, (ii) <3/≥3.
The farms were recorded according to the abattoir’s rating of high, variable and low pleurisy
farm (farm with overall lower score than 10% over observed period were classed as low,
farms with >20% were classed as high and farms that varied between low and above or high
and below or where in between the low and the high classification were classified as
variable).
In addition to the farm pleurisy categories based on retrospective data, a batch pleurisy
categories were defined whereby batches were categorized as ≤10% and >10% according to
the percentage of pigs in the batch that had an abattoir pleurisy score of either one or two
pleurisy.

13
Continuous variables were summarized by mean, standard deviation, median, minimum and
maximum. Categorical variables were summarized by frequency distributions at the farm,
batch or pig level, as appropriate.
To assess the extent of clustering of each pathogen of interest by farm intra-class correlation
coefficients were estimated. This was done by fitting separate null logistic regression models
for each pathogen of interest with farm as a random effect. To test the null hypotheses that
there is no association between the farm/batch pleurisy category and likelihood of a positive
result for each agent a series of multi-level univariable logistic regression models were fitted
with the result for each infectious agent as the outcome variable and either batch pleurisy
category or farm pleurisy category as the exposure variable and farm as the random effect.
This was only been done if at least five pigs had a positive result for the infectious agent
An odds ratio of one indicates no association. An odds ratio of greater than one indicates that
the odds of a positive test result are greater in that category than the reference category – e.g.
an odds ratio of two means that the odds of a positive result are twice as high for pigs with
that category of the variable than pigs with the reference category of the variable. An odds
ratio of less than one indicates that the odds of a positive result are lower in that category
compared to the reference category. The low batch pleurisy category and the low farm
pleurisy category were set as reference categories, so that if one expects an odds ratios greater
than one if the infectious agent is more likely to be found in pigs from higher pleurisy batches
or variable/high Swickers farm scores.
3. Outcomes
A total 46 batches from 46 farms were sampled with an average batch pleurisy score of
17.3%, average weight per pig of 80 kg, average back fat of 11.1 mm and a mean of 150 pigs
per batch. Of the total 210 lungs sampled more lungs were collected from batches with a
pleurisy score above ten percent (Table 1). Mean weight of pigs were similar across pleurisy
categories. The cranio-ventral pneumonia (CVP) mean score was 5.9 for lungs from batches
with ≤ 10% pleurisy compared to 12.0 for lungs from batches with >10%.

14
Table 1. Summary statistics for continuous variables at farm/batch and pig levels. Pig level
variables are summarised for all pigs by batch and Swickers pleurisy categories. CVP –
cranio-ventral pneumonia. HSC – hot standard carcass (weight of carcass on hooks).
Variable Number Mean Median S.D. Minimum Maximum
Farm/Batch
Batch pleurisy score 46 17.3 15.0 15.0 0.8 63.0 HSC weight average (kg) 46 80.0 82.3 12.1 10.1 92.6 Back fat average (mm) 46 11.1 11.0 1.6 8.7 18.0 Number of pigs in batch 46 150 160 68.7 40 325 Pig
Weight All pigs 210 80.7 81.6 8.7 52.6 101.7
Batch ≤ 10% 75 80.3 81.5 7.9 59.2 97.0 Batch > 10% 135 80.9 81.7 9.1 52.6 101.7 Swickers pleurisy category Swickers Low 62 79.6 82.3 10.3 52.6 100.5 Swickers Var 93 81.3 81.3 7.8 60.0 101.7 Swickers High 55 81.0 80.2 8.2 65.8 97.6 CVP score All pigs 210 9.8 6 11.2 0 51 Batch ≤ 10% 75 5.9 2 8.0 0 38 Batch > 10% 135 12.0 9 12.1 0 51 Swickers pleurisy category Swickers Low 62 8.2 1 8.2 0 38
Swickers Var 93 12.3 9 11.8 0 51 Swickers High 55 10.8 6 11.6 0 41
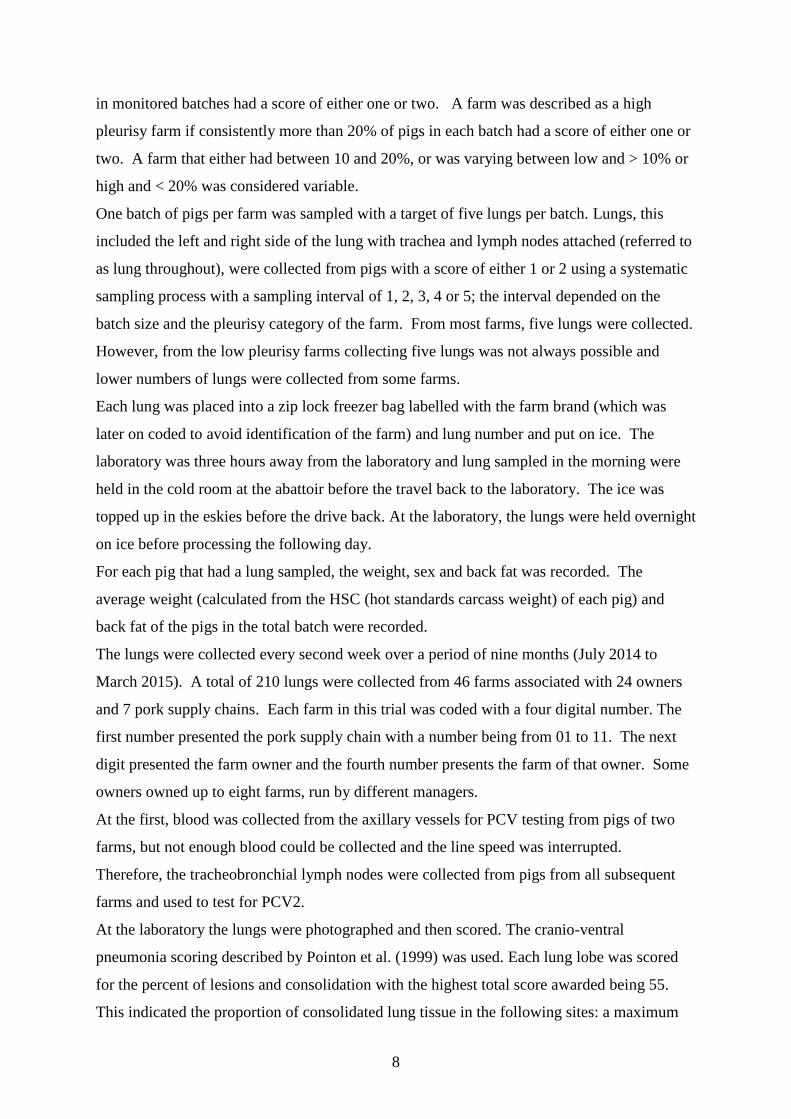
More batches were being sampled for the above 10% pleurisy (Table 2) category and from
most farms five lungs were collected. A total of 64.3% of the lungs sampled came from a
batch with a higher than ten pleurisy percentage (Table 3).
15
Table 2. Frequency distribution of pleurisy categories by farms/batches and number of pigs
sampled per farm
Variable/Category Total Percentage
Batch score
≤ 10% 19 41.3 > 10% 27 58.7 Swickers pleurisy category Swickers Low 16 34.8 Swickers Var 19 41.3 Swickers High 11 23.9 No. pigs sampled
1 1 2.2
2 2 4.4 3 3 6.5 4 4 8.7 5 36 78.3
Table 3. Frequency distribution of pleurisy categories by pigs
Variable/Category Total Percentage
Batch score
≤ 10% 75 35.7 > 10% 135 64.3 Swickers pleurisy category
Swickers Low 62 29.5 Swickers Var 93 44.3 Swickers High 55 26.2
Looking at the distribution of lung scores the batches with >10% pleurisy seem to have a
shift towards the higher scores (Figure 1). Most lungs (95.7%) had a lung pleurisy score of 3
for the lungs and 50.5% were of chronic infection with most of these coming from the
batches with pleurisy > 10% (70.8%). At the abattoir most lungs (66.2%) had an abattoir
pleurisy score of 1 (one side of the lung attached) (Table 4).

16
Figure 1. Histograms of cranio-ventral pneumonia scores by batch pleurisy category and
overall
0
.05
.1.1
5
0
.05
.1.1
5
0 20 40 60
0 20 40 60
<=10% >10%
TotalDe
nsity
Lung Score

17
Table 4. Frequency distribution of categorical variables relating to gross findings at the pig
level for all pigs and by batch and Swickers pleurisy category. CVP – cranio-ventral
pneumonia. A/C – acute/chronic. APP – Actinobacillus pleuropneumoniae
Variable/ Category
Total Number
(%)1
Batch pleurisy category Swickers pleurisy category
Batch ≤ 10% No. (%)2
Batch > 10% No. (%)2
Low No. (%)2
Variable No. (%)2
High No. (%)2
Gender
Female 123 (58.6) 49 (39.8) 74 (60.2) 40
(32.5) 57 (46.3) 26
(21.1)
Male 87 (41.43) 26 (29.9) 61 (70.1) 22
(25.3) 36 (41.4) 29
(33.3)
Abattoir pleurisy score
1 139 (66.2) 50 (36.0) 89 (64.0) 42
(30.2) 59 (42.4) 38
(27.3)
2 71 (33.8) 25 (35.2) 46 (64.8) 20
(28.2) 34 (47.9) 17
(23.9)
Lung pleurisy score
1 0 (0) 0 0 0 0 0
2 9 (4.3) 3 (33.3) 6 (66.7) 4 (44.4) 2 (22.2) 3 (33.3)
3 201 (95.7) 72 (35.8) 129 (64.2) 58
(28.9) 91 (45.3) 52
(25.9)
Stage of CVP
None 51 (24.3) 26 (51.0) 25 (49.0) 27
(52.9) 12 (23.5) 12
(23.5)
Acute 27 (12.9) 12 (44.4) 15 (55.6) 13
(48.1) 5 (18.5) 9 (33.3)
A/C 26 (12.4) 6 (23.1) 20 (76.9) 5 (19.2) 8 (30.8) 13
(50.0)
Chronic 106 (50.5) 31 (29.2) 75 (70.8) 17
(16.0) 68 (64.2) 21
(19.8)
APP lesions
No 202 (96.2) 70 (34.7) 132 (65.3) 60
(29.7) 89 (44.1) 53
(26.2)
Yes 8 (3.8) 5 (62.5) 3 (37.5) 2 (25.0) 4 (50.0) 2 (25.0) 1Column percentage e.g. 58.6% of all pigs were female 2Row percentage e.g. 39.8% of female pigs came from batches where the batch pleurisy score was ≤ 10%
18
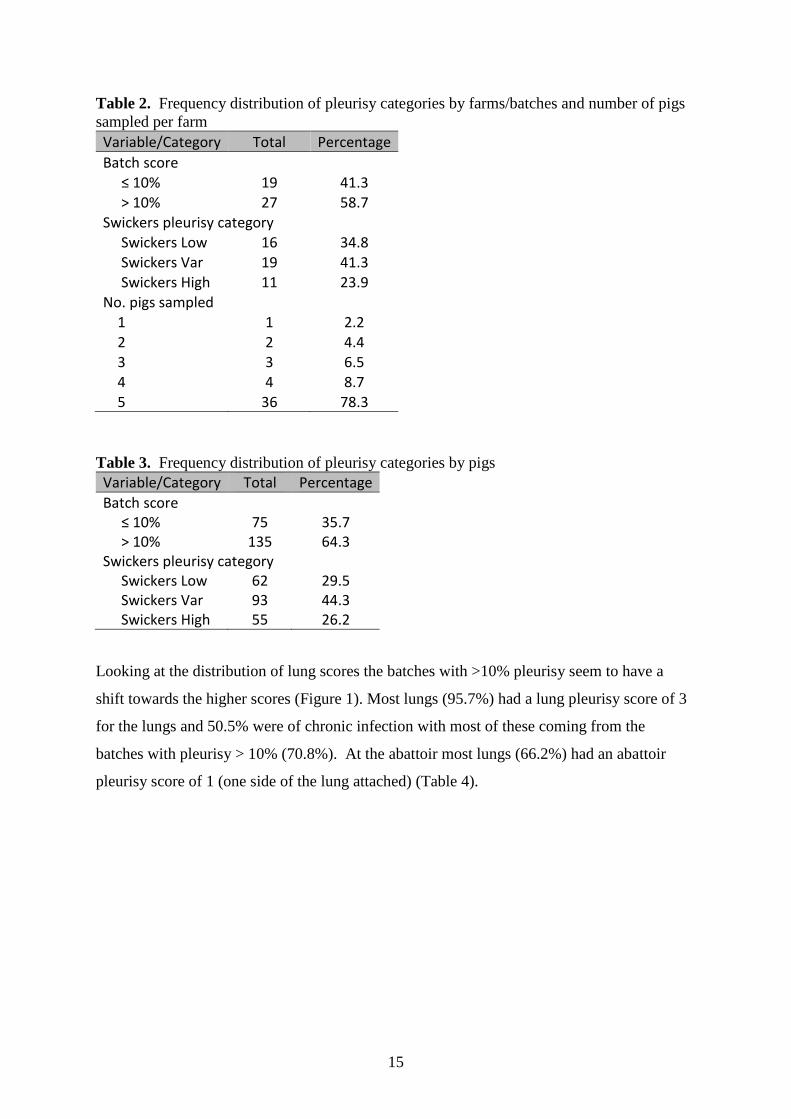
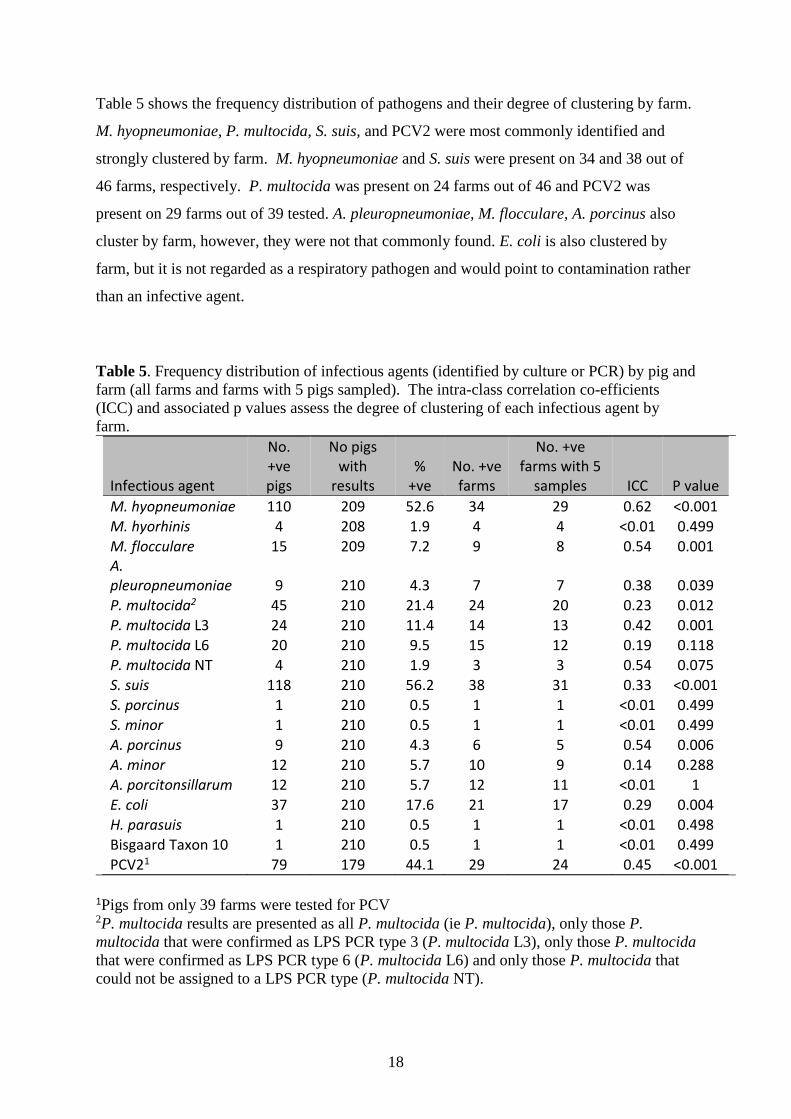
Table 5 shows the frequency distribution of pathogens and their degree of clustering by farm.
M. hyopneumoniae, P. multocida, S. suis, and PCV2 were most commonly identified and
strongly clustered by farm. M. hyopneumoniae and S. suis were present on 34 and 38 out of
46 farms, respectively. P. multocida was present on 24 farms out of 46 and PCV2 was
present on 29 farms out of 39 tested. A. pleuropneumoniae, M. flocculare, A. porcinus also
cluster by farm, however, they were not that commonly found. E. coli is also clustered by
farm, but it is not regarded as a respiratory pathogen and would point to contamination rather
than an infective agent.
Table 5. Frequency distribution of infectious agents (identified by culture or PCR) by pig and
farm (all farms and farms with 5 pigs sampled). The intra-class correlation co-efficients
(ICC) and associated p values assess the degree of clustering of each infectious agent by
farm.
Infectious agent
No. +ve pigs
No pigs with
results %
+ve No. +ve farms
No. +ve farms with 5
samples ICC P value
M. hyopneumoniae 110 209 52.6 34 29 0.62 <0.001 M. hyorhinis 4 208 1.9 4 4 <0.01 0.499 M. flocculare 15 209 7.2 9 8 0.54 0.001 A. pleuropneumoniae 9 210 4.3 7 7 0.38 0.039 P. multocida2 45 210 21.4 24 20 0.23 0.012 P. multocida L3 24 210 11.4 14 13 0.42 0.001 P. multocida L6 20 210 9.5 15 12 0.19 0.118 P. multocida NT 4 210 1.9 3 3 0.54 0.075
S. suis 118 210 56.2 38 31 0.33 <0.001 S. porcinus 1 210 0.5 1 1 <0.01 0.499 S. minor 1 210 0.5 1 1 <0.01 0.499 A. porcinus 9 210 4.3 6 5 0.54 0.006 A. minor 12 210 5.7 10 9 0.14 0.288 A. porcitonsillarum 12 210 5.7 12 11 <0.01 1
E. coli 37 210 17.6 21 17 0.29 0.004 H. parasuis 1 210 0.5 1 1 <0.01 0.498 Bisgaard Taxon 10 1 210 0.5 1 1 <0.01 0.499 PCV21 79 179 44.1 29 24 0.45 <0.001
1Pigs from only 39 farms were tested for PCV 2P. multocida results are presented as all P. multocida (ie P. multocida), only those P.
multocida that were confirmed as LPS PCR type 3 (P. multocida L3), only those P. multocida
that were confirmed as LPS PCR type 6 (P. multocida L6) and only those P. multocida that
could not be assigned to a LPS PCR type (P. multocida NT).

19
When looking at the species that have been found per farm (Table 6) there seems to be no
apparent association with any one species and high batch pleurisy score and the multitude of
species does not seem to be associated with the batch pleurisy score either, however that is
not taking in consideration multiple lungs per farm. Only two of the low pleurisy farms have
no bacterial species, but one of them has a high viral load. P. multocida is seen on farms at
all levels of pleurisy (from low to very high pleurisy percentage). A. pleuropneumoniae was
seen only at pleurisy above 8%. Interestingly, a lot of Actinobacillus species are found on
these farms with 29 farms having at least one species.

20
Table 6 Bacteria species and PCV2 virus found on each farm together with the batch pleurisy score of the batch sampled. PCV2 is given as
the number of copies per gram of tissue for the lung with the highest concentration per farm.
Code for farm
Total pleurisy
score (%) for batch
sampled
Bacteria species found for each farm
PCV2 (log 10)
App PM S.
suis Actinobacillus
sp. M.
hyopneumoniae M.
hyorhinis M.
flocculare Others
0451 0.83 8.66
0831 1.26 not
done
0881 1.49 LPS
6 Type 1
H. parasuis
neg
1012 1.75 Type 1 8.86
0863 1.76 Type 1 A. minor 9.18
0884 1.79 Type 1 A.
porcitonsillarum 7.15
0817 1.85 Type 1 8.96
0882 1.99
LPS 6
Type 1 A. indolicus neg
0414 3.48 Type 1 A.
porcitonsillarum 7.51
0862 3.8 Type 1 neg
0461 4.52
LPS 6,
LPS NT
Type 1 A.
porcitonsillarum, A. porcinus
7.26

21
0616 5 LPS
3 neg
0413 5.08 LPS
3 A. minor 10.21
1055 5.88 Type 1 8.46
1041 7.84 LPS
6 Type 1 A. porcinus
not done
0822 7.94 Type 1 A. porcinus, A.
minor not
done
0814 8.73
LPS 3
Type 1 8.09
0415 8.89 Serovar
15
LPS
6 A. minor
not done
1021 9.3 Type 1 9.70
0615 10.46 Type 1 A. indolicus, A. porcitonsillarum neg
0462 11.93 Type 1 A. porcinus 6.96
1031 13.66 Serovar
7 Type 1 9.39
0443 14.52
LPS 6,
LPS NT
Type 1 A.
porcitonsillarum 11.26
0871 15.48
LPS 6
Type 1 A. indolicus, A.
minor neg
0611 16.46 LPS
3 Type 1 7.28

22
0442 16.82
LPS 3
Type 1
A. porcitonsillarum,
A. minor, A porcinus
Bisgaard Taxon 10
9.87
1011 17.89 Type 1 A. indolicus, A.
minor S. minor 7.29
0812 18.04 Serovar
7
LPS 3 + LPS
6
A. minor, A.
porcitonsillarum S.
porcinus not
done
0861 18.18 LPS
3 A. indolicus 8.57
891 19.58
LPS 3,
LPS 6
Type 1 A. indolicus 8.38
1121 20.16 Type 1 A.
porcitonsillarum 9.06
0412 21.76 A.
porcitonsillarum 10.66
1053 23.31 LPS
6 Type 1 A. indolicus 10.48
0842 23.81 LPS
3 Type 1 A. indolicus
0448 23.94 Serovar
15 LPS
3 Type 1 A. minor 6.49
1052 24.36 Serovar
7 Type 1 A. porcinus 8.16
1054 25.45 LPS 3,
Type 1 7.99

23
LPS 6
0816 27.46 LPS
6 Type 1 neg
0447 30.26
LPS 3,
LPS 6,
LPS NT
Type 1 A.
porcitonsillarum neg
0225 38.46 Type 1 not
done
0211 40 Type 1 10.34
1111 41.01 LPS
3 Type 1 10.68
0111 45.81 Serovar
7 Type 1
A. porcitonsillarum 7.48
0851 46.3
LPS 3,
LPS 6
Type 1 A.
porcitonsillarum neg
1051 46.73 Serovar
7 Type 1 A. indolicus 9.48
0444 62.96 LPS
6 Type 1 A.minor neg
1For all bacteria, no entry means that the agent was not detected and indicates that the specific agent was identified. For PCV2, some samples
could not be tested and are recorded as Not Done.

24
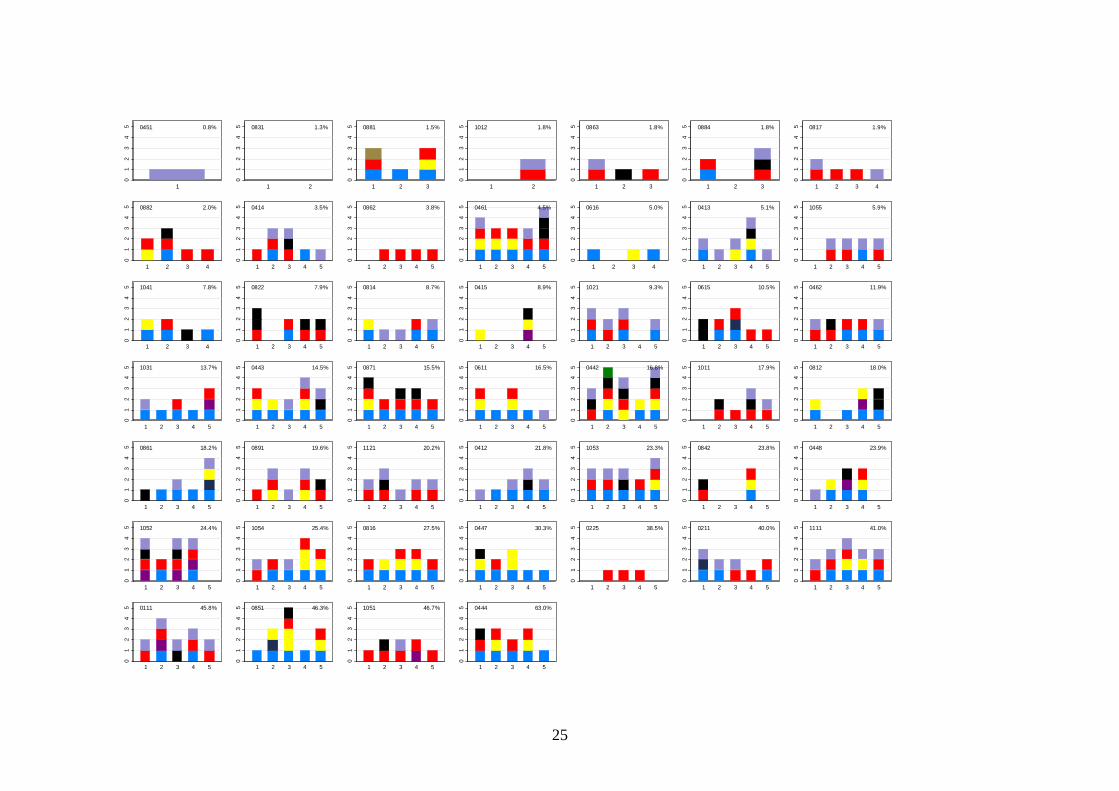
Figure 2 This figure shows all the species on the farms ordered by batch pleurisy score and
representing each lung from each batch with all species. Each square represents one farm
with 1 to five lungs. The figure in the right hand corner is the pleurisy score of the batch the
lungs came from. The right hand corner figure is the farm code. The Actinobacillus species
have been combined, as well as all the P. multocida of all serovars.
0
10
020
030
040
0
M. hyopneumoniae M. hyorhinis
A. pleuropneumoniae P. multocida l3
P. multocida l6 P. multocida NT
S. suis A. indolicus
A. porcinus A. minor
A. porcintonsillarum H. parasuis
Bisgaard Taxon 10 PCV2
25
0.8%04510
12
34
5
1
1.3%0831
01
23
45
1 2
1.5%0881
01
23
45
1 2 3
1.8%1012
01
23
45
1 2
1.8%0863
01
23
45
1 2 3
1.8%0884
01
23
45
1 2 3
1.9%0817
01
23
45
1 2 3 4
2.0%0882
01
23
45
1 2 3 4
3.5%0414
01
23
45
1 2 3 4 5
3.8%0862
01
23
45
1 2 3 4 5
4.5%0461
01
23
45
1 2 3 4 5
5.0%0616
01
23
45
1 2 3 4
5.1%0413
01
23
45
1 2 3 4 5
5.9%1055
01
23
45
1 2 3 4 5
7.8%1041
01
23
45
1 2 3 4
7.9%0822
01
23
45
1 2 3 4 5
8.7%0814
01
23
45
1 2 3 4 5
8.9%0415
01
23
45
1 2 3 4 5
9.3%1021
01
23
45
1 2 3 4 5
10.5%0615
01
23
45
1 2 3 4 5
11.9%0462
01
23
45
1 2 3 4 5
13.7%1031
01
23
45
1 2 3 4 5
14.5%0443
01
23
45
1 2 3 4 5
15.5%0871
01
23
45
1 2 3 4 5
16.5%0611
01
23
45
1 2 3 4 5
16.8%0442
01
23
45
1 2 3 4 5
17.9%1011
01
23
45
1 2 3 4 5
18.0%0812
01
23
45
1 2 3 4 5
18.2%0861
01
23
45
1 2 3 4 5
19.6%0891
01
23
45
1 2 3 4 5
20.2%1121
01
23
45
1 2 3 4 5
21.8%0412
01
23
45
1 2 3 4 5
23.3%1053
01
23
45
1 2 3 4 5
23.8%0842
01
23
45
1 2 3 4 5
23.9%0448
01
23
45
1 2 3 4 5
24.4%1052
01
23
45
1 2 3 4 5
25.4%1054
01
23
45
1 2 3 4 5
27.5%0816
01
23
45
1 2 3 4 5
30.3%0447
01
23
45
1 2 3 4 5
38.5%0225
01
23
45
1 2 3 4 5
40.0%0211
01
23
45
1 2 3 4 5
41.0%1111
01
23
45
1 2 3 4 5
45.8%0111
01
23
45
1 2 3 4 5
46.3%0851
01
23
45
1 2 3 4 5
46.7%1051
01
23
45
1 2 3 4 5
63.0%0444
01
23
45
1 2 3 4 5

26
When looking at all the lungs per farm and looking at the species found in all lungs
(Figure 2) no clear association can be seen either. There seems to be some farm
where not all lungs harboured pathogens and some where all lungs from one farm
harboured pathogens, even though not necessarily all the same pathogens. The
distribution of PCV2 levels appears similar across batch pleurisy categories (Figure
3).
Figure 3. Histograms of log (10) of number or copies of PCV2 (assuming zero for
those with a negative PCV2 result) by batch pleurisy category and overall
0.1
.2.3
0.1
.2.3
0 5 10 15
0 5 10 15
<=10% >10%
TotalDe
nsity
Log(10) of Number of Copies of PCV2

27
Most of the BA/SN plates had a score of 1 for their plate count, which means that the
bacteria were only in the base streak and not in large number (Table 6). When
looking at the plates with higher score (3 and 4) most of the high scores are caused
by S. suis (Table 7). However, some of the high plate scores also had P. multocida
and A. pleuropneumoniae on them. Some of the plates had environmental bacteria
on them, as can be seen in the list of others/contaminants.
Table 6 Frequency distribution of plate counts for each sample and combined
Sample No. pigs %
Sample 1
0 7 3.3 1 147 70.0 2 33 15.7 3 17 8.1 4 6 2.9 Sample 2
0 5 2.4
1 136 64.8 2 46 21.9 3 20 9.5 4 3 1.4 Combined
1 10 4.8 2 103 49.1
3 48 22.9 4 26 12.4 5 17 8.1 6 4 1.9
7 1 0.5 8 1 0.5

28
Table 7. Associated bacteria with high plate scores.
Farm
code
Plate
score
App
serotype PM serotype S. suis A. porcinus A. minor A. poritonsillarum Others/Contaminants
0111 3 App 7 S. suis
0211 3 S. suis
0412 4 Streptococcus spp
0412 4 A. porsitonsillarum Streptococcus spp
0414 3 Streptococcus spp
0415 4 App 15 PM L6 A. minor
0415 3
E. coli, Anoxybacillus
flavithermus
0444 3 PM L6 S. suis
0444 3 S. suis
0447 3 PM L3 A. porsitonsillarum
0447 4 PM L6 + LNT
0448 4 PM L3
0461 4 PM LNT S. suis
0461 4 S. suis
0461 3 S. suis
0461 3 Streptococcus spp
0462 3 S. suis
0462 3 A. porcinus
0462 3 S. suis A. porcinus
0611 3 PM L3
0615 3 S. suis
0814 3 PM L3
0816 3 S. suis
0822 3 S. suis
0842 3 PM L3
0842 3 Streptococcus spp
0862 3 S. suis
0862 3 Anoxybacillus kaynarcensis
0871 3 PM L6 S. suis
0871 3 S. suis
0871 4 S. suis
0881 3 Streptococcus spp
0882 3 PM L6 S. suis
0882 3 S. suis
0884 3 Streptococcus spp
0891 3 Streptococcus spp
1021 3 ?
1021 4 ?
1031 3 ?
1051 3 S. suis
1052 3 ?
1111 3 Streptococcus spp
1111 3 S. suis
1121 3 A. porcitonsillarum
1121 3 S. suis

29
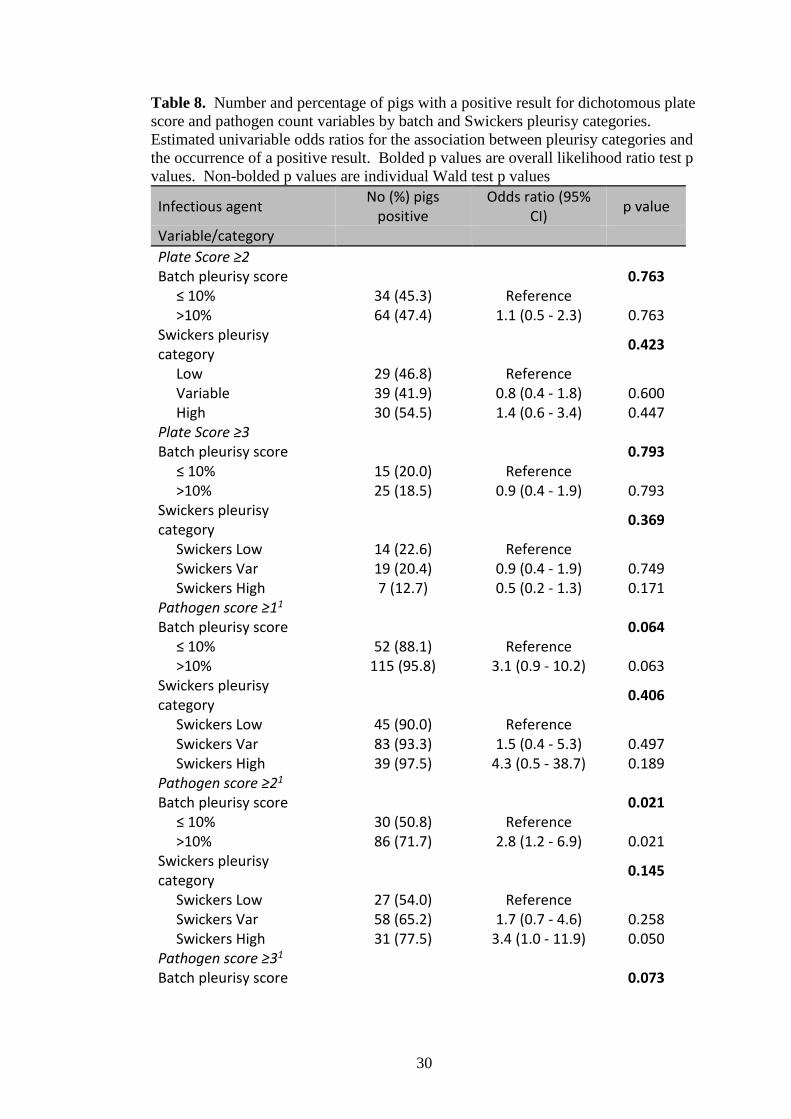
There was no association between the plate score and the pleurisy categories.
However, when looking at eight pathogens, M. hyopneumoniae, M. hyorhinis, A.
pleuropneumoniae, P. multocida L3, P. multocida L6, P. multocida LNT, S. suis and
PCV2, there was evidence of an association between higher pathogen score (more
pathogens present) and pleurisy categories (Table 8).
Crude risk of a pathogen score ≥ 2 was higher for pigs coming from batches with a
pleurisy score of >10% compared to those from batches where the pleurisy was ≤
10% (odds ratio (OR): 2.8, 95% confidence interval (CI): 1.2 – 6.9). Similarly crude
risk of a pathogen score ≥3 was higher for pigs coming from farms in the variable
and high pleurisy categories compared to the low pleurisy category (ORs: 4.3, 95%
CI: 1.2 – 15.5 and 7.6, 95% CI 1.8 – 31.9, respectively). Similar but less precisely
estimated trends were seen for a pathogen score ≥ 2 and the farm pleurisy category
and a pathogen score ≥ 3 and the batch pleurisy category (Table 8).
30
Table 8. Number and percentage of pigs with a positive result for dichotomous plate
score and pathogen count variables by batch and Swickers pleurisy categories.
Estimated univariable odds ratios for the association between pleurisy categories and
the occurrence of a positive result. Bolded p values are overall likelihood ratio test p
values. Non-bolded p values are individual Wald test p values
Infectious agent No (%) pigs
positive Odds ratio (95%
CI) p value
Variable/category
Plate Score ≥2
Batch pleurisy score 0.763 ≤ 10% 34 (45.3) Reference >10% 64 (47.4) 1.1 (0.5 - 2.3) 0.763 Swickers pleurisy category
0.423
Low 29 (46.8) Reference Variable 39 (41.9) 0.8 (0.4 - 1.8) 0.600 High 30 (54.5) 1.4 (0.6 - 3.4) 0.447 Plate Score ≥3
Batch pleurisy score 0.793 ≤ 10% 15 (20.0) Reference >10% 25 (18.5) 0.9 (0.4 - 1.9) 0.793 Swickers pleurisy category
0.369
Swickers Low 14 (22.6) Reference Swickers Var 19 (20.4) 0.9 (0.4 - 1.9) 0.749 Swickers High 7 (12.7) 0.5 (0.2 - 1.3) 0.171 Pathogen score ≥11
Batch pleurisy score 0.064 ≤ 10% 52 (88.1) Reference >10% 115 (95.8) 3.1 (0.9 - 10.2) 0.063 Swickers pleurisy category
0.406
Swickers Low 45 (90.0) Reference Swickers Var 83 (93.3) 1.5 (0.4 - 5.3) 0.497 Swickers High 39 (97.5) 4.3 (0.5 - 38.7) 0.189 Pathogen score ≥21
Batch pleurisy score 0.021 ≤ 10% 30 (50.8) Reference >10% 86 (71.7) 2.8 (1.2 - 6.9) 0.021 Swickers pleurisy category
0.145
Swickers Low 27 (54.0) Reference Swickers Var 58 (65.2) 1.7 (0.7 - 4.6) 0.258 Swickers High 31 (77.5) 3.4 (1.0 - 11.9) 0.050 Pathogen score ≥31
Batch pleurisy score 0.073

31
≤ 10% 10 (16.9) Reference >10% 37 (30.8) 2.8 (0.9 - 8.9) 0.073 Swickers pleurisy category
0.020
Swickers Low 5 (10.0) Reference Swickers Var 26 (29.2) 4.3 (1.2 - 15.5) 0.025 Swickers High 16 (40.0) 7.6 (1.8 - 31.9) 0.006
1Results are for 179 pigs from 39 farms
When looking at eight pathogens, M. hyopneumoniae, M. hyorhinis, A.
pleuropneumoniae, P. multocida 3, P. multocida 6, P. multocida NT, S. suis and
PCV2, most of the pigs (32.9%) harboured more than one of these respiratory
pathogen, while 12 pigs (5.7%) harboured none of these pathogens (Table 9).
Table 9. Frequency distribution of eight pathogen (M. hyopneumoniae, M. hyorhinis,
A. pleuropneumoniae, P. multocida 3, P. multocida 6, P. multocida NT, S. suis and
PCV2) counts for each pig
Pathogen Count No. pigs % pigs
0 12 5.7 1 51 24.3 2 69 32.9 3 37 17.6 4 10 4.8 Missing 31 14.8

32
Of the Mycoplasma species M. hyopneumoniae was the most prevalent being present
in 52.6% of the pigs sampled, present on 34 out of 46 farms and present on some
farms in all pigs sampled (Figure 4). S. suis was also present in high numbers
sampled from 56.2% of the lungs, present on 38 farms and on same farms it was
present in all pigs sampled. P. multocida L3 was also retrieved from some farms in
all pigs sampled.
Figure 4. Farm/batch level frequency distribution of the number of pigs testing
positive to Mycoplasma species, A. pleuropneumoniae, P. multocida L3, P.
multocida L6, P. multocida NT and S. suis.

33
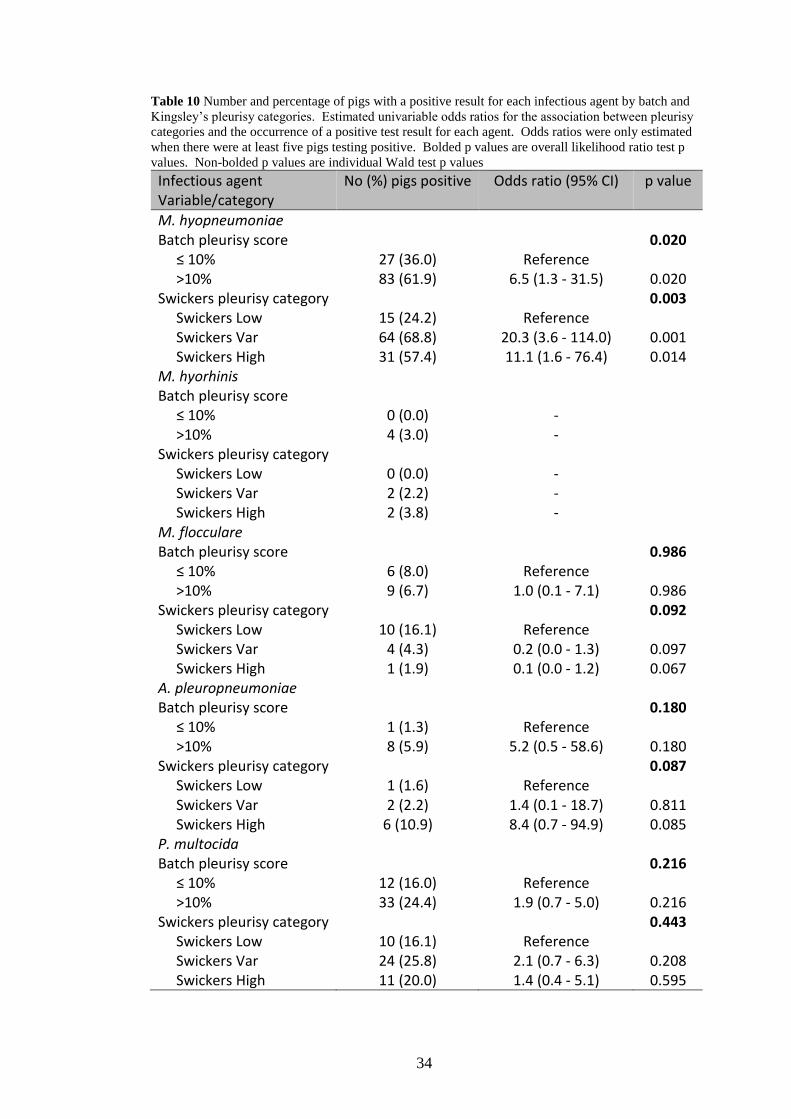
Estimated univariable odds ratios for the association between pleurisy categories and
the occurrence of a positive test result for each agent are shown in Table 10. Crude
risk of a positive result for M. hyopneumoniae was higher for pigs coming from
batches with a batch pleurisy score of >10% compared to those from batches where
the pleurisy was ≤ 10% (odds ratio (OR): 6.5, 95% confidence interval (CI): 1.3 –
31.5). Similarly crude risk of a positive result for M. hyopneumoniae was higher for
pigs coming from farms in the variable and high pleurisy categories compared to the
low pleurisy category (ORs: 20.3, 95% CI: 3.6 – 114.0 and 11.1, 95%CI 1.6 – 76.4,
respectively).
34
Table 10 Number and percentage of pigs with a positive result for each infectious agent by batch and
Kingsley’s pleurisy categories. Estimated univariable odds ratios for the association between pleurisy
categories and the occurrence of a positive test result for each agent. Odds ratios were only estimated
when there were at least five pigs testing positive. Bolded p values are overall likelihood ratio test p
values. Non-bolded p values are individual Wald test p values
Infectious agent No (%) pigs positive Odds ratio (95% CI) p value Variable/category
M. hyopneumoniae
Batch pleurisy score 0.020 ≤ 10% 27 (36.0) Reference >10% 83 (61.9) 6.5 (1.3 - 31.5) 0.020 Swickers pleurisy category 0.003 Swickers Low 15 (24.2) Reference Swickers Var 64 (68.8) 20.3 (3.6 - 114.0) 0.001 Swickers High 31 (57.4) 11.1 (1.6 - 76.4) 0.014 M. hyorhinis
Batch pleurisy score
≤ 10% 0 (0.0) - >10% 4 (3.0) - Swickers pleurisy category
Swickers Low 0 (0.0) - Swickers Var 2 (2.2) - Swickers High 2 (3.8) - M. flocculare
Batch pleurisy score 0.986 ≤ 10% 6 (8.0) Reference >10% 9 (6.7) 1.0 (0.1 - 7.1) 0.986 Swickers pleurisy category 0.092 Swickers Low 10 (16.1) Reference Swickers Var 4 (4.3) 0.2 (0.0 - 1.3) 0.097 Swickers High 1 (1.9) 0.1 (0.0 - 1.2) 0.067 A. pleuropneumoniae
Batch pleurisy score 0.180 ≤ 10% 1 (1.3) Reference >10% 8 (5.9) 5.2 (0.5 - 58.6) 0.180 Swickers pleurisy category 0.087 Swickers Low 1 (1.6) Reference Swickers Var 2 (2.2) 1.4 (0.1 - 18.7) 0.811 Swickers High 6 (10.9) 8.4 (0.7 - 94.9) 0.085 P. multocida
Batch pleurisy score 0.216 ≤ 10% 12 (16.0) Reference >10% 33 (24.4) 1.9 (0.7 - 5.0) 0.216 Swickers pleurisy category 0.443 Swickers Low 10 (16.1) Reference Swickers Var 24 (25.8) 2.1 (0.7 - 6.3) 0.208 Swickers High 11 (20.0) 1.4 (0.4 - 5.1) 0.595

35
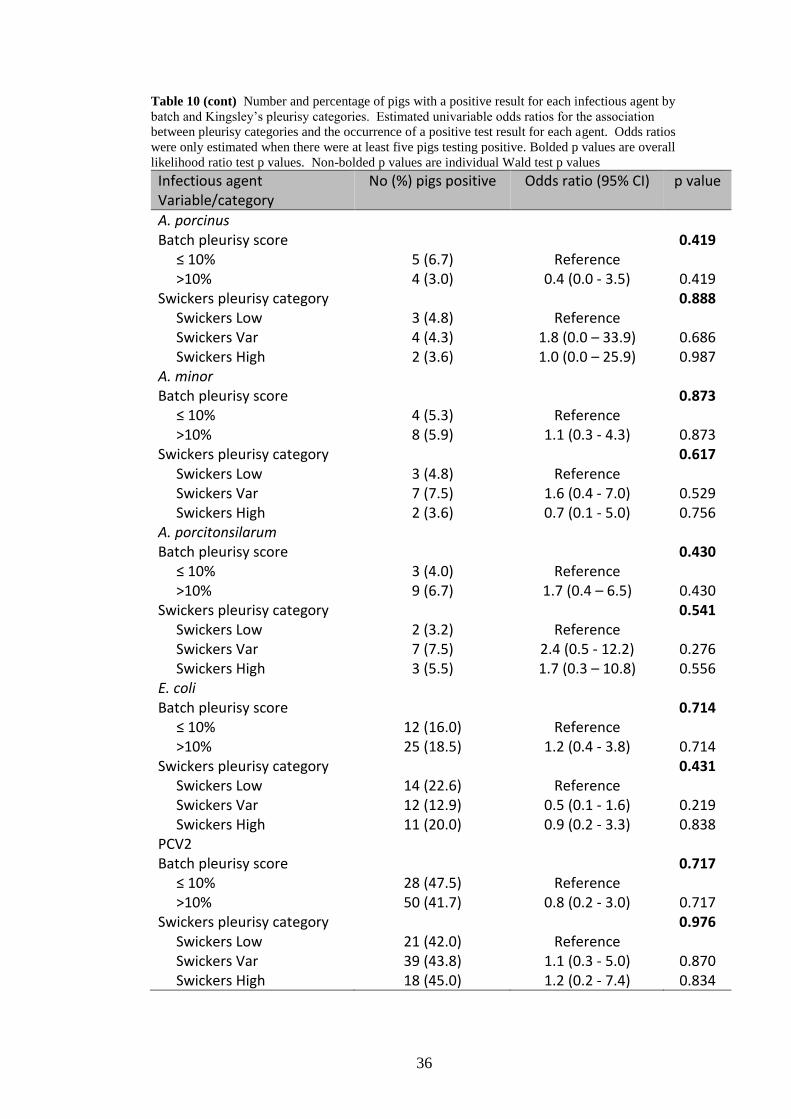
Table 10 (cont) Number and percentage of pigs with a positive result for each infectious agent by
batch and Kingsley’s pleurisy categories. Estimated univariable odds ratios for the association
between pleurisy categories and the occurrence of a positive test result for each agent. Odds ratios
were only estimated when there were at least five pigs testing positive. Bolded p values are overall
likelihood ratio test p values. Non-bolded p values are individual Wald test p values
Infectious agent No (%) pigs positive Odds ratio (95% CI) p value Variable/category
P. multocida L3
Batch pleurisy score 0.098 ≤ 10% 4 (5.3) Reference >10% 20 (14.8) 4.0 (0.8 - 20.2) 0.098 Swickers pleurisy category 0.137 Swickers Low 2 (3.2) Reference Swickers Var 15 (16.1) 7.4 (1.0 - 53.4) 0.047 Swickers High 7 (12.7) 5.3 (0.6 - 45.0) 0.128 P. multocida L6
Batch pleurisy score 0.618 ≤ 10% 6 (8.0) Reference >10% 14 (10.4) 1.3 (0.4 - 4.4) 0.618 Swickers pleurisy category 0.470 Swickers Low 8 (12.9) Reference Swickers Var 6 (6.5) 0.5 (0.1 - 1.7) 0.238 Swickers High 6 (10.9) 0.9 (0.2 - 3.2) 0.817 P. multocida NT
Batch pleurisy score
≤ 10% 2 (2.7) - >10% 2 (1.5) - Swickers pleurisy category
Swickers Low 0 (0.0) - Swickers Var 4 (4.3) - Swickers High 0 (0.0) - S. suis
Batch pleurisy score 0.342 ≤ 10% 38 (50.7) Reference >10% 80 (59.3) 1.6 (0.6 - 4.4) 0.342 Swickers pleurisy category 0.355 Swickers Low 38 (61.3) Reference Swickers Var 45 (48.4) 0.5 (0.2 - 1.7) 0.286 Swickers High 35 (63.6) 1.2 (0.3 - 4.3) 0.762 A. indolicus
Batch pleurisy score 0.150 ≤ 10% 1 (1.3) Reference >10% 8 (5.9) 4.7 (0.6 - 38.0) 0.150 Swickers pleurisy category 0.840 Swickers Low 2 (3.2) Reference Swickers Var 4 (4.3) 1.3 (0.2 - 7.6) 0.735 Swickers High 3 (5.5) 1.7 (0.3 - 10.8) 0.556
36
Table 10 (cont) Number and percentage of pigs with a positive result for each infectious agent by
batch and Kingsley’s pleurisy categories. Estimated univariable odds ratios for the association
between pleurisy categories and the occurrence of a positive test result for each agent. Odds ratios
were only estimated when there were at least five pigs testing positive. Bolded p values are overall
likelihood ratio test p values. Non-bolded p values are individual Wald test p values
Infectious agent No (%) pigs positive Odds ratio (95% CI) p value Variable/category
A. porcinus
Batch pleurisy score 0.419 ≤ 10% 5 (6.7) Reference >10% 4 (3.0) 0.4 (0.0 - 3.5) 0.419 Swickers pleurisy category 0.888 Swickers Low 3 (4.8) Reference Swickers Var 4 (4.3) 1.8 (0.0 – 33.9) 0.686 Swickers High 2 (3.6) 1.0 (0.0 – 25.9) 0.987 A. minor
Batch pleurisy score 0.873 ≤ 10% 4 (5.3) Reference >10% 8 (5.9) 1.1 (0.3 - 4.3) 0.873 Swickers pleurisy category 0.617 Swickers Low 3 (4.8) Reference Swickers Var 7 (7.5) 1.6 (0.4 - 7.0) 0.529 Swickers High 2 (3.6) 0.7 (0.1 - 5.0) 0.756 A. porcitonsilarum
Batch pleurisy score 0.430 ≤ 10% 3 (4.0) Reference >10% 9 (6.7) 1.7 (0.4 – 6.5) 0.430 Swickers pleurisy category 0.541 Swickers Low 2 (3.2) Reference Swickers Var 7 (7.5) 2.4 (0.5 - 12.2) 0.276 Swickers High 3 (5.5) 1.7 (0.3 – 10.8) 0.556 E. coli
Batch pleurisy score 0.714 ≤ 10% 12 (16.0) Reference >10% 25 (18.5) 1.2 (0.4 - 3.8) 0.714 Swickers pleurisy category 0.431 Swickers Low 14 (22.6) Reference Swickers Var 12 (12.9) 0.5 (0.1 - 1.6) 0.219 Swickers High 11 (20.0) 0.9 (0.2 - 3.3) 0.838 PCV2
Batch pleurisy score 0.717 ≤ 10% 28 (47.5) Reference >10% 50 (41.7) 0.8 (0.2 - 3.0) 0.717 Swickers pleurisy category 0.976 Swickers Low 21 (42.0) Reference Swickers Var 39 (43.8) 1.1 (0.3 - 5.0) 0.870 Swickers High 18 (45.0) 1.2 (0.2 - 7.4) 0.834

37
The point estimates of the odds ratios for the association between A.
pleuropneumoniae and P. multocida L3 were also large, suggesting increased risk of
positive test results for pigs from pigs with batch scores >10% and farms in the
variable and high pleurisy categories. However, the estimates were imprecise, with
95% confidence intervals including one, so given the limited power of the study (due
to small sample size and clustering of pathogens by farm) it is not possible to reach a
definitive conclusion about this association. There was no evidence of a strong
association between the identification of other bacterial species or PCV2 from pigs
or the dichotomous plate count variables and the batch or farm pleurisy category
(Table 10).
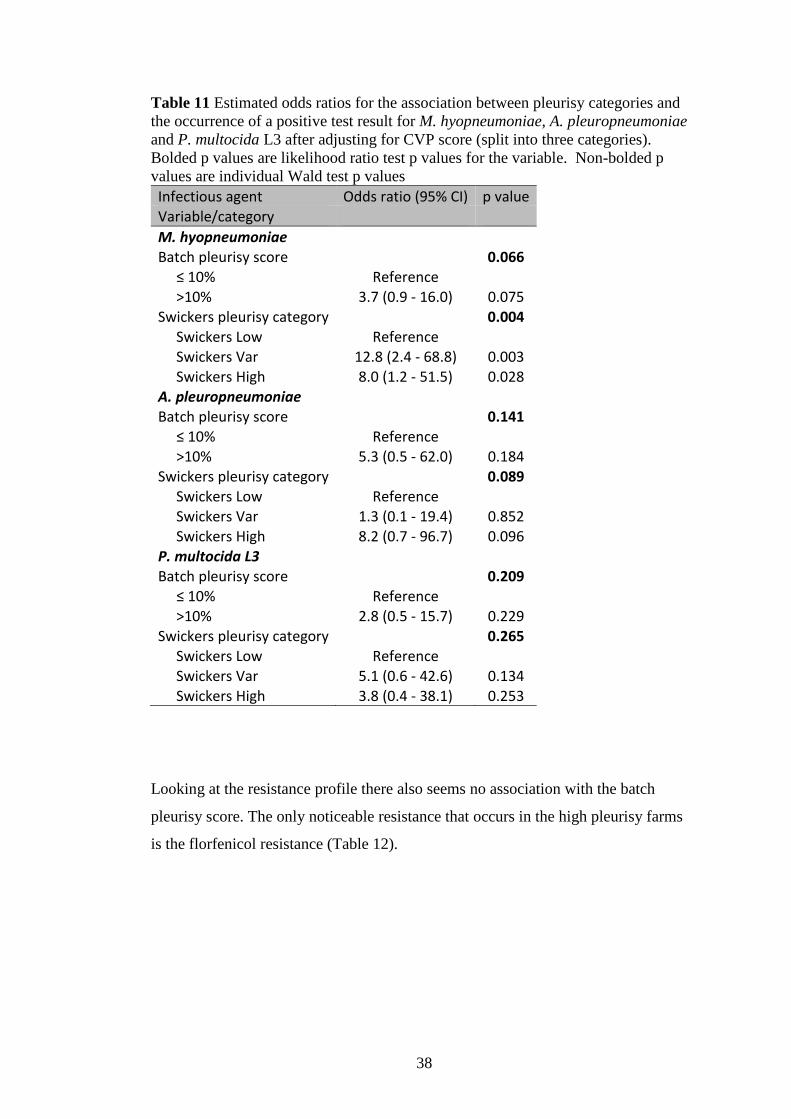
As it is likely that the presence of cranioventral pneumonia might confound the
observed association between the identification of pathogens and the batch or farm
pleurisy category, further analyses, adjusting for cranioventral lung score, were
conducted where the outcomes were the identification of M. hypneuomiae, A.
pleuropneumoniae and P. multocida L3. This was done using a variable that
categorised the cranioventral lung score into three categories each containing
approximately equal numbers of pigs. The point estimates were still large, but those
for M. hyopneumoniae and P. multocida were smaller than the unadjusted estimates
indicating that at least some of the observed crude association was due to
confounding. The estimates were also less precise with confidence intervals
including one in most cases so given the limited power of the study (due to small
sample size and clustering of pathogens by farm) it is not possible to reach a
definitive conclusion about these associations. (Table 11).
38
Table 11 Estimated odds ratios for the association between pleurisy categories and
the occurrence of a positive test result for M. hyopneumoniae, A. pleuropneumoniae
and P. multocida L3 after adjusting for CVP score (split into three categories).
Bolded p values are likelihood ratio test p values for the variable. Non-bolded p
values are individual Wald test p values
Infectious agent Odds ratio (95% CI) p value Variable/category
M. hyopneumoniae
Batch pleurisy score 0.066 ≤ 10% Reference >10% 3.7 (0.9 - 16.0) 0.075 Swickers pleurisy category 0.004
Swickers Low Reference Swickers Var 12.8 (2.4 - 68.8) 0.003 Swickers High 8.0 (1.2 - 51.5) 0.028 A. pleuropneumoniae
Batch pleurisy score 0.141 ≤ 10% Reference >10% 5.3 (0.5 - 62.0) 0.184 Swickers pleurisy category 0.089 Swickers Low Reference Swickers Var 1.3 (0.1 - 19.4) 0.852 Swickers High 8.2 (0.7 - 96.7) 0.096
P. multocida L3
Batch pleurisy score 0.209 ≤ 10% Reference >10% 2.8 (0.5 - 15.7) 0.229 Swickers pleurisy category 0.265 Swickers Low Reference Swickers Var 5.1 (0.6 - 42.6) 0.134 Swickers High 3.8 (0.4 - 38.1) 0.253
Looking at the resistance profile there also seems no association with the batch
pleurisy score. The only noticeable resistance that occurs in the high pleurisy farms
is the florfenicol resistance (Table 12).

39
Table 12. Antimicrobial sensitivity of S. suis isolates against five antimicrobials.
SXT = Cotrimoxazole (trimethoprim/sulfamethoxacole)
Code for
farm
Total pleurisy
score (%) for batch sampled
Antibiotic senstivity of Streptococcus suis isolates
Ampicillin Erythromycin Florfenicol Penicillin SXT
0881 1.49 S R S S S
1012 1.75 S S S S S
0863 1.76 S S S S S
0884 1.79 S R S R S
0817 1.85 S R S S S
0882 1.99 S R S S S
0414 3.48 S R S S I
0862 3.8 S R S S R
0461 4.52 S R S R R
1055 5.88 S R S S R
1041 7.84 S R S S S
0822 7.94 S R S S S
0814 8.73 R R S R S
1021 9.3 S R S S S
0615 10.46 R R S R R
0462 11.93 S R S S S
1031 13.66 S R S S S
0443 14.52 S R S S S
0871 15.48 R R S R R
0611 16.46 S R S S I
0442 16.82 S R S S S
1011 17.89 S R S S S
891 19.58 S R S S S
1121 20.16 S R S S S
1053 23.31 S R S S R
0842 23.81 S R S R S
0448 23.94 S R S S S
1052 24.36 S R S S R
1054 25.45 S R S S I
0816 27.46 S R S S S
0447 30.26 S R R S R
0225 38.46 S I S S S
0211 40 S S S S S
1111 41.01 S R R S R
0111 45.81 S R S R S
0851 46.3 R R I R S
1051 46.73 S R S S S
0444 62.96 S R S R S
All isolates were sensitive to ceftiofur and all were resistant to tilmicosin and
tulathromycin.

40
4. Application of Research
Pleurisy has a tremendous impact on the cost of the production and the cost of
the slaughter process. Studies in England have shown that the herds with pleurisy
prevalence running at >10% at slaughter experienced post-weaning mortalities
rates around 3.3% higher than unaffected units. These studies have predicted that
each 1% increase in pleurisy prevalence relates to a reduction of 1.55 – 2.5 g/day
average lifetime weight gain at batch level or in other terms, each 1% increase in
pleurisy prevalence at batch level resulted in 0.07 kg decrease in average
slaughter dead weight per pig. In other words pleurisy is costing the producer a
lot of money. To get a handle on the causes of pleurisy under Australian
conditions, this study was undertaken. It is vital to understand the bacterial and
viral species that are associated with chronic pleurisy.
For the farmer the knowledge gained on the bacterial species involved in pleurisy
is useful and will ensure targeted investigations and the development of
appropriate effective treatment and prevention programs.
The main points from this research are the importance of the two primary
pathogen species in pigs with pleurisy, PCV2 and M. hyopneumoniae. As well, the
importance of the secondary pathogens, which have so far been ignored in the
fight against respiratory disease, was shown.
The outcomes achieved are the knowledge of the bacterial and viral species that
are found in pigs with pleurisy at the abattoir and this knowledge will give farmers
the opportunity to investigate if these species are controlled on their farm and
implement control measures.
5. Conclusion
At slaughter, chronic pleuritis and cranio-ventral pulmonary consolidation are the
most frequent observations in the lungs of pigs (Martinez et al., 2007). These
consolidations and pleurisy are not associated with significant losses on the farms
41
due to growth retardation, pure feed efficiency and treatment cost, but chronic
pleurisy also has a huge impact at the abattoir due to increased time for slaughter and
compromised carcass weights and grades. Chronic respiratory disease represents a
long-standing problem can lead to prolonged or permanent damage. Contrary to the
acute outbreak, chronic disease is not normally caused by a single agent but by a
variety of pathogens (Mark White 2012). While a number of recognised bacterial
pathogens e.g. S. suis, M. hypneumoniae, P. multocida and A. pleuropneumoniae, as
well as PCV2 were found in this study no single dominant infectious cause of
pleurisy could be found.
The pathogens found in this study are similar to pathogens found in similar studies in
France, Denmark, Norway, Canada and Brazil (Dutra et al 2013, Fablet et al 2012b,
Høie et al 1991, O’Sullivan et al 2011, Tucker et al 2000). As in Canada, the most
frequent pathogen found in the current study was S. suis. This was followed by M.
hyopneumoniae, which was clustered by farm. Furthermore, after adjusting for
cranioventral lung score, there was increased risk of identification of M.
hyopneumoniae from pigs coming from farms in the variable and high farm pleurisy
categories compared to farms in the low pleurisy category. A similar trend was seen
in pigs coming from batches with a pleurisy score of >10% compared to those from
batches where the pleurisy was ≤ 10%, but this estimate was less precise. M.
hyopneumoniae has been found in the other countries as a major concern despite
widespread vaccination (Opriessnig et al 2011) and it clearly remains a major
concern in Australia as well, despite vaccination programs.
We found PCV2 was present in 44.1% of pigs in large numbers. It has been reported
that PCV2 is underpinning pleurisy (Tucker et al 2000), which might be due to its
potential to reduce acquired immunity to other pathogens (Oprieessnig et al 2006).
Vaccination against PCV2 has been shown to decrease co-infection with secondary
pathogens (Hansen et al 2010) and IgM antibodies against PCV are associated with
reduced pleuritis or lung lesions at slaughter (Wellenberg et al 2010). It is well
established that a combination of low pathogenic agents, such as PCV2 and M.
hyopneumoniae, can result in severe respiratory disease (Opriessnig et al 2011).
42
There is a strong link between pleurisy and underlying pneumonia, a correlation
which studies have relied on when sampling to identify the traditional bacterial
contributors to respiratory disease, therefore, the presence of P. multocida in 21.4 %
of the pigs in the current study is not surprising, as P. multocida has been found to be
an important agent in the development of pneumonia (Dutra et al 2013).
Experimental infections with P. multocida failed to cause disease, but, with the
addition of M. hypneumoniae, severe coughing and extensive lesions could be
observed (Opriessnig et al 2011). So the finding of many farms being co-infected
with M. hypneumoniae and P. multocida might explain some of the high pleurisy
cases. The same synergistic or additive effect has been found for M. hyopneumoniae
and A. pleuropneumoniae (Opriessnig et al 2011). Overall synergistic effects of
pathogens could explain the observation that most pigs had two pathogens. However,
not all farms with high pleurisy had a combination of pathogens and one farm in
particular stood out with a very high pleurisy percentage with only S. suis being
retrieved from the lungs. The explanations might be other contributing factors such
as parasites and non-infectious factors, such as the environment, management and
pig factors. It has been found that parasitism can affect the ability to respond to
respiratory disease and that it can also negatively impact M. hyopneuomiae
vaccination (Opriessnig et al 2011). Factors such as air pollution due to ammonia and
airborne particles can trigger inflammatory reactions and reduce the resistance to
respiratory infections and have been attributed negatively with production efficiency
(Banhazi 2013). Other risk factors for pleurisy have been identified such as no all-in-
all out flow, rearing pigs in the same air space with an age difference of more than
one month and repeated mixing of pigs (Jaeger et al, 2012)
A lot of bacterial species that are classed as species of minor relevance based on their
ability to induce respiratory disease and lesions (secondary pathogens) (Opriessnig et
al 2011), such as the Actinobacillus species, M. hyorhinis, P. multocida and S. suis,
were found in this study. The finding of S. suis from 38 farms, with the organism
being clustered by farm, and the observation that S. suis was present on plates with
high plates score indicates that this pathogen was present in lungs in substantial
numbers. The fact that it was on many farms with a high batch pleurisy score and
that it was the only pathogen found in lungs from a batch with 38.5% pleurisy

43
suggest that it has a contribution to pleurisy. S. suis is widely regarded as a
commensal in the upper respiratory tract and can be transmitted via vertical
transmission, however the main route of transmission is the respiratory route (Amass
1996, Higgins & Gottschalk 2006). It is estimated that almost 100% of pig farms
worldwide have carrier animals (Higgins & Gottschalk 2006). However, reports in
the literature indicate that the gdh PCR can give false positives (Goyette-Desjardins
et al 2014), which might have caused some over-estimation of the prevalence of this
organism. In the current study an isolate was only identified as S. suis if two
different PCR assays agreed, avoiding false positive diagnosis. Therefore, our
finding of 83% of farms having pigs that have S. suis in lungs affected by pleurisy
indicates that the statement of almost 100% of farms worldwide having carriers
(Higgins & Gottschalk 2006) appears correct. S. suis is regarded as one of the most
important pathogens in the porcine industry with many disease symptoms, but the
most renown ones being septicaemia and meningitis (Goyette-Desjardins et al 2014).
Florfenicol resistance was only found in batches (four farms) with high lung score
with the lungs also being positive for M. hyopneumoniae. These lungs also had either
P. multocida (three farms) or A. pleuropneumoniae (one farm). One of the farms
was associated with very high numbers of P. multocida. The S. suis resistance was
used as an indicator for resistance levels of these farms. It is well known that
resistance can be transmitted between bacterial species (da Costa et al 2013) and our
assumption that resistance present in S. suis might reflect the resistance in other
respiratory pathogens from this farms is a reasonable assumption. Resistance to
florfenicol has been detected in Australian porcine P. multocida isolates at a level of
2%, while no resistance was found in A. pleuropneumoniae (Dayao et al 2014).
The Actinobacillus species identified by 16S rDNA sequencing, which were found
on 28 out of 46 farms, are not believed to be associated with pathogenicity (Chiers et
al 2001). However, as early as 2001 there was a hint that there are new species
among the Actinobacillus species that might possibly be pathogenic (Kielstein et al
2001). In a recent a preliminary study performed in our laboratory, we have
examined 36 field isolates of Actinobacillus species (many from the current pleurisy
study) by recN sequencing and aligning the sequences to the reference strains for the

44
known Actinobacillus species. This preliminary study revealed that a total of 23
isolates could not be assigned to any of the Actinobacillus species. The phylogenetic
tree of the recN sequences indicated the presence of at least one novel species.
Given the uncertainity over identifaction and classification, it is not possible to be
confident about the pathogenic potential of these isolates.
Many of the P. multocida isolates were recovered in larger numbers and might have
been a main contributor to the observed pleurisy.
There were some plates that had a lot of bacteria on the plate but they were
environmental contaminants among them Streptococcus species and some of
unknown identity. Isolates that were Gram positive and had a colony appearance
typical of environmental organisms were not further analysed. At the slaughter pigs
were submerged in a scaling water tank and the possibility of contamination of the
lungs with bacteria is a possibility. However, some of the pigs had no bacterial
growth on their plates at all, despite the fact that the batches examined in this study
never being the first ones to go through the tank. The fact that not all lungs from one
batch had the same pathogens also speaks against contamination by the water. It is
known that lung lesions normally prevent contaminations due to mucopurulent or
catarrhal exudate in the airways of the affected pigs (Sorensen et al 2006). A study
of specific pathogen free pigs without lesions in the lung produced negative PCR
results for M. hypneumoniae, A. pleuropneumoniae, P. multocida, H. parasuis and S.
suis when their lungs were examined after scalding (Marois et al 2008). Finally, any
environmental contamination could have been due to the breakage of some tissue
when removing adhered lungs.
M. hyopneuomia and M. hyorhinis are known pathogens in pigs, the pathogenicity of
M. flocculare is still in question with the general belief being that it is not pathogenic
(Kobisch and Friis 1996). However, a case study of the Faculty of Veterinary
Medicine Timisoara in Romania found M. flocculare in lesions of enzootic
pneumonia in younger pigs and therefore suggesting a pathogenic potential (Faur et
al 2010).

45
As this study only looked at one batch per farm it has not included the seasonal
variation. Seasonal variation of pleurisy have been observed in other studies (Eze et
al 2015). It is known that A. pleuropneumoniae infections occur in spring and
autumn and could affect the pathogens that might be involved in the respiratory
disease of a particular batch and hence might not represent all the pathogens present
on the farm.
Summary
Despite no single cause of pleurisy being identified in this study, the finding of 38
and 34 farms being positive for S. suis and M. hyopneumoniae, respectively, points
out the importance of these bacterial species as has been noted in other countries
(Opriessnig et al 201; Goyette-Desjardins et al 2014). There was an association
between presence of M. hyopneumoniae and pigs with pleurisy coming from farms
with high pleurisy classed farms compared to pigs with pleurisy coming from low
pleurisy classed farms. However, given the design of the study it is not possible to
infer that there is a causal relationship between M. hyopneumoniae and pleurisy.
Also, as there were farms that were negative for M. hyopneumoniae but which had a
high batch pleurisy score (three of 35 high batch pleurisy score farms) and also some
farms that were positive for M. hyopneumoniae that had a low batch pleurisy score it
is clear that M. hyopneumoniae is not specific to high pleurisy batches/farms.
The finding of a lot of pathogens regarded as secondary pathogens, some of which
were in high numbers (S. suis and P. multocida) in some of the lungs, points to the
importance of these pathogens in the porcine respiratory disease complex.
In light of synergistic interactions of bacteria/viral species, of which M.
hyopneumoniae and PCV2 have been implicated as a common species, the finding of
74% of the farms with a positive result for M. hyopneumoniae and 63% of the farms
with a high concentration of PCV2 is a concerning finding.
6. Limitations/Risks
This study was only done in Queensland and involved a limited number of farms.
We believe that the results are most likely the same for other states in Australia,
as Queensland farms are not markedly or obviously different to the rest of the

46
farms in Australia. As well, the pathogens seen in our reference diagnostic
services submitted from Queensland farms are not different to the ones in the
other states of Australia. However, it is important that the key limit of this study,
the small sample size of farms, is recognized. This limitation was a reflection of
the resources available to do the work.
7. Recommendations
The finding that M. hyopneumoniae, P. multocida, S. suis and PCV2 were most
commonly identified and strongly clustered by farms is a major finding. M.
hyopneumoniae and S. suis were present on 34 and 38 out of 46 farms, while P.
multocida was present on 24 out of 46 and PCV2 on 29 farms of 39 farms tested.
Actinobacillus species were also seen on 29 farms out of 46. This means that most
of the bacterial species seen in pleurisy affected lungs were mainly those typically
regarded as secondary pathogens.
In the light of synergistic interaction of M. hyopneumoniae and PCV2 with
secondary pathogens, it seems vital that treatment and prevention/control
options for M. hyopneuomiae and PCV2 are looked at again. The results of this
study clearly show that farmers need to have a look at the status of these two
pathogens on their farm and re-evaluate the treatment and prevention/control
regimens currently in place.
It is well recorded in literature that S. suis is on most pig farms, but not much
attention has been paid to this pathogen. The same can be said for P. multocida
and Actinobacillus species. All are classed as secondary pathogens and therefore
regarded as not very important. The results of this study suggest that it would be
advisable to have a closer look at these “secondary” pathogens in terms of
prevention and treatment options, be that early intervention or vaccination.
We are currently looking at defining the identification of the Actinobacillus
species obtained in this study, as some of these have been associated with
respiratory disease outbreaks and we have potentially new species among the
isolates we currently identified as the “A. minor/porcitonsillarum complex”. We

47
are planning to develop PCR based identification tools to help in understanding
the role of these bacteria in respiratory disease and pleurisy.
So the main recommendations from this research are:
The industry should consider how well PCV2 is controlled on pig farms.
The industry should review M. hyopneumoniae vaccination control
The industry should have a look at the level of S. suis, P. multocida and
Actinobacillus species on farm level and at possible treatment/prevention
to keep the level of these species down.
8. Acknowledgements
I like to thank all my collaborators in this project for all their contributions and hard
work
Collaborators:
Pat Blackall
Tamsin Barnes
Jo Meers
Kit Park
John Al-Alawneh
I like to thank the Jillian Templeton, who was bound to this project by a subcontract.
I would also like to thank all the people in the laboratory and my PhD student for
helping at crucial times:
Reema Singh
Denise Dayao
Sarah Yee
Nhan Giang
I like to thank New Kyaw Mone for the analyzes of the PCV2 samples

48
9. References
Amass, S.F., Clark, L.K., Wu, C.C., Hill, M.A. (1996) Streptococcus suis colonization
of piglets during partuition. Swine Health Production 4, 269 – 272.
Banhazi, T. (2013) Environmental and management effects associated with improved
production efficiency in a respiratory disease free pig herd. In: A. Aland and T.
Banhazi (Eds.), Livestock housing: Modern management to ensure optimal health
and welfare of farm animals. DOI: http://dx.doi.org/10.3920/978-90-8686-771-4
pp297 - 314.
Chiers, K., Haesebrouck, F., Mateusen, B., Van Overbeke, I., & Ducatelle, R. (2001).
Pathogenicity of Actinobacillus minor, Actinobacillus indolicus and Actinobacillus
porcinus strains for gnotobiotic piglets. Journal of Veterinary Medicine, series B 48,
127-131.
Clinical Laboratory Standards Institute (2013). Performance standards for
antimicrobial disk and dilution susceptibility tests for bacteria isolated from animals:
Approved Standard - Fourth Edition. CLSI Document VET01-A4 (Wayne,
Pennsylvannia, Clinical and Laboratory Standards Insitute).
Clinical and Laboratory Standards Institute 2015. Performance Standards for
Antimicrobial Disk and Dilution Susceptibility Tests for Bacteria Isolated from
Animals VET01S (Wayne, Pennsylvania, Clinical and Laboratory Standards Institute).
Christensen, G., Sorensen, V., Mousing, J. Disease of the respiratory system. In:
Disease of Swine, Eds. Straw B, S D’allaire, W Mengeling, D Taylor, 8th edition.
1999. Blackwell Science. Oxford.
da Costa, P.M., Loureiro, L., Matos, A.J.F. (2013) Transfer of multidrug-resistant
bacteria between intermingled ecological niches: The interface between humans,
animals and the environment. International Journal of Environmental Research 10, 278
– 294.
Dayao, D., Gibson, J. Blackall, J.P., Turni, C. (2014) Antimicrobial resistance in
bacteria associated with porcine respiratory disease in Australia. Veterinary
Microbiology 171, 232 – 235.
Dutra, V., Chitarra, C. S., de Paula, D.A.J., Schvarzbach dos Santos, J.C., Silva de
Faria, A.C., de Oliveira Filho, J.X., da Silveira, M.M., De Oliceira, A.C.S., Pescador,
C.A., Nakazato, L. (2013) Detection of Pasteurella multocida by qPCR associated
with pneumonic lung in pigs slaughtered in Mato Grosso Brazil. International Journal
of Sciences 2, 25 – 31.

49
Enøe C, Mousing J, Schirmer AL, Willeberg P. 2002. Infectious and rearing-system
related risk factors for chronic pleuritis in slaughter pigs. Preventative Veterinary
Medicine 54, 337 – 349.
Eze, J.I., Correia-Gomes, C. Borobia-Belsue, J., Tucker, A.W., Sparrow, D.
Strachan, D.W., Gunn, G.J. (2015) Comparison of respiratory disease prevalence
among voluntary monitoring system for pig health and welfare in the UK. PLOS One
10, e0128137. doi:10. 1371/journal.pone.0128137.
Fablet, C., Marois-Crehan, C., Simon, G., Grasland, B., jestin, A., Kobisch, M.,
Madec, F. 2012a. Infectious agents associated with respiratory disease in 125
farrow-to-finish pig hers: A cross-sectional study. Veterinary Microbiology 157, 152
– 163.
Fablet, C., Marois, C., Dorenlor, V.,econo, F., Eveno, E., jolly, J.P., Le Devenec, L.,
Kobisch, M., Madec, F. And Rose, N. 2012b. Bacterial pathogens associated with
lung lesions in slaughter pigs from 125 herds. Research in Veterinary Science, 93,
627 – 630.
Faur, B., Popa, V., Herman, V., Pascu, C., Costinar, L., Vaduva, I., Surpat, A. Irimie,
S. (2010) Mycoplasma floccuare isolated from pig lungs. LUCRĂRI STIINłIFICE
MEDICINĂ VETERINARĂ VOL. XLIII (1), 2010 TIMISOARA http://www.usab-
tm.ro/vol10MV/30_vol10.pdf
Fraile, L., Alegre, A., Lopez-Jimenez, R., Norfrarias, M.and Segales, J. 2010. Risk
factors associated with pleuritis and cranio-ventral pulmonary consolidation in
slaughter-age pigs. The Veterinary Journal 184, 326 – 333.
Goyette-Desjardins, G., Auger, J.-P., Xu, J., Segura, M., Gottschalk, M. (2014)
Streptococcus suis, an important pig pathogen and emerging zoonotic agent – an
update on the worldwide distribution based on serotyping and sequence typing.
Emerging Microbes & Infections 3, e45; doi:10.1038/emi.2014.45.
Hansen, M.S., Pors, S.E., Jensen, H.E., Bille-hansen, V., Bisgaard, M., Flachs, E.M.
and Nielsen, O.L. (2010) An investigation of the pathology and pathogens associated
with porcine respiratory disease complex in Denmark. Journal of Comparative
Pathology 143, 120 – 131.
Harper, M., John, M., Turni, C., Edmunds, M., St Michael, F., Adler, B., Blackall,
P.J., Cox, AD., Boyce, J.D. (2015) Development of a rapid multiplex PCR assay to
genotype Pasteurella multocida strains by use of the lipopolysaccharide outer core
biosynthesis locus. Journal of Clinical Microbiology 53, 477 – 485.
Higgins, R., Gottschalk, M. (2006) Streptococcal diseases In: Straw B.E., D'Allaire
S., Mengeling W.L., Taylor D.J. (Eds.) Diseases of swine Ames, IA; Iowa State
University Press; 769–783.
http://www.ncbi.nlm.nih.gov/pubmed/?term=Blackall%20PJ%5BAuthor%5D&cauthor=true&cauthor_uid=25428149

50
Høie S, Falk K, Lium BM. 1991. An abattoir survey of pneumonia and pleuritis in
slaughter weight swine from 9 selected herds. IV. Bacteriological findings in chronic
pneumonic lesions. Acta Veterinary Scandinavia, 32, 395 – 402.
Jaeger, H.C., McKinley, T.J., Wood, J.J.N., Pearce, G.P., Williamson, S., Strugnell,
B., Done, S., Habernoll, H., Palzer, A. and Tucker, A.W. 2012 Factors associated
with Pleurisy in pigs: A case-control analysis of slaughter pig data for England and
Wales. PlosOne, 7, 2 – 9.
Jirawattanapong, P., Stockhofe-Zurwieden, N, van Leengoed, L., Wisselink, H.,
Raymakers, R., Cruijsen, T., van der Peet-Schwering, C, Nielen, M.and van Nes, A.
2011. Pleuritis in slaughter pigs: relations between lung lesions and bacteriology in
10 herds with high pleuritis. Research in Veterinary Science 88, 11 - 15.
Kawata, K., Anzai, T., Senna, K., Kikuchi, N., Ezawa, A., Takahashi, T. (2004)
Simple and rapid PCR method for identification of streptococcal species relevant to
animal infections based on 23S rDNA sequene. FEMS Microbiological Letters 237,
57 – 64.
Kielstein, P., Wuthe, H.-H., Angen, Ø., Mutters, R., & Ahrens, P. (2001). Phenotypic
and genetic characterization of NAD-dependent Pasteurellaceae from the respiratory
tract of pigs and their possible pathogenetic importance. Veterinary microbiology,
81(3), 243-255
Kobisch, M., Fiis, N.F. (1996) Swine mycoplasmosis. Review of Scientific
Technology 15, 1569 – 1605.
Merialdi, G., Dottori, M., Bonilauri, P., Luppi, A., Gozio, S., Pozzi, P., Spaggiari, B.
And Martelli, P. 2011. Survey of pleuritis and pulmonary lesions in pigs at abattoir
with a focus on the extent of the condition and herd risk factors. The Veterinary
Journal 193, 234 – 239.
Martinez, J., Jaro, P.J., Aduriz, G., Gomez, E.A., Peris, B., Corpa, J.M. (2007)
Carcass condemnation causes of growth retarded pigs at slaughter. The Veterinary
Journal 174, 160 – 164.
Marois, C., Cariolet, R., Morvan, H., Kobish, M. (2008) Transmission of pathogenic
respiratory bacteria to specific pathogen free pigs at slaughter. Veterinary
Microbiology 129, 325 – 332.
Okwumabua, O., O’Connor, M., Shull, E. (2003). A polymerase chain reaction
(PCR) assay specific for Streptococcus suis based on the gene encoding the
glutamate dehydrogenase. FEMS Microbiology Letters 218, 79 – 84

51
Olvera, A., Sibila, M., Calsamiglia, M., Segalés, J. & Domingo, M. (2004)
Comparison of porcine circovirus type 2 load in serum quantified by a real time PCR
in postweaning multisystemic wasting syndrome and porcine dermatitis and
nephropathy syndrome naturally affected pigs. Journal of Virological Methods 117,.
75 - 80.
Opriessnig, T., Gimenez-Lirola, L.G. and Halbur, P.G. (2011) Polymicrobial
respiratory disease in pigs. Animal Health Research Reviews 12, 133 – 148
Pointen AM, Davies PR, Bahnson PB. Disease Surveillance at Slaughter. In: Straw
BE, D’Allaire DS, Mengeling WL, Taylor DJ (Eds.), Disease of Swine, Iowa State
Press, Iowa, 1999: 1111 – 1132.
O’Sullivan, T., Friendship, R., Blackwell, T., Pearl, D., McEwen, B., Carman, S.,
Slavic, D. And Dewey, C. 2011. Microbiological identification and analysis of
swine tonsils collected from carcasses at slaughter. The Canadian Journal of
Veterinary Research, 75, 106 – 111.
Stakenborg, T., Vicca, J., Butaye, P. Imberechts, H., Peeters, J., de Kruil, A.,
Haesebrouck, F., Maes, D. (2006) A multiplex PCR to identify porcine Mycoplasmas
present in broth culture. Veterinary Research Communications 30, 239 – 247.
Sorensen, V., Jorsal, S.E., Mousing, J. (2006) Diseases of the respiratory system. In:
Straw, B., Zimmermann, W., D”Allaire, S., Taylor, D.J. (Eds.), Disease of Swine, 9th
edition. Iowa State University Press, Ames, Iowa, pp. 149 – 177.
Townsend, K.M. Frost, A., Lee, C.W., Papadimitriou, J.M., Dawkins, J.S. (1998)
Development of Pasteurella multocida isolates. Journal of Clinical Micobiology
1998, 1096 – 1100.
Tucker, A.W., McKinley, T.J. and Jaeger, H.J. 2000 BPEX Pleurisy in Pigs
http://www.bpex.org.uk/R-and-D/Pleurisy.aspx
Wellenberg, G.J., Bouwkamp, F.T., Wolf, P.J., Swart, W.A., Mombarg, M.J., de
Gee, A.L. 2010. A study on the severity and relevance of porcine circovirus type 2
infections in Dutch fattening pigs with respiratory diseases. Veterinary Microbiology
142, 217-224
White, M. (2014) Respiratory disease in growing pigs Module Part 2 – Chronic
respiratory disease (1). In: NADIS livestock health bulletins.
http://www.nadis.org.uk/bulletins/respiratory-disease-in-growing-pigs-module/part-
2-chronic-respiratory-disease%281%29.aspx?altTemplate=PDF