ESTABLISHING A TRADITION OF COMMITMENT: … · establishing a tradition of commitment: intellectual...
63
October 10, 2008 ESTABLISHING A TRADITION OF COMMITMENT: INTELLECTUAL AND DEVELOPMENTAL DISABILITIES SERVICES IN INDIANA David Braddock, Ph.D. and Richard Hemp, M.A. Prepared for the Indiana Institute on Disability and Community, Indiana University Indiana Governor’s Council for People with Disabilities Arc of Indiana Indiana Association of Rehabilitation Facilities, Inc.
-
Upload
truonglien -
Category
Documents
-
view
214 -
download
0
Transcript of ESTABLISHING A TRADITION OF COMMITMENT: … · establishing a tradition of commitment: intellectual...

October 10, 2008
EESSTTAABBLLIISSHHIINNGG AA TTRRAADDIITTIIOONN OOFF CCOOMMMMIITTMMEENNTT:: IINNTTEELLLLEECCTTUUAALL AANNDD DDEEVVEELLOOPPMMEENNTTAALL
DDIISSAABBIILLIITTIIEESS SSEERRVVIICCEESS IINN IINNDDIIAANNAA
DDaavviidd BBrraaddddoocckk,, PPhh..DD.. aanndd RRiicchhaarrdd HHeemmpp,, MM..AA..
Prepared for the
IInnddiiaannaa IInnssttiittuuttee oonn DDiissaabbiilliittyy aanndd CCoommmmuunniittyy,, IInnddiiaannaa UUnniivveerrssiittyy
IInnddiiaannaa GGoovveerrnnoorr’’ss CCoouunncciill ffoorr PPeeooppllee wwiitthh DDiissaabbiilliittiieess
AArrcc ooff IInnddiiaannaa
IInnddiiaannaa AAssssoocciiaattiioonn ooff RReehhaabbiilliittaattiioonn FFaacciilliittiieess,, IInncc..

ESTABLISHING A TRADITION OF COMMITMENT:
INTELLECTUAL AND DEVELOPMENTAL DISABILITIES SERVICES IN INDIANA
by
David Braddock, Ph.D. and Richard Hemp, M.A.
Prepared for
Indiana Institute on Disability and Community, Indiana University Indiana Governor’s Planning Council for People With Disabilities
Arc of Indiana IInnddiiaannaa AAssssoocciiaattiioonn ooff RReehhaabbiilliittaattiioonn FFaacciilliittiieess,, IInncc..
October 10, 2008

ii
Contents Listing of Figures and Tables ........................................................................................iii Acknowledgments ......................................................................................................... v Executive Summary ......................................................................................................vi
I. INTRODUCTION TO THE STUDY ................................................................................ 1
II. DECLINING UTILIZATION OF INSTITUTIONS............................................................ 2
1. Trends in State-Operated Institutions in Indiana and the Comparison States .......... 2 2. Closure of State Institutions ...................................................................................... 5 3. Utilization of Private Institutions in Indiana................................................................ 7 4. Utilization of Nursing Facilities in Indiana.................................................................. 7 5. Summary: Institutions and Nursing Facilities in Indiana............................................ 9
III. GROWTH OF COMMUNITY SERVICES .................................................................. 10
1. Community Residential Services in the U.S............................................................ 10 2. Community Residential Services in Indiana............................................................ 11
2.1 The Indiana 317 Plan....................................................................................... 11 2.2 Quality Assurance and Quality Improvement .................................................. 12
3. Out-of-Home Residents with I/DD in Indiana .......................................................... 13 4. Financing Community Services in Indiana .............................................................. 14
4.1 Family Support................................................................................................. 16 4.2 Supported Employment ................................................................................... 17 4.3 Supported Living.............................................................................................. 19
5. Fiscal Effort in Indiana............................................................................................. 20
IV. MEDICAID FINANCING OF I/DD SERVICES ........................................................... 21
1. The Home and Community Based Services (HCBS) Waiver.................................. 22 2. HCBS Waiver Services in Indiana........................................................................... 23
V. COMMUNITY SERVICES IN THE COMPARISON STATES ..................................... 26
1. Medicaid Financing in the Comparison States........................................................ 26 2. Analysis of Services and Spending in Indiana and the Five Comparison States.... 27
2.1 Indiana ....................................................................................................... 29 2.2 Illinois ....................................................................................................... 30 2.3 Michigan ....................................................................................................... 31 2.4 Minnesota ....................................................................................................... 33 2.4 Ohio ....................................................................................................... 35 2.4 Wisconsin ....................................................................................................... 36
3. Summary of Comparison States ............................................................................. 37
VI. AGING CAREGIVERS AND WAITING LISTS IN INDIANA ...................................... 39
VII. CONCLUSION.......................................................................................................... 42
Study Recommendations ............................................................................................ 45 The View Ahead.......................................................................................................... 46
VIII. REFERENCES ........................................................................................................ 49

iii
Listing of Figures and Tables Figure 1: Institutional utilization in Indiana, the U.S. and the five
comparison states ........................................................................................ 3
Figure 2: Nursing facility utilization in Indiana, the U.S. and the five comparison states ........................................................................................ 9
Figure 3: Public and private 16+ institutional utilization in Indiana, the U.S., and the comparison states ............................................................ 9
Figure 4: Residents in settings for six or fewer persons in the U.S.: 1960-2006 ................................................................................... 10
Figure 5: Out-of-home residents with I/DD in Indiana and the comparison states, by setting: 2008 (Indiana) and 2006........................................................... 14
Figure 6: Inflation-adjusted trends in I/DD spending in Indiana, 1977-2008.............. 15
Figure 7: Family support utilization in Indiana, the comparison states and the U.S.: 1997-2008 ............................................................................ 15
Figure 8: Supported employment utilization in Indiana, the comparison states and the U.S.: 1997-2008 ............................................................................ 18
Figure 9: Supported living utilization in Indiana, the comparison states and the U.S.: 1997-2008 ............................................................................ 20
Figure 10: Total I/DD fiscal effort in Indiana and the U.S. ........................................... 21
Figure 11: Public spending for I/DD services by revenue source in Indiana, 2008.............................................................................................. 22
Figure 12: Federal I/DD Medicaid revenue: U.S.......................................................... 24
Figure 13: Federal I/DD Medicaid revenue in Indiana ................................................. 25
Figure 14: Federal-state Waiver spending per capita, 2006 and 2008 (Indiana)......... 27
Figure 15: Trends in federal HCBS Waiver, ICF/MR, and related Medicaid spending in the comparison states: FY 1977-06 ........................................ 28
Figure 16: Indiana Trends in I/DD spending, 1977-06................................................. 29
Figure 17: Illinois Trends in I/DD spending, 1977-06................................................... 31
Figure 18: Michigan Trends in I/DD spending, 1977-06 .............................................. 32
Figure 19: Minnesota Trends in I/DD spending, 1977-06 ............................................ 34
Figure 20: Ohio Trends in I/DD spending, 1977-06 ..................................................... 35
Figure 21: Wisconsin Trends in I/DD spending, 1977-06 ............................................ 36
Figure 22: Hourly wages in 2006................................................................................. 38
Figure 23: Indiana—Estimated distribution of individuals with I/DD by living arrangement, 2008 ....................................................................... 40
Figure 24: Indiana—Estimated number of individuals with I/DD by age group living with family caregivers, 2008.............................................................. 41
Figure 25: Annual percentage change in I/DD spending during 1999-2008: Indiana .. 44
Figure 26: Annual percentage change in inflation-adjusted state general fund spending: Indiana ............................................................................... 47

iv
Table 1: Average daily census of Indiana developmental centers state hospital I/DD units: FY 2008......................................................................... 4
Table 2: Completed, in-progress closures of public institutions since 2000 ............... 5
Table 3: States with family support cash subsidy programs in 2006........................ 17
v
Acknowledgments
The authors express their appreciation to Professor David Mank, Ph.D., Director of Indiana University’s Institute on Disability and Community. Dr. Mank served as our project officer at IU and also assisted the authors in locating sources of data necessary to complete the study, particularly with respect to supported employment issues. John Dickerson, Director of the ARC of Indiana provided many insights into the history and contemporary operation of the State’s service delivery system. Since our first Indiana special study in 1996, John has been a tremendous source of information on developmental disabilities services in the State, including for the present 2008 study. There have been many changes in Indiana in the past four years since we completed our 2004 study of the State. Chief among these changes is the closure of all of the State’s developmental centers and the further expansion of a DD service delivery system predicated on community services and family support. Only the residential units in the State’s mental hospital system remain in use. Indiana is now the most heavily populated American state operating a developmental disabilities service delivery system without reliance on a state operated developmental disabilities institution.
John Dickerson and the Arc of Indiana played a key long term leadership role in this systemic change, along with Suellen Jackson-Boner, Director of the Indiana Governor’s Council for People with Disabilities. Jim Hammond, President and CEO of the Indiana Association of Rehabilitation Facilities, and the late Costa Miller, former Executive Director of INARF, provided critical leadership through the Association toward this objective. This group of leaders, along with state DD agency leadership and staff, service providers, parents and advocates have also worked tirelessly and effectively to reform the service delivery system. In completing this 2008 study, we are indebted to conscientious and capable staff in the State of Indiana’s Family and Social Services Administration (FSSA) and its constituent agency, the Division of Disability and Rehabilitative Services (DDRS). FSSA and DDRS provided data enabling updating of our longitudinal data files through FY 2008. We thank Randy Krieble in the DDRS Initiatives Unit for providing us with up-to-date financial and programmatic data on the State of Indiana’s DD service delivery system. We also thank DDRS Director Peter Bisbecos and Deputy Director Adrienne Shields for their review of the data and support for the study. Kenneth Winslow’s review as DDRS Controller was also most appreciated along with the reviews of data provided by Penny Shaffer in FSSA Budget and John B. Parks, the Chief Financial Officer of FSSA.
The State of Indiana has dramatically improved its DD data reporting capacities since we began our series of four special studies of the Indiana DD service delivery system in 1996. The FSSA and DDRS are to be commended for this improvement because it makes statewide program evaluation more feasible and enlightening, which in turn can lead to better public policies and services for people with developmental disabilities and their families in the State. As is the custom with studies of this type, however, the authors bear full and final responsibility for the accuracy of the data presented in this report, and for the conclusions and recommendations drawn therefrom.

Intellectual and Developmental Disabilities Services in Indiana EXECUTIVE SUMMARY
vi
ESTABLISHING A TRADITION OF COMMITMENT: INTELLECTUAL AND DEVELOPMENTAL
DISABILITIES SERVICES IN INDIANA
Executive Summary
The purpose of this study was to a) describe the structure and funding of
intellectual and developmental disabilities (I/DD) residential and community services in
Indiana and the United States; b) analyze recent trends in service utilization and financing
of I/DD services through fiscal year 2008; c) compare and contrast performance in
Indiana to other states and to the U.S.; and d) present recommendations for the future
direction of intellectual and developmental disabilities services in Indiana. This study
focuses most specifically on I/DD activities during the 1999-2008 decade. It builds on
our three previous analyses of Indiana services completed in 1996, 2000 and 2004
(Braddock & Hemp, 1996, 2000, 2004).
In the present study, five Midwestern states are compared to Indiana. The
comparison states are Illinois, Michigan, Minnesota, Ohio, and Wisconsin. These states’
experiences were analyzed comparatively with respect to community services
development, utilization of institutional services, development of Home and Community
Based Services (HCBS) Waiver options, and the provision of family support, supported
employment, and supported living services. The study was designed to assist Indiana
University’s Institute on Disability and Community, The Indiana Governor’s Council for
People with Disabilities, The Arc of Indiana, the Indiana Association of Rehabilitation
Facilities, Inc., and public officials, families, advocates, consumers and service providers
to assess their state’s progress in implementing services and supports for people with
developmental disabilities during the past decade.
Growth of Community Services in the United States
The nation’s census of persons with intellectual and developmental disabilities
living in state-operated institutions has declined steadily from the peak of about 195,000
persons in 1967, to 38,299 today. Forty states have closed or scheduled the closure of one

Intellectual and Developmental Disabilities Services in Indiana EXECUTIVE SUMMARY
vii
or more of their institutions. Indiana, along with nine other states and D.C.--Alaska,
Hawaii, Maine, Minnesota, New Hampshire, New Mexico, Rhode Island, Vermont, and
West Virginia--now operate no state-operated I/DD institutions. Additionally, in 2006
there were only 127 I/DD institutional residents in Michigan and nine persons in a mental
health center I/DD unit at Cambridge Mental Health Center in Minnesota. In Indiana, 147
persons resided in I/DD mental health units at the Logansport, Evansville, Madison and
Richmond State Hospitals in 2008. Indiana is the most populated American state to have
closed all of its free-standing state operated institutions exclusively serving people with
I/DD.
States have closed institutions and reallocated substantial institutional funding to
more individualized residential alternatives in community and family settings. Between
1980 and 2006, the number of individuals living in six-person or fewer community-based
group homes and supervised living arrangements in the U.S. increased from 28,000 to
approximately 373,000 persons. Individuals now living in community residential settings
for six or fewer persons represent 70% of all persons with developmental disabilities
residing in out-of-home residential settings in the United States.
Community Services Development in Indiana
In July, 1998, Indiana’s “317 Task Force” of consumers, advocates, and state
officials produced a report entitled A Comprehensive Plan for the Design of Services for
People with Developmental Disabilities. The Plan addressed key issues including waiting
lists for services, and the provision of necessary resources to support people with
developmental disabilities in their homes and at work. The Plan’s recommendations
provided the framework for extensive program development activities by the Indiana
Family and Social Services Administration.
Indiana has indeed made substantial progress in I/DD services development
during the past decade. With the closure of New Castle, Northern Indiana, Muscatatuck,
and Fort Wayne State Developmental Centers, Indiana’s 2008 state-operated institutional
utilization rate of two persons served per 100,000 individuals in the general population is
substantially below the estimated 2008 U.S. rate of 10 persons per 100,000. Indiana,

Intellectual and Developmental Disabilities Services in Indiana EXECUTIVE SUMMARY
viii
however, has not fully reallocated the financial resources “saved” from the institutional
facilities it closed to alternative community services, family support, supported
employment and supported living. Although overall community services spending,
adjusted for inflation, grew 93% in Indiana during 1999-2005, community services
spending declined four percent during 2005-08 after the closures of Muscatatuck and Fort
Wayne Developmental Centers. Indiana’s HCBS Waiver spending declined four percent
on an inflation-adjusted basis during the same period and the State’s I/DD fiscal effort
fell 10%. Total spending for I/DD services in Indiana, adjusted for inflation, fell by six
percent in 2006, four percent in 2007; and by three percent in 2008. In nominal dollar
terms (i.e., dollars as appropriated and not adjusted for inflation), total spending for I/DD
services declined by 0.1% in 2006 and increased modestly by 0.4% and 2.9% in 2007 and
2008, respectively.
State government leadership, community providers and consumers in Indiana
collaborated successfully during the past decade to develop HCBS Waiver services as the
major federal financing component for community services. This was an important
achievement. The Waiver underwrote 85% of adjusted community spending growth from
1999 to 2008. Moreover, the Daniels Administration is to be commended for several
recent initiatives including: 1) mandating that all high school graduates with I/DD be
enrolled in the Support Services Waiver; 2) assuring eligibility for appropriate services
and supports for all family caregivers aged 80 and above and for persons with I/DD who
lose shelter, lose a caregiver to death or illness, or age out of a children’s program; 3)
providing Waiver services for all nursing facility residents who wish to access
community services; and 4) providing a commitment of $11 million in annual funding for
24-hour crisis intervention services for persons with I/DD and behavioral support needs.
Study Findings Summarized
Study findings are provided in two broad categories: those relating to the growth
of community services and supports, and those pertinent to the utilization of institutional
settings.

Intellectual and Developmental Disabilities Services in Indiana EXECUTIVE SUMMARY
ix
Community Services Development Grew Significantly
1. A new Individual Community Living Budget (ICLB) process, initially implemented for individuals moving from Central State in 1994, helped assure that money follows individuals with disabilities receiving services;
2. The total number of persons served in residential settings increased four percent from 1999 to 2008. The proportion of individuals residing in settings for six or fewer persons increased from 42% of the system in 1999 to 63% in 2008. The 2008 rate, however, was still below the average U.S. state (70%);
3. We previously projected in 2000 that, if then current trends continued, HCBS Waiver revenue in Indiana would surpass ICF/MR revenue by 2006. This benchmark was actually attained two years earlier, in 2004. In 2008, Indiana HCBS Waiver spending exceeded ICF/MR spending by 38%;
4. Waiver spending per capita in 2008 places Indiana near the projected U.S. average, and above projected per capita spending levels in the comparison states of Illinois, Michigan and Ohio. Indiana, however, ranks below Minnesota and Wisconsin in the region; and
5. Community services spending in Indiana, adjusted for inflation, grew 85% during 1999-2008. Institutional spending declined by 81%. Community services spending, adjusted for inflation, declined by four percent during 2005-08. However, a new State of Indiana quarterly financial report projects non-adjusted increases of 10% and 6%, respectively, for the HCBS Waiver and for private ICFs/MR during 2008-09 (Indiana Family and Social Services Administration, 2008a).
Utilization of Public and Private Institutions/ Nursing Facilities Declined Significantly
6. Indiana has continued to reduce its reliance on state-operated institutions. New Castle and Northern Indiana closed in 1998/1999, Muscatatuck closed in 2005, and Fort Wayne closed in 2007. The 2008 institutional utilization rate of two persons per 100,000 of the general population in Indiana was well below the projected U.S. rate of 10 per 100,000;
7. In total, four developmental centers and six 16+ person private ICFs/MR closed between 1998 and 2007. This resulted in the combined public and private institutional census dropping 47% in the past 10 years (1999-2008);
Study Recommendations
Recommendations are provided in two broad categories: those relating to the
growth of community services and supports, and those pertinent to the utilization of
institutional settings.

Intellectual and Developmental Disabilities Services in Indiana EXECUTIVE SUMMARY
x
Continue the Expansion of Community Services and Related Supports
1. Complete the reallocation of institutional services funding to community services. Only a portion of the spending “saved” in the closures of Muscatatuck and Fort Wayne Developmental Centers has been reallocated to community services. That is hopefully temporary while funds from the closure of I/DD state institutions are being readied for deployment for additional community services. To date, however, total I/DD spending, adjusted for inflation, declined 13% during 2005-08 (a cumulative $95.2 million reduction). Indiana should reallocate all institutional funding previously “saved” to community services, family support and supported employment initiatives;
2. Expand HCBS Waiver services. An estimated 13,935 persons with I/DD in Indiana await Waiver services. The need for such services and supports will grow rapidly in the future due to increases in the number of aging caregivers in the state;
3. Develop additional support programs for families. The State should consider developing additional support programs for families, including implementation of a cash subsidy program similar to those in Illinois, Michigan, and Minnesota. Indiana ranked 40th nationally in 2006 in the number of families supported per capita and ranked 30th in family support spending per capita;
4. Expand supported employment services. Indiana should seriously consider expanding supported employment services managed by the Bureau of Developmental Disabilities Services. Spending for this program declined in inflation-adjusted terms during 2006-08. Indiana ranked 28th in supported employment spending per capita; and,
5. Increase wages and benefits for direct support professionals. Wages and benefits for community-based direct support staff should be increased significantly over the next several years to reduce staff turnover and improve service quality.
Continue to Reduce Reliance on Public and Private Institutions/Nursing Facilities
6. Reduce the number of persons with I/DD in nursing facilities. Evaluate and relocate as appropriate to alternative community settings the 1,640 individuals with I/DD residing in nursing facilities in 2008. Indiana’s nursing facility utilization rate is 27 per 100,000 of the state general population (2006 data). This was the fourth highest rate nationwide, and was substantially above both the U.S. rate (11) and the average rate of the five comparison states (12). Since the completion of our last study in 2004, Indiana reduced the average daily I/DD nursing facility population by only 78 persons. This is a reduction of less than 20 individuals per year. A class action lawsuit, Kraus v. Hamilton, was filed in St Joseph County Circuit Court several years ago on behalf of residents with I/DD in nursing facilities. A settlement agreement was reached in 2004 to facilitate community placements. This litigation is currently entering mediation (L. Frick, Indiana Attorney General’s Office, personal communication, September 9, 2008); and,

Intellectual and Developmental Disabilities Services in Indiana EXECUTIVE SUMMARY
xi
7. Reduce I/DD mental health units and private ICFs/MR. Continue to downsize the remaining four I/DD units at the Logansport, Evansville, Madison and Richmond State Hospitals, and the three remaining 16+ person private ICFs/MR. Allocate these resources to strengthen and develop additional community services programs and infrastructure.
The report that follows evaluates progress achieved by Indiana during the past
decade and the challenges currently faced by the State.
ESTABLISHING A TRADITION OF COMMITMENT: INTELLECTUAL AND DEVELOPMENTAL
DISABILITIES SERVICES IN INDIANA
I. INTRODUCTION TO THE STUDY
The purpose of this study was 1) to analyze current trends in service utilization
and financing of intellectual and developmental disabilities (I/DD) services in Indiana
through 2008; 2) compare and contrast such trends in Indiana to the Midwestern states of
Illinois, Michigan, Minnesota, Ohio and Wisconsin and to the United States; and 3) to
present recommendations for the future direction of intellectual and developmental
disabilities services in Indiana. In addressing these objectives, we focused our analysis
primarily on progress in Indiana during the past 10 years, 1999-2008.
The five Great Lakes states selected for comparison with Indiana--Illinois,
Michigan, Minnesota, Ohio, and Wisconsin--share much with Indiana in terms of
demography, economics, and histories of I/DD services. Each state is made up of both
urban and rural communities, their economies are based on the combined contributions of
manufacturers, the service industry, and agriculture, and in each state there was an early
history of relying on state-operated institutions as the primary model for I/DD services.
These states’ experiences in intellectual and developmental disabilities long-term care
services and supports illustrate the policy choices that that have been made in the past
and that continue to confront Indiana in 2008. Useful lessons from the comparison states
include the conversion of institution-dominated I/DD service systems through the
creative and cost-effective utilization of Medicaid Waivers; the expansion of family
support, supported living, and supported employment programs; and the closure of state-
operated institutions and large privately-operated ICF/MR facilities.
Comprehensive revenue, spending, and programmatic data for Indiana, Illinois,
Michigan, Minnesota, Ohio, and Wisconsin were collected using standardized data
collection instruments conforming to the definitions and data collection protocols
established for the University of Colorado’s State of the States in Developmental
Disabilities Project (Braddock, Hemp, & Rizzolo, 2008). With excellent cooperation
from Indiana agency staff, we collected new Indiana data for fiscal years 2007 and 2008.

Intellectual and Developmental Disabilities Services in Indiana Page 2
We also revised and updated some of the data collected for our three previous Indiana
studies (Braddock & Hemp, 2004, 2000, 1996).
II. DECLINING UTILIZATION OF INSTITUTIONS
Service delivery systems in the United States for persons with intellectual and
developmental disabilities have undergone profound change in the past three decades.
Indiana and the comparison states had strong historical precedents for utilizing the large
state-operated institutions that at one time dominated State service systems. Indiana
opened its first mental health institution, Central State Hospital, in 1848 and 31 years
later, in 1879, the first “mental retardation” (hereafter I/DD) institution in Indiana opened
in Fort Wayne (Braddock & Hemp, 2000). Beginning in the 1970s, class action litigation
throughout the states targeted institutional reform and the need for community
alternatives to institutions (Herr, 1992). Media exposés identified abysmal institutional
conditions (Blatt & Kaplan, 1974). Indiana and other states began to address the need for
community alternatives to state institutions and to initiate reforms in institutions as well.
Litigation helped stimulate the reduction in reliance on institutions and the
development of community services. Three types of class-action lawsuits have been filed
in recent years (Braddock et al., 2008). Litigation has sought to a) expand services to
people with I/DD on waiting lists; b) meet the requirements of the community integration
mandate of the Americans with Disabilities Act (ADA) and the Olmstead U.S. Supreme
Court decision (1999); and c) provide Medicaid services for eligible individuals who
were not receiving those services. In January 2008, waiting list lawsuits were active in 13
states and eight states had Olmstead lawsuits including three in Pennsylvania. Nine states
had active Medicaid-access lawsuits, with two in Arkansas (Braddock et al., 2008).
1. Trends in State-Operated Institutions in Indiana and the Comparison States
The nation’s institutional population peaked at 194,650 in 1967 and then declined
steadily at the rate of four percent each year through 2006. The average daily institutional
population in fiscal year 2006 was 38,299 (Braddock et al., 2008). From 1977 to 1988,
the I/DD institutional population in Indiana declined by an average two percent per year,

Intellectual and Developmental Disabilities Services in Indiana Page 3
half the national rate of decline. However, during 1999-2008 the I/DD institutional
census decline rate in Indiana accelerated to 18% per year.
In terms of institutional utilization (per 100,000 of the general population) the
Indiana trend approximates the declining reliance on institutions in the comparison states
(Figure 1). Institutional utilization in Indiana was well below the U.S. average and the
five comparison states in the
aggregate during 1977-81, but
briefly surpassed both the U.S.
and the comparison states’
rates during 1989-92. Indiana’s
institutional utilization rate
again dropped below the rates
in the comparison states and
the U.S. during 2000-08.
Indiana, Minnesota, Michigan,
and Wisconsin were leaders in
deinstitutionalization, with
2006 institutional utilization
rates of 2.0, 0.2, 1.2, and 9.9
per 100,000, respectively. Institutional utilization rates were higher than the U.S. average
in Ohio (14.1) and substantially higher in Illinois (21.3). In 2008, Minnesota operated
only one I/DD unit in the Cambridge Mental Health Center for nine individuals.
Michigan provided services for 127 individuals with I/DD at one state-operated facility,
Mt. Pleasant.
The Fort Wayne Developmental Center opened as the Asylum for Feeble Minded
Children in 1879. New Castle State Developmental Center, originally the Indiana Village
for Epileptics, was established in 1907. The Muscatatuck State Developmental Center
was initially the Indiana Farm Colony for Feeble Minded Youth (1920) and Northern
Indiana State Developmental Center opened in 1943 as the Northern Indiana Children’s
Hospital for children who had polio. Legislation in 1960 established Northern Indiana as
7778798081828384858687888990919293949596979899000102030405060708Fiscal Year
0
20
40
60
80
Ins
titu
tio
nal
Re
sid
en
ts p
er
100
,00
0 P
op
ula
tio
n69
13
63
11
46
2
U.S.Comparison StatesIndiana
FIGURE 1INSTITUTIONAL UTILIZATION IN INDIANA,
THE U.S. AND THE FIVE COMPARISON STATES*
*Comparison states include Illinois, Michigan, Minnesota, Ohio and Wisconsin. Institutional utilization for thecomparison states consists of I/DD institutional census divided by total general population, per 100,000 of thegeneral population aggregated for the five states.
Source: Braddock et al., Coleman Institute and Department of Psychiatry, University of Colorado (2008).

Intellectual and Developmental Disabilities Services in Indiana Page 4
a facility for children with mental retardation and developmental disabilities. Two of the
four original Indiana developmental centers, New Castle and Northern Indiana, closed in
July 1998 and December 1998, respectively. Muscatatuck closed in 2005 and Fort Wayne
closed in 2007.
The Indiana legislature authorized a “hospital for the insane” in 1827; the Indiana
Hospital for the Insane opened 21 years later in 1848. The Hospital (subsequently re-
named Central State Hospital) was constructed on the outskirts of Indianapolis.
Additional public psychiatric facilities were then built after the turn of the century in
Evansville, Logansport, Madison, and Richmond to relieve the overcrowding at Central
State. Central State Hospital subsequently assumed responsibility for the mid-state
district of 38 Indiana counties surrounding Indianapolis (Braddock & Hemp, 2000;
Willever, 1996).
During the 1970’s, Indiana established special I/DD units within Central State and
at the Evansville, Logansport, and Madison state mental hospitals. All of these I/DD
Units were certified as Intermediate Care Facilities/Mental Retardation (ICFs/MR).
Central State Hospital and its I/DD Unit closed in June 1994. In fiscal year 2008 the four
remaining intellectual and developmental disabilities units were in the Madison,
Logansport, Evansville and Richmond state hospitals. The four units had an average daily
population of 147 (Table 1).
Location Opened Closed Census
Fort Wayne Developmental Ctr. Fort Wayne 1879 2007 closedMuscatatuck Developmental Ctr. Muscatatuck 1920 2005 closedNew Castle Developmental Ctr. New Castle 1907 1998 closedNorthern Indiana Developmental Ctr. South Bend 1943 1998 closedCentral State Hospital (I/DD Unit) Indianapolis 1848 1994 closedMadison State Hospital (I/DD Unit) Madison 1910 44Logansport State Hospital (I/DD Unit) Logansport 1888 46Evansville State Hospital (I/DD Unit) Evansville 1950 33Richmond State Hospital (I/DD Unit) Richmond 1973 24TOTAL AVERAGE DAILY CENSUS 147
Sources: Braddock et al., 2008; state hospital units' data are from Bureau of Developmental Disabilities Services, 2008.
CENTERS AND STATE HOSPITAL I/DD UNITS: FY 2008AVERAGE DAILY CENSUS OF INDIANA DEVELOPMENTAL
TABLE 1
Facility/Unit

Intellectual and Developmental Disabilities Services in Indiana Page 5
2. Closure of State Institutions
Since 1970, 40 states have closed or are scheduled to close 140 state-operated
I/DD institutions (Braddock et al., 2008). Indiana, with the closure of Fort Wayne
Developmental Center in 2007, joins Alaska, the District of Columbia, Hawaii, Maine,
Minnesota, New Hampshire, New Mexico, Rhode Island, Vermont, and West Virginia.
These jurisdictions now operate without state-operated I/DD institutions. Table 2
summarizes information for the nation’s 26 institutions that have closed since 2000, or
are scheduled to close. Among the comparison states Illinois closed Lincoln in 2004,
Fergus Falls in Minnesota closed in 2000, and Southgate Center in Michigan closed in
2001. In Ohio, Springview closed in 2004 and Apple Creek closed in 2005. Wisconsin’s
TABLE 2
State Institution
Year Built/ Became
MR Original Use
# Residents, Closure
AnnouncementYear of Closure Alternate Use
Alabama Brewer-Bayside 1984 MR Facility 67 2003 Corrections
Alabama Tarwater 1976 MR Facility 74 2003 Corrections
Alabama Wallace 1970 MR Facility 80 2003 Corrections
California Agnews 1885/1966 MI Facility 411 2008 Undetermined
California Napa 1875/1967 Asylum for MR/MI 30 2001 MI use only
Florida Community of Landmark 1965 MR Facility 256 2005 Revert to Dade Cty.
Florida Gulf Coast Center 1960 MR Facility 306 2010 Undetermined
Georgia Bainbridge 1967 WW II Air Force Schoo 129 2001 Corrections
Georgia Georgia Regional-Augusta 438 2003 Undetermined
Georgia Gracewood School/Hospital 93 2003 Undetermined
Illinois Lincoln 1877 MR Facility 153 2004 Vacant
Indiana Ft. Wayne 1887 MR Facility 120 2007 To be demolished
Indiana Muscatatuck 1920 MR Facility 287 2005 Military
Louisiana Leesville 1913/1964 High School 20 2004 Undetermined
Louisiana Columbia 1967 MR Facility 14 2004 Undetermined
Massachusetts Paul A. Dever 1940/1946 P.O.W. Camp 294 2001 Higher Ed Ctr.
Michigan Southgate 1977 MR Facility 55 2002 Undetermined
Minnesota Fergus Falls 1888/1969 Asylum for MI 38 2000 Regional MH Center
Montana Eastmont 1969/1979 Residential School 29 2003 Nursing facility
New York Sunmount 1922/1965 TB Hospital 503 2003 OMRDD Specialty Units
North Carolina Black Mountain Center 1883/1977 MI Facility 77 2005 Skilled nursing facility
Ohio Apple Creek 1931 MR Facility 178 2005 Undetermined
Ohio Springview 1910/1975 TB Hospital 86 2004 Undetermined
Oregon Fairview 1907 MR Facility 327 2000 Commercial/housing
Pennsylvania Altoona 1975 MR Facility 90 2008 Undetermined
Wisconsin Northern Wisconsin Center 1897 MR Facility 173 2005 Short-term Dual Dx
Source : Braddock et al., 2008.
U.S. PUBLIC INSTITUTIONS SINCE 2000COMPLETED AND IN-PROGRESS CLOSURES OF
Intellectual and Developmental Disabilities Services in Indiana Page 6
Northern Wisconsin Center closed in 2005.
The pathbreaking Indiana 317 Plan recommended redirecting funding away from
large, congregate care settings. This was principally addressed through the State’s
closures of the Muscatatuck and Fort Wayne Developmental Centers (Bisbecos, 2007).
Previously, during fiscal years 1998 and 1999, 164 persons relocated to the community
from New Castle Developmental Center and 159 persons moved out of Northern Indiana
State Developmental Center as the two facilities closed. Only one of the 323 individuals
who moved from the two developmental centers required re-institutionalization in a state-
operated facility (R. Krieble, Developmental Disabilities, Division of Disability, Aging,
and Rehabilitative Services, personal communication, July 20, 2000). Seiders & Conroy
(2000) conducted an assessment of outcomes after six months for the Developmental
Center and private ICF/MR “movers” in Indiana. They found generally positive outcomes
for both the private ICF/MR and Developmental Center groups in adaptive behavior,
community integration, perceived improvement in quality of life, and reduced
challenging behavior.
Researchers at Indiana University surveyed the overall satisfaction of individuals
who moved from Muscatatuck State Developmental Center in 2001 and 2002 (Grossi,
Mank, Migliori, Pitts, & Schaaf, 2003). Although respondents (individuals with
disabilities, family members, guardians) were pleased with Muscatatuck services, they
were more satisfied with life in the community after the move from the State
Developmental Center. Respondents generally reported that they were well informed
during the planning process and the moves, and across the two years there was an
increase in respondents’ general knowledge of the services offered by the Bureau of
Quality Improvement Services (BQIS). The BQIS was a key component of improved
quality assurance and quality improvement programs in Indiana (Cook, 2003).
In April 2008 the Indiana Family and Social Services Administration announced
the dismissal of a consent agreement signed with the U.S. Department of Justice (DOJ)
eight years earlier (U.S. v. Indiana, S.D.) (U.S. DOJ, 2006). The DOJ suit had alleged
that conditions at Muscatatuck and Fort Wayne State Developmental Centers violated the
provisions of the Civil Rights of Institutionalized Persons Act (CRIPA). According to the

Intellectual and Developmental Disabilities Services in Indiana Page 7
National Association of State Directors of Developmental Disabilities Services
(NASDDDS):
Since the investigation began, Muscatatuck and Fort Wayne Centers have both been closed. Former residents are now working, volunteering, and being involved in a variety of community-based activities. In addition, DDRS implemented a number of wide-reaching changes to the system that have ensured quality assurance mechanisms to further protect individuals from abuse, neglect, and mistreatment, and provided improved community placements and services (NASDDDS, 2008, p. 8).
3. Utilization of Private Institutions in Indiana
“Institutional settings” in Indiana also include private facilities serving 16 or more
persons per facility certified as ICFs/MR. In addition to the state facility closures in
Indiana, three private institutional ICFs/MR in Sullivan, Angola, and Fort Wayne closed
during fiscal year 1999 (Seiders & Conroy, 2000). During 2001-03 seven of the State’s
10 remaining privately operated (16+) ICFs/MR closed. Three facilities (KCARC, 45
beds; New Horizon, 154 beds; and Miller Merry Manor Care, 38 beds) closed April 2001,
December 2001, and June 2002, respectively. In addition, three facilities (Normal Life
Sheridan, 50 beds; Riverbend, 93 beds; and Oak Meadows, 73 beds) closed during
November and December 2003. The Holy Cross facility (38 beds) closed in 2004 (S.
Cook, personal communication, January 10, 2004).
The average daily census of 16+ person private ICFs/MR in Indiana declined
63%, from 835 in fiscal year 1999 to 313 in fiscal year 2008. The remaining three
facilities are Arcadia (60 beds), North Willow (208 beds) and Hickory Creek of Gaston
(75 beds). In the United States, the number of residents in private ICF/MR facilities for
16 or more persons declined by an estimated 23% between 1999 and 2008, from 26,460
to an estimated 20,488 persons. The rate of reduction in the utilization of 16+ person
privately operated facilities in Indiana was nearly three times the U.S. rate during the
past 10 years.
4. Utilization of Nursing Facilities in Indiana
Congress enacted the Nursing Home Reform Act of 1987 (Public Law 100-203)
in response to the fact that most individuals with I/DD living in nursing facilities in the

Intellectual and Developmental Disabilities Services in Indiana Page 8
U.S. had been placed there inappropriately. Several studies have shown that 75-90% of
individuals with I/DD living in nursing facilities were appropriate candidates for
alternative living arrangements in community settings (Mitchell & Braddock, 1990).
The nursing facility reform legislation required that all states: a) assure that
individuals with I/DD be admitted to a nursing facility only if the individual was in need
of services made available in the particular facility; b) assess all nursing home residents
with intellectual disabilities to determine any need for “active treatment”; c) for those
assessed to be in need of active treatment, provide treatment in the nursing facility or
obtain a more appropriate community placement; and, d) assure that individuals residing
in nursing facilities for more than 30 months be given the option of moving or staying.
As a result of states’ efforts in response to Public Law 100-203, the number of
individuals with I/DD in nursing facilities in the United States declined from 54,202 in
1988 to 33,885 in 2006 (Braddock et al., 2008).
Since the completion of our last Indiana study in 2004, Indiana reduced the
average daily I/DD nursing facility population by only 78 persons. This is a reduction of
less than 20 individuals per year. A class action lawsuit, Kraus v. Hamilton, was filed in
St Joseph County Circuit Court several years ago on behalf of residents with I/DD in
nursing facilities. A settlement agreement between the litigating parties was reached in
2004 to facilitate community placements. This litigation is currently entering mediation
(L. Frick, Indiana Attorney General’s Office, personal communication, September 9,
2008).
Indiana’s Nursing Facility Trends. Indiana recently amended its Medicaid State
Plan to provide that persons with I/DD residing in nursing facilities who wish to move to
community settings may do so under the HCBS Waiver (Indiana Family and Social
Services Administration, 2008). Non-specialized nursing facilities in Indiana served
1,640 individuals with I/DD in 2008. Expressed in terms of nursing facility utilization per
100,000 of the state’s general population, Indiana’s rate of 26 in 2008 (27 in 2006) was
the nation’s fourth highest. Indiana was well above the U.S. rate (11) and the
consolidated nursing facility utilization rate for the five comparison states (12) (Figure
2). In 2006, nursing facility utilization rates were seven per 100,000 persons in the

Intellectual and Developmental Disabilities Services in Indiana Page 9
general population in Minnesota,
eight in Michigan, nine in
Wisconsin, 12 in Illinois, and 20
in Ohio. The nursing facility
utilization rate in Indiana would
match the rate in Minnesota
(seven per 100,000) if 1,201 or
73% of the 1,640 Indiana
nursing facility residents were
relocated to community
alternatives. The rate in Indiana
would match the U.S. rate (11
per 100,000) if 951 persons or 58% were relocated from such settings.
5. Summary: Institutions and Nursing Facilities in Indiana
Indiana has substantially reduced its reliance on public and private institutions,
but not nursing facilities. This is reflected in the recent closures of all remaining state
developmental centers and
all but three private
ICFs/MRs for 16+ persons.
Figure 3 depicts the
combined utilization rate
for nursing facilities,
private 16+ person
facilities, and develop-
mental centers including
I/DD units in state
hospitals. The utilization
rates displayed are for
Indiana, the five
88 89 90 91 92 93 94 95 96 97 98 99 00 01 02 03 04 05 06 07 08Fiscal Year
0
30
60
90
120
Pu
blic
/Pri
vate
16+
Res
iden
ts p
er 1
00,0
00 P
op
ula
tio
n
103
43
92
33
78
34
Comparison States*IndianaU.S.
FIGURE 3PUBLIC AND PRIVATE 16+ INSTITUTIONAL UTILIZATIONIN INDIANA, THE U.S. AND THE COMPARISON STATES
*Comparison states aggregated are Indiana, Michigan, Minnesota, Ohio and Wisconsin.
Source: Braddock et al., Coleman Institute and Department of Psychiatry, University of Colorado (2008).
88 89 90 91 92 93 94 95 96 97 98 99 00 01 02 03 04 05 06 07 08Fiscal Year
0
10
20
30
40
50
Inst
itu
tio
nal
Res
iden
ts p
er
100,
000
Po
pu
lati
on
40
26
34
12
21
11
IndianaComparison States*U.S.
FIGURE 2NURSING FACILITY UTILIZATION IN INDIANA,
THE U.S. AND THE FIVE COMPARISON STATES*
*Comparison states include Illinois, Michigan, Minnesota, Ohio and Wisconsin. Nursing facility utilization for thecomparison states consists of I/DD nursing facility census divided by total general population, per 100,000 of thegeneral population aggregated for the five states.
Source: Braddock et al., Coleman Institute and Department of Psychiatry, University of Colorado (2008).
Intellectual and Developmental Disabilities Services in Indiana Page 10
comparison states aggregated, and the U.S. During 1991-2000, the public/ private
institutional utilization rate in Indiana exceeded the rate for both the U.S. and for the
comparison states. However, during 1998-2008, Indiana’s public and private institutional
utilization rate declined rapidly, falling well below the comparison states. Public/private
16+ person facility utilization rates in 2006 for the comparison states were: Michigan (17
per 100,000), Minnesota (19), Wisconsin (43), Ohio (59), and Illinois (63). Indiana’s rate
was 33 per 100,000 persons in 2008. The average daily population of all public and
private institutions (including nursing facilities) in Indiana declined from 4,177 in 1998
to 2,100 in 2008. This was a decline of 50% over that 11-year period, and compared to a
decline of 26% in the U.S. during 1996-2006 (from 137,076 to 101,416).
III. GROWTH OF COMMUNITY SERVICES
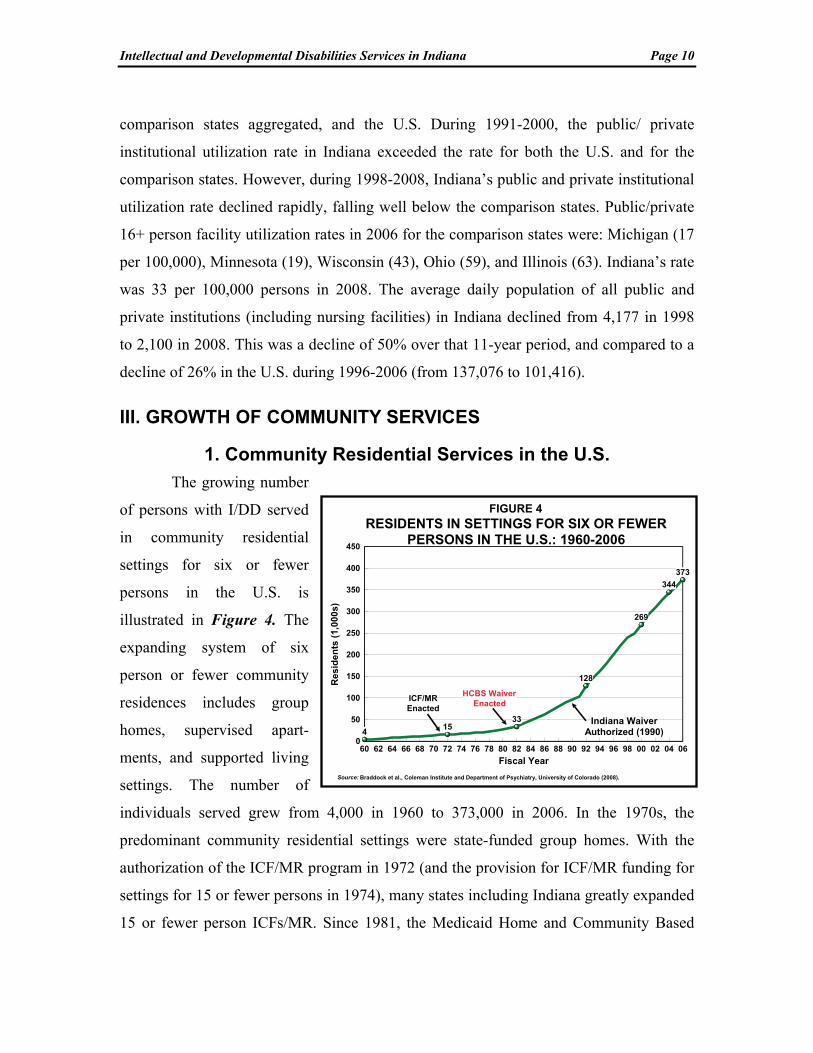
1. Community Residential Services in the U.S.
The growing number
of persons with I/DD served
in community residential
settings for six or fewer
persons in the U.S. is
illustrated in Figure 4. The
expanding system of six
person or fewer community
residences includes group
homes, supervised apart-
ments, and supported living
settings. The number of
individuals served grew from 4,000 in 1960 to 373,000 in 2006. In the 1970s, the
predominant community residential settings were state-funded group homes. With the
authorization of the ICF/MR program in 1972 (and the provision for ICF/MR funding for
settings for 15 or fewer persons in 1974), many states including Indiana greatly expanded
15 or fewer person ICFs/MR. Since 1981, the Medicaid Home and Community Based
60 62 64 66 68 70 72 74 76 78 80 82 84 86 88 90 92 94 96 98 00 02 04 06
Fiscal Year
0
50
100
150
200
250
300
350
400
450
Re
sid
en
ts (
1,00
0s)
415
33
128
269
344
373
HCBS WaiverEnacted
ICF/MREnacted
Indiana WaiverAuthorized (1990)
FIGURE 4RESIDENTS IN SETTINGS FOR SIX OR FEWER
PERSONS IN THE U.S.: 1960-2006
Source: Braddock et al., Coleman Institute and Department of Psychiatry, University of Colorado (2008).

Intellectual and Developmental Disabilities Services in Indiana Page 11
Services (HCBS) Waiver Program has emerged as the principal funding source for the
development of smaller, more individualized community settings including supported
living.
2. Community Residential Services in Indiana
The first community residential services in Indiana included a family boarding
home program established in 1955, followed by group homes developed by local
Associations for Retarded Citizens in the 1960s (Indiana Legislative Services Agency,
1991). In 1978, the Indiana Legislature’s Select Committee on Residential Care for the
Mentally Retarded and Developmentally Disabled reviewed developmental disabilities
services needs, funding, and program development issues. Lobbying efforts by the
Indiana Association for Retarded Citizens, Indiana Association of Rehabilitation
Facilities, and other advocacy organizations, coupled with the impact of the Select
Committee’s report, led to the passage of Public Law 126 in 1978 (Indiana Legislative
Services Agency, 1990). This legislation authorized the first Community Residential
Facilities/Developmental Disabilities (CRFs/DD) in Indiana, which were subsequently
certified as ICFs/MR for eight persons per facility.
By 1979, ICF/MR reimbursement was established for Indiana’s CRFs/DD. In
1981, P.L. 137 augmented Medicaid reimbursement, and rapid CRF/DD expansion
commenced four years later in 1985. By 1987, CRFs/DD federal Medicaid
reimbursement surpassed federal Title XX revenues to become the primary federal
community services funding source in Indiana (Braddock & Hemp, 2000).
2.1 The Indiana 317 Plan In 1997, Governor Frank O’Bannon signed Senate Enrolled Act 317. The law
established a bipartisan task force of consumers, advocates, and state officials that was
charged with conducting a study of services for people with developmental disabilities. In
its July 1998 report, A Comprehensive Plan for the Design of Services for People with
Developmental Disabilities, the 317 Task Force identified over 6,000 people with
developmental disabilities awaiting home and community based services. The Plan’s
series of recommendations included a) accessing financial support outside of the Bureau

Intellectual and Developmental Disabilities Services in Indiana Page 12
of Developmental Disabilities Services (BDDS) for children aging out of residential
services; b) emergency funding for caregivers not able to provide care; c) services for
over 1,300 persons who had been on waiting lists for an extended period of time; d)
resources to prevent family crisis situations; and e) maintenance of existing services to
keep people at home and at work (Braddock & Hemp, 2004).
As a result of the work of the 317 Task Force, the Indiana 2000/2001 biennial
budget bill included new funding of $39.3 million for services for people with
developmental disabilities. The late Costa N. Miller, CAE, formerly Executive Director
of the Association of Rehabilitation Facilities of Indiana, for purposes of governmental
affairs activities relating to the 317 Task Force’s resources and legislation, had stressed
the importance of including Senate Republican leadership in supporting the
recommendations of the 317 Task Force (J. Hammond, INARF, personal communication,
September 5, 2008). The FY 2001 budget targeted services for an additional 1,300
persons by the end of fiscal year 2001 (The Arc of Indiana, 2000). The 317 Plan resulted
in $157 million in new funding from state fiscal year 2000 through 2003, addressing
maintenance of services and the needs of those on waiting lists (Cook, 2003, p.5).
Three of the five Indiana 317 Plan recommendations addressed supported living
and/or person centered planning. The precedent for the Indiana Individual Community
Living Budget (ICLB) was individualized planning for persons moving from Central
State Hospital in 1994, and for the first time money followed the individual rather than
the service provider agency. Rule 460 IAC 7, promulgated in May 2003, mandated the
use of the person centered planning process for all individuals receiving services
authorized by the Bureau of Developmental Disabilities Services (BDDS), including
supported living, group home services, and private 16+ person ICFs/MR.
2.2 Quality Assurance and Quality Improvement Indiana 317 Plan recommendations one, two and four addressed person centered
planning and funding, and redirecting funding from congregate settings to integrated
community residential, day and employment settings. Quality assurance and quality
improvement was the subject of the Plan’s third recommendation: “Assure and improve
the quality of services delivered to individuals with developmental disabilities.” The

Intellectual and Developmental Disabilities Services in Indiana Page 13
Bureau of Quality Improvement Services (BQIS) was established in January 2000, with
the responsibility to develop and implement quality assurance and quality improvement
systems through DDARS. Funding was made available with Indiana 317 Plan funds as
well as funds from the closure of New Castle State Developmental Center and the
downsizing of Muscatatuck.
Quality assurance and quality improvement in Indiana included a complaint
process, an incident reporting policy and procedure, a risk management committee, and a
mortality review committee. Indiana joined the National Core Indicators Project in 1997
(a joint effort of the National Association of State Directors of Developmental
Disabilities Services and the Human Services Research Institute), scoring at or above the
national average in most areas (Cook, 2003, pp. 3, 4). As of February 2008, Indiana’s
quality assurance responsibility was contracted to a private company, Liberty Health
Care. Early reports from state officials are that this has been a successful transition and
that key mortality and other data are being tracked effectively (R. Krieble, DDRS,
personal communication, June 19, 2008).
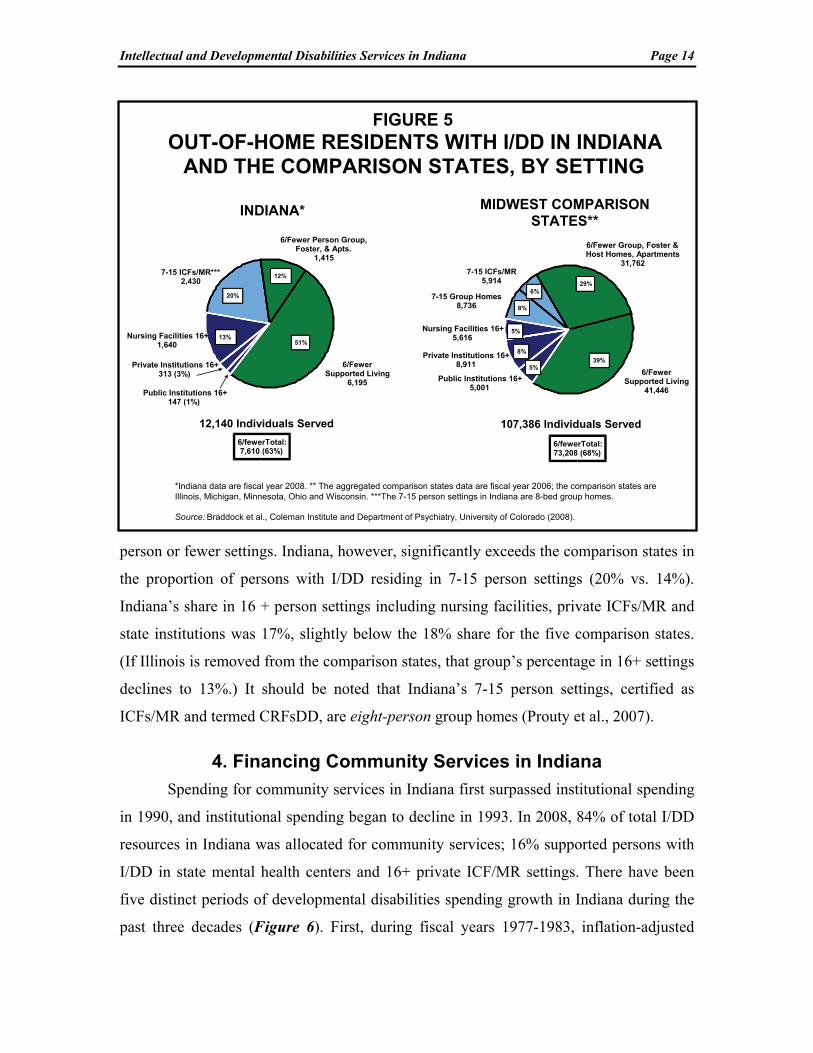
3. Out-of-Home Residents with I/DD in Indiana
Indiana is roughly comparable to the aggregated comparison states in the
proportion of persons with I/DD residing in six person or fewer settings. In 2008, 51% of
individuals with I/DD in Indiana participated in supported living and 12% resided in
other six person or fewer settings including foster homes, apartments, or group homes. In
total, 63% of individuals with I/DD in Indiana resided in settings for six or fewer persons.
This compared to 68% in the five comparison states (Figure 5) and 70% in the United
States. In 2006, the proportion of placements in settings for six or fewer persons was
higher in four of the five comparison states than in Indiana in 2008. Minnesota provided
services in settings for six or fewer persons to 90% of the State’s total of persons with
I/DD residing in out-of-home settings. The proportions in the other comparison states
were: Michigan (82%), Wisconsin (74%), Ohio (69%), and Illinois, the “outlier,” (30%).
If Illinois, the regional outlier, were removed from the comparison states, the
proportion in six person or fewer settings for the Midwest comparison states would be
77%, consisting of 45% of persons with I/DD in supported living and 32% in other six
Intellectual and Developmental Disabilities Services in Indiana Page 14
person or fewer settings. Indiana, however, significantly exceeds the comparison states in
the proportion of persons with I/DD residing in 7-15 person settings (20% vs. 14%).
Indiana’s share in 16 + person settings including nursing facilities, private ICFs/MR and
state institutions was 17%, slightly below the 18% share for the five comparison states.
(If Illinois is removed from the comparison states, that group’s percentage in 16+ settings
declines to 13%.) It should be noted that Indiana’s 7-15 person settings, certified as
ICFs/MR and termed CRFsDD, are eight-person group homes (Prouty et al., 2007).
4. Financing Community Services in Indiana
Spending for community services in Indiana first surpassed institutional spending
in 1990, and institutional spending began to decline in 1993. In 2008, 84% of total I/DD
resources in Indiana was allocated for community services; 16% supported persons with
I/DD in state mental health centers and 16+ private ICF/MR settings. There have been
five distinct periods of developmental disabilities spending growth in Indiana during the
past three decades (Figure 6). First, during fiscal years 1977-1983, inflation-adjusted
6/Fewer Group, Foster &Host Homes, Apartments
31,762
7-15 Group Homes8,736
Nursing Facilities 16+5,616
Private Institutions 16+8,911
Public Institutions 16+5,001
7-15 ICFs/MR5,914
107,386 Individuals Served
MIDWEST COMPARISON STATES**
29%
39%
6%
5%
8%
FIGURE 5OUT-OF-HOME RESIDENTS WITH I/DD IN INDIANA
AND THE COMPARISON STATES, BY SETTING
6/FewerSupported Living
41,446
8%
6/fewerTotal:73,208 (68%)
*Indiana data are fiscal year 2008. ** The aggregated comparison states data are fiscal year 2006; the comparison states are Illinois, Michigan, Minnesota, Ohio and Wisconsin. ***The 7-15 person settings in Indiana are 8-bed group homes.
Source: Braddock et al., Coleman Institute and Department of Psychiatry, University of Colorado (2008).
Nursing Facilities 16+1,640
Private Institutions 16+313 (3%)
7-15 ICFs/MR***2,430
12,140 Individuals Served
INDIANA*
12%
13%
20%
6/fewerTotal:7,610 (63%)
6/FewerSupported Living
6,195
6/Fewer Person Group, Foster, & Apts.
1,415
51%
Public Institutions 16+147 (1%)
5%

Intellectual and Developmental Disabilities Services in Indiana Page 15
public and private institutional spending declined and community services spending was
flat (no growth). Total I/DD spending declined by 6% during 1977-1983. In the second
period, 1983-1992, there was sustained growth in both the institutional and community
sectors, and total spending nearly tripled. In the third period, 1992-1997, total adjusted
spending advanced by only one percent, public and private institutional spending
declined by 24%, and community spending advanced by 25%. However, community
spending declined by 6% in the last year of that period, from 1996 to 1997.
In the fourth distinct period in the financing of I/DD services, 1997-2005,
combined institutional and community spending in real terms advanced 68% to a total
adjusted spending level of $1.048 billion in 2005. During 1997-2005, community
spending grew 129% and institutional spending plummeted by 39% as the New Castle
and Northern Indiana State Developmental Centers and large private ICFs/MR were
closed. In the final distinct period of I/DD spending in Indiana, 2005-08, total I/DD
spending in Indiana actually declined 13% in real terms. The institutional component of
total I/DD spending declined 68% in real terms during 2005-08 as Muscatatuck and Fort
Wayne Developmental Centers closed. Community services spending also dropped four
77 78 79 80 81 82 83 84 85 86 87 88 89 90 91 92 93 94 95 96 97 98 99 00 01 02 03 04 05 06 07 08Fiscal Year
$0.0
$0.2
$0.4
$0.6
$0.8
$1.0
Bill
ion
s o
f 20
08 D
olla
rs
Community Services Family Support, Supported Employment & Supported LivingInstitutional Settings (16+)
FIGURE 6INFLATION-ADJUSTED TRENDS IN I/DD
SPENDING IN INDIANA: 1977-2008
Source: Braddock et al., Coleman Institute and Department of Psychiatry, University of Colorado (2008).
Intellectual and Developmental Disabilities Services in Indiana Page 16
percent in real economic terms during 2005-08. Significant expansion of the revenue base
for community services in 2009 and beyond is needed to continue to address waiting lists
for such services. There is reason to believe that the State of Indiana is likely to
significantly increase its resource allocation for community services now that the state-
operated institutions have been closed. The next few years will be critically important for
community services development as Indiana moves closer to an “institution-free” I/DD
service delivery system.
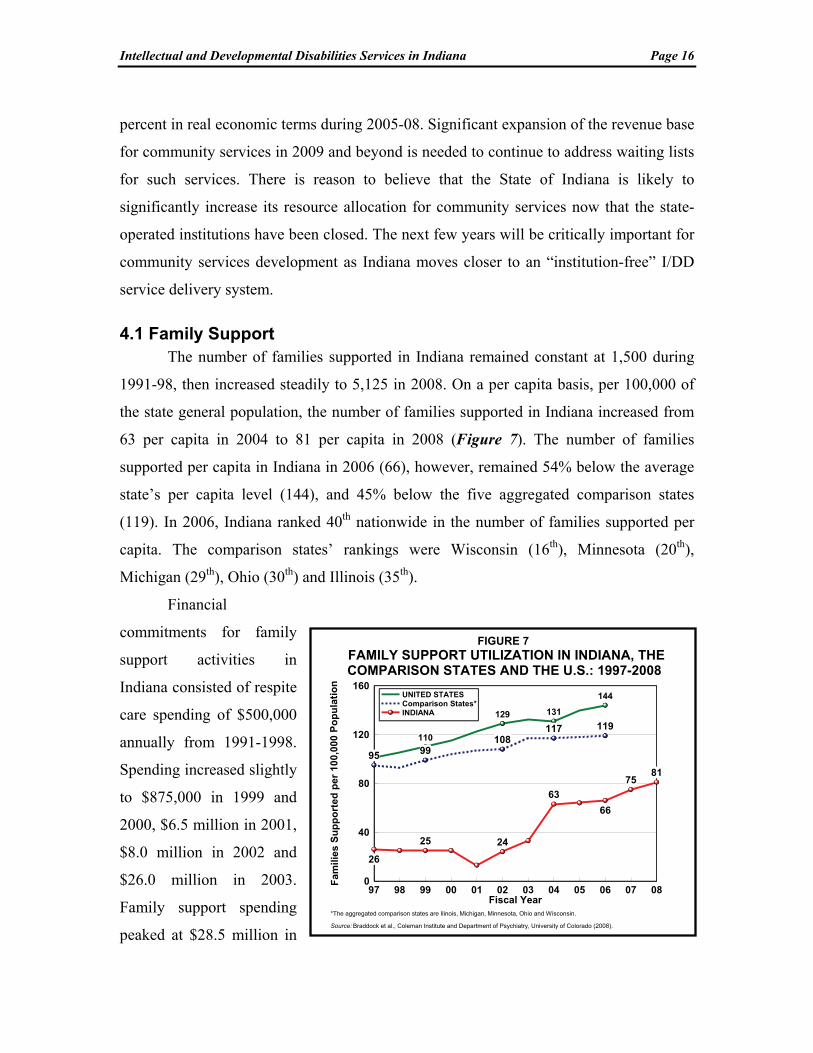
4.1 Family Support The number of families supported in Indiana remained constant at 1,500 during
1991-98, then increased steadily to 5,125 in 2008. On a per capita basis, per 100,000 of
the state general population, the number of families supported in Indiana increased from
63 per capita in 2004 to 81 per capita in 2008 (Figure 7). The number of families
supported per capita in Indiana in 2006 (66), however, remained 54% below the average
state’s per capita level (144), and 45% below the five aggregated comparison states
(119). In 2006, Indiana ranked 40th nationwide in the number of families supported per
capita. The comparison states’ rankings were Wisconsin (16th), Minnesota (20th),
Michigan (29th), Ohio (30th) and Illinois (35th).
Financial
commitments for family
support activities in
Indiana consisted of respite
care spending of $500,000
annually from 1991-1998.
Spending increased slightly
to $875,000 in 1999 and
2000, $6.5 million in 2001,
$8.0 million in 2002 and
$26.0 million in 2003.
Family support spending
peaked at $28.5 million in
97 98 99 00 01 02 03 04 05 06 07 08Fiscal Year
0
40
80
120
160
Fam
ilies
Su
pp
ort
ed p
er 1
00,0
00 P
op
ula
tio
n
26
25 24
63
66
7581
95 99108
117 119110
129 131
144UNITED STATESComparison States*INDIANA
FIGURE 7FAMILY SUPPORT UTILIZATION IN INDIANA, THE COMPARISON STATES AND THE U.S.: 1997-2008
*The aggregated comparison states are Ilinois, Michigan, Minnesota, Ohio and Wisconsin.
Source: Braddock et al., Coleman Institute and Department of Psychiatry, University of Colorado (2008).

Intellectual and Developmental Disabilities Services in Indiana Page 17
2006, then fell to $24.2 million in
2008. In 2006, Indiana ranked 30th in
family support spending per capita
of the general population. Michigan
ranked 26th, Illinois (29th),
Wisconsin (31st) and Ohio (44th).
Minnesota ranked second
nationwide in family support
spending per capita.
Legislation in Indiana (PL
126 in 1979) had previously created
a “family cash subsidy program”
designed to fund support services
allowing persons to remain with
their natural families. However, only
limited funding accompanied this
legislative initiative (Indiana
Legislative Services Agency, 1991,
p. 40). Indiana does not now operate
a cash subsidy program for families.
In 2006, 24 states financed cash subsidy programs, including the comparison states
Illinois, Michigan, and Minnesota (Table 3).
4.2 Supported Employment Supported employment data from 1999-2008 were reported by BDDS officials,
based on surveys from the Indiana Institute on Disability and Community. The Institute
researchers produced reports on day and employment services outcomes during 2002-07
(Grossi and Mank, 2006, 2007). In 2007, 11,217 individuals with disabilities were
receiving day and employment services from 55 of the 65 programs in Indiana. Of 10,688
persons responding about where they spend their day including recreation, day, and
employment services, 30% were in individual jobs, earning an average $6.68 per hour
STATE SPENDING FAMILIES
SUBSIDY PER
FAMILY
Alaska $4,548,000 1,516 $3,000Arizona $1,046,224 573 $1,826Arkansas $143,052 92 $1,555Connecticut $3,280,095 3,525 $931Delaware $233,854 126 $1,856Florida $473,600 210 $2,255Illinois $36,071,886 2,611 $13,815Iowa $1,602,523 378 $4,239Kansas $3,415,962 1,418 $2,409Louisiana $4,634,670 1,705 $2,718Maine $600,000 545 $1,101Michigan $17,614,656 6,722 $2,620Minnesota $13,392,880 2,346 $5,709Nevada $1,877,750 454 $4,136New Jersey $12,005,157 7,851 $1,529New Mexico $568,752 164 $3,468North Dakota $607,599 142 $4,272Oklahoma $4,972,075 2,077 $2,394Rhode Island $170,116 50 $3,402South Carolina $3,233,432 1,151 $2,809Tennessee $3,897,900 2,018 $1,932Texas $5,000,000 2,674 $1,870Utah $15,907 5 $3,181Washington $5,073,735 2,513 $2,019UNITED STATES $124,479,825 40,866 $3,046
Source: Braddock et al. (2008).
TABLE 3STATES WITH FAMILY SUPPORT
CASH SUBSIDY PROGRAMS IN 2006

Intellectual and Developmental Disabilities Services in Indiana Page 18
(wage data for May 2004). The BDDS utilized the Institute’s data, adjusting the annual
totals during 2002-08 by 71%-77%, to estimate the proportion that persons with I/DD
(“MR/DD,” autism and cerebral palsy) constituted of all persons with disabilities in the
State’s day/work programs.
However, Supported Employment Follow-Along (SEFA) funding managed by the
Bureau of Developmental Disabilities Services declined 10% in inflation-adjusted terms
during 2006-08, from $14.5 million (adjusted) to $13.0 million. During 2006-08, the
number of supported and competitive workers increased from 2,320 to 2,371. On a per
capita basis, the number of Indiana workers in 2008 was well below the five Midwestern
comparison states in the aggregate in 2006 but comparable to the U.S. per capita (Figure
8).
The number of supported employment workers nationally plateaued at 118,000
during 2002-06 (Braddock et al., 2008), and this is manifest in the declining per capita
levels displayed in Figure 8. A declining per capita is evident for the five aggregated
comparison states as well, from 56 in 2002 to 51 in 2006. In 2006 Indiana ranked 25th in
supported employment workers per capita of the general population. The comparison
state per capita ranks were: Ohio (7th), Minnesota (16th), Wisconsin (19th), Michigan
(22nd) and Illinois (32nd).
In 2006, Indiana
ranked 28th in supported
employment spending
per capita of the general
population ($2.09). The
U.S. average was $2.39
and the comparison state
spending per capita
levels were: Illinois
($1.55), Michigan
($2.45), Minnesota
($2.53), Ohio ($2.86),
97 98 99 00 01 02 03 04 05 06 07 08Fiscal Year
0
20
40
60
80
Wo
rke
rs S
up
po
rte
d p
er
100
,000
Po
pu
lati
on
56
6056
51 51
3438
41 40 39
28
3035
36 37
37
Comparison States*UNITED STATESINDIANA
FIGURE 8SUPPORTED EMPLOYMENT UTILIZATION IN INDIANA, THE COMPARISON STATES AND THE U.S.: 1997-2008
*The aggregated comparison states are Ilinois, Michigan, Minnesota, Ohio and Wisconsin.
Source: Braddock et al., Coleman Institute and Department of Psychiatry, University of Colorado (2008).
Intellectual and Developmental Disabilities Services in Indiana Page 19
and Wisconsin ($2.95). These supported employment spending per capita levels for the
five comparison states ranked 35th, 24th, 22nd, 20th, and 19th, respectively. Indiana’s
spending per capita ranking exceeded only Illinois among the comparison states.
Nationwide, supported employment workers constituted 21% of all day/work
program participants in 2006. Total day/work consisted of supported and competitive
workers, sheltered workshop and work activity center participants, and day training and
day habilitation program participants. In 2008, supported workers in Indiana constituted
22% of the total, just above the U.S. average in 2006 (21%), greater than all but Michigan
and Ohio of the comparison states, and ranking 24th nationally. The supported
employment share and rankings for the comparison states were: Illinois (13%, ranked
42nd), Minnesota (15%, ranked 36th), Wisconsin (16%, ranked 32nd), Ohio (22%, ranked
23rd) and Michigan (24%, ranked 21st). The Balanced Budget Act of 1997 afforded the
states an opportunity to greatly expand HCBS Waiver funding for supported
employment. In Indiana Waiver funding constituted 56% of supported employment
spending in 2008.
4.3 Supported Living There are three essential components of supported living: a) supported individuals
choose where and with whom they live; b) the housing is owned by the individual, the
family, or a housing cooperative or landlord; and c) individualized support planning
recognizes and meets individuals’ changing needs over time. In 2006, 49 state I/DD
agencies funded initiatives in supported living and/or personal assistance that were
consistent with the stated criteria. Supported living spending in 2006 totaled $4.90 billion
nationally for 188,616 participants (Braddock et al., 2008).
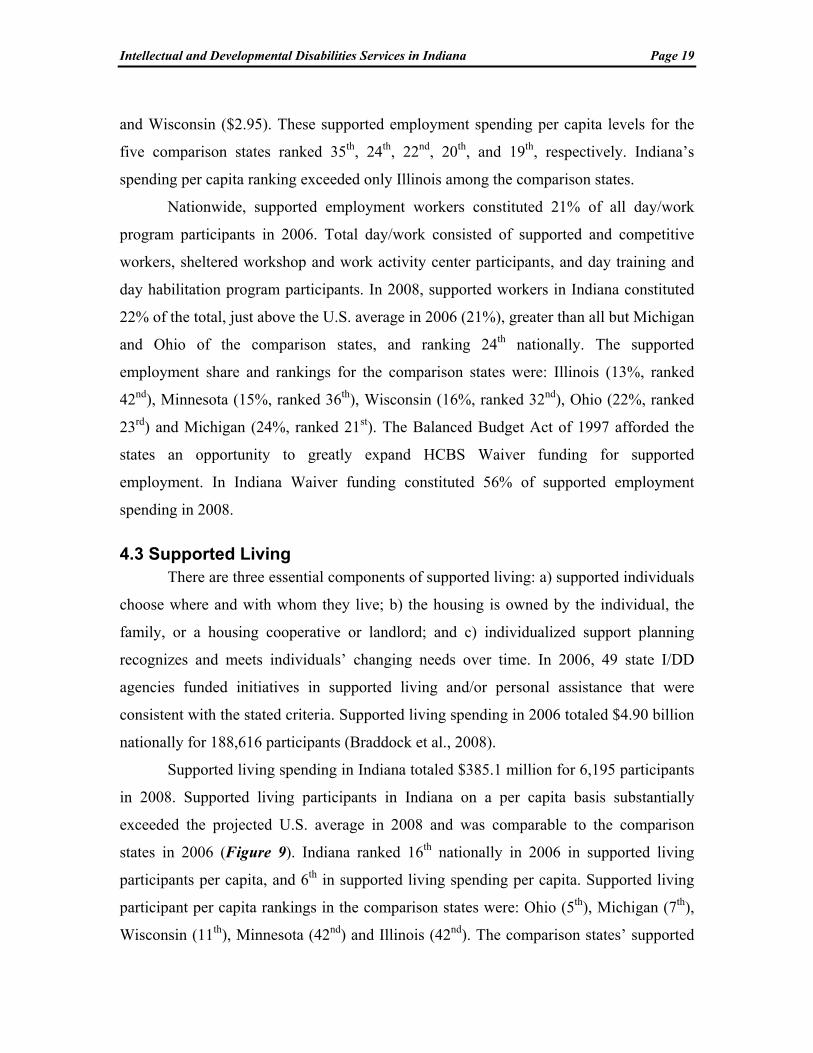
Supported living spending in Indiana totaled $385.1 million for 6,195 participants
in 2008. Supported living participants in Indiana on a per capita basis substantially
exceeded the projected U.S. average in 2008 and was comparable to the comparison
states in 2006 (Figure 9). Indiana ranked 16th nationally in 2006 in supported living
participants per capita, and 6th in supported living spending per capita. Supported living
participant per capita rankings in the comparison states were: Ohio (5th), Michigan (7th),
Wisconsin (11th), Minnesota (42nd) and Illinois (42nd). The comparison states’ supported

Intellectual and Developmental Disabilities Services in Indiana Page 20
living spending per
capita ranks in 2006
were Ohio (5th),
Michigan (17th),
Minnesota (22nd),
Wisconsin (24th), and
Illinois (42nd).
The HCBS
Waiver has become the
principal financial
source for individual
and family support
spending in the U.S.
and in Indiana (Rizzolo, Hemp, & Braddock, 2006). In the nation as a whole, federal-
state Waiver spending in 2006 constituted 54% of supported employment spending, 70%
of family support spending, and 86% of spending for supported living and personal
assistance. In 2008, HCBS Waiver funding in Indiana constituted 98% of family support
spending, 97% of supported living spending, and 56% of the State’s spending for
supported employment services. Indiana’s Support Services Waiver is dedicated entirely
to financing family support services, contributing $23.8 million in federal-state Medicaid
funding in 2008.
5. Fiscal Effort in Indiana
“Fiscal effort” is a ratio utilized to compare states according to the proportion of
their total statewide personal income devoted to I/DD services. Fiscal effort is expressed
in terms of I/DD spending per $1,000 of statewide aggregate personal income (Braddock
& Fujiura, 1991).
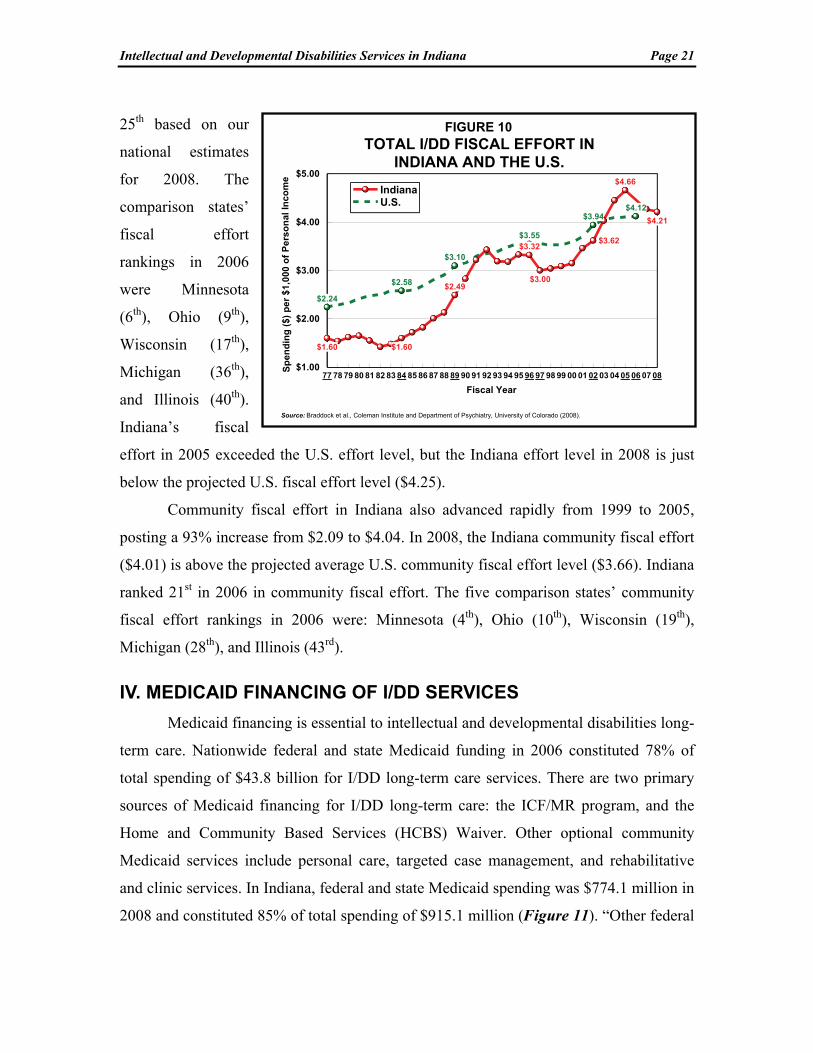
Fiscal effort in Indiana grew by 55% between 1997 and 2005 (from $3.00 to
$4.66 per $1,000 of aggregate statewide personal income). During 2005 to 2008,
however, Indiana’s fiscal effort fell--by 10% from $4.66 to $4.21 per $1,000 (Figure 10).
This degree of decline is unusual. In 2006, Indiana ranked 23rd in I/DD fiscal effort and
97 98 99 00 01 02 03 04 05 06 07 08Fiscal Year
0
30
60
90
120
Pa
rtic
ipan
ts p
er 1
00,0
00 P
op
ula
tio
n
11 12
49
8389
9397
29
92
36 49
5865
INDIANAComparison States*UNITED STATES
FIGURE 9SUPPORTED LIVING UTILIZATION IN INDIANA, THE COMPARISON STATES AND THE U.S.: 1997-2008
*The aggregated comparison states are Ilinois, Michigan, Minnesota, Ohio and Wisconsin.
Source: Braddock et al., Coleman Institute and Department of Psychiatry, University of Colorado (2008).
Intellectual and Developmental Disabilities Services in Indiana Page 21
25th based on our
national estimates
for 2008. The
comparison states’
fiscal effort
rankings in 2006
were Minnesota
(6th), Ohio (9th),
Wisconsin (17th),
Michigan (36th),
and Illinois (40th).
Indiana’s fiscal
effort in 2005 exceeded the U.S. effort level, but the Indiana effort level in 2008 is just
below the projected U.S. fiscal effort level ($4.25).
Community fiscal effort in Indiana also advanced rapidly from 1999 to 2005,
posting a 93% increase from $2.09 to $4.04. In 2008, the Indiana community fiscal effort
($4.01) is above the projected average U.S. community fiscal effort level ($3.66). Indiana
ranked 21st in 2006 in community fiscal effort. The five comparison states’ community
fiscal effort rankings in 2006 were: Minnesota (4th), Ohio (10th), Wisconsin (19th),
Michigan (28th), and Illinois (43rd).
IV. MEDICAID FINANCING OF I/DD SERVICES
Medicaid financing is essential to intellectual and developmental disabilities long-
term care. Nationwide federal and state Medicaid funding in 2006 constituted 78% of
total spending of $43.8 billion for I/DD long-term care services. There are two primary
sources of Medicaid financing for I/DD long-term care: the ICF/MR program, and the
Home and Community Based Services (HCBS) Waiver. Other optional community
Medicaid services include personal care, targeted case management, and rehabilitative
and clinic services. In Indiana, federal and state Medicaid spending was $774.1 million in
2008 and constituted 85% of total spending of $915.1 million (Figure 11). “Other federal
77 78 79 80 81 82 83 84 85 86 87 88 89 90 91 92 93 94 95 96 97 98 99 00 01 02 03 04 05 06 07 08
Fiscal Year
$1.00
$2.00
$3.00
$4.00
$5.00
Sp
end
ing
($
) p
er
$1
,000
of
Pe
rso
nal
In
co
me
$1.60 $1.60
$2.49
$3.32
$3.00
$3.62
$4.66
$4.21
$2.24
$2.58
$3.10
$3.55
$3.94$4.12
IndianaU.S.
Source: Braddock et al., Coleman Institute and Department of Psychiatry, University of Colorado (2008).
FIGURE 10TOTAL I/DD FISCAL EFFORT IN
INDIANA AND THE U.S.

Intellectual and Developmental Disabilities Services in Indiana Page 22
funds” in the figure consisted primarily of Waiver participants’ Social Security benefits
($80.8 million), and the Social Services Block Grant ($13.1 million).
Spending for private CRFs/DD serving 15 or fewer persons, certified as
ICFs/MR, constituted 36% of total federal-state Medicaid of $774.1 million in Indiana.
The HCBS Waiver constituted 56%, state mental hospital I/DD units certified as
ICFs/MR constituted three percent, Medicaid spending for targeted case management
constituted three percent, and the balance (2%) consisted of Medicaid spending for three
private ICFs/MR serving 16 or more persons.
1. The Home and Community Based Services (HCBS) Waiver
In 1981, the Federal government was concerned about rising Intermediate Care
Facility/Mentally Retarded (ICF/MR) costs. State officials and advocates were also
concerned that the ICF/MR program’s “institutional bias” promoted the
institutionalization of people with I/DD. The HCBS Waiver program was enacted in
Section 2176 of the Omnibus Budget Reconciliation Act of 1981 (Public Law 97-35),
authorizing federal reimbursement for a wide array of community services and supports.
5%
10% 85%
State-op ICF/MR
3%
36%
56%
3%
Federal SSI/ADC,SSBG
$93.9 Million
Other State Funds$47.2 Million
CRFs/DD (grouphome ICFs/MR)
HCBS Waiver
Private ICF/MR 16+ (2%)
Source: Braddock et al., Coleman Institute and Department of Psychiatry, University of Colorado (2008).
Total I/DD Spending: $915.1 Million
Federal/StateMedicaid Funds $774.1 Million
Figure 11Public Spending for I/DD Services
by Revenue Source in Indiana, 2008
Targeted Case Management

Intellectual and Developmental Disabilities Services in Indiana Page 23
Services that are reimbursed under the Waiver include supported employment,
habilitation training, respite care and other family supports, case management, supported
living, assistive technology, personal assistance, physical, occupational, and speech
therapies, and behavior management. The HCBS Waiver finances individuals in
community residential settings, including apartments, small homes, and the family’s
home. Nationwide, there were 489,384 Waiver participants in 2006, nearly five times the
102,300 residents in public and private ICFs/MR of all sizes (Braddock et al., 2008). All
fifty states and the District of Columbia are now participating in the HCBS Waiver.
Indiana’s Waiver was implemented in 1990; however, Indiana was one of the last 12
states to finance HCBS Waiver services.
An important collateral benefit of the HCBS Waiver to state governments, it
should be noted, is the $637 per month in federal income maintenance benefits which
Waiver participants receive in the form of Supplemental Security Income (SSI) payments
or other social security benefits consisting mostly of Adults Disabled in Childhood
(ADC) benefits under Title II of the Social Security Act. These federal SSI/ADC funds
pay room and board and other costs. The residents of public and private ICFs/MR of all
sizes receive $30-$60 per month in personal allowance from SSI/ADC. Waiver
participants’ SSI/ADC funds totaled $3.5 billion nationwide in 2006 ($637 per month), in
addition to the $19.6 billion in federal/state Medicaid Waiver funding. In Indiana, $80.8
million in federal SSI/ADC funding was generated for the State’s 10,570 Waiver
participants in 2008.
The rapid growth of federal HCBS Waiver spending nationally is illustrated in
Figure 12. After the peak of $8.3 billion (adjusted) in 1993, federal ICF/MR spending in
the U.S. declined 17% to $6.9 billion in 2006. Inflation-adjusted federal Medicaid
spending for the HCBS Waiver grew 17% per year from 1993 (the peak in ICF/MR
spending) to 2006. In 2006, federal Waiver spending in the U.S. was 59% more than
federal ICF/MR spending.
2. HCBS Waiver Services in Indiana
As noted, Indiana established its Waiver program in 1990, and in 2008 financed
services for 10,570 Waiver participants. In 1991, community provider organizations and
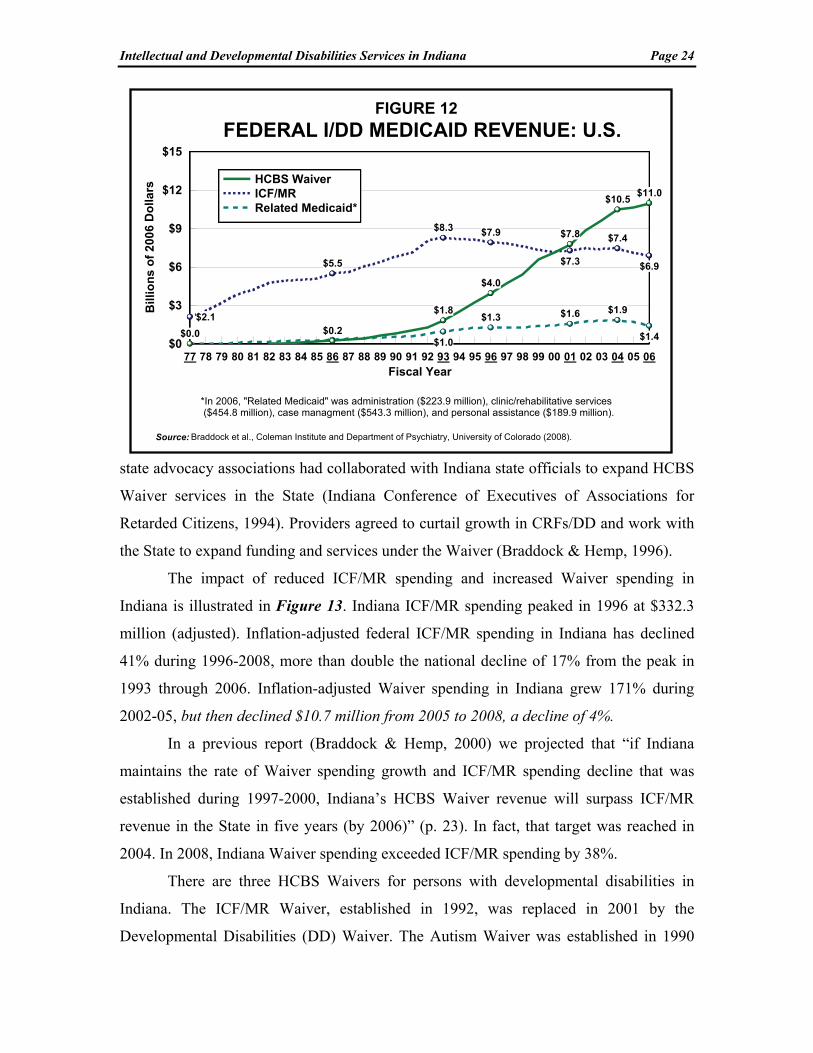
Intellectual and Developmental Disabilities Services in Indiana Page 24
state advocacy associations had collaborated with Indiana state officials to expand HCBS
Waiver services in the State (Indiana Conference of Executives of Associations for
Retarded Citizens, 1994). Providers agreed to curtail growth in CRFs/DD and work with
the State to expand funding and services under the Waiver (Braddock & Hemp, 1996).
The impact of reduced ICF/MR spending and increased Waiver spending in
Indiana is illustrated in Figure 13. Indiana ICF/MR spending peaked in 1996 at $332.3
million (adjusted). Inflation-adjusted federal ICF/MR spending in Indiana has declined
41% during 1996-2008, more than double the national decline of 17% from the peak in
1993 through 2006. Inflation-adjusted Waiver spending in Indiana grew 171% during
2002-05, but then declined $10.7 million from 2005 to 2008, a decline of 4%.
In a previous report (Braddock & Hemp, 2000) we projected that “if Indiana
maintains the rate of Waiver spending growth and ICF/MR spending decline that was
established during 1997-2000, Indiana’s HCBS Waiver revenue will surpass ICF/MR
revenue in the State in five years (by 2006)” (p. 23). In fact, that target was reached in
2004. In 2008, Indiana Waiver spending exceeded ICF/MR spending by 38%.
There are three HCBS Waivers for persons with developmental disabilities in
Indiana. The ICF/MR Waiver, established in 1992, was replaced in 2001 by the
Developmental Disabilities (DD) Waiver. The Autism Waiver was established in 1990
77 78 79 80 81 82 83 84 85 86 87 88 89 90 91 92 93 94 95 96 97 98 99 00 01 02 03 04 05 06Fiscal Year
$0
$3
$6
$9
$12
$15B
illio
ns
of
200
6 D
olla
rs
$0.2
$1.8
$4.0
$7.8
$10.5$11.0
$2.1
$5.5
$8.3 $7.9
$7.3
$7.4
$6.9
$0.0$1.0
$1.3 $1.6 $1.9
$1.4
HCBS WaiverICF/MRRelated Medicaid*
*In 2006, "Related Medicaid" was administration ($223.9 million), clinic/rehabilitative services ($454.8 million), case managment ($543.3 million), and personal assistance ($189.9 million).
FIGURE 12
FEDERAL I/DD MEDICAID REVENUE: U.S.
Source: Braddock et al., Coleman Institute and Department of Psychiatry, University of Colorado (2008).

Intellectual and Developmental Disabilities Services in Indiana Page 25
and the Support Services Waiver was established in 2002. All three Waivers have an
over-all spending cap (i.e., spending levels can vary for individual participants as long as
the Waiver cost per participant overall meets cost neutrality requirements). In addition,
the Support Services Waiver has an individual participant cap of $13,500 per year, which
may include up to $2,000 per year in respite care.
The Support Services Waiver’s array of services consisted of adult day services,
respite care, behavior management, case management, crisis intervention, day services,
family and caregiver training, OT, PT and music, psychological, speech and language and
recreational therapies, personal emergency response systems (PERS), specialized medical
equipment, and vehicle modification. The DD and Autism Waivers’ services consisted of
all of those services included in the Support Services Waiver and, in addition, adult foster
care, community transition services, environmental modifications, rent and food for
unrelated live-in caregiver, and residential habilitation and support. Effective 11/1/05,
“day services” (in all three Waivers) combined the previously separate services
community habilitation and participation, prevocational services, supported employment
follow along, and transportation. “Residential habilitation and support” in the DD and
Autism Waivers combined the previously separate services residential habilitation and
support, community habilitation and participation, and health care coordination (Indiana
77 78 79 80 81 82 83 84 85 86 87 88 89 90 91 92 93 94 95 96 97 98 99 00 01 02 03 04 05 06 07 08Fiscal Year
$0
$100
$200
$300
$400M
illio
ns
of
2008
Do
llars
$19.2
$104.4
$282.9 $272.2
$1.4
$78.8
$332.3
$297.8
$237.6
$196.7
$0.8 $9.5 $16.2
HCBS WaiverICF/MRTargeted Case Management
FIGURE 13FEDERAL I/DD MEDICAID REVENUE IN INDIANA
Source: Braddock et al., Coleman Institute and Department of Psychiatry, University of Colorado (2008).
Intellectual and Developmental Disabilities Services in Indiana Page 26
Family and Social Services Administration, 2008b).
Initiatives in smart home technology for individuals with I/DD in Indiana are
being provided by Madison, Wisconsin-based Night Owl Support Systems, LLC, and by
Lafayette, Indiana-based Rest Assured, LLC. Night Owl Support Systems uses telephone
line connections to sensors in consumers’ homes, with professional back-up at a central
call response center. Rest Assured, affiliated with ResCare, Inc., is a collaborative effort
of Wabash Center Arc and Engineering Projects in Community Service (EPIC) at Purdue
University College of Engineering. In 2008, Rest Assured served 118 consumers at 52
sites (personal communication, J. Darling, President, Rest Assured, LLC, March 4,
2008). It utilizes Telecare wireless technology with a secure broadband Internet
connection and a central video monitoring center. In Indiana, Night Owl Support Systems
and Rest Assured are state funded. However, the State is working with the Centers for
Medicare and Medicaid Services (CMS) to amend the Indiana Waiver’s Personal
Emergency Response System (PERS) service to include coverage for the “electronic
monitoring” provided by smart home services like Night Owl and Rest Assured.
V. COMMUNITY SERVICES IN THE COMPARISON STATES
This section addresses in more detail the community services development
activities of the five comparison states. The discussion begins with these states’ HCBS
Waiver utilization compared to ICF/MR utilization. A discussion of 1977-2006 trends in
spending for institutional services and community services follows.
1. Medicaid Financing in the Comparison States
In 2006, three of the five comparison states utilized the HCBS Waiver more
extensively than Indiana. Minnesota, Wisconsin, Michigan, Ohio, and Illinois ranked 3rd,
16th, 25th, 32nd, and 47th, respectively, in federal-state Waiver spending per capita of the
general population. Indiana ranked 31st. Per capita Waiver spending in Indiana in 2008
was slightly above the U.S. average for 2006 (Figure 14). Waiver utilization in
Minnesota provides an example for Indiana. Minnesota relied heavily on federal ICF/MR
financing of private ICFs/MR for 15 or fewer persons until 1994, when HCBS Waiver

Intellectual and Developmental Disabilities Services in Indiana Page 27
growth accelerated in
the state. By 2006,
Waiver spending in
Minnesota constituted
71% of Medicaid
spending for I/DD
long-term care
services in the state,
and as noted
Minnesota ranked 3rd
(behind New York
and Rhode Island) in federal-state HCBS Waiver spending per capita.
Figure 15 presents ICF/MR and Waiver spending trends for each of the five
comparison states. Minnesota began spending more for HCBS Waiver services than for
combined public and private ICF/MR services in 1996 and Michigan and Wisconsin did
so in 1998, and in 2006 Ohio began spending more for the HCBS Waiver than for
ICF/MR services. Illinois continues to receive substantially more ICF/MR reimbursement
than HCBS Waiver reimbursement. Each comparison state and Indiana has begun to
reduce ICF/MR spending. The reduction of ICF/MR spending commenced in 1993 in
Minnesota and Wisconsin, 1994 in Illinois, 1995 in Ohio, and 1997 in Michigan. As
previously discussed, Indiana began to substantially reduce its commitment to financing
public and private ICFs/MR beginning in 1997 (Figure 13, p. 25).
2. Analysis of Services and Spending in Indiana and the Five Comparison States
Illinois, Michigan, Minnesota, Ohio and Wisconsin were compared to Indiana
along several dimensions of their developmental disabilities spending profiles, including:
a) the year in which “parity” between community spending and public/private
institutional care spending was achieved; b) the extent to which funds have been
reallocated to community services; and, c) the types of residential programs and indi-
MN WI MI INDIANA U.S. OH IL$0
$50
$100
$150
$200
Fed
eral
-Sta
te W
aive
r D
olla
rs p
er C
apit
a(C
itiz
en o
f G
ener
al P
op
ula
tio
n) $169
$82$71 $68 $66 $60
$32
FIGURE 14FEDERAL-STATE WAIVER SPENDING PER CAPITA
Source: Braddock et al., Coleman Institute and Department of Psychiatry, University of Colorado (2008).
*Data for Indiana are 2008; all other states have data for 2006.
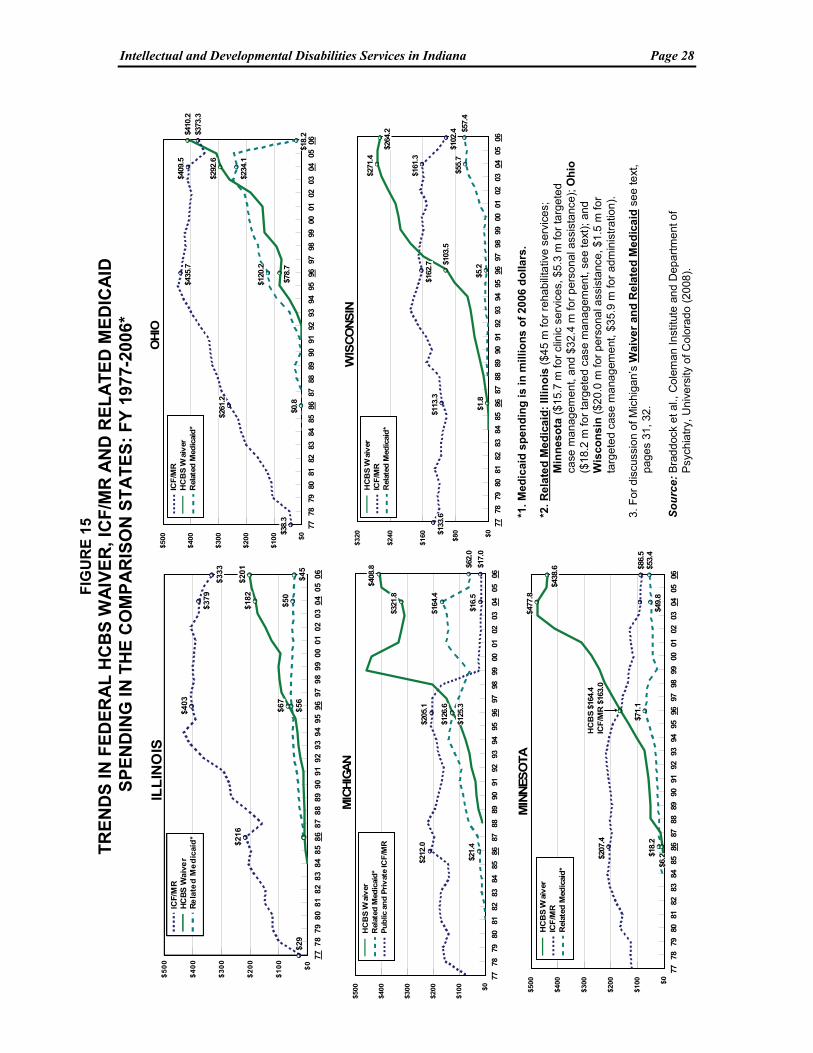
Intellectual and Developmental Disabilities Services in Indiana Page 28
FIG
UR
E 1
5T
RE
ND
S I
N F
ED
ER
AL
HC
BS
WA
IVE
R, I
CF
/MR
AN
D R
EL
AT
ED
ME
DIC
AID
SP
EN
DIN
G IN
TH
E C
OM
PA
RIS
ON
ST
AT
ES
: F
Y 1
977-
2006
*
*1.
Med
icai
d s
pe
nd
ing
is
in m
illi
on
s o
f 2
006
do
llars
.
*2. R
ela
ted
Me
dic
aid
: Il
lin
ois
($45
m fo
r re
habi
litat
ive
serv
ices
; M
inn
eso
ta (
$15.
7 m
for
clin
ic s
ervi
ces,
$5.
3 m
for
targ
eted
ca
se m
an
agem
en
t, a
nd $
32
.4 m
fo
r p
ers
ona
l ass
ista
nce
); O
hio
($18
.2 m
for
targ
eted
cas
e m
anag
emen
t, s
ee
text
); a
nd
Wis
co
ns
in (
$20.
0 m
for
pers
onal
ass
ista
nce
, $1.
5 m
for
targ
eted
cas
e m
ana
gem
ent
, $3
5.9
m fo
r ad
min
istr
atio
n).
3.
Fo
r d
iscu
ssio
n o
f M
ich
iga
n’s
Wa
ive
r an
d R
ela
ted
Me
dic
aid
see
text
, p
ag
es 3
1, 3
2.
So
urc
e: B
rad
doc
k et
al.,
Co
lem
an In
stitu
te a
nd D
epar
tme
nt o
f P
sych
iatr
y, U
nive
rsity
of C
olo
rado
(20
08).
7778
7980
8182
8384
8586
8788
8990
9192
9394
9596
9798
9900
0102
0304
0506
$0
$100
$200
$300
$400
$500 $3
8.3
$261
.2
$435
.7$4
09.5
$373
.3
$78.
7
$292
.6
$410
.2
$0.8
$120
.2
$234
.1
$18.
2
ICF
/MR
HC
BS
Wai
ver
Rel
ated
Med
icai
d*
OH
IO
7778
7980
8182
8384
8586
8788
8990
9192
9394
9596
9798
9900
0102
0304
0506
$0
$80
$160
$240
$320
$1.8
$103
.5
$271
.4
$264
.2
$133
.6$1
13.3
$162
.7
$161
.3
$102
.4
$5.2
$55.
7$5
7.4
HC
BS
Wai
ver
ICF
/MR
Rel
ated
Med
icai
d*
WIS
CO
NS
IN
7778
7980
8182
8384
8586
8788
8990
9192
9394
9596
9798
9900
0102
0304
0506
$0
$100
$200
$300
$400
$500
$6.2
$477
.8
$438
.6
$207
.4
$86.
5
$18.
2
$71.
1
$49.
8$5
3.4
HC
BS
Wai
ver
ICF
/MR
Rel
ated
Med
icai
d*
HC
BS
$16
4.4
ICF
/MR
$16
3.0
MIN
NES
OTA
7778
7980
8182
8384
8586
8788
8990
9192
9394
9596
9798
9900
0102
0304
0506
$0
$100
$200
$300
$400
$500
$125
.3
$321
.8
$408
.8
$21.
4
$126
.6$1
64.4
$62.
0
$212
.0$2
05.1
$16.
5$1
7.0
HC
BS
Wai
ver
Rel
ated
Med
icai
d*
Pu
blic
an
d P
riv
ate
ICF
/MR
MIC
HIG
AN
7778
7980
81
82
83
8485
86
87
88
8990
91
9293
94
9596
9798
99
0001
0203
04
0506
$0
$1
00
$2
00
$3
00
$4
00
$5
00
$29
$21
6
$403
$37
9
$33
3
$67
$18
2$20
1
$56
$50
$45
ICF/M
RH
CB
S W
aiv
er
Re
late
d M
ed
icai
d*
ILL
INO
IS

Intellectual and Developmental Disabilities Services in Indiana Page 29
vidual and family support utilized in community services development (Braddock et al.,
2008).
2.1 Indiana As discussed earlier (p. 14) I/DD spending for institutional and community
services in Indiana underwent substantial changes during 1977-2008. During 1977
through 2005 there were continuous annual reductions in inflation-adjusted institutional
spending. This was in contrast to annual inflation-adjusted increases in community
spending for every year during 1977-2005 except during 1981-82 and in 1997. During
2005-08, total I/DD spending in Indiana dropped 13% in real terms and institutional
spending declined 68% as the Muscatatuck and Fort Wayne Developmental Centers were
closed. Most notable, however, during 2005-08, was the four percent inflation-adjusted
decline in community spending (Figure 16).
Prior to 1993, Indiana’s competing growth in community and institutional
spending was similar to neighboring Illinois. The Lincoln State School and Colony in
Illinois and the Asylum for Feeble Minded Children in Fort Wayne in Indiana were two
of the nation’s first I/DD institutions, established in 1877 and 1879, respectively. Both
states relied heavily on state-operated developmental centers well into the 1990s and
Illinois continues to do so today. Both states developed large numbers of private
77 78 79 80 81 82 83 84 85 86 87 88 89 90 91 92 93 94 95 96 97 98 99 00 01 02 03 04 05 06 07 08
Fiscal Year
$0.0
$0.2
$0.4
$0.6
$0.8
$1.0
Bill
ion
s o
f 20
08 D
olla
rs
Community Services Individual and Family Support (IFS)Institutional Settings (16+)
Figure 16INDIANA TRENDS IN I/DD SPENDING, 1977-2008
Source: Braddock et al., Coleman Institute and Department of Psychiatry, University of Colorado (2008).

Intellectual and Developmental Disabilities Services in Indiana Page 30
ICFs/MR serving 16 or more persons, and ICFs/MR for 15 or fewer persons. In Indiana,
these were termed CRFs/DD and consist of eight-bed facilities. Indiana and Illinois were
relatively late in establishing the HCBS Waiver as a significant funding source for
community services. In 2008, however, the Indiana HCBS Waiver was twice the size of
the Illinois Waiver on a per capita basis.
Waiver expansion, the development of six person or fewer community residences
and supported living, and the substantial increases in community spending have been the
hallmarks of Indiana’s development of services and supports during 1999-2008. When
Indiana closed Fort Wayne in 2007, it joined nine other states and DC that no longer have
state-operated institutions for individuals with I/DD. In 2008, Indiana committed 88% of
total I/DD resources to community services. This figure compares to 97% in Minnesota,
94% in Michigan, 82% in Ohio, 71% in Wisconsin and only 64% in Illinois.
2.2 Illinois Illinois, like Indiana, was relatively late in establishing the HCBS Waiver as a
primary funding source for community services. But unlike Indiana’s strong HCBS
Waiver spending growth during 1999-2008 and a per capita ranking of 31st in 2006,
Illinois ranked 47th in Waiver spending per capita. Illinois’ family support programs
continue to serve as somewhat of a model for Indiana. Illinois in 1991 was one of the first
states to pass legislation initiating family support cash subsidies. In 2006, Illinois’ cash
subsidy program of $36.1 million served 2,611 families and total family support spending
in the state was $62.5 million for over 11,000 families. Illinois expended more for cash
subsidies than any other state and was fifth behind Connecticut, Michigan, New Jersey
and Texas in the number of families receiving cash subsidies.
During 1977-2008 there were four major periods in financing I/DD services in
Illinois. During 1977-84, institutional spending was essentially flat, community spending
advanced 59% and total I/DD spending advanced 13% (Figure 17). During 1984-95,
total spending increased 81%, consisting of strong growth both in institutional spending
(46%) and in community spending (160%). During the third period, 1995-2002, there
was a steady decline in institutional spending of 10%, except for a slight increase in
2002. Community spending advanced 65% and there was 23% inflation-adjusted growth
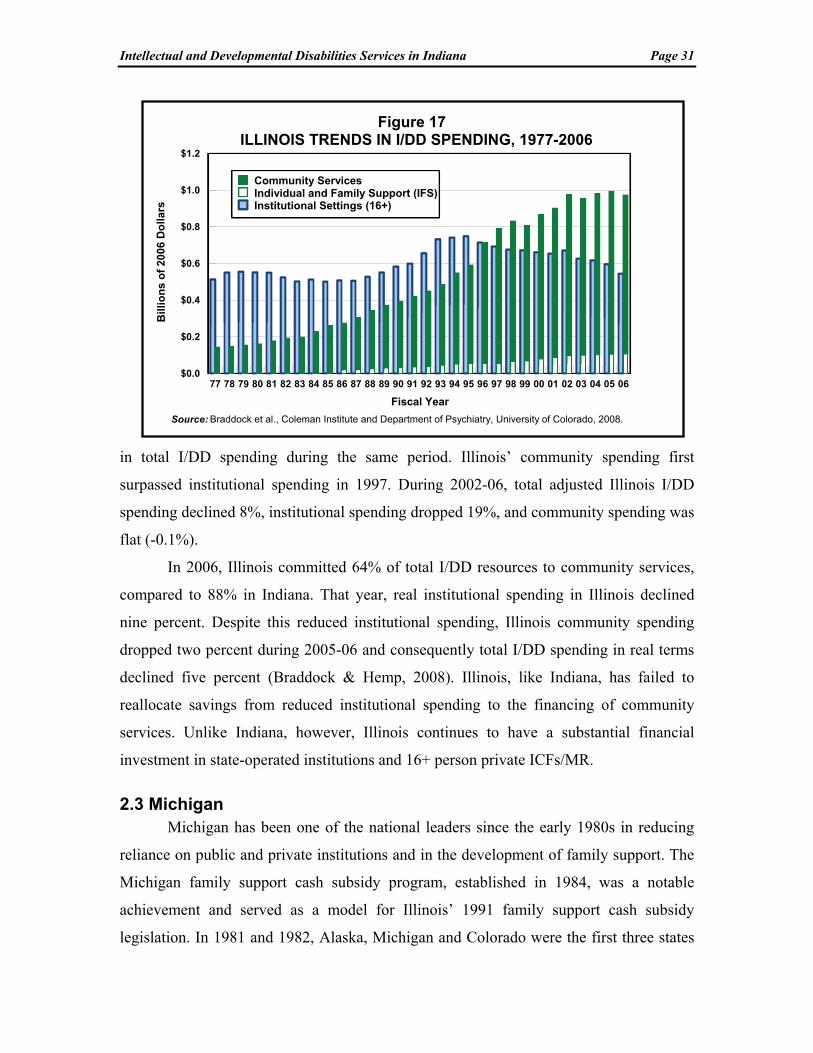
Intellectual and Developmental Disabilities Services in Indiana Page 31
in total I/DD spending during the same period. Illinois’ community spending first
surpassed institutional spending in 1997. During 2002-06, total adjusted Illinois I/DD
spending declined 8%, institutional spending dropped 19%, and community spending was
flat (-0.1%).
In 2006, Illinois committed 64% of total I/DD resources to community services,
compared to 88% in Indiana. That year, real institutional spending in Illinois declined
nine percent. Despite this reduced institutional spending, Illinois community spending
dropped two percent during 2005-06 and consequently total I/DD spending in real terms
declined five percent (Braddock & Hemp, 2008). Illinois, like Indiana, has failed to
reallocate savings from reduced institutional spending to the financing of community
services. Unlike Indiana, however, Illinois continues to have a substantial financial
investment in state-operated institutions and 16+ person private ICFs/MR.
2.3 Michigan Michigan has been one of the national leaders since the early 1980s in reducing
reliance on public and private institutions and in the development of family support. The
Michigan family support cash subsidy program, established in 1984, was a notable
achievement and served as a model for Illinois’ 1991 family support cash subsidy
legislation. In 1981 and 1982, Alaska, Michigan and Colorado were the first three states
77 78 79 80 81 82 83 84 85 86 87 88 89 90 91 92 93 94 95 96 97 98 99 00 01 02 03 04 05 06
Fiscal Year
$0.0
$0.2
$0.4
$0.6
$0.8
$1.0
$1.2B
illio
ns
of
2006
Do
llars
Community Services Individual and Family Support (IFS)Institutional Settings (16+)
Figure 17ILLINOIS TRENDS IN I/DD SPENDING, 1977-2006
Source: Braddock et al., Coleman Institute and Department of Psychiatry, University of Colorado, 2008.
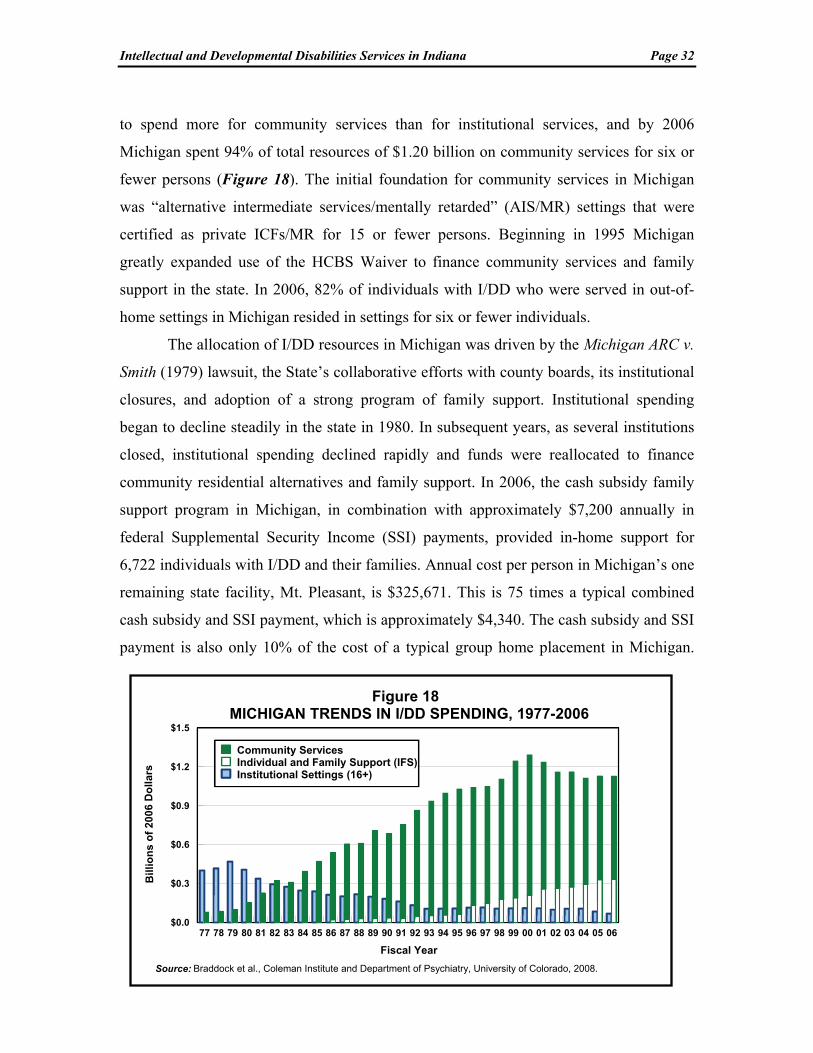
Intellectual and Developmental Disabilities Services in Indiana Page 32
to spend more for community services than for institutional services, and by 2006
Michigan spent 94% of total resources of $1.20 billion on community services for six or
fewer persons (Figure 18). The initial foundation for community services in Michigan
was “alternative intermediate services/mentally retarded” (AIS/MR) settings that were
certified as private ICFs/MR for 15 or fewer persons. Beginning in 1995 Michigan
greatly expanded use of the HCBS Waiver to finance community services and family
support in the state. In 2006, 82% of individuals with I/DD who were served in out-of-
home settings in Michigan resided in settings for six or fewer individuals.
The allocation of I/DD resources in Michigan was driven by the Michigan ARC v.
Smith (1979) lawsuit, the State’s collaborative efforts with county boards, its institutional
closures, and adoption of a strong program of family support. Institutional spending
began to decline steadily in the state in 1980. In subsequent years, as several institutions
closed, institutional spending declined rapidly and funds were reallocated to finance
community residential alternatives and family support. In 2006, the cash subsidy family
support program in Michigan, in combination with approximately $7,200 annually in
federal Supplemental Security Income (SSI) payments, provided in-home support for
6,722 individuals with I/DD and their families. Annual cost per person in Michigan’s one
remaining state facility, Mt. Pleasant, is $325,671. This is 75 times a typical combined
cash subsidy and SSI payment, which is approximately $4,340. The cash subsidy and SSI
payment is also only 10% of the cost of a typical group home placement in Michigan.
77 78 79 80 81 82 83 84 85 86 87 88 89 90 91 92 93 94 95 96 97 98 99 00 01 02 03 04 05 06
Fiscal Year
$0.0
$0.3
$0.6
$0.9
$1.2
$1.5
Bill
ion
s o
f 20
06 D
olla
rs
Community Services Individual and Family Support (IFS)Institutional Settings (16+)
Figure 18MICHIGAN TRENDS IN I/DD SPENDING, 1977-2006
Source: Braddock et al., Coleman Institute and Department of Psychiatry, University of Colorado, 2008.

Intellectual and Developmental Disabilities Services in Indiana Page 33
Illinois and Minnesota, in part, have modeled their cash subsidy programs on Michigan’s
example.
The Michigan Medicaid program is unique, consisting of a “Section 1915(b)/(c)
Combination Waiver” and Medicaid state plan personal care funding for community
I/DD programs. Medicaid funding for the state’s 1915b/c Waiver and for “B-3
Community Living Services” (CLS) is included in the HCBS Waiver line in Figure 15.
Federal Medicaid funding for these two programs ranged from $14.1 million in 1998 to
$201.9 million in 2006. The marked changes in Waiver spending and in “related
Medicaid” (personal care) during 1998-2006 were due in part to growth in person-
centered planning and the B-3 Waiver, and in part to poor data quality during the transfer
from fee-for-service to managed care in 1998.
In 1997, Michigan proposed to the Centers for Medicare and Medicaid Services
(CMS) the development of a comprehensive, prepaid, capitated managed care network
that would be administered by local government Community Mental Health Services
Programs (CMHSPs). The CMHSPs are the 51 county-based public Community Mental
Health agencies that have traditionally provided long-term care to people with I/DD in
Michigan’s 83 counties. Michigan’s “Combination 1915(b)/(c) Medicaid Prepaid
Specialty Services and Supports for Persons with Developmental Disabilities” waiver
was approved in June 1998 (CMS, 2003). Person-centered planning amendments in
Michigan’s 1995 Mental Health Code became an integral part of the Medicaid managed
care plan. The Michigan Waiver affords a uniform package of benefits for people with
I/DD, allowing the state to remove the artificial distinctions between Medicaid state plan
benefits and Medicaid HCBS Waiver benefits. Michigan’s PHP contracts affirmatively
require CMHSPs to ensure that individuals with I/DD can choose among service
providers, and that consumer service plans are developed using person-centered planning
principles (Smith, O’Keeffe, et al. 2000).
2.4 Minnesota Minnesota, like Michigan, heavily utilized Intermediate Care Facility/Mental
Retardation (ICF/MR) funding for settings for 15 or fewer persons as the foundation of
community services development in the 1980s. Like Michigan, Minnesota began in the

Intellectual and Developmental Disabilities Services in Indiana Page 34
mid-1990s to shift from ICF/MR funding to greatly expanded use of the HCBS Waiver
(Figure 15). Inflation-adjusted federal Waiver spending during 1998-2004 advanced over
114% and in 2006 Minnesota ranked third among all states in federal-state Waiver
spending per capita of the general population.
Minnesota first expended more resources for community services than public and
private institutional services in 1987, and institutional spending began to decline rapidly
in 1992 (Figure 19). By 2006, 97% of Minnesota’s total developmental disabilities
resources financed community services, family support, supported employment, and
supported living. In October 2000, Minnesota closed its sole remaining state I/DD
institution, Fergus Falls. The only remaining state-operated institutional setting is the
Minnesota Extended Treatment Options (METO) program, a unit for persons with I/DD
at the Cambridge Mental Health Center that served nine individuals during fiscal year
2006. Minnesota’s nursing facility census in 2006, 383 persons, was 64% below the level
in 1996. As noted, the number of nursing facility residents per capita (7) in Minnesota
was the lowest among the comparison states and was well below the nursing facility
utilization rate in Indiana (27).
77 78 79 80 81 82 83 84 85 86 87 88 89 90 91 92 93 94 95 96 97 98 99 00 01 02 03 04 05 06
Fiscal Year
$0.0
$0.2
$0.4
$0.6
$0.8
$1.0
$1.2
$1.4
Bill
ion
s o
f 2
006
Do
llar
s
Community Services Individual and Family Support (IFS)Institutional Settings (16+)
Source: Braddock et al., Coleman Institute and Department of Psychiatry, University of Colorado, 2008.
Figure 19MINNESOTA TRENDS IN I/DD SPENDING, 1977-2006

Intellectual and Developmental Disabilities Services in Indiana Page 35
2.4 Ohio Ohio was an early leader in the financing of supported living services (Braddock
et al., 1998). In 2006 it ranked fifth in supported living spending per capita of the general
population and also fifth in the number of supported living participants per capita. Ohio’s
community services spending first reached parity with the State’s institutional spending
in 1985 (Figure 20), five years earlier than Indiana. In 2006 Ohio committed 82% of
total I/DD resources to community services, just below Indiana’s 84% and exceeding the
community shares for the two comparison states Illinois and Wisconsin. There were
generally steady increases in inflation-adjusted community spending in Ohio during
1977-2006, with the exceptions of 1978, 1981, 1990, 2000, 2004, and 2006. Institutional
spending was essentially flat during 1987-2000, then declined during 2001-2006. The
exception was the spending increase in 2006 associated with employee salary and benefit
increases at the state developmental centers. Ohio recently closed Apple Creek and
Springfield Developmental Centers but retains 10 state-operated institutions.
In 2006, Ohio ranked 32nd in Waiver spending per capita, just below Indiana’s
ranking of 31st. Ohio continues to finance a considerable network of public and private
ICFs/MR. In 2006, in agreement with the Centers for Medicare and Medicaid Services
77 78 79 80 81 82 83 84 85 86 87 88 89 90 91 92 93 94 95 96 97 98 99 00 01 02 03 04 05 06
Fiscal Year
$0.0
$0.4
$0.8
$1.2
$1.6
$2.0
$2.4
Bill
ion
s o
f 20
06 D
oll
ars
Community Services Individual and Family Support (IFS)Institutional Settings (16+)
Source: Braddock et al., Coleman Institute and Department of Psychiatry, University of Colorado, 2008.
Figure 20OHIO TRENDS IN I/DD SPENDING, 1977-2006
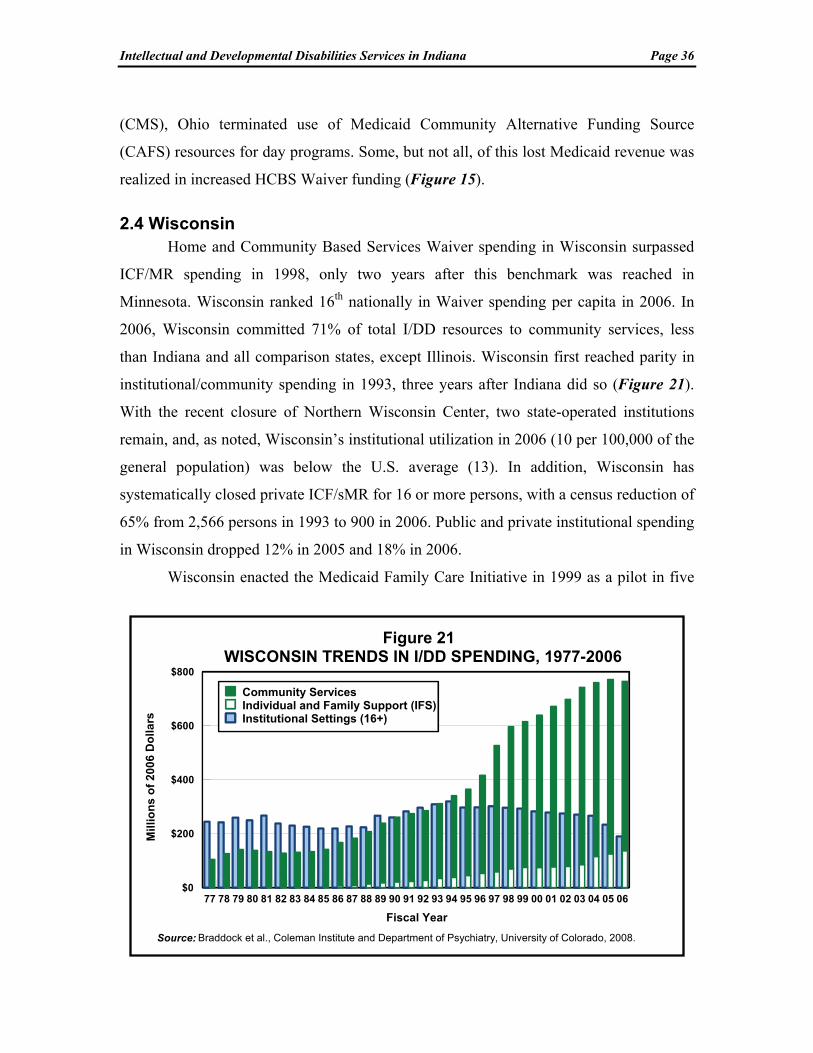
Intellectual and Developmental Disabilities Services in Indiana Page 36
(CMS), Ohio terminated use of Medicaid Community Alternative Funding Source
(CAFS) resources for day programs. Some, but not all, of this lost Medicaid revenue was
realized in increased HCBS Waiver funding (Figure 15).
2.4 Wisconsin Home and Community Based Services Waiver spending in Wisconsin surpassed
ICF/MR spending in 1998, only two years after this benchmark was reached in
Minnesota. Wisconsin ranked 16th nationally in Waiver spending per capita in 2006. In
2006, Wisconsin committed 71% of total I/DD resources to community services, less
than Indiana and all comparison states, except Illinois. Wisconsin first reached parity in
institutional/community spending in 1993, three years after Indiana did so (Figure 21).
With the recent closure of Northern Wisconsin Center, two state-operated institutions
remain, and, as noted, Wisconsin’s institutional utilization in 2006 (10 per 100,000 of the
general population) was below the U.S. average (13). In addition, Wisconsin has
systematically closed private ICF/sMR for 16 or more persons, with a census reduction of
65% from 2,566 persons in 1993 to 900 in 2006. Public and private institutional spending
in Wisconsin dropped 12% in 2005 and 18% in 2006.
Wisconsin enacted the Medicaid Family Care Initiative in 1999 as a pilot in five
77 78 79 80 81 82 83 84 85 86 87 88 89 90 91 92 93 94 95 96 97 98 99 00 01 02 03 04 05 06
Fiscal Year
$0
$200
$400
$600
$800
Mil
lion
s o
f 2
006
Do
lla
rs
Community Services Individual and Family Support (IFS)Institutional Settings (16+)
Figure 21WISCONSIN TRENDS IN I/DD SPENDING, 1977-2006
Source: Braddock et al., Coleman Institute and Department of Psychiatry, University of Colorado, 2008.

Intellectual and Developmental Disabilities Services in Indiana Page 37
counties. Family Care is a capitated acute care and long-term care managed care program
for people with I/DD, older people, and young persons with physical disabilities,
managed by the Department of Health and Family Services (DHFS). Medicaid home and
community-based services are an entitlement in the pilot counties and there are therefore
no waiting lists for services. The original legislation limited enrollment to 29% of the
state’s Medicaid population of persons with disabilities. However, the Wisconsin
Governor and legislature have recognized the program’s cost-effectiveness and consumer
satisfaction. The State has a five-year plan to expand Family Care to all of Wisconsin’s
72 counties and to 50% of the state’s Medicaid recipients with disabilities (Folkemer &
Coleman, 2006).
3. Summary of Comparison States
Indiana and the comparison states have closed numerous state institutions and
private ICFs/MR, reduced the number of nursing home residents with I/DD, and
developed community services and family supports. Minnesota, Michigan, and Indiana
have the best records in the region in the development of community service alternatives
to state institutions. Minnesota closed its last remaining state I/DD institution in October
2000 and now serves only nine persons in a state Mental Health Center I/DD unit.
Michigan serves 127 institutional residents in one remaining state-operated facility.
Indiana closed its last state-operated I/DD institution, Fort Wayne, in 2007. Minnesota,
Michigan, Wisconsin, and Illinois lead the comparison states and Indiana in reducing the
numbers of persons with I/DD in nursing facilities. The nursing facility utilization rates
per 100,000 of the general population in 2006 were Minnesota (7 persons per 100,000),
Michigan (8), Wisconsin (9) and Illinois (12). The rate was 20 in Ohio and 11 in the
U.S.--all well below Indiana’s rate of 27 persons per 100,000.
Michigan’s cash subsidy and family support programs have had an impact on the
state’s I/DD service system. Michigan places proportionately fewer individuals with
I/DD in out-of-home residential settings (214 per 100,000) than do Wisconsin (333),
Minnesota (316), and Ohio (259). The out-of-home placement rates per 100,000 in 2006
were 163 in Illinois and 187 in Indiana. Illinois and Minnesota, with their family cash

Intellectual and Developmental Disabilities Services in Indiana Page 38
subsidy legislation, have both developed family support programs that are good examples
for Indiana.
The comparison states, like Indiana, initially relied heavily on ICF/MR
reimbursement for group homes as their primary federal funding source for community
services. However, the comparison states have all developed significant HCBS Waiver-
financed alternatives for substantial numbers of their former ICF/MR residents. Growth
in the HCBS Waiver in Indiana during 2002-2005 was also impressive, and the State has
moved vigorously in the direction of Michigan, Minnesota and Wisconsin in reducing
reliance on ICFs/MR.
All comparison states employed local government funding for community I/DD
services, but Indiana did not. In fact, local/county government funding of community
I/DD services is a very important component in Ohio (41% of total I/DD spending), Iowa
(31%), and Wisconsin (15%). The local government share of community spending was
three percent in Minnesota, two percent in Illinois and five tenths percent in Michigan.
Community Wages, Benefits and Staff Training. Turnover of direct support
professionals and the inability to recruit replacement staff are detrimental to the quality of
I/DD long-term care programs. Direct support professional average wages in privately-
All Workers State Institution Nursing Aides Comm. I/DD Comm. I/DD Poverty Level$0
$5
$10
$15
$20
$25
Do
llars
per
Ho
ur
$18.46
$15.02
$11.27 $10.71$9.62 $9.62
Indiana U.S.IndianaIndiana
FIGURE 22HOURLY WAGES IN 2006
Sources: "All Workers" for Indiana and "Nursing Aides" for 2001 (Bureau of Labor Statistics, 2007) adjusted for inflation to a 2006 estimated value; "State Institution" for Indiana for 2002 (Lakin, Polister, & Prouty, 2003) adjusted for inflation; "Community I/DD" for Indiana for 2007 for direct support professional-adult services (INARF, 2007) and for the U.S. for 2001 (Lakin et al., 2003) adjusted for inflation; and "Poverty Level" for 2006 (Assistant Secretary for Planning and Evaluation, 2007).
U.S.

Intellectual and Developmental Disabilities Services in Indiana Page 39
operated community-based long-term care programs in Indiana are below the wages of all
workers covered by unemployment insurance (Bureau of Labor Statistics, 2007) (Figure
22). They also fall below average wages for state-operated direct care staff (Lakin,
Polister, and Prouty, 2003). Indiana’s average community DSP wages are below those of
nursing aides (Bureau of Labor Statistics, 2007) and equal to the 2006 poverty level for a
family of four (Assistant Secretary for Planning and Evaluation, 2007).
However, significant new direct support professional initiatives in Indiana include
a statewide training initiative at the Indiana University’s Institute on Disability and
Community (IIDC) and a two-year, $12 million DSP collaborative training program with
IIDC and Ivy Tech State College. Also participating in the latter program are Indiana
State University, the Indiana Division of Disability and Rehabilitative Services (DDRS)
of the Family and Social Services Administration (FSS), and nine provider agencies.
Both of these direct support staff initiatives are designed to enhance DSP wages, benefits
and academic and career opportunities (“DDRS is leading collaborative effort,” 2008).
VI. AGING CAREGIVERS AND WAITING LISTS IN INDIANA
The growing need for I/DD services in our society is strongly related to the aging
of our society. The baby boom generation will begin to reach age 65 in 2011. The
proportion of Americans aged 65+ years, now 13%, will grow steadily over the next three
decades and reach 22% of the U.S. population in 2030. There have also been impressive
increases in the lifespan of individuals with I/DD. Persons with I/DD had an average
lifespan of 66 years in 1993 (Janicki, 1996). The average age of death for persons with
Down syndrome had also increased substantially to 56 years in 1993 (Janicki, Dalton,
Henderson, & Davidson, 1999).
Katz (2003), in a recent international review, summarized research on life
expectancy for persons with intellectual disability from several countries including the
U.S. He concluded that life expectancy for persons with mild and moderate degrees of
impairment, the vast majority of persons with I/DD, did not differ significantly from the
general population. Patja, Iivanainen, and Vesala et al. (2000) reported, however, a 19-
35% diminishment of life expectancy in the much smaller cohort of persons with severe
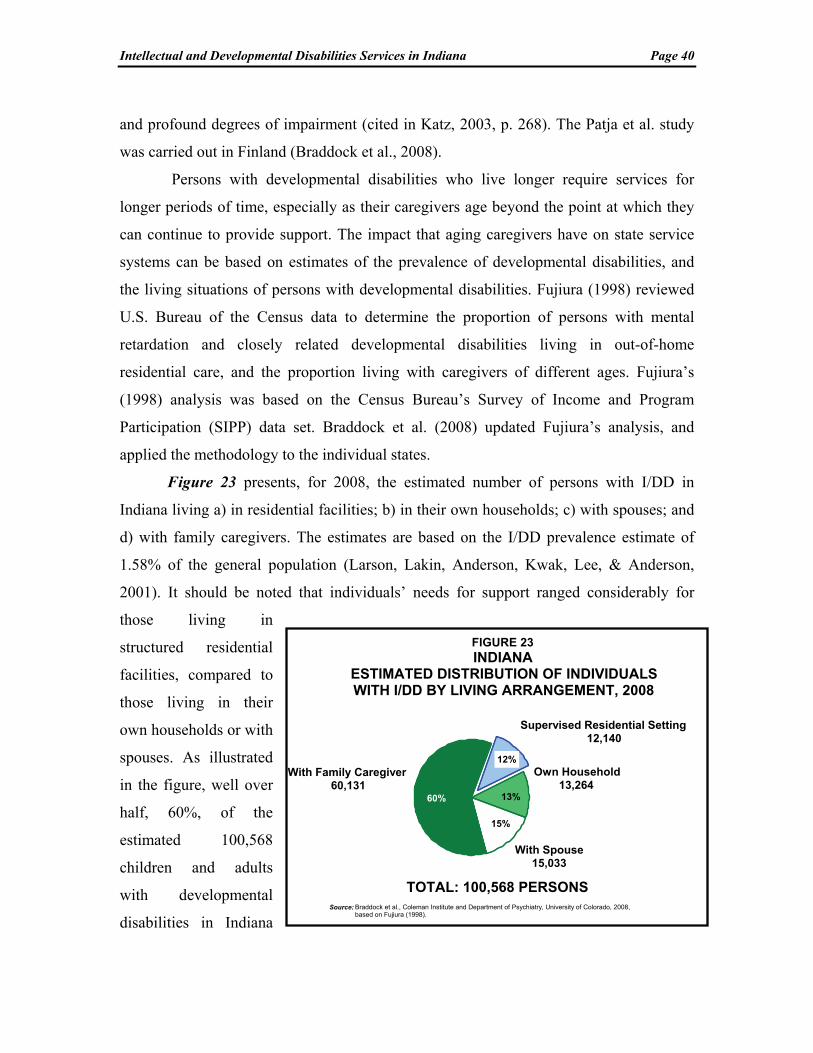
Intellectual and Developmental Disabilities Services in Indiana Page 40
and profound degrees of impairment (cited in Katz, 2003, p. 268). The Patja et al. study
was carried out in Finland (Braddock et al., 2008).
Persons with developmental disabilities who live longer require services for
longer periods of time, especially as their caregivers age beyond the point at which they
can continue to provide support. The impact that aging caregivers have on state service
systems can be based on estimates of the prevalence of developmental disabilities, and
the living situations of persons with developmental disabilities. Fujiura (1998) reviewed
U.S. Bureau of the Census data to determine the proportion of persons with mental
retardation and closely related developmental disabilities living in out-of-home
residential care, and the proportion living with caregivers of different ages. Fujiura’s
(1998) analysis was based on the Census Bureau’s Survey of Income and Program
Participation (SIPP) data set. Braddock et al. (2008) updated Fujiura’s analysis, and
applied the methodology to the individual states.
Figure 23 presents, for 2008, the estimated number of persons with I/DD in
Indiana living a) in residential facilities; b) in their own households; c) with spouses; and
d) with family caregivers. The estimates are based on the I/DD prevalence estimate of
1.58% of the general population (Larson, Lakin, Anderson, Kwak, Lee, & Anderson,
2001). It should be noted that individuals’ needs for support ranged considerably for
those living in
structured residential
facilities, compared to
those living in their
own households or with
spouses. As illustrated
in the figure, well over
half, 60%, of the
estimated 100,568
children and adults
with developmental
disabilities in Indiana
Supervised Residential Setting12,140
Own Household13,264
With Spouse15,033
With Family Caregiver60,131
TOTAL: 100,568 PERSONS
12%
13%
15%
60%
FIGURE 23INDIANA
ESTIMATED DISTRIBUTION OF INDIVIDUALSWITH I/DD BY LIVING ARRANGEMENT, 2008
Source: Braddock et al., Coleman Institute and Department of Psychiatry, University of Colorado, 2008, based on Fujiura (1998).

Intellectual and Developmental Disabilities Services in Indiana Page 41
resided with 60,131
family caregivers.
Figure 24
provides an estimate
of the age categories
of the caregivers for
the 60,131 persons
with intellectual and
developmental dis-
abilities in Indiana
who are living with
families. Of partic-
ular note is the category of 15,254 persons residing with caregivers who are aged 60
years or more. Clearly, many of these individuals need services now or very soon in the
future.
Waiting Lists in Indiana. There are three sources of waiting list statistics for
Indiana. First, Prouty et al. (2007) reported that, as of June 30, 2006, a total of 15,068
persons with I/DD in Indiana were awaiting residential services, and not presently
receiving residential services. Second, the Indiana Bureau of Developmental Disabilities
Services (BDDS) Monthly Management Report for fiscal year 2008 lists 2,140 persons
with I/DD “in application status,” and 8,932 persons “eligible but not in setting.” Finally,
Indiana waiting list data for fiscal year 2006 are available from the Indiana Family and
Social Services Administration (FSSA) for the three HCBS Waivers serving people with
I/DD. A total of 13,935 children and adults awaited services from the Indiana DD
Waiver, 2,861 awaited the Autism Waiver, and 9,454 awaited the Support Services
Waiver. However, consumers requesting Indiana Waiver services are directed by the
State to apply to the waiting lists for all three Waivers. Therefore, the DD Waiver number
(13,935) is probably a better representation of the unduplicated number of individuals
awaiting Waiver services.
Caregivers Aged 60+15,254
Caregivers Aged 41-59 21,094
Caregivers Aged <4123,783
TOTAL: 60,131 PERSONS
35%
40%25%
FIGURE 24INDIANA
ESTIMATED NUMBER OF INDIVIDUALS WITH I/DDBY AGE GROUP LIVING WITH FAMILY CAREGIVERS, 2008
Source: Braddock et al., Coleman Institute and Department of Psychiatry, University of Colorado, 2008, based on Fujiura (1998).

Intellectual and Developmental Disabilities Services in Indiana Page 42
Waiting list data are not always based on standardized definitions of the urgency
of need, and some states distinguish between families with young children registering
future need, youth turning 22 years of age, and individuals awaiting services who
themselves are older or who live with caregivers aged 60 years or older (Braddock &
Hemp, 1997). Major factors that have contributed to growing waiting lists in Indiana and
other states, in addition to the growing number of aging caregivers, include the large
proportion of nursing home residents who could benefit from receiving services in
community alternatives, and students exiting special education programs (U.S.
Department of Education, 2007).
Indiana’s Progress in Reducing Waiting Lists. Indiana has made significant
progress during the Daniels Administration in reducing waiting lists, which fell by 2,000
persons between September 2006 and June 2008. Moreover, Indiana adopted a policy to
end the waiting list for caregivers aged 80 and above seeking to access the
Developmental Disabilities Waiver and a policy for exiting high school students to access
the Support Services Waiver. Waiting list termination policies were also adopted for
persons with I/DD who lose shelter, lose a caregiver to death or illness, age out of a
children’s program, or have a life shortening disease. In addition, the State committed
$11 million per year for 24-hour crisis intervention for individuals with I/DD who have
behavioral support needs (Indiana Family and Social Services Administration, 2008a).
VII. CONCLUSION
This study a) described the structure of intellectual and developmental disabilities
(I/DD) residential and community services in Indiana and the United States; b) analyzed
recent developments in service utilization and financing of I/DD services through fiscal
year 2008; c) compared and contrasted performance in Indiana to other states and to the
U.S.; and d) presented recommendations for the future direction of intellectual and
developmental disabilities services in Indiana. The study focused most specifically on
I/DD activities during 1999-2008, and built upon our three previous analyses of Indiana
services completed in 1996, 2000 and 2004 (Braddock & Hemp, 1996, 2000, 2004).
In the present study, five Great Lakes states were compared to Indiana: Illinois,
Michigan, Minnesota, Ohio, and Wisconsin. We analyzed these states’ experiences in the
Intellectual and Developmental Disabilities Services in Indiana Page 43
development of community services, reallocation of institutional resources, development
of Home and Community Based Services (HCBS) Waiver options, and in the provision
of family support, supported employment, and supported living. The study was designed
to assist public officials, families, advocates, and consumers in Indiana to quantitatively
gauge their state’s progress toward implementing appropriate services and supports for
people with developmental disabilities and their families during the past 10 years, and to
determine progress needed in the years ahead.
Indiana’s “317 Task Force” of consumers, advocates, and state officials published
a seminal report in 1998 entitled A Comprehensive Plan for the Design of Services for
People with Developmental Disabilities. The Plan addressed key issues including waiting
lists for services and the provision of necessary resources to support people with
developmental disabilities in their homes and at work. The Plan’s recommendations
provided the framework for extensive program development activities by the Indiana
Family and Social Services Administration.
Indiana has indeed made substantial progress in I/DD services development
during the past decade. With the closure of New Castle, Northern Indiana, Muscatatuck,
and Fort Wayne State Developmental Centers, Indiana’s 2008 state-operated institutional
utilization rate of two per 100,000 persons in the general population is substantially
below the estimated 2008 U.S. rate of 10 per 100,000. However, Indiana has reallocated
insufficient resources from the institutional facilities it closed to community and family
support services. Although inflation-adjusted community services spending grew 93% in
Indiana during 1999-2005, it declined four percent during 2005-08 after the closures of
Muscatatuck and Fort Wayne Developmental Centers. HCBS Waiver spending declined
four percent on an adjusted basis during the same period and the State’s fiscal effort for
I/DD services dropped by 10%. Total spending for I/DD services in Indiana, adjusted for
inflation, declined by six percent in 2006, four percent in 2007 and by three percent in
2008.
I/DD Resource Allocation for Institutional and Community Services. In
nominal dollar terms, not adjusted for inflation, institutional services spending in Indiana
declined or showed minimal growth for every year during the 10-year period 1999-2008.

Intellectual and Developmental Disabilities Services in Indiana Page 44
Institutional spending declined 58% in 2008 (see Figure 25 below, which is not adjusted
for inflation). Alternatively, during 1999-05 community spending increased by 8% to
21% annually. However, community services spending grew only one percent in 2006
and 2007 on an unadjusted basis. Community services spending rebounded to grow by
11% in 2008. The State forecasts additional increases in Waiver and ICF/MR spending in
2009 (Indiana Family and Social Services Administration, 2008a).
During 1999-2005, total inflation-adjusted I/DD spending in Indiana grew 50%
but then declined 13% during 2005-08. During that three year period, in contrast to the
$25.8 million cumulative adjusted increase for community services spending,
institutional services spending dropped $121.1 million. Thus, during 2005-08, cumulative
adjusted spending for total I/DD services in Indiana fell $95.2 million. Spending is
expected to rebound in 2009. A July 24, 2008 State of Indiana report indicated that the
HCBS Waiver and private ICF/MR programs will be increased by 10% and six percent,
respectively, during FY 2009 (Indiana Family and Social Services Administration,
2008a).
Figure 25 ANNUAL PERCENTAGE CHANGE IN I/DD SPENDING
DURING 1999-2008: INDIANA
Source: Braddock et al., Coleman Institute and Department of Psychiatry, University of Colorado, 2008.
1999 2000 2001 2002 2003 2004 2005 2006 2007 2008Fiscal Year
-40%
-30%
-20%
-10%
0%
10%
20%
30%
40%
13% 12%
21%
8%
20% 21%
14%
1% 1%
11%
-1% -2% -2%
1% 0.4%
-11% -11% -9%
-3%
-58%
CommunityInstitutional

Intellectual and Developmental Disabilities Services in Indiana Page 45
Study Recommendations
Recommendations are provided in two broad categories: those relating to the
growth of community services and supports, and those pertinent to the utilization of
institutional settings.
Continue the Expansion of Community Services and Related Supports
1. Complete the reallocation of institutional services funding to community services. To date only a portion of the spending “saved” in the closures of Muscatatuck and Fort Wayne Developmental Centers has been reallocated to community services. Adjusted for inflation, total I/DD spending declined 13% during 2005-08 (a cumulative $95.2 million reduction). Indiana should reallocate all institutional funding previously “saved” during the institutional closures to community services, family support and supported employment initiatives;
2. Expand HCBS Waiver services. An estimated 13,935 persons with I/DD in Indiana await Waiver services. The need for such services and supports will grow rapidly in the future due to rapid increases in the number of aging caregivers in the state;
3. Develop additional support programs for families. The State should consider developing additional support programs for families, including implementation of a cash subsidy program similar to those in Illinois, Michigan, and Minnesota. Indiana ranked 40th nationally in 2006 in the number of families supported per capita and ranked 30th in family support spending per capita;
4. Expand supported employment services. Indiana should seriously consider expanding supported employment services managed by the Bureau of Developmental Disabilities Services. Spending for this program declined substantially in inflation-adjusted terms during 2006-08. Indiana ranked below the median in supported employment spending per capita; and,
5. Increase wages and benefits for direct support professionals. Wages and benefits for community-based direct support staff should be increased significantly over the next several years to reduce staff turnover and improve service quality.
Continue to Reduce Reliance on Public and Private Institutions/Nursing Facilities
6. Reduce the number of persons with I/DD in nursing facilities. Evaluate and relocate as appropriate to alternative community settings the 1,640 individuals with I/DD residing in nursing facilities in 2008. Indiana’s nursing facility utilization rate is 27 per 100,000 of the state general population (2006 data). This was the fourth highest rate nationwide, and was substantially above both the U.S. rate (11) and the average rate of the five comparison states (12). Since the completion of our last study in 2004, Indiana reduced the average daily I/DD nursing facility population by only 78 persons. This is a reduction of less than 20 individuals per year. A class action

Intellectual and Developmental Disabilities Services in Indiana Page 46
lawsuit, Kraus v. Hamilton, was filed in St Joseph County Circuit Court several years ago on behalf of residents with I/DD in nursing facilities. A settlement agreement was reached in 2004 to facilitate community placements. This litigation is currently entering mediation (L. Frick, Indiana Attorney General’s Office, personal communication, September 9, 2008); and,
7. Reduce I/DD mental health units and private ICFs/MR. Continue to downsize the remaining four I/DD units at the Logansport, Evansville, Madison and Richmond State Hospitals, and the three remaining 16+ person private ICFs/MR. Allocate these resources to strengthen and develop additional community services programs and infrastructure.
The View Ahead
During the past decade, Indiana substantially reduced reliance on institutions and
established the HCBS Waiver as the major federal funding source for community
developmental disabilities services. However, to continue this progress in providing I/DD
services, the State must reverse the recent trend during 2005-08 of resource reductions for
community services spending. Funding for the HCBS Waiver program was $10.7 million
higher in inflation-adjusted terms in FY 2005 than in FY 2008. Nonetheless, Indiana
remains well-positioned to continue to build on its notable achievements in I/DD services
development over the past decade. Indeed, State leadership is to be commended for
several recent and in-progress services initiatives including: 1) mandating that all high
school graduates with I/DD be enrolled in the Support Services Waiver; 2) assuring
eligibility for appropriate services and supports for all family caregivers aged 80 and
above and for persons with I/DD who lose shelter, lose a caregiver to death or illness, or
age out of a children’s program; 3) providing commitments for Waiver services for
nursing facility residents who wish to access community services; and 4) providing $11
million in annual funding for 24-hour crisis intervention services for persons with I/DD
and behavioral support needs (Indiana Family and Social Services Administration, 2008).
Challenges for Indiana loom large, however, given the emerging U.S. economic
and budgetary environment. In June 2008, the National Governor’s Association
anticipated fiscal problems in the states as follows:
…fiscal year 2008 marked a turning point for states’ finances with a significant increase in states seeing fiscal difficulties…as the economy has weakened, so has the state revenue and spending picture…[resulting in] spending pressures for social programs and health care increases” (p. vii).

Intellectual and Developmental Disabilities Services in Indiana Page 47
The impact of reductions in state general fund spending in Indiana is illustrated in Figure
26. Following state general fund spending growth in Indiana during 2002-04, there were
four years of spending reductions during 2005-08. The most pronounced reduction was
4.8% in 2006.
Most states
experienced
reasonably robust
economic and fiscal
conditions during
2006-07. However,
30 states are
projected to face
budget shortfalls of
at least $53 billion
in fiscal year 2009
(McNichol & Lav,
2008). Indiana is not currently one of the 30 states with a projected 2009 budget deficit,
but all five comparison states are. Their projected budget shortfalls, expressed as a
percentage of their state general fund, are: Illinois (6.3%), Minnesota (5.4%), Michigan
(4.8%), Wisconsin (4.6%), and Ohio (4.5%). The 30-state projected average budget gap
as a proportion of the states’ general fund was 10%. Indiana presently appears to be the
best positioned among the Midwestern comparison states to continue to enhance its
commitments to people with developmental disabilities and their families.
Last year Indiana capped overall Medicaid spending growth at five percent per
year (vs. the 10% growth projection based on past experience). This action contributed to
Indiana’s first-ever AAA bond rating by Standard & Poor’s. This improved rating lead to
significant savings for taxpayers (“Give state leaders credit,” 2008). However, the State’s
annual five percent Medicaid spending cap has implications for the continuing expansion
of long-term care services for people with I/DD. Persons with I/DD represent a
comparatively small but a very vulnerable and high-needs population receiving Medicaid
79 80 81 82 83 84 85 86 87 88 89 90 91 92 93 94 95 96 97 98 99 00 01 02 03 04 05 06 07 08Fiscal Year
-30%
-20%
-10%
0%
10%
20%
30%
Per
cen
t R
eal C
ha
ng
e in
Gen
era
l F
un
d
-3.9%
-7.6%-5.9%
27.3%
-3.3%
7.1%
-0.2%
5.2%
-0.6%
-4.8%
-1.3%
FIGURE 26ANNUAL PERCENTAGE CHANGE IN INFLATION-
ADJUSTED STATE GENERAL FUND SPENDING: INDIANA
Source: National Governors Association and National Association of State Budget Officers (2008).

Intellectual and Developmental Disabilities Services in Indiana Page 48
long-term care services. Should there be an economic downturn in the State, long-term
care support services for people with I/DD, including persons on waiting lists, could be
impacted negatively by the costs of addressing the large and growing population of
Indiana’s indigent non-developmentally disabled Medicaid recipients. The five percent
Medicaid growth cap is one of the challenges the State faces over the next several years
as it simultaneously continues to implement its progressive reforms in the I/DD service
delivery system. However, we expect Indiana to continue to rise to the occasion over the
next decade just as it has over the last ten years. A tradition of commitment to people
with developmental disabilities and their families is clearly being established.

Intellectual and Developmental Disabilities Services in Indiana Page 49
VIII. REFERENCES
The Arc of Indiana. (2000). History of the 317 Plan (available at: http://www.arcind.org/history_of _the_317_plan.htm)
Assistant Secretary for Planning and Evaluation. (2007). The 2007 HHS poverty guidelines. Washington, DC: Office of the Assistant Secretary, U.S. Department of Health and Human Services. (Accessed December 2005: www.aspe.hhs.gov/poverty).
Bisbecos, P. (2007, September). Closing institutions and opening doors to the community. Community Services Reporter, 14(9), 3-4.
Blatt, B., & Kaplan, F. (1974). Christmas in Purgatory: A photographic essay in mental retardation. Syracuse, NY: Syracuse University, Center on Human Policy.
Braddock, D., & Hemp, R. (2008). Services and funding for people with developmental disabilities in Illinois: A multi-state comparative analysis. A report prepared for the Illinois Council on Developmental Disabilities. Chicago and Springfield, IL: ICDD.
Braddock, D., & Hemp, R. (2004). Developmental disabilities services in Indiana: 2004 progress report. Indianapolis: Association of Rehabilitation Facilities of Indiana.
Braddock, D., & Hemp, R. (2000). Developmental disabilities services in Indiana: Assessing progress through the year 2000. Indianapolis: Association of Rehabilitation Facilities of Indiana.
Braddock, D., & Hemp, R. (1997). Toward family and community: Mental retardation services in Massachusetts, New England, and the United States. Mental Retardation, 35, 241-256.
Braddock, D., & Hemp, R. (1996a). Developmental disability services in Indiana: Current trends and future directions. Indianapolis, IN: Indiana Association of Rehabilitation Facilities and The Arc of Indiana.
Braddock, D., Hemp, R., & Rizzolo, M.C. (2008). The state of the states in developmental disabilities, 2008. Boulder, CO and Washington, DC: Department of Psychiatry and Coleman Institute for Cognitive Disabilities, University of Colorado, and American Association on Intellectual and Developmental Disabilities.
Bureau of Developmental Disabilities Services. (2008). State of the states revenue, expenditure and participant statistics for state fiscal years 2007 and 2008. Indianapolis: Family and Social Services Administration, Division of Disability and Rehabilitative Services.
Bureau of Labor Statistics. (2007). State average annual pay for 2006. Washington, DC: U.S. Department of Labor. (Accessed January 2008: www.bls.gov/oes/current/oes_nat.htm# b00-0000).
Centers for Medicare and Medicaid Services [CMS]. (2003). Section 1915(b)/(c) waiver programs. Baltimore, MD: Author. [Available at: http://cms.hhs.gov/medicaid/1915b/1915bc.asp
Cook, S. (2003, November 6). MR/DD Commission report [Update on the implementation of the 317 Plan]. Indianapolis, IN: State of Indiana, Family and Social Services Administration, Division of Disability, Aging and Rehabilitative Services. [Available at: http://www.in.gov/fssa/servicedisabl/ddars/mrddreport.html]
“DDRS is leading collaborative effort to improve the recruitment and retention of DSPs in Indiana.” (2008). DDRS Connections, April 2008, p 3.
Folkemer, D., & Coleman, B. (2006, December). Long-term care reform: Legislative efforts to shift care to the community. Washington: National Conference of State Legislatures. [accessed March 3, 2008: www.ncsl.org/programs/health/forum/longtermcarereform.htm]
Intellectual and Developmental Disabilities Services in Indiana Page 50
Fujiura, G.T. (1998). Demography of family households. American Journal on Mental Retardation, 103(2), 225-235.
“Give state leaders credit for all-time high rating.” (2008, July 24). The Indianapolis Star.
Grossi, T., & Mank, D. (2007, June). Indiana day and employment services outcomes system report. Bloomington, IN: Indiana University, Indiana Institute on Disability and Community.
Grossi, T., & Mank, D. (2006, September). Indiana day and employment services outcomes system report. Bloomington, IN: Indiana University, Indiana Institute on Disability and Community.
Grossi, T., Mank, D., Migliori, A., Pitts, S., & Schaaf, L. (2003, May 27). Muscatatuck State Developmental Center family follow-up survey of individuals who had left in 2001 and 2002 (submitted to Division of Disability, Aging, and Rehabilitative Services, Indiana Family and Social Services Administration). Bloomington, IN: Indiana University, Indiana Institute on Disability and Community, Center on Community Living and Careers.
Herr, S.S. (1992). Beyond benevolence: Legal protection for persons with special needs. In L. Rowitz (Ed.), Mental retardation in the year 2000 (pp. 279-298). New York: Springer-Verlag.
Indiana Association of Rehabilitation Facilities (INARF). (2007, May). 2007 salary and compensation survey report, revised May 2007. Indianapolis: Author.
Indiana Family and Social Services Administration [FSSA]. (2008, April 28). Division of Disability and Rehabilitative Services quarterly financial review, Peter A. Bisbecos, Director. Indianapolis: Author.
Indiana Family and Social Services Administration [FSSA]. (2008a July 24). Division of Disability and Rehabilitative Services SFY 08 financial review, Peter A. Bisbecos, Director. Indianapolis: Author.
Indiana Family and Social Services Administration [FSSA]. (2008b). Indiana HCBS Waivers. Indianapolis: Author.
Indiana Legislative Services Agency. (1991, October). Senior citizens, the disabled and children in Indiana: Adults with disabilities and local service delivery (evaluation audit). Indianapolis: Author
Indiana Legislative Services Agency. (1990, July). Senior citizens, the disabled, and children in Indiana. Indianapolis: Legislative Information Center.
Janicki, M.P. (1996, Fall). Longevity increasing among older adults with an intellectual disability. Aging, Health, and Society, 2,2.
Janicki, M.P., Dalton, A.J., Henderson, C.M., & Davidson, P.W. (1999). Mortality and morbidity among older adults with intellectual disability: Health service considerations. Disability and Rehabilitation, 21(5/6), 284-294.
Katz, R.T. (2003). Life expectancy for children with cerebral palsy and mental retardation: Implications for life care planning. NeuroRehabilitation, 18, 261-270.
Lakin, K.C., Polister, B., & Prouty, R. W. (2003). Trends & Milestones: Wages of non-state direct-support professions lag far behind those of public direct-support professionals and the general workforce. Mental Retardation, 41(2), 141-146.
Larson, S., Lakin, K.C., Anderson, L., Kwak, N., Lee, J.H., & Anderson, D. (2001). Prevalence of mental retardation and developmental disabilities: Estimates from the 1995/95 National Health Interview Survey Disability Supplements (NHIS-D). American Journal on Mental Retardation, 106(3), 231-252.
Kraus v. Hamilton, 71D060012CT260 St. Joseph Co.

Intellectual and Developmental Disabilities Services in Indiana Page 51
McNichol, E.C., & Lav, I.J. (2008, September 26). State budget troubles worsen. Washington, DC: Center on Budget and Policy Priorities.
Mitchell, D., & Braddock, D. (1990). Historical and contemporary issues in nursing home reform. Mental Retardation, 28(4), 201-210.
National Association of State Directors of Developmental Disabilities Services (NASDDDS). (2008). NASDDDS litigation updates, January – July 2008. Alexandria, VA: Author.
National Governors Association and National Association of State Budget Officers. (2008, June). The fiscal survey of states. Washington, DC: Authors.
Pajta, K., Iivanainen, M., Vesala, H., et. al. (2000). Life expectancy of people with intellectual disability: A 35-year follow-up study. Journal of Intellectual Disability Research, 44, 591-599.
Prouty, R.W., Smith G., & Lakin, K.C. (2007). Residential services for persons with developmental disabilities: Status and trends through 2006. Minneapolis: University of Minnesota, Institute on Community Integration, Research and Training Center on Community Living.
Rest Assured. (2008). Caring people, remarkable technology. Lafayette, IN: Author. (Accessed January 16, 2008: www.restassuredsystem.com/services.htm).
Rizzolo, M.C., Hemp, R., & Braddock, D. (2006, February). Family support services in the United States. Policy Research Brief, 17(1), 1-11 (University of Minnesota, Center on Residential Services and Com-munity Living).
Seiders, J.X., & Conroy, J.W. (2000, January 24). Outcomes of community placement at six months for the people who moved from ResCare Intermediate Care Facilities. Rosemont, PA: The Center for Outcome Analysis.
Smith, G., O’Keeffe, J., Carpenter, L., Doty, P., Kennedy, G., Burwell, B., Mollica, R., & Williams, L. (2000, October). Understanding Medicaid home and community services: A primer. Washington, DC: George Washington University, Center for Health Policy Research.
U.S. Department of Education. (2007). To assure the free appropriate public education of all children with disabilities: Twenty-seventh annual report to Congress on the Implementation of the Individuals with Disabilities Education Act. Washington, DC: The Department.
U.S. Department of Justice. (2006). Department of Justice activities under the Civil Rights of Institutionalized Persons Act fiscal year 2006. Washington, DC: Author.
Willever, H. (1996). Records of state mental hospitals. Indianapolis: Indiana State Archives.