Establishing a scientific framework for aquatic plant ... a scientific framework for aquatic plant...
69
Establishing a scientific framework for aquatic plant management in WI Alison Mikulyuk, Research Scientist Michelle Nault, Research Scientist Jennifer Hauxwell, Section Chief Wisconsin Department of Natural Resources Science Services Bureau
Transcript of Establishing a scientific framework for aquatic plant ... a scientific framework for aquatic plant...

Establishing a scientific framework for aquatic plant
management in WI
Alison Mikulyuk, Research Scientist
Michelle Nault, Research Scientist
Jennifer Hauxwell, Section Chief
Wisconsin Department of Natural Resources
Science Services Bureau

WDNR Research Overview
Theme: The importance of good data to inform management: providing science tools for you!
Talk outline:
1) Building and testing a good observation system
2) Using data to understand systems – What drives EWM abundance in lakes? 100 lake survey, long-
term statewide surveys, 2,4-D experimental case studies

Baseline Sampling of Aquatic Plants -Statewide Sampling Protocol
• Point-intercept design
• Goals and applications
• 2005-2008 Sampling effort
• Setting the sampling intensity
• Evaluating sampling intensity
– Balancing good data and cost
Protocol available at http://www.uwsp.edu/cnr/uwexlakes/ecology/APM/APM%20Appendix.pdf

Baseline sampling of aquatic plants Goals and Applications
1) In-lake ecology and management -Snapshot of one lake today…
and over time
2) Regional and state-wide ecology and management
-Comparisons among many lakes today…
and over time
-Provides CONTEXT
3) State $ yield state “product”!

Summary Statistics Total lake points 563
Number of points with plants 178
Maximum depth of plants (m) 4.1
Littoral area (% of lake) 32
Mean # species/point 1.7
Species Richness 27
Simpson's Diversity Index 0.87
Enterprise Lake, Langlade County
Size - 200 ha; Max depth - 8.2 m
In-lake examples: 1) Summary statistics

Enterprise Lake, Langlade
Species Frequency of
occurrence (%)
Species Frequency of
occurrence (%)
E. canadensis 48.1 M. tenellum 1.9
Nitella spp. 26.4 Chara spp. 1.9
V. americana 14.3 Isoetes spp. 1.9
C. demersum 12.0 P. amplifolius 1.6
N. flexilus 11.6 M. beckii 1.6
P. pusillus 11.2 E. acicularis 1.2
N. gracillima 8.1 N. odorata 1.2
P. richardsonii 4.7 P. strictifolius 1.2
S. fluctuans 4.7 E. palustris 0.8
P. robbinsii 3.9 M. heterophyllum 0.8
U. purpurea 3.9 N. variegata 0.4
M. spicatum 3.5 P. crispus 0.4
P. spirillus 3.1
B. schreberi 2.3

N
In-lake examples: 2) Maps of species distributions
Enterprise Lake, Langlade
In-lake examples:
Vegetated sites
Sites with plants
Enterprise Lake, Langlade
N

Request origination: DNR, municipalities, lake consultants, educational institutions
2005-2008 - Sampling Maps Standardized by DNR Research
Aquatic Plant Sampling Maps (822 lakes)
Variable Range Mean
Lake size (ha) 5-4000 115
Distance between points (m) 25-150 45
Total # sample points 40-4100 370
266 sampled by DNR Research crews = about 52,000 rake tosses!
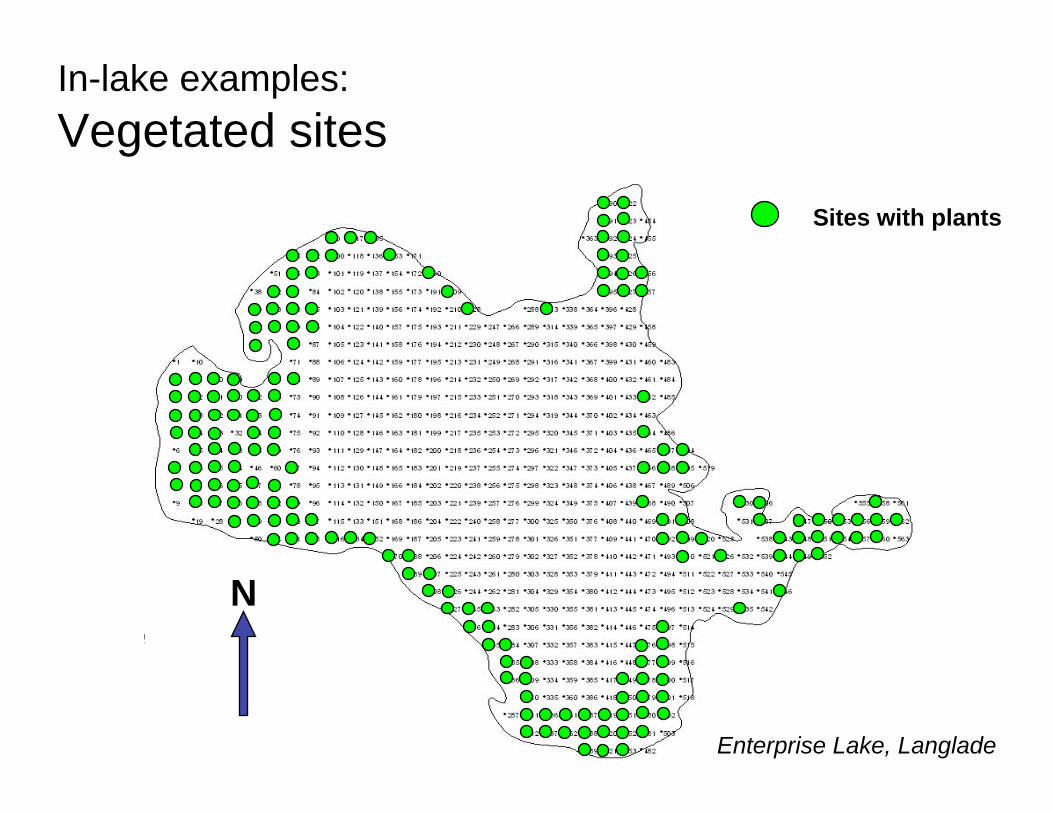
In-lake examples: Distribution of Eurasian Watermilfoil
N
Enterprise Lake, Langlade
Myriophyllum
spicatum
Sites with plants

Utricularia
purpurea
N
Enterprise Lake, Langlade
In-lake examples: Species of Special Concern
Myriophyllum
spicatum
Sites with plants

Sample Size Affects Data Quality
(and Cost)


Richness: Full dataset vs. 90% Note: Each point = a lake

Richness: Full dataset vs. 80%

Richness: Full dataset vs. 70%

Richness: Full dataset vs. 60%

Richness: Full dataset vs. 50%

Richness: Full dataset vs. 40%

Richness: Full dataset vs. 30%

Richness: Full dataset vs. 20%

Richness: Full dataset vs. 10%

Richness: Full dataset vs. 10%
* Note increased deviation
at higher richness levels

Increase in Accuracy Decrease in Variability
Y axis: clarify
Accurate estimates in 94% of lakes tested

Cost-Benefit Analysis


Establishing a scientific framework for Eurasian watermilfoil management in
Wisconsin
Photo by John Madsen, Aquatic Plant Management Society

Present in 479 lakes in WI
Historically more problematic in SE WI
Eurasian watermilfoil

Despite good tracking of EWM populations in WI ( yes if present):
• How much? Where in the lake? What will the lake look like in the future?
-different lake types, different outcome? -different location, different outcome? -different management, different outcome?
Translates to poor ability to educate the public on potential outcomes and management

Questions about EWM
1) EWM ecology -What are the possible outcomes when EWM is introduced to a lake? -What factors contribute to different outcomes? -Interannual variation (with and without management)?
2) EWM management -Past management (non strategic) outcomes = short term nuisance relief? -Future management (strategic) outcomes = restoration?

Goals of Statewide EWM Research in WI
1) Within a given lake - gain background data on EWM lakes to manage today and track future changes
2) Across lakes statewide - understand the factors that control EWM abundance and time course in lakes
Approach – survey as many milfoil lakes as possible!!!
Search for patterns across meaningful gradients…

Project Design
• Gradients of:
–Size (up to 500 acres)
–Depth
–Date reported present
–Management histories
Omernick et al. 2000
• Major factors:
–Ecoregion
–Lake Type

Data Collection
• Point-intercept method • 100 EWM lakes • 30-70 m resolution • Species list and distributions for
each lake • Density rating for exotics (1,2,3):
EWM and Curly-leaf pondweed
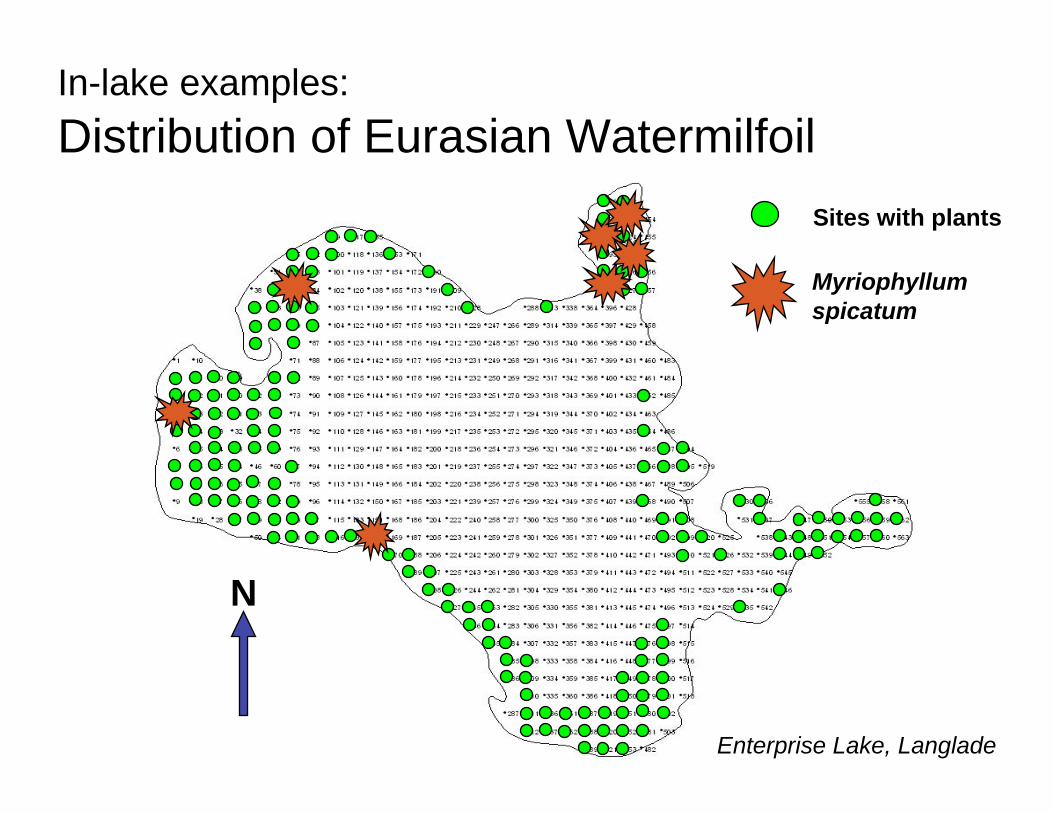
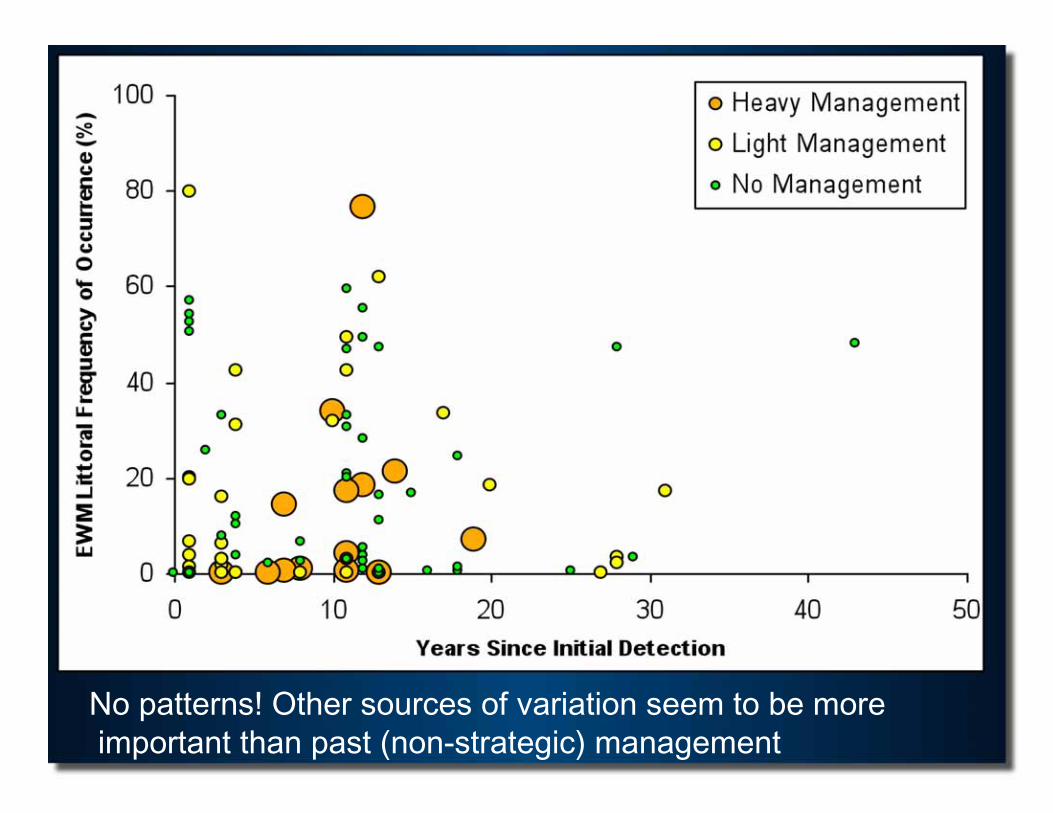
EWM frequencies across state… PERCEPTIONS
0-10 10-20 20-30 30-40 40-50 50-60 60-70 70-80 80-90 90-100
Fake data!

EWM frequencies across state… REALITY!
-Most EWM littoral frequencies are <10%... Variation?

Management history in WI
• Acreage of EWM
• Acreage of EWM treated
• Chemical used
• Amount used
• When
• Where

What would we like to see?

Eurasian watermilfoil
Long-term EWM management study
• Track results of STRATEGIC management
– Annual PI survey and biomass collection
– Control for region and time since detection
• Management effect in preliminary data

-How does strategic management affect long-term EWM population levels? Tracking 24 lakes over time, ongoing 3 regions, established and new, managed and unmanaged
ESTABLISHED populations
Hypothetical data
Managed
Unmanaged
?
?
NEW populations
Hypothetical data
Managed
Unmanaged
?
?

Southeastern Wisconsin Till Plains
Unmanaged
Managed

North Central Hardwood Forests
Unmanaged
Managed

Northern Lakes & Forests
Unmanaged
Managed

Summary
• Baseline data on EWM lakes
• Continue to track new and established populations in managed and unmanaged systems
• Be able to inform the public about reasonable expectations for EWM on individual lakes
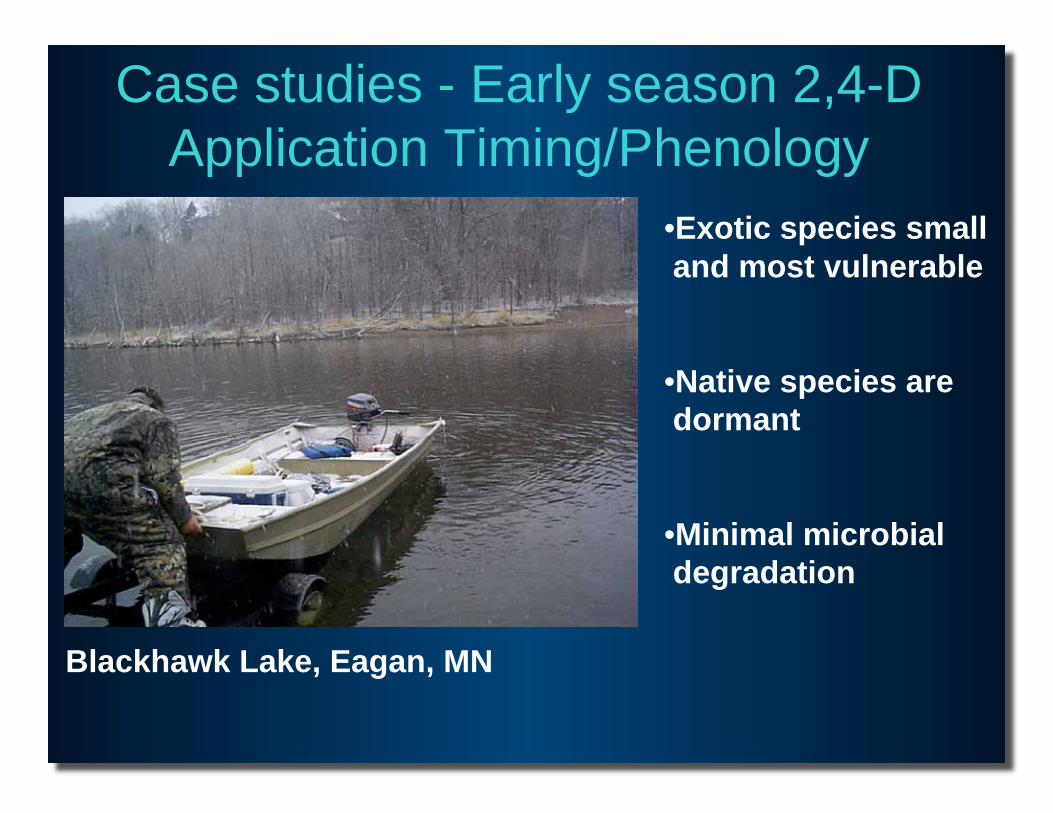
Case studies - Early season 2,4-D Application Timing/Phenology
•Exotic species small
and most vulnerable
•Native species are
dormant
•Minimal microbial
degradation
Blackhawk Lake, Eagan, MN

Case Studies – Early season control
Turville Bay Early season harvesting and 2,4-D treatment
Sandbar, Tomahawk
Early season 2,4-D treatment

Tomahawk & Sandbar:
Study design
• Tomahawk – early season low dose 2,4-D (0.5 mg/L ae)
treatment to whole lake (May 20, 2008)
• Sandbar – reference lake
• PI Surveys conducted on Tomahawk: 2006-2008
• PI Surveys conducted on Sandbar: 2007-2008
• Biomass collected in 2007 & 2008 surveys

Case studies Sandbar/Tomahawk; Town of Barnes, Bayfield County,
Army Corps of Engineers, WDNR
1) What are the effects of early season 2,4-D on Eurasian watermilfoil?
2) What are the effects of early season 2,4-D on native plants?
Approach: Monitor annual changes
in plant communities in experimental
lakes (herbicide or reference)
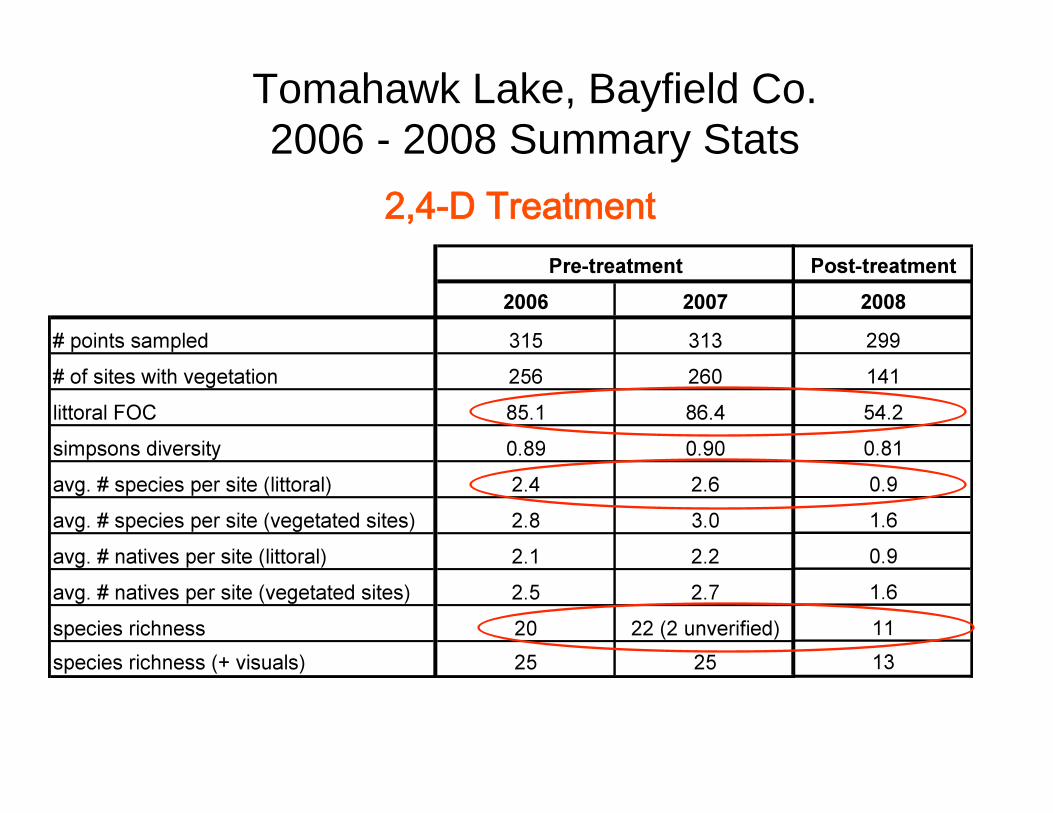
Tomahawk Lake, Bayfield Co. 2006 - 2008 Summary Stats

*** *** *
*** *** ***
*
***
** ** ***
* = p 0.05
** = p 0.01
*** = p 0.001

Sandbar Lake, Bayfield Co. 2007 - 2008 Summary Stats
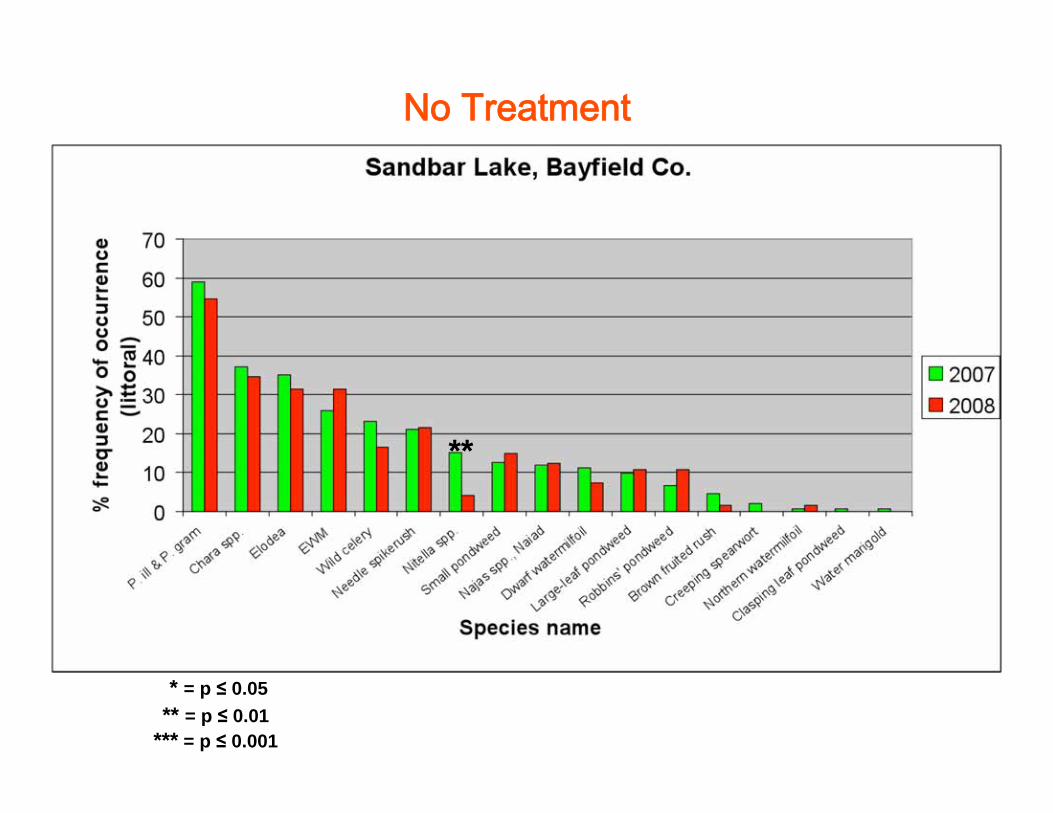
**
* = p 0.05
** = p 0.01
*** = p 0.001


Case studies Turville Bay, Lake Monona; Dane County, Army Corps,
WDNR
1) What are the effects of early season 2,4-D, early season harvesting, and no-management on Eurasian watermilfoil?
2) What are the effects of early season 2,4-D, early season harvesting, and no-management on native plants?
Approach: Monitor annual changes in plant communities in experimental plots (herbicide, harvested, control plot replicates = 7 total plots)

Turville Bay Experimental plot locations (5 acres) -3 control plots -2 harvested plots -2 herbicide plots
2,4-D
CONTROL
2,4-D
CONTROL
CONTROL
HARVEST
HARVEST

Methodology • 4 survey dates
– June and August, 2007 – 2008
• ~40 points per plot – Rake sampler employed
• Species ID, fullness rating, depth, substrate
• Biomass collection at each point
• Statistical Analysis – ANOVA to assess treatment effect
– Chi-square to assess changes in
frequency of occurrence by plot

*** SIGNIFICANT TREATMENT EFFECT 2007 – 2008 (ANOVA, p = 0.005)
Chemical Harvest Control
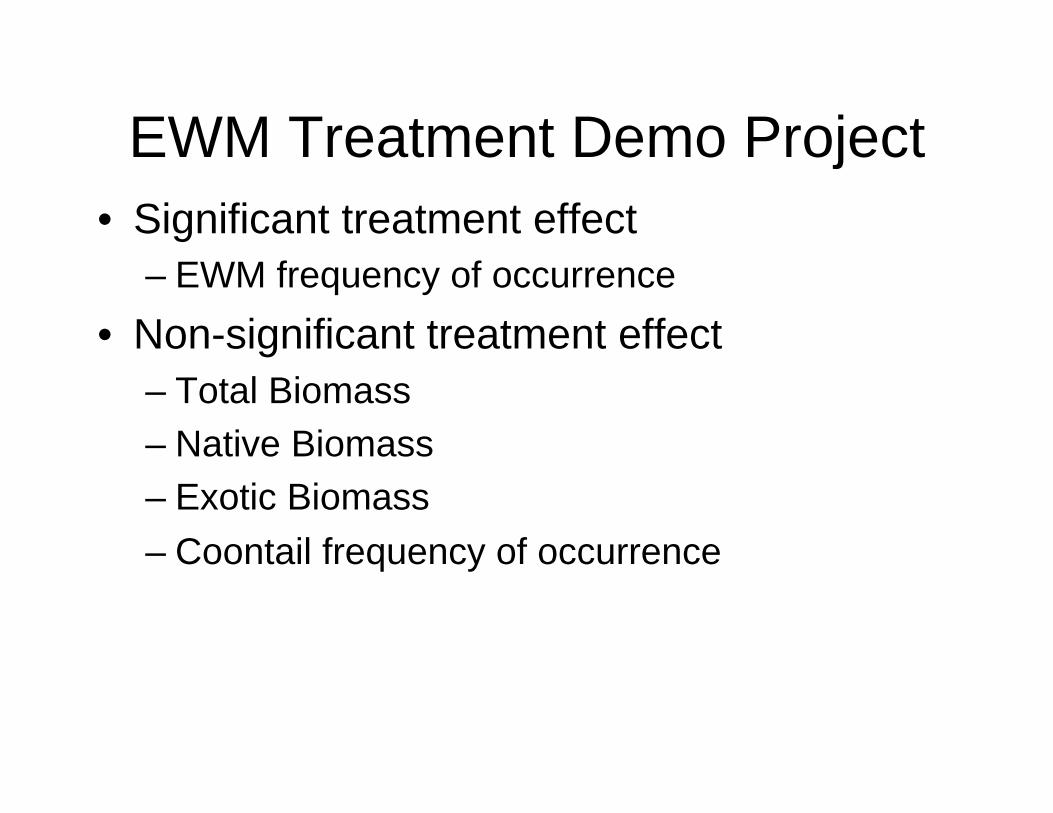
EWM Treatment Demo Project
• Significant treatment effect
– EWM frequency of occurrence
• Non-significant treatment effect
– Total Biomass
– Native Biomass
– Exotic Biomass
– Coontail frequency of occurrence

Eurasian Watermilfoil
• Looking forward:
– Continue annual monitoring
• Sandbar/Tomahawk
• Turville Bay
• Long-term statewide management project

What can science do for you?
• Save money!
-Don’t want to spend unwisely without knowing the facts
-Want to be able to invest wisely
• Set reasonable expectations
-Data provides objective information to base decisions on
-Helps to weigh the benefits of management with the potential risks

Fluridone Overview • Marketed as Sonar® and Avast!®
• Systemic herbicide
• Kills plants in 60-90 days (6 ppb)
• Whole-lakes or coves,
partial treatments possible
• Semi-selective control of Eurasian Watermilfoil and Hydrilla

Q: So what’s the big deal with fluridone?
vs
Whole lake treatment = Whole ecosystem manipulation
A: Spatial scale!
Why do we care? Plants = nutrient uptake, erosion control, fish habitat Too much algae = poor water clarity, aesthetics (odors), health, affect fish Fish = important component of ecosystem, important to WI economy and legacy

Questions
1) What are the primary and secondary ecological effects (both intended and unintended)?
-Vegetation (exotic and native)
-Water quality (algae)
-Fisheries
2) What has been done already to address those questions?
Anecdotal accounts
Technical review of DATA
N > 1, generalize effects

Long-term effects on EWM (3+ year data sets):
*Cumulative cover – indicates coverage and density of plants in lake
Year Year
Fre
quency o
f occurr
ence
Dosage (ppb)
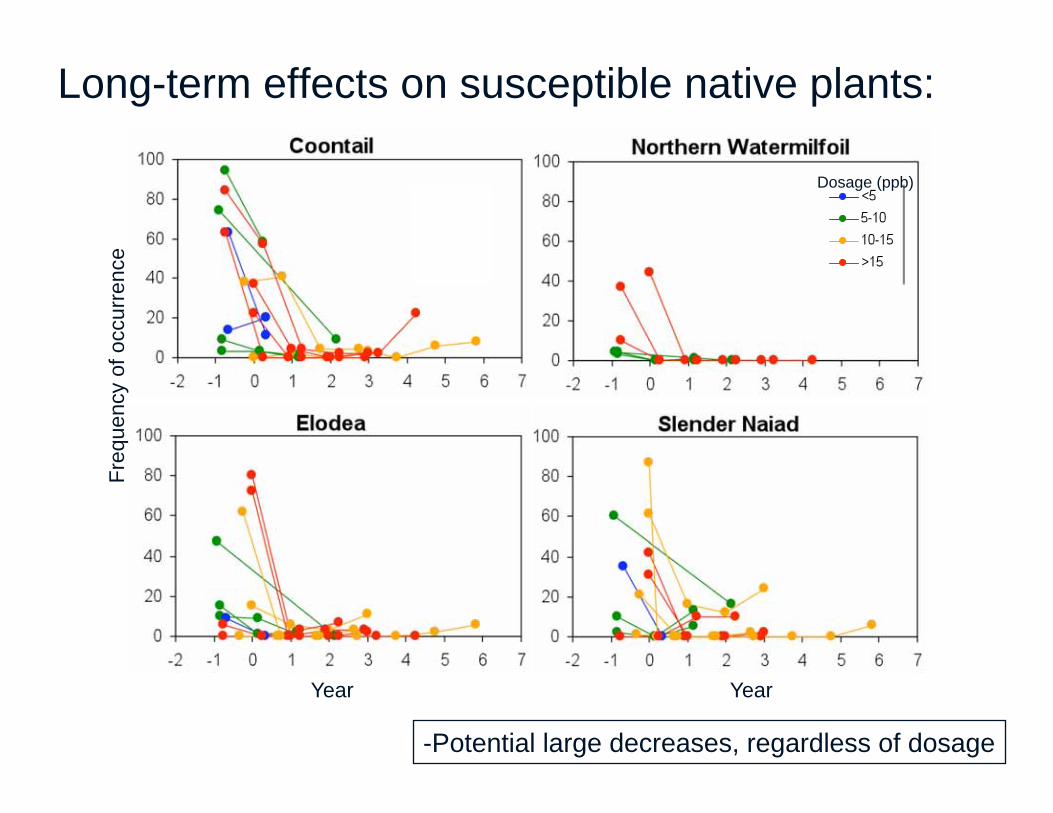
-Potential large decreases, regardless of dosage
Long-term effects on susceptible native plants:

Effects on Algae / Water Clarity
Reductions in secchi depth in 80% of treated lakes (P = 0.003) due to increased algae (late summer samples, 1 yr pretreatment vs averaged year of treatment and 1 year post)
-Since they compete for nutrients, trade-off between plants and algae -Plant decay also provides nutrients for algal growth

Potter Lake 9/30/05

Depends on the lake:
• Biomass of susceptible vegetation
• External and internal nutrient loads
• Morphology and bathymetry of lake (% of lake area that is vegetated)
Overall effects on algae/water clarity:
Shallow, eutrophic lake with high biomass of EWM, coontail, and elodea throughout
Deep, oligotrophic lake with some EWM, and high biomass of
tolerant natives
vs

Summary
Deciding whether a whole-lake treatment is appropriate:
1) Quantify the perceived problem! Data, data, data…
2) Set reasonable expectations (ecological and economical) -Whole lake treatments generally do not eradicate EWM repeat treatments would probably be requested -Usually provide 2 seasons of nuisance relief, need to manage in interim -Can incur unintended ecological effects – need to evaluate data lake by lake (physical features, plants, algae/water clarity, fisheries)
3) Weigh the benefit with the risks
4) Recognize that managing invasives is a long-term
commitment with any tool (action based on data)