ESSnet KOMUSO constraints, i.e. if elements cohere or fit together – they can be satisfied by...
18
ESSnet KOMUSO Quality in Multisource Statistics https://ec.europa.eu/eurostat/cros/content/essnet-quality- multisource-statistics-komuso_en Specific Grant Agreement No 2 (SGA-2) Framework Partnership Agreement Number 07112.2015.003-2015.226 Specific Grant Agreement Number 07112.2016.019-2017.144 Work Package 3 Literature Review Coherence in Multi-Source Statistics – Literature Review Version 2018-02-20 ESSnet co-ordinator: Niels Ploug (DST, Denmark), email [email protected], telephone +45 2033 0875 Prepared by Ferenc Mújdricza and Ágnes Almádi (HCSO, Hungary) With contributions from Csaba Ábry (HCSO, Hungary), Gábor Lovics (HCSO, Hungary), Ton de Waal (CBS, Netherlands), Giovanna Brancato (Istat, Italy)
Transcript of ESSnet KOMUSO constraints, i.e. if elements cohere or fit together – they can be satisfied by...

ESSnet KOMUSO
Q u a l i t y i n M u l t i s o u r c e S t a t i s t i c s
h t t p s : / / e c . e u r o p a . e u / e u r o s t a t / c r o s / c o n t e n t / e s s n e t - q u a l i t y -m u l t i s o u r c e - s t a t i s t i c s - k o m u s o _ e n
S p e c i f i c G r a n t A g r e e m e n t N o 2 ( S G A - 2 )
Framework Partnership Agreement Number 07112.2015.003-2015.226
Specific Grant Agreement Number 07112.2016.019-2017.144
W o rk P a c ka ge 3
L i tera t ure Rev i ew
Co here nc e i n Mul t i - So urc e S ta t i s t i c s – L i te ra tur e Rev i ew
Version 2018-02-20
ESSnet co-ordinator: Niels Ploug (DST, Denmark), email [email protected], telephone +45 2033 0875
Prepared by Ferenc Mújdricza and Ágnes Almádi (HCSO, Hungary)
With contributions from Csaba Ábry (HCSO, Hungary), Gábor Lovics (HCSO, Hungary), Ton de Waal (CBS, Netherlands), Giovanna Brancato (Istat, Italy)

ESSnet KOMUSO Work Package 3 (SGA-2)
[2]
Contents
1 Coherence – a broader picture .........................................................................................................3
2 Coherence in the quality of statistics literature ................................................................................4
2.1 The demand for coherence assessment .....................................................................................4
2.2 The distinction of ‘intrastatistical’ and ‘interstatistical’ coherence ..........................................7
2.3 The ‘earlier’ works ...................................................................................................................8
2.4 The ‘newer’ works and the ESS Handbook for Quality Reports ............................................11
2.4.1 A source to be discussed separately - the ESS Handbook for Quality Reports ..............12
3 Final remarks .................................................................................................................................16
4 References .....................................................................................................................................17
ESSnet KOMUSO Work Package 3 (SGA-2)
[3]
1 Coherence – a broader picture
Almost every statistical quality guideline contains more or less (usually less) detailed reference on the
importance of coherence and the need for measuring it. In spite of being such a recognised aspect,
conceptualisations of coherence in the framework of the quality of statistics (either single-, or multi-
source) tend to be quite vague and generalising, while usually lacking accurate descriptions of the
notion as well as of the measurement of it. The only exception to be noted is Eurostat’s ESS Handbook
for Quality Reports (2015). Although, as shown below, it also has minor conceptual and major
methodological shortcomings, its thorough approach is exceptional among the literature discussed in
the present paper.1 Given that statistics-focused texts on coherence never provide us with any proper,
unquestionable interpretation of the essence of the phenomenon in question, mostly treating it as
some evident commonplace knowledge, let us begin with a glimpse at the basics of the philosophy of
coherence, in order to have a ground to take off from towards the heights of statistical coherence.
We do not intend to delve deeper into the phenomenology of coherence, but it is important
to understand some fundamental general characteristics of this highly popular, though rather poorly
defined dimension of statistical quality. In line with Thagard and Verbeurgt’s (1998) ground-breaking
theory of coherence as ‘constraint satisfaction’, the core of coherence can basically be ‘understood in
terms of maximal satisfaction of multiple constraints’ (Thagard et al. 2002). Thagard et al. (2002) define
two types of constraints:
1. positive constraints, i.e. if elements cohere or fit together – they can be satisfied by accepting
as well as rejecting both elements, and
2. negative constraints, i.e. if elements are incoherent or resist to fit together – they can be
satisfied only by accepting one of the elements and rejecting the other.
Without going into further details, we should recognise that for any description and measurement of
coherence demands us to 1.) specify the elements, and 2.) define the positive and negative constraints
that hold between them.
Coherence, by the way, does not entail validity on its own. Fairy tales, hallucinations, astrology,
etc. may be as coherent as firm facts-based knowledge, such as astronomy is. Astrology, for instance,
might be an internally coherent structure of explaining human behaviour but the comparative
coherence of astrology, astronomy, and psychology shows that its inconsistency with them makes it
rather incoherent with external empirical evidence (Thagard et al. 2002). Hence, applying a ‘multi-
source view’ of constructs of similar phenomena is essential in some cases for assessing their quality
of catching the essence of the phenomena they try to describe. We have to admit, though, that this
multi-source incoherence does not affect the ‘level’ of their internal coherence. Multi-source
incoherence of a given construct informs us about its validity. In other cases, though, the incoherence
of different constructs does not mean that any of them should be disposed of. Such are the internally
equally coherent Quantum Theory and General Relativity which are well-known to be irreconcilable
with each other. A possible solution for reconciliation would be introducing a third ‘source’, such as
String Theory, which is regarded as a highly elegant model. To sum up, in order to keep the internal
coherence of a ‘multi-source construct’, we need to find a way to reconcile them, or
partially/completely dispose of the incoherent source.
1 This is the reason for why we decided to devote a whole chapter to this source.
ESSnet KOMUSO Work Package 3 (SGA-2)
[4]
After this short introduction delineating the mere outlines of the concept of coherence in a
broader sense, we have at least the basics of a conceptual framework that enables making sense of
the various attempts on coherence in statistics, with a special attention to coherence in multi-source
statistics. We have to define multi-source beforehand. We treat a construct as multi-source if it is built
of at least two different individual constructs. In a certain sense, we can treat any individual construct
as a multi-source construct. For instance, survey datasets are collected from different entities, contain
different variables, etc., all of which can be viewed as individual sources. In the following chapters, we
also treat single-source statistics that can be described with a dataset obtained from a single data
collection (survey, Big Data, etc.) or administrative data transmission (source). Coherence within the
different elements of the dataset (e.g. definitions, variables, etc.) are conceived as internal coherence
of the given single-source statistics.
2 Coherence in the quality of statistics literature
2.1 The demand for coherence assessment
The Regulation (EC) No 223/2009 of the European Parliament and of the Council (2009) sets the criteria
(dimensions) of statistical quality, which assumes the need for measuring these criteria in quality
assessments of statistical process/product/etc. The Regulation contains brief definitions of these
criteria. We cannot expect thorough conceptual and/or methodological explanations from the
Regulation, but it has an important characteristic that we should pay attention to. It clearly
distinguishes comparability from coherence, unlike, by the way, a number of relevant literature,
among them even important guiding texts written after it, such as the highly important Code of Practice
(henceforth: CoP) of the European Statistical System (2011). EC Regulation 223/2009 (2009: 169.)
conceives coherence as ‘which refers to the adequacy of the data to be reliably combined in different
ways and for various uses’. Although this approach is a popular one, as shown below, it has major
limitations, such as the danger of confusing coherence and integrability. Although the latter is not
listed among the statistical quality criteria of the Regulation, this conceptual problem is an issue that
calls for a solution.
So, let us begin with the CoP. It consists of fifteen principles to be followed, fourteenth of which
pertains to coherence (and comparability – the two phenomena seem to be intermingled). The Quality
Assurance Framework of the ESS (2015) (henceforth: QAF), offers further details to each principle and
indicator, as a ‘supporting document aimed at assisting the implementation’ (ESS 2015: 3.) of the CoP.
Therefore, we deal with its relevant passages together with the discussion of the CoP indicators of
coherence and comparability. The fourteenth principle of the CoP begins with a declaration that
‘European Statistics are consistent internally, over time and comparable between regions and
countries; it is possible to combine and make joint use of related data from different sources.’ (ESS
ESSnet KOMUSO Work Package 3 (SGA-2)
[5]
2011: 8.) Although this principle mixes coherence and comparability together, we should focus on
coherence.
The most important features of this declaration (it would be quite ambitious calling it a proper
definition) are the following:
- it pertains to single-source statistics, for the coherence of statistics described as such is a
precondition for the combination and use of data from different sources, i.e. for usable multi-
source statistics;
- coherent (and comparable) statistics have to be internally consistent;
- they have to be consistent over time;
- they have to be comparable between different geographic units;
- it pertains implicitly to multi-source statistics as well, because
o if we take comparability of statistics between different geographic units as a
determinant of coherence, it assumes that we are dealing with the issue of coherence
of multi-source statistical construct (it would make no sense binding the coherence of
a single-source statistical construct to its external comparability to other constructs);
o ‘combination and joint use of related data from different sources’ is only interpretable
with regard to coherence having multi-source statistics in the focus.
Principle 14 provides the readers with several indicators of coherence and comparability:
1. Indicator 14.1: ‘Statistics are internally coherent and consistent (i.e. arithmetic and
accounting identities observed)’
This indicator seems to be loaded with tautology: an indicator of coherence is its internal
coherence. The document does not enlighten us about the meaning of internal coherence, so
we reach a conceptual dead end here.
The QAF, however, provides us with some hints on the methods, namely, at
institutional level it suggests monitoring coherence in a ‘systematic way (…) with consistency
between preliminary and final data (i.e. continuity), between microdata and aggregated data,
between annual, quarterly and monthly data, between statistics and National Accounts and
also with non-deterministic consistency (e.g. consistency between economic growth and
employment, also called plausibility).’ (ESS 2015: 32.) At product/process level, it expresses a
demand that procedures have to be established in NSIs that ‘ensure combination of outputs
from complementary sources’ (ESS 2015: 32.). These hints hardly deserve to be called
methods, though, for we get no actual guidance on the measurement methodology. The
‘methods’ presented in the QAF offer some clarification regarding Indicator 14.1, indeed, but
the methodology to be used for reaching the goals set is left obscure.
We should note that the QAF suggestions assume a multi-source view of internal
coherence and consistency, especially the product/process level suggestions.
2. Indicator 14.2: ‘Statistics are comparable over a reasonable period of time’
ESSnet KOMUSO Work Package 3 (SGA-2)
[6]
This indicator speaks about comparability, which might or might not be an actual indicator of
coherence, given that the principle pertains to coherence and to comparability at the same
time, giving us no explanation whatsoever on their assumed relationship. Hence, Indicator 14.2
might either be an indicator of coherence as much as comparability, or only an indicator of
comparability that has nothing to do with coherence. The latter, obviously, seems the more
plausible, but assuming the (obscure) relationship of the two phenomena, comparability might
affect coherence somehow. We know nothing about how and why comparability affects
coherence, though, from this Code of Practice.
Vagueness is also built in the ‘reasonable period of time’. We do not get any concrete
definition of how to decide what is to be counted ‘reasonable’ and what is not. If we take it as
a positive constraint in the above-described sense, this constraint is not appropriately defined,
leaving us in darkness as for how long comparability in time is required for satisfying a certain
degree of coherence.
According to the QAF, comparability is linked to changes in methods and concepts
(classifications, definitions and target population). Although QAF expresses here a
requirement of measuring the impact of such changes, no measurement methodology is
presented.
3. Indicator 14.3: ‘Statistics are compiled on the basis of common standards with respect to
scope, definitions, units and classifications in the different surveys and sources.’
This indicator seems to be the most accurate one. It leaves no room for misunderstanding.
QAF suggests periodic assessments of compliance with standards, and explanation of the
deviations, without concrete methodological pointers on the assessment, though.
The key phrase of the indicator is ‘common standards’. How to measure the
‘commonness’ of these standards is not evident, though. Can we properly measure, for
instance, the difference between definitions? We might describe their differences, thus also
satisfying the QAF requirement of explaining the deviations, but measurement is another
story. If the definitions of two different sources refer exactly to the same thing, only their
wording is different, we can say that they are coherent with each other. But it is harder to give
an accurate measurement of actual differences in the individual pairs of definitions or in the
sets of definitions of the sources. A qualitative analysis of them can point out the differences,
and might even enable categorising them into predefined coherence categories. But
quantitative analysis of definitional coherence seems to be an illusion. By means of
computational linguistics, however, we might be able to count a percent of how much the
definitions or sets of definitions of multiple sources overlap each other, but it is a highly
complex and still developing branch of science yet way beyond the usual routines of
ESSnet KOMUSO Work Package 3 (SGA-2)
[7]
statisticians or NSIs. Were it possible, we could call this solution a micro-level assessment of
the commonness of standards. At the macro-level, we could use the rather crude
measurement method of dividing the number of the differing definitions by the number of the
matching definitions in case of two or more sources or of one or more sources and a set of
standards. This solution seems to be satisfying the QAF requirement of assessing the
compliance with standards, but it offers low resolution without micro-level (e.g. pairs of
definition-level) details.
We should note, by the way, that this indicator is interpretable regarding multi-source
statistics as well as single-source statistics (in the case of assessing a statistics’ compliance with
set standards).
4. Indicator 14.4: ‘Statistics from the different sources and of different periodicity are
compared and reconciled.’
This indicator pertains to multi-source statistics. By the way, it refers to the internal coherence
of multi-source statistics on a certain level of internality, for it makes no sense that the
coherence of the individual sources or periodicities of the sources would be determined or
characterised by them being compared to and reconciled with any other individual source or
periodicity of the source. Indicator 14.4 does not pose a requirement of measurement of any
kind, the QAF does neither say anything on how to, if possible, measure the level/degree/etc.
of comparability.
5. Indicator 14.5: ‘Cross-national comparability of the data is ensured within the European
Statistical System through periodical exchanges between the European Statistical System
and other statistical systems. Methodological studies are carried out in close co-operation
between the Member States and Eurostat.’
It requires no further explanation to acknowledge the multi-source-character of this indicator,
too.
The QAF’s explanation on this indicator lists several requirements, such as
assessments of comparability (note the slight contradiction with Indicator 14.4 which does not
expressly requires any measurement of comparability) and analysis of asymmetries on mirror
statistics between Member States. Sadly, appropriate methodological suggestions are lacking
here, too.
2.2 The distinction of ‘intrastatistical’ and ‘interstatistical’ coherence
Owing to the fact that a number of papers in the relevant literature tend to deal with single-source
coherence together with multi-source coherence, it seems reasonable to make a distinction between
intrastatistical and interstatistical coherence. The List of Quality Groups and Indicators Identified for
Administrative Data Sources – Deliverable 4.1 of the BLUE-ETS Project (Daas et al. 2011) – follows the
same logic by decomposing coherence into ‘within coherence’ and ‘between coherence’. We still
ESSnet KOMUSO Work Package 3 (SGA-2)
[8]
consider our terms functional, not only for their more appropriate wording in comparison with Daas
et al.’s (2011) solution, but because of the slightly different ‘conceptual coverage’ of the pairs of notion
as well.
By intrastatistical coherence we mean the internal coherence of a given statistical construct. It
can either be single-source or multi-source, as long as the coherence we refer to is limited to the
comparability, consistency, harmony, etc. among the constitutive elements of the whole construct,
that is, variables, definitions as well as individual single-source source statistics that the multi-source
construct is composed of. ‘Within coherence’ is a narrower concept, covering only ‘the internal
consistency of the variables in the source, e.g. comparison of the variables at the record level’ (Daas
et al. 2011: 11.). The document treats ‘within coherence’ as something that practically belongs to the
domain of accuracy at the input level. Li-Chun Zhang’s new approach to coherence measures (2017)
and Jeroen Pannekoek’s additional remarks (2017) on this novel approach seem to assert that not even
‘within coherence’ (or intrastatistical coherence in a narrow sense) should simply be identified with
accuracy.
By interstatistical coherence we mean the coherence among different statistical constructs,
therefore it is to be interpreted exclusively as a feature of multi-source statistics. It thus becomes
reasonable to speak of interstatistical coherence of a single-source statistical construct, but only in its
relationship with at least one other source. Interstatistical coherence and its extent and measure
always depends on the other source(s) we choose for comparison and/or combination with a given
statistical construct. ‘Between coherence’ has a slightly different meaning than interstatistical
coherence, for it focuses on ‘the comparability between the data in different sources or in separately
delivered parts of a source’ (Daas et al. 2011: 11.). We should note, however, that this BLUE-ETS
document keeps solely ‘between coherence’ in the coherence dimension (given that it treats ‘within
coherence’ as belonging to the accuracy dimension), but instantly renames it to integrability. That is,
coherence would only be about how well certain source(s) can be integrated. However, as already
noted above, our intuition warns us, that decomposing the notion of coherence and placing the
decomposed parts into dimensions other than coherence, thus getting rid of the problem coherence
poses, is not an actual solution in itself. Therefore, the broader approach that the distinction of
interstatistical and intrastatistical coherence offers (in comparison with the coherence-decomposing
‘within/between coherence’ distinction) is of better use in a less ‘effort-saving’ endeavour unto a
sound conceptualisation and operationalisation of coherence, as it were.
2.3 The ‘earlier’ works
The comparability-coherence issue might be solved by the definitional distinction of Eurostat’s
document on the definition of quality in statistics (2003). According to this document, ‘measuring the
impact of differences in applied statistical concepts and measurement tools/procedures’ (Eurostat
2003: 3.) as well as comparability over time, between geographical areas and between domains
belongs to the quality dimension of comparability. Coherence seems to be related to comparability, so
to say, coherence ‘leans on’ the comparability parameter of given statistics. ‘Coherence of statistics is
therefore their adequacy to be reliably combined in different ways and for various uses.’ (Eurostat
2003: 3.). The adequacy of the reliability for combination seems to be originated from how
‘comparable’ the statistics to be combined are. It is, however, only interpretable regarding multi-
source statistical constructs. The document tells us a few words on single-source coherence, too:
‘When originating from a single source, statistics are normally coherent in the sense that elementary
ESSnet KOMUSO Work Package 3 (SGA-2)
[9]
results derived from the concerned survey can be reliably combined in numerous ways to produce
more complex results.’ (Eurostat 2003: 4.). Coherence in this sense refers to the extent complex results
can be reliably extracted from a given dataset. Now we can see what comparability is, and that
coherence is not comparability, however, it is closely related to it. This concept assumes that if we wish
to measure coherence, we should first measure comparability, and the reliability of the results.
Obviously, the latter introduces further problems, for reliability is not only a by-product of coherence,
but it is also related to accuracy, for instance, as Principle 12 of ESS CoP (2011) assumes.
Coherence is also bound to the similarity of approaches, classifications, and methodological
standards used by the different statistics to be combined (Eurostat 2003: 4.). Further problems arise if
we take into account the fact that the adequacy of statistics to be reliably combined reminds us
suspiciously of a different quality dimension, namely, integrability. As shown in the next paragraph,
there has been an attempt to decompose coherence, and simply rename one of the decomposed parts
to integrability, and the other to accuracy. Our intuition, though, still warns us not to oversimplify the
matter. We have to avoid conflating the notions of coherence, integrability and accuracy as much as
we shouldn’t conflate coherence with comparability, either. Differentiation enables us to carry out
better, more detailed, higher resolution quality assessments that obviously help us to attain a higher
level in overall quality of producing either multi-, or single-source statistics. If the differentiation of
these dimensions is thus to be taken as necessary, our goal has to be to create conceptualisations of
the quality dimensions in question that enable proper identification and accurate distinction leaving
no room for overlaps of the phenomena they refer to, together with the explanation of their
relationship and obvious connections. For example, as we concluded that coherence ‘leans on’
comparability, integrability may be viewed as leaning on coherence. A future endeavour to an
appropriate conceptualisation of the integrability quality dimension must take these characteristics
and connections to coherence and comparability into account. This matter is way beyond the scope of
the present paper, though, so we leave it as an ‘outlook’, and do not discuss further.
In the Handbook on Data Quality Assessment Methods and Tools (Ehling & Körner 2007), the
authors use a reduced version of Eurostat’s (2003) above-mentioned definition. They, however,
excluded the passage on single-source coherence. Since we discussed the original version earlier, we
see no reason to discuss this one further, except for a remark that the coherence notion of this
handbook thus pertains only to multi-source statistics, i.e. interstatistical coherence. The suggestion
for measuring it is a macro-level solution. According to the handbook, the rate of coherence is the
‘[r]ate of statistics that satisfies the requirements for the main secondary use’ (Ehling & Körner 2007:
17.). The handbook also warns us that some of the quality components, such as coherence (and
accuracy), are ‘difficult to assess (…), reliable assessment requires a certain degree of expert
knowledge’ (Ehling & Körner 2007: 52.). HCSO’s document Seasonal Adjustment Methods and Practices
(2007) uses the same reduced definition of coherence as Ehling & Körner’s handbook (2007), with a
slight extension mentioning the differences in methodologies of statistics with both infra-annual and
annual frequencies. Its suggestion for measuring coherence is only applicable for single-source
seasonally adjusted data, so we do not discuss it here.
A slightly differently approach of conceptualising coherence can be read in Statistics Canada’s
Quality Guidelines (2009: 7), which defines coherence of statistical information that
reflects the degree to which it can be successfully brought together with other
statistical information within a broad analytic framework and over time. The use of
standard concepts, classifications and target populations promotes coherence, as
does the use of common methodology across surveys. Coherence does not
necessarily imply full numerical consistency.
ESSnet KOMUSO Work Package 3 (SGA-2)
[10]
This coherence concept pertains also to interstatistical (multi-source) coherence. Aside from the
differences in wording, this approach brings in only two new aspects compared to the previously
discussed approaches: standard target populations are important factors of coherence and full
numerical consistency is not a necessary prerequisite for coherence. The Canadian guidelines
emphasise in accordance with Ehling & Körner’s handbook (2007) that assessment of coherence is not
obvious. For evaluating coherence, it suggests two ways:
1. External checking in relation to other data sources
2. Internal checking for example ‘by calculating ratios that are known to be within certain limits
(male-female ratios, average values of properties, etc).’ (Statistics Canada 2009: 72.)
As for the external checking of coherence, which would be interesting from the aspect of multi-source
statistics, the guidelines contain only rather obscure hints, such as:
- ‘Review reasons for differences in results from previous iterations and try to quantify them’
(Statistics Canada 2009: 73. Italics added.).
- ‘Review the survey results and those of external sources; address discrepancies’ (Statistics
Canada 2009: 73.).
Even though the guidelines provide an example for how should we try quantifying differences in
results, it does not help us with counting a certain quantitative value of coherence itself. On how
should we address discrepancies we get no pointers.
The definition of coherence of the Australian Bureau of Statistics’ The Data Quality Framework
(2009) also links it to internal consistency and comparability. This definition is one of the longer ones,
and it implies single-source (intrastatistical, internal) as well as multi-source (interstatistical)
coherence. The unique feature of this approach is the emphasis on conceptual and methodological
(i.e. collection, processing, or estimation methodology) consistency instead of numerical consistency.
The ABS offers several aspects for the assessment of coherence, however, without any further
elaboration. These include the following:
- ‘Is it possible to compile a consistent time series of a particular data item of interest over a
number of years?’ – This is a so-called ‘dummy’ question in its present form, that is, we have
only two mutually exclusive answer options (Yes/No).
- ‘To what extent can a user meaningfully compare several data items within this collection?’ –
Were it backed with a sufficiently explained assessment methodology on calculating the
‘extent’ of the ‘meaningful comparability’ of data items, this question would enable more
detailed measurement of coherence. Unfortunately – but not surprisingly – such methodology
is missing.
- ‘Could any natural disasters or significant economic events have influenced the data since the
previous release?’ – A dummy question again, which is a suggestion on how to incorporate
relevant ‘real world’ events in the assessment of coherence, another unique feature of the
ABS approach to coherence.
- ‘Have these data been confronted with other data sources, and are the messages consistent
from all data sources?’ – In this form it is a dummy question, but it is much more of a
requirement of ‘confronting’ (comparing) data(sets) with other sources, than a real question,
i.e. it expresses the need for interstatistical measurement of coherence. As for the
measurement/assessment methodology, the reader is left without any concrete clue again.
One of the lengthiest description of coherence can be found in Anders and Britt Wallgren’s book
Register-Based Statistics (2007). It binds coherence to consistency, that is, high level of coherence
means consistency regarding populations and definitions, variables, and estimates. The Wallgrens

ESSnet KOMUSO Work Package 3 (SGA-2)
[11]
define coherence simply as the ‘estimates from different surveys (…) used together. (…) Consistent
surveys give coherent estimates.’ (Wallgren & Wallgren 2007: 219.)
2.4 The ‘newer’ works and the ESS Handbook for Quality Reports
The Quality Policy of HCSO (2014) deals with comparability and coherence (as well as some of the other
sources) together. Its definition is the following: ‘statistical data are to be in line with other related
data in logical, economic and social aspects and must be comparable in time, across geographical areas
and statistical domains’ (HCSO 2014: 2.). The unique element of this definition is that it expresses the
logical harmony of related statistical data instead of numerical harmony/consistency. Statistics Canada
(2009) and ABS (2009) also rejects identifying coherence with full numerical consistency, but they do
not offer such a good substitute as HCSO does with logical consistency. We can deduce from this, as a
small addition to the above-discussed issues, that not even the methodology used to produce statistics
from different sources should necessarily be identical for satisfying the coherence requirement. If they
are understandable in the context of each other and can be derived from one another (i.e. logically
consistent), they should be treated as coherent conceptual constructs of a given statistical construct.
The same holds for the definitions and concepts as well. If there are changes in the concepts and/or
methodology over a period of time, then a full documentation must be made available. The coherence
between the former and the newer concepts/methodologies might be made measurable in the future
by the elaboration of a proper methodology if an appropriate documentation and correspondence
table is at hand.
Agafiţei et al. (2015) put forward an approach assumed to be suitable for the purposes of
measuring quality for multisource statistics. In their paper, they discuss the possible strategies, such
as measurement of the input and process quality, and measurement of the output quality. Although
the authors do not deem the measurement of input and process quality impossible, they suggest that
measuring output quality is more feasible. Focusing on the process is not enough. As for coherence,
the article states that it ‘incorporates the two related ESS concepts of coherence and comparability’
(Agafiţei et al. 2015: 206.). Integrating multiple sources affects how to measure coherence and
comparability: it requires ‘incorporating the effect of sources, methods and the integration approach’
(Agafiţei et al. 2015: 206.). Complexity of the production process highly impacts the measurement of
coherence and comparability. Although the authors do not provide us with suggestions on the
assessment of coherence, they do so in the case of comparability: it ‘can be to a large extent reduced
to structural error generated by statistical bias. Possible outliers/breaks in data sets can be detected
based upon existing methods.’ (Agafiţei et al. 2015: 207.) We can argue against this suggestion, though,
for neither comparability, nor coherence may be reduced to structural differences of given datasets.
The related table shows how much confusion such approach to measurement of comparability or
coherence are hindered by. The measurement of
- bias and confidence range of the target population (linkage and determination of the target
population – affected quality dimensions are accuracy and comparability);
- of bias, variance error and qualitative assessment (concepts and definitions – affected quality
dimensions are relevance, accuracy and comparability);
- and of bias and variance error (classifications – affected quality dimensions are relevance,
accuracy and comparability)
ESSnet KOMUSO Work Package 3 (SGA-2)
[12]
is not broken down to any concrete measurement method for the single dimensions. The only
information provided is that the results of such measurement tells us something about these
dimensions, but we do not know to what extent variance error stands for the conceptual and
definitional incoherence, for example, or what kind of qualitative assessment should it be
accompanied with. We get some suggestions though on how to get a more or less stable degree of the
- variance error component: estimation of the overall process variance give its upper bound,
- of the possible bias: reported breaks in series (although it has some drawbacks, e.g. the
interpretation of a break might not be straightforward),
- of the changes in sources and methods: when a double production system is kept for a certain
period, the quantitative impact can be estimated with the help of extrapolation.
Outliers can also be a result of ‘hidden’ comparability issues, but it is not always the case, for extreme
values are more likely in smaller countries, according to the paper. To sum up, this paper shows some
directions indeed as offered in its title, but these directions do not include any concrete method for
measuring coherence (which is relatively neglected in the article) or at least comparability (which the
paper treats as being essentially linked to coherence).
UNECE (2017: 11.) does not define the notion of coherence, but provides us with an indicator
of coherence and comparability: the ‘[e]xpected length of comparable time series.’ In a note to this
indicator, two distinct elements can be identified as important factors of coherence and comparability:
changes in the definitions or in the methodology. We should note that this document also deals with
coherence and comparability linked together despite its ‘succinctness’ on the matter.
2.4.1 A source to be discussed separately - the ESS Handbook for Quality Reports
Probably the most important document on coherence (and, by the way, on all the other quality
dimensions) is Eurostat’s ESS Handbook for Quality Reports (2015) (henceforth: HQR), which provides
us with by far the most elaborated approach to the quality dimension of coherence. It also presents a
simple yet elegant solution for the aforementioned problem of the differentiation of coherence and
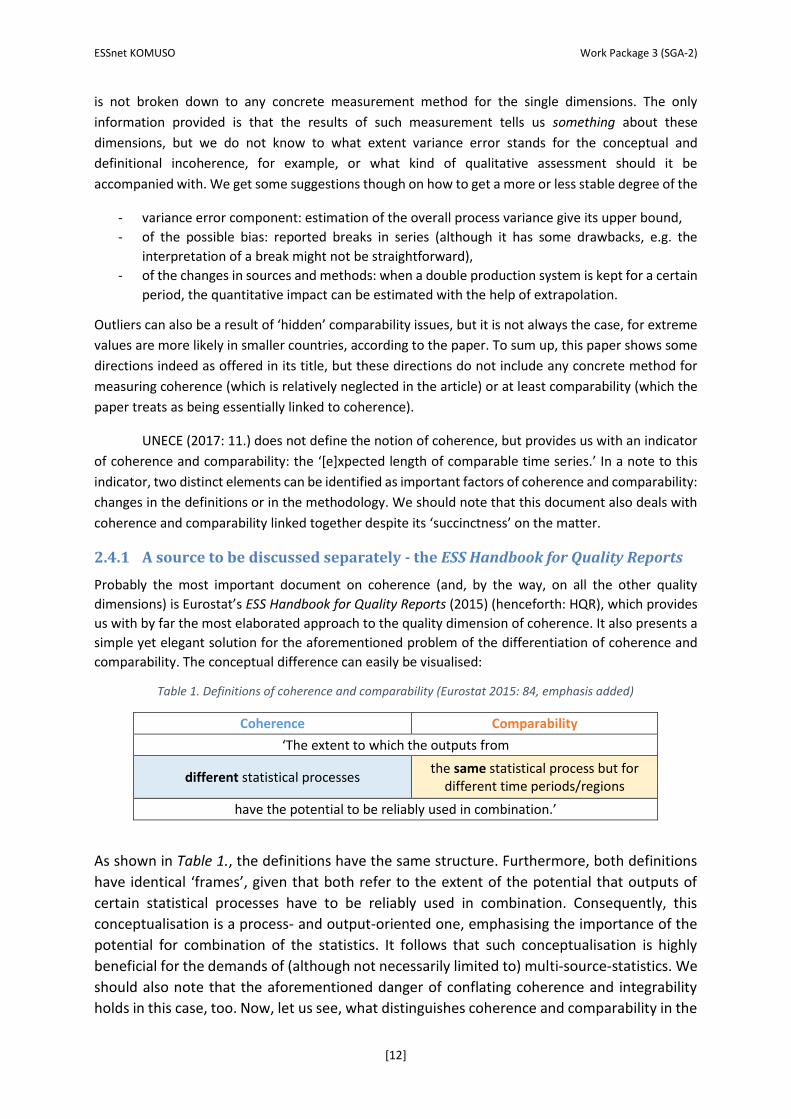
comparability. The conceptual difference can easily be visualised:
Table 1. Definitions of coherence and comparability (Eurostat 2015: 84, emphasis added)
Coherence Comparability
‘The extent to which the outputs from
different statistical processes the same statistical process but for
different time periods/regions
have the potential to be reliably used in combination.’
As shown in Table 1., the definitions have the same structure. Furthermore, both definitions
have identical ‘frames’, given that both refer to the extent of the potential that outputs of
certain statistical processes have to be reliably used in combination. Consequently, this
conceptualisation is a process- and output-oriented one, emphasising the importance of the
potential for combination of the statistics. It follows that such conceptualisation is highly
beneficial for the demands of (although not necessarily limited to) multi-source-statistics. We
should also note that the aforementioned danger of conflating coherence and integrability
holds in this case, too. Now, let us see, what distinguishes coherence and comparability in the

ESSnet KOMUSO Work Package 3 (SGA-2)
[13]
HQR’s concept. In the case of coherence, this extent of potential for reliable combination is to
be understood in reference with different statistical processes. In the case of comparability,
by contrast, it refers to the same statistical process over time or among regions.
The HQR explains the main reasons, too, for lack of coherence and comparability thus
conceived. These reasons are ordered in two main categories: differences in concepts and
differences in methods. Although these can be familiar from many of the other literature
discussed above, not one of them provides us with such an exhaustive and organised account
on the matter as the HQR does. Let us see the specifics. The reasons for lack of
coherence/comparability may possibly be
1. differences in concepts:
a. target population differences – differences in units and coverage;
b. differences in geographical coverage;
c. differences in reference period;
d. differences in data item definitions and classifications;
and/or
2. differences in methods:
a. differences in frame population;
b. differences in source(s) of data and sample design;
c. (differences in data collection, capture, and editing methods – if biases due to
non-response errors are reported under the accuracy dimension, then it is
unnecessary to be reported under the coherence/comparability dimension;)
d. differences in imputation and estimation methods.
Another unique feature of the HQR is its addressing the problem of the confusion
about the distinction of coherence/comparability and accuracy. Even though it seems to fail
to accomplish the task by resorting to an unsatisfying solution (by containing a major
contradiction), we may consider the very attempt alone a great advantage compared to the
other literature. The HQR conceives (and seeks to measure, by the way)
coherence/comparability as ‘descriptive (design) metadata (i.e. concepts and methods) about
the processes, whereas accuracy is measured and assessed in terms of operational metadata
(sampling rates, data capture error rates, etc.) associated with the actual operations that
produced the data’ (Eurostat 2015: 88-89, italics in the original). Consequently, on the one
hand, coherence/comparability is about the logical consistency of the processes. The question
arises, should the assessment of coherence/comparability be qualitative-oriented, for a
properly expressive numerical assessment of the degree of logical (in)consistency is hard to
imagine? On the other hand, according to the HQR, accuracy is about the actual errors in the
processes, which can be accurately measured by quantitative means. This distinction enables
the assumption that accuracy-related quality issues would exclusively be responsible for the
errors, and coherence would not be involved at all. Such conclusion would not be correct,
though, as the HQR demonstrates it, seemingly somewhat self-contradictorily. The
‘differences between preliminary, revised and final estimates generated by the same basic
process relate to accuracy problems rather than coherence’ (Eurostat 2015: 89.), therefore if
the error profiles are included in the description of accuracy, no further reference is necessary

ESSnet KOMUSO Work Package 3 (SGA-2)
[14]
to them under coherence/comparability. Our above assumption seems to be correct at this
point, for it seems errors fall within the domain of accuracy quality dimension. But the HQR
adds the fact that error profiles are rarely fully and precisely known, therefore ‘errors in the
estimates may be confounded with the effects of lack of coherence/comparability’ (Eurostat
2015: 89.). Thus, (lack of) coherence/comparability still have possible consequences on these
errors. The HQR concludes the matter with a clarification of the relationship of the
phenomena. Coherence/comparability in this concept appears as a ‘prerequisite for numerical
consistency’ (Eurostat 2015: 89, italics added) which assumption is in line with the relevant
statements in Statistics Canada’s above-discussed Guidelines (2009) and ABS’s Framework
(2009), and ‘[t]he degree of coherence/comparability determines the potential for numerical
consistency’ (Eurostat 2015: 89.). But even though coherence/comparability determines the
potential for numerical consistency, it does not guarantee numerical consistency, owing to
the fact that it also depends on errors – namely, on accuracy. It follows that either accuracy
and coherence/comparability exist in a sensitive (although not full!) interdependence of each
other, or accuracy is not exclusively responsible for the errors, which conclusion contradicts
the previous assumptions of the HQR, and is left without further clarification in this text. This
somewhat contradictory result notwithstanding, the authors of the HQR did a great deal of
clarifying the relationship of accuracy and coherence/comparability. Their interrelated nature
seems to be the most likely, which makes their accurate distinction in their measurement
methodology a highly challenging task. No wonder the HQR does not offer us any specific,
detailed measurement method for coherence/comparability and is similar in this sense to the
other literature discussed in the present paper…
There are, though, several assessment suggestions for lack of coherence/comparability
to be found on the subsequent pages of the HQR. Let us briefly address them, noting
beforehand that we do not get accurate, specified descriptions on the method of
measurement. Generally, the assessment should consist
- a clear explanation of the changes in concepts/methods:
o the effects of these changes should be quantified, at least approximately – the
reader is not informed about how to quantify them, or what degree of
(in)precision would be acceptable;
o as a minimum requirement, the reason and the order of magnitude of each
source of incoherence/incomparability should be stated – it amounts to their
descriptive analysis, which can hardly be called assessment;
- changes in legislations and deviations from ESS legislations and standards that could
cause incoherence/incomparability should also be reported – it seems to necessitate
descriptive analysis again, for no reference on a measurement method is provided
here, either, that would enable a qualitative or quantitative assessment of the degree
such changes and deviations affect coherence/comparability.
The general methodology provided is thus somewhat vague:
1. step: systematic assessment of possible reasons for incoherence/incomparability
based on key metadata elements
ESSnet KOMUSO Work Package 3 (SGA-2)
[15]
We do not get any pointers on the method of the calculation, only an obscure hint that
says ‘[l]ooking at the data (…) may provide some indication of the likely magnitude’
(Eurostat 2015: 90, italics added). Neither how should we ‘look at’ the data, nor how
and what indicates ‘the likely magnitude’ is particularised further, nor is the method
for the quantification of this magnitude.
2. step: deduce the likely effect of each difference in metadata on the statistical output
Again, no reference on a measurement methodology of any kind.
3. Aggregate and summarise „in some way” the total possible effect.
Same as above, the reader is left without methodological explanations, only an
obscure hint is provided that requires us to ‘form an impression on the degree of (lack
of) coherence/comparability’ (Eurostat 2015: 90, italics added). We do not deem it
necessary to stress the vagueness of the instruction further.
The HQR’s methodology broken down to indicators is the following (we focus on the
methodological considerations related to coherence only, for the measurement of
comparability falls out of the scope of the present paper):
1. Coherence: cross-domain (similar to geographical comparability)
a. pair-wise comparisons of the metadata across domains;
b. comparison of metadata for the domain with a standard or best practice;
c. summarising the differences with a binary code scoring system: difference
/ no difference;
d. assigning a weighting to the key metadata elements according to its
potential effect on coherence;
e. computing a weighted score across all metadata elements.
The method provided for the assessment of this quality indicator is a refreshing
example of a more developed, more specified one compared to the others. This
measurement method of cross-domain coherence is a refined version of the
aforementioned macro-level assessment, which still does not enable a high
resolution, micro-level (i.e. to what the pairs of metadata actually refer to and to
what extent they differ) assessment. We should note that this is a mixed method
suggestion for measurement, given that the weighting system is based on a
subjective/qualitative pre-assessment of the potential effect of the key metadata
elements on coherence. Since we have no better alternative at hand yet, such a
refined macro-level method for assessing differences in metadata as this may be
theoretically recommended. Theoretically, for a sound standard qualitative
methodology for the assessment of the potential effect of these metadata on
coherence is still lacking (and not provided in the HQR, either) – the weighting
system cannot be reliably created in the absence of it.
2. Coherence: comparison of annual and sub-annual estimates
If the differences cannot be fully explained by accuracy issues, then assessment of
the possible causes is required – how to carry out this assessment, the reader is
offered no details whatsoever. The expression ‘likely magnitude’ appears again
regarding the assessment of differences caused by incoherence, which is a clear
sign of the uncertainty as to how to accurately measure its degree.
ESSnet KOMUSO Work Package 3 (SGA-2)
[16]
3. Coherence: National Accounts
Feedbacks from the National Accounts on incoherence and the adjustments
necessary for balancing the accounts may be excellent indicators of the accuracy
and/or the coherence of the statistical outputs, but the problem is again this
‘and/or’. We do not know how to decompose these feedbacks into actual accuracy-
and coherence-related measures.
4. Coherence: internal
The HQR means by full internal coherence that all arithmetic or accounting
identities are observed. The text does not necessitate a quantitative assessment of
internal coherence, it settles for a brief explanation in the quality report of the
reasons of internal incoherence. Consequently, we get no measurement method
for this type of (in)coherence.
After this point, the HQR turns its attention to comparability. In spite fact that it mostly lacks
clear methodological references, the insightful framework and suggestions HQR provides may
be a good starting point towards an actual (in)coherence assessment methodology.
3 Final remarks
As a conclusion, we have found that the definitions on coherence usually pertain to interstatistical (i.e.
multi-source only) coherence. Considerations of intrastatistical coherence are also applicable to
coherence of multi-source statistics, for if we take a multi-source statistical construct as a single
statistical construct, its internal coherence is not only determined by the interstatistical coherence of
its constituents, but also by the intrastatistical parameters of these constituent elements. By the way,
interstatistical coherence of the individual sources are to be taken as intrastatistical, too, from the
viewpoint of the whole multi-source statistical construct.
Generally speaking, most descriptions of coherence are hindered by conceptual
vagueness/obscurity and/or contradictions, not to mention the conflating of different concepts of
accuracy, integrability, comparability, and coherence. One of the most elaborated concept is HQR’s
definition, but although it solves the problem of distinguishing coherence and comparability in an
elegant way, the danger of conceptual confusion (with accuracy and integrability) holds for this
approach as well.
To sum up, before we could define any measurable indicators for multi-source coherence, we
cannot avoid the hard task of an appropriate conceptualisation2 that could serve as a ground for the
development of either qualitative or quantitative measurement methods.
Li-Chun Zhang’s approach (2017) and Jeroen Pannekoek’s remarks (2017) on this approach
might be a good starting point for measuring the incoherence of the initial estimations later adjusted
for coherence, or at least measuring the extent of our adjustments in order to reach coherence. The
measurement of incoherence of the initial estimates or of our adjusted estimates with reality seems
impossible, so we still need to have a firm conceptual understanding on the nature of coherence we
implicitly strive for in the process of adjusting for coherence in order to understand what our numbers
2 The related regulations and guidelines will have to be updated once a proper conceptualisation of coherence isready.
ESSnet KOMUSO Work Package 3 (SGA-2)
[17]
would tell us about. If it is impossible, then we should maybe gather more knowledge on the ‘implicit
coherentiation’ we do while adjusting for coherent estimates.
The inter-disciplinary approach of Danutė Krapavickaitė’s A Glance to Coherence (2018) seems
highly adequate for the challenge that the measurement of coherence of multi-source statistics poses.
The outlook on and use of results and practices of other disciplines regarding coherence is highly
appreciated, for we surmise that the phenomenon which the notion ‘coherence’ refers to has to be
essentially similar, no matter what the scientific domain or purpose is. This remark notwithstanding,
elaboration or decision of an ultimate measurement method, or reconciliation of the competing
methodological assumptions fall out of the scope of present article.
4 References
ABS [Australian Bureau of Statistics] (2009): ABS Data Quality Framework, May 2009.
http://www.abs.gov.au/ausstats/[email protected]/mf/1520.0 Accessed on 13. 12. 2017.
Agafiţei, M., Gras, F., Kloek, W., Reis, F. & Vâju, S. (2015): Measuring Output Quality for Multisource
Statistics in Official Statistics: Some Directions. Statistical Journal of the IAOS 31. pp. 203-211.
https://pdfs.semanticscholar.org/8d3c/a494888028afda4f5fb86d8a7b81a3f2337c.pdf
Accessed on 13. 12. 2017.
Daas, P., Ossen, S., Tennekes, M., Zhang, L-C., Hendriks, C., Haugen, K. F., … Wallgren, B. (2011): BLUE-
Enterprise and Trade Statistics Deliverable 4.1: List of Quality Groups and Indicators Identified
for Administrative Data Sources. BLUE-ETS Project, European Commission European Research
Area, Seventh Framework Programme.
https://www.blue-ets.istat.it/fileadmin/deliverables/Deliverable4.1.pdf Accessed on 13. 12.
2017.
Ehling, M. & Körner, T. (Eds.) (2007): Handbook on Data Quality Assessment Methods and Tools.
Wiesbaden: Eurostat.
https://unstats.un.org/unsd/dnss/docs-nqaf/Eurostat-
HANDBOOK%20ON%20DATA%20QUALITY%20ASSESSMENT%20METHODS%20AND%20TOOLS
%20%20I.pdf Accessed on 29. 11. 2017.
European Statistical System (2011): European Statistics Code of Practice. European Statistical System
Committee.
http://ec.europa.eu/eurostat/documents/3859598/5921861/KS-32-11-955-EN.PDF/5fa1ebc6-
90bb-43fa-888f-dde032471e15 Accessed on 29. 11. 2017.
European Statistical System (2015): Quality Assurance Framework of the European Statistical System.
European Statistical System.
http://ec.europa.eu/eurostat/documents/64157/4392716/ESS-QAF-V1-2final.pdf/bbf5970c-
1adf-46c8-afc3-58ce177a0646 Accessed on 29. 11. 2017.
Eurostat (2003): Working Group "Assessment of quality in statistics" Sixth meeting: Item 4.2:
Methodological Documents – Definition of Quality in Statistics.

ESSnet KOMUSO Work Package 3 (SGA-2)
[18]
http://ec.europa.eu/eurostat/documents/64157/4373735/02-ESS-quality-definition.pdf
Accessed on 29. 11. 2017.
Eurostat (2015): ESS Handbook for Quality Reports. 2014 edition. Luxembourg: Publications Office of
the European Union.
http://ec.europa.eu/eurostat/documents/3859598/6651706/KS-GQ-15-003-EN-N.pdf
Accessed on 13. 01. 2018.
Hungarian Central Statistical Office (2014): Quality Policy of HCSO. Hungarian Central Statistical Office.
https://www.ksh.hu/docs/bemutatkozas/eng/minpol_web_eng.pdf Accessed on 13. 12. 2017.
Krapavickaitė, D. (2018): A Glance to Coherence. Manuscript, internal document within the project
group Komuso.
Pannekoek, J. (2017): An Approach to Coherence Measures? A Few Additional Remarks. Manuscript,
internal document within the project group Komuso.
Regulation (EC) No 223/2009 of the European Parliament and of the Council. Official Journal of the
European Union Vol. 52. 31. 03. 2009. L87 pp. 164-173.
http://eur-lex.europa.eu/legal-content/EN/TXT/PDF/?uri=CELEX:32009R0223&from=EN
Accessed on 01. 02. 2018.
Statistics Canada (2009): Statistics Canada Quality Guidelines. Fifth Edition. Ottawa: Statistics Canada.
https://unstats.un.org/unsd/dnss/docs-nqaf/Canada-12-539-x2009001-eng.pdf Accessed on
29. 11. 2017.
Thagard, P. & Verbeurgt, K. (1998): Coherence as Constraint Satisfaction. Cognitive Science Vol. 22. No.
1. pp. 1-24.
http://onlinelibrary.wiley.com/doi/10.1207/s15516709cog2201_1/epdf Accessed on 29. 11.
2017.
Thagard, P., Eliasmith, C., Rusnock, P. & Shelley, C. (2002): Knowledge and Coherence. In Elio, R. (ed.):
Common Sense, Reasoning, and Rationality. New York, NY: Oxford University Press. pp. 104-131.
http://cogsci.uwaterloo.ca/Articles/Pages/epistemic.html Accessed on 29. 11. 2017.
UNECE (2017): Quality Indicators for the Generic Statistical Business Process Model (GSBPM) - For
Statistics Derived from Surveys. United Nations Economic Commission for Europe.
https://statswiki.unece.org/download/attachments/114394087/Quality%20Indicators%20for%
20the%20GSBPM%20-
%20For%20Statistics%20derived%20from%20Surveys%20and%20Administrative%20Data%20S
ources_Final.pdf?version=1&modificationDate=1512635878810&api=v2. Accessed on 01. 02.
2018.
Wallgren, A. & Wallgren, B. (2007): Register-Based Statistics. Administrative Data for Statistical
Purposes. Chichester: John Wiley & Sons.
Zhang, L-C. (2017): An Approach to Coherence Measures? Manuscript, internal document within the
project group Komuso.