
ESSENTIALS OF FULL - COST ACCOUNTING · COST ACCOUNTING LEARNING OBJECTIVES Upon completing this...
62
CHAPTER 1 ESSENTIALS OF FULL- COST ACCOUNTING LEARNING OBJECTIVES Upon completing this chapter, you should know about The potential uses of full-cost information The relationship between full-cost accounting and the economist’s three factors of production: land, labor, and capital Concepts such as cost object, cost center, direct and indirect costs, overhead, and cost allocation methods The distinction between mission centers and service centers Alternative ways to allocate service costs into mission centers so as to determine each mission center’s full cost ■ ■ ■ ■ ■ COPYRIGHTED MATERIAL
Transcript of ESSENTIALS OF FULL - COST ACCOUNTING · COST ACCOUNTING LEARNING OBJECTIVES Upon completing this...
CHAPTER
1 ESSENTIALS OF FULL - COST ACCOUNTING
LEARNING OBJECTIVES Upon completing this chapter, you should know about
The potential uses of full - cost information The relationship between full - cost accounting and the economist ’ s three factors of production: land, labor, and capital Concepts such as cost object, cost center, direct and indirect costs, overhead, and cost allocation methods The distinction between mission centers and service centers Alternative ways to allocate service costs into mission centers so as to determine each mission center ’ s full cost
■
■
■
■
■
c01.indd 1c01.indd 1 9/2/08 6:27:20 PM9/2/08 6:27:20 PM
COPYRIG
HTED M
ATERIAL
2 Management Accounting in Health Care Organizations
In almost all organizations, managers need to answer the question “ What did it cost? ” It is especially important for those health care organizations whose prices are set by insur-ers or other third - party payers, or when senior management needs to assess the fi nancial viability of different programs and services.
Answering the question is easy if we are discussing the purchase of inputs, such as supplies and labor, for the service - delivery process. Even calculating the full cost of a unit produced — whether it is a surgical procedure or fi fty minutes of psychotherapy — is relatively easy as long as the organization produces goods or services that are completely homogeneous. Complications arise when an organization provides multiple goods and services that require different kinds and amounts of resource inputs.
This chapter identifi es some of the key decisions made in a full - cost accounting sys-tem and discusses how they infl uence an answer to “ What did it cost? ” As you read the chapter, you should be aware that there is considerable disagreement among managers and accountants about whether full cost is an appropriate calculation. Some accountants believe (for reasons that you will see in the chapter) that any such computation is inher-ently distorted and therefore of little value for managerial decision - making. Neverthe-less, we will assume for the moment that senior management wishes to know the full cost of a particular good or service, and we will examine the choices it must make to arrive at that fi gure.
ORGANIZATION OF THE CHAPTER The chapter begins with a discussion of the uses of full - cost information. It then turns to the issues that must be considered in calculating full cost and links them to the econo-mist ’ s three factors of production: land, labor, and capital. Next, it outlines the decisions that must be made in calculating full costs, or the cost accounting methodology. The chapter concludes by looking at the effect of the cost accounting methodology on pricing an organization ’ s services.
USES OF COST INFORMATION Information on the cost of carrying out a particular endeavor is used for essentially three purposes: pricing decisions, profi tability assessments, and comparative analyses. Most managers use cost information for one or all of these purposes at different times and under varying decision - making scenarios.
Pricing Decisions Cost information is not the only information that management uses in setting prices, but it is an important ingredient. In negotiating a contract with a managed care organization or a commercial payer, for example, a hospital or physician group practice is at a signifi -cant disadvantage if it does not know its full cost for the service under discussion. Even if its goal is to obtain a large volume of new patients by offering a price below its full
c01.indd 2c01.indd 2 9/2/08 6:27:21 PM9/2/08 6:27:21 PM
Chapter 1 Essentials of Full - cost Accounting 3
cost, it needs to know the full cost. Otherwise, it will be at a distinct disadvantage in the negotiations.
Profi tability Assessments By contrast, many health care organizations are price taker s — they must accept the price that has been set by a third - party payer, such as Medicare or Medicaid. For these organi-zations, full - cost information allows senior management to assess whether a particular program or service is fi nancially viable. Indeed, if a program or service is not covering its full cost, it is by defi nition a loss leader. Because an organization cannot survive if all its programs or services are loss leaders, full cost accounting serves to highlight where the cross - subsidization among them is taking place. This allows management to assess whether that cross - subsidization is consistent with the organization ’ s overall strategy and, if it is not, to take corrective action.
Comparative Analyses Many organizations can benefi t from comparing their costs with those of organizations delivering similar programs or services. For example, an integrated delivery system (IDS) with a network of physician group practices, hospitals, and other service delivery units may make comparisons among similar entities. Full - cost information can assist in this effort.
One diffi culty with comparative analyses is that not all organizations of the same type measure their costs in the same way. Typically, this is not a concern for an integrated delivery system, because the cost accounting effort for, say, its physician group practices can be specifi ed in detail. Otherwise, an organization attempting a comparison with like entities may encounter a variety of methodological impediments.
PROBLEM Concord Health Network, an integrated delivery system, is interested in comparing its cost per patient with the per - patient cost in a similar IDS. What are some of the issues it must consider in making this comparison? Please write out some of your thoughts before reading the analysis that follows.
■ ■ ■
It is extremely important that you write out your own answer before looking at the one given. Please do not shortcut this feature of the learning process. If you have not written out an answer yet, please do so before you continue reading.
c01.indd 3c01.indd 3 9/2/08 6:27:21 PM9/2/08 6:27:21 PM

4 Management Accounting in Health Care Organizations
As this answer suggests, the defi nition of what is to be included in a full - cost calcula-tion is by no means clear cut. Indeed, because such a wide range of choices is embedded in an organization ’ s cost accounting system, managers frequently fi nd it diffi cult to com-pare their organization ’ s costs with those of other organizations, where the choices may have been made differently.
ANSWER Concord must consider such comparability issues as the average occupancy rate of its hos-pitals; the existence of specialized programs in, say, cardiology or oncology; and the provi-sion of services such as social work and discharge planning. It also must consider whether it wishes to focus on an episode of illness, a hospitalization, or something else, and it must decide whether it wishes to include outpatient and/or home care costs in the comparison.
Because of these impediments, many organizations simply make comparisons of their own costs over time rather than with other organizations. They know that their full - cost methodology has remained reasonably consistent from one year to the next and there-fore that there will not be problems with either noncomparable or scale - related costs.
ISSUES TO CONSIDER IN CALCULATING FULL COSTS If senior management does not wish to use full - cost information for pricing decisions, profi tability assessments, or comparative analyses, it does not need to become involved in the effort to calculate full costs. Rather, it can delegate the task to the accounting staff. Although Medicare has paid hospitals on the basis of diagnosis - related groups (DRGs) for over 25 years, it continues to require hospitals to prepare a full - cost report. In general,
EXAMPLE
A study that compared the cost of an outpatient visit in a hospital with the cost of a similar visit in a physician ’ s offi ce identifi ed two impediments to the com-parison. One factor was noncomparable costs. For example, because of the way the hospital allocated its overhead costs, a fraction of the cost of the chaplain ’ s offi ce was included in the cost of each outpatient visit — there was nothing com-parable in the physician ’ s offi ce. The other factor was scale - related costs. In a hos-pital, the cost of governance was high, entailing a great deal of time, effort, and expense to work with the hospital ’ s board of trustees. Governance in a physician ’ s offi ce was much simpler.1
c01.indd 4c01.indd 4 9/2/08 6:27:24 PM9/2/08 6:27:24 PM

Chapter 1 Essentials of Full - cost Accounting 5
however, such a report is of little interest to senior managers, and they can simply ask the accounting staff to prepare it as quickly and as easily as possible.
On the other hand, when a hospital or academic medical center contracts with the federal government to do research, senior management no doubt will want to be more closely involved with the full - cost accounting effort. This is because the full - cost analysis must be prepared in accordance with the principles set forth in the Offi ce of Management and Bud-get ’ s Circular A - 21, “ Cost Principles for Educational Institutions. ” These principles provide for reimbursement of direct costs plus an “ equitable share ” of overhead costs. Overhead costs include depreciation of buildings and equipment, operation and maintenance of plant, general administration, departmental administration, student administration and services, and library. Because these overhead costs can vary widely among organizations, senior management must assure itself that the amount submitted to the government is legitimate and reasonable.
If senior management has decided to use full - cost information for pricing and other decision making purposes, it must work with its accounting staff to select an appropriate methodology. The term “ work with ” is important. Because the issues are complex, the decisions cannot be completely delegated to the accountants. Full - cost information can be computed in a variety of ways, most of which can be defended as valid, but each of which can produce a different result. Moreover, the full - cost accounting effort in health care organizations is complicated by a variety of factors, such as patient or service mix, standby capacity, and alternative treatment modalities. Thus, senior management must be involved in setting the ground rules and in guiding the accounting staff ’ s work. Other-wise, the resulting information may be of little managerial use.
Because there are no full - cost accounting rules similar to Generally Accepted Account-ing Principles (GAAP) in fi nancial accounting, we fi rst need to discuss the conceptual structure that underlies full cost accounting. We then can turn to the cost accounting deci-sions that will affect the way the accounting staff gathers and presents the information.
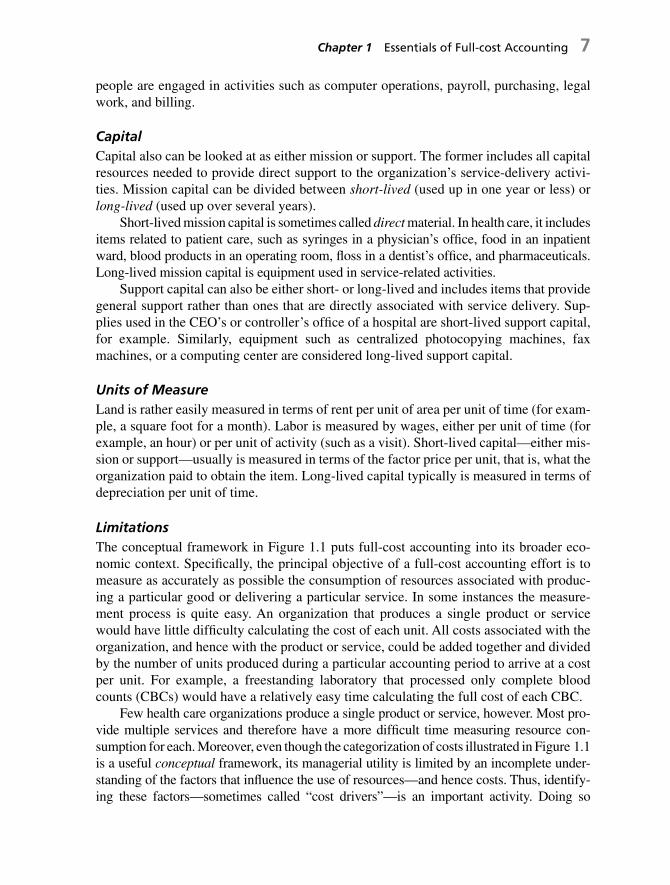
RESOURCE USAGE: A CONCEPTUAL FRAMEWORK The fundamental issue that cost accounting addresses is the use of resources. At the most basic conceptual level, these resources are the classic ones of the economist: land, labor, and capital. They are shown schematically in Figure 1.1 . Take a few minutes now to review this diagram so that you can relate it to the following discussion.
Land Land is the simplest of the three. Unlike the other two, it has no subclassifi cations. It can be somewhat complicated for agricultural fi rms or companies in the extraction industries (oil, coal, etc.), but in general — and certainly in health care — it is the site where the orga-nization is located.
If an organization has multiple sites, as many large academic medical centers and integrated delivery systems do, the land resource might be divided between mission and support facilities. The mission facilities would be those where patients and other cli-ents receive services; the support facilities would not be used for patient or other mission purposes (e.g., research).
c01.indd 5c01.indd 5 9/2/08 6:27:26 PM9/2/08 6:27:26 PM

6 Management Accounting in Health Care Organizations
Labor Labor in health care and other service organizations can be classifi ed into either mission (sometimes called professional) or support (sometimes called administrative). Mission labor consists of the individuals who actually deliver the organization ’ s services (and thus are directly associated with the organization ’ s main mission). Support labor includes everyone else in the organization.
Support labor can be divided into direct and general. Direct support activities include scheduling patients or providing secretarial support for a research project. General sup-port may be related to mission services or it may be part of general administration. If the former, it includes centralized functions that assist the organization ’ s mission depart-ments but that are organized separately from them, such as maintenance or cleaning. General administration is the organization ’ s central offi ce staff — the people who engage in activities that typically are not related to specifi c professional departments. These
FIGURE 1.1 Resource Usage: A Conceptual Framework
Basiccategory
1
Subclassifications
32
Directsupport
Generalsupport
Cost measure
Rent/month
Wage/month
Price/unit
——Land
Labor
Capital
4
The site
Mission
Assembly line workersPhysiciansAirline pilotsTeachers
Support
SchedulersAdministrators
Missionservices
Generaladmin.
MaintenanceCleaningLaundry
ComputerLegalBillingAccounting
Wage/month
Mission
Short-lived
Long-lived
Raw materialsProduction suppliesLubricantsTicketsSyringes
Manufacturing equipmentAirplanesChurch pews
Short-lived
Long-lived
Support
Administrative supplies:Stationery
Administration-relatedequipment/facilities
Depreciationper month
Depreciationper month
Wage/month
Wage/month
Price/unit
—
c01.indd 6c01.indd 6 9/2/08 6:27:26 PM9/2/08 6:27:26 PM
Chapter 1 Essentials of Full - cost Accounting 7
people are engaged in activities such as computer operations, payroll, purchasing, legal work, and billing.
Capital Capital also can be looked at as either mission or support. The former includes all capital resources needed to provide direct support to the organization ’ s service - delivery activi-ties. Mission capital can be divided between short - lived (used up in one year or less) or long - lived (used up over several years).
Short - lived mission capital is sometimes called direct material. In health care, it includes items related to patient care, such as syringes in a physician ’ s offi ce, food in an inpatient ward, blood products in an operating room, fl oss in a dentist ’ s offi ce, and pharmaceuticals. Long - lived mission capital is equipment used in service - related activities.
Support capital can also be either short - or long - lived and includes items that provide general support rather than ones that are directly associated with service delivery. Sup-plies used in the CEO ’ s or controller ’ s offi ce of a hospital are short - lived support capital, for example. Similarly, equipment such as centralized photocopying machines, fax machines, or a computing center are considered long - lived support capital.
Units of Measure Land is rather easily measured in terms of rent per unit of area per unit of time (for exam-ple, a square foot for a month). Labor is measured by wages, either per unit of time (for example, an hour) or per unit of activity (such as a visit). Short - lived capital — either mis-sion or support — usually is measured in terms of the factor price per unit, that is, what the organization paid to obtain the item. Long - lived capital typically is measured in terms of depreciation per unit of time.
Limitations The conceptual framework in Figure 1.1 puts full - cost accounting into its broader eco-nomic context. Specifi cally, the principal objective of a full - cost accounting effort is to measure as accurately as possible the consumption of resources associated with produc-ing a particular good or delivering a particular service. In some instances the measure-ment process is quite easy. An organization that produces a single product or service would have little diffi culty calculating the cost of each unit. All costs associated with the organization, and hence with the product or service, could be added together and divided by the number of units produced during a particular accounting period to arrive at a cost per unit. For example, a freestanding laboratory that processed only complete blood counts (CBCs) would have a relatively easy time calculating the full cost of each CBC.
Few health care organizations produce a single product or service, however. Most pro-vide multiple services and therefore have a more diffi cult time measuring resource con-sumption for each. Moreover, even though the categorization of costs illustrated in Figure 1.1 is a useful conceptual framework, its managerial utility is limited by an incomplete under-standing of the factors that infl uence the use of resources — and hence costs. Thus, identify-ing these factors — sometimes called “ cost drivers ” — is an important activity. Doing so
c01.indd 7c01.indd 7 9/2/08 6:27:26 PM9/2/08 6:27:26 PM

8 Management Accounting in Health Care Organizations
allows us to bridge the gap between the broad overview in Figure 1.1 and the accountant ’ s need to measure resource consumption in detail.
Cost Drivers Cost drivers are organizational activities that can be linked directly to costs. Certain costs in a clinic, for example, arise as a result of the number of patient visits. Others come about as a result of the number and complexity of the programs available. Similarly, in a hospital, some costs are related to the number and complexity of patients, whereas others are a result of the available programs.
There are six cost drivers in most health care organizations. Table 1.1 describes them and gives examples for a hospital. Note that this classifi cation scheme does not use the traditional departmental structure found in most organizations. Instead, it lists and classi-fi es the activities that cause costs to exist. We will return to this idea in Chapter Nine , when we look at how an organization can use cost drivers to build a budget.
TABLE 1.1 Examples of Cost Drivers in a Hospital
Cost driver Examples
Case type . Type of patient; sometimes called case mix
Myocardial infarction; pneumonia; appendicitis
Volume . The number of patients of each type
10 cases of myocardial infarction; 50 cases of pneumonia; 30 cases of appendicitis
Patient needs . The resources typically used by a patient with a particular case type
For myocardial infarction: 2 days in coronary care unit; 4 days of care in a ward; 3 days of Level III nursing care; 2 days of Level II nursing care; 12 laboratory tests; 7 X - rays
Effi ciency. The number of resource “ inputs ” needed for each unit of output
Nursing hours per patient at each level of nursing care; time and supplies per radiological procedure; time and supplies per lab test
Factor prices . The cost per unit of each resource
Hourly nursing wage; hourly technician wage; price per unit of laboratory reagents
Program. The fi xed costs incurred so that the organization is ready to serve patients
The fi xed costs needed to run programs such as open - heart surgery, renal transplant, alcohol detoxifi cation
c01.indd 8c01.indd 8 9/2/08 6:27:27 PM9/2/08 6:27:27 PM
Chapter 1 Essentials of Full - cost Accounting 9
THE COST ACCOUNTING METHODOLOGY Let ’ s turn now to some concrete aspects of the cost accounting methodology. As indi-cated earlier, an organization that produces a single good or service usually has little dif-fi culty in calculating the cost of each unit. Let ’ s start with such an organization and then move to a more complex one.
PROBLEM Homecare, Inc. delivers services to homebound patients. Its services include assistance with bathing, feeding, and exercising. It calculates the cost for its services on an hourly basis. Last year the organization had total costs of $ 600,000 and delivered 8,000 hours of services. What is its cost per service unit? Please make your computation before reading the answer.
ANSWER If we defi ne a service unit as an hour, rather than as a particular activity, we can say that the organization delivers a single service — an hour of care. The full - cost accounting process, therefore, is quite simple: $ 600,000 � 8,000 hours � $ 75.00 per hour of service.
In contrast, organizations that produce a variety of goods or services, each requiring different amounts of land, labor, and capital, have a more diffi cult time determining the cost for each unit sold. For example, the cost accounting process for Homecare, Inc. would become somewhat more complex if senior management wished to identify the costs for different program activities (bathing assistance, feeding assistance, and exercis-ing assistance).
To address this more complex process, Homecare must make six full - cost accounting decisions: (1) defi ning a cost object, (2) determining mission and service cost centers, (3) distinguishing between direct and indirect costs, (4) choosing bases for allocating ser-vice center costs, (5) selecting an allocation method, and (6) deciding how to attach mis-sion center costs to cost objects. Together these six decisions constitute the full - cost accounting methodology.
Decision 1: Defi ning the Cost Object The cost object is the unit for which we wish to know the cost. Generally, the more spe-cifi c the cost object, the more complex the accounting methodology. At one time, for example, some acute care hospitals defi ned their cost object as an all - inclusive day of care — a cost object that included surgical procedures, laboratory tests, radiology exams, pharmaceutical usage, and so on. For these hospitals, calculating their per - diem cost was as simple as calculating the per - hour cost at Homecare, Inc.
c01.indd 9c01.indd 9 9/2/08 6:27:27 PM9/2/08 6:27:27 PM
10 Management Accounting in Health Care Organizations
Most hospitals now use more specifi c cost objects. A day of care might be for “ rou-tine ” activities only (such as room, dietary, and nursing costs), with separate cost objects for other activities, such as laboratory tests. Some hospitals now use a discharge or an episode of illness as the cost object, rather than a day of care. If a discharge is the cost object, the hospital would need to include all costs associated with the patient ’ s inpatient stay (that is, for all days of care rather than just an average single day). If an episode of illness is the cost object, the hospital would include costs for all admissions associated with a particular illness for a given patient, plus outpatient and home care costs as well. In 1983, with the introduction of diagnosis - related group (DRG) reimbursement, Medi-care effectively specifi ed that a hospital ’ s cost object was a discharge. Consequently, because there are several hundred different DRGs, hospitals now have several hundred different cost objects, one for each DRG.
To compute the full cost of each cost object, many hospitals have identifi ed what they call “ intermediate cost objects. ” These constitute the various services that a patient receives while in the hospital, or what are called “ patient needs ” in Table 1.1 . Thus, the full cost of caring for a patient with DRG X would be the sum of the cost of each resource (intermediate cost object) that he or she used during the hospital stay.
Let ’ s now return to Homecare, Inc., where, for simplicity, we used an hour of time as the cost object. This choice of cost object creates the same problem as an all - inclusive day of hospital care — namely, that there is considerable dispersion around the average. We therefore need to distinguish between fi nal and intermediate cost objects. In this instance, the fi nal cost object is a visit (such as a trip to a home to provide some care), and one of our intermediate cost objects might be an hour of time for some type of provider (such as an exercise trainer or a home health aide), with the cost of the hour depending on the sal-ary levels of Homecare ’ s personnel. Before we can compute the cost of these intermediate cost objects, however, we need to examine some of the other cost accounting choices.
Decision 2: Determining Mission and Support Cost Centers Cost centers can be thought of as categories (or buckets) used to collect cost information. To best understand how they work, consider again the organization that delivers a single service. The organization could treat itself as a single cost center, thereby creating a rela-tively simple cost accounting system. In this case, the category used to collect cost infor-mation would be the organization itself.
Alternatively, the organization could subdivide itself into several cost centers — such as direct care delivery, administration, housekeeping, and the like — for the purposes of its cost accounting effort. When this is done, the cost of a particular cost object will be the sum of the costs attributed to it in each of the cost centers.
PROBLEMHomecare, Inc. is considering the use of four cost centers: Housekeeping, Administration, Patient Services, and Patient Education. Cost data are available for Housekeeping salaries ( $ 30,000) and supplies ( $ 4,000), Administration salaries ( $ 100,000) and supplies ( $ 36,000),
c01.indd 10c01.indd 10 9/2/08 6:27:28 PM9/2/08 6:27:28 PM

Chapter 1 Essentials of Full - cost Accounting 11
Note that the total cost per hour remains the same in both analyses. This must be the case because total costs ( $ 600,000) and total hours (8,000) are unchanged. What value, then, derives from the extra effort associated with separating the agency into four cost centers?
There is an accounting - oriented and a management - oriented answer to this question. From an accounting perspective, costs are better understood and more easily computed if they are for relatively homogeneous groupings of activities. For this reason, the choice of cost centers ordinarily is based on homogeneity — that is, each cost center is defi ned so as to include a collection of very similar activities.
ANSWERUsing these four cost centers, our analysis would give the same answer we found for the previous problem, but it would have a different structure, as follows:
Cost centers
Cost items Housekeeping Administration Patient services
Patient education Total
Salaries $ 30,000 $ 100,000 $ 175,000 $ 105,000 $ 410,000 Supplies 4,000 36,000 125,000 25,000 190,000 TOTAL $ 34,000 $ 136,000 $ 300,000 $ 130,000 $ 600,000
COST PER HOUR $ 4.25 $ 17.00 $ 37.50 $ 16.25 $ 75.00
Patient Services salaries ( $ 175,000) and supplies ( $ 125,000), and Patient Education salaries ( $ 105,000) and supplies ( $ 25,000). The agency provided 8,000 hours of service last year. What are the costs in each cost center? What is Homecare ’ s cost per hour? You should make the computation before reading the answer.
EXAMPLE
A photocopy center with an extremely sophisticated machine (perhaps high - speed with color capability) and an extremely simple one would most likely create a separate cost center for each machine. The sophisticated machine no doubt was more costly to purchase (and hence has higher depreciation), is more costly to
c01.indd 11c01.indd 11 9/2/08 6:27:29 PM9/2/08 6:27:29 PM

12 Management Accounting in Health Care Organizations
From a managerial perspective, separate cost centers give better information for decision making. For example, a multi - cost - center structure can be used for pricing or submitting reimbursement claims to third parties. When each program (or service) is rep-resented by a cost center, the costs of that center can be used as the basis for setting the appropriate prices.
PROBLEMWhat concerns would you have about the breakdown of Homecare’s costs in the answer to the previous problem?
ANSWERServices are provided to patients only in the Patient Services and Patient Education cost cen-ters. Therefore the cost per hour in the Housekeeping and Administration cost centers is not an especially useful number. Moreover, the cost per hour in the Patient Services and Patient Education will depend on the number of hours of service provided in each, but we do not have this information. (We’ll get it in Decision 3.)
In a multi - cost - center structure, an organization ’ s cost centers generally are divided into two broad categories: mission centers and support centers (sometimes called service centers). Mission centers are associated with the organization ’ s main focus (or mission); normally, they charge for (or are reimbursed for) their activities. In fact, some hospitals call them revenue centers (because they earn revenue by charging for their activities). In a manufacturing context, they sometimes are called production centers (because they are where the company ’ s products are made).
Support centers accumulate the costs of the activities the organization carries out to support its mission centers. In the Homecare, Inc. example, Housekeeping and Adminis-tration would be support centers, and Patient Services and Patient Education would be mission centers. In a hospital, institution - wide depreciation, human resources, plant maintenance, laundry, and the like generally are support centers, and programs and patient service departments are mission centers.
service and repair, has more costly toner cartridges, and perhaps requires a more highly skilled (and hence higher salaried) operator. Including the two machines in one cost center and calculating the average cost of a photocopy would produce a misleading cost fi gure. The average would overstate the cost of a copy on the simple machine and understate it on the sophisticated machine.
c01.indd 12c01.indd 12 9/2/08 6:27:30 PM9/2/08 6:27:30 PM

Chapter 1 Essentials of Full - cost Accounting 13
With the above distinctions, the cost for a given cost object now depends upon (1) the mission center or centers where a patient received services, (2) the number of units of ser-vice he or she received in each, and (3) the cost for each unit of service. The cost per unit of service in each mission center depends, in part, on that center ’ s fair share of the organi-zation ’ s support center costs.
Decision 3: Distinguishing Between Direct and Indirect Costs A third decision in designing a cost accounting system is distinguishing between direct and indirect costs. Direct costs are unambiguously associated with, or physically trace-able to, a specifi c cost center. Indirect costs apply to more than one cost center and thus must be distributed among the cost centers that use them.
Again, under the simplest of circumstances, where an organization produces one product in one cost center, there are no indirect costs, because it is not possible to have costs that apply to more than one cost center. The creation of multiple cost centers means that some costs become indirect, thereby necessitating their distribution, or assignment.
PROBLEMThe staff members in the Patient Education program are supervised by someone whose sal-ary is contained in the Patient Services cost center. What kind of a cost is the supervisor’s salary? Why? What should be done with it? Write a general answer to each question.
ANSWERThe salary is an indirect cost because it applies to activities in both the Patient Services and Patient Education cost centers. This means that it must be distributed between them. To distribute the salary to the two centers, we might ask the supervisor to maintain careful time records. If we do this, we effectively convert the indirect cost into a direct cost, because we will have created a situation in which the cost (time) is physically traceable to each cost center. Alternatively, we might create a formula that uses, say, salary dollars or number of personnel in each cost center as the distribution mechanism.
PROBLEMAssume that Homecare, Inc. decides to use hours of service as the distribution mechanism, and that 6,000 service hours were provided by the staff in Patient Services and 2,000 hours by the staff in Patient Education. The supervisor’s salary is $60,000. How would the salary be distributed? Please make some calculations before continuing.
c01.indd 13c01.indd 13 9/2/08 6:27:31 PM9/2/08 6:27:31 PM

14 Management Accounting in Health Care Organizations
ANSWERHomecare, Inc. can perform the following calculations:
Cost centers Hours of service Hours as %Assigned supervisor’s
salary
Patient Services 6,000 75.0 $45,000Patient Education 2,000 25.0 15,000TOTAL 8,000 100.0 $60,000
The cost centers would then have the following total costs:
Cost centers Cost
Housekeeping $34,000Administration 136,000Patient Services 285,000 (that is, $300,000 � $15,000 for supervisor)Patient Education 145,000 (that is, $130,000 � $15,000 for supervisor)TOTAL $600,000
Note that this approach has divided the supervisor ’ s salary between the two relevant cost centers, based on a distribution formula. Of the $ 60,000 salary, $ 45,000 remains in the Patient Services cost center, and $ 15,000 has been transferred to the Patient Educa-tion cost center.
Decision 4: Choosing Allocation Bases for Support Center Costs The hourly cost of Patient Services and the hourly cost of Patient Education includes more than the direct costs and distributed indirect costs of those activities. It also includes each mission center ’ s “ fair share ” of the organization ’ s support center costs. (As you might imagine, the notion of fair can be highly debatable in cost accounting — just as it is in other aspects of life.)
Because of the need to allocate support center costs, the fourth decision in the cost accounting methodology is the selection of bases of allocation. That is, we must choose a metric for each service center that measures its use by the remaining cost centers (fre-quently including other support centers as well as mission centers) as accurately as possi-ble. In this regard we are seeking the activity that causes the existence of a support center ’ s costs.
Let ’ s begin with Housekeeping. Our goal is to fi nd an allocation basis that measures as accurately as possible the use of the Housekeeping resource by the other cost centers.
c01.indd 14c01.indd 14 9/2/08 6:27:34 PM9/2/08 6:27:34 PM

Chapter 1 Essentials of Full - cost Accounting 15
PROBLEMAssume that the following information on square feet is available:
Cost center Square feet
Administration 1,000Patient Services 3,000Patient Education 1,000TOTAL 5,000
How much of the cost of the Housekeeping cost center will be allocated per square foot? Make your computations before continuing reading.
ANSWERThe rate is $6.80 per square foot: $34,000 of Housekeeping � 5,000 square feet of fl oor space.
PROBLEMHow much Housekeeping should be allocated to each cost center? Write out your compu-tations and allocation amounts, using the following headings:
Cost center Computation Allocation
AdministrationPatient ServicesPatient EducationTOTAL
Although several allocation bases may be available, one that seems to be quite appropriate is square feet of fl oor space. That is, the more fl oor space a cost center uses, the greater will be its share of the Housekeeping expense.
With this information, we are now prepared to allocate housekeeping costs to the three remaining cost centers. All we now need to do is multiply the rate by the number of square feet in each.
c01.indd 15c01.indd 15 9/2/08 6:27:34 PM9/2/08 6:27:34 PM

16 Management Accounting in Health Care Organizations
Note that Housekeeping has been allocated to the Administration cost center as well as to the Patient Service and Patient Education cost centers — that is, in this approach, a support center ’ s costs have been allocated to other support centers as well as to mission centers. We will examine alternative approaches later in the chapter.
Given this approach, Homecare, Inc. now must allocate the costs of the Administra-tion cost center to the remaining cost centers. To do so, it must choose an appropriate allocation basis. There are several bases we might use, such as number of personnel, sal-ary cost, or number of visits. Assume that salary cost is the allocation basis and that the following information is available:
Salary costs
Cost center Initial With supervisor salary assignment
Administration $ 100,000 $ 100,000 Patient Services 175,000 160,000 (15,000 removed for supervisor) Patient Education 105,000 120,000 (15,000 added for supervisor) TOTAL $ 380,000 $ 380,000
Computing the allocation rate per salary dollar for Administration is somewhat more complicated than it was for Housekeeping, because total costs in the Administration cost center have been increased by the Housekeeping allocation. When we include this allocation, the total costs in the Administration cost center are $ 142,800, calculated as follows:
Direct (and distributed) costs $ 136,000 Housekeeping allocation 6,800 Total costs to be allocated $ 142,800
ANSWERThe amount of Housekeeping allocated to each cost center would be calculated as follows:
Cost center Square feet � rate � Allocation
Administration 1,000 � $6.80 � $6,800Patient Services 3,000 � 6.80 � 20,400Patient Education 1,000 � 6.80 � 6,800TOTAL 5,000 � $34,000
c01.indd 16c01.indd 16 9/2/08 6:27:38 PM9/2/08 6:27:38 PM

Chapter 1 Essentials of Full - cost Accounting 17
PROBLEMGiven the fi gures supplied, how much Administration should be allocated for each salary dollar? Please make your computations before looking at the answer.
ANSWERThe amount of Administration per salary dollar would be calculated as follows:
Total costs to be allocated $142,800Divided by salary dollars in cost centers receiving Administration’s services $280,000Equals rate of Administration costs per salary dollar $0.51
Note that we have used only the salary dollars in the two receiving cost centers, that is, the cost centers to which the Administration costs are to be allocated. If we were to use all salary costs — those in Administration, Patient Services, and Patient Education — we would end up with a rate that does not fully allocate the $ 142,800. (This idea is a little tricky. If you are having trouble with it, try doing the allocation using a rate that includes salary dollars in all cost centers.)
Determining the Allocation Rate We can use the previous example to derive a general principle for determining the allocation rate:
T o t a l cos t s i n t h e sup p o r t c e n t e r t o b e a l l o c a t e d
T o t a l a l l o c a t i o n - b a s i s u n i t s i n t h e r e c e i v i n g cos t c e n t e r s
An important point to note here is that the denominator of the formula does not include the units of the allocation basis in the cost center from which the allocation is tak-ing place. Nor does it include any units from cost centers that have already been allo-cated. It includes only the units in the receiving cost centers.
A l l o c a t i o n r a t e �
Because the Administration costs are to be allocated to the remaining cost centers (Patient Services and Patient Education), and because the basis of allocation is salary dollars, we need to determine the allocation rate — that is, Administration dollars per sal-ary dollar.
c01.indd 17c01.indd 17 9/2/08 6:27:39 PM9/2/08 6:27:39 PM
18 Management Accounting in Health Care Organizations
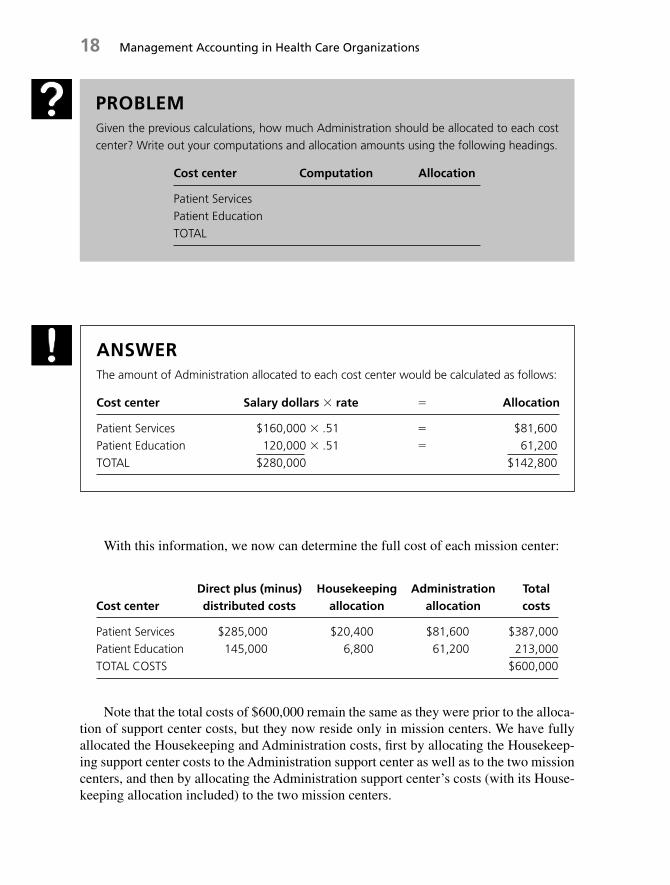
With this information, we now can determine the full cost of each mission center:
Cost centerDirect plus (minus) distributed costs
Housekeeping allocation
Administration allocation
Total costs
Patient Services $285,000 $20,400 $81,600 $387,000Patient Education 145,000 6,800 61,200 213,000TOTAL COSTS $600,000
Note that the total costs of $ 600,000 remain the same as they were prior to the alloca-tion of support center costs, but they now reside only in mission centers. We have fully allocated the Housekeeping and Administration costs, fi rst by allocating the Housekeep-ing support center costs to the Administration support center as well as to the two mission centers, and then by allocating the Administration support center’s costs (with its House-keeping allocation included) to the two mission centers.
ANSWERThe amount of Administration allocated to each cost center would be calculated as follows:
Cost center Salary dollars � rate � Allocation
Patient Services $160,000 � .51 � $81,600Patient Education 120,000 � .51 � 61,200TOTAL $280,000 � $142,800
PROBLEMGiven the previous calculations, how much Administration should be allocated to each cost center? Write out your computations and allocation amounts using the following headings.
Cost center Computation Allocation
Patient ServicesPatient EducationTOTAL
c01.indd 18c01.indd 18 9/2/08 6:27:40 PM9/2/08 6:27:40 PM

Chapter 1 Essentials of Full - cost Accounting 19
In summary, the total costs in a given mission cost center are the sum of (1) its direct costs, (2) the indirect costs distributed to (or removed from) it, and (3) the support cen-ter costs allocated to it. In Homecare, Inc., our bases of allocation were square feet and salary dollars, but an allocation basis can be almost anything that (1) can be measured and (2) has a reasonable cause - and - effect relationship with the use of a support center ’ s resources.
In the context of deciding on allocation bases, it should be noted that increased preci-sion generally requires greater measurement efforts and hence higher accounting costs. Thus, the decision to use the more accurate basis depends largely on senior management ’ s planned use of the information. In some instances the information can improve pricing decisions, and in others it will have an effect on reimbursement from third - party payers. These and similar considerations will determine whether a more accurate allocation basis should be used.
This dilemma frequently arises with the Housekeeping support center. The usual basis of allocation for Housekeeping is square feet of fl oor space. Computation of square footage for all cost centers is a one - time activity. After it has been completed, House-keeping costs can be allocated quite easily. This method, although less precise than, say, hours of service, is much easier to apply because the hours - of - service method requires ongoing measurement of the number of units of the allocation basis. Obviously, however, the use of square feet can lead to over - or under - representation of the actual use of House-keeping services by a given cost center; the hours - of - service basis presumably would not have this problem.
In general, the more precise the allocation basis, the more accurately one captures true consumption of a support center ’ s resources. Measurement of the more precise basis can be a time - consuming and complicated process, however. Occasionally, a less accu-rate basis is adopted in response to time, staffi ng, and technical constraints.
Distribution versus Allocation In choosing allocation bases, it is important to keep in mind that distribution, discussed in Decision 3, precedes allocation and serves to place costs into both support and mission centers. Costs that are direct for a given cost center need not be distributed, whereas indirect costs (those that apply to more than one cost center) must be distributed into the relevant centers. In contrast, allocation is the process of transferring support center costs to mission centers to determine the full cost of each mission center.
EXAMPLE
In one study of the precision of allocation bases, the researchers found that the use of a more precise basis in only three service centers changed the cost in sev-eral mission centers by about 15 to 20 percent.2
c01.indd 19c01.indd 19 9/2/08 6:27:41 PM9/2/08 6:27:41 PM
20 Management Accounting in Health Care Organizations
This terminology can be confusing, because the terms distribution, allocation, and (sometimes) apportionment are sometimes used interchangeably. In addition, support centers are sometimes called service centers, and their costs are sometimes called indirect costs or overhead costs. As a result, attempting to memorize precise meanings for the various terms is not especially useful. Rather, by understanding the process that is at work, you generally will fi nd that the context clarifi es the meaning.
Decision 5: Selecting an Allocation Method Three methods are used to allocate support center costs to mission centers: (1) direct (or single - stage), (2) step - down (or two - stage), and (3) reciprocal.
The Direct Method Under the direct method, support center costs are allocated to mis-sion centers only and not to other support centers. This is the simplest method of the three and is used by many organizations. It is the least precise of the three, however, in that it does not include the cost effects associated with one support center ’ s use of another sup-port center.
The Step - down Method The step - down method is the one we used for Homecare, Inc. It sequentially “ trickles down ” support center costs into other support centers and mis-sion centers. This “ stepping - down ” process begins with the fi rst support center in the sequence and spreads its costs over the remaining support centers and the mission cen-ters. The distribution is based on each cost center ’ s use of the support center ’ s resources as determined by the chosen allocation basis. This process is followed for all remaining support centers.
Because it allocates each support center ’ s costs to other support centers as well as to mission centers, the step - down method is more complicated than the direct method, but it is also more precise in that it includes the cost effects associated with one support center ’ s use of another. However, once a support center ’ s costs have been allocated, it cannot receive an allocation; thus the step - down method does not include the cost effects of a given support center ’ s use of another support center that comes later in the sequence.
The Reciprocal Method Under the reciprocal method, the most complex technique, all support centers make allocations to and receive allocations from each other, as well as make allocations to all the mission centers. The allocation amounts are determined by a set of simultaneous equations. Because all support centers can both make and receive allocations, the reciprocal method is the most accurate of the three.
An example of the reciprocal method is contained in Appendix 1.1 , at the end of this chapter. As it demonstrates, even when only two support centers are used, the simultane-ous equations make the method quite complex. When the number of support centers (and hence simultaneous equations) exceeds three, a human has considerable diffi culty using the reciprocal method. It is relatively easy for a computer to solve the equations, how-ever, and software packages are available to do this.
Because of its precision, the reciprocal method is preferred by the Cost Accounting Standards Board (CASB). Despite the CASB ’ s preference, many health care organizations
c01.indd 20c01.indd 20 9/2/08 6:27:42 PM9/2/08 6:27:42 PM
Chapter 1 Essentials of Full - cost Accounting 21
fi nd that the step - down method strikes about the right balance between accuracy and ease of use. It is the method preferred by the American Hospital Association (AHA) for hospi-tals, and Medicare requires hospitals to use it in order to receive reimbursement.
Choosing a Support Center Sequence When the step - down method is used, the sequence followed in allocating the support centers can affect the costs in each mission center. The sequence will not affect total costs, however, which will remain the same under all sequences (for example, $ 600,000 for Homecare, Inc.). Occasionally, the effect of the sequence deci-sion on a particular mission center is signifi cant, however. Therefore the sequence decision should be considered carefully.
In general the approach to choosing a sequence is to allocate support centers in order of their use by other support centers. That is, the support center that uses other support centers the least is allocated fi rst, and the support center that uses other support centers the most is allocated last. Clearly, considerable judgment is required to determine this sequence.
PROBLEMWhat judgment has management at Homecare, Inc. made in deciding to allocate the House-keeping cost center before the Administration cost center? Is a similar judgment involved in choosing the sequence of mission centers? Why or why not? Write out your answers before reading the analysis that follows.
ANSWERManagement’s judgment apparently is that the Housekeeping Department uses the Admin-istration Department less than the Administration Department uses the Housekeeping Department. (That is, less effort is spent administering the Housekeeping Department than is spent cleaning the Administrative offi ces!) With regard to mission centers, their sequence is unimportant because there is no allocation out of mission centers.
An Illustration Figure 1.2 shows the same support and mission centers that were dis-cussed in the preceding section. As in that section, the allocation process begins with the Housekeeping support center, and uses square feet as the basis for allocation. This is shown by including the term square feet in parentheses in the column headed “ House-keeping. ” As this column shows, the $ 34,000 in the Housekeeping support center has been allocated across the remaining support centers.
Looked at a bit differently, the total direct costs (plus distributed costs if there had been any) in Housekeeping are $ 34,000, which is shown in the row labeled “ Housekeeping. ”
c01.indd 21c01.indd 21 9/2/08 6:27:42 PM9/2/08 6:27:42 PM

22 Management Accounting in Health Care Organizations
The total allocated costs of $ 34,000 are shown in the column labeled “ Housekeeping. ” The row amount is shaded; the allocations are shown in the outlined box, with a total at the bottom.
With the allocation of the housekeeping costs, the Administration support center now has a total of $ 142,800 ( $ 136,000 � $ 6,800) to be allocated — that is, its $ 136,000 of direct costs (plus any distributed costs) plus the $ 6,800 of housekeeping allocated to it. These two amounts are shown in the shaded box in the “ Administration ” row.
Administration costs are allocated using salary dollars, and the outlined box shows how those costs were allocated to the remaining cost centers, the two mission centers in this case. The total amount allocated ( $ 142,800) is shown at the bottom of the column.
The total costs in the mission centers are determined by combining their direct and distributed costs and adding the costs allocated to them from the support centers. This process was discussed in the section on allocation bases. The step - down method is the formal approach to the same process.
Key Aspects of the Step - down Method There are several important points to keep in mind when allocating costs using the step - down method.
1. Only support center costs are allocated. Mission center costs are not. Mission cen-ters receive costs from support centers, but once a cost has been allocated to a mis-sion center, it stays there.
2. To carry out the step - down process, a basis of allocation must be chosen for each support center. The basis attempts to measure the usage of that cost center by the other cost centers — both support centers and mission centers. For example, in orga-nizations that have a laundry (such as hospitals), the number of pounds of laundry frequently is used as the basis for allocating the costs of the laundry support center. Each cost center thus receives a portion of laundry costs, in accordance with its pro-portion of the total pounds of laundry processed. If a particular cost center used no pounds of laundry, it would not receive any allocation from the laundry cost center.
Administration
Administration(salary $)Cost centers
Direct plusdistributed costs
Housekeeping(square feet)
Totalcosts
Patient Services
Patient Education
TOTAL COSTS
Missioncenters
Servicecenters
Housekeeping 34,000
136,000
300,000
130,000
600,000
6,800
20,400
6,800
81,600
61,200
387,000
213,000
600,000
------------------Allocations------------------
34,000 142,800
FIGURE 1.2 The Step - down Method
c01.indd 22c01.indd 22 9/2/08 6:27:44 PM9/2/08 6:27:44 PM

Chapter 1 Essentials of Full - cost Accounting 23
3. The amount of a given support center ’ s costs allocated to a particular mission center will depend in part on whether that support center is allocated early or late in the sequence. If it is allocated late in the sequence, it will contain some costs from sup-port centers allocated earlier in the sequence. If it is allocated early, it will not.
4. Total costs do not change. All that changes with different allocation bases and step - down sequences is the distribution of total costs among the various cost centers and, ultimately, among the mission centers.
Decision 6: Attaching Costs to Cost Objects A fi nal decision to be made in a full - cost accounting system concerns the way mission center costs are “ attached ” to cost objects. A process system typically is used when all units of output are roughly identical, as on a production line. All production - related costs for a given accounting period are calculated and then divided by the total number of units produced to give an average cost per unit. When hospitals used an all - inclusive per diem, they were using a process system.
A job order system is used when the units of output are different. An automobile repair garage is illustrative. Adding all costs for a given accounting period, such as a day, and dividing the total by the number of cars repaired to determine an average cost per repaired car would provide misleading information to management (as well as unfair prices to cus-tomers). Instead, a job order cost system uses a job ticket on which the time and parts asso-ciated with each repair effort are recorded separately and their costs are computed by means of hourly wage rates, unit prices, and so on. We will examine these choices and their impact on the cost of a cost object in considerable detail in Chapters 4 and 5 .
Of the six cost accounting decisions we have discussed, the two that typically require the most judgment are the defi nition of a cost object and the determination of cost cen-ters. The distinction between direct and indirect costs is largely a matter for the account-ing staff. The choice of allocation bases and the selection of an allocation method require some involvement by senior management but largely with regard to the balance between the precision that a particular basis or method provides and the cost of using it.
Defi ning an organization ’ s cost object requires senior management ’ s judgment about how well a given cost object fi ts with management ’ s pricing policies. In Homecare, Inc. ’ s case, the fi nal cost object probably is a visit to a patient, because this is how most patients think about Homecare ’ s work. However, senior management also will be interested in the cost per hour — which would be its intermediate cost object, and would likely differ among mission centers.
Consideration of the multiple - cost - center approach raises the issue of the most appro-priate number and kind of cost centers. As discussed earlier, the main goal in choosing cost centers is to organize costs into homogeneous collections of activities. When this is the case in a support center, and when an appropriate allocation basis has been chosen, the portion of that support center ’ s costs that is allocated to each remaining cost center gener-ally is a fair measure of usage.
Similarly, when a mission center consists of a set of homogeneous activities, the same activities will take place for every cost object; the only difference will be the length
c01.indd 23c01.indd 23 9/2/08 6:27:45 PM9/2/08 6:27:45 PM

24 Management Accounting in Health Care Organizations
of time they take. Thus, the portion of the center ’ s costs that is attached to a cost object depends only on the amount of time the cost object spent in the mission center, not on what happened to it while it was in the center.
Unfortunately, resource and time constraints sometimes make it necessary to group heterogeneous activities into one cost center. When this happens, the costs allocated from a support center to a receiving cost center or attached to a cost object using a mission cen-ter will not be solely a function of the allocation basis or the time spent in a given cost center; they also will be a function of the activities that take place in the cost center.
PROBLEMWhat additional information would you like to have about the Housekeeping cost center at Homecare, Inc. to determine whether it is appropriately structured as a single cost center or whether it should be divided into two or more cost centers? Write out your answer before continuing.
ANSWERWe would like to know what sorts of activities take place in the Housekeeping cost center and whether there are different kinds of cleaning that could infl uence the costs allocated to Administration, Patient Services, and Patient Education. For example, we would like to know whether the Patient Services cost center requires special equipment or cleaning sol-vents that are not used for cleaning in Administration or Patient Education. If this is the case, Homecare might use two cost centers for Housekeeping activities: one for Special Housekeeping and one for General Housekeeping. This frequently is the case in hospitals, where cleaning, say, the operating rooms requires a much more intensive effort per square foot and more expensive cleaning supplies than cleaning the admitting area.
EXAMPLE
Recall the earlier example of the photocopy center. There were two photocopying machines: a simple one and a sophisticated one. If senior management sets up each machine as a separate cost center, the cost of a job will depend on (1) the rate for the machine that is used and (2) the amount of time the machine is used. The accounting cost thus will come close to measuring the true consumption of resources.
c01.indd 24c01.indd 24 9/2/08 6:27:45 PM9/2/08 6:27:45 PM

Chapter 1 Essentials of Full - cost Accounting 25
Determining the Impact on Customer Prices Information structured into multiple cost centers can be extremely useful for pricing pur-poses. If we assume for the moment that Homecare, Inc. ’ s management wants a 10 percent markup over costs when pricing the agency ’ s services, the multiple - cost - center approach will give a very different pricing structure than the single - cost - center approach.
PROBLEMA potential patient has asked Homecare, Inc. for a bid on a weekly home visit, which the manager estimates will require 3 hours. Another potential client has asked for a bid on edu-cating an elderly relative, which the manager estimates will require 1 hour a week. How would the prices Homecare, Inc. proposes to these potential patients and clients differ between the single-cost-center and multi-cost-center approaches?
ANSWERThe price per hour for either patient service or patient education would be the cost plus 10 percent, computed as follows:
Cost per hour
One cost center $600,000 � 8,000 hours � $75.00Multiple cost centers Patient Services $387,000 � 6,000 hours � $64.50 Patient Education $213,000 � 2,000 hours � $106.50
Price per hour
One cost center $75.00 � $7.50 � $82.50Multiple cost centers Patient Services $64.50 � $6.45 � $70.95 Patient Education $106.50 � $10.65 � $117.15
Thus the cost-based prices proposed to the patient for the two jobs would be as follows:
One cost center
Patient Services 3 hours @ $82.50 � $247.50Patient Education 1 hour @ $82.50 � $82.50
Multiple cost centers
Patient Services 3 hours @ $70.95 � $212.85Patient Education 1 hour @ $117.15 � $117.15
c01.indd 25c01.indd 25 9/2/08 6:27:48 PM9/2/08 6:27:48 PM
26 Management Accounting in Health Care Organizations
Note that with the multiple - cost - center approach, the price per hour for Patient Ser-vices decreased by about 13 percent, and the price for Patient Education increased by about 43 percent. If we assume that the multiple - cost - center approach gives us a more homoge-neous collection of activities in each cost center, then the cost on which the price is based comes closer to the true consumption of resources needed for each hour of service.
SUMMARY OF COST ACCOUNTING CHOICES The choices involved in developing a cost accounting system can be tricky and usually involve some managerial judgment. Moreover they are highly interdependent. The choice of cost centers will infl uence the distinction between direct and indirect costs. The choice of a particular fi nal cost object frequently will require the use of certain inter-mediate cost objects or call for certain kinds of cost centers. Allocation of support center costs will be determined in part by the choice of the support centers themselves, in part by the distribution process for indirect costs, in part by the chosen allocation bases, and in part by the allocation sequence.
In this context it is important to emphasize that any change to the cost of one cost center always will be accompanied by changes in another direction to other cost centers. That is, once costs have been incurred, they do not change. Hence total costs will always be the same on any set of cost reports prepared for the same organization for the same pe-riod. As a result the effect of any change in methodology is solely one of making shifts among cost centers. Sometimes these cost shifts can be quite signifi cant, however.
You are now ready to work on the practice case for this chapter, Mossy Bog Labora-tories, which will give you some practice in using the step - down method. Work through the case to the best of your ability before looking at the solution, which is contained in the Appendix at the end of the book.
KEY TERMS Allocated overhead Direct labor Direct cost Direct material
TO BEAR IN MIND 1. This chapter has focused on mission and support centers and the allocation of sup-
port center costs into mission centers. This way of viewing costs has some lim-itations. Specifi cally, the allocation methodology says little about a cost ’ s actual behavior as the volume of activity in a cost center increases or decreases. For this reason, full - cost information is not especially useful for a category of decisions known as alternative choice decisions. The costs appropriate for these decisions are discussed in Chapters Two and Three .
2. In this chapter you have learned about Stage 1 of the cost accounting effort. At the end of this stage, all costs reside in mission centers. In Stage 2, mission center
c01.indd 26c01.indd 26 9/2/08 6:27:51 PM9/2/08 6:27:51 PM

Chapter 1 Essentials of Full - cost Accounting 27
costs are attached to the cost objects passing through those centers. We discussed this activity briefl y in terms of the choice between a process and a job - order system, but it is trickier than it might seem. It is discussed in detail in Chapters Four and Five .
NOTES 1. Young, David W., “ Cost Accounting and Cost Comparisons: Methodological Issues
and Their Policy and Management Implications. ” Accounting Horizons , Mar. 1988.
2. Young, D.W., E. Socholitzky, and E.W. Locke, “ Ambulatory Care Costs and the Medicare Cost Report: Managerial and Public Policy Implications. ” Journal of Ambulatory Care Management , Feb. 1982.
APPENDIX 1.1: THE RECIPROCAL METHOD OF COST ALLOCATION
To see how the reciprocal allocation method works, let ’ s use the example of an express mail delivery company with two support centers, Housekeeping and Administration. We wish to allocate the support center costs to the two mission centers: Next - Day Delivery and Two - Day Delivery. Management has decided to allocate housekeeping costs on the basis of the square footage in each department and administration costs on the basis of the number of hours worked by the employees in each department. Table A1.1 shows how the initial data for the company might look.
TABLE A1.1 Basic Information for a Reciprocal Cost Allocation (costs in thousands of dollars)
Administration House-keeping
Two - day delivery
Next - day delivery Total
Area occupied (sq. ft.) 1,000 1,000 3,000 5,000
Labor hours 100 100 400 600
Mission center costs $ 1,500 $ 4,000 $ 5,500
Support center costs $ 1,200 $ 2,400 $ 3,600
TOTAL COSTS $ 9,100
c01.indd 27c01.indd 27 9/2/08 6:27:51 PM9/2/08 6:27:51 PM

28 Management Accounting in Health Care Organizations
Note that there are no square feet shown for Housekeeping and no labor hours shown for the Administration cost center. Because we are using square feet as the basis of allocation for Housekeeping and labor hours as the basis of allocation for Administration, we therefore exclude these measures from the two departments. In effect we do not calculate the cost of cleaning the Housekeeping Department or administering the Administration Department. We will, however, calculate the cost of administering the Housekeeping Department and of cleaning the Administration Department.
To perform the reciprocal allocation, we must set up two equations with two unknowns; the unknowns are the amount of Administration to be allocated (which is des-ignated as A ) and the amount of Housekeeping to be allocated (designated as H ). Then, because Housekeeping costs are allocated on the basis of square footage, and Administra-tion occupies 1/5 (1,000 ÷ 5,000) of the total square footage,
A � $ 1 , 200 � 1 / 5 H
In effect the amount of Administration to be allocated to the other cost centers is the sum of the Administration Department ’ s direct costs plus its share of Housekeeping costs.
Because Administration costs are allocated on the basis of hours worked and House-keeping uses 1/6 (100 � 600) of the hours,
H � $ 2 , 400 � 1 / 6 A
That is, the amount of Housekeeping to be allocated to the other cost centers is the sum of the Housekeeping Department ’ s direct costs plus its share of Administration costs.
We now can substitute terms, as follows:
A � $ 1,200 � 1/5 ( $ 2,400 � 1/6 A ), or A � $ 1,200 � $ 480 � 1/30 A. Therefore, A � $ 1,738.
And, because H � $ 2,400 � 1/6 A,
H � $ 2 , 690
To complete the reciprocal allocation, we remove $ 1,738 from Administration and allocate it to the remaining three cost centers on the basis of labor hours, and we remove
c01.indd 28c01.indd 28 9/2/08 6:27:52 PM9/2/08 6:27:52 PM
Chapter 1 Essentials of Full - cost Accounting 29
PRACTICE CASE
MOSSY BOG LABORATORIES
Mossy Bog Laboratories—an organization that contracts with hospitals to perform various kinds of laboratory tests for outpatients—has two support departments (Maintenance and Administration) and two mission departments (Sophisticated Tests and Simple Tests). The Sophisticated Test Department is highly equipment intensive, whereas the Slow Test Department is highly labor intensive. Management has decided to allocate housekeeping costs on the basis of depreciation dollars in each department, and administration costs on the basis of labor hours worked by the employees in each department.
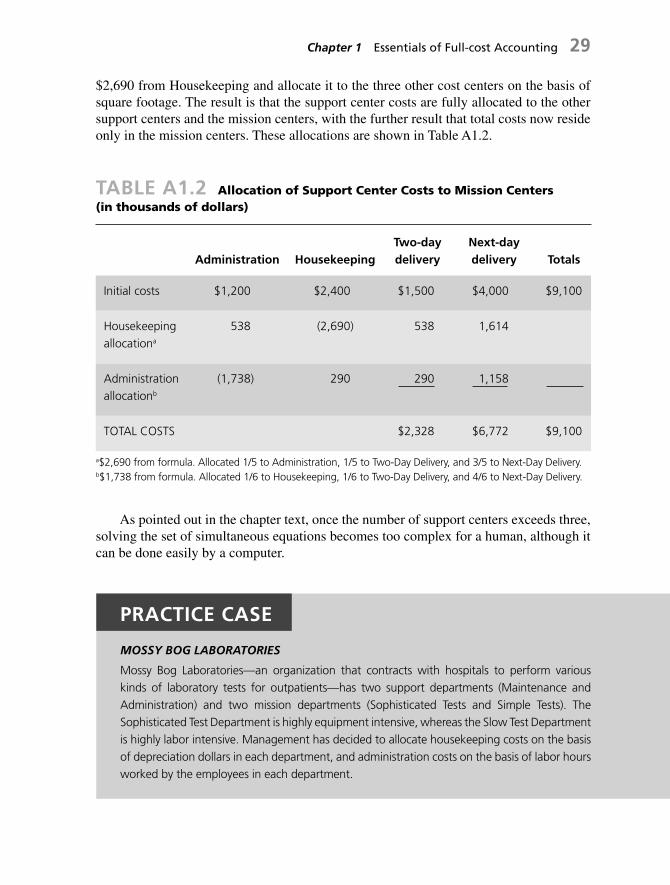
TABLE A1.2 Allocation of Support Center Costs to Mission Centers (in thousands of dollars)
Administration Housekeeping Two - day delivery
Next - day delivery Totals
Initial costs $ 1,200 $ 2,400 $ 1,500 $ 4,000 $ 9,100
Housekeeping allocation a
538 (2,690) 538 1,614
Administration allocation b
(1,738) 290 290 1,158
TOTAL COSTS $ 2,328 $ 6,772 $ 9,100
a$2,690 from formula. Allocated 1/5 to Administration, 1/5 to Two-Day Delivery, and 3/5 to Next-Day Delivery.b$1,738 from formula. Allocated 1/6 to Housekeeping, 1/6 to Two-Day Delivery, and 4/6 to Next-Day Delivery.
$ 2,690 from Housekeeping and allocate it to the three other cost centers on the basis of square footage. The result is that the support center costs are fully allocated to the other support centers and the mission centers, with the further result that total costs now reside only in the mission centers. These allocations are shown in Table A1.2 .
As pointed out in the chapter text, once the number of support centers exceeds three, solving the set of simultaneous equations becomes too complex for a human, although it can be done easily by a computer.
c01.indd 29c01.indd 29 9/2/08 6:27:52 PM9/2/08 6:27:52 PM
30 Management Accounting in Health Care Organizations
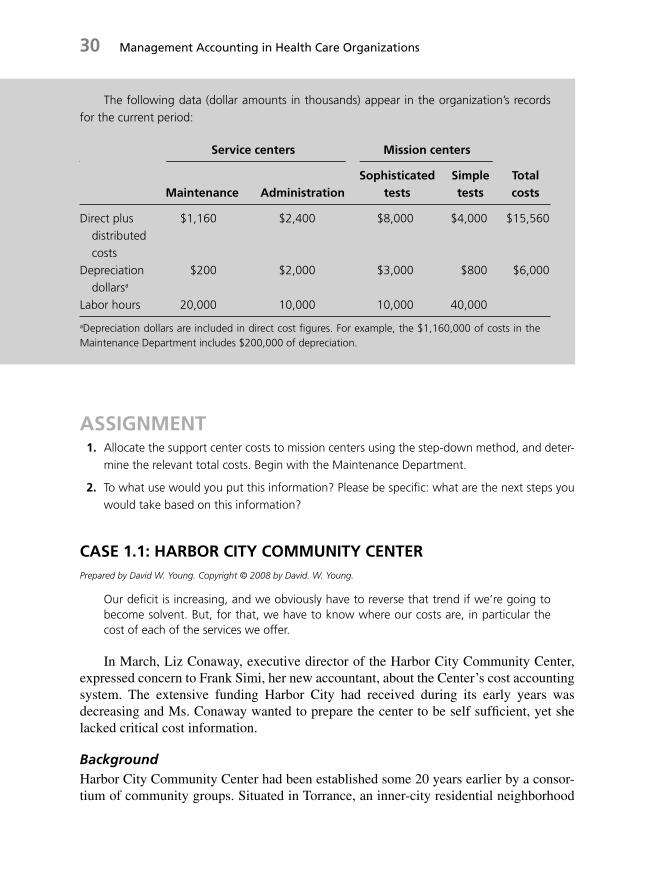
The following data (dollar amounts in thousands) appear in the organization’s records for the current period:
Service centers Mission centers
Maintenance AdministrationSophisticated
testsSimple tests
Total costs
Direct plus distributed costs
$1,160 $2,400 $8,000 $4,000 $15,560
Depreciation dollarsa
$200 $2,000 $3,000 $800 $6,000
Labor hours 20,000 10,000 10,000 40,000
aDepreciation dollars are included in direct cost fi gures. For example, the $1,160,000 of costs in the Maintenance Department includes $200,000 of depreciation.
ASSIGNMENT 1. Allocate the support center costs to mission centers using the step-down method, and deter-
mine the relevant total costs. Begin with the Maintenance Department.
2. To what use would you put this information? Please be specifi c: what are the next steps you would take based on this information?
CASE 1.1: HARBOR CITY COMMUNITY CENTER Prepared by David W. Young. Copyright © 2008 by David. W. Young.
Our defi cit is increasing, and we obviously have to reverse that trend if we ’ re going to become solvent. But, for that, we have to know where our costs are, in particular the cost of each of the services we offer.
In March, Liz Conaway, executive director of the Harbor City Community Center, expressed concern to Frank Simi, her new accountant, about the Center ’ s cost accounting system. The extensive funding Harbor City had received during its early years was decreasing and Ms. Conaway wanted to prepare the center to be self suffi cient, yet she lacked critical cost information.
Background Harbor City Community Center had been established some 20 years earlier by a consor-tium of community groups. Situated in Torrance, an inner - city residential neighborhood
c01.indd 30c01.indd 30 9/2/08 6:27:52 PM9/2/08 6:27:52 PM

Chapter 1 Essentials of Full - cost Accounting 31
of Los Angeles, California, the center provided comprehensive services to residents of Torrance and neighboring communities. It continued to maintain strong ties with the com-munity groups responsible for its development and subsequent acceptance in Torrance.
Funding of Harbor City was initially provided by the Federal government as part of an attempt by the Department of Health and Human Services to provide broad based community services to inner - city poverty areas in the United States. When these operat-ing funds were depleted two years ago, the city of Torrance supplemented Harbor City ’ s income with a small three - year grant. Because Ms. Conaway realized that foundation and government support could not continue indefi nitely, she intended to make the center self - suffi cient as soon as possible. Harbor City ’ s income statement is contained in Exhibit 1 .
The center contained eight client - service departments: Homemaker Service, Family Planning, Counseling, Parents ’ Advocacy, Mental Health, Alcohol Rehabilitation, Com-munity Outreach, and Referral and Placement. In addition, the center had a Training and Education Department. The center had twenty - two paid employees and a volunteer staff of six to ten students acquiring clinical and managerial experience.
Community Outreach, which had been designed by Harbor City ’ s consumers, was a multidisciplinary department providing a link between the health and social services at the center and the schools services of the community. The department was staffed by a part - time speech pathologist, a part - time learning specialist, and a full - time nutritionist.
The Referral and Placement service was for people whom the center felt, at the time it received a referral, it could not serve; the staff tried to locate another agency to serve the person. Parents ’ Advocacy did not serve clients directly but rather worked on behalf of clients who were having diffi culty with housing, schools, and so forth.
Existing Information System Harbor City ’ s previous accountant had established a system to determine the cost per client - visit (or related activity such as advocacy). According to this method, shown in Exhibit 2 , the cost was a yearly average for all client visits. The accountant would fi rst determine the direct cost of each department. He would then add overhead costs (such as administration, rent, and utilities) to the total cost of all the departments to determine the community center ’ s total costs. Finally, he would divide the total by the year ’ s number of visits. Increased by an anticipated infl ation fi gure for the following year, this number became the projected cost per visit for the subsequent year.
In reviewing this method with Mr. Simi, Ms. Conaway explained the problems she perceived. She said that although she realized this was not a precise method of determin-ing cost for clients, the center ’ s cost per visit had to be held at a reasonable level in order to keep its services accessible to as many community residents as possible. Additionally, she anticipated complications in determining the cost per visit for each of Harbor City ’ s departments:
You have to consider that our overhead costs, like administration and rent, have to be included in the cost per visit. That ’ s easy to do when we have a single cost, but I ’ m not certain how to go about it when determining costs on a departmental basis.
c01.indd 31c01.indd 31 9/2/08 6:27:53 PM9/2/08 6:27:53 PM

32 Management Accounting in Health Care Organizations
Furthermore, it ’ s important to point out that some of our departments provide ser-vices to others. Parents ’ Advocacy, for example. There are three social workers in that department, all earning the same salary. But one works exclusively for Counseling, and another divides her time evenly between Family Planning and Homemaker Service. Only the third spends his entire time in the Advocacy Department seeing clients who don ’ t need other social services, although he occasionally refers clients to other social work-ers. In the Alcohol Rehabilitation Department, the situation is more complicated. We have two part - time MSWs, each earning $ 48,000 a year, and one part - time bachelor degree social worker earning $ 32,000. The two MSWs yearly see about 1,500 clients who need general social work counseling, but they also spend about 50 percent of their time in other departments. The BA social worker cuts pretty evenly across all depart-ments, except Referral and Placement of course.
Mr. Simi added a further dimension:
I ’ ve spent most of my time so far trying to get a handle on allocating these overhead costs to the departments. It ’ s not an easy job, you know. Administration, for example, seems to help everyone about equally, yet I suppose we might say more administrative time is spent in the departments where we pay more salaries. Rent, on the other hand, is pretty easy; it can be done on a square - foot basis. We could classify utilities according to usage if we had meters to measure electricity, phone usage and so forth, but because we don ’ t, we have to do that on a square - foot basis as well. This applies to cleaning too, I guess. It seems that recordkeeping can be allocated on the basis of the number of records, and each department generates one record per client visit.
Training and Education (T & E) is the most confusing. Some departments don ’ t use it at all, but others use it regularly. I guess the fairest would be to charge for it on an hourly basis. Since there are two people in the department, each working about 2,000 hours a year, the hourly charge would be about $ 16.00. But this is a bit unfair, since T & E also uses supplies, space, and administrative time. So we should include those costs in its hourly rate. Thus, the process is confusing, and I haven ’ t really decided how to sort it out. However, I have prepared data on fl oor space and T & E usage. [See Exhibit 3 .]
As Ms. Conaway looked toward the rest of the year, she decided she needed a precise cost fi gure for each department. The center was growing, and she estimated that total cli-ent volume would increase by about 10 percent during the year, spread evenly over each department. She anticipated that costs would also increase by about 10 percent. She asked Mr. Simi to prepare a step - down analysis for the prior year so that they would know Har-bor City ’ s costs for each department. She planned to use this information to assist her in projecting costs for the current year.
ASSIGNMENT 1. What is the cost per visit for each department?
2. How might this information be used by Ms. Conaway?
c01.indd 32c01.indd 32 9/2/08 6:27:53 PM9/2/08 6:27:53 PM
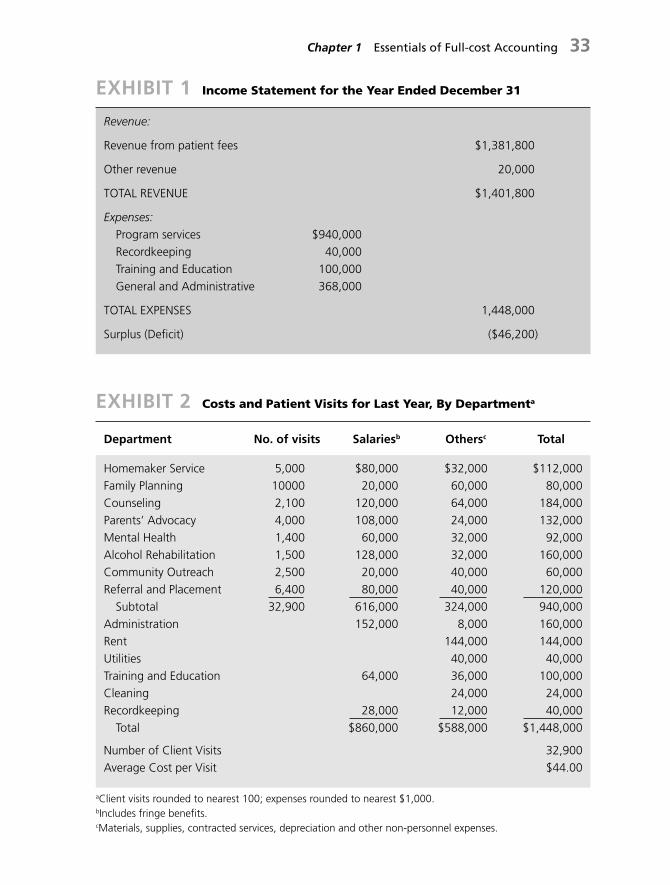
Chapter 1 Essentials of Full - cost Accounting 33
EXHIBIT 2 Costs and Patient Visits for Last Year, By Departmenta
Department No. of visits Salariesb Othersc Total
Homemaker Service 5,000 $80,000 $32,000 $112,000Family Planning 10000 20,000 60,000 80,000Counseling 2,100 120,000 64,000 184,000Parents’ Advocacy 4,000 108,000 24,000 132,000Mental Health 1,400 60,000 32,000 92,000Alcohol Rehabilitation 1,500 128,000 32,000 160,000Community Outreach 2,500 20,000 40,000 60,000Referral and Placement 6,400 80,000 40,000 120,000 Subtotal 32,900 616,000 324,000 940,000Administration 152,000 8,000 160,000Rent 144,000 144,000Utilities 40,000 40,000Training and Education 64,000 36,000 100,000Cleaning 24,000 24,000Recordkeeping 28,000 12,000 40,000 Total $860,000 $588,000 $1,448,000
Number of Client Visits 32,900Average Cost per Visit $44.00
aClient visits rounded to nearest 100; expenses rounded to nearest $1,000.bIncludes fringe benefi ts.cMaterials, supplies, contracted services, depreciation and other non-personnel expenses.
EXHIBIT 1 Income Statement for the Year Ended December 31
Revenue:
Revenue from patient fees $1,381,800
Other revenue 20,000
TOTAL REVENUE $1,401,800
Expenses: Program services $940,000 Recordkeeping 40,000 Training and Education 100,000 General and Administrative 368,000
TOTAL EXPENSES 1,448,000
Surplus (Defi cit) ($46,200)
c01.indd 33c01.indd 33 9/2/08 6:27:53 PM9/2/08 6:27:53 PM

34 Management Accounting in Health Care Organizations
CASE 1.2: CARROLL HOSPITAL Prepared by David W. Young with assistance from Robert Goldszer, M.D. Financial support for its preparation was provided by the Alliance for Academic Internal Medicine, Washington D.C. Copyright © 2008 by David W. Young.
This report doesn ’ t describe where our costs are generated. We ’ re applying one standard to all patients, regardless of their level of care. What incentive is there to identify and account for the costs of each type of procedure? Unless I have better cost information, all our attempts to control costs will focus on decreasing the number of days spent in the hospital. This limits our options. In fact, it ’ s not even an appropriate response to senior management ’ s mandate.
The speaker was Ann Julian, M.D., chief of the Department of Obstetrics and Gyne-cology at Carroll Hospital, a medium - sized tertiary care facility. After reviewing the most recent cost report for her department, Dr. Julian had some serious concerns, and was meeting with Jonathan Haskell, the director of Fiscal Affairs, whose department had gen-erated the report. Dr. Julian continued:
Not only that, but over half the costs are not even within my control. How am I supposed to exert any infl uence over Dietary or Housekeeping, for example? I also know from experience that the cost fi gure the hospital is using for a simple lab test, such as a CBC,
EXHIBIT 3 Floor Space and Training and Education Usagea
Department Floor spaceb T & E usagec
Homemaker Service 1,000 1,000Family Planning 1,300 200Counseling 1,800 2,400Parents’ Advocacy 300 100Mental Health 1,000 ---Alcohol Rehabilitation 500 ---Community Outreach 1,100 100Referral and Placement 1,000 200Administration 500 ---Recordkeeping 300 ---Training and Education 1,200 ---Total 10,000 4,000
aRounded to nearest 100bIn square feetcIn hours per year rounded to the nearest 100
c01.indd 34c01.indd 34 9/2/08 6:27:54 PM9/2/08 6:27:54 PM

Chapter 1 Essentials of Full - cost Accounting 35
is exorbitant. And it ’ s likely that some of the other clinical services shown on my report are too expensive as well. But I can ’ t do anything about it!
Background Two years ago, in an effort to control rising hospital costs, Carroll ’ s senior management had instituted spending limits and had made each department responsible for keeping its total costs at or below the limit determined during annual budget negotiations. Ob - Gyn, like many other departments, had felt the pinch.
Some years earlier, Carroll had established a departmental cost accounting system, and now, with the support of its medical staff leadership, Carroll required each service chief to become involved in the hospital ’ s budgeting process and to take responsibility for the costs associated with the care of patients in his or her department. By involving service chiefs in the budgeting and control process, Carroll ’ s senior management hoped to gain more control over its costs and to improve the hospital ’ s overall fi nancial performance.
The Cost Accounting System Carroll ’ s cost accounting system was based on three costing units: a bed/day for inpatient care, a visit for outpatient care, and a procedure (or operation) for operating rooms. Each department was required to compute its unit costs, such as a cost per bed/day for inpatient care, and report them to senior management monthly. Senior management planned to use the information for cost comparisons, and it expected that each chief would make cross - department comparisons as part of its cost - control efforts.
Under Mr. Haskell ’ s leadership, Carroll had begun to use standard costing units for its clinical care departments (such as Ob - Gyn), and it had begun to use similar units for its clinical service departments, such as Radiology, Laboratory, and the Pharmacy. In Radiology, for example, the unit was a procedure, and Mr. Haskell ’ s staff computed an average cost per procedure each month. The monthly Radiology costs for each clinical care department then were computed by multiplying this average by the number of proce-dures its physicians had ordered that month. The same was true in the Laboratory, where the unit was a test, and in the Pharmacy, where it was a fi lled prescription.
To calculate the cost per bed/day for a clinical care department, the Fiscal Affairs staff fi rst computed that department ’ s direct costs. Then, using the above methodology, it added the costs of the tests, procedures, and prescriptions the department ’ s physicians had ordered from the clinical service departments. It called these purchased clinical ser-vices. Finally, it allocated the hospital service center costs, such as Dietary, Laundry, and Housekeeping, to the department, using allocation bases (such as space, meals, and hours of service) that had been specifi ed by the hospital ’ s accounting department. The result for Dr. Julian ’ s department is shown in Exhibit 1 . Exhibit 1 also shows the units used for the clinical service departments, and the bases used for allocating service center costs.
After fi scal affairs had determined a clinical care department ’ s direct costs, added the costs, for clinical services, and allocated the service center costs, it calculated the aver-age cost per unit by dividing the department ’ s total costs by its number of bed/days.
c01.indd 35c01.indd 35 9/2/08 6:27:59 PM9/2/08 6:27:59 PM

36 Management Accounting in Health Care Organizations
The average for inpatient surgery - gynecology is shown at the bottom of Exhibit 1 . Exhibit 2 shows the average cost per unit for several other surgical specialty departments.
After reviewing his department ’ s cost report, Dr. Julian felt that the obstetrics service was fairly well defi ned in terms of its costs. By contrast, surgical gynecology presented a problem. She commented:
Gynecological procedures are less amenable to assignment into cost categories. This is mainly because of the age range and diversity of the patients, but it ’ s also due to the distinctions among the surgical subspecialties in gynecology. Because of this, the present cost accounting system is of little use for gynecology cases. This is extremely frustrat-ing, especially since the hospital is expecting me to use this information to manage the department ’ s costs. The average fi gure simply does not account for the real use of clinical resources by gynecology patients.
Mr. Haskell disagreed:
Dr. Julian just doesn ’ t understand. This system is ideal for comparative purposes. It allows me to quickly compare the costs among different departments within the hospital. It also helps me to compare the cost of a particular department at Carroll with a similar depart-ment at another hospital. Additionally, I can use the information to estimate the cost of treating an entire illness at Carroll. For example, with this system, I can easily determine the approximate cost of treating a patient having a total abdominal hysterectomy [TAH] and compare it to other hospitals.
According to Mr. Haskell ’ s fi gures, the cost of a non - oncology TAH (a procedure in which the uterus, fallopian tubes, and ovaries are removed; if it is done for reasons other than cancer, it is classifi ed as a non - oncology procedure), which usually required four days in the hospital) was $ 3,708 ( $ 927 � 4). To this would be added the cost of a major operation with general anesthesia, or $ 1,197. (The procedure might instead be performed with epidural or spinal anesthesia at the discretion of the attending physician and the anesthesia staff, in which case the total cost of the procedure would be slightly less.)
The inpatient operating room costs were based on a two - year study, and the fi gures were updated regularly by the fi scal affairs department. At present, Dr. Julian was not held accountable for these costs nor for the costs of anesthesia management. She was responsible only for the costs associated with the pre - and postoperative care of the patients in his department. These costs were the ones causing her diffi culty. She continued:
Some patients, especially those undergoing treatment for cancer, use more resources than others. This is mainly because the testing and therapeutic treatment of patients var-ies widely. Some patients require more or fewer diagnostic and therapeutic interventions, depending on their admitting diagnoses. For example, radiation therapy is used almost exclusively by oncology patients.
Somehow, a good cost accounting system needs to recognize these differences. I also don ’ t want my department to appear overly costly simply because some patients don ’ t conform to the norm. The current cost accounting system just doesn ’ t account for
c01.indd 36c01.indd 36 9/2/08 6:27:59 PM9/2/08 6:27:59 PM

Chapter 1 Essentials of Full - cost Accounting 37
the differences among patients. As a result, it doesn ’ t give me the data I need to manage costs, and it includes a variety of items that I can ’ t control.
The Use of Clinical Distinctions After some discussion, Dr. Julian convinced Mr. Haskell that the average unit cost calcu-lation could be revised to account for the differences among patients having different gynecology procedures. In an effort to address these clinical differences, the two decided that gynecology patients could be divided into three categories according to clinical subspecialty:
1. General Gynecology/Urogynecology (non - oncology)
2. Reproductive/In Vitro Fertilization (IVF)
3. Oncology
With the help of Dr. Julian, Mr. Haskell calculated time and material estimates for each type of patient stay. For example, he estimated that, in general, more medication was used on Oncology patients than on General Gynecology patients. Also, Oncology patients were likely to need more of a variety of other resources, such as lab tests, drugs, and X - rays.
Mr. Haskell conferred with his staff about the best method to apportion the department ’ s costs among the three subspecialties. After much discussion, they decided to apportion most of them according to the number of patient days per subspecialty. They made some adjust-ments, however, to refl ect unusual circumstances. The results are shown in Exhibit 3 .
Dr. Julian and Mr. Haskell performed some calculations and compared the differ-ences between the two systems. They fi rst computed the cost of a non - oncology TAH using each system. Dr. Julian noted that the procedure generally took place in the General Gynecology category. They then compared the costs of patients undergoing two other procedures. One was a tuboplasty, a procedure in which the fallopian tube is opened or its lumen (passage) is reestablished. The other was a TAH with lymph node dissection. In this operation, the lymph nodes in the pelvic region are excised. The tuboplasty would take place in the Reproductive - IVF category, and the TAH with lymph node dissection ordinarily would be classifi ed in the Oncology category.
Although this new system maintained bed/days as the costing unit, Mr. Haskell concluded that it was more accurate than the current one because there were now three average costs per bed/day: one for General Gynecology/Urogynecology, another for Reproductive - IVF, and a third for Oncology. Dr. Julian and Mr. Haskell concluded that this specialty - based system could greatly increase Dr. Julian ’ s ability to control costs.
Intensities of Care After Dr. Julian had compared a few more specialty - based costs of care, she continued to harbor some concerns about the new system. Although it was an improvement over the average bed/day calculation, it still had problems. She was particularly disturbed about the intensities of medical and nursing attention given to patients within each subspecialty.
c01.indd 37c01.indd 37 9/2/08 6:28:01 PM9/2/08 6:28:01 PM

38 Management Accounting in Health Care Organizations
She explained to Mr. Haskell that, for example, a TAH patient with cancer required more nursing and medical care on the second postoperative day than did a patient receiving laparoscopy, even if both patients were classifi ed in the Oncology category.
The new system did not address these differences. In fact, the system made it appear as if all Oncology patients received the same amount of care on a given day in the hospi-tal. From a clinical perspective, this clearly was not the case. Because of this, Dr. Julian felt that the subspecialty breakdown was still not a suffi ciently accurate measure of the costs of care rendered to different patients. Working on her own, she developed a third cost accounting method based on levels of care delivered by the nursing and medical teams. In developing this new method, she divided the department ’ s costs into three cate-gories that were quite different from the ones used by Mr. Haskell:
1. Daily patient maintenance
2. Medical treatment
3. Nursing care
Dr. Julian decided that medical treatment could be measured with an index of non-nursing clinical intensity. She worked with two other physicians in the department to determine the amount of Laboratory, Diagnostic Radiology, Therapeutic Radiology, and Pharmacy resources that would be used by a typical patient with a TAH (non - oncology), a TAH (oncology), and a tuboplasty. She then translated these resources into units that could be counted and totaled easily.
Dr. Julian knew that this type of information was not completely accurate. For example, a TAH (non - oncology) patient in relatively good health would need fewer tests and drugs than a somewhat older patient or a patient with complications. This could result in higher or lower medical intensity, even though the number of medical treatment units in the system would be the same for all patients with the same procedure. Despite these problems, she felt that she now had a way to measure medical resource use fairly accurately.
Levels of nursing care proved to be similarly complicated. Dr. Julian consulted with nurses on the Gynecology fl oor and, with them, developed a system to measure patient care needs. They defi ned three basic levels of nursing care, which are described in Exhibit 4 . A patient could change levels during her stay, and, within each level, a patient could be assigned a range of units, depending upon the intensity of nursing services being provided.
In this third method, Dr. Julian expected to use not only bed/days as a costing unit, but also, the average number of medical treatment units and nursing units per procedure. She enlisted Mr. Haskell ’ s assistance in devising a means to divide costs among the cate-gories in his new system. The resulting cost breakdown is shown in Exhibit 5 .
Comparison of Costs To compare his new system with the others, Dr. Julian again calculated costs for the same three procedures. According to his calculations, each required the following:
c01.indd 38c01.indd 38 9/2/08 6:28:02 PM9/2/08 6:28:02 PM
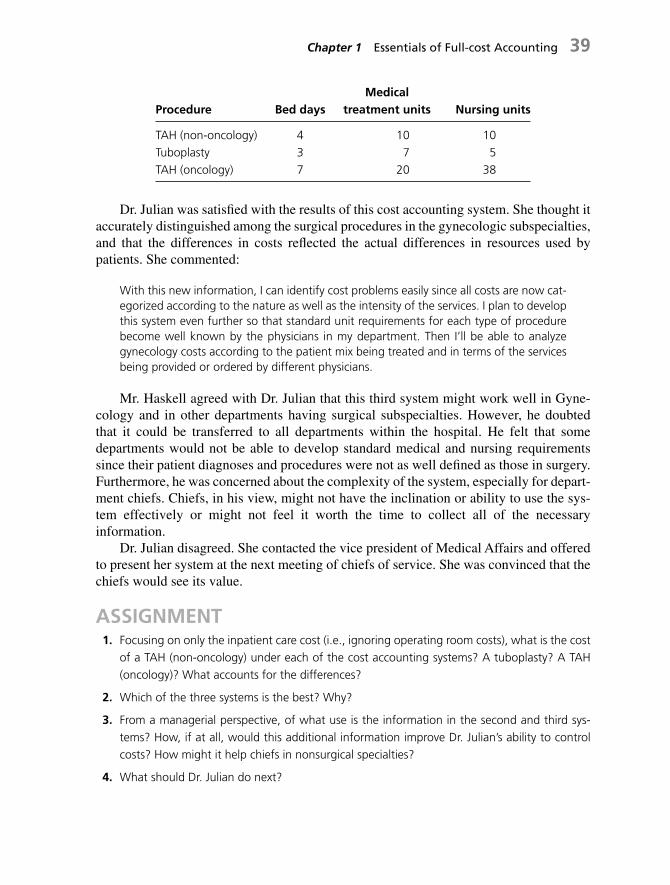
Chapter 1 Essentials of Full - cost Accounting 39
Procedure Bed days Medical
treatment units Nursing units
TAH (non - oncology) 4 10 10 Tuboplasty 3 7 5 TAH (oncology) 7 20 38
Dr. Julian was satisfi ed with the results of this cost accounting system. She thought it accurately distinguished among the surgical procedures in the gynecologic subspecialties, and that the differences in costs refl ected the actual differences in resources used by patients. She commented:
With this new information, I can identify cost problems easily since all costs are now cat-egorized according to the nature as well as the intensity of the services. I plan to develop this system even further so that standard unit requirements for each type of procedure become well known by the physicians in my department. Then I ’ ll be able to analyze gynecology costs according to the patient mix being treated and in terms of the services being provided or ordered by different physicians.
Mr. Haskell agreed with Dr. Julian that this third system might work well in Gyne-cology and in other departments having surgical subspecialties. However, he doubted that it could be transferred to all departments within the hospital. He felt that some departments would not be able to develop standard medical and nursing requirements since their patient diagnoses and procedures were not as well defi ned as those in surgery. Furthermore, he was concerned about the complexity of the system, especially for depart-ment chiefs. Chiefs, in his view, might not have the inclination or ability to use the sys-tem effectively or might not feel it worth the time to collect all of the necessary information.
Dr. Julian disagreed. She contacted the vice president of Medical Affairs and offered to present her system at the next meeting of chiefs of service. She was convinced that the chiefs would see its value.
ASSIGNMENT 1. Focusing on only the inpatient care cost (i.e., ignoring operating room costs), what is the cost
of a TAH (non - oncology) under each of the cost accounting systems? A tuboplasty? A TAH (oncology)? What accounts for the differences?
2. Which of the three systems is the best? Why?
3. From a managerial perspective, of what use is the information in the second and third sys-tems? How, if at all, would this additional information improve Dr. Julian ’ s ability to control costs? How might it help chiefs in nonsurgical specialties?
4. What should Dr. Julian do next?
c01.indd 39c01.indd 39 9/2/08 6:28:02 PM9/2/08 6:28:02 PM

40 Management Accounting in Health Care Organizations
EXHIBIT 1 Cost Center Report for Inpatient Surgery: Department of Gynecology
Direct costsWages: Physician services 1,881,160
Nursing service 1,301,170Clinical support staff 902,790Administrative staff 132,605 4,217,725
Supplies: Medical supplies 670,050Administrative supplies 205,150 875,200
174,000Capital equipment:
Depreciation on major purchasesMinor purchases 34,000 208,000
Total direct costs 5,300,925
Purchased clinical services Costing unitDiagnostic imaging Procedure 687,361Laboratory tests Test 923,986Radiotherapy Procedure 279,486Pharmaceutical Prescription 2,518,643 4,409,476
Allocated service center costs Allocation basisPatient Dietary Meal 626,430services: Laundry Kilogram 169,575
Housekeeping Square meter 154,260Medical records Record 127,720Social Service Hour of service 120,897 1,198,882
General Operation of plant Square foot 236,450services: Plant depreciation Square foot 382,680
Employee benefi ts Salaries 469,950Administration No. employees 1,000,300
Insurance Square foot 541,000 2,630,380Total purchased and allocated costs 8,238,738
Total costs 13,539,663
Average cost per day 927
c01.indd 40c01.indd 40 9/2/08 6:28:02 PM9/2/08 6:28:02 PM

Chapter 1 Essentials of Full - cost Accounting 41
EXHIBIT 2 Cost Summary for Surgical Specialties and Anesthesia
Inpatient cost by specialty Costing unit Total cost Average/Unit
General bed/day 11,871,305 797
Orthopedic bed/day 12,274,636 938
Neurosurgery bed/day 15,837,594 1,106
Gynecology bed/day 13,539,663 927
Obstetrics bed/day 9,483,625 819
Pediatrics bed/day 11,847,364 882
Total Inpatient 74,854,187
Anesthesia in inpatient operating rooms 13,789,475
Major/General procedure 1,197
Major/Epidural or Spinal procedure 1,163
Major/Local or Regional procedure 760
Minor/General procedure 589
Minor/Epidural or Spinal procedure 485
Minor/Local or Regional procedure 274
Anesthesia in emergency operating rooms 4,842,631
Minor/General anesthesia procedure 486
Minor/Local or Regional procedure 388
Minor/No anesthesia procedure 178
Total Cost 93,486,293
c01.indd 41c01.indd 41 9/2/08 6:28:03 PM9/2/08 6:28:03 PM

42 Management Accounting in Health Care Organizations
EXHIBIT 3 Cost Breakdown by Surgical Specialty: Department of Gynecology
General gynecology
Reproductive/IVF Oncology Total
Direct costs
Wages: Physician services 564,348 564,348 752,464 1,881,160Nursing services 455,410 260,234 585,527 1,301,170Clinical support staff 306,949 243,753 352,088 902,790Administrative staff 42,434 37,129 53,042 132,605
Supplies: Medical supplies 134,010 201,015 335,025 670,050Administrative supplies 67,700 67,700 69,751 205,150
Capital Depreciation on major purchases 34,800 87,000 52,200 174,000equipment: Minor purchases 5,100 15,300 13,600 34,000
Total direct costs 1,610,751 1,476,479 2,213,697 5,300,925
Purchased clinical servicesDiagnostic imaging 229,564 153,838 303,959 687,361Laboratory tests 295,384 241,745 386,857 923,986Radiotherapy 0 0 279,486 279,486Pharmaceutical 650,422 595,277 1,272,944 2,518,643Total purchased clinical services 1,175,370 990,860 2,243,246 4,409,476
Allocated service center costsPatient Dietary 180,480 136,490 309,460 626,430Services: Laundry 57,495 45,535 66,545 169,575
Housekeeping 49,090 43,030 62,140 154,260Medical records 30,930 31,850 64,940 127,720Social services 32,567 28,465 59,865 120,897Total patient services allocations 350,562 285,370 562,950 1,198,882
General Operation of plant 79,160 59,155 98,135 236,450services: Plant depreciation 102,230 113,370 167,080 382,680
Employee benefi ts 141,550 153,280 175,120 469,950Administration 200,060 390,117 410,123 1,000,300Insurance 195,771 187,243 157,986 541,000Total general services allocations 718,771 903,165 1,008,444 2,630,380
Total direct, purchased, and allocated 3,855,454 3,655,874 6,028,337 13,539,663
Number of bed/days 4,002 5,023 5,577 14,602
Cost per bed/day 963 728 1,081 927
c01.indd 42c01.indd 42 9/2/08 6:28:04 PM9/2/08 6:28:04 PM

Chapter 1 Essentials of Full - cost Accounting 43
EXHIBIT 4 Levels of Nursing Care
Level 1 Basic assistance (mainly for ambulatory patients) 1–3 unitsFeeds self without supervision or with family member.Toilets independently.Vital signs routine—daily temperature, pulse and respiration.Bedside humidifi er or blow bottle.Routine post-operation suction standby.Bathes self, bed straightened with minimal or no supervision.Exercises with assistance, once in 8 hours.Treatments once or twice in 8 hours.
Level 2 Periodic assistance 4–7 unitsFeeds self with staff supervision; I&O; or tubal feeding by patient.Toilets with supervision or specimen collection, or uses bedpan.
Hemovac output.Vital signs monitored; every 2 to 4 hours.Mist or humidifi ed air when sleeping, or cough and deep breathe
every 2 hours.Nasopharyngeal or oral suction prn.Bathed and dressed by personnel or partial bath given; daily change
of linen.Up in chair with assistance twice in 8 hours or walking with assistance.Treatments 3 or 4 times in 8 hours.
Level 3 Continual nursing care 8–10 unitsTotal feeding by personnel or continuous IV or blood transfusions or
instructing the patient. Tube feeding by personnel every 3 hours or less.Up to toilet with standby supervision or output measurement every
hour. Initial hemovac setup.Vital signs and observation every hour or vital signs monitored plus
neuro check.Blood pressure, pulse, respiration and neuro check every 30 minutes.Continuous oxygen, trach mist or cough and deep breathe every
hour. IPPB with supervision every 4 hours.Tracheostomy suction every 2 hours or less.Bathed and dressed by personnel, special skin care, occupied bed.Bed rest with assistance in turning every 2 hours or less, or walking
with assistance of two persons twice in 8 hours.Treatments more than every 2 hours.
Adapted from Poland, M., et al., “PETO—A System for Assisting and Meeting Patient Care Needs,” American Journal of Nursing, July 1970, 70:1479.
c01.indd 43c01.indd 43 9/2/08 6:28:04 PM9/2/08 6:28:04 PM

44 Management Accounting in Health Care Organizations
EXHIBIT 5 Level of Care System: Department of Gynecology
Daily patient maintenance
Medical treatment
Nursingcare Total
Direct costsWages: Physician services $1,881,160 $1,881,160
Nursing services $1,301,170 1,301,170Clinical support staff $17,345 429,756 455,689 902,790Administrative staff 132,605 132,605
Supplies: Medical supplies 229,310 328,140 112,600 670,050Administrative supplies 205,150 205,150
CapitalEquipment:
Minor purchases 6,748 17,928 9,324 34,000Depreciation on major purchases 35,276 138,724 174,000
Total direct costs $626,434 $2,795,708 $1,878,783 $5,300,925
Purchased clinical servicesDiagnostic imaging 687,361 687,361Laboratory tests 923,986 923,986Radiotherapy 279,486 279,486Pharmaceutical 2,518,643 2,518,643
Total purchased clinical services $4,409,476 $4,409,476
Allocated service center costsPatient Dietary 626,430 626,430services: Laundry 169,575 169,575
Housekeeping 154,260 154,260Medical records 127,720 127,720Social services 72,100 18,747 30,050 120,897
Total patient services allocations $1,150,085 $18,747 $30,050 $1,198,882
General Plant depreciation 382,680 382,680services: Operation of plant 236,450 236,450
Employee benefi ts 88,860 255,840 125,250 469,950Administration 1,000,300 1,000,300Insurance 465,000 12,585 63,415 541,000
Total general services allocations $2,173,290 $268,425 $188,665 $2,630,380
Total direct, purchased, and allocated $3,949,809 $7,492,356 $2,097,498 $13,539,663
Total days care 14,602
Cost per bed/day $270
Total medical treatment units 36,180
Cost per medical treatment unit $207
Total nursing units 49,754
Cost per nursing unit $42
c01.indd 44c01.indd 44 9/2/08 6:28:04 PM9/2/08 6:28:04 PM

Chapter 1 Essentials of Full - cost Accounting 45
CASE 1.3: ATHERTON MEDICAL EDUCATION PROGRAMS
Prepared by Sheila M. McCarthy and David W. Young, with support from the Alliance for Academic Internal Medicine. Copyright © 2008 by David W. Young and the Alliance for Academic Internal Medicine.
One of the major issues that we face going forward is how to be true to our core educational mission and at the same time meet the needs of Bennington Hospital, the Southwestern Healthcare Network, and the broader Atherton community. This is becom-ing increasingly diffi cult with the rising number of indigent patients, our relatively recent integration into the Southwestern Network, and the constant struggle we face as a community - based program to recruit and maintain faculty. We also need to continue to enhance the partnership between Bennington and AMEP and to design systems that satisfy all the stakeholders involved.
Mary W. Bethridge, M.D., residency program director for Internal Medicine at Ben-nington Hospital, was discussing some of the issues that faced her program and the Atherton Medical Education Programs (AMEP), of which her program was a part. She continued:
One of the issues that we continue to analyze is how to distribute the various revenue streams that come into the network in a way that is fair to all parties. Between our unique relationship with the City of Atherton and the evolving relationship between Bennington and ourselves, there is some confusion about the intent of some of the rev-enue that comes in and, just as important, some disagreements around who should bear the costs of the various activities that the money is meant to cover. Right now, we have a negative bottom line, but it may appear worse than it actually is. For example, we have a lot of costs in our budget related to indigent care. This is problematic because it makes it seem like education is very expensive, when in fact it may have more to do with the indigent care we provide. As a program director, I worry about this and the impact it might have on my program. I know that I have to have a really good understanding of the costs of my program as well as of the benefi ts that it brings to Bennington and to the Southwestern Network.
Henry Byron, M.D., medical director of AMEP, echoed Dr. Bethridge ’ s concerns.
I have been focusing a lot of my efforts on the business aspects of AMEP. Obviously, we are always concerned with the quality of the educational program; that is a given. As far as things beyond that, our situation is a little unusual because we have only been a part of the Southwestern Network for a relatively short time, and because of that we are still in the stage of getting acquainted with one another. We need to improve the fi nancials but also continue the educational mission. Everyone is challenged fi nancially in undergraduate and graduate education. We need to have our fi nancial ducks in a row, so to speak, so we can convince Southwestern that we add value to them and that they are getting their money ’ s worth.
A complication is that the education and the patient care are so inextricably linked that I fi nd it diffi cult and somewhat artifi cial to separate the two. Nevertheless, one of the things we have been trying to do is to separate the cost of education from the cost
c01.indd 45c01.indd 45 9/2/08 6:28:05 PM9/2/08 6:28:05 PM

46 Management Accounting in Health Care Organizations
of patient care. We assume that we have to fi rst cover the cost of our teaching program. We get money from various sources, and if you were to take all the monies that fl ow to us simply because we have a residency program, we are pretty much fi nancially neutral. On the books, Southwestern subsidizes us, but they don ’ t give us all the IME [Indirect Medical Education] money from Medicare; that goes to the hospital. If you were to say that instead of subsidizing us, they simply gave us the IME money, then I would say we are fi nancially neutral.
Drs. Byron and Bethridge knew that in the upcoming months some key decisions were going to be made regarding how funds were allocated between Bennington and AMEP, and more broadly, there would be strategic discussions about AMEP ’ s role in the Southwestern Healthcare Network. Given the importance of these issues, they saw an opportunity to present their own vision of AMEP and the most appropriate fi nancial model. They realized that this would not be an easy task and that there would be others who might have different views. Dr. Bethridge had decided to take the lead in analyzing some of these issues as they related to the Internal Medicine Residency Program.
Background Atherton Medical Education Programs (AMEP) was a community - based organization that operated fully accredited medical resident training programs. Its programs included Family Practice, Internal Medicine, OB/GYN, and Pediatrics. In addition, it offered inte-grated programs in surgery and OB/GYN in conjunction with St. Mary ’ s Hospital in a nearby city. It also offered a transitional year program and electives for fourth - year medi-cal school students.
AMEP ’ s primary goal was for each of its programs to “ develop educational excel-lence and innovation to enhance the residency training in a community setting. ” A related goal was that each program would “ provide excellent, faculty - supervised patient care at Bennington Hospital, Atherton - Taylor County Health Department Clinics, St. David ’ s Hospital, Blackstone Family Practice Academic Associates, and numerous private set-tings, that provided primary care and specialty experiences for resident education. ”
AMEP had the following specifi c objectives:
Training competent, compassionate physicians through its primary care graduate medical education programs, transitional residency, and affi liated programs in sur-gery and in obstetrics and gynecology. Improving health care delivery in the greater metro area by participating as the pro-viders of the safety net of care and, in so doing, delivering only the highest - quality medical care to the indigent population of Atherton and of Taylor County. Developing undergraduate clerkships to enhance clinical training of state university medical students at both the junior and senior levels. Acting as the administrative and developmental body for regional programs in con-tinuing medical education and research, with research concentrating on each resi-dency program ’ s requirements in the areas of clinical medicine, health care delivery, quality assurance, and education.
■
■
■
■
c01.indd 46c01.indd 46 9/2/08 6:28:05 PM9/2/08 6:28:05 PM

Chapter 1 Essentials of Full - cost Accounting 47
AMEP was established in 1972 by the Taylor County Medical Society and had a long tradition of collaborating with Bennington Hospital, which sponsored and served as the primary site for AMEP ’ s residency programs. In addition to its teaching and clinical care, AMEP conducted a limited amount of research related to its residency requirements.
Bennington Hospital Bennington was an acute care hospital and outpatient facility that served as the area ’ s only trauma center as well as the safety net hospital for the medically indigent of Taylor County. Until 1995, it was run by the City of Atherton.
In October 1995, Southwestern Healthcare Network took over management of Ben-nington through a twenty - fi ve - year lease agreement with the City of Atherton. Under the terms of the agreement, Southwestern would pay $ 2.2 million annually to lease the hospital from the city. The city would continue to provide reimbursement for indigent patients who received care at Bennington, including the uninsured and those enrolled in the city ’ s Health Assistance Program. At the time of the lease this reimbursement totaled $ 11 mil-lion annually, with some $ 5.6 million dedicated to physician services for the indigent.
Southwestern Healthcare Network The Southwestern Healthcare Network (South-western), a nonprofi t organization, was a member of a larger health care network that spanned sixteen states and had more than 87,000 employees. As the leading health care service provider in Taylor County, Southwestern had approximately 766,000 outpatient visits and close to 50,000 admissions annually. As Exhibit 1 indicates, it also contributed more than $ 84 million in charity care and community benefi ts in 2000. In that same year, its facilities and programs served more than 203,000 people through charity care and community benefi t activities.
Hazel Patterson, Ph.D., Southwestern ’ s acting CEO, commented on the importance of Southwestern ’ s community service mission:
As an organization, Southwestern is fully committed to caring for the uninsured and indi-gent of this community. We see ourselves taking a leadership role in setting up systems that allow us and other providers to better meet the needs of this population. Obviously, the need has increased since the time we entered the lease with the city. Nevertheless, caring for the poor and uninsured is a core part of our mission.
AMEP - Bennington Relationship AMEP and Bennington had a long history of collaboration around graduate medical education (GME) and care for the indigent. When Southwestern fi rst took over the man-agement of Bennington, it contracted with AMEP for physician services for the indigent. Dr. Patterson explained the rationale:
Clearly, we entered into our current relationship with AMEP because of the lease with Bennington and because the physicians who serve the uninsured in our community are primarily the physicians of AMEP. Having said that, I don ’ t think that there ’ s any doubt here that AMEP exists with a mission that is primarily dedicated to graduate medical education and, secondarily, to indigent care. One of the worrisome things is that because of a lack of a reasonable public policy regarding care for the uninsured, we haven ’ t
c01.indd 47c01.indd 47 9/2/08 6:28:05 PM9/2/08 6:28:05 PM
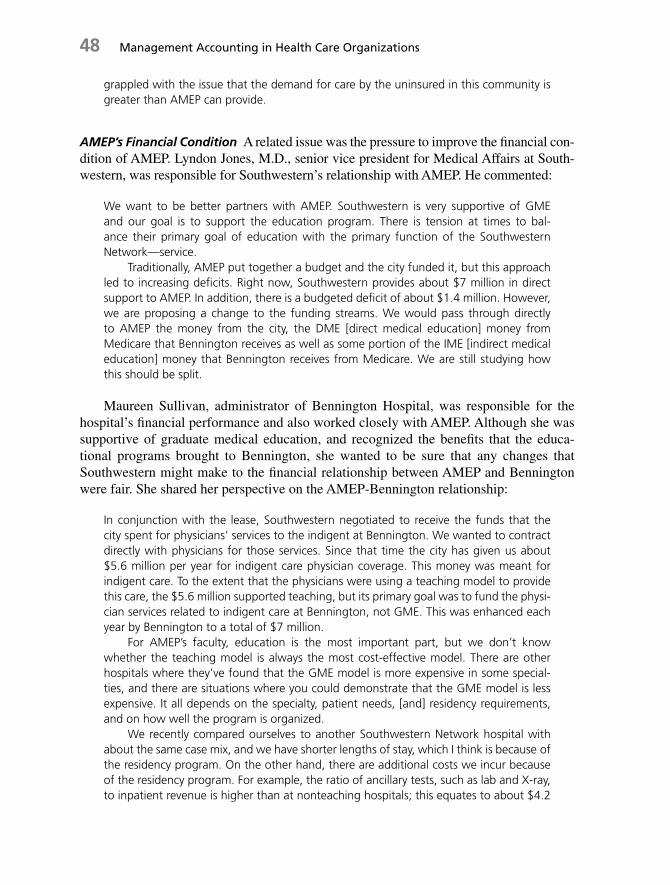
48 Management Accounting in Health Care Organizations
grappled with the issue that the demand for care by the uninsured in this community is greater than AMEP can provide.
AMEP ’ s Financial Condition A related issue was the pressure to improve the fi nancial con-dition of AMEP. Lyndon Jones, M.D., senior vice president for Medical Affairs at South-western, was responsible for Southwestern ’ s relationship with AMEP. He commented:
We want to be better partners with AMEP. Southwestern is very supportive of GME and our goal is to support the education program. There is tension at times to bal-ance their primary goal of education with the primary function of the Southwestern Network — service.
Traditionally, AMEP put together a budget and the city funded it, but this approach led to increasing defi cits. Right now, Southwestern provides about $ 7 million in direct support to AMEP. In addition, there is a budgeted defi cit of about $ 1.4 million. However, we are proposing a change to the funding streams. We would pass through directly to AMEP the money from the city, the DME [direct medical education] money from Medicare that Bennington receives as well as some portion of the IME [indirect medical education] money that Bennington receives from Medicare. We are still studying how this should be split.
Maureen Sullivan, administrator of Bennington Hospital, was responsible for the hospital ’ s fi nancial performance and also worked closely with AMEP. Although she was supportive of graduate medical education, and recognized the benefi ts that the educa-tional programs brought to Bennington, she wanted to be sure that any changes that Southwestern might make to the fi nancial relationship between AMEP and Bennington were fair. She shared her perspective on the AMEP - Bennington relationship:
In conjunction with the lease, Southwestern negotiated to receive the funds that the city spent for physicians ’ services to the indigent at Bennington. We wanted to contract directly with physicians for those services. Since that time the city has given us about $ 5.6 million per year for indigent care physician coverage. This money was meant for indigent care. To the extent that the physicians were using a teaching model to provide this care, the $ 5.6 million supported teaching, but its primary goal was to fund the physi-cian services related to indigent care at Bennington, not GME. This was enhanced each year by Bennington to a total of $ 7 million.
For AMEP ’ s faculty, education is the most important part, but we don ’ t know whether the teaching model is always the most cost - effective model. There are other hospitals where they ’ ve found that the GME model is more expensive in some special-ties, and there are situations where you could demonstrate that the GME model is less expensive. It all depends on the specialty, patient needs, [and] residency requirements, and on how well the program is organized.
We recently compared ourselves to another Southwestern Network hospital with about the same case mix, and we have shorter lengths of stay, which I think is because of the residency program. On the other hand, there are additional costs we incur because of the residency program. For example, the ratio of ancillary tests, such as lab and X - ray, to inpatient revenue is higher than at nonteaching hospitals; this equates to about $ 4.2
c01.indd 48c01.indd 48 9/2/08 6:28:05 PM9/2/08 6:28:05 PM
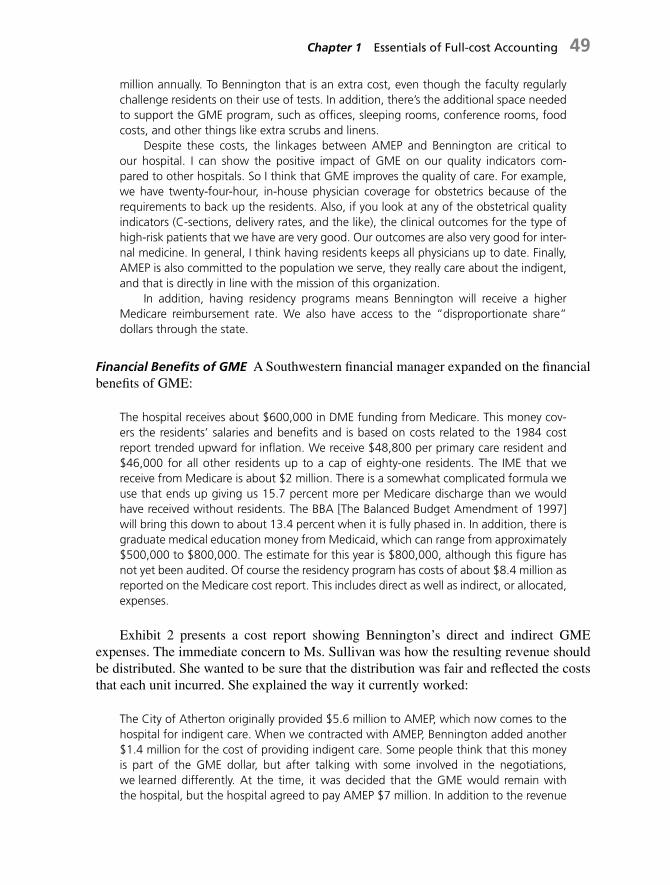
Chapter 1 Essentials of Full - cost Accounting 49
million annually. To Bennington that is an extra cost, even though the faculty regularly challenge residents on their use of tests. In addition, there ’ s the additional space needed to support the GME program, such as offi ces, sleeping rooms, conference rooms, food costs, and other things like extra scrubs and linens.
Despite these costs, the linkages between AMEP and Bennington are critical to our hospital. I can show the positive impact of GME on our quality indicators com-pared to other hospitals. So I think that GME improves the quality of care. For example, we have twenty - four - hour, in - house physician coverage for obstetrics because of the requirements to back up the residents. Also, if you look at any of the obstetrical quality indicators (C - sections, delivery rates, and the like), the clinical outcomes for the type of high - risk patients that we have are very good. Our outcomes are also very good for inter-nal medicine. In general, I think having residents keeps all physicians up to date. Finally, AMEP is also committed to the population we serve, they really care about the indigent, and that is directly in line with the mission of this organization.
In addition, having residency programs means Bennington will receive a higher Medicare reimbursement rate. We also have access to the “ disproportionate share ” dollars through the state.
Financial Benefi ts of GME A Southwestern fi nancial manager expanded on the fi nancial benefi ts of GME:
The hospital receives about $ 600,000 in DME funding from Medicare. This money cov-ers the residents ’ salaries and benefi ts and is based on costs related to the 1984 cost report trended upward for infl ation. We receive $ 48,800 per primary care resident and $ 46,000 for all other residents up to a cap of eighty - one residents. The IME that we receive from Medicare is about $ 2 million. There is a somewhat complicated formula we use that ends up giving us 15.7 percent more per Medicare discharge than we would have received without residents. The BBA [The Balanced Budget Amendment of 1997] will bring this down to about 13.4 percent when it is fully phased in. In addition, there is graduate medical education money from Medicaid, which can range from approximately $ 500,000 to $ 800,000. The estimate for this year is $ 800,000, although this fi gure has not yet been audited. Of course the residency program has costs of about $ 8.4 million as reported on the Medicare cost report. This includes direct as well as indirect, or allocated, expenses.
Exhibit 2 presents a cost report showing Bennington ’ s direct and indirect GME expenses. The immediate concern to Ms. Sullivan was how the resulting revenue should be distributed. She wanted to be sure that the distribution was fair and refl ected the costs that each unit incurred. She explained the way it currently worked:
The City of Atherton originally provided $ 5.6 million to AMEP, which now comes to the hospital for indigent care. When we contracted with AMEP, Bennington added another $ 1.4 million for the cost of providing indigent care. Some people think that this money is part of the GME dollar, but after talking with some involved in the negotiations, we learned differently. At the time, it was decided that the GME would remain with the hospital, but the hospital agreed to pay AMEP $ 7 million. In addition to the revenue
c01.indd 49c01.indd 49 9/2/08 6:28:06 PM9/2/08 6:28:06 PM

50 Management Accounting in Health Care Organizations
AMEP receives from Southwestern related to indigent care and GME, AMEP also gets the billings and collections for all the patients they see at Bennington. We are about 23 percent self - pay [patients], and approximately 75 percent are billable, which includes Medicaid. In addition, AMEP received another grant from the network to balance its budget. Again, that is right off the top, because the network services unit has no rev-enue sources.
I believe we should have a formal contract to clearly identify and value what Bennington provides and to identify the value of what AMEP provides in this partnership. We look at AMEP as a very valuable partner — they need to know what we are providing them and we need to acknowledge what they are providing us. I look forward to con-tinuing our current relationship with AMEP, and I will continue to challenge them to work with us to improve our quality of patient care and be more cost effective.
A complication in understanding the revenue and expenses was the diffi culty in iden-tifying which costs were related to care for the indigent and the hospital ’ s needs and which were related to education. Indeed, that was one of the major issues that Dr. Bethridge hoped to sort out for the Internal Medicine Residency Program.
Internal Medicine Residency Program The Internal Medicine Program had thirty residents and was staffed by seven full - time sal-aried faculty members and thirty - fi ve contracted physicians. Its residents rotated through a variety of subspecialties including Gastroenterology, Pulmonary/Critical Care, Cardiology, Nephrology, Infectious Diseases, Endocrinology, Rheumatology, Hematology/Oncology, Allergy, Dermatology, and Neurology. Exhibit 3 illustrates a schedule of rotations. While in their training program, residents received an annual salary as well as benefi ts. A fi rst - year resident ’ s salary was $ 34,000, second - year residents received $ 35,300, and third - year residents received $ 36,600. Fellows and fourth - year chief residents received $ 52,300.
Residents typically worked as part of a ward team that included one attending physi-cian, two second - or third - year residents, and two interns (fi rst - year residents). There were four of these teams, plus one overfl ow team to pick up the excess capacity. One of the issues that Dr. Bethridge had to manage was the set of guidelines put forth by the Resi-dency Review Committees that placed caps on the number of patients that residents could admit. She commented:
In order to provide coverage for the hospital, we rely on the other programs, like Family Practice, to help us. Internal Medicine could never provide all the coverage that is needed and meet our educational objectives. I ’ ve got to be careful not to overload our residents. One of the ways to do this would be to use hospitalists, but I would need to justify this not just on the educational merits but also fi nancially.
Resident Activities The following Residency Program Analysis contains some informa-tion on the services provided by AMEP ’ s residents.
c01.indd 50c01.indd 50 9/2/08 6:28:06 PM9/2/08 6:28:06 PM

Chapter 1 Essentials of Full - cost Accounting 51
Residents’ provision of 24-hour/7-day-a-week coverage at Bennington and Children’s Hospital
Internal Medicine: 13 residents on General Medicine Service, 3 in ICUPediatrics: 7–9 residents on General Pediatric Service, 5 in Pediatric and Neonatal Intensive Service, 2 in Nursery, 1 in EROB/GYN: 7 residentsSurgery: 4 residents in general/trauma, 1 in pediatricsPsychiatry elective: 1–2 residents
Residents’ service in clinics
Internal Medicine
The Clinic at BenningtonSpecialty care from City Clinics, People’s ClinicInternal Medicine Resident Continuity Clinic (38% of resident’s clinic needs)Multiple subspecialties—electives (2–4 residents also provide inpatient consultation)5,400 visits per year
Other Continuity ClinicsCity Clinics (50% of resident’s clinic needs)VA Clinic (12% of resident’s clinic needs)
Pediatric
City Clinics: 14,500 visits per year (35% of resident’s clinic needs)
Subspecialty electives (15% of resident’s clinic needs)
Children’s Specialty Care Center (10% of resident’s clinic needs)
Continuity Clinic with private M.D.’s (15% of resident’s clinic needs)
Electives (15% of resident’s clinic needs)
Adolescent, Developmental, and so forth (10% of resident’s clinic needs)OB/GYN3,400 deliveries per year
The Clinic at Bennington: 7 clinics per week with 1–2 residents; 6,000 visits per year
City Clinics: $200,000 per year contract to provide 6 clinics per week
People’s Clinic: 3 clinics per week with 1–2 residentsSurgery
The Clinic at Bennington: 4,000 visits per year; 3 clinics per week; 4–6 residents per clinicFamily Practice
Blackstone Family Health Center: 20,000 visits per year
St. David’s Hospital: Inpatient service
Rotate at Bennington in Internal Medicine, Pediatrics, OB/GYN, Surgery ED, Psychiatry, electives
■
■
■
■
■
■
■
■
■
■
■
■
■
■
■
■
■
■
■
■
■
■
■
■
■
As indicated, Internal Medicine residents provided inpatient coverage for Benning-ton and also trained in both Bennington ’ s clinics and clinics run by the City of Atherton. Dr. Byron commented on some of the issues surrounding the clinics:
c01.indd 51c01.indd 51 9/2/08 6:28:06 PM9/2/08 6:28:06 PM

52 Management Accounting in Health Care Organizations
It ’ s diffi cult to compare clinic coverage here with coverage in other places. The amount of space is so limited. There are a variety of subspecialty clinics in the hospital and then we have about half of the space in the professional building. However, the main sites that we use for our residency programs are the city clinics, of which there are twelve. These are federally qualifi ed health centers, and we have a long - standing relationship provid-ing residents to these clinics. Since Southwestern bought Bennington, our relationship with the city clinics has been somewhat tense. I think they probably wonder if they could provide patient care for less money with private physicians. We are working with them to determine how best to work together. One of the problems on the clinic side is that they have their own scheduling system, which affects our performance. If we show up for a clinic and there are no appointments scheduled, our productivity looks bad. Nevertheless, the clinics are an integral part of the ambulatory training and continuity experience for our residents.
In addition to ward duty and clinics, residents also participated in curriculum confer-ences that were offered daily at noon. Some of these conferences were core didactic presentations by faculty, and others were case conferences presented by residents. In addition, there were the morning reports, interactive, case - based conferences offered daily at 7:00 A.M., and grand rounds, a weekly continuing medical education (CME) con-ference featuring national speakers.
Financial Performance The 2001 budget for the Internal Medicine Residency Program is contained in Exhibit 4 . The budget for AMEP overall is contained in Exhibit 5 . The Internal Medicine Residency Program, like all the other AMEP residency programs, was under pressure to improve its fi nancial performance. This was diffi cult because of the poor payer mix (Exhibit 6 ) and the fact that the budget contained both the training pro-gram costs and indigent care costs. Dr. Bethridge explained:
Southwestern allows us to be in a budget negative position. This is frustrating — you feel somewhat like a corporate underdog. We would prefer to have our services valued at x, believing the training program is worth that, rather than constantly be in a budget nega-tive position. My budget includes the contractual costs of medical subspecialists for the hospital and for their outpatient care to the city clinics. The training program also has the “ no preference contract ” for all the patients who come through the ER. This can be a good thing for education, but it also means that we must be able to handle the large volume of patients in the context of education. We need a certain volume and diversity of pathology for a good educational experience. We need subspecialists to help us care for the patients, and we need a relatively high volume of patients to ensure diversity. But this means we must provide the subspecialists — and pay them increasingly retail rates — and take the high volume to enhance education. At the same time, we are caring for a mostly indigent patient population, which cannot easily be shifted to another source of care. Most of what is in my budget is not the cost of education; it is the cost of indigent care.
Contracts with Community - based Physicians A key concern for Dr. Bethridge was her relationship with the community - based physicians who served as faculty for her program. These were largely subspecialists who had attending duties and supervised residents on the inpatient wards and in the clinics. Unlike full - time faculty members, however, they were not salaried. Instead, each group of subspecialists had a different contract with
c01.indd 52c01.indd 52 9/2/08 6:28:07 PM9/2/08 6:28:07 PM

Chapter 1 Essentials of Full - cost Accounting 53
AMEP, which usually was automatically renewed, although some were renegotiated periodically. Some of the physicians also had contacts with Bennington for other services that they provided, such as trauma coverage.
Gary Marks, M.D., had been hired by Southwestern to review these contracts. He commented on the challenges of this undertaking:
My goal is to bring clarity to the cost structure. There are multiple contracts with numer-ous community physicians. Some are contracts with Bennington Hospital for availability, some are with Bennington for direct patient care to the medically indigent, and some are contracts with AMEP for curriculum development, GME supervision, and/or direct patient care for inpatients and clinics. The variations make it very diffi cult to understand the costs, relationships, and opportunities. For example, AMEP is accountable for gradu-ate medical education but employs the primary care physicians and fi nances the subspe-cialty care for the medically indigent. Therefore many of the AMEP contracts cover both medical education and patient care.
Another issue you have with some of the physicians is the need to look at all arrange-ments in their entirety. A physician may be generously compensated on one contract but poorly on another. The more lucrative contracts subsidize the other activities that may not be well reimbursed. People are reluctant to change contracts that may be above market rates for fear that the changes will have adverse effects elsewhere. One admon-ishment I shared with the people at Southwestern prior to my arrival was not to hire me based on any assumptions regarding the bottom line. My goal is clear and fair contracts. If the contracts and payments are not fair, the physician relationship will fall apart in the long term anyway. We must also be aware that many of the community - based physicians could walk away from Bennington and AMEP with only minor fi nancial implications. They can easily replace the lost revenue working someplace else.
Dr. Bethridge also wanted to be sure that the contracts were appropriate. She realized that even though many of the physicians enjoyed interacting with the residents and val-ued their affi liation with the educational programs, they also had private practices. One such physician was Harold Davidson, M.D., a cardiologist who worked with the Internal Medicine Program. He described his relationship in these terms:
I have worked with the training program for almost ten years, although when I relocated to Atherton I had no intention of teaching or becoming affi liated with the GME program. I view myself as a private practice physician as opposed to an “ academic ” physician, but have enjoyed all my years working with AMEP. When I moved to Atherton, the cardiologist who had previously worked with AMEP resigned to take a job in a different city, so I agreed to assume the responsibilities for cardiology. We negotiated a contract about eight years ago, and it has remained the same since then. I receive a monthly stipend check and within that are the responsibilities to provide medical education for cardiology and provide cardiac care for AMEP ’ s patients. This includes twenty - four - hour, 365 - days - a - year coverage of the ER, consultations, diagnostic tests, and invasive proce-dures and interventions such as angioplasty and coronary stents.
In general the monthly stipend arrangement has worked well. At one point we tried to bill and collect from the patients, but because of the poor payer mix, it wasn ’ t worthwhile. The best we can hope for is Medicare; once in a blue moon you may have a patient insured by a managed care organization, but, overall, cardiology probably is
c01.indd 53c01.indd 53 9/2/08 6:28:07 PM9/2/08 6:28:07 PM

54 Management Accounting in Health Care Organizations
about 50 percent unfunded. Because of that I think the valuation of the contract is cor-rect. We do occasionally have a slow week, but at other times we may do procedures that would generate well over $ 20,000 in professional fees if the patients were insured. I work with another physician to split the clinical work; I handle almost all of the teaching duties at conferences and morning reports.
A lot of the teaching — I would say 90 percent — is at the bedside. In terms of my own productivity, I could probably go twice as fast without residents as I do with them, but that depends on how experienced the residents are. On the outpatient side, residents can help my productivity because they can do a lot of the diagnostic work. I supervise and train the residents and they are my responsibility, but given our volume it would be diffi cult without the residents. I also admit my private patients here. I feel that it is part of the good will that fl ows. The training program has been very fair with me over the years and so has the hospital, plus the fact that I am here and it is very cost effective and time effective for me to admit my patients here. Overall, the experience has been great. The interactions with the residents keep me on my toes, and I enjoy working with them.
Next Steps As she analyzed her program, Dr. Bethridge was aware that Southwestern wanted to build a more entrepreneurial culture within AMEP and perhaps see it expand its clinical activities. In the longer term there was the possibility of developing a research partner-ship with the state university. She also knew that there was some concern about AMEP ’ s capacity to meet the needs of the expanding number of indigent patients. In addition, there might be some changes to the way funds were distributed between AMEP and Ben-nington. Although she was open to the idea of change, she wanted to be sure that the approach Southwestern and AMEP took did not erode the educational mission of AMEP. She felt it was critical that she work with Dr. Byron to develop a strong case for the Inter-nal Medicine Program and a proposal for an appropriate fi nancial model.
ASSIGNMENT 1. Exhibit 2 shows $ 7 million on the line “ Interns & residents — other program costs. ” What is
the source of this fi gure? Is it appropriate that this cost center be treated as a service center? If so, why? If not, what rationale would you use for classifying it as a mission center?
2. How do you think the faculty salaries and contract services amounts on Exhibit 4 were deter-mined? What kinds of activities do you think are included in these amounts?
3. Dr. Bethridge has indicated an interest in having a good understanding of the costs and bene-fi ts of her program. Assuming the cost object is the education of a medical resident, how would you compute an accurate amount? Specifi cally, how would you determine the direct costs of a resident and how would you attach an appropriate amount of overhead? What additional information, if any, would you recommend that Dr. Bethridge obtain to make these computations, and from where?
4. How closely do you think the DME and IME payments come to covering the cost of graduate medical education at Southwestern? Where, if at all, do you think there might be slippages between the “ real cost ” of GME and the payments that are made to cover it? In answering this question, please address the relationship between GME and indigent care. Is the funding for the two activities structured appropriately? If not, how would you change it?
c01.indd 54c01.indd 54 9/2/08 6:28:07 PM9/2/08 6:28:07 PM

Chapter 1 Essentials of Full - cost Accounting 55
EXHIBIT 1 Charity Care and Community Benefi ts, 1995–2000 (in thousands of dollars)
1995 1996 1997 1998 1999 2000
Actual charity care $6,116 $11,917 $18,318 $21,204 $25,285 $32,598Other charity care 1,214 1,702 3,073 3,619 3,717 3,713Unreimbursed Medicaid 1,183 4,271 1,611 2,949 8,252TOTAL CHARITY CARE $8,513 $13,619 $25,662 $26,434 $31,951 $44,563Community benefi t 878 2,665 7,795 7,641 7,955 9,244Unreimbursed Medicare 5,810 5,950 10,870 14,703 26,426 30,715TOTAL COMMUNITY
BENEFIT $6,688 $8,615 $18,665 $22,344 $34,381 $39,959TOTAL CHARITY CARE &
COMMUNITY BENEFIT $15,201 $22,234 $44,327 $48,778 $66,332 $84,522
c01.indd 55c01.indd 55 9/2/08 6:28:07 PM9/2/08 6:28:07 PM

EXHIBIT 2 Cost Allocation Summary from Medicare Cost Report
Net Expenses for Cost
Allocation
New Cap. Rel. Costs —
BLDG
New Cap. Rel. Costs —
MVBLE Employee Benefi ts Subtotal
Admin & General
Operation of Plant
General Services Cost Center New Cap Rel Costs—BLDG 3,193,269 3,193,269 New Cap Rel Costs—MVBLE 5,622,288 5,622,288 Employee Benefi ts 2,834,392 2,834,392 Admin & General 23,376,594 206,546 363,659 124,734 24,071,533 24,071,533 Operation of Plant 4,299,794 527,003 927,878 87,811 5,842,486 1,166,441 7,008,927 Laundry & Linen Service 818,118 64,706 113,925 996,749 198,999 184,377 Housekeeping 2,282,932 12,359 21,759 64,302 2,381,352 475,432 35,216 Dietary 1,968,633 84,267 148,366 67,947 2,269,213 453,044 240,117 Cafetaria 32,666 57,514 90,180 18,004 93,081 Nursing Admin � 105,037 21,184 37,298 396 � 46,159 60,363 Central Services & Supply 2,564,758 131,126 230,869 55,519 2,982,272 595,405 373,641 Pharmacy 4,010,020 42,841 75,429 103,074 4,231,364 844,783 122,075 Medical Records & Library 1,900,922 37,364 65,786 44,303 2,048,375 408,954 106,469 Biomed Instrumentation 1,245,476 28,316 49,855 17,749 1,341,396 267,807 80,685 Interns & Residents - Other Program 7,000,000 7,000,000 1,397,536 Inpatient Routine Srvc Cntrs Adults and Ped 13,304,172 558,090 982,612 547,134 15,392,008 3,072,928 1,590,269 ICU 5,291,975 125,284 220,584 220,333 5,858,176 1,169,573 356,995 CCU 0 Pedi - ICU 2,480,837 46,924 82,618 97,551 2,707,930 540,633 133,710 Nursery 3,046,254 61,145 107,656 124,312 3,339,367 666,698 174,231 Ancillary Cost Centers Operating Room 7,557,537 192,630 339,158 208,029 8,297,354 1,656,550 548,897 Recovery Room 1,775,321 55,369 97,486 75,086 2,003,262 399,947 157,772 Delivery Room & Labor 2,705,671 40,223 70,819 99,316 2,916,029 582,179 114,613 Anesthesiology 821,096 6,963 12,260 16 840,335 167,771 19,842 Radiology - Diagnostic 4,825,314 129,705 228,368 155,100 5,338,487 1,065,818 369,592 Laboratory 4,825,859 97,932 172,426 107,614 5,203,831 1,038,934 279,056 Whole Blood and Packed Red 1,764,154 8,776 15,452 15,813 1,804,195 360,204 25,008 Respiratory Therapy 3,823,332 18,260 32,150 145,170 4,018,912 802,368 52,032 Physical Therapy 1,259,723 27,505 48,427 50,450 1,386,105 276,733 78,374 Occupational Therapy 331,406 4,437 7,812 14,262 357,917 71,457 12,643 Speech Pathology 198,505 3,588 6,317 8,677 217,087 43,341 10,223 Electrocardiology 410,249 19,904 35,045 15,482 480,680 95,967 56,717 Electroencephalography 151,859 5,281 9,298 5,808 172,246 34,389 15,048 Medical Supplies Charged 8,041,703 8,041,703 1,605,510 Drugs Charged to Patients 7,088,386 7,088,386 1,415,182 Nuclear Medicine 726,042 3,751 6,604 18,211 754,608 150,656 10,689 Special Proc/Cath Lab 2,359,044 10,878 19,152 35,649 2,424,723 484,091 30,996 CT Scan 724,315 5,722 10,074 19,739 759,850 151,703 16,305 Renal Dialysis 256,222 148 256,370 51,184 Outpatient Service Cost Centers Clinic 739,573 104,280 183,603 27,666 1,055,122 210,653 297,144 Specialty Care 794,547 39,471 69,496 31,185 934,699 186,611 112,472 Emergency 5,876,226 337,514 594,250 213,502 7,021,492 1,401,827 961,740 Oncology 391,800 85,312 150,207 15,750 643,069 128,387 243,096 Special Purpose Cost Centers Kidney Acquisition 393,945 2,031 3,575 7,753 407,304 81,317 5,787 Subtotals 142,977,226 3,179,353 5,597,787 2,825,591 142,930,008 23,739,016 6,969,275 Non Reimbursed Cost Centers Gift Flower, Coffee Shop 13,916 24,501 38,417 1 7,670 39,652 Star Flight 475,947 3,540 479,487 95,729 Parking 167,160 167,160 33,373 Other Non - Reimbursable 975,192 5,261 980,453 195,745
Total 144,595,525 3,193,269 5,622,288 2,834,392 144,595,525 24,071,533 7,008,927
c01.indd 56c01.indd 56 9/2/08 6:28:08 PM9/2/08 6:28:08 PM
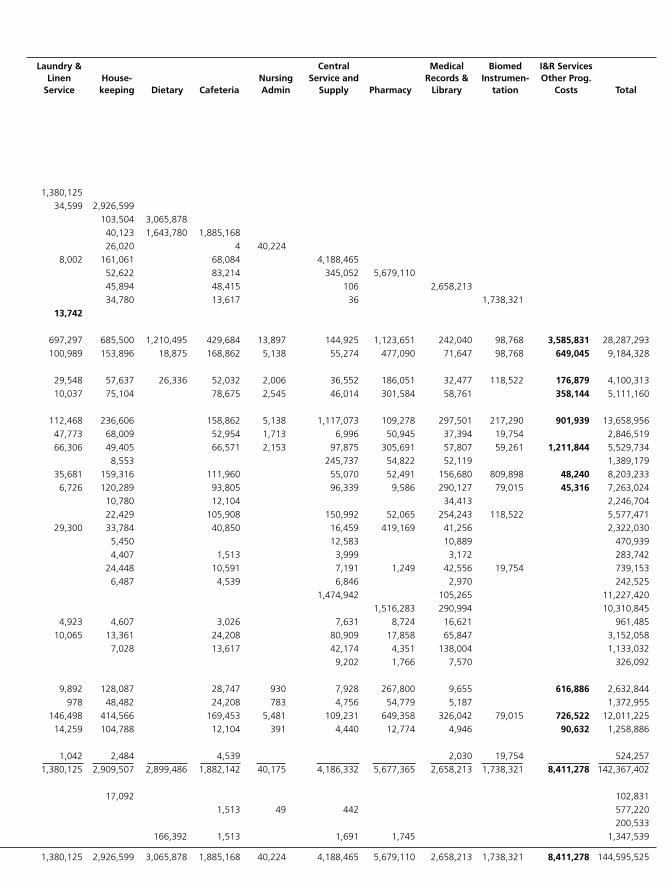
Laundry & Linen
Service House -
keeping Dietary Cafeteria Nursing Admin
Central Service and
Supply Pharmacy
Medical Records &
Library
Biomed Instru m en-
ta tion
I & R Services Other Prog.
Costs Total
1,380,125 34,599 2,926,599
103,504 3,065,878 40,123 1,643,780 1,885,168 26,020 4 40,224
8,002 161,061 68,084 4,188,465 52,622 83,214 345,052 5,679,110 45,894 48,415 106 2,658,213 34,780 13,617 36 1,738,321
13,742
697,297 685,500 1,210,495 429,684 13,897 144,925 1,123,651 242,040 98,768 3,585,831 28,287,293 100,989 153,896 18,875 168,862 5,138 55,274 477,090 71,647 98,768 649,045 9,184,328
29,548 57,637 26,336 52,032 2,006 36,552 186,051 32,477 118,522 176,879 4,100,313 10,037 75,104 78,675 2,545 46,014 301,584 58,761 358,144 5,111,160
112,468 236,606 158,862 5,138 1,117,073 109,278 297,501 217,290 901,939 13,658,956
47,773 68,009 52,954 1,713 6,996 50,945 37,394 19,754 2,846,519 66,306 49,405 66,571 2,153 97,875 305,691 57,807 59,261 1,211,844 5,529,734
8,553 245,737 54,822 52,119 1,389,179 35,681 159,316 111,960 55,070 52,491 156,680 809,898 48,240 8,203,233 6,726 120,289 93,805 96,339 9,586 290,127 79,015 45,316 7,263,024
10,780 12,104 34,413 2,246,704 22,429 105,908 150,992 52,065 254,243 118,522 5,577,471
29,300 33,784 40,850 16,459 419,169 41,256 2,322,030 5,450 12,583 10,889 470,939 4,407 1,513 3,999 3,172 283,742 24,448 10,591 7,191 1,249 42,556 19,754 739,153 6,487 4,539 6,846 2,970 242,525 1,474,942 105,265 11,227,420 1,516,283 290,994 10,310,845
4,923 4,607 3,026 7,631 8,724 16,621 961,485 10,065 13,361 24,208 80,909 17,858 65,847 3,152,058
7,028 13,617 42,174 4,351 138,004 1,133,032 9,202 1,766 7,570 326,092
9,892 128,087 28,747 930 7,928 267,800 9,655 616,886 2,632,844 978 48,482 24,208 783 4,756 54,779 5,187 1,372,955
146,498 414,566 169,453 5,481 109,231 649,358 326,042 79,015 726,522 12,011,225 14,259 104,788 12,104 391 4,440 12,774 4,946 90,632 1,258,886
1,042 2,484 4,539 2,030 19,754 524,257
1,380,125 2,909,507 2,899,486 1,882,142 40,175 4,186,332 5,677,365 2,658,213 1,738,321 8,411,278 142,367,402 17,092 102,831 1,513 49 442 577,220 200,533 166,392 1,513 1,691 1,745 1,347,539
1,380,125 2,926,599 3,065,878 1,885,168 40,224 4,188,465 5,679,110 2,658,213 1,738,321 8,411,278 144,595,525
c01.indd 57c01.indd 57 9/2/08 6:28:09 PM9/2/08 6:28:09 PM

58 Management Accounting in Health Care Organizations
EXHIBIT 3 Schedule of Rotations
Postgraduate Year 1Wards 5 months Night callClinic 2 months No callICU 2 months Night callNephrology 1 month No callEmergency Department 1 month 19 10-hr. shiftsBehavioral Medicine 1 month No call
Postgraduate Year 2Wards 4 months Night call (stay until midnight)Clinic 1 month No callICU 1 month Night callNightfl oat/clinic 1 month 6 nights per week (no daytime
responsibilities)Medicine consults 1 month 2 weekends per month (no night call)Electives (each) 1 month No call except approx. 3 nightfl oat
calls per yearCardiologyPulmonaryHematology/OncologyGastroenterology
Postgraduate Year 3Wards 2 months Night call (stay until midnight)Ambulatory Care Block 4 months No call except 3 nightfl oats per yearICU 1 month Night callElectives 1 month No callInfectious Diseases 1 month No callNightfl oat 1 month 6 nights per week (no daytime
responsibilities)Neurology 1 month 2 weekends of beeper callGeriatric Medicine 1 month No call
c01.indd 58c01.indd 58 9/2/08 6:28:10 PM9/2/08 6:28:10 PM

Chapter 1 Essentials of Full - cost Accounting 59
EXHIBIT 4 Budget for Internal Medicine Residency Program
Patient revenueTotal charges $3,866,365Less: CT med. Charges (1,594,459)
Revenue deductions 2,271,906
Medicare contractuals (181,134)Medicaid contractuals (184,294)HMO & PPO write-off (71,156)Charity—City Health Assistance Program (202,030)Admin. & other write-offs (66,837)Charity (616,103) (1,321,554)
NET PATIENT CARE REVENUE $950,352
Revenue from contractsUniversity contract $4,3795th-fl oor GI Clinic 24,000Bennington hospitalists 174,055 202,434
Revenue from CT medical collections 335,501Reimbursed grand rounds 27,050Coordinating Board 348,864
TOTAL REVENUE $1,864,201
ExpensesFaculty salaries $868,353Resident salaries 1,187,985Admin. salaries 73,999 $2,130,337Benefi ts (salaries � 12.1%) 292,864
Contract servicesInpatient coverage, teaching, some outpatient servicesa $597,392Clinic attending stipendsb 102,600General medicalc 58,800 758,792Grand rounds (honorarium & travel, CME consort fee, supplies) 27,050Supplies (food, offi ce supplies) 10,700Apparel for residents 2,190Dietary (transfer in) (resident meals, meals for functions) 33,193Maintenance 1,450Equipment 9,070Permits, licenses for residents, training program 10,563Telephone, paging 12,600Personal dues, licenses 13,490Books, subscriptions (incl. $12,400 for resident book funds) 18,500Conventions, education 27,350Travel (noneducation) 1,000Recruitment (incl. match fees, brochures, residency fairs) 8,455Postage 1,000Gifts, entertainment 4,250Insurance 53,844Total bad debt 331,743
TOTAL EXPENSESNET PROFIT (LOSS)
$3,748,441($1,884,240)
aIncludes Cardiology, Geriatrics, GI coverage, ICU, Nephrology, Neurology, Hematology/Oncology, and Rheumatology.bIncludes Allergy, Cardiology, Dermatology, Gastroenterology, Neurology, Pulmonary.cIncludes weekend inpatient coverage and VA clinic coverage.
c01.indd 59c01.indd 59 9/2/08 6:28:11 PM9/2/08 6:28:11 PM

60 Management Accounting in Health Care Organizations
EXHIBIT 5 Budget for Faculty Practice Plan
Total pro-
grams Trauma Capital OB Pediatrics OB/GYN Midwives Internal Medicine
Gross patient revenue less contracted medical charges 17,312,348 979,356 899,201 811,527 6,597,600 424,162 2,271,906 Revenue deductions
Contractual adjustments (3,774,609) (245,610) (123,864) (158,488) (1,579,437) (188,712) (365,428) HMO/PPO write - off (1,703,257) (212,164) (266,647) (84,009) (118,899) (71,156) Charity —city MAP (804,358) (56,684) (181,164) (202,030) Admin. & other write - offs (982,972) (52,230) (30,793) (37,276) (352,019) (30,793) (66,837) Charity (2,070,678) (107,624) (5,314) (33,849) (978,391) (5,314) (616,103) Total of revenue deductions (9,335,874) (674,312) (426,618) (313,621) (3,209,910) (224,819) (1,321,554) NET PATIENT REVENUE 7,976,474 305,044 472,583 497,905 3,387,690 199,343 950,352
Other revenue Revenue—contract 9,148,009 464,400 268,144 184,800 202,434 Revenue—CT med. 1,083,180 316,352 335,113 335,501 Revenue grants 38,900 10,000 27,050 Revenue grants—Coord. Board 891,840 149,592 348,864 TOTAL OF OTHER REVENUE 11,161,929 940,344 603,256 184,800 913,848 TOTAL OPERATING REVENUES 19,138,404 305,043 472,583 1,438,249 3,990,947 384,143 1,864,200
Expenses Total salaries 11,490,542 200,002 326,459 2,279,580 1,800,720 258,317 2,130,337 Total benefi ts 1,556,162 44,879 275,829 247,550 35,512 292,864 Total professional fees — medical 2,198,478 227,766 622,000 758,792 Total professional fees—other 43,440 15,390 27,050 Total supplies 447,433 31,286 29,609 12,806 4,400 46,333 Total depreciation & amortization 85,286 Total insurance 612,369 10,212 15,312 46,560 224,724 18,528 53,844 Total bad debt 1,944,373 117,631 14,046 131,036 945,934 14,046 331,743 Total other expenses 1,346,381 4,005 35,616 143,190 121,395 13,848 107,478 Total utility expenses 7,484 4,772 Net work Allocation Total expenses 19,731,946 331,850 467,597 3,148,961 3,979,902 344,651 3,748,441
NET INCOME (LOSS) (593,543) (26,807) 4,985 (1,710,712) 11,045 39,492 (1,884,241) Deduct $7.5 million from admin. for reallocation
Reallocation of $7.5 million from admin. to GME prog. 1,619,349 846,115 2,458,465 PFS collection fee (8% of net patient rev.) (14,993) (36,683) (29,350) (195,340) (14,824) (49,489) Admin. fee (7% of net patient rev.) (13,119) (32,098) (25,681) (170,923) (12,971) (43,303)
ADJUSTED NET INCOME (LOSS) (54,919) (63,795) (146,393) 490,897 11,697 481,433
c01.indd 60c01.indd 60 9/2/08 6:28:11 PM9/2/08 6:28:11 PM
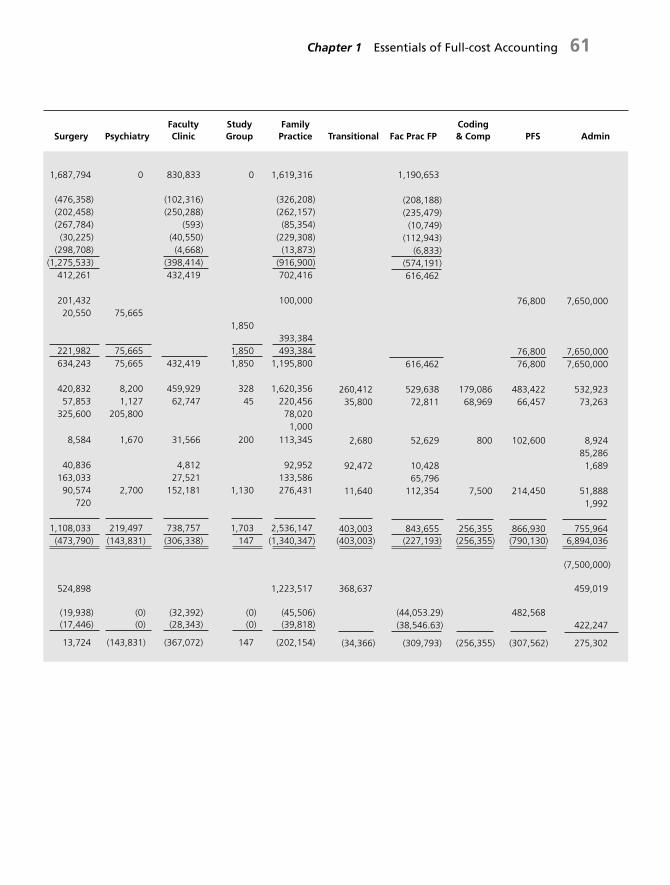
Chapter 1 Essentials of Full - cost Accounting 61
Surgery Psychiatry Faculty Clinic
Study Group
Family Practice Transitional Fac Prac FP
Coding & Comp PFS Admin
1,687,794 0 830,833 0 1,619,316 1,190,653
(476,358) (102,316) (326,208) (208,188) (202,458) (250,288) (262,157) (235,479) (267,784) (593) (85,354) (10,749) (30,225) (40,550) (229,308) (112,943)
(298,708) (4,668) (13,873) (6,833) (1,275,533) (398,414) (916,900) (574,191)
412,261 432,419 702,416 616,462
201,432 100,000 76,800 7,650,000 20,550 75,665
1,850 393,384
221,982 75,665 1,850 493,384 76,800 7,650,000 634,243 75,665 432,419 1,850 1,195,800 616,462 76,800 7,650,000
420,832 8,200 459,929 328 1,620,356 260,412 529,638 179,086 483,422 532,923 57,853 1,127 62,747 45 220,456 35,800 72,811 68,969 66,457 73,263
325,600 205,800 78,020 1,000
8,584 1,670 31,566 200 113,345 2,680 52,629 800 102,600 8,924 85,286
40,836 4,812 92,952 92,472 10,428 1,689 163,033 27,521 133,586 65,796 90,574 2,700 152,181 1,130 276,431 11,640 112,354 7,500 214,450 51,888
720 1,992
1,108,033 219,497 738,757 1,703 2,536,147 403,003 843,655 256,355 866,930 755,964 (473,790) (143,831) (306,338) 147 (1,340,347) (403,003) (227,193) (256,355) (790,130) 6,894,036
(7,500,000)
524,898 1,223,517 368,637 459,019
(19,938) (0) (32,392) (0) (45,506) (44,053.29) 482,568 (17,446) (0) (28,343) (0) (39,818) (38,546.63) 422,247
13,724 (143,831) (367,072) 147 (202,154) (34,366) (309,793) (256,355) (307,562) 275,302
c01.indd 61c01.indd 61 9/2/08 6:28:12 PM9/2/08 6:28:12 PM

62 Management Accounting in Health Care Organizations
EXHIBIT 6 Payer Mix
2000 actual 2001 budget 2001 6 - month projection
Payer mix Payer mix Collection % Payer mix Collection %
Residency program
Self - pay 31.4 % 30.1% 5.3% 31.8% 2.8%
Medicare 29.8 27.5 47.4 27.7 44.7
Medicaid 17.2 13.8 26.2 15.2 29.4
Managed care 14.8 10.0 60.8 13.3 50.9
City Health Assistance
Program 6.8 18.6 0.9 12.0 12.6
TOTAL 100.0 % 100.0% 28.1% 100.0% 28.1%
Faculty practice
Self - pay 4.2 % 3.9% 50.1 % 3.4 % 47.2 %
Medicare 18.9 22.4 50.0 24.8 48.5
Medicaid 2.6 5.2 37.5 2.8 32.8
Managed care 74.2 68.5 51.0 68.7 49.4
City Health Assistance
Program 0.1 0.0 0.0 0.2 0.0
TOTAL 100.0% 100.0% 50.0% 99 .9% 48.5%
c01.indd 62c01.indd 62 9/2/08 6:28:13 PM9/2/08 6:28:13 PM