Essentials of Financial Statement Analysis of Financial Statement Analysis An Introduction to...
73
Essentials of Financial Statement Analysis An Introduction to Financial Statement Analysis Gregory Mostyn, CPA Worthy and James Publishing www.worthyjames.com
-
Upload
nguyenthuy -
Category
Documents
-
view
237 -
download
7
Transcript of Essentials of Financial Statement Analysis of Financial Statement Analysis An Introduction to...
Essentials of FinancialStatement Analysis
An Introduction to Financial Statement
Analysis
Gregory Mostyn, CPA
Worthy and James Publishingwww.worthyjames.com
Essentials of Financial Statement Analysis
An Introduction to Financial Statement Analysis
Published by
Worthy and James Publishing
To view our publications and other content, go to: www.worthyjames.com
<http://www.worthyjames.com>
Terms of Use
This material is copyrighted. © 2008 Worthy and James Publishing. All rights
reserved. No part of this work may be reproduced, transmitted, or used in any other
form or by any means—electronic or mechanical—including photocopying, Internet
distribution, or any other manner without the written permission of the publisher
except as is permitted by Federal copyright law.
If you use this material, then you understand and agree to these terms of use:
Warning - Disclaimer:
If you decide to use this material, then you agree that this mate-
rial is designed and intended to provide you only general educational instruction in
accounting principles. This material is sold with the understanding that the author and
publisher are not engaged in providing accounting, financial, investing, tax, legal, or any
other type of professional services. If professional services are needed, competent pro-
fessional advice should be obtained. Although every effort has been made to make this
material as relevant, useful, and accurate as possible up to the date of publication, the
material may contain errors and omissions. The author and publisher make no guaran-
tees or warranties, express or implied, and shall have neither liability nor responsibility,
even if advised of such possibility, for any loss or damage caused or alleged to be caused,
directly or indirectly, by use of this material. If you do not agree to these conditions you
may return this special report immediately upon purchase for a full refund.
With the exception of companies and organizations whose identities as actual entities
are made clear within the context of the text discussion, all persons, organizations,
and entities in this material, including in illustrations and Practice, are completely fic-
tional. Any resemblance to actual persons, organizations, or entities, past or present, is
purely coincidental.

iii
Table of Contents
© 2008 Worthy and James Publishing. See front matter: Terms of Use.
Financial Statements Quick Review . . . . . . . . . . . . . . . . . . . . . . . . . . . . . . . . . . . . . . . . . . . . . . . . . . . . . . . . . . . . 1
GAAP Quick Review . . . . . . . . . . . . . . . . . . . . . . . . . . . . . . . . . . . . . . . . . . . . . . . . . . . . . . . . . . . . . . . . . . . . . . . 7
Trend Analysis Using a Reference Base . . . . . . . . . . . . . . . . . . . . . . . . . . . . . . . . . . . . . . . . . . . . . . . . . . . . . . . . . 9
Financial Ratios and Ratio Analysis Overview . . . . . . . . . . . . . . . . . . . . . . . . . . . . . . . . . . . . . . . . . . . . . . . . . . . . 16
Ratio Analysis: Measures of Liquidity . . . . . . . . . . . . . . . . . . . . . . . . . . . . . . . . . . . . . . . . . . . . . . . . . . . . . . . . . . . 18
Ratio Analysis: Measures of Solvency. . . . . . . . . . . . . . . . . . . . . . . . . . . . . . . . . . . . . . . . . . . . . . . . . . . . . . . . . . . 22
Ratio Analysis: Measures of Profitability. . . . . . . . . . . . . . . . . . . . . . . . . . . . . . . . . . . . . . . . . . . . . . . . . . . . . . . . . 26
Ratio Analysis: Measures of Investment Return . . . . . . . . . . . . . . . . . . . . . . . . . . . . . . . . . . . . . . . . . . . . . . . . . . . 29
Ratio Analysis: Measures of Productivity . . . . . . . . . . . . . . . . . . . . . . . . . . . . . . . . . . . . . . . . . . . . . . . . . . . . . . . . 30
Analysis as an Outsider. . . . . . . . . . . . . . . . . . . . . . . . . . . . . . . . . . . . . . . . . . . . . . . . . . . . . . . . . . . . . . . . . . . . . . 32
Quality of Earnings . . . . . . . . . . . . . . . . . . . . . . . . . . . . . . . . . . . . . . . . . . . . . . . . . . . . . . . . . . . . . . . . . . . . . . . . . 34
Potentially Hidden Liabilities . . . . . . . . . . . . . . . . . . . . . . . . . . . . . . . . . . . . . . . . . . . . . . . . . . . . . . . . . . . . . . . . . 39
Big, Bad, Sudden Surprises . . . . . . . . . . . . . . . . . . . . . . . . . . . . . . . . . . . . . . . . . . . . . . . . . . . . . . . . . . . . . . . . . . 44
Conclusions About Usefulness And Oversight. . . . . . . . . . . . . . . . . . . . . . . . . . . . . . . . . . . . . . . . . . . . . . . . . . . . 48
Summary Table of Financial Ratios and Measurements . . . . . . . . . . . . . . . . . . . . . . . . . . . . . . . . . . . . . . . . . . . . . 51
Quick Review and Vocabulary . . . . . . . . . . . . . . . . . . . . . . . . . . . . . . . . . . . . . . . . . . . . . . . . . . . . . . . . . . . . . . . . 53
Practice Questions and Problems. . . . . . . . . . . . . . . . . . . . . . . . . . . . . . . . . . . . . . . . . . . . . . . . . . . . . . . . . . . . . . 55
Solutions to Questions and Problems . . . . . . . . . . . . . . . . . . . . . . . . . . . . . . . . . . . . . . . . . . . . . . . . . . . . . . . . . . 64
Essentials of Financial Statement Analysis
1
© 2008 Worthy and James Publishing. See front matter: Terms of Use.
Balance Sheet
Purpose
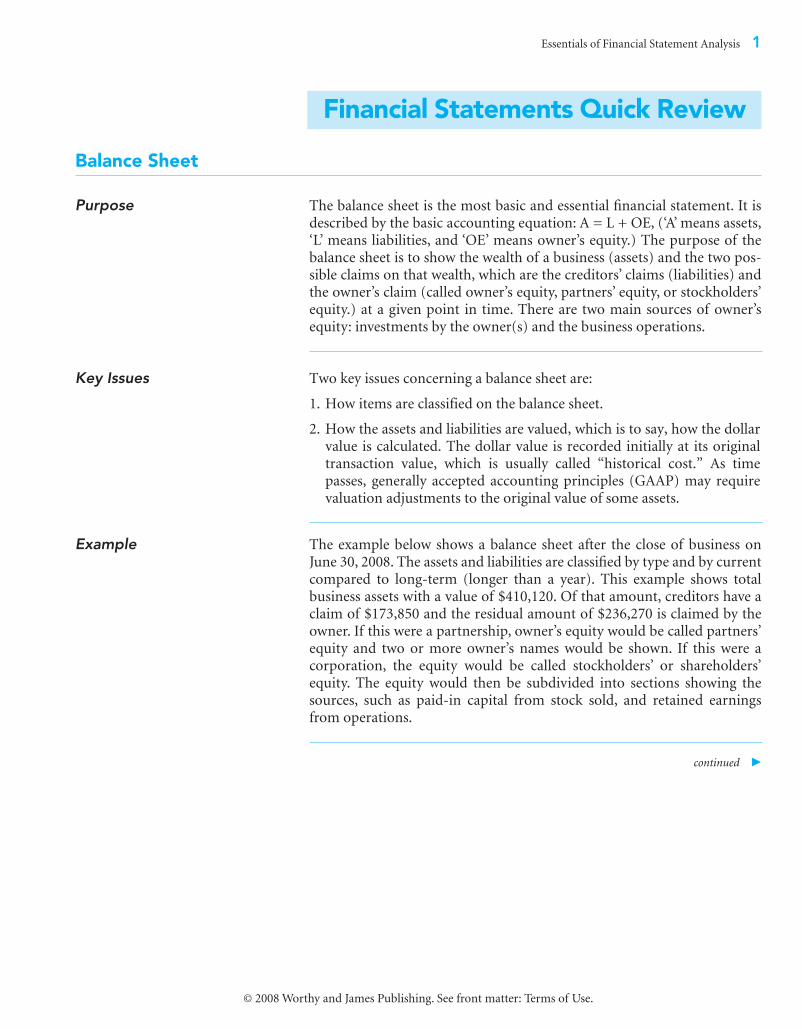
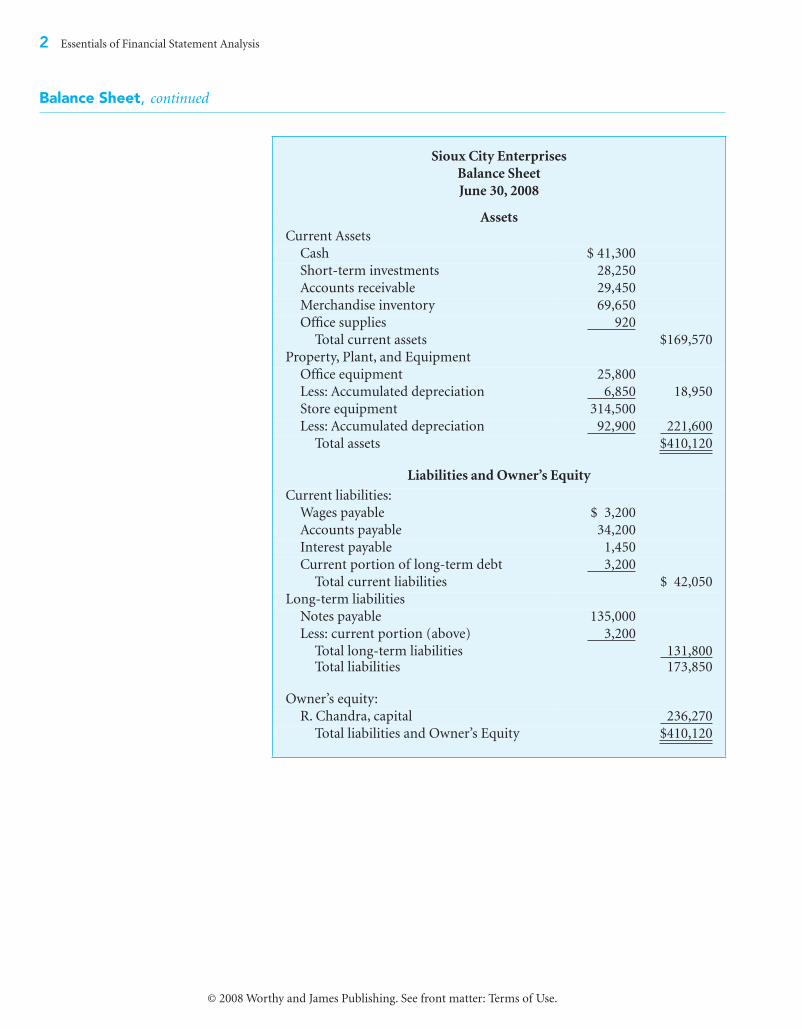
The balance sheet is the most basic and essential financial statement. It isdescribed by the basic accounting equation: A = L + OE, (‘A’ means assets,‘L’ means liabilities, and ‘OE’ means owner’s equity.) The purpose of thebalance sheet is to show the wealth of a business (assets) and the two pos-sible claims on that wealth, which are the creditors’ claims (liabilities) andthe owner’s claim (called owner’s equity, partners’ equity, or stockholders’equity.) at a given point in time. There are two main sources of owner’s
equity: investments by the owner(s) and the business operations.
Key Issues
Two key issues concerning a balance sheet are:
1. How items are classified on the balance sheet.
2. How the assets and liabilities are valued, which is to say, how the dollarvalue is calculated. The dollar value is recorded initially at its originaltransaction value, which is usually called “historical cost.” As timepasses, generally accepted accounting principles (GAAP) may require
valuation adjustments to the original value of some assets.
Example
The example below shows a balance sheet after the close of business onJune 30, 2008. The assets and liabilities are classified by type and by currentcompared to long-term (longer than a year). This example shows totalbusiness assets with a value of $410,120. Of that amount, creditors have aclaim of $173,850 and the residual amount of $236,270 is claimed by theowner. If this were a partnership, owner’s equity would be called partners’equity and two or more owner’s names would be shown. If this were acorporation, the equity would be called stockholders’ or shareholders’equity. The equity would then be subdivided into sections showing thesources, such as paid-in capital from stock sold, and retained earnings
from operations.
continued
�
Financial Statements Quick Review
2
Essentials of Financial Statement Analysis
© 2008 Worthy and James Publishing. See front matter: Terms of Use.
Balance Sheet
,
continued
Sioux City Enterprises
Balance Sheet
June 30, 2008
Assets
Current Assets
Cash $ 41,300
Short-term investments 28,250
Accounts receivable 29,450
Merchandise inventory 69,650
Office supplies 920
Total current assets $169,570
Property, Plant, and Equipment
Office equipment 25,800
Less: Accumulated depreciation 6,850 18,950
Store equipment 314,500
Less: Accumulated depreciation 92,900 221,600
Total assets $410,120
Liabilities and Owner’s Equity
Current liabilities:
Wages payable $ 3,200
Accounts payable 34,200
Interest payable 1,450
Current portion of long-term debt 3,200
Total current liabilities $ 42,050
Long-term liabilities
Notes payable 135,000
Less: current portion (above) 3,200
Total long-term liabilities 131,800Total liabilities 173,850
Owner’s equity:
R. Chandra, capital 236,270
Total liabilities and Owner’s Equity $410,120
Essentials of Financial Statement Analysis
3
© 2008 Worthy and James Publishing. See front matter: Terms of Use.
Income Statement
Purpose
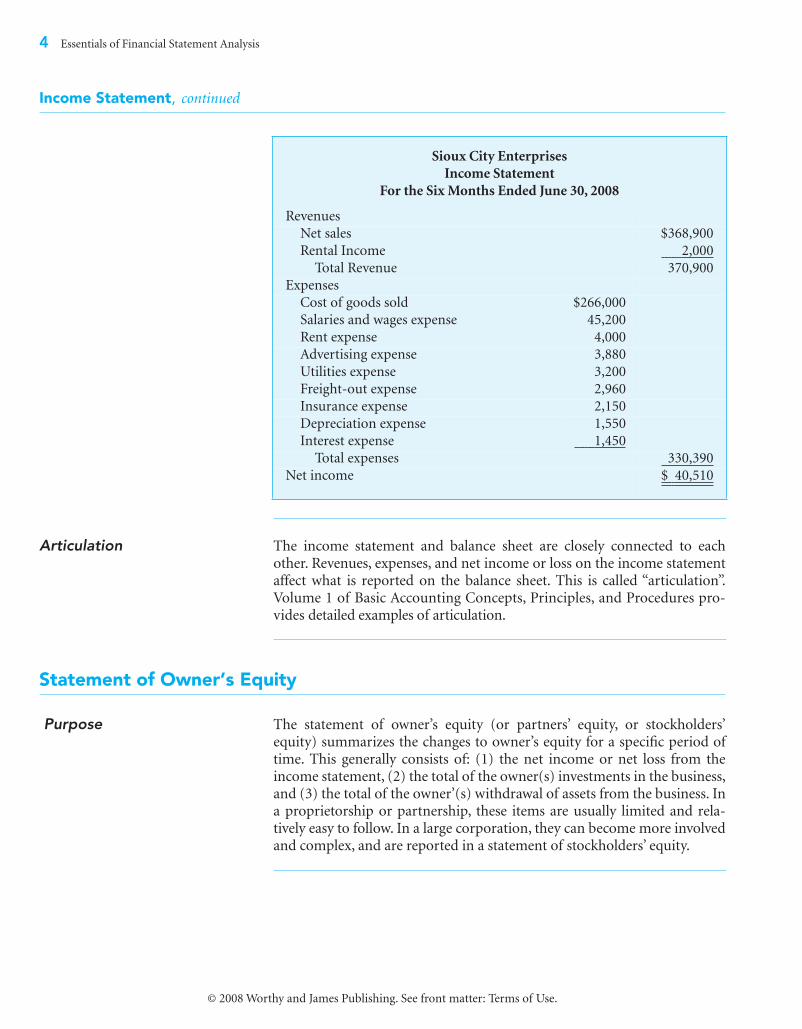
The income statement is a “change statement” that shows the change inequity as a result of operating a business during a specific period of time.
The income statement shows the change in owner’s equity (or partners’ orstockholders’ equity) that results from the sales made to customers (reve-nues) minus the resources consumed to operate the business (expenses).When revenues exceed expenses (net income) assets increase and/or debtdecreases. When expenses exceed revenues (net loss) assets decrease and/or
debt increases.
Key Issues
The key issues concerning the income statement are the proper classifica-tion, correct amounts, and timing of revenues and expenses into the correct
accounting periods.
Example
The example below shows an income statement. The income statementshows the revenues and expenses for the six months ended June 30, 2008.This business has a net income of $40,150 for the period, which meansthat the owner’s equity increased by that amount as a result of operatingthe business. Notice the importance of recording in the correct period. Ifsome revenue or expense on this income statement were recorded in theprior or the next period, this would change the results on income state-ments for two periods and change the trend in the revenue or expense,and net income.
This example contains a detailed listing of expenses. These are sometimescondensed into categories called “operating expenses” and “other
expenses”.
continued
�
4
Essentials of Financial Statement Analysis
© 2008 Worthy and James Publishing. See front matter: Terms of Use.
Income Statement
,
continued
Articulation
The income statement and balance sheet are closely connected to eachother. Revenues, expenses, and net income or loss on the income statementaffect what is reported on the balance sheet. This is called “articulation”.Volume 1 of Basic Accounting Concepts, Principles, and Procedures pro-
vides detailed examples of articulation.
Statement of Owner’s Equity
Purpose
The statement of owner’s equity (or partners’ equity, or stockholders’equity) summarizes the changes to owner’s equity for a specific period oftime. This generally consists of: (1) the net income or net loss from theincome statement, (2) the total of the owner(s) investments in the business,and (3) the total of the owner’(s) withdrawal of assets from the business. Ina proprietorship or partnership, these items are usually limited and rela-tively easy to follow. In a large corporation, they can become more involved
and complex, and are reported in a statement of stockholders’ equity.
Sioux City Enterprises
Income Statement
For the Six Months Ended June 30, 2008
Revenues
Net sales $368,900
Rental Income 2,000
Total Revenue 370,900
Expenses
Cost of goods sold $266,000
Salaries and wages expense 45,200
Rent expense 4,000
Advertising expense 3,880
Utilities expense 3,200
Freight-out expense 2,960
Insurance expense 2,150
Depreciation expense 1,550
Interest expense 1,450
Total expenses 330,390
Net income $ 40,510
Essentials of Financial Statement Analysis
5
© 2008 Worthy and James Publishing. See front matter: Terms of Use.
Statement of Cash Flows
Purpose
The statement of cash flows explains the change in cash for a specificperiod of time. This usually corresponds to the same period of time usedfor the income statement and statement of owner’s equity. The change incash is explained by three types of business activities: operating, investing,
and financing.
Key Issue
The key issue concerning the statement of cash flows is whether a transac-tion has been properly classified as an operating, investing, or financing
activity.
Operating Activities
Operating activities relate to the cash effects of the transactions that makeup net income. In effect, the cash flow from operating activities shows theincome statement on a cash basis instead of an accrual basis. Cash flowfrom operating activities shows the cash results from the essential recur-ring operations of a business, and it is the most important part of the
statement of cash flows.
Investing Activities
Investing activities relate to the increases and decreases in cash from trans-actions that involve buying and selling long-term assets and activities thatinvolve buying and selling investments, including making and collecting
loans.
Financing Activities
Financing activities relate to the cash effects of the transactions thatinvolve obtaining and paying back sources of business capital, such asloans and investments in the business. (This does not include short-term
debt related to operating activities.)
Format
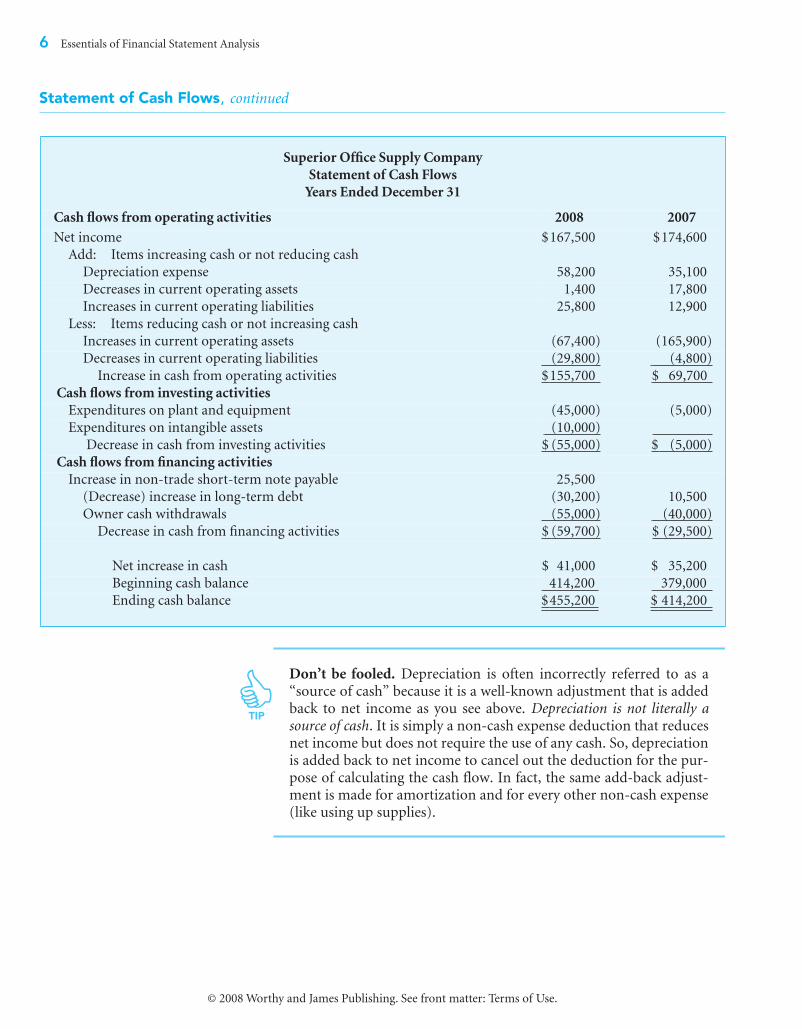
The statement of cash flows presented below is shown in the most popularformat. The operating activities section begins with net income and makestwo types of adjustments to net income to convert it to a cash basis:
■
Add
operating items that increase cash and are not part of the netincome calculation or items that reduced net income but did not usecash.
■
Deduct
operating items that use cash and are not part of the netincome calculation or items that increased net income but did notincrease cash.
Note:
An alternative format is sometimes used. The point here is tounderstand the essential components of the statement. The details of
formats and adjustments is a more advanced topic.
continued
�
6
Essentials of Financial Statement Analysis
© 2008 Worthy and James Publishing. See front matter: Terms of Use.
Statement of Cash Flows
,
continued
Don’t be fooled.
Depreciation is often incorrectly referred to as a“source of cash” because it is a well-known adjustment that is addedback to net income as you see above.
Depreciation is not literally asource of cash
. It is simply a non-cash expense deduction that reducesnet income but does not require the use of any cash. So, depreciationis added back to net income to cancel out the deduction for the pur-pose of calculating the cash flow. In fact, the same add-back adjust-ment is made for amortization and for every other non-cash expense
(like using up supplies).
Superior Office Supply Company
Statement of Cash Flows
Years Ended December 31
Cash flows from operating activities 2008 2007
Net income $167,500 $174,600
Add: Items increasing cash or not reducing cash
Depreciation expense 58,200 35,100
Decreases in current operating assets 1,400 17,800
Increases in current operating liabilities 25,800 12,900
Less: Items reducing cash or not increasing cash
Increases in current operating assets (67,400) (165,900)
Decreases in current operating liabilities (29,800) (4,800)
Increase in cash from operating activities $155,700 $ 69,700
Cash flows from investing activities
Expenditures on plant and equipment (45,000) (5,000)
Expenditures on intangible assets (10,000)
Decrease in cash from investing activities $ (55,000) $ (5,000)
Cash flows from financing activities
Increase in non-trade short-term note payable 25,500
(Decrease) increase in long-term debt (30,200) 10,500
Owner cash withdrawals (55,000) (40,000)
Decrease in cash from financing activities $ (59,700) $ (29,500)
Net increase in cash $ 41,000 $ 35,200
Beginning cash balance 414,200 379,000
Ending cash balance $455,200 $ 414,200
TIP
Essentials of Financial Statement Analysis
7
© 2008 Worthy and James Publishing. See front matter: Terms of Use.
GAAP (Generally Accepted Accounting Principles)
What Is GAAP?
In the United States, GAAP is a set of rules and standards that guideaccountants as to when and how to properly record transactions and how toprepare proper financial statements. GAAP is not like unchanging laws ofphysics. GAAP is designed to meet the needs of society. GAAP is alwaysevolving as the economic environment changes. Also, GAAP only refers torules of accounting in the United States. Different countries have different
rules for different purposes.
Broad GAAP
There are a few broad GAAP principles that provide general guidance andthat apply to all types of transactions. These are fundamental accountingrules. These are like general traffic laws. Example: The historical costprinciple requires that all transactions be recorded at original transaction
value unless a specific GAAP rule creates an exception.
Specific GAAP
Specific GAAP rules offer specific direction for important kinds ofspecific situations. As you continue your study of accounting and learnhow to record specific types of transactions, you will learn specific GAAPrules.
Examples of some specific GAAP rules are:
■
How uncollectible accounts receivable should be recorded
■
Acceptable methods for calculating inventory cost
■
Requirements for changing inventory values
■
How interest should be calculated on certain kinds of debt
GAAP Is Not Perfect
Just as with other kinds of rules, GAAP is not perfect. GAAP is often sub-ject to interpretation. Estimates are frequently required. The applicationof different methods is allowed, which can make comparability difficult toachieve. However, despite shortcomings, GAAP is essential to financial
reporting.
continued
�
GAAP Review
8
Essentials of Financial Statement Analysis
© 2008 Worthy and James Publishing. See front matter: Terms of Use.
GAAP (Generally Accepted Accounting Principles)
,
continued
Where Does GAAP Come From?
There is no single source or listing of GAAP! There are a number of differ-ent sources, some more important than others.
■
Official Pronouncements:
An official pronouncement is a formal andauthoritative document issued by the
Financial Accounting StandardsBoard (FASB),
which is the standard-setting authority in the accountingprofession. The FASB is an independent organization that derives itsauthority from the Federal Securities and Exchange Commission andthe fact that state licensing boards for accountants accept the FASBpronouncements as highest authority.
The pronouncements of the FASB are called
Statements of FinancialAccounting Standards (SFAS)
.
An SFAS prescribes how certain kindsof transactions must be recorded, and presented and explained onfinancial statements.
■
FASB Technical Guides:
The next authoritative level below an SFAS is atechnical guide, usually dealing with narrow or very specific subjectmatter.
Examples:
• FASB Technical Bulletins• AICPA (American Institute of CPAs) Statements of Position and Prac-
tice Bulletins• EITF (Emerging Issues Task Force) Positions and Recommendations
■
Industry Practice:
Industry practice is a source of GAAP. Historically,some industry practices have achieved wide acceptance over manyyears. Sometimes this has created conflict and a lack of consistencywithin GAAP because the practices serve the purposes of differentgroups. To a diminished degree, this process continues today.
■
Other Accounting Literature:
Research publications by educators, journalarticles, textbooks, professional association publications, and AICPAtechnical practice aids are examples of this source of GAAP. These are
the least authoritative GAAP sources.
International Standards
The International Accounting Standards Board (IASB) is an independentorganization with the goal of developing a single set of comprehensiveglobal accounting standards. The FASB currently has several major
projects underway with the IASB working towards uniform standards.
Essentials of Financial Statement Analysis
9
© 2008 Worthy and James Publishing. See front matter: Terms of Use.
Overview
Introduction: Your New Business
We begin our discussion by assuming that you have just recently takenover the management of your (imaginary) family business. The business isa wholesale office supply store that primarily sells office supplies and officeequipment on account to retail merchants. One of the first things that youneed to do is to analyze the financial statements of the business to judge itscondition and to decide if you need to make any changes in the operations
and management.
A Reference Base
A reference base is simply a selected amount that is used to compare toother numbers. The comparison is usually done by calculating the other
numbers as a percentage of the reference base amount.
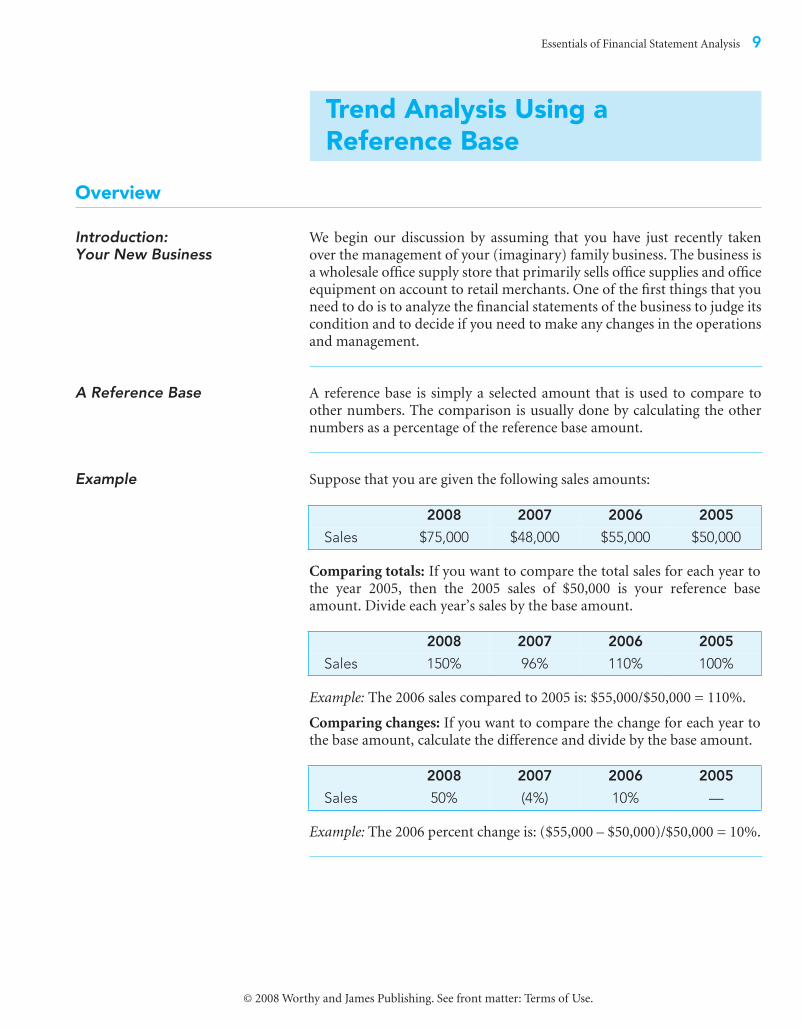
Example
Suppose that you are given the following sales amounts:
Comparing totals:
If you want to compare the total sales for each year tothe year 2005, then the 2005 sales of $50,000 is your reference baseamount. Divide each year’s sales by the base amount.
Example:
The 2006 sales compared to 2005 is: $55,000/$50,000 = 110%.
Comparing changes:
If you want to compare the change for each year tothe base amount, calculate the difference and divide by the base amount.
Example:
The 2006 percent change is: ($55,000 – $50,000)/$50,000 = 10%.
Trend Analysis Using a Reference Base
2008 2007 2006 2005
Sales $75,000 $48,000 $55,000 $50,000
2008 2007 2006 2005
Sales 150% 96% 110% 100%
2008 2007 2006 2005
Sales 50% (4%) 10% —
10 Essentials of Financial Statement Analysis
© 2008 Worthy and James Publishing. See front matter: Terms of Use.
Horizontal Analysis
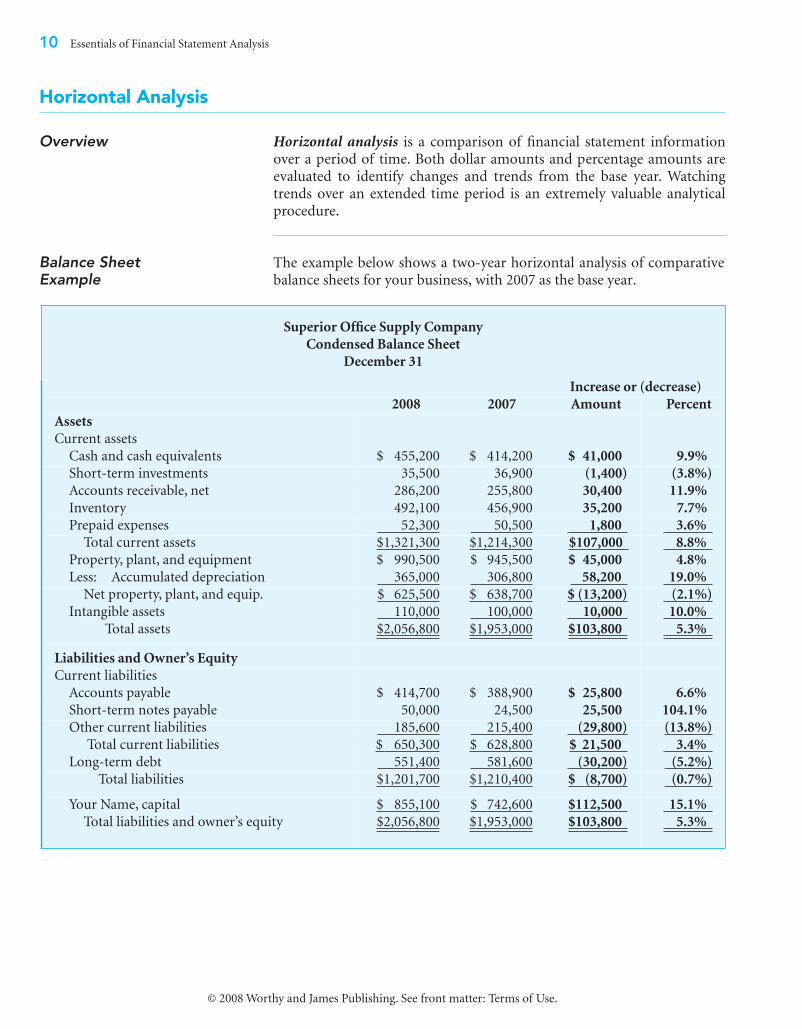
Overview Horizontal analysis is a comparison of financial statement informationover a period of time. Both dollar amounts and percentage amounts areevaluated to identify changes and trends from the base year. Watchingtrends over an extended time period is an extremely valuable analyticalprocedure.
Balance Sheet Example
The example below shows a two-year horizontal analysis of comparativebalance sheets for your business, with 2007 as the base year.
Superior Office Supply Company
Condensed Balance Sheet
December 31
Increase or (decrease)
2008 2007 Amount Percent
Assets
Current assets
Cash and cash equivalents $ 455,200 $ 414,200 $ 41,000 9.9%
Short-term investments 35,500 36,900 (1,400) (3.8%)
Accounts receivable, net 286,200 255,800 30,400 11.9%
Inventory 492,100 456,900 35,200 7.7%
Prepaid expenses 52,300 50,500 1,800 3.6%
Total current assets $1,321,300 $1,214,300 $107,000 8.8%
Property, plant, and equipment $ 990,500 $ 945,500 $ 45,000 4.8%
Less: Accumulated depreciation 365,000 306,800 58,200 19.0%
Net property, plant, and equip. $ 625,500 $ 638,700 $ (13,200) (2.1%)
Intangible assets 110,000 100,000 10,000 10.0%
Total assets $2,056,800 $1,953,000 $103,800 5.3%
Liabilities and Owner’s Equity
Current liabilities
Accounts payable $ 414,700 $ 388,900 $ 25,800 6.6%
Short-term notes payable 50,000 24,500 25,500 104.1%
Other current liabilities 185,600 215,400 (29,800) (13.8%)
Total current liabilities $ 650,300 $ 628,800 $ 21,500 3.4%
Long-term debt 551,400 581,600 (30,200) (5.2%)
Total liabilities $1,201,700 $1,210,400 $ (8,700) (0.7%)
Your Name, capital $ 855,100 $ 742,600 $112,500 15.1%
Total liabilities and owner’s equity $2,056,800 $1,953,000 $103,800 5.3%
Essentials of Financial Statement Analysis 11
© 2008 Worthy and James Publishing. See front matter: Terms of Use.
Horizontal Analysis, continued
Income Statement Example
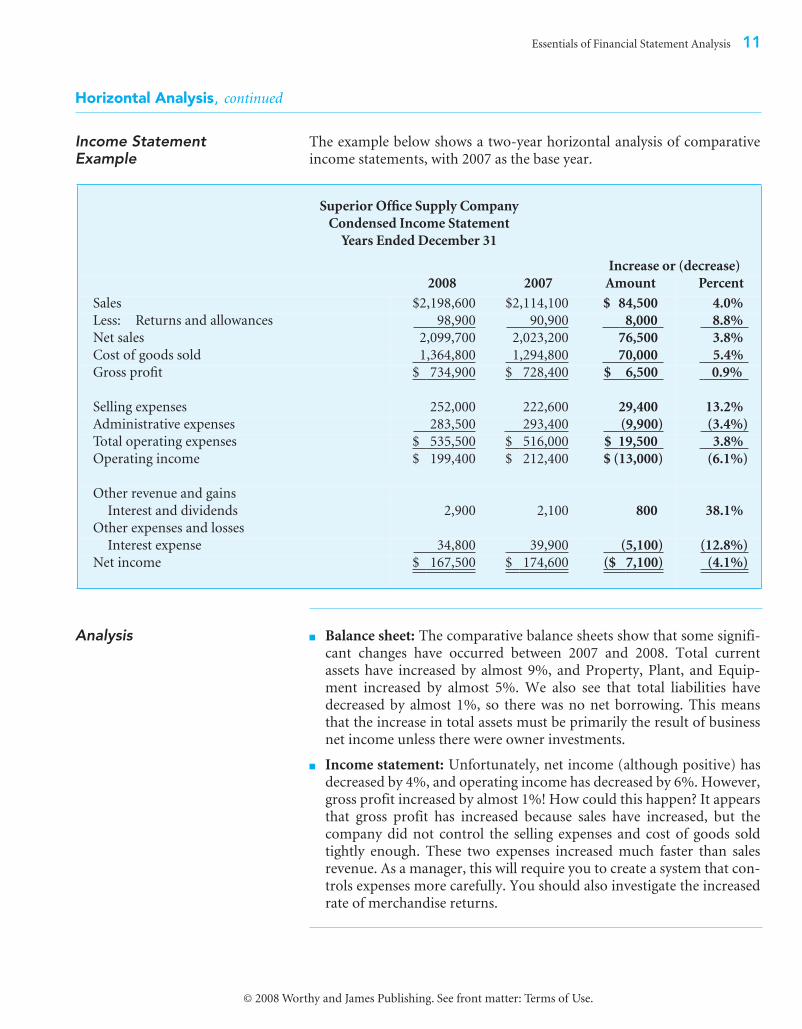
The example below shows a two-year horizontal analysis of comparativeincome statements, with 2007 as the base year.
Analysis ■ Balance sheet: The comparative balance sheets show that some signifi-cant changes have occurred between 2007 and 2008. Total currentassets have increased by almost 9%, and Property, Plant, and Equip-ment increased by almost 5%. We also see that total liabilities havedecreased by almost 1%, so there was no net borrowing. This meansthat the increase in total assets must be primarily the result of businessnet income unless there were owner investments.
■ Income statement: Unfortunately, net income (although positive) hasdecreased by 4%, and operating income has decreased by 6%. However,gross profit increased by almost 1%! How could this happen? It appearsthat gross profit has increased because sales have increased, but thecompany did not control the selling expenses and cost of goods soldtightly enough. These two expenses increased much faster than salesrevenue. As a manager, this will require you to create a system that con-trols expenses more carefully. You should also investigate the increasedrate of merchandise returns.
Superior Office Supply Company
Condensed Income Statement
Years Ended December 31
Increase or (decrease)
2008 2007 Amount Percent
Sales $2,198,600 $2,114,100 $ 84,500 4.0%
Less: Returns and allowances 98,900 90,900 8,000 8.8%
Net sales 2,099,700 2,023,200 76,500 3.8%
Cost of goods sold 1,364,800 1,294,800 70,000 5.4%
Gross profit $ 734,900 $ 728,400 $ 6,500 0.9%
Selling expenses 252,000 222,600 29,400 13.2%
Administrative expenses 283,500 293,400 (9,900) (3.4%)
Total operating expenses $ 535,500 $ 516,000 $ 19,500 3.8%
Operating income $ 199,400 $ 212,400 $ (13,000) (6.1%)
Other revenue and gains
Interest and dividends 2,900 2,100 800 38.1%
Other expenses and losses
Interest expense 34,800 39,900 (5,100) (12.8%)
Net income $ 167,500 $ 174,600 ($ 7,100) (4.1%)
12 Essentials of Financial Statement Analysis
© 2008 Worthy and James Publishing. See front matter: Terms of Use.
Vertical Analysis
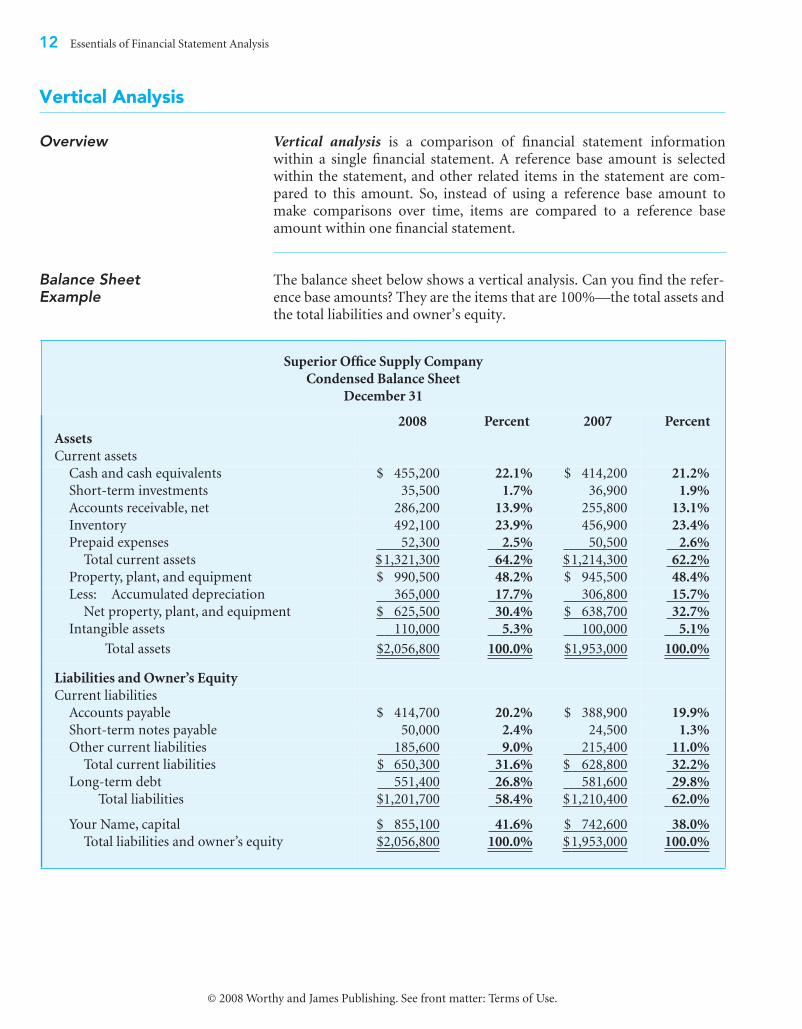
Overview Vertical analysis is a comparison of financial statement informationwithin a single financial statement. A reference base amount is selectedwithin the statement, and other related items in the statement are com-pared to this amount. So, instead of using a reference base amount tomake comparisons over time, items are compared to a reference baseamount within one financial statement.
Balance Sheet Example
The balance sheet below shows a vertical analysis. Can you find the refer-ence base amounts? They are the items that are 100%—the total assets andthe total liabilities and owner’s equity.
Superior Office Supply Company
Condensed Balance Sheet
December 31
2008 Percent 2007 Percent
Assets
Current assets
Cash and cash equivalents $ 455,200 22.1% $ 414,200 21.2%
Short-term investments 35,500 1.7% 36,900 1.9%
Accounts receivable, net 286,200 13.9% 255,800 13.1%
Inventory 492,100 23.9% 456,900 23.4%
Prepaid expenses 52,300 2.5% 50,500 2.6%
Total current assets $1,321,300 64.2% $1,214,300 62.2%
Property, plant, and equipment $ 990,500 48.2% $ 945,500 48.4%
Less: Accumulated depreciation 365,000 17.7% 306,800 15.7%
Net property, plant, and equipment $ 625,500 30.4% $ 638,700 32.7%
Intangible assets 110,000 5.3% 100,000 5.1%
Total assets $2,056,800 100.0% $1,953,000 100.0%
Liabilities and Owner’s Equity
Current liabilities
Accounts payable $ 414,700 20.2% $ 388,900 19.9%
Short-term notes payable 50,000 2.4% 24,500 1.3%
Other current liabilities 185,600 9.0% 215,400 11.0%
Total current liabilities $ 650,300 31.6% $ 628,800 32.2%
Long-term debt 551,400 26.8% 581,600 29.8%
Total liabilities $1,201,700 58.4% $1,210,400 62.0%
Your Name, capital $ 855,100 41.6% $ 742,600 38.0%
Total liabilities and owner’s equity $2,056,800 100.0% $1,953,000 100.0%
Essentials of Financial Statement Analysis 13
© 2008 Worthy and James Publishing. See front matter: Terms of Use.
Vertical Analysis, continued
Income Statement Example
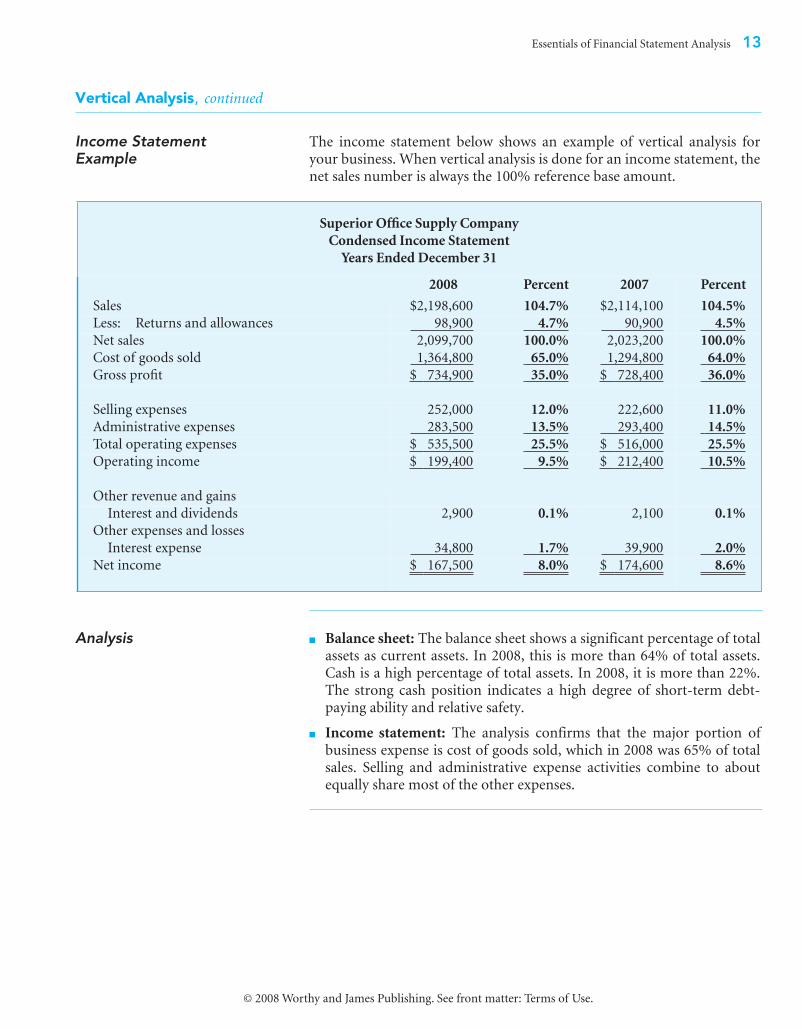
The income statement below shows an example of vertical analysis foryour business. When vertical analysis is done for an income statement, thenet sales number is always the 100% reference base amount.
Analysis ■ Balance sheet: The balance sheet shows a significant percentage of totalassets as current assets. In 2008, this is more than 64% of total assets.Cash is a high percentage of total assets. In 2008, it is more than 22%.The strong cash position indicates a high degree of short-term debt-paying ability and relative safety.
■ Income statement: The analysis confirms that the major portion ofbusiness expense is cost of goods sold, which in 2008 was 65% of totalsales. Selling and administrative expense activities combine to aboutequally share most of the other expenses.
Superior Office Supply Company
Condensed Income Statement
Years Ended December 31
2008 Percent 2007 Percent
Sales $2,198,600 104.7% $2,114,100 104.5%
Less: Returns and allowances 98,900 4.7% 90,900 4.5%
Net sales 2,099,700 100.0% 2,023,200 100.0%
Cost of goods sold 1,364,800 65.0% 1,294,800 64.0%
Gross profit $ 734,900 35.0% $ 728,400 36.0%
Selling expenses 252,000 12.0% 222,600 11.0%
Administrative expenses 283,500 13.5% 293,400 14.5%
Total operating expenses $ 535,500 25.5% $ 516,000 25.5%
Operating income $ 199,400 9.5% $ 212,400 10.5%
Other revenue and gains
Interest and dividends 2,900 0.1% 2,100 0.1%
Other expenses and losses
Interest expense 34,800 1.7% 39,900 2.0%
Net income $ 167,500 8.0% $ 174,600 8.6%
14 Essentials of Financial Statement Analysis
© 2008 Worthy and James Publishing. See front matter: Terms of Use.
Combined Horizontal and Vertical Analysis
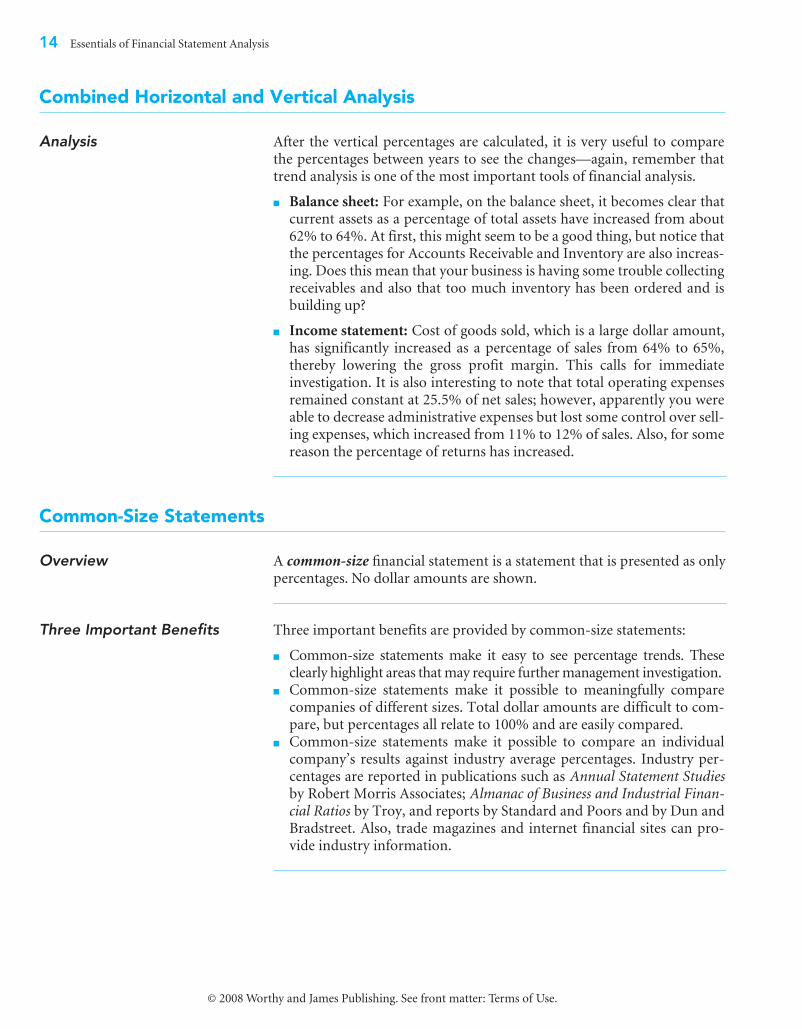
Analysis After the vertical percentages are calculated, it is very useful to comparethe percentages between years to see the changes—again, remember thattrend analysis is one of the most important tools of financial analysis.
■ Balance sheet: For example, on the balance sheet, it becomes clear thatcurrent assets as a percentage of total assets have increased from about62% to 64%. At first, this might seem to be a good thing, but notice thatthe percentages for Accounts Receivable and Inventory are also increas-ing. Does this mean that your business is having some trouble collectingreceivables and also that too much inventory has been ordered and isbuilding up?
■ Income statement: Cost of goods sold, which is a large dollar amount,has significantly increased as a percentage of sales from 64% to 65%,thereby lowering the gross profit margin. This calls for immediateinvestigation. It is also interesting to note that total operating expensesremained constant at 25.5% of net sales; however, apparently you wereable to decrease administrative expenses but lost some control over sell-ing expenses, which increased from 11% to 12% of sales. Also, for somereason the percentage of returns has increased.
Common-Size Statements
Overview A common-size financial statement is a statement that is presented as onlypercentages. No dollar amounts are shown.
Three Important Benefits Three important benefits are provided by common-size statements:
■ Common-size statements make it easy to see percentage trends. Theseclearly highlight areas that may require further management investigation.
■ Common-size statements make it possible to meaningfully comparecompanies of different sizes. Total dollar amounts are difficult to com-pare, but percentages all relate to 100% and are easily compared.
■ Common-size statements make it possible to compare an individualcompany’s results against industry average percentages. Industry per-centages are reported in publications such as Annual Statement Studiesby Robert Morris Associates; Almanac of Business and Industrial Finan-cial Ratios by Troy, and reports by Standard and Poors and by Dun andBradstreet. Also, trade magazines and internet financial sites can pro-vide industry information.
Essentials of Financial Statement Analysis 15
© 2008 Worthy and James Publishing. See front matter: Terms of Use.
Common-Size Statements, continued
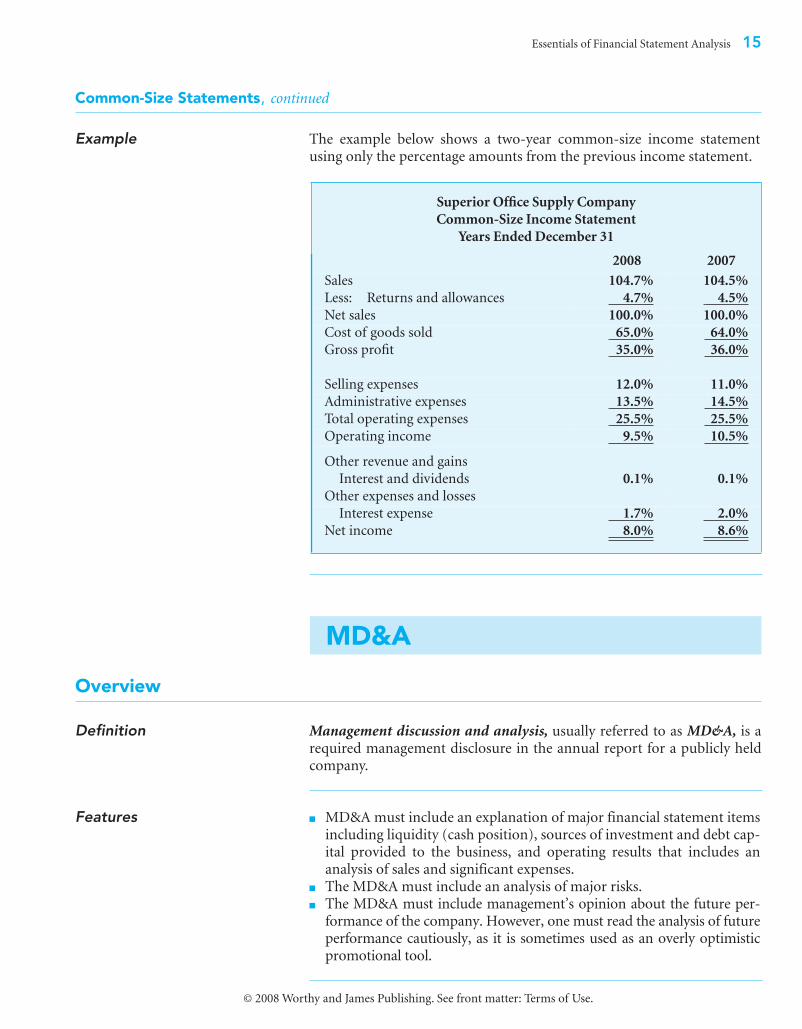
Example The example below shows a two-year common-size income statementusing only the percentage amounts from the previous income statement.
Overview
Definition Management discussion and analysis, usually referred to as MD&A, is arequired management disclosure in the annual report for a publicly heldcompany.
Features ■ MD&A must include an explanation of major financial statement itemsincluding liquidity (cash position), sources of investment and debt cap-ital provided to the business, and operating results that includes ananalysis of sales and significant expenses.
■ The MD&A must include an analysis of major risks. ■ The MD&A must include management’s opinion about the future per-
formance of the company. However, one must read the analysis of futureperformance cautiously, as it is sometimes used as an overly optimisticpromotional tool.
Superior Office Supply Company
Common-Size Income Statement
Years Ended December 31
2008 2007
Sales 104.7% 104.5%
Less: Returns and allowances 4.7% 4.5%
Net sales 100.0% 100.0%
Cost of goods sold 65.0% 64.0%
Gross profit 35.0% 36.0%
Selling expenses 12.0% 11.0%
Administrative expenses 13.5% 14.5%
Total operating expenses 25.5% 25.5%
Operating income 9.5% 10.5%
Other revenue and gains
Interest and dividends 0.1% 0.1%
Other expenses and losses
Interest expense 1.7% 2.0%
Net income 8.0% 8.6%
MD&A
16 Essentials of Financial Statement Analysis
© 2008 Worthy and James Publishing. See front matter: Terms of Use.
Overview
Introduction Ratio analysis is a means of analyzing selected financial statement items bythe use of ratios. A ratio is the comparison of one number to another byshowing the numbers as a fraction, with the answer expressed as the frac-tion, or converted to a percentage, a rate, or a proportion. (To review theseitems, see the basic math reviews in the disks accompanying these volumes.)
A financial ratio is designed so that the two numbers used in the ratio areconnected in a meaningful way. As a result, the ratio should provide a usefulinsight into some specific element of a company’s condition or operations.Ratios are designed to evaluate many different elements of a business.
Business Elements Analyzed
A great deal of financial data is available that can be used for many possi-ble ratio calculations. In this section, we look at some of the most impor-tant and useful ratios, which measure these key aspects of a business:
■ Liquidity: The ability to pay short-term debts as they come due■ Solvency: The long-term survival of a business■ Profitability: The success of a business as measured by net income■ Investment return: Measures a company on its merit as an investment ■ Productivity: Measures the operating efficiency
Interpreting Financial Ratios
Overview Mechanically calculating a ratio does not tell you much—you need to beable to interpret the answer you get. Let’s take a look at how to interpretthe ratios we will calculate.
Research the Company
First, find out enough about a company to have an understanding of whathas been happening to it. This makes the ratios more meaningful. If possi-ble, talk to present and past managers and employees. For large companies,read financial and trade newspapers, magazines, and reports to find outabout the company and its industry area. Search the Internet using thecompany’s name, including a visit to the company’s home page and linkson the home page to sites that analyze the company.
Ratio Analysis
Essentials of Financial Statement Analysis 17
© 2008 Worthy and James Publishing. See front matter: Terms of Use.
Interpreting Financial Ratios, continued
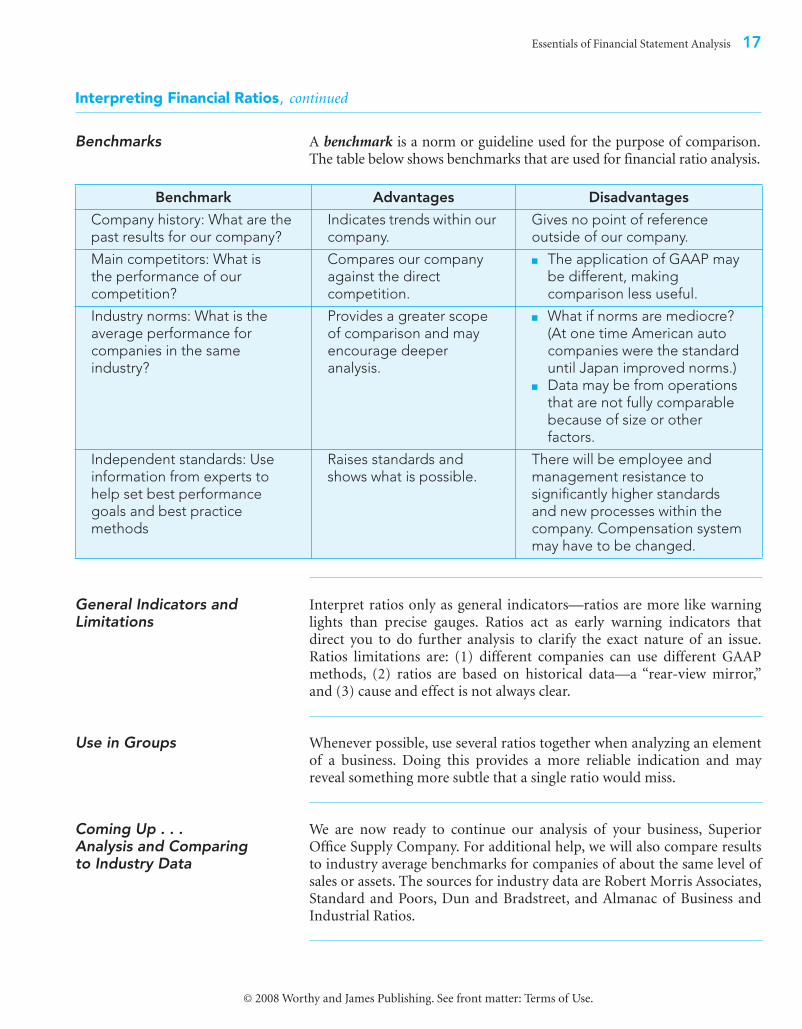
Benchmarks A benchmark is a norm or guideline used for the purpose of comparison.The table below shows benchmarks that are used for financial ratio analysis.
General Indicators and Limitations
Interpret ratios only as general indicators—ratios are more like warninglights than precise gauges. Ratios act as early warning indicators thatdirect you to do further analysis to clarify the exact nature of an issue.Ratios limitations are: (1) different companies can use different GAAPmethods, (2) ratios are based on historical data—a “rear-view mirror,”and (3) cause and effect is not always clear.
Use in Groups Whenever possible, use several ratios together when analyzing an elementof a business. Doing this provides a more reliable indication and mayreveal something more subtle that a single ratio would miss.
Coming Up . . .Analysis and Comparing to Industry Data
We are now ready to continue our analysis of your business, SuperiorOffice Supply Company. For additional help, we will also compare resultsto industry average benchmarks for companies of about the same level ofsales or assets. The sources for industry data are Robert Morris Associates,Standard and Poors, Dun and Bradstreet, and Almanac of Business andIndustrial Ratios.
Benchmark Advantages Disadvantages
Company history: What are the past results for our company?
Indicates trends within our company.
Gives no point of reference outside of our company.
Main competitors: What is the performance of our competition?
Compares our company against the direct competition.
■ The application of GAAP may be different, making comparison less useful.
Industry norms: What is the average performance for companies in the same industry?
Provides a greater scope of comparison and may encourage deeper analysis.
■ What if norms are mediocre? (At one time American auto companies were the standard until Japan improved norms.)
■ Data may be from operations that are not fully comparable because of size or other factors.
Independent standards: Use information from experts to help set best performance goals and best practice methods
Raises standards and shows what is possible.
There will be employee and management resistance to significantly higher standards and new processes within the company. Compensation system may have to be changed.
18 Essentials of Financial Statement Analysis
© 2008 Worthy and James Publishing. See front matter: Terms of Use.
Measures of Liquidity
Overview Liquidity means the ability to obtain cash needed to pay current liabilitiesas they come due and to pay unexpected short-term obligations. If a busi-ness cannot pay these immediate obligations, it will cease to operate. Own-ers, managers, suppliers, and lenders are very concerned with liquidity. Wewill examine the following ratios to evaluate liquidity condition: (1) currentratio, (2) quick ratio, (3) receivables turnover ratio, and (4) inventory turn-over ratio.
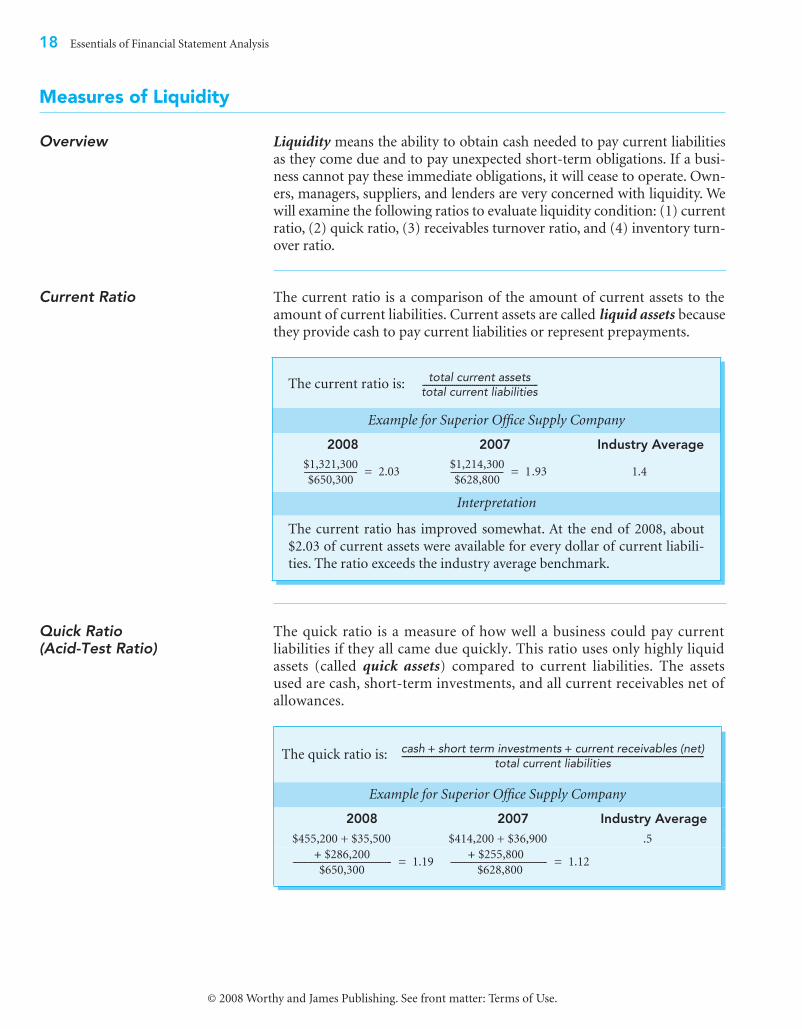
Current Ratio The current ratio is a comparison of the amount of current assets to theamount of current liabilities. Current assets are called liquid assets becausethey provide cash to pay current liabilities or represent prepayments.
Quick Ratio (Acid-Test Ratio)
The quick ratio is a measure of how well a business could pay currentliabilities if they all came due quickly. This ratio uses only highly liquidassets (called quick assets) compared to current liabilities. The assetsused are cash, short-term investments, and all current receivables net ofallowances.
The current ratio is:
Example for Superior Office Supply Company
2008 2007 Industry Average
1.4
Interpretation
The current ratio has improved somewhat. At the end of 2008, about
$2.03 of current assets were available for every dollar of current liabili-
ties. The ratio exceeds the industry average benchmark.
total current assetstotal current liabilities----------------------------------------------------------
$1,321,300
$650,300----------------------- 2.03=
$1,214,300
$628,800----------------------- 1.93=
The quick ratio is:
Example for Superior Office Supply Company
2008 2007 Industry Average$455,200 + $35,500 $414,200 + $36,900 .5
cash short term investments current receivables (net)+ +total current liabilities
------------------------------------------------------------------------------------------------------------------------------------------------
$286,200 +$650,300
------------------------------------------- 1.19= $255,800 +
$628,800------------------------------------------ 1.12=
Essentials of Financial Statement Analysis 19
© 2008 Worthy and James Publishing. See front matter: Terms of Use.
Measures of Liquidity, continued
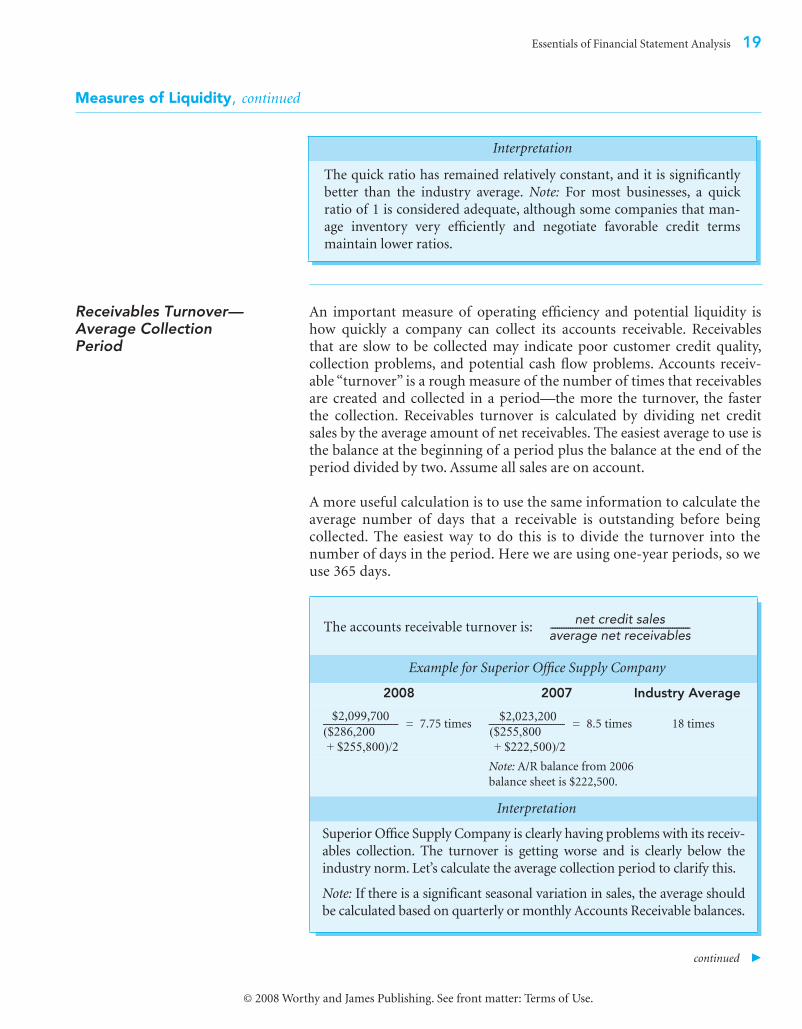
Receivables Turnover—Average Collection Period
An important measure of operating efficiency and potential liquidity ishow quickly a company can collect its accounts receivable. Receivablesthat are slow to be collected may indicate poor customer credit quality,collection problems, and potential cash flow problems. Accounts receiv-able “turnover” is a rough measure of the number of times that receivablesare created and collected in a period—the more the turnover, the fasterthe collection. Receivables turnover is calculated by dividing net creditsales by the average amount of net receivables. The easiest average to use isthe balance at the beginning of a period plus the balance at the end of theperiod divided by two. Assume all sales are on account.
A more useful calculation is to use the same information to calculate theaverage number of days that a receivable is outstanding before beingcollected. The easiest way to do this is to divide the turnover into thenumber of days in the period. Here we are using one-year periods, so weuse 365 days.
continued �
Interpretation
The quick ratio has remained relatively constant, and it is significantly
better than the industry average. Note: For most businesses, a quick
ratio of 1 is considered adequate, although some companies that man-
age inventory very efficiently and negotiate favorable credit terms
maintain lower ratios.
The accounts receivable turnover is:
Example for Superior Office Supply Company
2008 2007 Industry Average
18 times
Note: A/R balance from 2006
balance sheet is $222,500.
Interpretation
Superior Office Supply Company is clearly having problems with its receiv-
ables collection. The turnover is getting worse and is clearly below the
industry norm. Let’s calculate the average collection period to clarify this.
Note: If there is a significant seasonal variation in sales, the average should
be calculated based on quarterly or monthly Accounts Receivable balances.
net credit salesaverage net receivables---------------------------------------------------------------
$2,099,700 ($286,200+ $255,800)/2
--------------------------------- 7.75 times=$2,023,200
($255,800+ $222,500)/2
--------------------------------- 8.5 times=
20 Essentials of Financial Statement Analysis
© 2008 Worthy and James Publishing. See front matter: Terms of Use.
Measures of Liquidity, continued
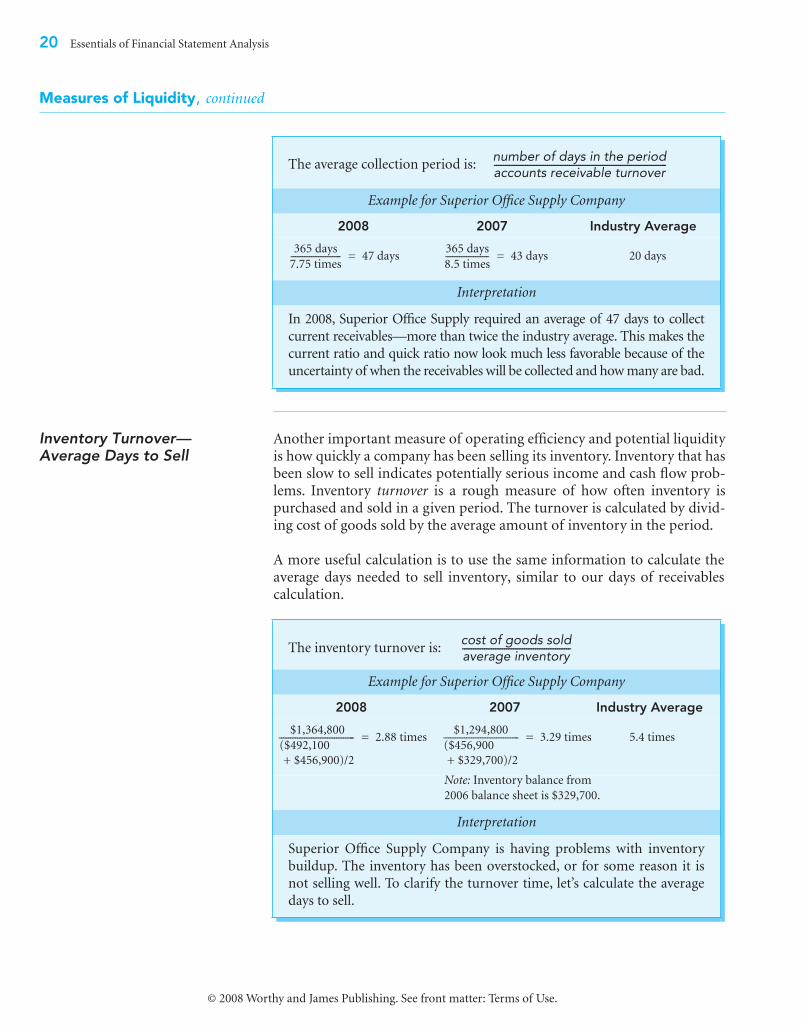
Inventory Turnover— Average Days to Sell
Another important measure of operating efficiency and potential liquidityis how quickly a company has been selling its inventory. Inventory that hasbeen slow to sell indicates potentially serious income and cash flow prob-lems. Inventory turnover is a rough measure of how often inventory ispurchased and sold in a given period. The turnover is calculated by divid-ing cost of goods sold by the average amount of inventory in the period.
A more useful calculation is to use the same information to calculate theaverage days needed to sell inventory, similar to our days of receivablescalculation.
The average collection period is:
Example for Superior Office Supply Company
2008 2007 Industry Average
20 days
Interpretation
In 2008, Superior Office Supply required an average of 47 days to collect
current receivables—more than twice the industry average. This makes the
current ratio and quick ratio now look much less favorable because of the
uncertainty of when the receivables will be collected and how many are bad.
number of days in the periodaccounts receivable turnover------------------------------------------------------------------------------
365 days
7.75 times---------------------- 47 days=
365 days
8.5 times------------------- 43 days=
The inventory turnover is:
Example for Superior Office Supply Company
2008 2007 Industry Average
5.4 times
Note: Inventory balance from
2006 balance sheet is $329,700.
Interpretation
Superior Office Supply Company is having problems with inventory
buildup. The inventory has been overstocked, or for some reason it is
not selling well. To clarify the turnover time, let’s calculate the average
days to sell.
cost of goods soldaverage inventory-------------------------------------------------
$1,364,800
($492,100
+ $456,900)/2
--------------------------------- 2.88 times=$1,294,800
($456,900
+ $329,700)/2
--------------------------------- 3.29 times=
Essentials of Financial Statement Analysis 21
© 2008 Worthy and James Publishing. See front matter: Terms of Use.
Measures of Liquidity, continued
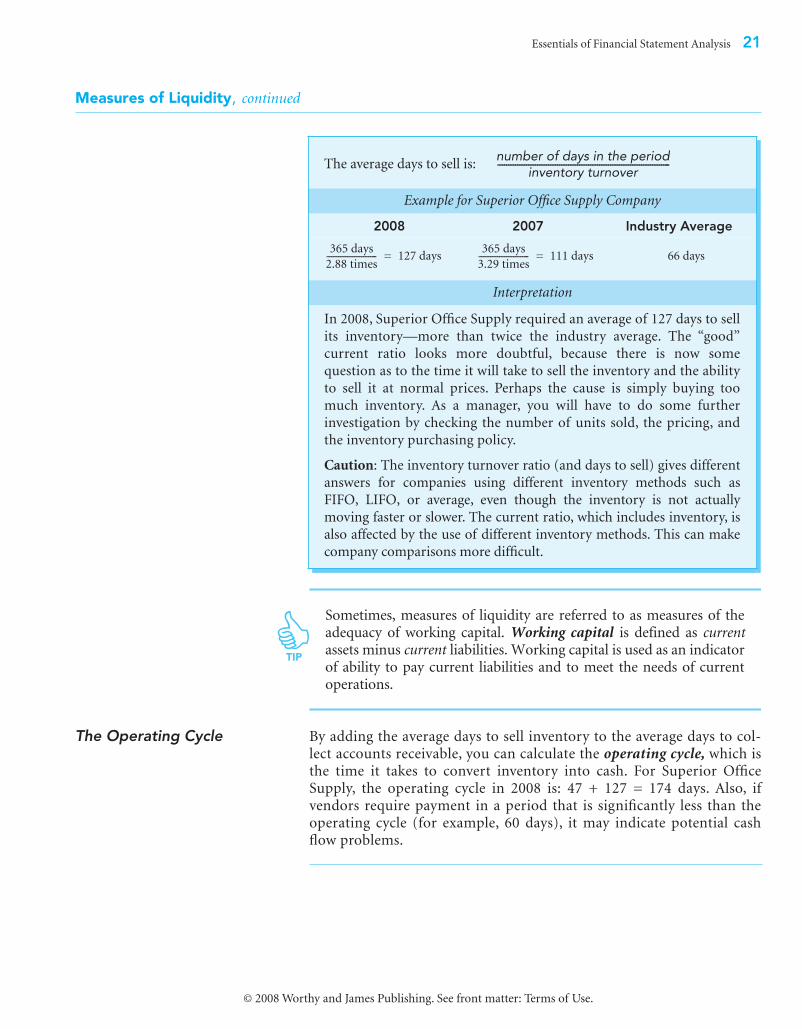
Sometimes, measures of liquidity are referred to as measures of theadequacy of working capital. Working capital is defined as currentassets minus current liabilities. Working capital is used as an indicatorof ability to pay current liabilities and to meet the needs of currentoperations.
The Operating Cycle By adding the average days to sell inventory to the average days to col-lect accounts receivable, you can calculate the operating cycle, which isthe time it takes to convert inventory into cash. For Superior OfficeSupply, the operating cycle in 2008 is: 47 + 127 = 174 days. Also, ifvendors require payment in a period that is significantly less than theoperating cycle (for example, 60 days), it may indicate potential cashflow problems.
The average days to sell is:
Example for Superior Office Supply Company
2008 2007 Industry Average
66 days
Interpretation
In 2008, Superior Office Supply required an average of 127 days to sell
its inventory—more than twice the industry average. The “good”
current ratio looks more doubtful, because there is now some
question as to the time it will take to sell the inventory and the ability
to sell it at normal prices. Perhaps the cause is simply buying too
much inventory. As a manager, you will have to do some further
investigation by checking the number of units sold, the pricing, and
the inventory purchasing policy.
Caution: The inventory turnover ratio (and days to sell) gives different
answers for companies using different inventory methods such as
FIFO, LIFO, or average, even though the inventory is not actually
moving faster or slower. The current ratio, which includes inventory, is
also affected by the use of different inventory methods. This can make
company comparisons more difficult.
number of days in the periodinventory turnover
------------------------------------------------------------------------------
365 days
2.88 times---------------------- 127 days=
365 days
3.29 times---------------------- 111 days=
TIP
22 Essentials of Financial Statement Analysis
© 2008 Worthy and James Publishing. See front matter: Terms of Use.
Measures of Solvency
Overview Solvency is the ability to remain in business for a long period of time. Thismainly refers to the ability to pay all debts as they come due. It also involvesthe ability to raise new capital and to adapt to changing conditions. Theratios we will use to evaluate solvency are: (1) debt ratio, (2) times interestearned ratio, (3) asset turnover ratio, (4) cash flow to debt ratio, and(5) free cash flow.
Note: Profitability also affects solvency; however, we will discuss this inthe next topic when we look at measures of profitability.
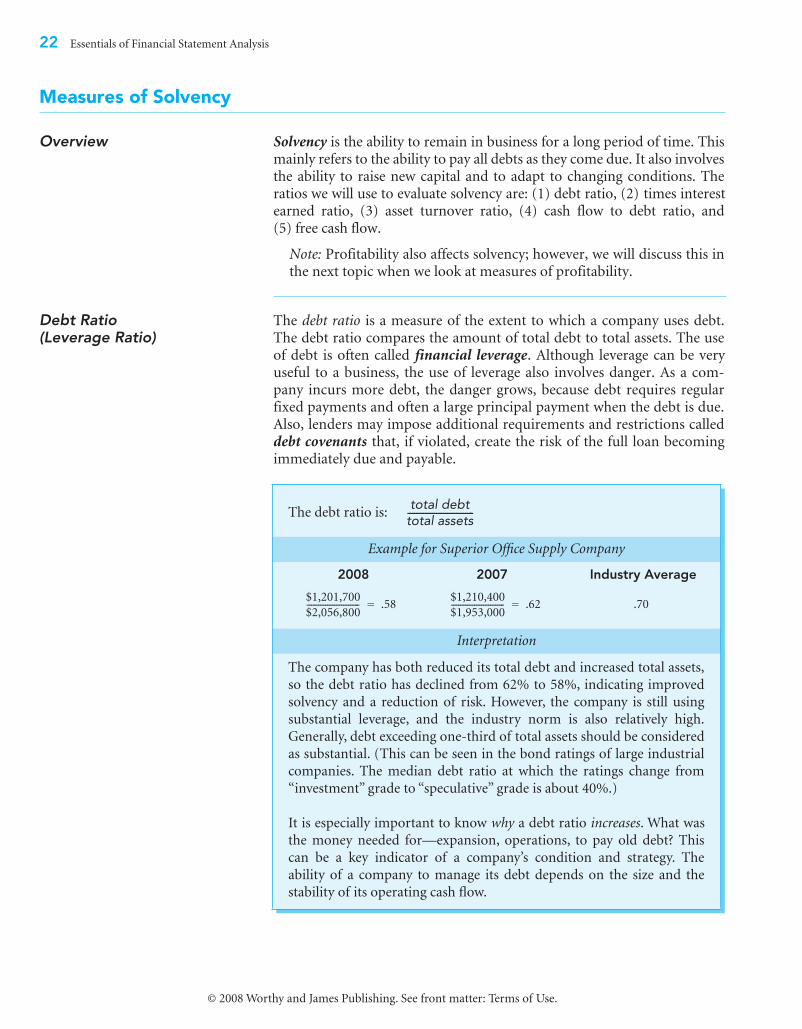
Debt Ratio(Leverage Ratio)
The debt ratio is a measure of the extent to which a company uses debt.The debt ratio compares the amount of total debt to total assets. The useof debt is often called financial leverage. Although leverage can be veryuseful to a business, the use of leverage also involves danger. As a com-pany incurs more debt, the danger grows, because debt requires regularfixed payments and often a large principal payment when the debt is due.Also, lenders may impose additional requirements and restrictions calleddebt covenants that, if violated, create the risk of the full loan becomingimmediately due and payable.
The debt ratio is:
Example for Superior Office Supply Company
2008 2007 Industry Average
.70
Interpretation
The company has both reduced its total debt and increased total assets,
so the debt ratio has declined from 62% to 58%, indicating improved
solvency and a reduction of risk. However, the company is still using
substantial leverage, and the industry norm is also relatively high.
Generally, debt exceeding one-third of total assets should be considered
as substantial. (This can be seen in the bond ratings of large industrial
companies. The median debt ratio at which the ratings change from
“investment” grade to “speculative” grade is about 40%.)
It is especially important to know why a debt ratio increases. What was
the money needed for—expansion, operations, to pay old debt? This
can be a key indicator of a company’s condition and strategy. The
ability of a company to manage its debt depends on the size and the
stability of its operating cash flow.
total debttotal assets------------------------------
$1,201,700
$2,056,800----------------------- .58=
$1,210,400
$1,953,000----------------------- .62=
Essentials of Financial Statement Analysis 23
© 2008 Worthy and James Publishing. See front matter: Terms of Use.
Measures of Solvency, continued
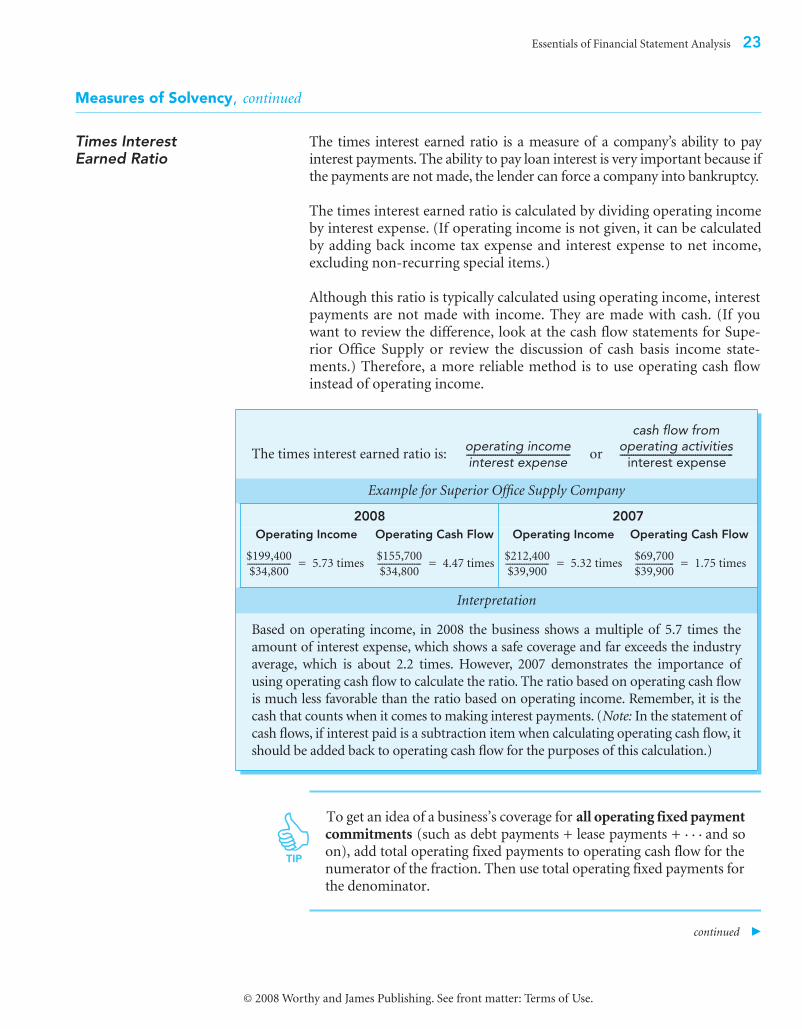
Times InterestEarned Ratio
The times interest earned ratio is a measure of a company’s ability to payinterest payments. The ability to pay loan interest is very important because ifthe payments are not made, the lender can force a company into bankruptcy.
The times interest earned ratio is calculated by dividing operating incomeby interest expense. (If operating income is not given, it can be calculatedby adding back income tax expense and interest expense to net income,excluding non-recurring special items.)
Although this ratio is typically calculated using operating income, interestpayments are not made with income. They are made with cash. (If youwant to review the difference, look at the cash flow statements for Supe-rior Office Supply or review the discussion of cash basis income state-ments.) Therefore, a more reliable method is to use operating cash flowinstead of operating income.
To get an idea of a business’s coverage for all operating fixed paymentcommitments (such as debt payments + lease payments + . . . and soon), add total operating fixed payments to operating cash flow for thenumerator of the fraction. Then use total operating fixed payments forthe denominator.
continued �
The times interest earned ratio is: or
Example for Superior Office Supply Company
2008 2007Operating Income Operating Cash Flow Operating Income Operating Cash Flow
Interpretation
Based on operating income, in 2008 the business shows a multiple of 5.7 times the
amount of interest expense, which shows a safe coverage and far exceeds the industry
average, which is about 2.2 times. However, 2007 demonstrates the importance of
using operating cash flow to calculate the ratio. The ratio based on operating cash flow
is much less favorable than the ratio based on operating income. Remember, it is the
cash that counts when it comes to making interest payments. (Note: In the statement of
cash flows, if interest paid is a subtraction item when calculating operating cash flow, it
should be added back to operating cash flow for the purposes of this calculation.)
operating incomeinterest expense-----------------------------------------------
cash flow fromoperating activities
interest expense---------------------------------------------------
$199,400
$34,800------------------- 5.73 times=
$155,700
$34,800------------------- 4.47 times=
$212,400
$39,900------------------- 5.32 times=
$69,700
$39,900----------------- 1.75 times=
TIP
24 Essentials of Financial Statement Analysis
© 2008 Worthy and James Publishing. See front matter: Terms of Use.
Measures of Solvency, continued
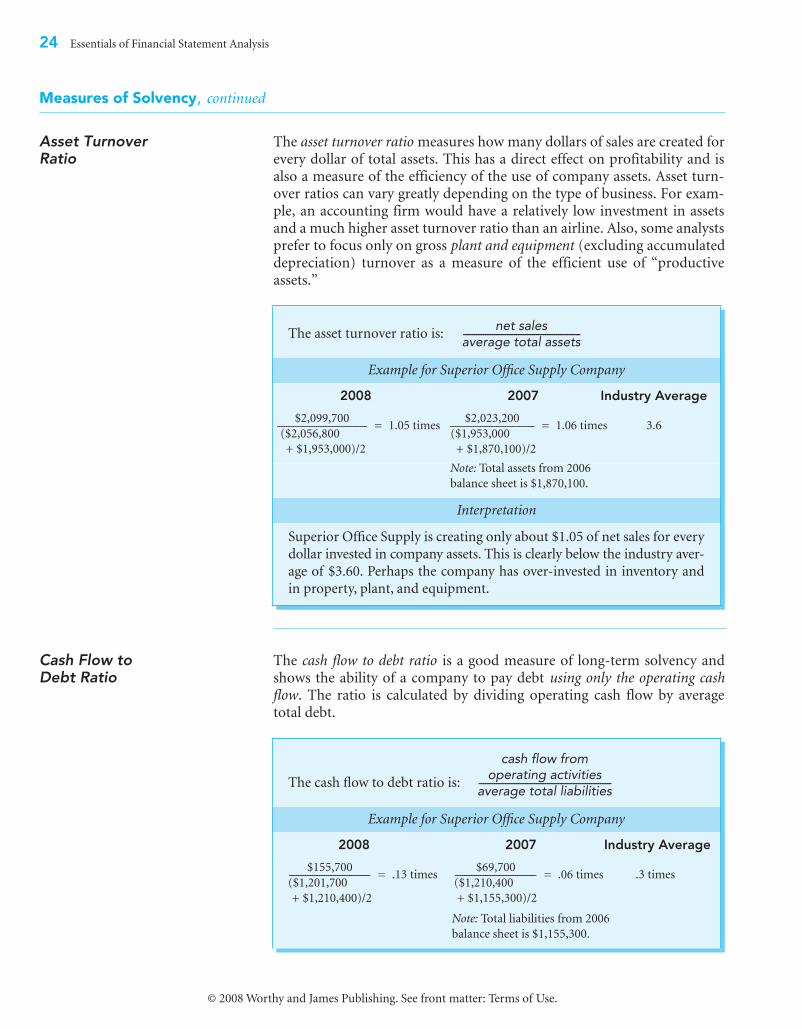
Asset TurnoverRatio
The asset turnover ratio measures how many dollars of sales are created forevery dollar of total assets. This has a direct effect on profitability and isalso a measure of the efficiency of the use of company assets. Asset turn-over ratios can vary greatly depending on the type of business. For exam-ple, an accounting firm would have a relatively low investment in assetsand a much higher asset turnover ratio than an airline. Also, some analystsprefer to focus only on gross plant and equipment (excluding accumulateddepreciation) turnover as a measure of the efficient use of “productiveassets.”
Cash Flow toDebt Ratio
The cash flow to debt ratio is a good measure of long-term solvency andshows the ability of a company to pay debt using only the operating cashflow. The ratio is calculated by dividing operating cash flow by averagetotal debt.
The asset turnover ratio is:
Example for Superior Office Supply Company
2008 2007 Industry Average
3.6
Note: Total assets from 2006
balance sheet is $1,870,100.
Interpretation
Superior Office Supply is creating only about $1.05 of net sales for every
dollar invested in company assets. This is clearly below the industry aver-
age of $3.60. Perhaps the company has over-invested in inventory and
in property, plant, and equipment.
net salesaverage total assets-----------------------------------------------------
$2,099,700
($2,056,800
+ $1,953,000)/2
--------------------------------------- 1.05 times=$2,023,200
($1,953,000
+ $1,870,100)/2
------------------------------------- 1.06 times=
The cash flow to debt ratio is:
Example for Superior Office Supply Company
2008 2007 Industry Average
.3 times
Note: Total liabilities from 2006
balance sheet is $1,155,300.
cash flow fromoperating activities
average total liabilities------------------------------------------------------------
$155,700
($1,201,700
+ $1,210,400)/2
----------------------------------- .13 times=$69,700
($1,210,400
+ $1,155,300)/2
----------------------------------- .06 times=
Essentials of Financial Statement Analysis 25
© 2008 Worthy and James Publishing. See front matter: Terms of Use.
Measures of Solvency, continued
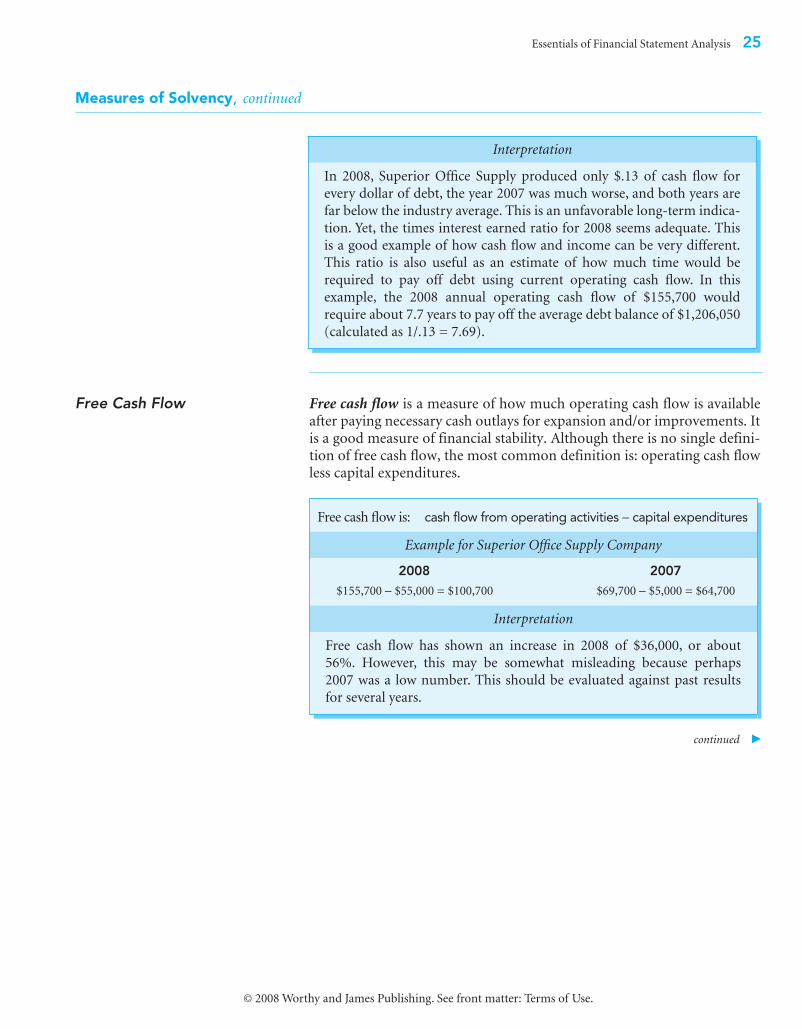
Free Cash Flow Free cash flow is a measure of how much operating cash flow is availableafter paying necessary cash outlays for expansion and/or improvements. Itis a good measure of financial stability. Although there is no single defini-tion of free cash flow, the most common definition is: operating cash flowless capital expenditures.
continued �
Interpretation
In 2008, Superior Office Supply produced only $.13 of cash flow for
every dollar of debt, the year 2007 was much worse, and both years are
far below the industry average. This is an unfavorable long-term indica-
tion. Yet, the times interest earned ratio for 2008 seems adequate. This
is a good example of how cash flow and income can be very different.
This ratio is also useful as an estimate of how much time would be
required to pay off debt using current operating cash flow. In this
example, the 2008 annual operating cash flow of $155,700 would
require about 7.7 years to pay off the average debt balance of $1,206,050
(calculated as 1/.13 = 7.69).
Free cash flow is: cash flow from operating activities − capital expenditures
Example for Superior Office Supply Company
2008 2007$155,700 − $55,000 = $100,700 $69,700 − $5,000 = $64,700
Interpretation
Free cash flow has shown an increase in 2008 of $36,000, or about
56%. However, this may be somewhat misleading because perhaps
2007 was a low number. This should be evaluated against past results
for several years.
26 Essentials of Financial Statement Analysis
© 2008 Worthy and James Publishing. See front matter: Terms of Use.
Measures of Solvency, continued
EBITDA EBITDA sounds like some kind of wild African animal, but it really meansEarnings Before Interest, Taxes, Depreciation, and Amortization. To calcu-late EBITDA, start with income from continuing operations and add backdepreciation and amortization to obtain an income amount that excludesthese four expenses.
EBITDA is supposed to be an estimate of cash flow from operations, and itis often used in press releases, business news reports, and even in someratio calculations. This is unfortunate because it is a very inferior and mis-leading estimate for several reasons. I mostly ignore EBITDA and simplylook for cash flow from operating activities on the statement of cash flows.
Measures of Profitability
Overview Profitability is the essential reason for operating a business. It is also a keyelement in a company’s success, or lack of it, in obtaining capital. Profit-ability information is widely used and reported to lenders, investors, andother stakeholders. Profitability ratios can be calculated at different levelsof the income statement, such as net income, operating income, and grossprofit.
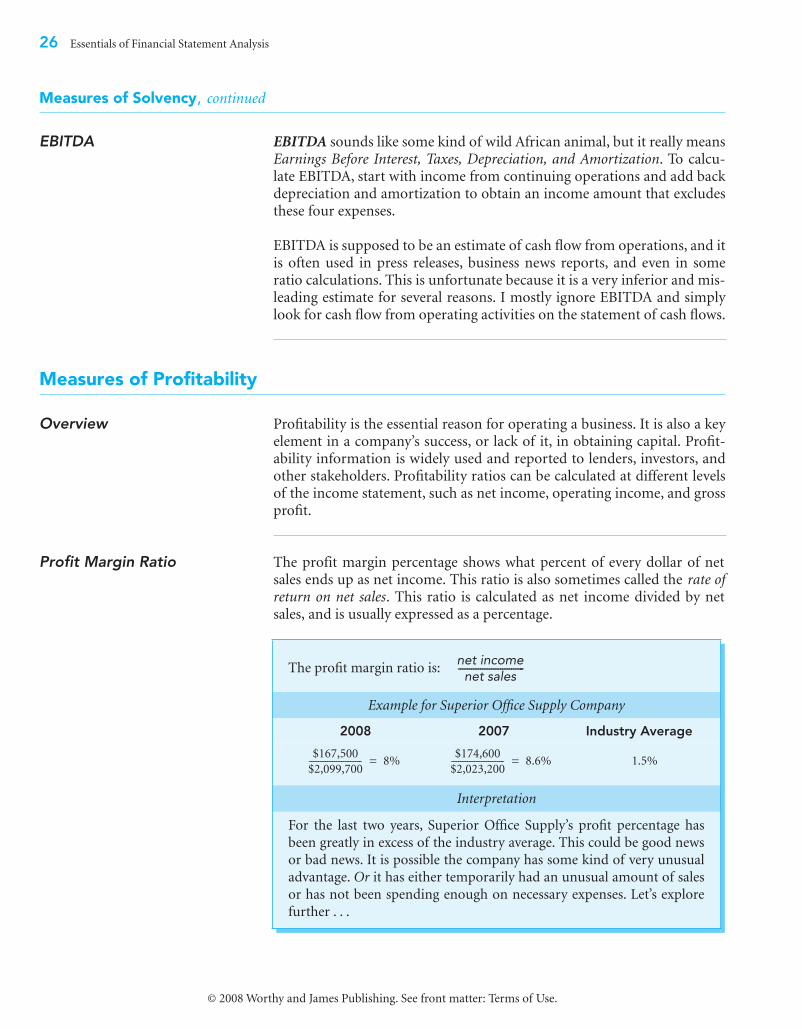
Profit Margin Ratio The profit margin percentage shows what percent of every dollar of netsales ends up as net income. This ratio is also sometimes called the rate ofreturn on net sales. This ratio is calculated as net income divided by netsales, and is usually expressed as a percentage.
The profit margin ratio is:
Example for Superior Office Supply Company
2008 2007 Industry Average
1.5%
Interpretation
For the last two years, Superior Office Supply’s profit percentage has
been greatly in excess of the industry average. This could be good news
or bad news. It is possible the company has some kind of very unusual
advantage. Or it has either temporarily had an unusual amount of sales
or has not been spending enough on necessary expenses. Let’s explore
further . . .
net incomenet sales
------------------------------
$167,500
$2,099,700----------------------- 8%=
$174,600
$2,023,200----------------------- 8.6%=
Essentials of Financial Statement Analysis 27
© 2008 Worthy and James Publishing. See front matter: Terms of Use.
Measures of Profitability, continued
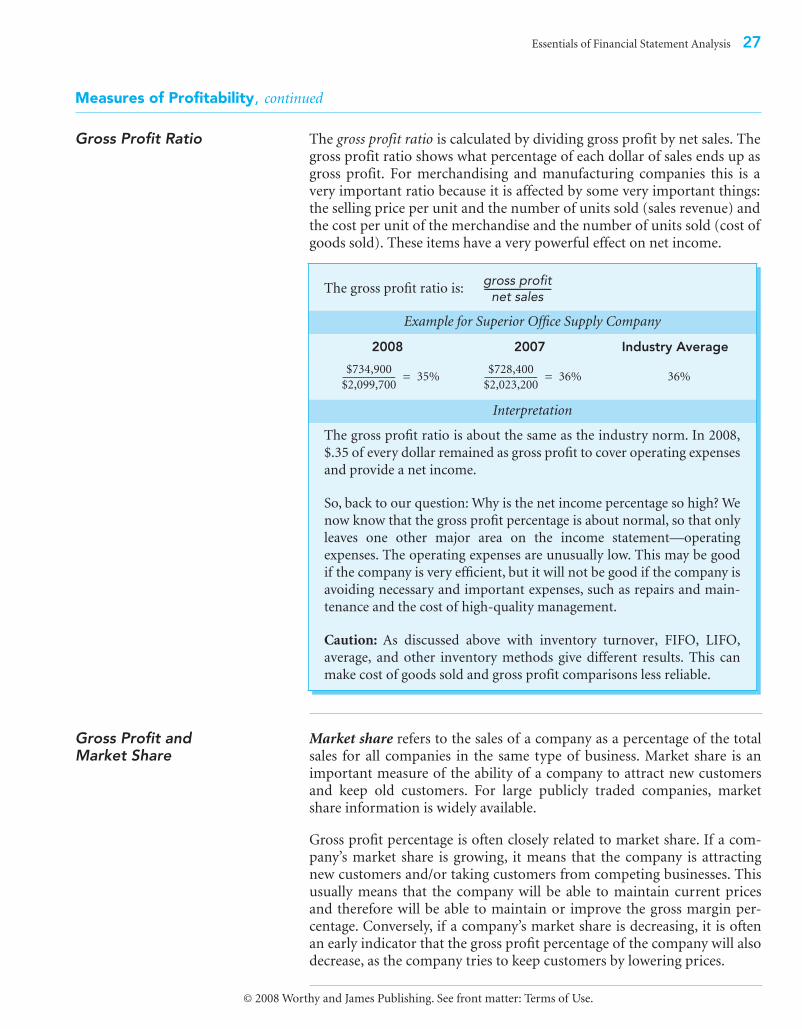
Gross Profit Ratio The gross profit ratio is calculated by dividing gross profit by net sales. Thegross profit ratio shows what percentage of each dollar of sales ends up asgross profit. For merchandising and manufacturing companies this is avery important ratio because it is affected by some very important things:the selling price per unit and the number of units sold (sales revenue) andthe cost per unit of the merchandise and the number of units sold (cost ofgoods sold). These items have a very powerful effect on net income.
Gross Profit andMarket Share
Market share refers to the sales of a company as a percentage of the totalsales for all companies in the same type of business. Market share is animportant measure of the ability of a company to attract new customersand keep old customers. For large publicly traded companies, marketshare information is widely available.
Gross profit percentage is often closely related to market share. If a com-pany’s market share is growing, it means that the company is attractingnew customers and/or taking customers from competing businesses. Thisusually means that the company will be able to maintain current pricesand therefore will be able to maintain or improve the gross margin per-centage. Conversely, if a company’s market share is decreasing, it is oftenan early indicator that the gross profit percentage of the company will alsodecrease, as the company tries to keep customers by lowering prices.
The gross profit ratio is:
Example for Superior Office Supply Company
2008 2007 Industry Average
36%
Interpretation
The gross profit ratio is about the same as the industry norm. In 2008,
$.35 of every dollar remained as gross profit to cover operating expenses
and provide a net income.
So, back to our question: Why is the net income percentage so high? We
now know that the gross profit percentage is about normal, so that only
leaves one other major area on the income statement—operating
expenses. The operating expenses are unusually low. This may be good
if the company is very efficient, but it will not be good if the company is
avoiding necessary and important expenses, such as repairs and main-
tenance and the cost of high-quality management.
Caution: As discussed above with inventory turnover, FIFO, LIFO,
average, and other inventory methods give different results. This can
make cost of goods sold and gross profit comparisons less reliable.
gross profitnet sales
------------------------------
$734,900
$2,099,700----------------------- 35%=
$728,400
$2,023,200----------------------- 36%=
28
Essentials of Financial Statement Analysis
© 2008 Worthy and James Publishing. See front matter: Terms of Use.
Measures of Profitability
,
continued
Earnings Per Share
Earnings per share (often called
EPS
) is a calculation that is done only fora corporation. The basic EPS calculation is:
The EPS shows how much net income is potentially available for each shareof common stock. The EPS number is important because it is a scalingmethod that allows the earnings of different size companies to be comparedon a per-share basis. Corporations that have
publicly traded
stock (stockthat is traded on exchanges like the New York Stock Exchange or Nasdaqexchange) are required to show earnings per share. The ratio is also impor-tant to stock investors who use it as part of a calculation called the
priceearnings ratio
(
PE ratio
), which is the price per share divided by the earn-ings per share. The PE ratio is used as an indicator of relative stock value.
There is no “good or bad” EPS number; it is an amount that is watched overtime and compared to the EPS of other corporations and measured againstthe price of the stock using the PE ratio. (Some analysts prefer to use operat-
ing cash flow or free cash flow instead of net income in the calculation.)
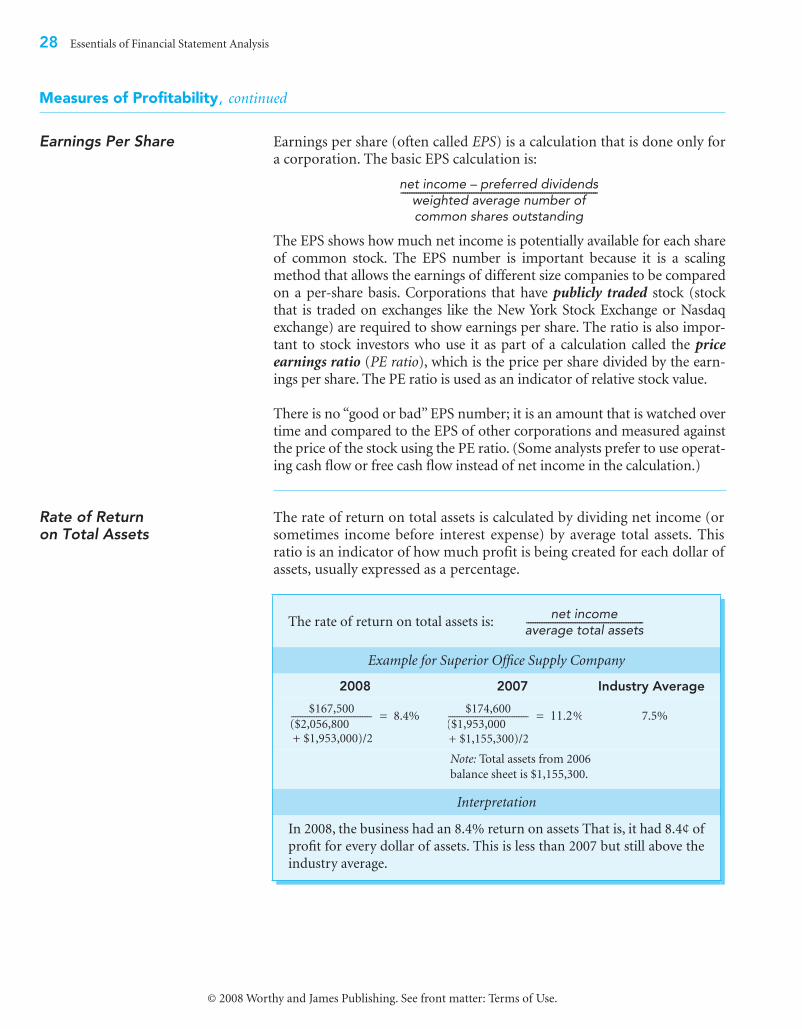
Rate of Returnon Total Assets
The rate of return on total assets is calculated by dividing net income (orsometimes income before interest expense) by average total assets. Thisratio is an indicator of how much profit is being created for each dollar ofassets, usually expressed as a percentage.
net income – preferred dividendsweighted average number ofcommon shares outstanding
-----------------------------------------------------------------------------------------
The rate of return on total assets is:
Example for Superior Office Supply Company
2008 2007 Industry Average
7.5%
Note:
Total assets from 2006
balance sheet is $1,155,300.
Interpretation
In 2008, the business had an 8.4% return on assets That is, it had 8.4¢ of
profit for every dollar of assets. This is less than 2007 but still above the
industry average.
net incomeaverage total assets-----------------------------------------------------
$167,500
($2,056,800 + $1,953,000)/2
----------------------------------- 8.4%=$174,600
($1,953,000+ $1,155,300)/2
----------------------------------- 11.2%=
Essentials of Financial Statement Analysis 29
© 2008 Worthy and James Publishing. See front matter: Terms of Use.
Measures of Investment Return
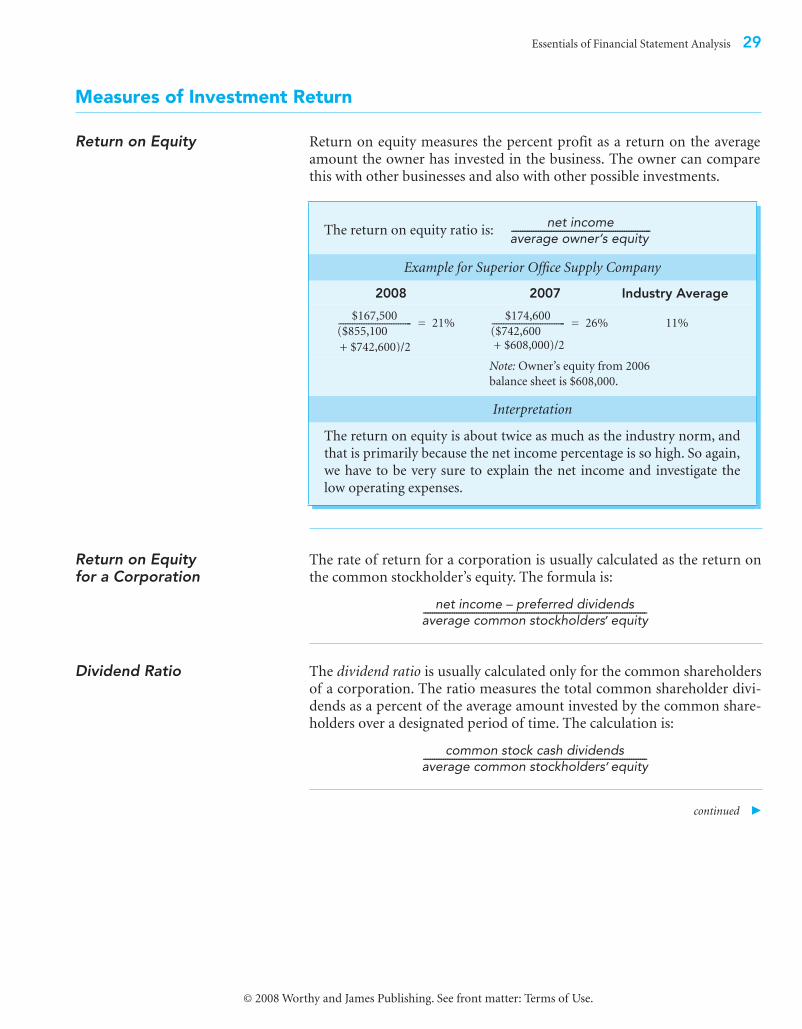
Return on Equity Return on equity measures the percent profit as a return on the averageamount the owner has invested in the business. The owner can comparethis with other businesses and also with other possible investments.
Return on Equityfor a Corporation
The rate of return for a corporation is usually calculated as the return onthe common stockholder’s equity. The formula is:
Dividend Ratio The dividend ratio is usually calculated only for the common shareholdersof a corporation. The ratio measures the total common shareholder divi-dends as a percent of the average amount invested by the common share-holders over a designated period of time. The calculation is:
continued �
The return on equity ratio is:
Example for Superior Office Supply Company
2008 2007 Industry Average
11%
Note: Owner’s equity from 2006
balance sheet is $608,000.
Interpretation
The return on equity is about twice as much as the industry norm, and
that is primarily because the net income percentage is so high. So again,
we have to be very sure to explain the net income and investigate the
low operating expenses.
net incomeaverage owner,s equity---------------------------------------------------------------
$167,500
($855,100
+ $742,600)/2
-------------------------------- 21%=$174,600
($742,600 + $608,000)/2
-------------------------------- 26%=
net income – preferred dividendsaverage common stockholders, equity-----------------------------------------------------------------------------------------------------
common stock cash dividendsaverage common stockholders,equity-----------------------------------------------------------------------------------------------------
30 Essentials of Financial Statement Analysis
© 2008 Worthy and James Publishing. See front matter: Terms of Use.
Measures of Investment Return, continued
Trading on Equity Trading on equity refers to the effect that financial leverage (see the debtratio discussion) has on the return on equity. The effect of trading onequity can be seen by comparing the rate of return on total assets of 8.4%in 2008 with the return on the owner’s equity in 2008 of 21%. The positivedifference that exceeds the return on total assets happens when a businessborrows money at an interest rate that is less than the rate that the busi-ness is able to earn when it uses the borrowed money. Using borrowedfunds (leverage) also means that less of the owners’ money is needed toacquire assets. The borrowed money is being put to work to buy assets thatcreate additional income and that do not require the use of owners’money. If the borrowed money more than “pays for itself,” this profitabilityis a boost that adds directly to net income.
Trading on equity should be used cautiously. The attempt to trade onequity may result in a much worse rate of return to owners if the situationreverses and a company cannot earn a rate of return on the borrowedmoney that is equivalent to the interest cost. Furthermore, increased debtalways means increased risk. In our discussion of the debt ratio, we sawthat the median level at which debt ratings change from investment tospeculative grade is about 40%. Although many companies in fact operateat a debt ratio higher than 40%, it does not lessen the increased cash flowrisk and opportunity cost risk when large, sudden, and negative financialevents occur.
Measures of Productivity
Overview Measures of productivity show the level of efficiency at which a companyis using and obtaining its resources. There are many measures of produc-tivity. The measure used should relate to an important resource. Sometypical examples are shown below.
Revenue (or Gross Profit)Per Unit of Resource
Revenue (or gross profit) per unit of resource shows the amount of reve-nue (gross profit) created per unit of scarce resource used. Examples:
■ Revenue per square foot of floor space (used by retail stores)■ Revenue per employee or per dollar of wages expense■ Revenue per seat per mile (used by airlines)■ Asset turnover ratio. The asset turnover ratio previously discussed can
also be interpreted as an overall measure of how effectively the invest-ment in assets is used to create revenue.

Essentials of Financial Statement Analysis 31
© 2008 Worthy and James Publishing. See front matter: Terms of Use.
Measures of Productivity, continued
Cost Per Unitof Resource
Cost per unit of resource shows the cost incurred to obtain or use a unit ofa particular resource. Examples:
■ Wage expense per employee or per hour worked■ Rent expense per square foot■ Cost of inventory per item
Other GoodIndicators
Other indicators of productivity focus on designated activities. Examples:
■ Plant and equipment turnover: This is an indicator of the amount ofrevenue created for every dollar invested in the plant and equipment(productive) assets. This is similar to total asset turnover, except thatthe denominator used is the average gross cost of plant and equipment.
■ Inventory turnover: The inventory turnover ratio previously discussedshows how quickly a business is able to sell inventory. Also, the numberof days of inventory on hand can be a good early warning of an inven-tory buildup.
■ Accounts receivable turnover: As previously discussed, this also relates tothe efficiency of collecting receivables and the management of credit policy.
■ Accounts receivable compared to sales: Compare the percentage changein the age of accounts receivable to the percentage change in net sales.(The accounts receivable turnover ratio acts as a similar indicator of theability to actually collect what is reported as revenue.)
■ Percent of past-due or uncollectible receivables per sales dollar: This is anindicator of the credit policy applied and collectibility of reported sales.
■ Cost of goods sold as a percentage of revenue■ Percent of returned merchandise per sales dollar ■ Variances between actual costs and budgeted or standard costs
32 Essentials of Financial Statement Analysis
© 2008 Worthy and James Publishing. See front matter: Terms of Use.
Overview
Insider As PrimaryUser of FinancialInformation
Until this point, our discussion about financial statement analysis hasbeen from the point of view of someone who has the ability to influence orcontrol the management—an insider. For example, we analyzed the finan-cial statements of Superior Office Supply Company as if you were assum-ing management of your own family-owned business. Therefore, thefinancial information was primarily for your use, as an insider, to analyzeand improve your business.
As an insider and primary user you want financial statements to be asaccurate and as honestly representative of the real situation as possible.Your analysis of these statements improves your understanding of what ishappening to the business and improves your decision making, which inturn results in better profits and cash flow. Your good decisions increasethe value of the business. Moreover, if necessary, the business will be able toobtain cheaper outside capital (lower interest on loans and lower requiredrate of return on new investment money), because the business is secureand profitable.
Notice the priorities here for use of financial statement information:(1) create better understanding and decision making, which results in (2) anincrease in real business value, and finally (3) a cheaper cost of capital.
Outsiders As Usersof FinancialInformation
Outsiders are people who do not have authority to manage a company. Themost important outsiders are providers of capital: (1) investors, (2) lenders,and (3) suppliers. For some businesses, outsiders may be a significant andregular source of capital. This is usually the situation with large corpora-tions. Outsiders are also financial statement users and, of course, wantstatements that are reliable and accurate. However, outsiders must rely onthe financial statements that have been prepared by the insiders—the topmanagement.
Different Priorities As an outsider, you naturally would like to believe that the financial infor-mation priorities of the management are the same as yours, which is to firstcreate reliable financial statements that result in good decision making.Then business value increases and cost of capital decreases. Sometimes ithappens this way.
Often however, when outsiders begin to provide a significant amount ofcapital, the management’s financial information priorities become reversed:(1) maximize short-term business value and obtain the cheapest possiblecapital and (2) create better understanding and decision making.
Analysis as an Outsider
Essentials of Financial Statement Analysis 33
© 2008 Worthy and James Publishing. See front matter: Terms of Use.
Overview, continued
Be Skeptical Maximum business value and low-cost capital happen primarily as theresult of high reported profits. When high reported profits become a com-pelling first priority that supersedes effective management, the financialstatements become a tool for reporting favorable information rather thanfor showing reliable and accurate information for decision making. Thebusiness begins to look more valuable—not because management hasactually made it more valuable but because the financial statements areused as a shortcut to make the business appear more valuable.
As an outsider, it is always wise to maintain the following skeptical atti-tude: A company that (1) needs significant capital from outsiders and/or(2) provides significant rewards to top management based on profitabilitywill (3) have a management that is highly motivated to create financialstatements that make a business appear as profitable as possible.
Finding Information
Full Disclosure For publicly traded companies, the law requires that information disclo-sures to outside parties be made available simultaneously to all outsideparties. Therefore, even as an outsider, you have access to very usefulinformation, and no other outsider legally has better access to informationthan you do.
SEC Probably the single best source of detailed company information for pub-licly traded companies is the SEC (Securities and Exchange Commission)website at www.sec.gov. You can type in a company name (or its trading“ticker” symbol) to locate the company and its reports. The key financialinformation items to look for are reports 10-K (annual report) and 10-Q(quarterly report) and 8-K (disclosure of material events).
Annual Reports Company annual reports are available at the investor relations page of acompany website. Some other sites that provide annual reports arewww.annualreportservice.com and www.reportgallery.com.
Conference Calls When publicly traded companies release annual reports, top managementwill present a public question-and-answer session called a conference call.You can listen to this discussion on the Internet! Written transcripts of thecall are also available on the Internet. This is often very useful informationbecause analysts participating in the session ask very insightful questions.
34 Essentials of Financial Statement Analysis
© 2008 Worthy and James Publishing. See front matter: Terms of Use.
Overview
Overview At various times in this volume and in Volume 1, we have referred to theimportant topic of event analysis. We defined event analysis as the ana-lytical procedure used to identify and properly record transactions. Thekey elements of event analysis are: (1) classification, (2) valuation, and(3) timing (recognition).
The quality of earnings issue is really a discussion about proper eventanalysis in the context of how the event analysis affects the income state-ment. Specifically, on the income statement the reported income or loss isa direct result of how revenue and gain events and expense and loss eventsare analyzed.
Definition Although there is no single definition of quality of earnings, the generalidea is the extent to which a company’s operating and net income hon-estly portray what has really happened. More specifically, quality of earn-ings refers to these issues:
1. Does income accurately measure the change in a company’s wealth thathas resulted from the current period operations?
2. Does income accurately represent the recurring and repeatable opera-tions of a company so that the reported income has predictive usefulness?
EarningsManagement
Whenever a company intentionally uses GAAP for the purpose of manip-ulating the results shown on the income statement, the company is doingearnings management. This is a major cause of low quality of earnings.
Earnings Management
Example Smith Corporation is aggressive and wants to favorably impress investorsso that the price of its stock will increase. Smith uses every accountingmethod that it can for the express purpose of reporting higher net income.For example, it records all revenue regardless of the financial condition ofits customers, it uses the straight-line depreciation method, and it usesFIFO in an industry in which prices are regularly increasing. Smith is saidto have a low quality of earnings because there is a good chance that itsselection of methods, all biased toward showing higher income, overstatesthe wealth actually resulting from operations. Also, outsiders are likely tobe misled into believing that the favorable results come from recurringoperations that will continue into future periods.
Quality of Earnings
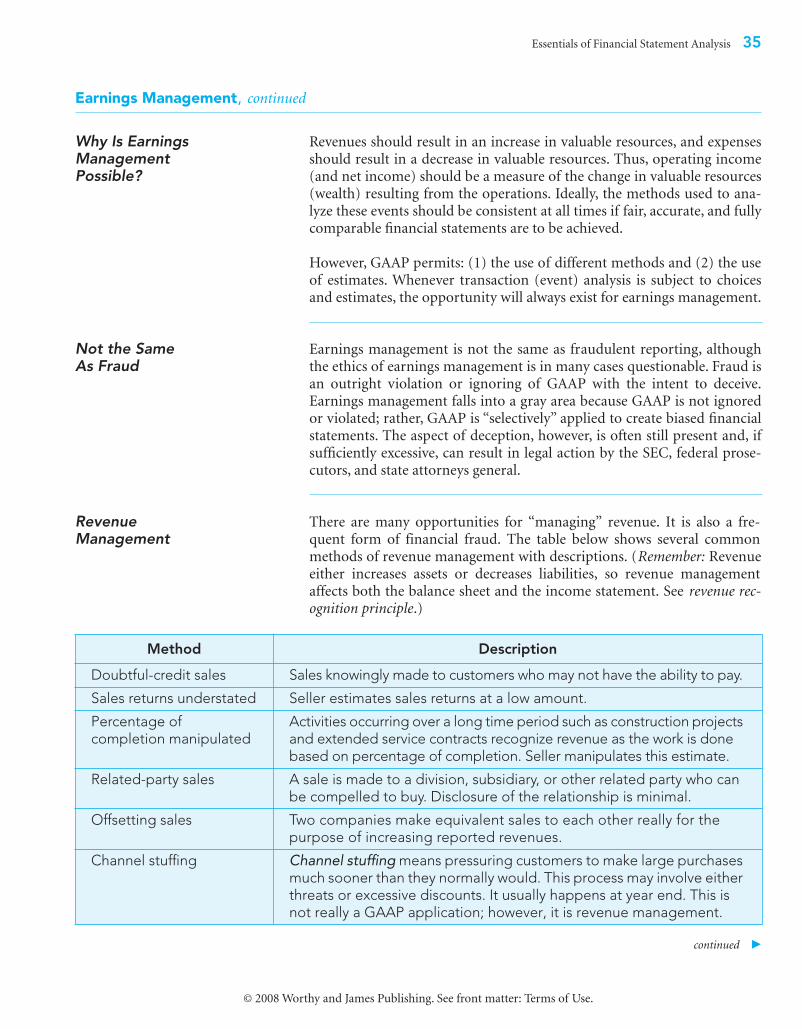
Essentials of Financial Statement Analysis 35
© 2008 Worthy and James Publishing. See front matter: Terms of Use.
Earnings Management, continued
Why Is EarningsManagementPossible?
Revenues should result in an increase in valuable resources, and expensesshould result in a decrease in valuable resources. Thus, operating income(and net income) should be a measure of the change in valuable resources(wealth) resulting from the operations. Ideally, the methods used to ana-lyze these events should be consistent at all times if fair, accurate, and fullycomparable financial statements are to be achieved.
However, GAAP permits: (1) the use of different methods and (2) the useof estimates. Whenever transaction (event) analysis is subject to choicesand estimates, the opportunity will always exist for earnings management.
Not the SameAs Fraud
Earnings management is not the same as fraudulent reporting, althoughthe ethics of earnings management is in many cases questionable. Fraud isan outright violation or ignoring of GAAP with the intent to deceive.Earnings management falls into a gray area because GAAP is not ignoredor violated; rather, GAAP is “selectively” applied to create biased financialstatements. The aspect of deception, however, is often still present and, ifsufficiently excessive, can result in legal action by the SEC, federal prose-cutors, and state attorneys general.
RevenueManagement
There are many opportunities for “managing” revenue. It is also a fre-quent form of financial fraud. The table below shows several commonmethods of revenue management with descriptions. (Remember: Revenueeither increases assets or decreases liabilities, so revenue managementaffects both the balance sheet and the income statement. See revenue rec-ognition principle.)
continued �
Method Description
Doubtful-credit sales Sales knowingly made to customers who may not have the ability to pay.
Sales returns understated Seller estimates sales returns at a low amount.
Percentage of completion manipulated
Activities occurring over a long time period such as construction projects and extended service contracts recognize revenue as the work is done based on percentage of completion. Seller manipulates this estimate.
Related-party sales A sale is made to a division, subsidiary, or other related party who can be compelled to buy. Disclosure of the relationship is minimal.
Offsetting sales Two companies make equivalent sales to each other really for the purpose of increasing reported revenues.
Channel stuffing Channel stuffing means pressuring customers to make large purchases much sooner than they normally would. This process may involve either threats or excessive discounts. It usually happens at year end. This is not really a GAAP application; however, it is revenue management.
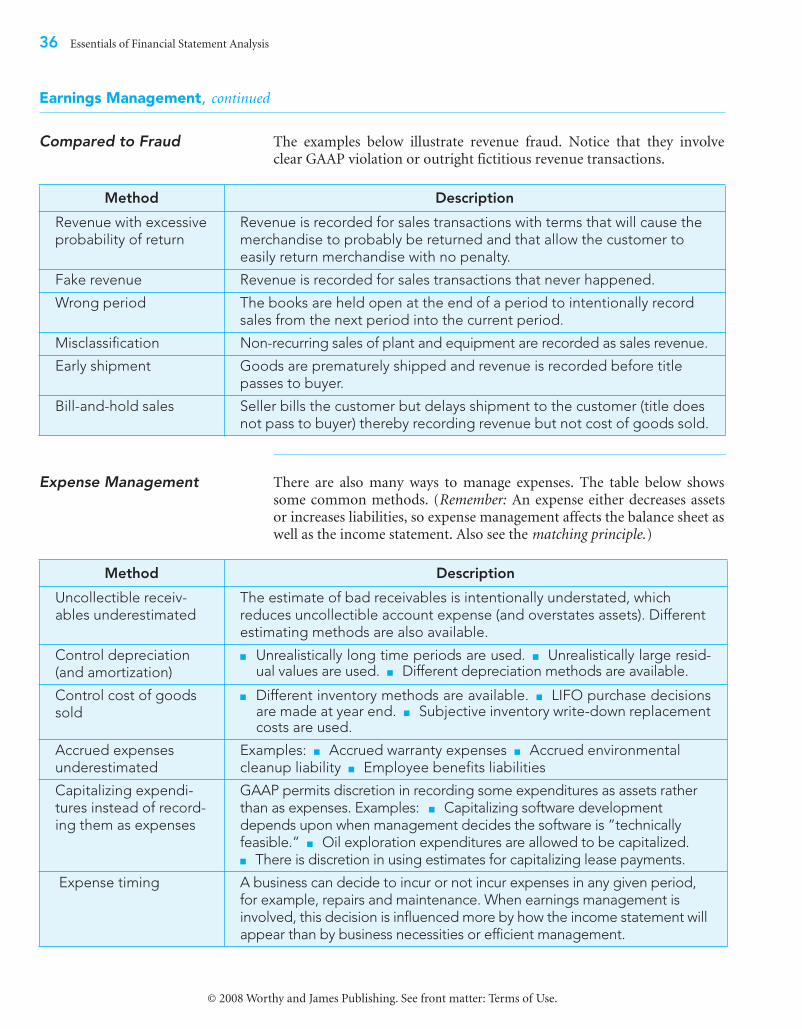
36 Essentials of Financial Statement Analysis
© 2008 Worthy and James Publishing. See front matter: Terms of Use.
Earnings Management, continued
Compared to Fraud The examples below illustrate revenue fraud. Notice that they involveclear GAAP violation or outright fictitious revenue transactions.
Expense Management There are also many ways to manage expenses. The table below showssome common methods. (Remember: An expense either decreases assetsor increases liabilities, so expense management affects the balance sheet aswell as the income statement. Also see the matching principle.)
Method Description
Revenue with excessive probability of return
Revenue is recorded for sales transactions with terms that will cause the merchandise to probably be returned and that allow the customer to easily return merchandise with no penalty.
Fake revenue Revenue is recorded for sales transactions that never happened.
Wrong period The books are held open at the end of a period to intentionally record sales from the next period into the current period.
Misclassification Non-recurring sales of plant and equipment are recorded as sales revenue.
Early shipment Goods are prematurely shipped and revenue is recorded before title passes to buyer.
Bill-and-hold sales Seller bills the customer but delays shipment to the customer (title does not pass to buyer) thereby recording revenue but not cost of goods sold.
Method Description
Uncollectible receiv-ables underestimated
The estimate of bad receivables is intentionally understated, which reduces uncollectible account expense (and overstates assets). Different estimating methods are also available.
Control depreciation (and amortization)
■ Unrealistically long time periods are used. ■ Unrealistically large resid-ual values are used. ■ Different depreciation methods are available.
Control cost of goods sold
■ Different inventory methods are available. ■ LIFO purchase decisionsare made at year end. ■ Subjective inventory write-down replacementcosts are used.
Accrued expenses underestimated
Examples: ■ Accrued warranty expenses ■ Accrued environmental cleanup liability ■ Employee benefits liabilities
Capitalizing expendi-tures instead of record-ing them as expenses
GAAP permits discretion in recording some expenditures as assets rather than as expenses. Examples: ■ Capitalizing software development depends upon when management decides the software is ”technically feasible.” ■ Oil exploration expenditures are allowed to be capitalized. ■ There is discretion in using estimates for capitalizing lease payments.
Expense timing A business can decide to incur or not incur expenses in any given period, for example, repairs and maintenance. When earnings management is involved, this decision is influenced more by how the income statement will appear than by business necessities or efficient management.
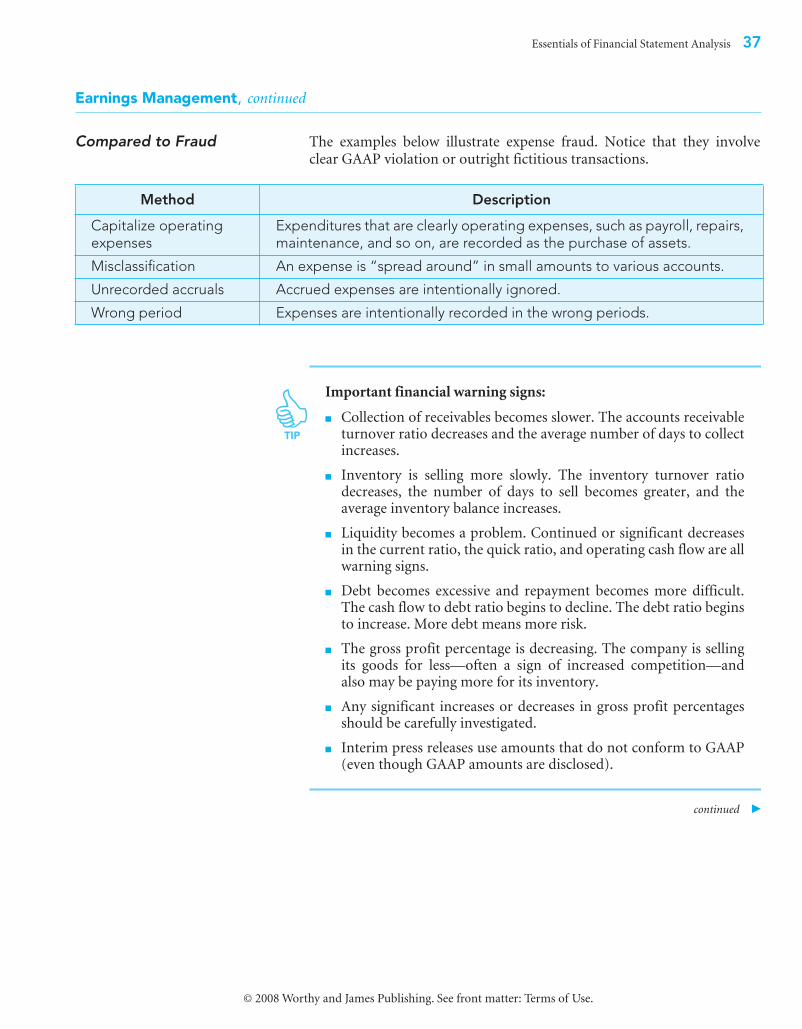
Essentials of Financial Statement Analysis 37
© 2008 Worthy and James Publishing. See front matter: Terms of Use.
Earnings Management, continued
Compared to Fraud The examples below illustrate expense fraud. Notice that they involveclear GAAP violation or outright fictitious transactions.
Important financial warning signs:
■ Collection of receivables becomes slower. The accounts receivableturnover ratio decreases and the average number of days to collectincreases.
■ Inventory is selling more slowly. The inventory turnover ratiodecreases, the number of days to sell becomes greater, and theaverage inventory balance increases.
■ Liquidity becomes a problem. Continued or significant decreasesin the current ratio, the quick ratio, and operating cash flow are allwarning signs.
■ Debt becomes excessive and repayment becomes more difficult.The cash flow to debt ratio begins to decline. The debt ratio beginsto increase. More debt means more risk.
■ The gross profit percentage is decreasing. The company is sellingits goods for less—often a sign of increased competition—andalso may be paying more for its inventory.
■ Any significant increases or decreases in gross profit percentagesshould be carefully investigated.
■ Interim press releases use amounts that do not conform to GAAP(even though GAAP amounts are disclosed).
continued �
Method Description
Capitalize operating expenses
Expenditures that are clearly operating expenses, such as payroll, repairs, maintenance, and so on, are recorded as the purchase of assets.
Misclassification An expense is “spread around” in small amounts to various accounts.
Unrecorded accruals Accrued expenses are intentionally ignored.
Wrong period Expenses are intentionally recorded in the wrong periods.
TIP
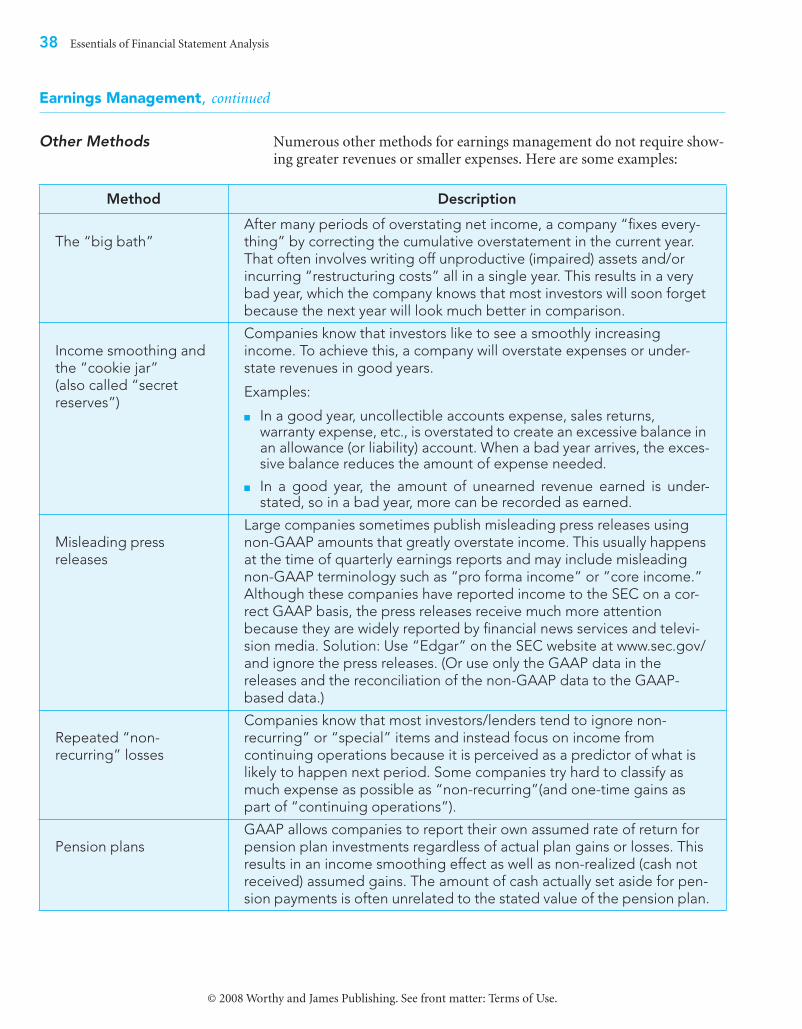
38 Essentials of Financial Statement Analysis
© 2008 Worthy and James Publishing. See front matter: Terms of Use.
Earnings Management, continued
Other Methods Numerous other methods for earnings management do not require show-ing greater revenues or smaller expenses. Here are some examples:
Method Description
The “big bath” After many periods of overstating net income, a company “fixes every-thing” by correcting the cumulative overstatement in the current year. That often involves writing off unproductive (impaired) assets and/or incurring “restructuring costs” all in a single year. This results in a very bad year, which the company knows that most investors will soon forget because the next year will look much better in comparison.
Income smoothing and the “cookie jar” (also called “secret reserves”)
Companies know that investors like to see a smoothly increasing income. To achieve this, a company will overstate expenses or under-state revenues in good years.
Examples:
■ In a good year, uncollectible accounts expense, sales returns, warranty expense, etc., is overstated to create an excessive balance in an allowance (or liability) account. When a bad year arrives, the exces-sive balance reduces the amount of expense needed.
■ In a good year, the amount of unearned revenue earned is under-stated, so in a bad year, more can be recorded as earned.
Misleading press releases
Large companies sometimes publish misleading press releases using non-GAAP amounts that greatly overstate income. This usually happens at the time of quarterly earnings reports and may include misleading non-GAAP terminology such as “pro forma income” or ”core income.” Although these companies have reported income to the SEC on a cor-rect GAAP basis, the press releases receive much more attention because they are widely reported by financial news services and televi-sion media. Solution: Use “Edgar” on the SEC website at www.sec.gov/ and ignore the press releases. (Or use only the GAAP data in the releases and the reconciliation of the non-GAAP data to the GAAP-based data.)
Repeated “non-recurring” losses
Companies know that most investors/lenders tend to ignore non-recurring” or “special” items and instead focus on income from continuing operations because it is perceived as a predictor of what is likely to happen next period. Some companies try hard to classify as much expense as possible as “non-recurring”(and one-time gains as part of “continuing operations”).
Pension plansGAAP allows companies to report their own assumed rate of return for pension plan investments regardless of actual plan gains or losses. This results in an income smoothing effect as well as non-realized (cash not received) assumed gains. The amount of cash actually set aside for pen-sion payments is often unrelated to the stated value of the pension plan.

Essentials of Financial Statement Analysis 39
© 2008 Worthy and James Publishing. See front matter: Terms of Use.
Overview
Importance of Knowing Liabilities
The importance of identifying all liabilities cannot be overstated. Liabil-ities are a claim on a company’s present and future wealth. Furthermore,many liabilities are created by expenses that significantly impact theamount of income reported on the income statement and thereby affectthe earnings. The analysis guidelines of classification, valuation, and tim-ing must be applied to all liabilities.
Identifying Liabilities Some liabilities are easy to identify because they have been recorded as theresult of completed transactions such as the receipt of cash from a bankloan or by properly recording an adjusting entry for an expense accrual.These are the liabilities that regularly appear on a balance sheet. But, canthere be liabilities that do not appear the balance sheet? Yes!
Liabilities Not on the Balance Sheet
Two kinds of liabilities have the potential to “disappear” from the balancesheet. These liabilities are:
■ Contingent liabilities■ Off-balance-sheet financing
Contingent Liabilities
Definition A contingent liability is a potential liability that will become an actual lia-bility only if some other event occurs first.
continued �
Potentially Hidden Liabilities
This contingent liability . . . . . . becomes an actual (recorded) liability if . . .
Product warranty the customer wants a defective item repaired or replaced.
IRS audit the IRS assesses a deficiency.
Activity impacting the environment environmental damage has occurred.
Potentially dangerous product damages are awarded or settlement is agreed.
Defendant in a lawsuit the lawsuit results in damages awarded or settlement agreed.
Issuance of coupons a customer uses coupons.
Guarantee a debt the borrower does not repay the debt.
Frequent-flier miles non-paying passengers replace paying passengers.
40 Essentials of Financial Statement Analysis
© 2008 Worthy and James Publishing. See front matter: Terms of Use.
Contingent Liabilities, continued
Contingent Liability Classifications
When you look at the list of examples, it becomes clear that not all the con-tingencies are equally likely to happen. For example, product warrantiesrequire some future expenditures and can be estimated from past experience.However, the outcome of a lawsuit is very unpredictable. GAAP classifiescontingent liabilities into three categories:
■ Probable
• The amount can be reasonably estimated: Accrue the expense and liability on the financial statements (use the estimate to debit an expense and credit a liability).
• The amount cannot be reasonably estimated: Disclose in footnotes.
■ Reasonably Possible: Disclose in footnotes.■ Remote: Depending on item, disclose in footnotes or no disclosure
required.
The items that are disclosed in footnotes will be recorded on financialstatements only if and when the contingency happens.
What Is the Potential Problem?
The classifications probable, reasonably possible, and remote are subjectivedescriptions. Only items in the probable category that can be reasonablyestimated such as warranty expenses or coupon expenses will show up asaccrued expenses on the financial statements.
But what should be done in the case of potential environmental damage orpotentially dangerous products? These items could be very large amountsfor some companies. Another example is airline frequent-flier miles, forwhich there is no consistent treatment.
Also, there is great variety in footnote disclosures. Sometimes disclosuresare clear and easy to understand. Sometimes they are vague or quite com-plex and difficult to interpret.
If an aggressive management can convince auditors that an item shouldnot appear on the financial statements or that disclosure should be vagueor even eliminated by classifying an item as remote, then a contingent lia-bility has the potential to result in a very unpleasant surprise. In a com-pany with a high quality of earnings, contingent liabilities are fully andobviously disclosed, and expense or loss provisions are recorded as neces-sary, based on a conservative management attitude.
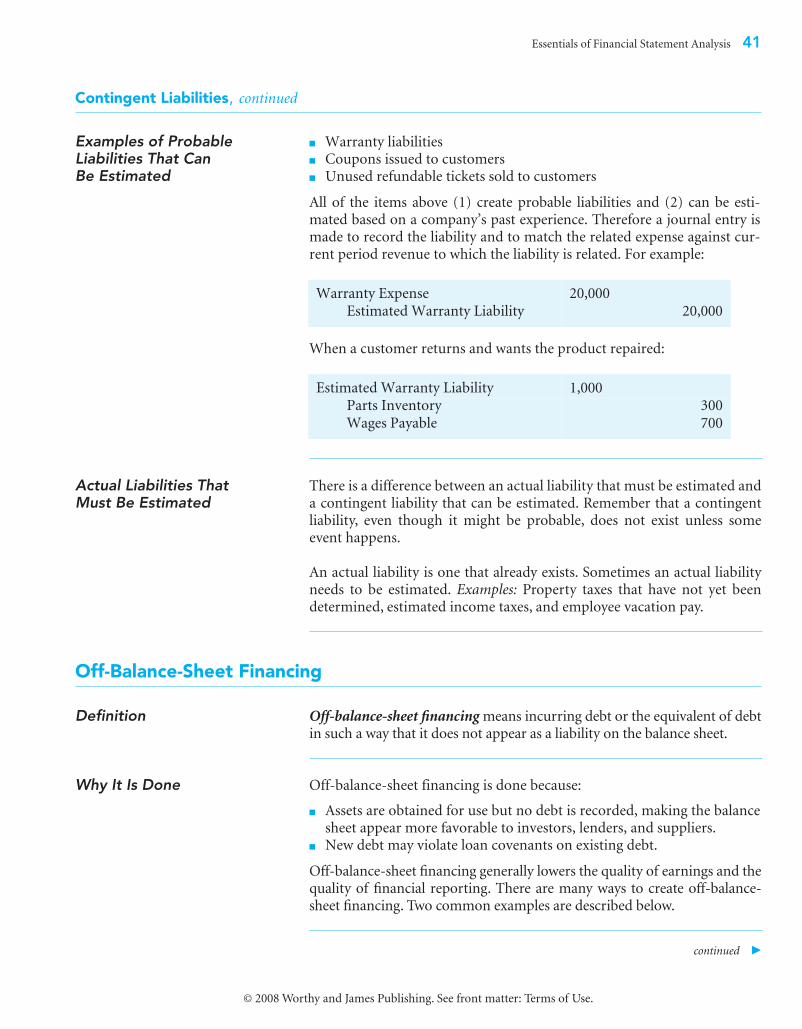
Essentials of Financial Statement Analysis 41
© 2008 Worthy and James Publishing. See front matter: Terms of Use.
Contingent Liabilities, continued
Examples of Probable Liabilities That Can Be Estimated
■ Warranty liabilities■ Coupons issued to customers■ Unused refundable tickets sold to customers
All of the items above (1) create probable liabilities and (2) can be esti-mated based on a company’s past experience. Therefore a journal entry ismade to record the liability and to match the related expense against cur-rent period revenue to which the liability is related. For example:
When a customer returns and wants the product repaired:
Actual Liabilities That Must Be Estimated
There is a difference between an actual liability that must be estimated anda contingent liability that can be estimated. Remember that a contingentliability, even though it might be probable, does not exist unless someevent happens.
An actual liability is one that already exists. Sometimes an actual liabilityneeds to be estimated. Examples: Property taxes that have not yet beendetermined, estimated income taxes, and employee vacation pay.
Off-Balance-Sheet Financing
Definition Off-balance-sheet financing means incurring debt or the equivalent of debtin such a way that it does not appear as a liability on the balance sheet.
Why It Is Done Off-balance-sheet financing is done because:
■ Assets are obtained for use but no debt is recorded, making the balancesheet appear more favorable to investors, lenders, and suppliers.
■ New debt may violate loan covenants on existing debt.
Off-balance-sheet financing generally lowers the quality of earnings and thequality of financial reporting. There are many ways to create off-balance-sheet financing. Two common examples are described below.
continued �
Warranty Expense 20,000 Estimated Warranty Liability 20,000
Estimated Warranty Liability 1,000 Parts Inventory 300Wages Payable 700
42 Essentials of Financial Statement Analysis
© 2008 Worthy and James Publishing. See front matter: Terms of Use.
Off-Balance-Sheet Financing, continued
Example 1: Leases A company acquires a long-term asset, but instead of buying the asset bypaying cash or signing a loan agreement, the company signs a long-termlease. Because a lease is a rental agreement, no debt (and no asset) isrecorded. By keeping the new asset and the new debt off the balance sheet,the company’s debt ratio does not increase. This makes the companyappear stronger.
GAAP response: This kind of lease is characterized as a capital lease andrequires the lessee (the entity using the asset) to record the leased item asan asset and to record debt on the balance sheet for a calculated value ofthe total lease payments. However, this requirement is based on a four-part test. If the answer is “yes” to any of the following items, the arrange-ment is a capital lease:
1. Does the lease transfer ownership to the lessee?2. Is there an option to purchase the asset at a bargain (unusually low)
price?3. Is the lease term at least 75% of the asset’s useful life?4. Does the present value (a calculated value) of payments exceed 90% of
the asset’s initial value?
GAAP weakness: Because the numerical amounts of the test are not reallyvery demanding, it is extremely easy to manipulate a lease agreement intoa normal (operating) lease (rather than a capital lease) that keeps the lia-bility for future payments off the balance sheet. As one example, the leaseterm could be set at 74.9% of the asset life. At the present time, many mil-lions of dollars of future lease payment obligations disappear from balancesheets because of lease manipulation. As well, ratios such as the debt ratiobecome unusable. Required footnote disclosures are often obscure anddifficult to interpret.
This is another example of a problem created when GAAP permits the useof “flexible” alternatives, although here “flexibility” is not the result of directalternatives but rather the use of two not very demanding rules that createan opportunity for manipulation.
Essentials of Financial Statement Analysis 43
© 2008 Worthy and James Publishing. See front matter: Terms of Use.
Off-Balance-Sheet Financing, continued
Example 2: Variable Interest Entities
If a company wants to finance and operate a specific activity, the companyis able keep the activity’s related debt off its balance sheet by creating anew entity (a corporation, partnership, etc.) with a very small investmentof its own money. Other investors may also be involved. The new entity isfinanced mostly by debt, while the company creating the entity directly orindirectly guarantees up to 50% of the debt repayment (and may share upto the same percentage profits). The assets of the new entity are also usedas security for the debt. This type of high-debt entity is called a “variableinterest entity” (V.I.E.) because the company creating it has an “interest”in the entity that varies, depending upon the amount of the gains or lossesthat it shares, while maintaining a very small equity investment. Essen-tially, the company that creates the V.I.E. is using a combination of itsgood credit plus the V.I.E. assets to create the V.I.E.
For example, Enron engaged in many activities that were very speculative,risky, and used primarily debt financing. Enron formed numerous part-nerships with highly leveraged debt to operate and finance these activitiesoff-balance sheet while earning fees for managing the partnerships, plussharing in some potential profits (which usually never happened). Eventu-ally the partnerships failed and Enron could not fulfill its guarantees to theV.I.E. lenders.
Large banks and investment companies such as Citigroup, Bear Stearns,and Merrill Lynch provide another example. These companies madeinvestments that included high yielding but very risky (called “sub-prime”) adjustable rate long-term mortgages. A company would create aV.I.E. and sell the investments to the V.I.E. This turned the long-terminvestments back into cash; also, the company received substantial fees.In many of these cases, the V.I.E. was entirely financed by short-term debt(6 months or less) and wealthy investors, with no investment or guaranteeby the bank or investment company. However, the reputation of the com-pany creating the V.I.E. implied that it would make sure that the lenderswould not lose money.
The investors and lenders were happy as long at they continued to receivepayments from the mortgages; however, a ‘perfect storm’ soon appearedthat changed everything. At about the same time, real estate valuesseverely declined and the interest rates on the mortgage loans started toadjust up. Many homeowners lost or abandoned their homes. Soon, thepayments decreased, losses were incurred, lenders became frightened, andthe short-term financing became impossible to renew. Even in cases wherethey had made no contractual guarantees, the implicit guarantees andimportance of financial reputation were so essential to the banks andinvestment companies that they incurred huge losses in order to pay offthe V.I.E. lenders (but not the investors).
44 Essentials of Financial Statement Analysis
© 2008 Worthy and James Publishing. See front matter: Terms of Use.
The Nature of the Surprises
Overview If you are an outsider and a stakeholder in a business, you are going to besubject to many different kinds of financial risks. Many of these risks are ofthe kind that can be spotted by using the tools that we have discussed so far.Discovering other operating risks such as poor earnings quality mayrequire more accounting training and especially keen observation of thefinancial statements and footnote disclosures. So far, so good—but unfor-tunately, these do not come close to covering all the dangerous possibilities.
Where They Appear The subject of financial risk is huge; we cannot even begin to describe allthe possibilities here. However, what we can still do is have some idea of thegeneral direction that risks will be coming from, and this can be useful. Ofcourse, what we are most concerned with are not small losses or the losseswe can see coming. What we are most worried about are those big lossesthat take us by surprise. (Big unexpected surprises are sometimes called“Black Swans”. A very useful, entertaining, and best-selling book on thissubject is The Black Swan by Nassim Taleb.) So where do we direct ourwatchful eyes? We return to balance sheet: we are concerned with suddendecreases in assets or surprise increases in liabilities.
As you know, the owner’s claim (Owner’s Equity) on the wealth of abusiness is calculated by the basic accounting equation of A = L + OE. Youcan see from this simple equation that a net decrease in assets (A) or netincrease in liabilities (L) will make owner’s equity decrease.
Note: A material decrease in an asset value that is not recoverable iscalled impairment. The word is usually used in connection with long-term tangible assets, but may by used to describe any unrecoverableasset value loss. Accountants measure and record impairment losses onfinancial statements, but by the time this happens, the damage hasalready been done.
Big, Bad, and Sudden Surprises
Essentials of Financial Statement Analysis
45
© 2008 Worthy and James Publishing. See front matter: Terms of Use.
Sudden Asset Decreases
Know Your Assets
When you look at a balance sheet, do you understand the assets? “Under-standing assets” means two key things: 1. Do you know what the assetsare? 2. Do you understand how the assets are valued?
When you can answer these two questions, you will have a general sense ofhow quickly the assets could change value, the subjectivity of their valuesthat appear on the balance sheet, and their utility to the business. Themore that you learn about the asset types the better “feel” for them youwill develop.
In general, physical assets are usually easier to understand and value thanintangible assets and financial assets. For example, it would probably beeasier to understand and to estimate likely values for a truck and somemerchandise inventory than for a retained interest in a securitized loan orfor an exotic financial market derivative. Especially when complex assets
are a substantial portion of total assets, we need to be extra careful.
Look at the Notes
Look at the disclosure in notes to the financial statements in either theannual report or the SEC reports (10-Q or 10-K) that discuss the assets. Ifyou can understand the notes and understand what they say about valua-tion, then you are reducing your possible surprises. What do you thinkabout this actual example:
“The market for MSRs (Mortgage Loan Servicing Rights) is not sufficiently liquid to pro-vide participants with quoted market prices. Therefore, the Company uses an option-adjusted spread valuation approach to determine the fair value of MSRs. This approachconsists of projecting servicing cash flows under multiple interest rate scenarios, and dis-counting these cash flows using risk adjusted discount rates. The key assumptions used inthe valuation of MSRs include mortgage prepayment speeds and discount rates. Themodel assumptions and the MSRs’ fair value estimates are compared to observable trades ofsimilar MSR portfolios and interest-only security portfolios, as well as to MSR broker val-uations and industry surveys. The cash flow model and underlying prepayment and inter-est rate models used to value these MSRs are subject to validation in accordance with theCompany’s model validation policies. Refer to key assumptions at June 30, 2007 on page 65for the key assumptions used in the MSR valuation process.” (Citigroup June 30, 2007 10-Q)
Do you understand what these assets are, the reliability of the value measure-ment, and what could happen to the values? The more complex the assetsare, probably the more complex the business operations are. Remember theinvestment method of the famous investor Warren Buffet (who is one of therichest men in the world). He repeatedly states that if he does not completelyunderstand a company, he will not invest in it. This is a good basic principle
for all kinds of stakeholders.
46
Essentials of Financial Statement Analysis
© 2008 Worthy and James Publishing. See front matter: Terms of Use.
Sudden Liability Increases
Overview
If you think that analyzing assets can be difficult, then predicting unforeseenliabilities is almost off the scale! This is where real surprises can happen.
Nevertheless a thoughtful analysis can still provide benefits.
Contingent Liabilities
Review the contingent liabilities. Take a careful look at the notes that relateto the contingent liabilities. Regardless of what assurances the notes mightprovide, what events could increase the contingent liabilities that areshown on the balance sheet or create new liabilities from possible events
that are described in the notes?
Look at the Notes
Just as with the assets, read the notes that relate to the liabilities. Do youunderstand the liabilities that are recorded on the balance sheet and theirdescriptions on the footnotes? Do you understand how amounts couldincrease? Here is another actual example:
“The Company may provide various products and services to the VIEs. It may provideliquidity facilities, may be a party to derivative contracts with VIEs, may provide lossenhancement in the form of letters of credit and other guarantees to the VIEs, may be theinvestment manager, and may also have an ownership interest or other investment in certainVIEs. In general, the investors in the obligations of consolidated VIEs have recourse onlyto the assets of the VIEs and do not have recourse to the Company, except where theCompany has provided a guarantee to the investors or is the counterparty to a derivativetransaction involving the VIE. In addition to the VIEs that are consolidated in accordancewith FIN 46-R, the Company has significant variable interests in certain other VIEs thatare not consolidated because the Company is not the primary beneficiary. These includemulti-seller finance companies, collateralized debt obligations (CDOs), structured financetransactions, and numerous investment funds. In addition to these VIEs, the Companyissues preferred securities to third party investors through trust vehicles as a source offunding and regulatory capital, which were deconsolidated during the 2004 first quarter.The Company’s liabilities to the deconsolidated trust are included in long-term debt.”(Citigroup 10Q June 30, 2007)
This complexity should make us all think twice.
Assurances
In general, of course, one should always be cautious about assurances inthe financial statements notes such as “…maximum losses are unlikely…”;this is particularly true when financial instruments and entities are com-
plex and not easily understood.
Essentials of Financial Statement Analysis 47
© 2008 Worthy and James Publishing. See front matter: Terms of Use.
Sudden Liability Increases, continued
What Kind of Activities?
Review the nature of the business activities. For example, some activitiesmay be inherently more prone to lawsuits, such as selling prescriptiondrugs or selling tobacco products. Potential liabilities for some activitiescan be very difficult to predict. For example, the note above indicates thatin general investors in the consolidated V.I.E. debt had access only to V.I.E.assets and not to the Company creating the V.I.E. However, as we discussedin the previous section about V.I.E.s, despite the fact that when there wereno loan guarantees to V.I.E. lenders, in many cases major losses were stillincurred in order to pay off the lenders simply to preserve a company’sgood name and credit standing.
Other Issues
Fraud When people think of sudden, negative financial surprises, what oftencomes to mind is fraud. Fraudulent financial reporting is sometimesdetectable by financial statement analysis. Auditors, of course, performtests that can detect fraudulent activities. However, sometimes fraud canbe difficult to detect and may persist until its cumulative negative effect issuddenly revealed. Often just the rumor or possibility of fraud is enoughto significantly impact both credit availability and investment values. Thedecrease in asset values or sudden appearance of new liabilities can be dev-astating, but at this point a stakeholder will have few, if any, good options.
Direct Equity Events That Affect Investor Stakeholders
Apart from an awareness of possible sudden changes in assets and liabilities,a person who is an investor stakeholder also needs to be concerned aboutevents that can directly and negatively affect the market value of invest-ments. These can include items such as surprise news events of variouskinds, the issuance of new stock and stock options and the creation ofother kinds of equity dilution, changes in debt ratings, and changes inmanagement. As well, various kinds of operational issues can affect equityvalue both by decreased earnings and market valuation losses. These arethe kinds of issues that relate most directly to equity investors.
48 Essentials of Financial Statement Analysis
© 2008 Worthy and James Publishing. See front matter: Terms of Use.
Financial Statement Usefulness
GAAP Does Matter GAAP is important. GAAP provides the essential standards for maintain-ing the integrity of accounting information and financial reporting.Therefore, you should not conclude from our discussion that GAAP doesnot matter. On the contrary, GAAP is the best means presently availablefor communicating accounting information.
High Earnings Quality Is Not Assured
However, the very flexibility and complexity of GAAP that is intended toencourage accurate reporting enables companies to manipulate and biasthe results of financial statements, creating the definite possibility of lowquality of earnings. Because estimates often must be used, and becausealternative methods are frequently permitted for measuring particularkinds of transactions, the meaning of financial statements can becomesubjective. The qualities of usefulness and relevance can be easily com-promised.
Therefore, you should retain your skepticism even when you are usingGAAP-based, audited financial statements. This advice is reinforced by thefact that many investment professionals no longer attribute major impor-tance to GAAP net income or even income from continuing operations,but instead they prefer to base much of their analysis on the statement ofcash flows, particularly operating cash flows, which are much less subjectto manipulation. This is a rather sad commentary, considering the greatefforts that have gone into developing the GAAP that measures andreports income. Nevertheless, given human nature, you should concludethat GAAP cannot be relied upon to assure high quality of earnings.
Conclusions
Essentials of Financial Statement Analysis 49
© 2008 Worthy and James Publishing. See front matter: Terms of Use.
The Public Response
Sarbanes-Oxley In 2002, Congress created the Sarbanes-Oxley Act. Sarbanes-Oxley wasa response to the ever-increasing investor distrust of public companyfinancial reporting and to the concerns that unreliable reporting woulddamage the American capital markets.
This distrust was later vindicated by securities and accounting fraudcharges filed against numerous large public companies such as Adelphia,Health South, Sunbeam, WorldCom, Global Crossing, and Enron, all ofwhich had published audited financial statements that aggressivelyreported inflated earnings and gave little or no indication of seriousfinancial problems. The “last straw” was the sudden collapse and bank-ruptcy of Enron and then WorldCom, which was the largest bankruptcyever filed. These two financial shocks were quickly followed by the licenserevocation and collapse of the auditor involved with both businesses,Arthur Andersen Company.
The cumulative effect of all these events was a public outcry that theaccounting profession had become unable to adequately regulate itsauditors because of the conflict of interest created by the large audit andconsulting fees received from the clients being audited. The result wasSarbanes-Oxley.
The Sarbanes-Oxley law applies generally to publicly traded companiesand has the following broad objectives:
■ Reporting: Make financial reporting fair, understandable, and independent.
■ Auditing and internal control: Enforce and improve auditing stan-dards and internal control analysis by CPA firms. Significantlyimprove internal control procedures used by the reporting companies.
■ Corporate responsibility: Require personal accountability by top exec-utives (chief executive officer and chief financial officer) for what isreported on financial statements of their companies. Corporate auditcommittees cannot be part of management and must have member-ship on the board of directors.
■ Penalties: Enact severe criminal and civil penalties for top executives,board members, and auditors who knowingly act or fail to act in waysthat cause shareholders and other stakeholders to be defrauded.
50 Essentials of Financial Statement Analysis
© 2008 Worthy and James Publishing. See front matter: Terms of Use.
The Public Response, continued
The Public Company Accounting Oversight Board (PCAOB)
A potentially very significant development for improving the quality ofearnings for public companies is the Public Company Accounting Over-sight Board (PCAOB). The PCAOB is a private-sector, non-profit organi-zation that was created by the Sarbanes-Oxley Act.
The main purpose of the PCAOB is to assure the implementation of twoof the Sarbanes-Oxley goals:
■ Make financial reporting fair, understandable, and independent.■ Enforce and improve high-quality auditing and internal control standards.
The Sarbanes-Oxley Act removed the final authority over audit and inter-nal control standards and enforcement from the public accounting profes-sion and placed this authority under the control of the PCAOB for allpublicly traded companies.
The PCAOB makes proposals for auditing and reporting rule changes andsubmits these proposals to the Securities and Exchange Commission. Inturn, the Commission must approve each proposal for it to become effec-tive as a PCAOB rule. The PCAOB rules serve to implement existingGAAP and to create improved auditing, internal control, and reportingstandards and, hopefully, to improve the quality of earnings.
To perform audits of public companies, CPA firms must register with thePCAOB. The PCAOB has broad investigative and disciplinary authorityover these CPA firms. The PCAOB actively investigates potential viola-tions and solicits information and complaints about potential violations.
The Future? GAAP is always evolving and responding to the economic, social, andpolitical environment. For example, the accounting profession continuesto clarify the objectives of the conceptual framework of accounting GAAPis also being integrated with international accounting standards. Perhapsin the future, a consensus may develop that the many rules attemptinganalytical precision have exceeded limits beyond which the unintendedresults of complexity and manipulation cancel out any subtle measure-ment benefits.
Perhaps the concept of single reasonable point of reference might beacknowledged as often more useful to stakeholders than current “flexibility”and the “selective accuracy” that are often the result. And for quality of earn-ings, hopefully the PCAOB oversight will result in continuing improvement.
However, you can at least be certain of this: In the financial world, regard-less of where your future leads, a good understanding of accounting willalways serve you very well.
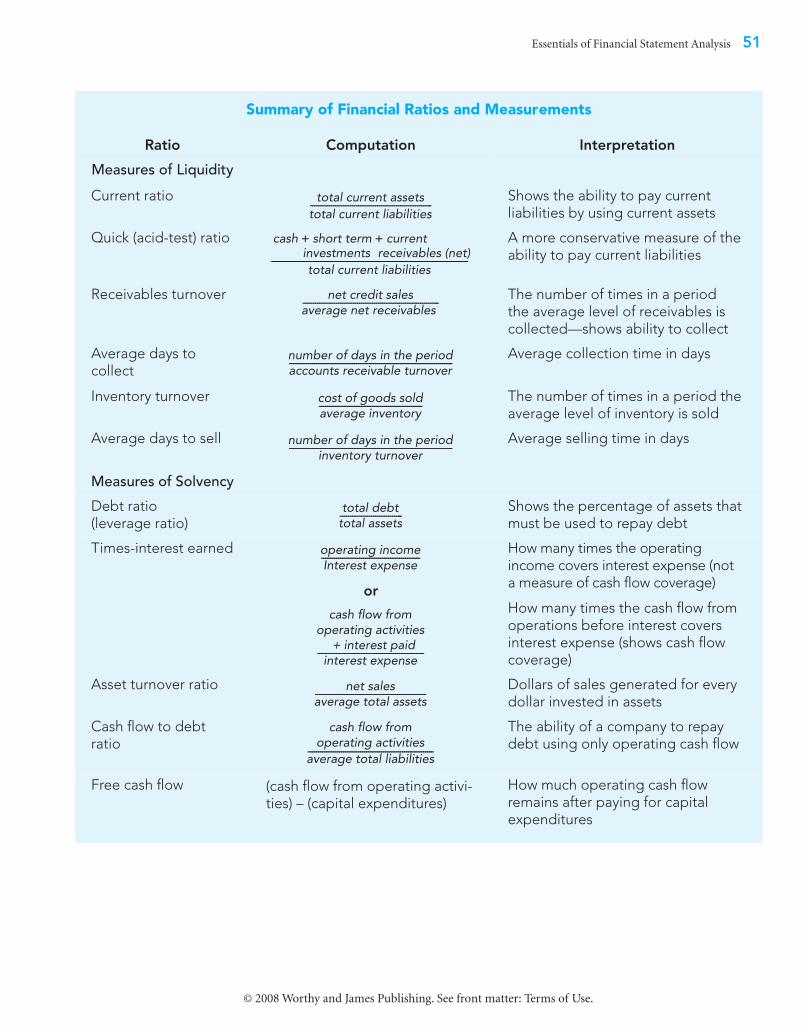
Essentials of Financial Statement Analysis 51
© 2008 Worthy and James Publishing. See front matter: Terms of Use.
Summary of Financial Ratios and Measurements
Ratio Computation Interpretation
Measures of Liquidity
Current ratio Shows the ability to pay current liabilities by using current assets
Quick (acid-test) ratio A more conservative measure of the ability to pay current liabilities
Receivables turnover The number of times in a period the average level of receivables is collected—shows ability to collect
Average days to collect
Average collection time in days
Inventory turnover The number of times in a period the average level of inventory is sold
Average days to sell Average selling time in days
Measures of Solvency
Debt ratio(leverage ratio)
Shows the percentage of assets that must be used to repay debt
Times-interest earned
or
How many times the operating income covers interest expense (not a measure of cash flow coverage)
How many times the cash flow from operations before interest covers interest expense (shows cash flow coverage)
Asset turnover ratio Dollars of sales generated for every dollar invested in assets
Cash flow to debt ratio
The ability of a company to repay debt using only operating cash flow
Free cash flow (cash flow from operating activi-ties) – (capital expenditures)
How much operating cash flow remains after paying for capital expenditures
total current assetstotal current liabilities----------------------------------------------------------
cash short term current+ +investments receivables (net)total current liabilities
----------------------------------------------------------------------------------------------
net credit salesaverage net receivables -----------------------------------------------------------------
number of days in the periodaccounts receivable turnover------------------------------------------------------------------------------
cost of goods soldaverage inventory-------------------------------------------------
number of days in the periodinventory turnover
------------------------------------------------------------------------------
total debttotal assets------------------------------
operating incomeInterest expense-----------------------------------------------
cash flow fromoperating activities
interest paid+interest expense
---------------------------------------------------
net salesaverage total assets-----------------------------------------------------
cash flow fromoperating activities
average total liabilities------------------------------------------------------------
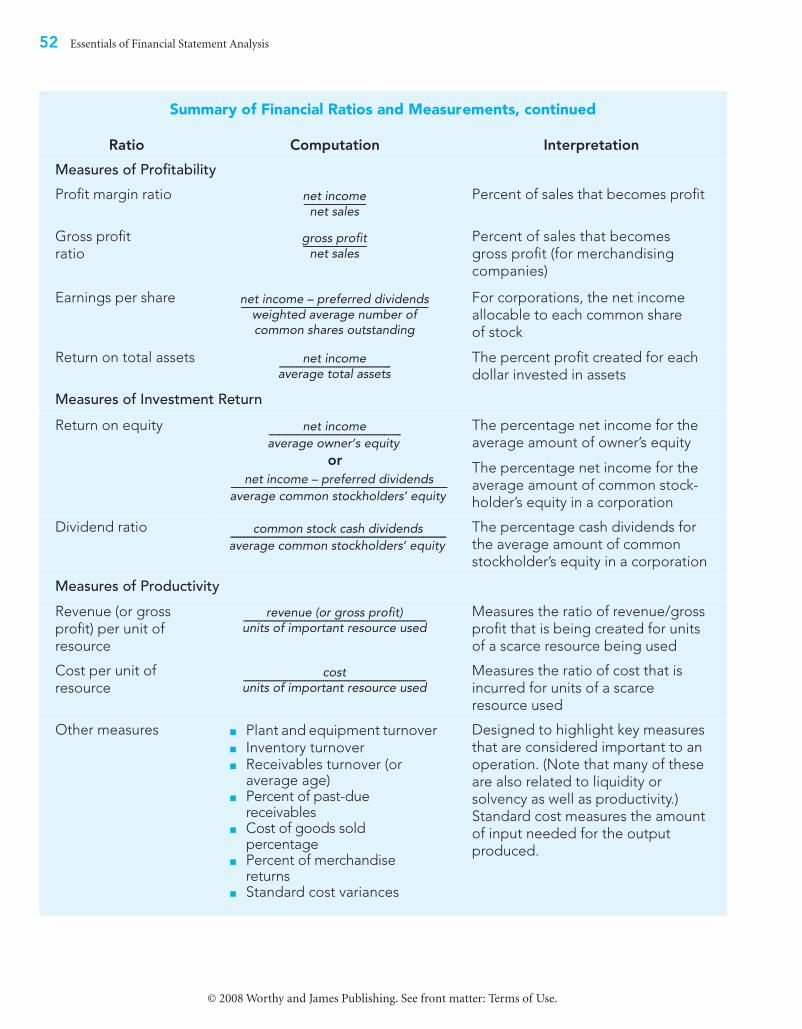
52 Essentials of Financial Statement Analysis
© 2008 Worthy and James Publishing. See front matter: Terms of Use.
Summary of Financial Ratios and Measurements, continued
Ratio Computation Interpretation
Measures of Profitability
Profit margin ratio Percent of sales that becomes profit
Gross profit ratio
Percent of sales that becomes gross profit (for merchandising companies)
Earnings per share For corporations, the net income allocable to each common share of stock
Return on total assets The percent profit created for each dollar invested in assets
Measures of Investment Return
Return on equity
or
The percentage net income for the average amount of owner’s equity
The percentage net income for the average amount of common stock-holder’s equity in a corporation
Dividend ratio The percentage cash dividends for the average amount of common stockholder’s equity in a corporation
Measures of Productivity
Revenue (or gross profit) per unit of resource
Measures the ratio of revenue/gross profit that is being created for units of a scarce resource being used
Cost per unit of resource
Measures the ratio of cost that is incurred for units of a scarce resource used
Other measures ■ Plant and equipment turnover ■ Inventory turnover ■ Receivables turnover (or
average age)■ Percent of past-due
receivables■ Cost of goods sold
percentage■ Percent of merchandise
returns■ Standard cost variances
Designed to highlight key measures that are considered important to an operation. (Note that many of these are also related to liquidity or solvency as well as productivity.) Standard cost measures the amount of input needed for the output produced.
net incomenet sales
------------------------------
gross profitnet sales
------------------------------
net income – preferred dividendsweighted average number ofcommon shares outstanding
-----------------------------------------------------------------------------------------
net incomeaverage total assets-----------------------------------------------------
net incomeaverage owner
,s equity
---------------------------------------------------------------
net income – preferred dividendsaverage common stockholders
, equity
-------------------------------------------------------------------------------------------------------
common stock cash dividendsaverage common stockholders
, equity
-------------------------------------------------------------------------------------------------------
revenue (or gross profit)units of important resource used---------------------------------------------------------------------------------------
costunits of important resource used---------------------------------------------------------------------------------------
Essentials of Financial Statement Analysis 53
© 2008 Worthy and James Publishing. See front matter: Terms of Use.
QUICK REVIEW
■ The essential financial statements are the balance sheet, income statement, statement of owner’s (or partners’ or stockholders’) equity, and the statement of cash flows. The balance sheet shows financial condition as wealth and claims on wealth. The income statement shows changes in owner’s equity that result from operations, the statement of owner’s equity shows all changes in owner’s equity, and the statement of cash flows explains the change in the cash balance as operating activities, investing activities, and financing activities.
■ Horizontal analysis compares amounts over a selected time period to a reference base amount at the beginning the time period. Vertical analysis is a comparison of amounts within a financial statement to a designated amount in the statement. Vertical and horizontal analysis can be combined.
■ Ratio analysis analyzes important financial relationships by use of a ratio, which is the comparison of one number to another, usually displayed as a fraction. Ratio analysis focuses on the elements of liquidity, solvency, profit-ability, investment return, and productivity. These ratios are summarized on pages 882 and 883.
■ Analyzing a business as an outsider always requires skepticism and caution. Careful analysis of 10-K (annual financial statements), 10-Q (quarterly financial statements), and 8-K (significant event) reports filed with the SEC (Securities and Exchange Commission), of annual reports, and of conference calls is essential. All of these resources are available on the Internet.
■ Quality of earnings affects the usefulness of financial reports and can be impaired by both revenue and expense management. Off-balance-sheet financing understates total obligations and makes a company’s financial condition appear more secure and favorable.
■ The Sarbanes-Oxley Act of 2002 was a response to increasing distrust of financial reporting by publicly traded companies. The purpose of the act is to: (1) improve the reliability and quality of financial reporting, (2) improve auditing standards and internal control, (3) increase corporate responsibility, and (4) impose significant penalties for violations. The Public Company Accounting Oversight Board (PCAOB) was created by Sarbanes-Oxley to implement the first two goals of the act.
54 Essentials of Financial Statement Analysis
© 2008 Worthy and James Publishing. See front matter: Terms of Use.
VOCABULARY
Benchmark: a norm or guideline used for the purpose of comparison
Capital lease: a financed asset purchase disguised as a long-term lease
Common-size financial statement: a financial statement shown in percentages
Contingent liability: a potential liability that will become an actual liability only if some other event occurs first
Debt covenants: requirements and restrictions imposed by lenders
Earnings management: the use of GAAP to manipulate reported income
EBITDA: Earnings Before Interest, Taxes, Depreciation, and Amortization
Financial leverage: the use of debt
Free cash flow: cash flow from operating activities minus capital expenditures
Horizontal analysis: comparing financial statement information over time
Impairment: an unrecoverable decrease in asset value
Liquidity: the ability to pay current liabilities as they become due
Liquid assets: assets quickly convertible into cash
Market share: a company’s sales as a percentage of total sales for all companies in the same industry or type of business
MD&A: Management discussion and analysis
Off-balance-sheet financing: incurring debt in such a way that it does not appear as a liability on the balance sheet
Operating cycle: the time required to convert inventory back into cash
PCAOB: the Public Company Accounting Oversight Board
Price earnings ratio: stock price per share divided by earnings per share; used by investors in the stock of publicly traded companies to gauge relative value of a stock
Productivity: the level of efficiency at which a business operates
Publicly traded: stock that can be bought and sold on stock exchanges
Quality of earnings: an evaluation as to whether the reported income accurately represents the true change in wealth and the recurring nature of business operations
Quick assets: highly liquid assets (cash, short-term investments, and net short-term receivables) used to calculate the quick ratio
Sarbanes-Oxley: a federal law that controls auditing standards for publicly traded companies and imposes personal liability on the top executives of such companies for the reliability of financial statements
Solvency: the ability to remain in business for a long period of time
Trading on equity: the effect on return on equity when a business incurs debt
Vertical analysis: comparing financial statement information within a statement
Working capital: current assets minus current liabilities
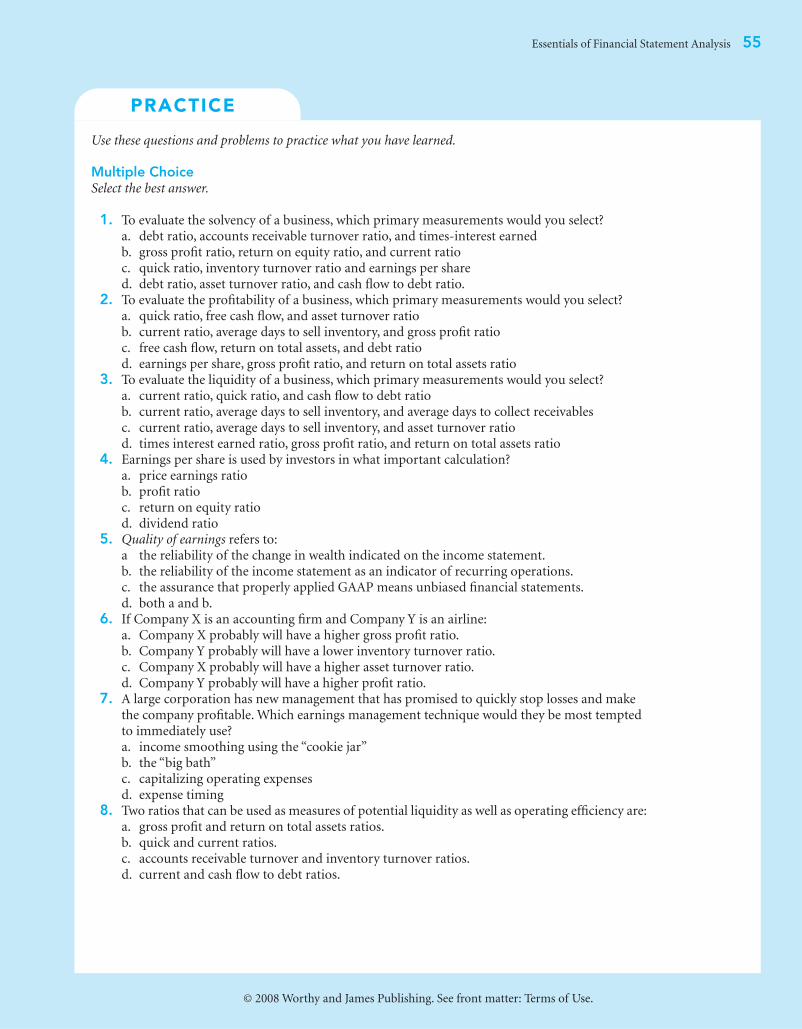
PRACTICE
Essentials of Financial Statement Analysis 55
© 2008 Worthy and James Publishing. See front matter: Terms of Use.
Use these questions and problems to practice what you have learned.
Multiple ChoiceSelect the best answer.
1. To evaluate the solvency of a business, which primary measurements would you select? a. debt ratio, accounts receivable turnover ratio, and times-interest earnedb. gross profit ratio, return on equity ratio, and current ratioc. quick ratio, inventory turnover ratio and earnings per shared. debt ratio, asset turnover ratio, and cash flow to debt ratio.
2. To evaluate the profitability of a business, which primary measurements would you select?a. quick ratio, free cash flow, and asset turnover ratiob. current ratio, average days to sell inventory, and gross profit ratioc. free cash flow, return on total assets, and debt ratiod. earnings per share, gross profit ratio, and return on total assets ratio
3. To evaluate the liquidity of a business, which primary measurements would you select? a. current ratio, quick ratio, and cash flow to debt ratiob. current ratio, average days to sell inventory, and average days to collect receivablesc. current ratio, average days to sell inventory, and asset turnover ratiod. times interest earned ratio, gross profit ratio, and return on total assets ratio
4. Earnings per share is used by investors in what important calculation?a. price earnings ratiob. profit ratioc. return on equity ratiod. dividend ratio
5. Quality of earnings refers to: a the reliability of the change in wealth indicated on the income statement.b. the reliability of the income statement as an indicator of recurring operations.c. the assurance that properly applied GAAP means unbiased financial statements.d. both a and b.
6. If Company X is an accounting firm and Company Y is an airline:a. Company X probably will have a higher gross profit ratio.b. Company Y probably will have a lower inventory turnover ratio.c. Company X probably will have a higher asset turnover ratio.d. Company Y probably will have a higher profit ratio.
7. A large corporation has new management that has promised to quickly stop losses and make the company profitable. Which earnings management technique would they be most tempted to immediately use?a. income smoothing using the “cookie jar”b. the “big bath”c. capitalizing operating expensesd. expense timing
8. Two ratios that can be used as measures of potential liquidity as well as operating efficiency are: a. gross profit and return on total assets ratios.b. quick and current ratios.c. accounts receivable turnover and inventory turnover ratios.d. current and cash flow to debt ratios.
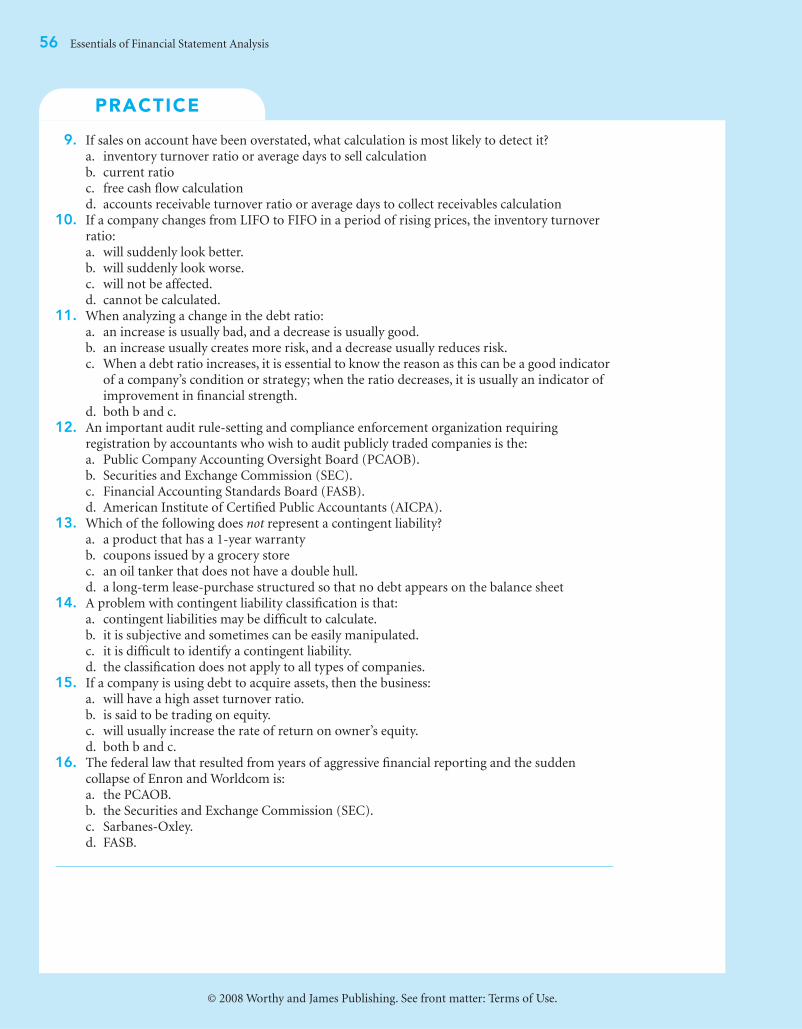
PRACTICE
56 Essentials of Financial Statement Analysis
© 2008 Worthy and James Publishing. See front matter: Terms of Use.
9. If sales on account have been overstated, what calculation is most likely to detect it?a. inventory turnover ratio or average days to sell calculationb. current ratioc. free cash flow calculationd. accounts receivable turnover ratio or average days to collect receivables calculation
10. If a company changes from LIFO to FIFO in a period of rising prices, the inventory turnover ratio:a. will suddenly look better.b. will suddenly look worse.c. will not be affected.d. cannot be calculated.
11. When analyzing a change in the debt ratio:a. an increase is usually bad, and a decrease is usually good.b. an increase usually creates more risk, and a decrease usually reduces risk. c. When a debt ratio increases, it is essential to know the reason as this can be a good indicator
of a company’s condition or strategy; when the ratio decreases, it is usually an indicator of improvement in financial strength.
d. both b and c.12. An important audit rule-setting and compliance enforcement organization requiring
registration by accountants who wish to audit publicly traded companies is the:a. Public Company Accounting Oversight Board (PCAOB).b. Securities and Exchange Commission (SEC).c. Financial Accounting Standards Board (FASB).d. American Institute of Certified Public Accountants (AICPA).
13. Which of the following does not represent a contingent liability?a. a product that has a 1-year warrantyb. coupons issued by a grocery storec. an oil tanker that does not have a double hull.d. a long-term lease-purchase structured so that no debt appears on the balance sheet
14. A problem with contingent liability classification is that:a. contingent liabilities may be difficult to calculate.b. it is subjective and sometimes can be easily manipulated.c. it is difficult to identify a contingent liability.d. the classification does not apply to all types of companies.
15. If a company is using debt to acquire assets, then the business:a. will have a high asset turnover ratio.b. is said to be trading on equity.c. will usually increase the rate of return on owner’s equity.d. both b and c.
16. The federal law that resulted from years of aggressive financial reporting and the sudden collapse of Enron and Worldcom is: a. the PCAOB.b. the Securities and Exchange Commission (SEC).c. Sarbanes-Oxley. d. FASB.
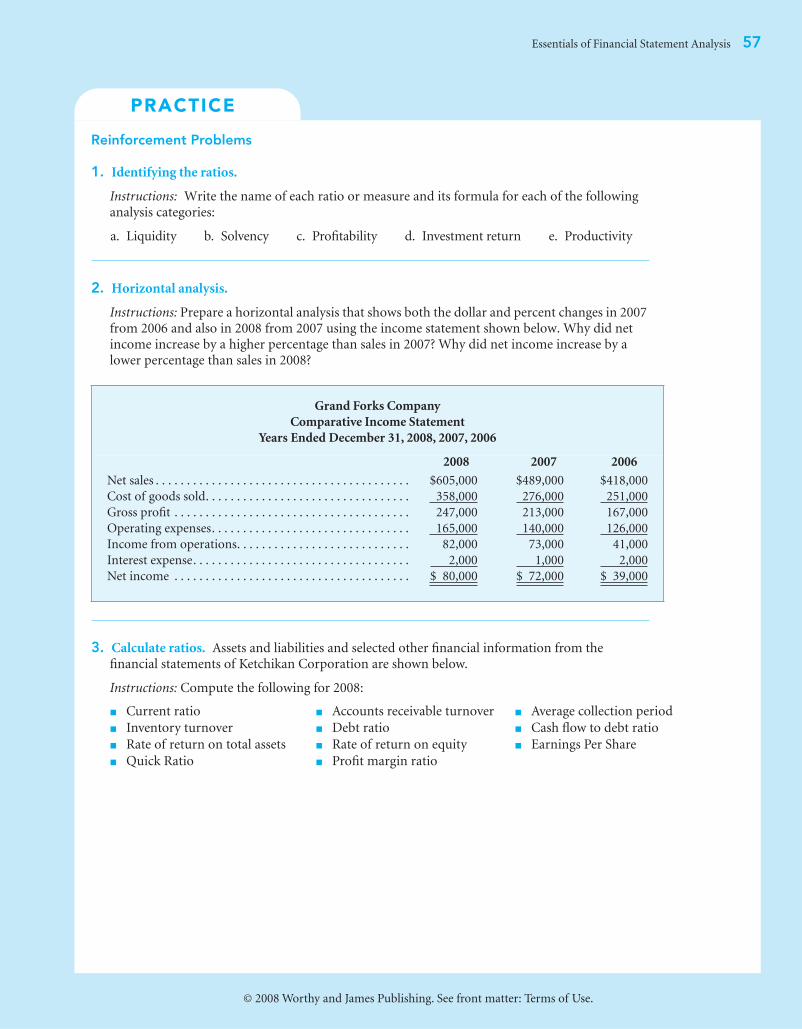
PRACTICE
Essentials of Financial Statement Analysis 57
© 2008 Worthy and James Publishing. See front matter: Terms of Use.
Reinforcement Problems
1. Identifying the ratios.
Instructions: Write the name of each ratio or measure and its formula for each of the following analysis categories:
a. Liquidity b. Solvency c. Profitability d. Investment return e. Productivity
2. Horizontal analysis.
Instructions: Prepare a horizontal analysis that shows both the dollar and percent changes in 2007 from 2006 and also in 2008 from 2007 using the income statement shown below. Why did net income increase by a higher percentage than sales in 2007? Why did net income increase by a lower percentage than sales in 2008?
3. Calculate ratios. Assets and liabilities and selected other financial information from the financial statements of Ketchikan Corporation are shown below.
Instructions: Compute the following for 2008:
Grand Forks Company
Comparative Income Statement
Years Ended December 31, 2008, 2007, 2006
2008 2007 2006
Net sales . . . . . . . . . . . . . . . . . . . . . . . . . . . . . . . . . . . . . . . . . $605,000 $489,000 $418,000
Cost of goods sold. . . . . . . . . . . . . . . . . . . . . . . . . . . . . . . . . 358,000 276,000 251,000
Gross profit . . . . . . . . . . . . . . . . . . . . . . . . . . . . . . . . . . . . . . 247,000 213,000 167,000
Operating expenses. . . . . . . . . . . . . . . . . . . . . . . . . . . . . . . . 165,000 140,000 126,000
Income from operations. . . . . . . . . . . . . . . . . . . . . . . . . . . . 82,000 73,000 41,000
Interest expense. . . . . . . . . . . . . . . . . . . . . . . . . . . . . . . . . . . 2,000 1,000 2,000
Net income . . . . . . . . . . . . . . . . . . . . . . . . . . . . . . . . . . . . . . $ 80,000 $ 72,000 $ 39,000
■ Current ratio ■ Accounts receivable turnover ■ Average collection period
■ Inventory turnover ■ Debt ratio ■ Cash flow to debt ratio
■ Rate of return on total assets ■ Rate of return on equity ■ Earnings Per Share
■ Quick Ratio ■ Profit margin ratio
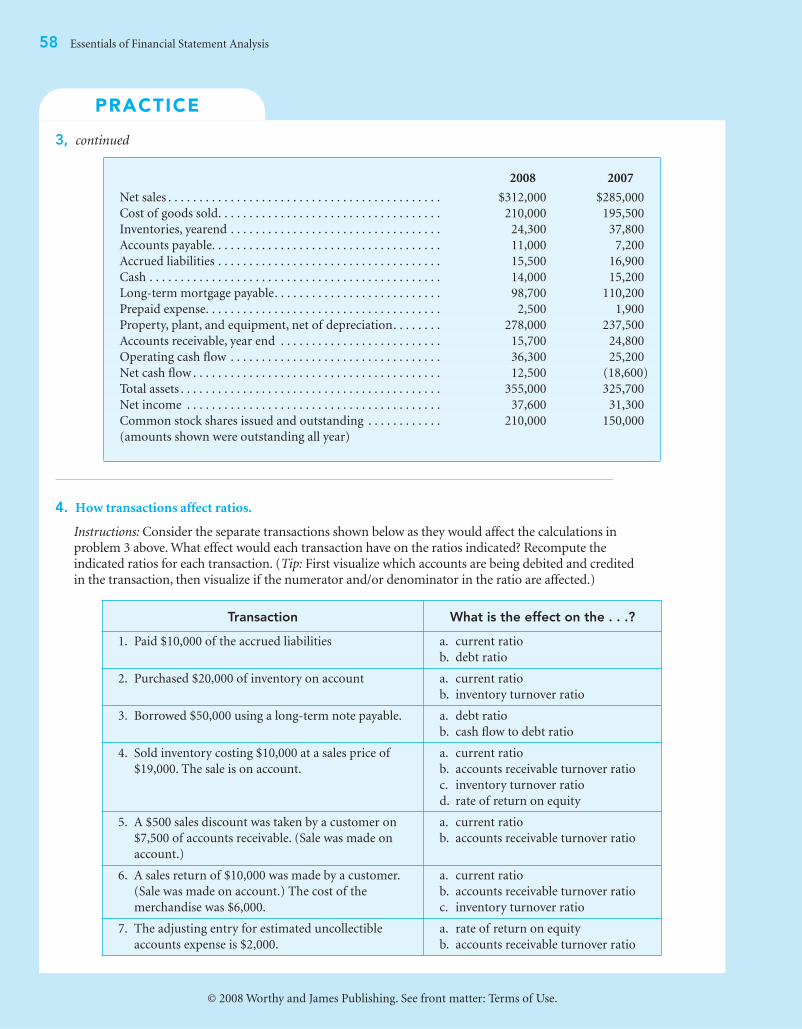
PRACTICE
58 Essentials of Financial Statement Analysis
© 2008 Worthy and James Publishing. See front matter: Terms of Use.
3, continued
4. How transactions affect ratios.
Instructions: Consider the separate transactions shown below as they would affect the calculations in problem 3 above. What effect would each transaction have on the ratios indicated? Recompute the indicated ratios for each transaction. (Tip: First visualize which accounts are being debited and credited in the transaction, then visualize if the numerator and/or denominator in the ratio are affected.)
2008 2007
Net sales . . . . . . . . . . . . . . . . . . . . . . . . . . . . . . . . . . . . . . . . . . . . $312,000 $285,000
Cost of goods sold. . . . . . . . . . . . . . . . . . . . . . . . . . . . . . . . . . . . 210,000 195,500
Inventories, yearend . . . . . . . . . . . . . . . . . . . . . . . . . . . . . . . . . . 24,300 37,800
Accounts payable. . . . . . . . . . . . . . . . . . . . . . . . . . . . . . . . . . . . . 11,000 7,200
Accrued liabilities . . . . . . . . . . . . . . . . . . . . . . . . . . . . . . . . . . . . 15,500 16,900
Cash . . . . . . . . . . . . . . . . . . . . . . . . . . . . . . . . . . . . . . . . . . . . . . . 14,000 15,200
Long-term mortgage payable. . . . . . . . . . . . . . . . . . . . . . . . . . . 98,700 110,200
Prepaid expense. . . . . . . . . . . . . . . . . . . . . . . . . . . . . . . . . . . . . . 2,500 1,900
Property, plant, and equipment, net of depreciation. . . . . . . . 278,000 237,500
Accounts receivable, year end . . . . . . . . . . . . . . . . . . . . . . . . . . 15,700 24,800
Operating cash flow . . . . . . . . . . . . . . . . . . . . . . . . . . . . . . . . . . 36,300 25,200
Net cash flow . . . . . . . . . . . . . . . . . . . . . . . . . . . . . . . . . . . . . . . . 12,500 (18,600)
Total assets . . . . . . . . . . . . . . . . . . . . . . . . . . . . . . . . . . . . . . . . . . 355,000 325,700
Net income . . . . . . . . . . . . . . . . . . . . . . . . . . . . . . . . . . . . . . . . . 37,600 31,300
Common stock shares issued and outstanding . . . . . . . . . . . .
(amounts shown were outstanding all year)
210,000 150,000
Transaction What is the effect on the . . .?
1. Paid $10,000 of the accrued liabilities a. current ratio
b. debt ratio
2. Purchased $20,000 of inventory on account a. current ratio
b. inventory turnover ratio
3. Borrowed $50,000 using a long-term note payable. a. debt ratio
b. cash flow to debt ratio
4. Sold inventory costing $10,000 at a sales price of
$19,000. The sale is on account.
a. current ratio
b. accounts receivable turnover ratio
c. inventory turnover ratio
d. rate of return on equity
5. A $500 sales discount was taken by a customer on
$7,500 of accounts receivable. (Sale was made on
account.)
a. current ratio
b. accounts receivable turnover ratio
6. A sales return of $10,000 was made by a customer.
(Sale was made on account.) The cost of the
merchandise was $6,000.
a. current ratio
b. accounts receivable turnover ratio
c. inventory turnover ratio
7. The adjusting entry for estimated uncollectible
accounts expense is $2,000.
a. rate of return on equity
b. accounts receivable turnover ratio
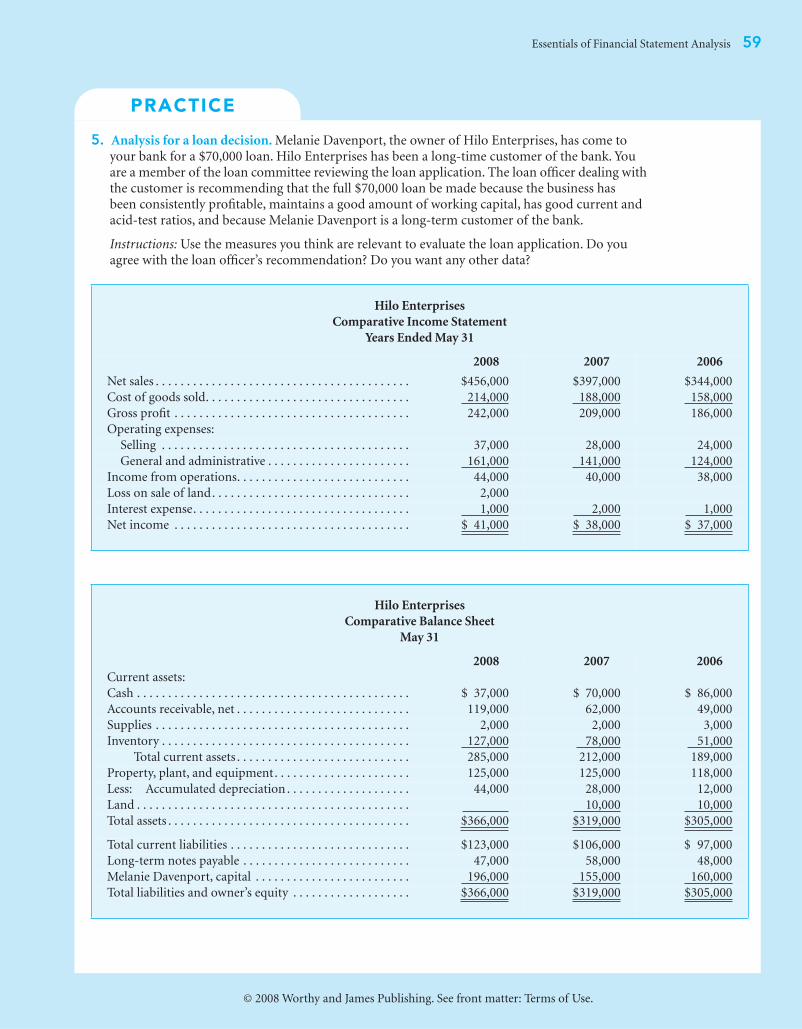
PRACTICE
Essentials of Financial Statement Analysis 59
© 2008 Worthy and James Publishing. See front matter: Terms of Use.
5. Analysis for a loan decision. Melanie Davenport, the owner of Hilo Enterprises, has come to your bank for a $70,000 loan. Hilo Enterprises has been a long-time customer of the bank. You are a member of the loan committee reviewing the loan application. The loan officer dealing with the customer is recommending that the full $70,000 loan be made because the business has been consistently profitable, maintains a good amount of working capital, has good current and acid-test ratios, and because Melanie Davenport is a long-term customer of the bank.
Instructions: Use the measures you think are relevant to evaluate the loan application. Do you agree with the loan officer’s recommendation? Do you want any other data?
Hilo Enterprises
Comparative Income Statement
Years Ended May 31
2008 2007 2006
Net sales . . . . . . . . . . . . . . . . . . . . . . . . . . . . . . . . . . . . . . . . . $456,000 $397,000 $344,000
Cost of goods sold. . . . . . . . . . . . . . . . . . . . . . . . . . . . . . . . . 214,000 188,000 158,000
Gross profit . . . . . . . . . . . . . . . . . . . . . . . . . . . . . . . . . . . . . . 242,000 209,000 186,000
Operating expenses:
Selling . . . . . . . . . . . . . . . . . . . . . . . . . . . . . . . . . . . . . . . . 37,000 28,000 24,000
General and administrative . . . . . . . . . . . . . . . . . . . . . . . 161,000 141,000 124,000
Income from operations. . . . . . . . . . . . . . . . . . . . . . . . . . . . 44,000 40,000 38,000
Loss on sale of land. . . . . . . . . . . . . . . . . . . . . . . . . . . . . . . . 2,000
Interest expense. . . . . . . . . . . . . . . . . . . . . . . . . . . . . . . . . . . 1,000 2,000 1,000
Net income . . . . . . . . . . . . . . . . . . . . . . . . . . . . . . . . . . . . . . $ 41,000 $ 38,000 $ 37,000
Hilo Enterprises
Comparative Balance Sheet
May 31
2008 2007 2006
Current assets:
Cash . . . . . . . . . . . . . . . . . . . . . . . . . . . . . . . . . . . . . . . . . . . . $ 37,000 $ 70,000 $ 86,000
Accounts receivable, net . . . . . . . . . . . . . . . . . . . . . . . . . . . . 119,000 62,000 49,000
Supplies . . . . . . . . . . . . . . . . . . . . . . . . . . . . . . . . . . . . . . . . . 2,000 2,000 3,000
Inventory . . . . . . . . . . . . . . . . . . . . . . . . . . . . . . . . . . . . . . . . 127,000 78,000 51,000
Total current assets . . . . . . . . . . . . . . . . . . . . . . . . . . . . 285,000 212,000 189,000
Property, plant, and equipment. . . . . . . . . . . . . . . . . . . . . . 125,000 125,000 118,000
Less: Accumulated depreciation . . . . . . . . . . . . . . . . . . . . 44,000 28,000 12,000
Land . . . . . . . . . . . . . . . . . . . . . . . . . . . . . . . . . . . . . . . . . . . . 10,000 10,000
Total assets . . . . . . . . . . . . . . . . . . . . . . . . . . . . . . . . . . . . . . . $366,000 $319,000 $305,000
Total current liabilities . . . . . . . . . . . . . . . . . . . . . . . . . . . . . $123,000 $106,000 $ 97,000
Long-term notes payable . . . . . . . . . . . . . . . . . . . . . . . . . . . 47,000 58,000 48,000
Melanie Davenport, capital . . . . . . . . . . . . . . . . . . . . . . . . . 196,000 155,000 160,000
Total liabilities and owner’s equity . . . . . . . . . . . . . . . . . . . $366,000 $319,000 $305,000
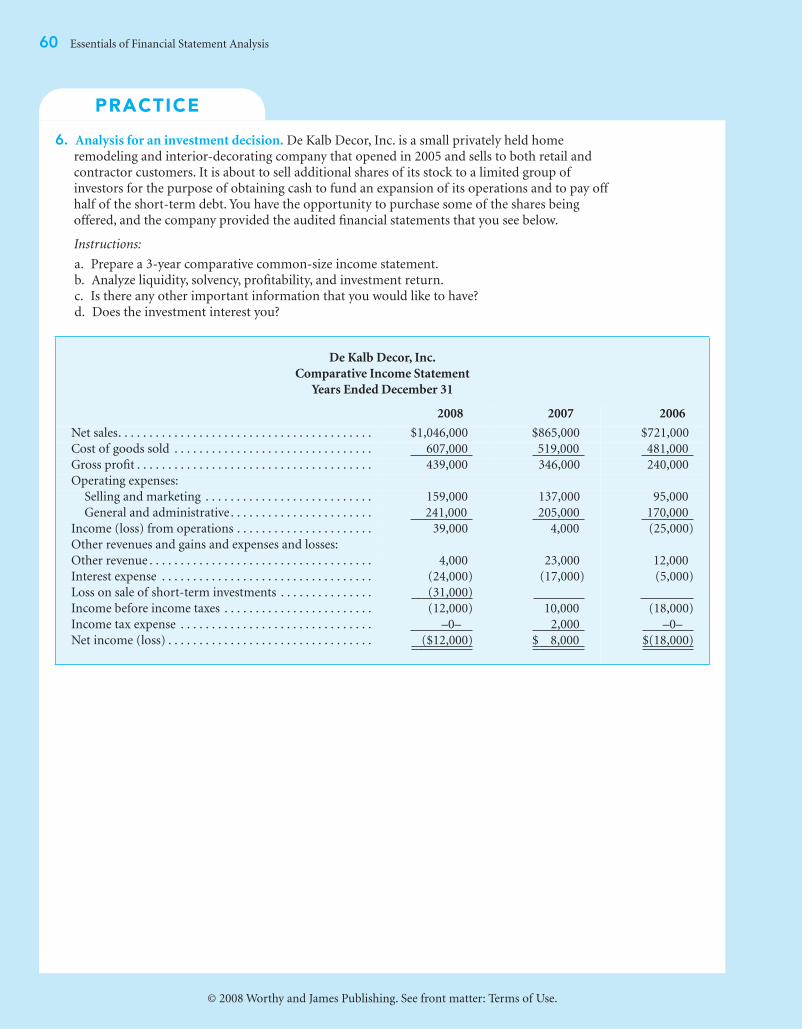
PRACTICE
60 Essentials of Financial Statement Analysis
© 2008 Worthy and James Publishing. See front matter: Terms of Use.
6. Analysis for an investment decision. De Kalb Decor, Inc. is a small privately held home remodeling and interior-decorating company that opened in 2005 and sells to both retail and contractor customers. It is about to sell additional shares of its stock to a limited group of investors for the purpose of obtaining cash to fund an expansion of its operations and to pay off half of the short-term debt. You have the opportunity to purchase some of the shares being offered, and the company provided the audited financial statements that you see below.
Instructions:
a. Prepare a 3-year comparative common-size income statement. b. Analyze liquidity, solvency, profitability, and investment return. c. Is there any other important information that you would like to have? d. Does the investment interest you?
De Kalb Decor, Inc.
Comparative Income Statement
Years Ended December 31
2008 2007 2006
Net sales. . . . . . . . . . . . . . . . . . . . . . . . . . . . . . . . . . . . . . . . . $1,046,000 $865,000 $721,000
Cost of goods sold . . . . . . . . . . . . . . . . . . . . . . . . . . . . . . . . 607,000 519,000 481,000
Gross profit . . . . . . . . . . . . . . . . . . . . . . . . . . . . . . . . . . . . . . 439,000 346,000 240,000
Operating expenses:
Selling and marketing . . . . . . . . . . . . . . . . . . . . . . . . . . . 159,000 137,000 95,000
General and administrative . . . . . . . . . . . . . . . . . . . . . . . 241,000 205,000 170,000
Income (loss) from operations . . . . . . . . . . . . . . . . . . . . . . 39,000 4,000 (25,000)
Other revenues and gains and expenses and losses:
Other revenue . . . . . . . . . . . . . . . . . . . . . . . . . . . . . . . . . . . . 4,000 23,000 12,000
Interest expense . . . . . . . . . . . . . . . . . . . . . . . . . . . . . . . . . . (24,000) (17,000) (5,000)
Loss on sale of short-term investments . . . . . . . . . . . . . . . (31,000)
Income before income taxes . . . . . . . . . . . . . . . . . . . . . . . . (12,000) 10,000 (18,000)
Income tax expense . . . . . . . . . . . . . . . . . . . . . . . . . . . . . . . –0– 2,000 –0–
Net income (loss) . . . . . . . . . . . . . . . . . . . . . . . . . . . . . . . . . ($12,000) $ 8,000 $(18,000)
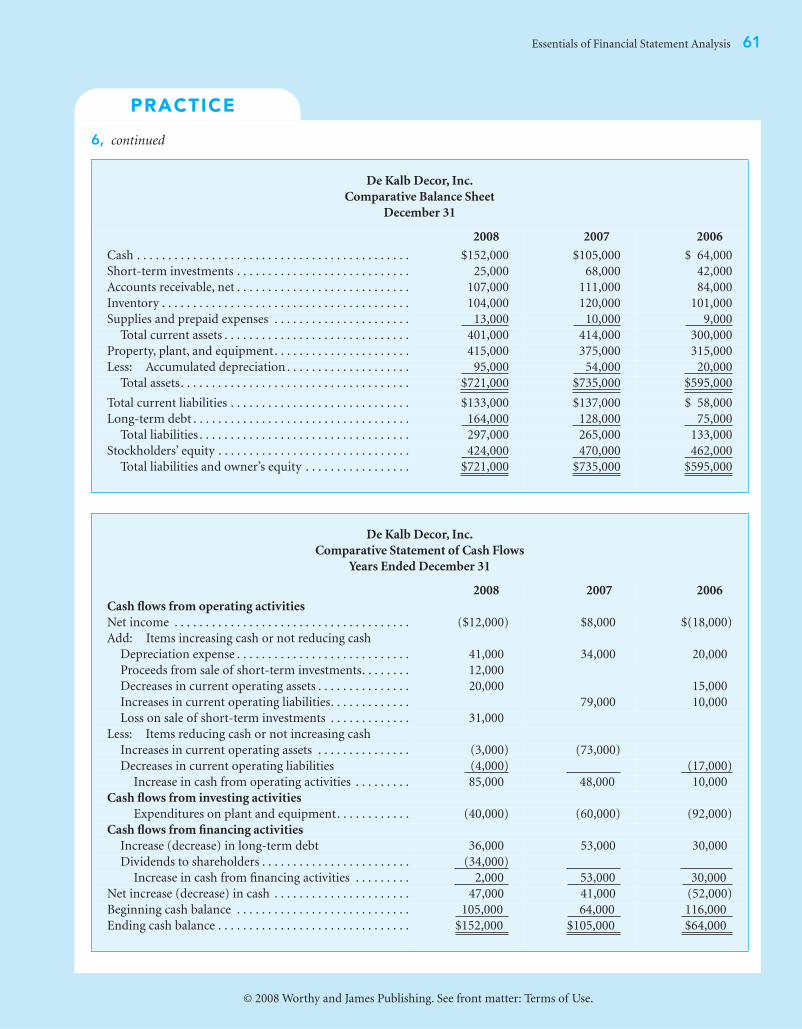
PRACTICE
Essentials of Financial Statement Analysis 61
© 2008 Worthy and James Publishing. See front matter: Terms of Use.
6, continued
De Kalb Decor, Inc.
Comparative Balance Sheet
December 31
2008 2007 2006
Cash . . . . . . . . . . . . . . . . . . . . . . . . . . . . . . . . . . . . . . . . . . . . $152,000 $105,000 $ 64,000
Short-term investments . . . . . . . . . . . . . . . . . . . . . . . . . . . . 25,000 68,000 42,000
Accounts receivable, net . . . . . . . . . . . . . . . . . . . . . . . . . . . . 107,000 111,000 84,000
Inventory . . . . . . . . . . . . . . . . . . . . . . . . . . . . . . . . . . . . . . . . 104,000 120,000 101,000
Supplies and prepaid expenses . . . . . . . . . . . . . . . . . . . . . . 13,000 10,000 9,000
Total current assets . . . . . . . . . . . . . . . . . . . . . . . . . . . . . . 401,000 414,000 300,000
Property, plant, and equipment. . . . . . . . . . . . . . . . . . . . . . 415,000 375,000 315,000
Less: Accumulated depreciation . . . . . . . . . . . . . . . . . . . . 95,000 54,000 20,000
Total assets. . . . . . . . . . . . . . . . . . . . . . . . . . . . . . . . . . . . . $721,000 $735,000 $595,000
Total current liabilities . . . . . . . . . . . . . . . . . . . . . . . . . . . . . $133,000 $137,000 $ 58,000
Long-term debt . . . . . . . . . . . . . . . . . . . . . . . . . . . . . . . . . . . 164,000 128,000 75,000
Total liabilities . . . . . . . . . . . . . . . . . . . . . . . . . . . . . . . . . . 297,000 265,000 133,000
Stockholders’ equity . . . . . . . . . . . . . . . . . . . . . . . . . . . . . . . 424,000 470,000 462,000
Total liabilities and owner’s equity . . . . . . . . . . . . . . . . . $721,000 $735,000 $595,000
De Kalb Decor, Inc.
Comparative Statement of Cash Flows
Years Ended December 31
2008 2007 2006
Cash flows from operating activities
Net income . . . . . . . . . . . . . . . . . . . . . . . . . . . . . . . . . . . . . . ($12,000) $8,000 $(18,000)
Add: Items increasing cash or not reducing cash
Depreciation expense . . . . . . . . . . . . . . . . . . . . . . . . . . . . 41,000 34,000 20,000
Proceeds from sale of short-term investments. . . . . . . . 12,000
Decreases in current operating assets . . . . . . . . . . . . . . . 20,000 15,000
Increases in current operating liabilities. . . . . . . . . . . . . 79,000 10,000
Loss on sale of short-term investments . . . . . . . . . . . . . 31,000
Less: Items reducing cash or not increasing cash
Increases in current operating assets . . . . . . . . . . . . . . . (3,000) (73,000)
Decreases in current operating liabilities (4,000) (17,000)
Increase in cash from operating activities . . . . . . . . . 85,000 48,000 10,000
Cash flows from investing activities
Expenditures on plant and equipment. . . . . . . . . . . . (40,000) (60,000) (92,000)
Cash flows from financing activities
Increase (decrease) in long-term debt 36,000 53,000 30,000
Dividends to shareholders . . . . . . . . . . . . . . . . . . . . . . . . (34,000)
Increase in cash from financing activities . . . . . . . . . 2,000 53,000 30,000
Net increase (decrease) in cash . . . . . . . . . . . . . . . . . . . . . . 47,000 41,000 (52,000)
Beginning cash balance . . . . . . . . . . . . . . . . . . . . . . . . . . . . 105,000 64,000 116,000
Ending cash balance . . . . . . . . . . . . . . . . . . . . . . . . . . . . . . . $152,000 $105,000 $64,000
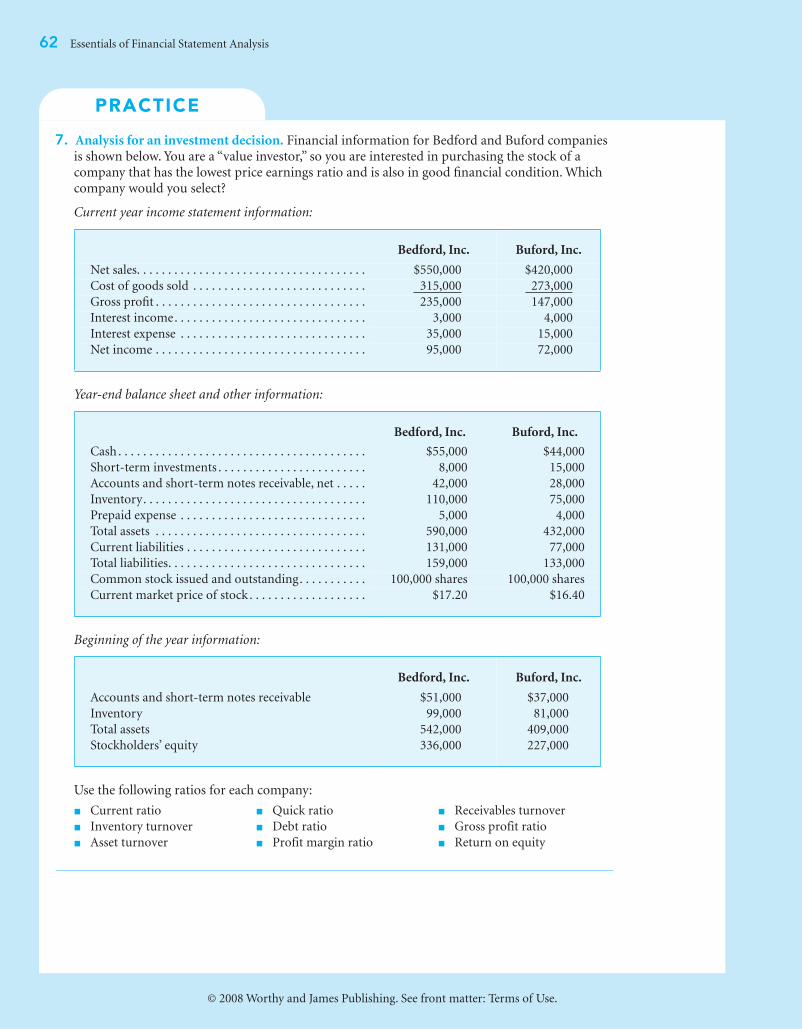
PRACTICE
62 Essentials of Financial Statement Analysis
© 2008 Worthy and James Publishing. See front matter: Terms of Use.
7. Analysis for an investment decision. Financial information for Bedford and Buford companies is shown below. You are a “value investor,” so you are interested in purchasing the stock of a company that has the lowest price earnings ratio and is also in good financial condition. Which company would you select?
Current year income statement information:
Year-end balance sheet and other information:
Beginning of the year information:
Use the following ratios for each company:
Bedford, Inc. Buford, Inc.
Net sales. . . . . . . . . . . . . . . . . . . . . . . . . . . . . . . . . . . . . $550,000 $420,000
Cost of goods sold . . . . . . . . . . . . . . . . . . . . . . . . . . . . 315,000 273,000
Gross profit . . . . . . . . . . . . . . . . . . . . . . . . . . . . . . . . . . 235,000 147,000
Interest income. . . . . . . . . . . . . . . . . . . . . . . . . . . . . . . 3,000 4,000
Interest expense . . . . . . . . . . . . . . . . . . . . . . . . . . . . . . 35,000 15,000
Net income . . . . . . . . . . . . . . . . . . . . . . . . . . . . . . . . . . 95,000 72,000
Bedford, Inc. Buford, Inc.
Cash . . . . . . . . . . . . . . . . . . . . . . . . . . . . . . . . . . . . . . . . $55,000 $44,000
Short-term investments . . . . . . . . . . . . . . . . . . . . . . . . 8,000 15,000
Accounts and short-term notes receivable, net . . . . . 42,000 28,000
Inventory. . . . . . . . . . . . . . . . . . . . . . . . . . . . . . . . . . . . 110,000 75,000
Prepaid expense . . . . . . . . . . . . . . . . . . . . . . . . . . . . . . 5,000 4,000
Total assets . . . . . . . . . . . . . . . . . . . . . . . . . . . . . . . . . . 590,000 432,000
Current liabilities . . . . . . . . . . . . . . . . . . . . . . . . . . . . . 131,000 77,000
Total liabilities. . . . . . . . . . . . . . . . . . . . . . . . . . . . . . . . 159,000 133,000
Common stock issued and outstanding. . . . . . . . . . . 100,000 shares 100,000 shares
Current market price of stock . . . . . . . . . . . . . . . . . . . $17.20 $16.40
Bedford, Inc. Buford, Inc.
Accounts and short-term notes receivable $51,000 $37,000
Inventory 99,000 81,000
Total assets 542,000 409,000
Stockholders’ equity 336,000 227,000
■ Current ratio ■ Quick ratio ■ Receivables turnover
■ Inventory turnover ■ Debt ratio ■ Gross profit ratio
■ Asset turnover ■ Profit margin ratio ■ Return on equity
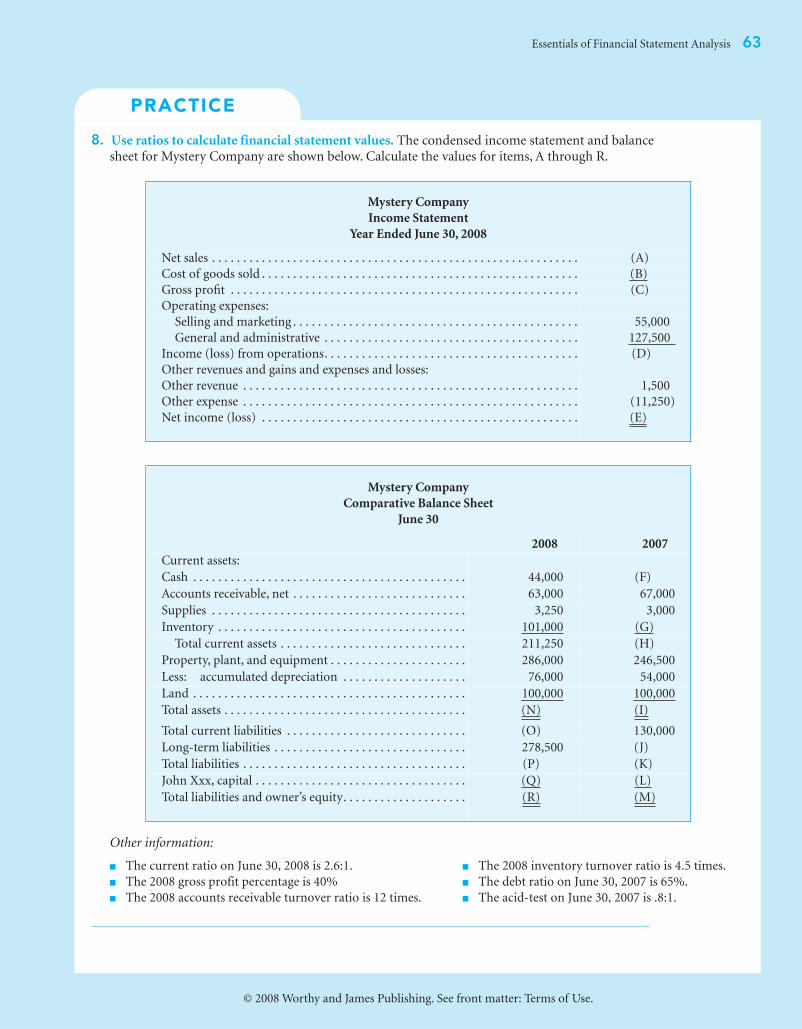
PRACTICE
Essentials of Financial Statement Analysis 63
© 2008 Worthy and James Publishing. See front matter: Terms of Use.
8. Use ratios to calculate financial statement values. The condensed income statement and balance sheet for Mystery Company are shown below. Calculate the values for items, A through R.
Other information:
Mystery Company
Income Statement
Year Ended June 30, 2008
Net sales . . . . . . . . . . . . . . . . . . . . . . . . . . . . . . . . . . . . . . . . . . . . . . . . . . . . . . . . . . . (A)
Cost of goods sold . . . . . . . . . . . . . . . . . . . . . . . . . . . . . . . . . . . . . . . . . . . . . . . . . . . (B)
Gross profit . . . . . . . . . . . . . . . . . . . . . . . . . . . . . . . . . . . . . . . . . . . . . . . . . . . . . . . . (C)
Operating expenses:
Selling and marketing . . . . . . . . . . . . . . . . . . . . . . . . . . . . . . . . . . . . . . . . . . . . . . 55,000
General and administrative . . . . . . . . . . . . . . . . . . . . . . . . . . . . . . . . . . . . . . . . . 127,500
Income (loss) from operations. . . . . . . . . . . . . . . . . . . . . . . . . . . . . . . . . . . . . . . . . (D)
Other revenues and gains and expenses and losses:
Other revenue . . . . . . . . . . . . . . . . . . . . . . . . . . . . . . . . . . . . . . . . . . . . . . . . . . . . . . 1,500
Other expense . . . . . . . . . . . . . . . . . . . . . . . . . . . . . . . . . . . . . . . . . . . . . . . . . . . . . . (11,250)
Net income (loss) . . . . . . . . . . . . . . . . . . . . . . . . . . . . . . . . . . . . . . . . . . . . . . . . . . . (E)
Mystery Company
Comparative Balance Sheet
June 30
2008 2007
Current assets:
Cash . . . . . . . . . . . . . . . . . . . . . . . . . . . . . . . . . . . . . . . . . . . . 44,000 (F)
Accounts receivable, net . . . . . . . . . . . . . . . . . . . . . . . . . . . . 63,000 67,000
Supplies . . . . . . . . . . . . . . . . . . . . . . . . . . . . . . . . . . . . . . . . . 3,250 3,000
Inventory . . . . . . . . . . . . . . . . . . . . . . . . . . . . . . . . . . . . . . . . 101,000 (G)
Total current assets . . . . . . . . . . . . . . . . . . . . . . . . . . . . . . 211,250 (H)
Property, plant, and equipment . . . . . . . . . . . . . . . . . . . . . . 286,000 246,500
Less: accumulated depreciation . . . . . . . . . . . . . . . . . . . . 76,000 54,000
Land . . . . . . . . . . . . . . . . . . . . . . . . . . . . . . . . . . . . . . . . . . . . 100,000 100,000
Total assets . . . . . . . . . . . . . . . . . . . . . . . . . . . . . . . . . . . . . . . (N) (I)
Total current liabilities . . . . . . . . . . . . . . . . . . . . . . . . . . . . . (O) 130,000
Long-term liabilities . . . . . . . . . . . . . . . . . . . . . . . . . . . . . . . 278,500 (J)
Total liabilities . . . . . . . . . . . . . . . . . . . . . . . . . . . . . . . . . . . . (P) (K)
John Xxx, capital . . . . . . . . . . . . . . . . . . . . . . . . . . . . . . . . . . (Q) (L)
Total liabilities and owner’s equity. . . . . . . . . . . . . . . . . . . . (R) (M)
■ The current ratio on June 30, 2008 is 2.6:1. ■ The 2008 inventory turnover ratio is 4.5 times.
■ The 2008 gross profit percentage is 40% ■ The debt ratio on June 30, 2007 is 65%.
■ The 2008 accounts receivable turnover ratio is 12 times. ■ The acid-test on June 30, 2007 is .8:1.
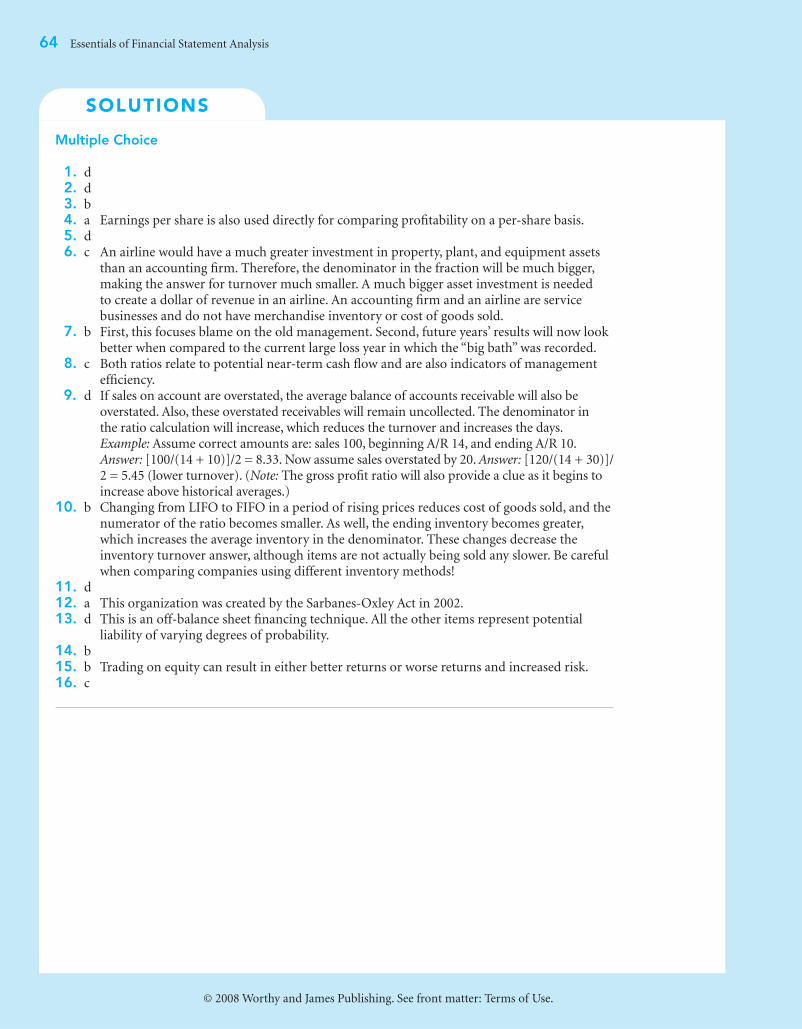
SOLUTIONS
64
Essentials of Financial Statement Analysis
© 2008 Worthy and James Publishing. See front matter: Terms of Use.
Multiple Choice
1.
d
2.
d
3.
b
4.
a Earnings per share is also used directly for comparing profitability on a per-share basis.
5.
d
6.
c An airline would have a much greater investment in property, plant, and equipment assets than an accounting firm. Therefore, the denominator in the fraction will be much bigger, making the answer for turnover much smaller. A much bigger asset investment is needed to create a dollar of revenue in an airline. An accounting firm and an airline are service businesses and do not have merchandise inventory or cost of goods sold.
7.
b First, this focuses blame on the old management. Second, future years’ results will now look better when compared to the current large loss year in which the “big bath” was recorded.
8.
c Both ratios relate to potential near-term cash flow and are also indicators of management efficiency.
9.
d If sales on account are overstated, the average balance of accounts receivable will also be overstated. Also, these overstated receivables will remain uncollected. The denominator in the ratio calculation will increase, which reduces the turnover and increases the days.
Example:
Assume correct amounts are: sales 100, beginning A/R 14, and ending A/R 10.
Answer:
[100/(14 + 10)]/2 = 8.33. Now assume sales overstated by 20.
Answer:
[120/(14 + 30)]/2 = 5.45 (lower turnover). (
Note:
The gross profit ratio will also provide a clue as it begins to increase above historical averages.)
10.
b Changing from LIFO to FIFO in a period of rising prices reduces cost of goods sold, and the numerator of the ratio becomes smaller. As well, the ending inventory becomes greater, which increases the average inventory in the denominator. These changes decrease the inventory turnover answer, although items are not actually being sold any slower. Be careful when comparing companies using different inventory methods!
11.
d
12.
a This organization was created by the Sarbanes-Oxley Act in 2002.
13.
d This is an off-balance sheet financing technique. All the other items represent potential liability of varying degrees of probability.
14.
b
15.
b Trading on equity can result in either better returns or worse returns and increased risk.
16.
c

SOLUTIONS
Essentials of Financial Statement Analysis
65
© 2008 Worthy and James Publishing. See front matter: Terms of Use.
Reinforcement Problems
1.
See the table on pages 51 and 52.
2.
Grand Forks Company
In 2007, net income increased by a greater percentage than sales because total expenses increased by a lower percentage than sales. As the biggest expense item, cost of goods sold had the biggest effect. In 2008, net income increased by a lower percentage than sales because the total expenses increased by a higher percentage than sales. Cost of goods sold again had the greatest effect, as operating expenses actually increased by a lesser percentage than sales.
3.
Ketchikan Company
(
Note:
No preferred stock or dividends in this problem.)
4.
1a. The current ratio improves! (Current assets and current liabilities each decrease by $10,000.) The new ratio is 2.8:1.
1b. The debt ratio also improves. (Total debt and total assets each decrease by $10,000.) The new ratio is 33.3%.
2008 changes 2007 changes
Net sales . . . . . . . . . . . . . . . . . . . . . . . . . . . . . $116,000 23.7% $71,000 16.9%
Cost of goods sold . . . . . . . . . . . . . . . . . . . . 82,000 29.7 25,000 10.0
Gross profit . . . . . . . . . . . . . . . . . . . . . . . . . . 34,000 16.0 46,000 27.5
Operating expenses. . . . . . . . . . . . . . . . . . . . 25,000 17.9 14,000 11.1
Income from operations . . . . . . . . . . . . . . . 9,000 12.3 32,000 78.0
Interest expense. . . . . . . . . . . . . . . . . . . . . . . 1,000 100.0 (1,000) (50.0)
Net income . . . . . . . . . . . . . . . . . . . . . . . . . . $ 8,000 11.1% $33,000 84.6%
Current ratio: 2.13:1
(14,000 + 15,700 + 24,300 + 2,500)/(11,000 + 15,500)
Accounts receivable turnover: 15.4 times per year
312,000/[(15,700 + 24,800)/2] = 15.4
Average collection period: 24 days
(312,000)/[(15,700 + 24,800)/2] = 15.4
365/15.4 = aprox. 24 days
Inventory turnover: 6.76 times per year
210,000/[(24,300 + 37,800)/2] = 6.76
Debt ratio: 35.3%
(11,000 + 15,500 + 98,700)/355,000 = .353
Cash flow to debt ratio: 28%
36,300/[(125,200 + 134,300)/2] = .279
Rate of return on total assets: 11%
37,600/[(355,000 + 325,700)/2] = .11
Rate of return on equity: 17.9%
37,600/[(229,800 + 191,400)/2] = .1785
Earnings per share: $.18 per common share
37,600/210,000 = .179
Quick ratio: 1.12
($14,000 + $15,700)/$26,500 = 1.12
Profit margin ratio: .12 (about 12%)
$37,600/$312,000 = .12
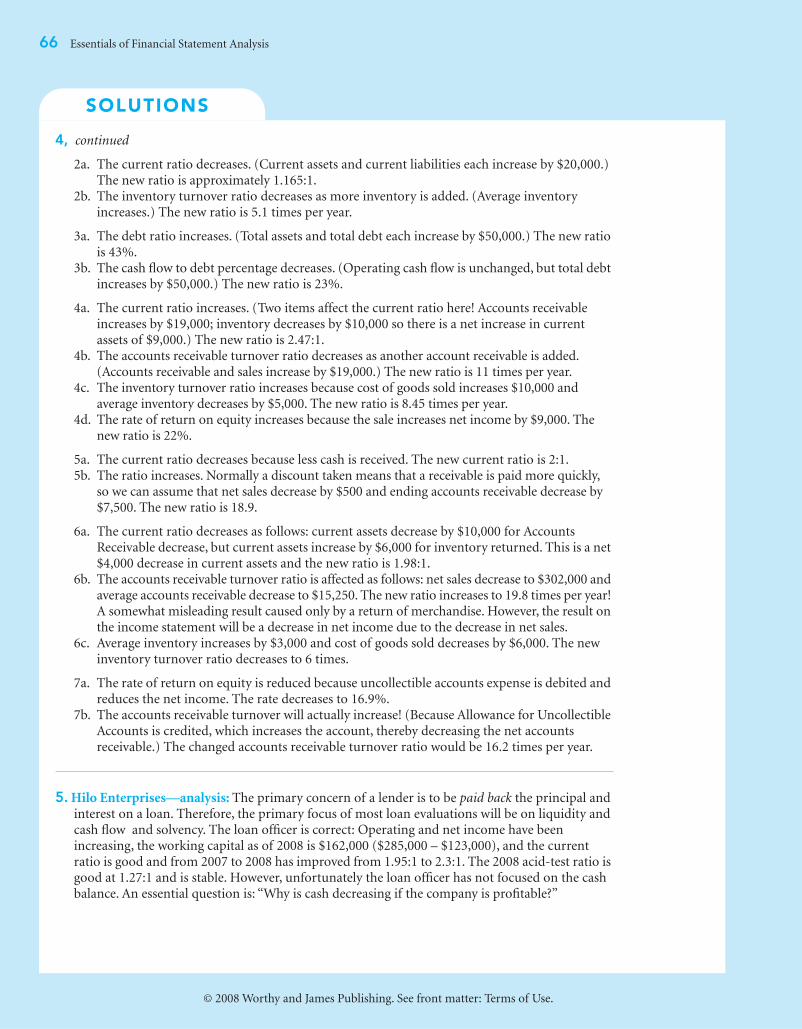
SOLUTIONS
66
Essentials of Financial Statement Analysis
© 2008 Worthy and James Publishing. See front matter: Terms of Use.
4,
continued
2a. The current ratio decreases. (Current assets and current liabilities each increase by $20,000.) The new ratio is approximately 1.165:1.
2b. The inventory turnover ratio decreases as more inventory is added. (Average inventory increases.) The new ratio is 5.1 times per year.
3a. The debt ratio increases. (Total assets and total debt each increase by $50,000.) The new ratio is 43%.
3b. The cash flow to debt percentage decreases. (Operating cash flow is unchanged, but total debt increases by $50,000.) The new ratio is 23%.
4a. The current ratio increases. (Two items affect the current ratio here! Accounts receivable increases by $19,000; inventory decreases by $10,000 so there is a net increase in current assets of $9,000.) The new ratio is 2.47:1.
4b. The accounts receivable turnover ratio decreases as another account receivable is added. (Accounts receivable and sales increase by $19,000.) The new ratio is 11 times per year.
4c. The inventory turnover ratio increases because cost of goods sold increases $10,000 and average inventory decreases by $5,000. The new ratio is 8.45 times per year.
4d. The rate of return on equity increases because the sale increases net income by $9,000. The new ratio is 22%.
5a. The current ratio decreases because less cash is received. The new current ratio is 2:1. 5b. The ratio increases. Normally a discount taken means that a receivable is paid more quickly,
so we can assume that net sales decrease by $500 and ending accounts receivable decrease by $7,500. The new ratio is 18.9.
6a. The current ratio decreases as follows: current assets decrease by $10,000 for Accounts Receivable decrease, but current assets increase by $6,000 for inventory returned. This is a net $4,000 decrease in current assets and the new ratio is 1.98:1.
6b. The accounts receivable turnover ratio is affected as follows: net sales decrease to $302,000 and average accounts receivable decrease to $15,250. The new ratio increases to 19.8 times per year! A somewhat misleading result caused only by a return of merchandise. However, the result on the income statement will be a decrease in net income due to the decrease in net sales.
6c. Average inventory increases by $3,000 and cost of goods sold decreases by $6,000. The new inventory turnover ratio decreases to 6 times.
7a. The rate of return on equity is reduced because uncollectible accounts expense is debited and reduces the net income. The rate decreases to 16.9%.
7b. The accounts receivable turnover will actually increase! (Because Allowance for Uncollectible Accounts is credited, which increases the account, thereby decreasing the net accounts receivable.) The changed accounts receivable turnover ratio would be 16.2 times per year.
5.
Hilo Enterprises—analysis:
The primary concern of a lender is to be
paid back
the principal and interest on a loan. Therefore, the primary focus of most loan evaluations will be on liquidity and cash flow and solvency. The loan officer is correct: Operating and net income have been increasing, the working capital as of 2008 is $162,000 ($285,000 – $123,000), and the current ratio is good and from 2007 to 2008 has improved from 1.95:1 to 2.3:1. The 2008 acid-test ratio is good at 1.27:1 and is stable. However, unfortunately the loan officer has not focused on the cash balance. An essential question is: “Why is cash decreasing if the company is profitable?”
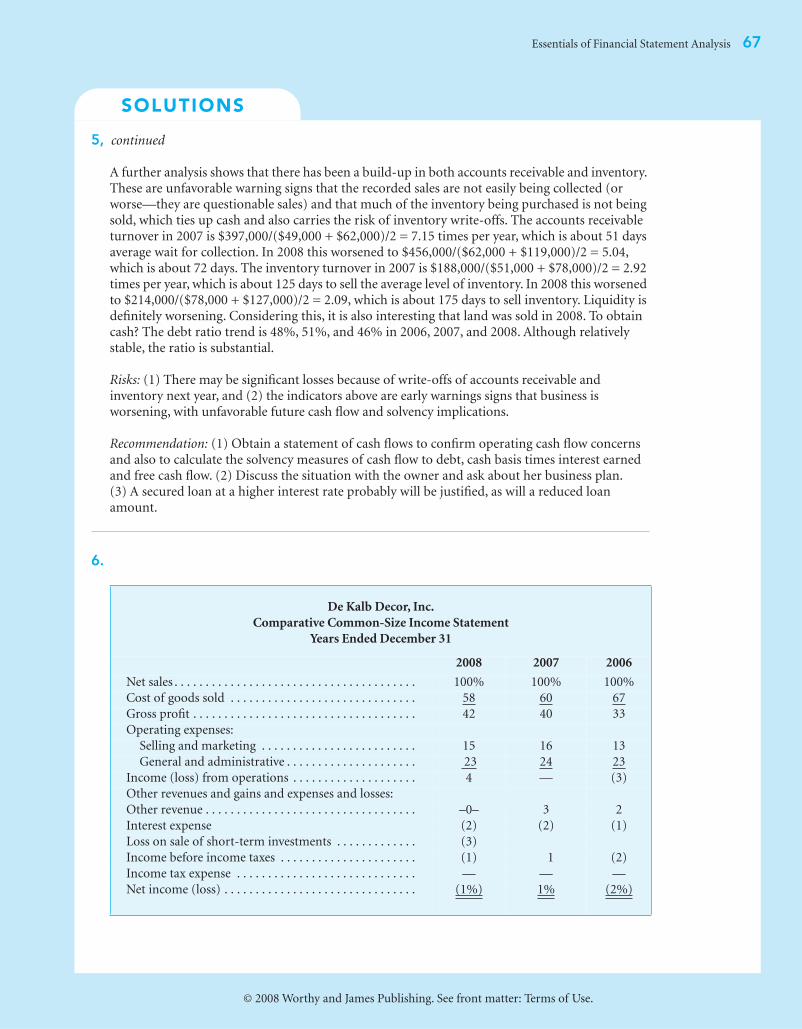
SOLUTIONS
Essentials of Financial Statement Analysis
67
© 2008 Worthy and James Publishing. See front matter: Terms of Use.
5,
continued
A further analysis shows that there has been a build-up in both accounts receivable and inventory. These are unfavorable warning signs that the recorded sales are not easily being collected (or worse—they are questionable sales) and that much of the inventory being purchased is not being sold, which ties up cash and also carries the risk of inventory write-offs. The accounts receivable turnover in 2007 is $397,000/($49,000 + $62,000)/2 = 7.15 times per year, which is about 51 days average wait for collection. In 2008 this worsened to $456,000/($62,000 + $119,000)/2 = 5.04, which is about 72 days. The inventory turnover in 2007 is $188,000/($51,000 + $78,000)/2 = 2.92 times per year, which is about 125 days to sell the average level of inventory. In 2008 this worsened to $214,000/($78,000 + $127,000)/2 = 2.09, which is about 175 days to sell inventory. Liquidity is definitely worsening. Considering this, it is also interesting that land was sold in 2008. To obtain cash? The debt ratio trend is 48%, 51%, and 46% in 2006, 2007, and 2008. Although relatively stable, the ratio is substantial.
Risks:
(1) There may be significant losses because of write-offs of accounts receivable and inventory next year, and (2) the indicators above are early warnings signs that business is worsening, with unfavorable future cash flow and solvency implications.
Recommendation:
(1) Obtain a statement of cash flows to confirm operating cash flow concerns and also to calculate the solvency measures of cash flow to debt, cash basis times interest earned and free cash flow. (2) Discuss the situation with the owner and ask about her business plan. (3) A secured loan at a higher interest rate probably will be justified, as will a reduced loan amount.
6.
De Kalb Decor, Inc.
Comparative Common-Size Income Statement
Years Ended December 31
2008 2007 2006
Net sales . . . . . . . . . . . . . . . . . . . . . . . . . . . . . . . . . . . . . . . 100% 100% 100%
Cost of goods sold . . . . . . . . . . . . . . . . . . . . . . . . . . . . . . 58 60 67
Gross profit . . . . . . . . . . . . . . . . . . . . . . . . . . . . . . . . . . . . 42 40 33
Operating expenses:
Selling and marketing . . . . . . . . . . . . . . . . . . . . . . . . . 15 16 13
General and administrative . . . . . . . . . . . . . . . . . . . . . 23 24 23
Income (loss) from operations . . . . . . . . . . . . . . . . . . . . 4 — (3)
Other revenues and gains and expenses and losses:
Other revenue . . . . . . . . . . . . . . . . . . . . . . . . . . . . . . . . . . –0– 3 2
Interest expense (2) (2) (1)
Loss on sale of short-term investments . . . . . . . . . . . . . (3)
Income before income taxes . . . . . . . . . . . . . . . . . . . . . . (1) 1 (2)
Income tax expense . . . . . . . . . . . . . . . . . . . . . . . . . . . . . — — —
Net income (loss) . . . . . . . . . . . . . . . . . . . . . . . . . . . . . . . (1%) 1% (2%)
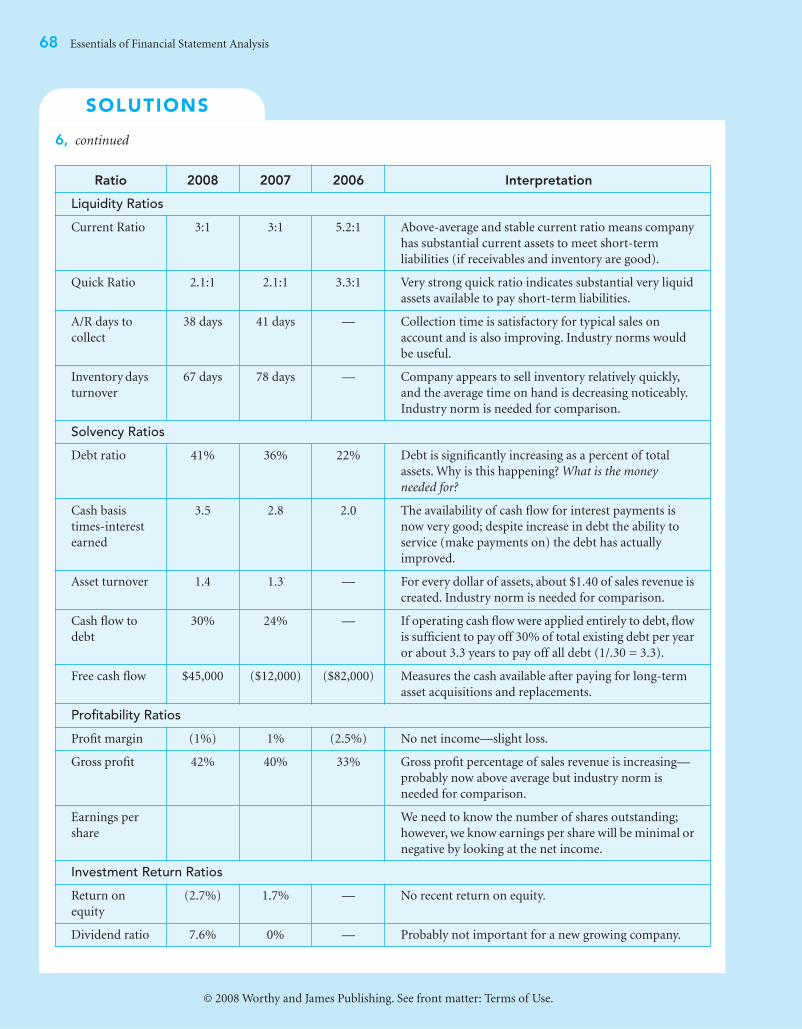
SOLUTIONS
68
Essentials of Financial Statement Analysis
© 2008 Worthy and James Publishing. See front matter: Terms of Use.
6,
continued
Ratio 2008 2007 2006 Interpretation
Liquidity Ratios
Current Ratio 3:1 3:1 5.2:1 Above-average and stable current ratio means company
has substantial current assets to meet short-term
liabilities (if receivables and inventory are good).
Quick Ratio 2.1:1 2.1:1 3.3:1 Very strong quick ratio indicates substantial very liquid
assets available to pay short-term liabilities.
A/R days to
collect
38 days 41 days — Collection time is satisfactory for typical sales on
account and is also improving. Industry norms would
be useful.
Inventory days
turnover
67 days 78 days — Company appears to sell inventory relatively quickly,
and the average time on hand is decreasing noticeably.
Industry norm is needed for comparison.
Solvency Ratios
Debt ratio 41% 36% 22% Debt is significantly increasing as a percent of total
assets. Why is this happening?
What is the money
needed for?
Cash basis
times-interest
earned
3.5 2.8 2.0 The availability of cash flow for interest payments is
now very good; despite increase in debt the ability to
service (make payments on) the debt has actually
improved.
Asset turnover 1.4 1.3 — For every dollar of assets, about $1.40 of sales revenue is
created. Industry norm is needed for comparison.
Cash flow to
debt
30% 24% — If operating cash flow were applied entirely to debt, flow
is sufficient to pay off 30% of total existing debt per year
or about 3.3 years to pay off all debt (1/.30 = 3.3).
Free cash flow $45,000 ($12,000) ($82,000) Measures the cash available after paying for long-term
asset acquisitions and replacements.
Profitability Ratios
Profit margin (1%) 1% (2.5%) No net income—slight loss.
Gross profit 42% 40% 33% Gross profit percentage of sales revenue is increasing—
probably now above average but industry norm is
needed for comparison.
Earnings per
share
We need to know the number of shares outstanding;
however, we know earnings per share will be minimal or
negative by looking at the net income.
Investment Return Ratios
Return on
equity
(2.7%) 1.7% — No recent return on equity.
Dividend ratio 7.6% 0% — Probably not important for a new growing company.
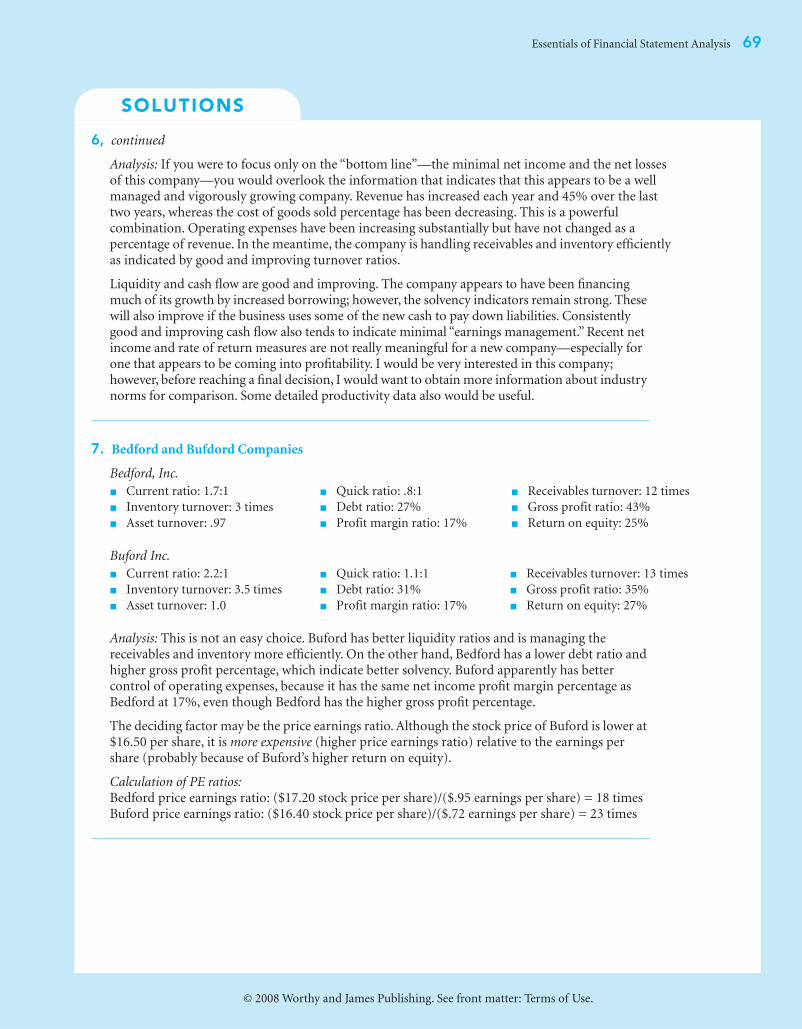
SOLUTIONS
Essentials of Financial Statement Analysis
69
© 2008 Worthy and James Publishing. See front matter: Terms of Use.
6,
continued
Analysis:
If you were to focus only on the “bottom line”—the minimal net income and the net losses of this company—you would overlook the information that indicates that this appears to be a well managed and vigorously growing company. Revenue has increased each year and 45% over the last two years, whereas the cost of goods sold percentage has been decreasing. This is a powerful combination. Operating expenses have been increasing substantially but have not changed as a percentage of revenue. In the meantime, the company is handling receivables and inventory efficiently as indicated by good and improving turnover ratios.
Liquidity and cash flow are good and improving. The company appears to have been financing much of its growth by increased borrowing; however, the solvency indicators remain strong. These will also improve if the business uses some of the new cash to pay down liabilities. Consistently good and improving cash flow also tends to indicate minimal “earnings management.” Recent net income and rate of return measures are not really meaningful for a new company—especially for one that appears to be coming into profitability. I would be very interested in this company; however, before reaching a final decision, I would want to obtain more information about industry norms for comparison. Some detailed productivity data also would be useful.
7.
Bedford and Bufdord Companies
Bedford, Inc.
Buford Inc.
Analysis:
This is not an easy choice. Buford has better liquidity ratios and is managing the receivables and inventory more efficiently. On the other hand, Bedford has a lower debt ratio and higher gross profit percentage, which indicate better solvency. Buford apparently has better control of operating expenses, because it has the same net income profit margin percentage as Bedford at 17%, even though Bedford has the higher gross profit percentage.
The deciding factor may be the price earnings ratio. Although the stock price of Buford is lower at $16.50 per share, it is
more expensive
(higher price earnings ratio) relative to the earnings per share (probably because of Buford’s higher return on equity).
Calculation of PE ratios:
Bedford price earnings ratio: ($17.20 stock price per share)/($.95 earnings per share) = 18 times Buford price earnings ratio: ($16.40 stock price per share)/($.72 earnings per share) = 23 times
■
Current ratio: 1.7:1
■
Quick ratio: .8:1
■
Receivables turnover: 12 times
■
Inventory turnover: 3 times
■
Debt ratio: 27%
■
Gross profit ratio: 43%
■
Asset turnover: .97
■
Profit margin ratio: 17%
■
Return on equity: 25%
■
Current ratio: 2.2:1
■
Quick ratio: 1.1:1
■
Receivables turnover: 13 times
■
Inventory turnover: 3.5 times
■
Debt ratio: 31%
■
Gross profit ratio: 35%
■
Asset turnover: 1.0
■
Profit margin ratio: 17%
■
Return on equity: 27%
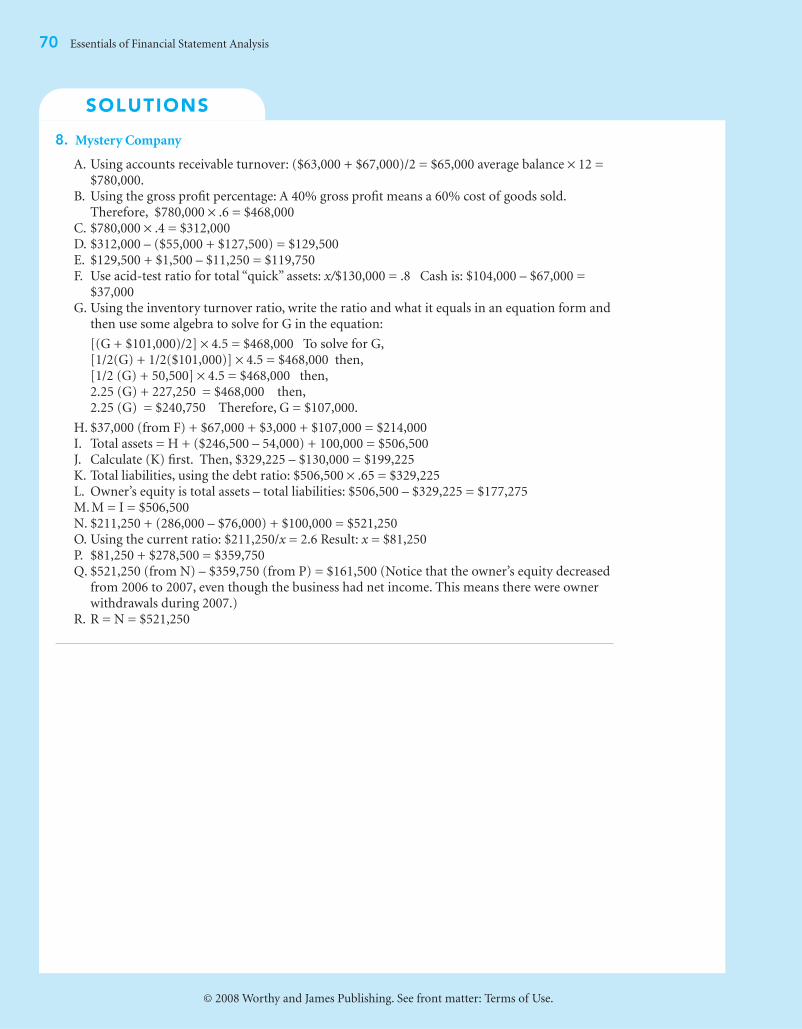
SOLUTIONS
70
Essentials of Financial Statement Analysis
© 2008 Worthy and James Publishing. See front matter: Terms of Use.
8.
Mystery Company
A. Using accounts receivable turnover: ($63,000 + $67,000)/2 = $65,000 average balance
×
12 = $780,000.
B. Using the gross profit percentage: A 40% gross profit means a 60% cost of goods sold. Therefore, $780,000
×
.6 = $468,000 C. $780,000
×
.4 = $312,000 D. $312,000 – ($55,000 + $127,500) = $129,500E. $129,500 + $1,500 – $11,250 = $119,750F. Use acid-test ratio for total “quick” assets:
x/
$130,000 = .8 Cash is: $104,000 – $67,000 = $37,000
G. Using the inventory turnover ratio, write the ratio and what it equals in an equation form and then use some algebra to solve for G in the equation:
[(G + $101,000)/2]
×
4.5 = $468,000 To solve for G, [1/2(G) + 1/2($101,000)]
×
4.5 = $468,000 then,[1/2 (G) + 50,500]
×
4.5 = $468,000 then, 2.25 (G) + 227,250 = $468,000 then,2.25 (G) = $240,750 Therefore, G = $107,000.
H. $37,000 (from F) + $67,000 + $3,000 + $107,000 = $214,000I. Total assets = H + ($246,500 – 54,000) + 100,000 = $506,500J. Calculate (K) first. Then, $329,225 – $130,000 = $199,225K. Total liabilities, using the debt ratio: $506,500
×
.65 = $329,225L. Owner’s equity is total assets – total liabilities: $506,500 – $329,225 = $177,275M. M = I = $506,500N. $211,250 + (286,000 – $76,000) + $100,000 = $521,250O. Using the current ratio: $211,250/
x
= 2.6 Result:
x
= $81,250P. $81,250 + $278,500 = $359,750Q. $521,250 (from N) – $359,750 (from P) = $161,500 (Notice that the owner’s equity decreased
from 2006 to 2007, even though the business had net income. This means there were owner withdrawals during 2007.)
R. R = N = $521,250