Essential Oil Metabolomic Profiling with HRMS and a Variety...
8
1 [ APPLICATION NOTE ] WATERS SOLUTIONS Xevo™ G2 Tof Mass Spectrometer ACQUITY™ UPLC I-Class System Viridis™ HSS C 18 SB Column CORTECS™ C 18 Column Progenesis QI Software MassLynx™ Software KEYWORDS UPC,² MS, E ASAP/APCI, natural products, essential oil, mass spectrometry, Progenesis QI APPLICATION BENEFITS ■ ■ HRMS coupled to UPLC™ and UPC 2 ™ provides complementary information regarding the non-volatile and semi- volatile components of non-conforming batches of vetiver essential oil (as compared to the volatile components characterized by GC-FID and GC-MS). ■ ■ The advanced statistical tools provided by Progenesis™ QI enabled comprehensive sample comparisons leading to the highlighting of suspected adulteration in some of the non-conforming vetiver essential oil batches ■ ■ The combination of LC-MS and advanced statistical tools for characterization of vetiver essential oil offers a valuable tool for essential oil quality control and testing of authentic natural raw ingredients Essential Oil Metabolomic Profiling with HRMS and a Variety of Complementary Ionization Techniques - Allowing Discrimination of Samples of Different Botanical Origin and Non-Conformity Jerome Masson, 1 Hugues Brevard, 1 Agnes Corbin, 2 Joanne Connolly, 3 1 Robertet SA, Research Division, 37 Avenue Sidi Brahim, F-06130 Grasse, France; 2 Waters SAS, Saint-Quentin en Yvelines, France; 3 Waters Corporation, Wilmslow, UK INTRODUCTION In the fragrance industry, vetiver essential oil (chrysopogon zizanioides) is one of the major natural raw ingredients used. Its particularly heavy, earthy fragrance with woody, grapefruit, and smoky-earthy notes, 1 make it a raw ingredient of choice for perfumers – who use 250 tons of it per year, worldwide. Essential oils, and more generally, volatile compounds are usually characterized by well-established and effective approaches involving GC-MS. With GC-MS techniques, precise and accurate quantitative analyses are performed, monitoring the oil’s quality and stability, based on a limited number of specific chemical markers. However, a recent evolution of the REACH regulations (EU n° 1907/2006) based on the Natural Complexes Substances (NCS), obliges suppliers to have a better knowledge of the phytochemistry of their products. The combination of UPLC and UPC² analyses coupled with HRMS can be used for a more comprehensive overview of raw ingredients using an untargeted metabolomics approach. 2–4 A variety of ionization sources (ESI, APCI, ASAP), ionization modes (positive/negative) and capillary or corona voltages (low and high) were used to be as exhaustive as possible. In this study, ten distinct vetiver oil samples of different botanical origins were analysed to determine their chemical constituent make-up and assess their qualities.
Transcript of Essential Oil Metabolomic Profiling with HRMS and a Variety...

1
[ APPLICATION NOTE ]
WATERS SOLUTIONSXevo™ G2 Tof Mass Spectrometer
ACQUITY™ UPLC I-Class System
Viridis™ HSS C18 SB Column
CORTECS™ C18 Column
Progenesis QI Software
MassLynx™ Software
KEYWORDSUPC,² MS,E ASAP/APCI, natural products, essential oil, mass spectrometry, Progenesis QI
APPLICATION BENEFITS■■ HRMS coupled to UPLC™ and UPC2™
provides complementary information regarding the non-volatile and semi-volatile components of non-conforming batches of vetiver essential oil (as compared to the volatile components characterized by GC-FID and GC-MS).
■■ The advanced statistical tools provided by Progenesis™ QI enabled comprehensive sample comparisons leading to the highlighting of suspected adulteration in some of the non-conforming vetiver essential oil batches
■■ The combination of LC-MS and advanced statistical tools for characterization of vetiver essential oil offers a valuable tool for essential oil quality control and testing of authentic natural raw ingredients
Essential Oil Metabolomic Profiling with HRMS and a Variety of Complementary Ionization Techniques - Allowing Discrimination of Samples of Different Botanical Origin and Non-ConformityJerome Masson,1 Hugues Brevard,1 Agnes Corbin,2 Joanne Connolly,31 Robertet SA, Research Division, 37 Avenue Sidi Brahim, F-06130 Grasse, France; 2 Waters SAS, Saint-Quentin en Yvelines, France; 3 Waters Corporation, Wilmslow, UK
INTRODUCTIONIn the fragrance industry, vetiver essential oil (chrysopogon zizanioides) is one of the major natural raw ingredients used. Its particularly heavy, earthy fragrance with woody, grapefruit, and smoky-earthy notes,1 make it a raw ingredient of choice for perfumers – who use 250 tons of it per year, worldwide. Essential oils, and more generally, volatile compounds are usually characterized by well-established and effective approaches involving GC-MS. With GC-MS techniques, precise and accurate quantitative analyses are performed, monitoring the oil’s quality and stability, based on a limited number of specific chemical markers. However, a recent evolution of the REACH regulations (EU n° 1907/2006) based on the Natural Complexes Substances (NCS), obliges suppliers to have a better knowledge of the phytochemistry of their products.
The combination of UPLC and UPC² analyses coupled with HRMS can be used for a more comprehensive overview of raw ingredients using an untargeted metabolomics approach.2–4 A variety of ionization sources (ESI, APCI, ASAP), ionization modes (positive/negative) and capillary or corona voltages (low and high) were used to be as exhaustive as possible.
In this study, ten distinct vetiver oil samples of different botanical origins were analysed to determine their chemical constituent make-up and assess their qualities.

Essential Oil Metabolomic Profiling with HRMS and a Variety of Complementary Ionization Techniques
[ APPLICATION NOTE ][ APPLICATION NOTE ]
2
EXPERIMENTAL
SamplesVetiver essential oil from Haiti (4 biological replicates), Indonesia (4 biological replicates), and Paraguay (2 biological replicates) were obtained from trade suppliers. QC samples comprising of a mixture of the essential oils were also included in the experiment. Oil samples were subjected to dilution 1/10 in a mix of MeOH:ACN (50:50).
LC conditions (UPLC)LC system: ACQUITY UPLC I-Class
Column(s): CORTECS UPLC C18, 1.6 µm, 2.1 × 100 mm (p/n: 186007095)
Column temp.: 45 °C
Flow rate: 0.45 mL/min
Mobile phase: 5 mM ammonium formate (AF) solution (pH=3.8)
Eluent (B): methanol MeOH:ACN (50:50) with 5 mM AF and 0.1% formic acid (FA)
Gradient: 1% B (2 min) to 90% of B in 10 min, then to 99% of B in 3min stay at 99% of B for 3 min
Injection volume : 1 µL
SFC conditions (UPC²)SFC system: ACQUITY UPC² System
Column: Viridis HSS C18 SB, 1.8 µm, 3 × 100 mm (p/n: 186006623)
Column temp.: 55 °C
Flow rate: 1.2 mL/min
Mobile phase: Supercritical CO2 (A) – MeOH:ACN (50:50) (B)
Gradient: Isocratic for 3 min at 100% A then to 1% B in 2 min, remaining at 1% of B in isocratic mode for 3 min then ramping to 40% B in 6 min, remain at 40% B for 4 min
Injection volume: 1 µL
The CO2 is maintained at a supercritical state with a convergent manager using a gradient pressure profile: from 1500 psi to 1750 psi in 3 min then remaining at 1750 psi for 14 min before returning to initial conditions. A splitter and a solvent makeup of MeOH:H2O (99:1) with 0.1% FA was introduced at 0.45 mL/min in positive mode, and 5mM of AF in negative mode, to improve the ionization.
MS conditionsMS system: XEVO G2-Tof in MS,E data independent
analysis acquisition, using argon as collision gas
Acquisition mode: MSE 50 m/z to 1200 m/z both functions (low and elevated energy)
Acquisition rate: Low and elevated energy functions at 0.3 s
Collision energy: 6 eV (low energy function) and from 15 eV to 30 eV (elevated energy function)
Resolution: 22,000 FWHM
Ionization: ESI
Capillary voltage: (+ and -) at 1 kV and 2.6 kV
Extraction cone: 4 V,
Source temp.: 120 °C
Desolvation temp.: 400 °C
Gas flow (nitrogen): Nitrogen at 10 L/h
Desolvation gas flow: 1200 L/h
Ionization: APCI (Ion sabre II)
Corona current: (+ and -) at 5 µA and 20 µA
Probe temp.: from 600 °C
Cone voltage: 30 V
Extraction cone: 4 V,
Source temp.: 120 °C
Gas flow: Nitrogen at 10 L/h
Desolvation gas flow: 1200 L/h
Ionization: ASAP Acquisition during 5 min in continuum mode

[ APPLICATION NOTE ]
3Essential Oil Metabolomic Profiling with HRMS and a Variety of Complementary Ionization Techniques
RESULTS AND DISCUSSIONA preliminary untargeted study, based on a global fingerprinting approach, undertaken with the different inlet and ionization methods, was performed. The UPLC-Tof-MS profiles of the samples from different geographical origins showed only minor differences. The main variations between samples concerned the different abundances of some components (markers). The overall fingerprints of the extracts were very similar (Figure 1).
With all analytical combinations employed, 180 analyses were acquired in total on the Xevo G2-Tof. They showed the synergy and the complementary nature of the data obtained with the different chromatographic techniques (UPLC and UPC²) and also with the different ionization modes (ESI and APCI) (Figure 2).
The modification of the probe voltages (low and high) allowed modification of the ionization efficiency of some compounds. However, the differences between the analyses obtained at different probe voltages were not significant (data not shown here). Nevertheless, the profiles obtained (Figure 2) with different ionization interfaces, chromatographic techniques, and ionization modes, gave additional chemical information and helped to characterize extracts in more detail.
Haiti
Paraguay
Indonesia
UPLC ESI Pos
UPLC ESI neg
UPLC ESI
UPCL APCI
UPLC ESI
UPC2 ESI
*
*
Figure 1. UPLC-Tof-MS profiles obtained in ESI positive ionization mode of the samples from three different geographical regions.
Figure 2. Complementary LC-MS profiles obtained using different techniques. Top left; Classical RP-UPLC analysis in ESI ionization in positive and negative modes. Top right RP-UPLC analysis in ESI and APCI ionization in positive mode. Bottom; UPLC and UPC2 analysis coupled with ESI ionization in positive mode.
Corona current: (+ and -) at 20 µA
Probe temp.: from 40 °C to 600 °C
Cone voltage : 30 V
Extraction cone: 4 V
Source temp.: 120 °C
Gas flow: Nitrogen at 10 L/h
Desolvation gas flow: 1200 L/h
Data managementMS software: MassLynx
Informatics: Progenesis QI, v2.3, EZInfo v3.0.3
BioinformaticsThe LC-MSE data obtained were processed, searched (against a Robertet in-house vetiver database of over 400 compounds referenced in literature5-14), and quantified with Progenesis QI Software v2.3. Progenesis QI enabled normalized label-free quantification to be achieved along with compound identifications. Features were filtered for statistical significance (CV <30%; ANOVA (p) <0.05, fold change >2). Data extracts with Progenesis QI were also submitted for additional multi-variate statistical analysis with EZinfo: Principal Component Analysis (PCA), Hierarchical Clustering Analysis (HCA), Partial Least Square-Discriminant Analysis (PLS-DA), and Orthogonal Partial Least Square-Discriminant analysis (OPLS-DA).

[ APPLICATION NOTE ]
4Essential Oil Metabolomic Profiling with HRMS and a Variety of Complementary Ionization Techniques
In order to extract meaningful results from all the raw data acquired in the entire study, Progenesis QI Software was used (Figure 3). Progenesis QI is designed for discovery metabolomic analysis, allowing retention time alignment of large numbers of LC-MS/MS runs, followed by peak picking with a unique co-detection approach, and the automatic deconvolution of the compounds’ adducts. The relative quantification of the ion occurs prior to the identifcation. Identification can be perfomed with the various databases and search engine provided by default, or with any public and in-house database with a supported generic format. Once data have been processed in Progenesis QI, the EZinfo statistical package was used to mine the data and extract the specific markers of the different botanical origins.
Statistical analysis of the LC-MSE data by means of unsupervised Principle Component Analysis (PCA) for the vetiver datasets show clear separation and clustering of the three different botanical types Haiti, Indonesia, Paraguay (PC1 and PC2 components) (Figure 4), confirmed by the HCA analysis (Figure 5).
Data alignment
Peak detection
Deconvolution
Compoundquantification
Identification
Statistics
Progenesis QI data analysis workflowRaw data import
Figure 3. Progenesis QI – guided-workflow. Software for quantification and identification of LC-MS/MS discovery metabolomics data analysis.
Figure 4. PCA score plots resulting from the analysis of vetiver oils of different botanical origins.
Figure 5. Hierarchical clustering analysis of vetiver oils of different botanical origins.
Paraguay
Haïti
Indonesia
Paraguay
Haïti
Indonesia
[ APPLICATION NOTE ]
5Essential Oil Metabolomic Profiling with HRMS and a Variety of Complementary Ionization Techniques
UPLC UPC2
ESI APCI ESI APCI
Pos.33 15 34 24
7500 635 2500 1722
Neg.17 17 13 5
298 135 908 21
The PCA score plot also shows separation between groups of low and high voltage and revealed outliers in the Indonesian group. The supervised PLS-DA analysis (Figure 6), displays better separation between the groups, decreases dispersion within the groups, and, again, highlights outliers in the Indonesian group. OPLS-DA (Figure 7 left) was then applied to extract the best discriminant markers for each geographical origin. From the OPLS-DA analysis S-plots were then created (Figure 7 right) highlighting the features which have the highest confidence and contribution to the differences between the vetivers of differing botanical origins.
Figure 8 is a table which highlights the total number of chemical features detected in each type of analysis undertaken. It also shows the number of up and down regulated features deduced following unsupervised PCA and OPLS-DA statistical analysis of the data. The regulated features can be tagged in Progenesis QI Software and exclusively interrogated to facilitate their identification.
OutliersIndonesia
Paraguay
Haïti
Indonesia
B
A
Figure 6. PLS-DA score plots resulting of the statistical analysis of the different geographical origins.
Figure 7. On the left OPLS-DA score plots from the comparison between Haiti and Indonesia groups. On the right: corresponding S-Plot resulting from the comparison between Haiti and Indonesia groups.
Figure 8. Table showing number of detected and regulated features found in vetiver differential analysis (all varieties) across all chromatographic and ionization experiments. Bold number shows regulated features, Italics number shows total number of features.
Haïti
Indonesia
Common biomarkers
Specific biomarkers
Markers for Indonesia
Markers for Haiti

[ APPLICATION NOTE ]
6Essential Oil Metabolomic Profiling with HRMS and a Variety of Complementary Ionization Techniques
The Robertet’s database was queried with Metascope, the built-in Progenesis QI search tool, to identify one of the specific markers of the vetiver essential oil: β-vetivone with a mass 219.1760 Da and Retention time 11.25 min. (Figure 9) The relative abundances of that compound were compared in the different vetiver essential oil origins, highlighting outliers in the Indonesian samples (Figure 10).
The same strategy was then applied to highlight the differences between samples of the same group, as the observation of the outliers made in the Indonesia group (Figure 11).
Figure 9. Identification of β-vetivone m/z = 219.1760 Da and RT = 11.25 min with Progenesis Metascope and Robertet in-house database.
Figure 10. Relative abundances of β-vetivone compounds in the three geographical origins of the samples – Analysis performed with UPC² in positive ionization, at high and low voltage (purple = Haiti, orange = Paraguay, green = Indonesia).
Figure 11. On the left PLS-DA score plots from the comparison between Haiti, Paraguay, and Indonesia groups, highlighting outliers within the Indonesian group (clusters A and B). On the right: corresponding OPLS-DA resulting from the comparison between the two clusters A and B within Indonesia groups.
A
A
B B
OutliersIndonesia
[ APPLICATION NOTE ]
7Essential Oil Metabolomic Profiling with HRMS and a Variety of Complementary Ionization Techniques
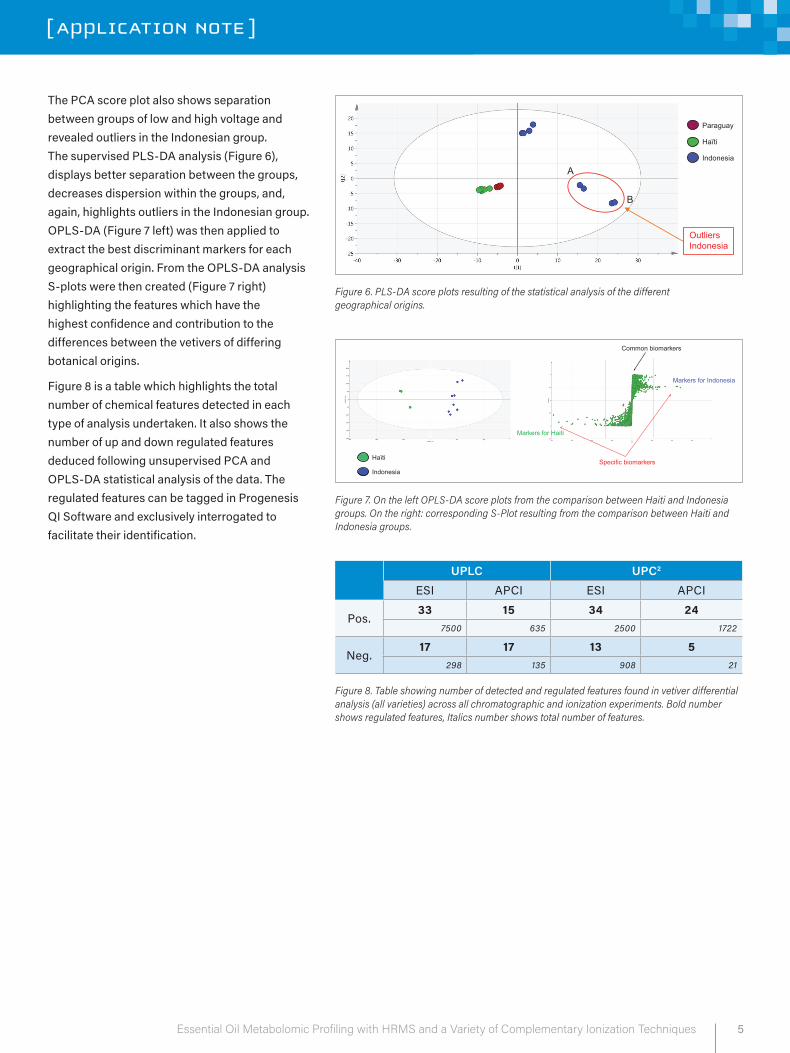
Figure 12. HCA comparison on the two clusters A and B from Indonesian group.
Figure 13. Progenesis QI browser window showing identification with Metascope of ricinoleIc acid.
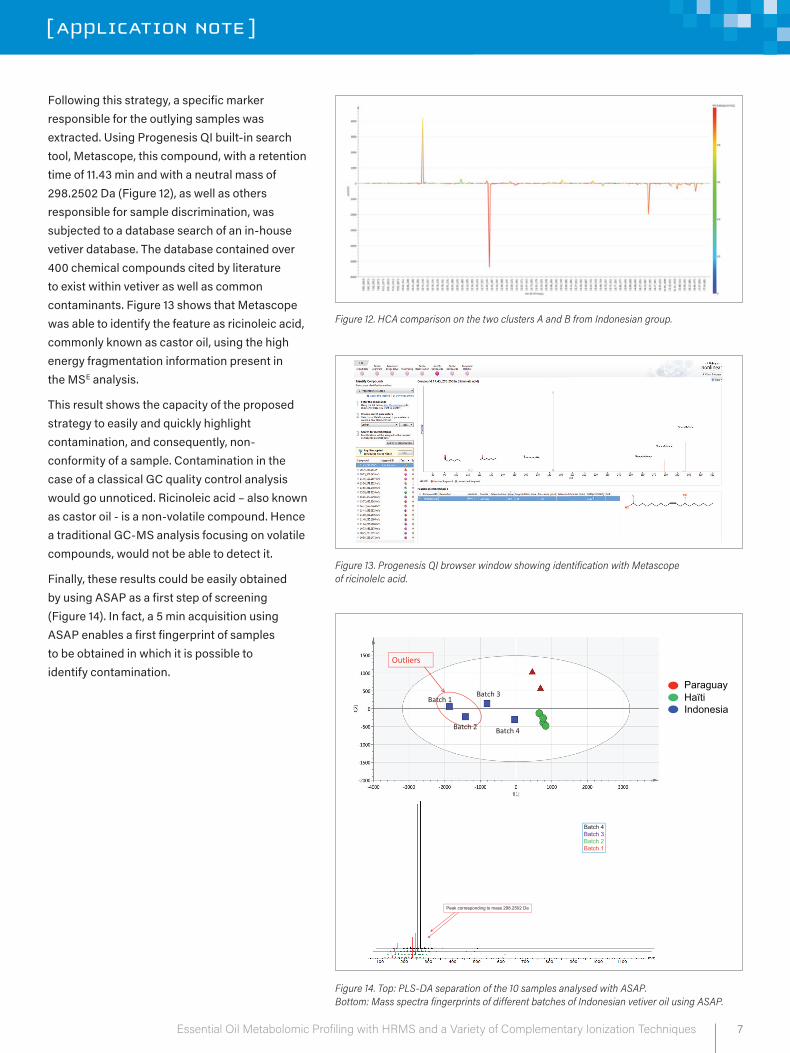
Figure 14. Top: PLS-DA separation of the 10 samples analysed with ASAP. Bottom: Mass spectra fingerprints of different batches of Indonesian vetiver oil using ASAP.
Following this strategy, a specific marker responsible for the outlying samples was extracted. Using Progenesis QI built-in search tool, Metascope, this compound, with a retention time of 11.43 min and with a neutral mass of 298.2502 Da (Figure 12), as well as others responsible for sample discrimination, was subjected to a database search of an in-house vetiver database. The database contained over 400 chemical compounds cited by literature to exist within vetiver as well as common contaminants. Figure 13 shows that Metascope was able to identify the feature as ricinoleic acid, commonly known as castor oil, using the high energy fragmentation information present in the MSE analysis.
This result shows the capacity of the proposed strategy to easily and quickly highlight contamination, and consequently, non-conformity of a sample. Contamination in the case of a classical GC quality control analysis would go unnoticed. Ricinoleic acid – also known as castor oil - is a non-volatile compound. Hence a traditional GC-MS analysis focusing on volatile compounds, would not be able to detect it.
Finally, these results could be easily obtained by using ASAP as a first step of screening (Figure 14). In fact, a 5 min acquisition using ASAP enables a first fingerprint of samples to be obtained in which it is possible to identify contamination.
ParaguayHaïtiIndonesia
Peak corresponding to mass 298.2502 Da
Batch 4Batch 3Batch 2Batch 1
Outliers
Batch 3
Batch 4
Batch 1
Batch 2

Waters Corporation 34 Maple Street Milford, MA 01757 U.S.A. T: 1 508 478 2000 F: 1 508 872 1990 www.waters.com
[ APPLICATION NOTE ]
Waters, The Science of What’s Possible, ACQUITY, CORTECS, MassLynx, Progenesis, TargetLynx, UPLC, UPC,2 Viridis, and Xevo are Trademarks of Waters Corporation. All other trademarks are the property of their respective owners.
©2019 Waters Corporation. Produced in the U.S.A. March 2019 720006510EN AG-PDF
CONCLUSIONS■■ The workflow employed in this study enabled the analysis of
LC-MS data generated from a multitude of analyses of vetiver essential oil in a quick and easy way.
■■ UPLC and UPC² MS techniques, in combination with advanced statistical tools provided in Progenesis QI Software, can successfully be applied in quality control and natural raw ingredient authentication.
■■ LC-MS untargeted metabolomics approach provides a wide range of information, and increases product knowledge, particularly on the non-volatile compounds of essential oils.
■■ Without using LC-MS technique to study the non-volatile compounds, the potential castor oil pollution would have been missed.
■■ It may be considered as a complementary tool for non-volatile compounds as compared to the well-established GC-MS methods for volatile compounds analysis.
References1. Belhassen, E., et al.; Volatile constituents of vetiver:
a review, Flavour Fragrance Journal, 2015, 30, 26–82.
2. Marti, G., et al.; Comprehensive profiling and marker identification in non-volatile citrus oil residues by mass spectrometry and nuclear magnetic resonance. Food Chem. 2015, 150, 235–245.
3. Mehl, F., et al.; Differentiation of lemon essential oil based on volatile and non-volatile fractions with various analytical techniques: a metabolomic approach. Food Chem. 2014, 143 (1), 325–335.
4. Farag, M., et al.; Metabolomics driven analysis of artichoke leaf and its commercial products via UHPLC-q-TOF-MS and chemometrics. Phytochemistry 2013, 95, 177–187.
5. Sidibé, L., et al.; Der Chemica Sinica, 2012, 3(5), 1276–1279.
6. Chalchat, J-L., et al.; Jeobp, 2008, 11(5), 468–475.
7. J-J, Filippi FFJ, 2014,29,137–142.
8. Champagnat, P., Journal of Essential Oil Bearings Plants.
9. Champagnat, P.; Biotechnological Systemaics and Ecology, 2008,36,68–70.
10. Champagnat, P., et al.; J. Essent. Oil Res. 2006, 18, 647–649.
11. Champagnat, P., et al.; OCL, 2006, 2–3(13),190–194.
12. Champagnat, P., et al.; Flavour and Fragrance Journal, 2007, 22, 488–493.
13. Belhassen, E., et al.; Flavour and Fragrance Journal, 2015,30,26–82.
14. http://kanaya.naist.jp/knapsack_jsp/result.jsp?sname=all&word=vetiveria