Essays in Maternal and Child Health Economics
149
Essays in Maternal and Child Health Economics Permanent link http://nrs.harvard.edu/urn-3:HUL.InstRepos:40050048 Terms of Use This article was downloaded from Harvard University’s DASH repository, and is made available under the terms and conditions applicable to Other Posted Material, as set forth at http:// nrs.harvard.edu/urn-3:HUL.InstRepos:dash.current.terms-of-use#LAA Share Your Story The Harvard community has made this article openly available. Please share how this access benefits you. Submit a story . Accessibility
Transcript of Essays in Maternal and Child Health Economics

Essays in Maternal and Child Health Economics
Permanent linkhttp://nrs.harvard.edu/urn-3:HUL.InstRepos:40050048
Terms of UseThis article was downloaded from Harvard University’s DASH repository, and is made available under the terms and conditions applicable to Other Posted Material, as set forth at http://nrs.harvard.edu/urn-3:HUL.InstRepos:dash.current.terms-of-use#LAA
Share Your StoryThe Harvard community has made this article openly available.Please share how this access benefits you. Submit a story .
Accessibility

Essays in Maternal and Child Health Economics
A dissertation presented
by
Katherine Elizabeth Donato
to
The Committee on Higher Degrees in Health Policy
in partial fulfillment of the requirements
for the degree of
Doctor of Philosophy
in the subject of
Health Policy
Harvard University
Cambridge, Massachusetts
April 2018

© 2018 Katherine Elizabeth Donato
All rights reserved.

iii
Dissertation Advisor: David Cutler Katherine Elizabeth Donato
Essays in Maternal and Child Health Economics
Abstract
Overall, this dissertation studies important issues around the early years of our lives, both
in developing and developed countries. With coauthors I first look at how maternity and
neonatal care are influenced by what else is going on while a woman is laboring in a hospital.
Analyzing a robust dataset covering a 16 year period in Philadelphia, we find that the busyness
of a labor floor – measured by the number of other women on the floor – has meaningful adverse
effects on the risks of use of interventional procedures such as cesarean sections and of adverse
maternal health outcomes. There is no association with adverse neonatal health outcomes,
suggesting that the increased use of interventional procedures may be unnecessary from a
medical perspective.
After this analysis, I turn to the first years after children are born. During this period
nutritional intake is especially important due to the lifetime consequences on cognitive
development, health, and physical development. With this motivation, I study the effects of two
randomized interventions targeting child nutritional intake in Ethiopia. In the first experiment,
with coauthors I analyze how behavioral techniques can be used to translate the development of
improved crop varieties (Quality Protein Maize, in this case) into actual behavior change and
improvements in nutritional status. Prior efforts in this space have resulted in the development
of numerous improved crop varieties that improve children’s nutritional status in controlled
settings, but little effect on children in real-world settings. We find that educating caregivers and
household heads about the importance of keeping improved crop varieties separate for their
iv
young children, combined with tools for earmarking and labeling the grain, effectively improves
a number of intermediate outcomes, including the children’s consumption of the improved crop
varieties and the caregivers’ cooking and food storage behaviors. However, there were no
meaningful improvements in the children’s nutritional status.
In the second experiment, I build on the first trial to study how small nudges grounded in
behavioral economics can be used to improve young children’s overall nutritional intake and
nutritional status. Specifically, I build on the finding during the first trial that caregivers were
often unaware of or unconcerned about their child’s poor nutritional status (i.e., height) and
analyze the impact of providing personalized information about the children’s nutritional status
to caregivers. Given the economic constraints of the region, I pair this with an orthogonal cash
transfer intervention, where the cash transfer is labeled as being specifically for additional food
for the young child. I find that both interventions were effective in increasing the children’s
consumption of eggs, a key underutilized source of protein in the context. However, the cash
transfer was generally more effective in terms of effect size and diversity of impacts (i.e.,
relevant outcomes other than egg consumption). Both interventions led to improvements in the
children’s sex- and gender-standardized weight.
v
Table of contents
Chapter 1: The impact of overlapping patients on intervention rates, maternal and neonatal
morbidity in childbirth ………………………………………………………….………….. page 1
Chapter 2: Behavioral nudges toward increased consumption of improved maize by young
children: a cluster randomized experiment in Ethiopia …………………………………... page 22
Chapter 3: Personalized information and labeled cash transfers to improve child nutrition:
evidence from a randomized controlled trial in Ethiopia ………………………………… page 53
Supplementary materials …………………………………………………………..……. Page 103

1
Chapter 1: The impact of overlapping patients on intervention rates, maternal and
neonatal morbidity in childbirth
Authors: Katherine Donato, Jessica Cohen, David Cutler, Margaret McConnell, Avery Plough,
and Neel Shah
Abstract
Importance: Hospital labor and delivery units can experience large fluctuations in busyness due
to rapid turn-over in patient census. When there is a high number of overlapping patients, staff
and other safety-critical resources are less available. The relationship between short-term
increases in busyness and patient safety is understudied.
Objective: To investigate the impact of overlapping patients on the labor floor on intervention
rates, maternal and neonatal morbidity.
Design: Cross-sectional regression analysis of birth certificate records linked with hospital
inpatient claims for mothers and babies, controlling for the mother’s demographics and
comorbidities, and using month, year, and facility fixed effects.
Setting: All hospitals providing obstetric care in Philadelphia, Pennsylvania between 1995 and
2010.
2
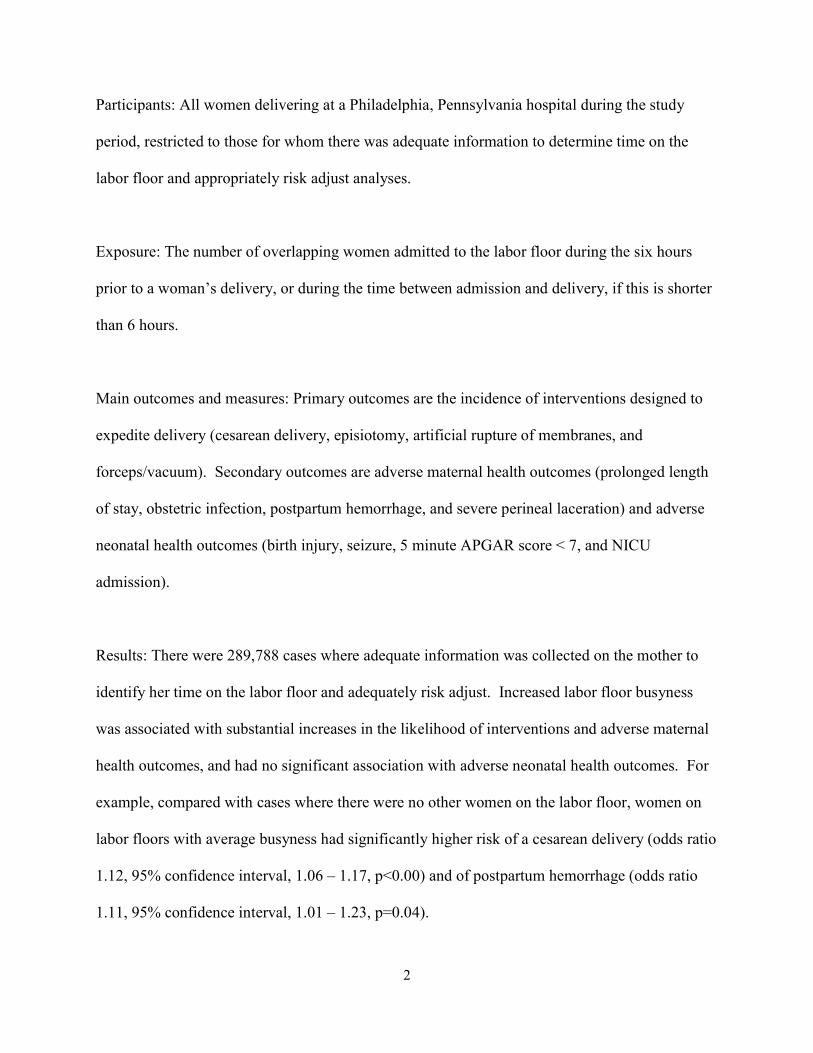
Participants: All women delivering at a Philadelphia, Pennsylvania hospital during the study
period, restricted to those for whom there was adequate information to determine time on the
labor floor and appropriately risk adjust analyses.
Exposure: The number of overlapping women admitted to the labor floor during the six hours
prior to a woman’s delivery, or during the time between admission and delivery, if this is shorter
than 6 hours.
Main outcomes and measures: Primary outcomes are the incidence of interventions designed to
expedite delivery (cesarean delivery, episiotomy, artificial rupture of membranes, and
forceps/vacuum). Secondary outcomes are adverse maternal health outcomes (prolonged length
of stay, obstetric infection, postpartum hemorrhage, and severe perineal laceration) and adverse
neonatal health outcomes (birth injury, seizure, 5 minute APGAR score < 7, and NICU
admission).
Results: There were 289,788 cases where adequate information was collected on the mother to
identify her time on the labor floor and adequately risk adjust. Increased labor floor busyness
was associated with substantial increases in the likelihood of interventions and adverse maternal
health outcomes, and had no significant association with adverse neonatal health outcomes. For
example, compared with cases where there were no other women on the labor floor, women on
labor floors with average busyness had significantly higher risk of a cesarean delivery (odds ratio
1.12, 95% confidence interval, 1.06 – 1.17, p<0.00) and of postpartum hemorrhage (odds ratio
1.11, 95% confidence interval, 1.01 – 1.23, p=0.04).

3
Conclusions and relevance: Increases in short-term busyness are associated with significant risk
to maternal safety. Future research should investigate whether earlier recruitment of staff, beds,
and other safety-critical resources can reduce harm.
4
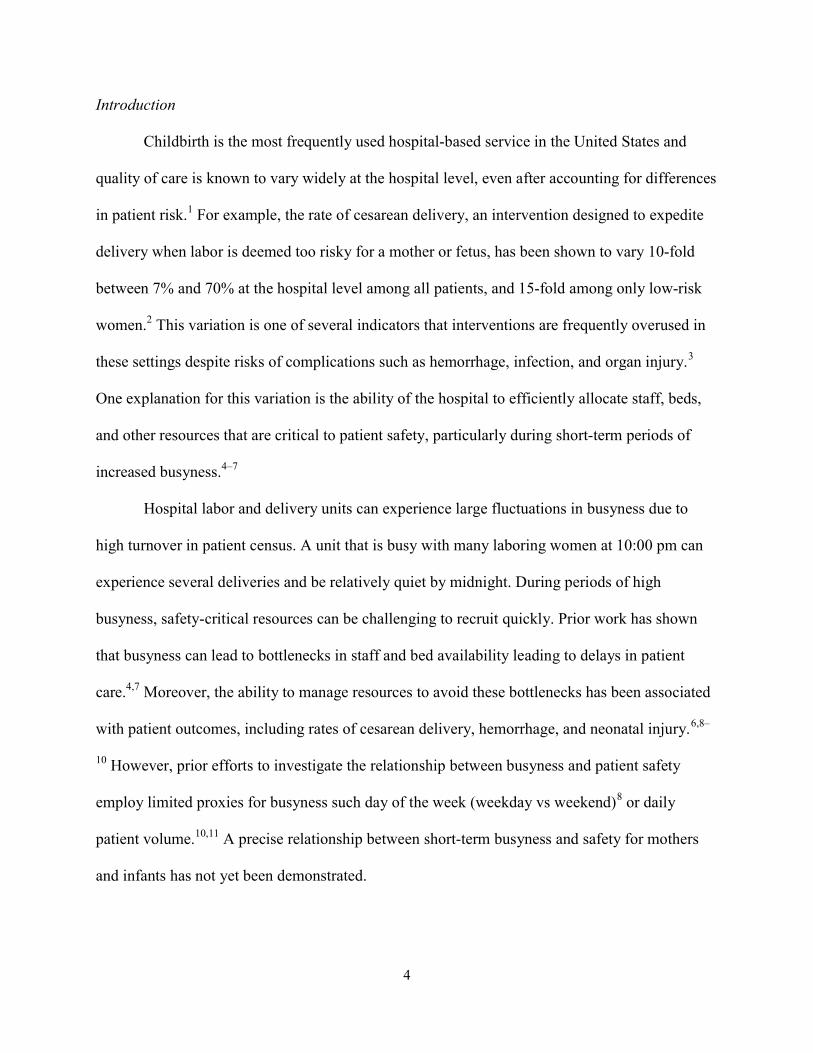
Introduction
Childbirth is the most frequently used hospital-based service in the United States and
quality of care is known to vary widely at the hospital level, even after accounting for differences
in patient risk.1 For example, the rate of cesarean delivery, an intervention designed to expedite
delivery when labor is deemed too risky for a mother or fetus, has been shown to vary 10-fold
between 7% and 70% at the hospital level among all patients, and 15-fold among only low-risk
women.2 This variation is one of several indicators that interventions are frequently overused in
these settings despite risks of complications such as hemorrhage, infection, and organ injury.3
One explanation for this variation is the ability of the hospital to efficiently allocate staff, beds,
and other resources that are critical to patient safety, particularly during short-term periods of
increased busyness.4–7
Hospital labor and delivery units can experience large fluctuations in busyness due to
high turnover in patient census. A unit that is busy with many laboring women at 10:00 pm can
experience several deliveries and be relatively quiet by midnight. During periods of high
busyness, safety-critical resources can be challenging to recruit quickly. Prior work has shown
that busyness can lead to bottlenecks in staff and bed availability leading to delays in patient
care.4,7 Moreover, the ability to manage resources to avoid these bottlenecks has been associated
with patient outcomes, including rates of cesarean delivery, hemorrhage, and neonatal injury.6,8–
10 However, prior efforts to investigate the relationship between busyness and patient safety
employ limited proxies for busyness such day of the week (weekday vs weekend)8 or daily
patient volume.10,11 A precise relationship between short-term busyness and safety for mothers
and infants has not yet been demonstrated.
5
Recently, busyness has been examined with greater precision in surgery. The challenge of
“overlapping” surgeries, a circumstance when the same surgeon oversees more than one
simultaneous operation, has emerged as a significant risk factor for postoperative complications,
including infection, revision, and dislocation within one year of hip surgery.12 These findings are
consistent with prior studies of busyness in a broad range of clinical contexts, including in
emergency departments13 and intensive care units14.
Rather than relying on limited proxies for estimating busyness, we identify all patients
that are simultaneously admitted to a labor and delivery unit. This identification allows us to
more precisely measure “unpredictable” busyness in terms of overlapping patients. On these
units, busyness creates an incentive to decrease clinical workload and relieve strained resources
by using procedures that expedite delivery of the baby. We hypothesize that increased labor floor
busyness may increase the use of these procedures. Due to the risks of overutilization, we
additionally explore the impact of busyness on adverse maternal and neonatal outcomes.
Methods
We performed a retrospective analysis of deliveries in Philadelphia between 1995 and
2010 using three primary data sources: (1) birth certificate records, (2) medical claims records
associated with obstetric deliveries for mothers, and (3) medical claims records associated with
obstetric deliveries for neonates. The birth certificate records are maintained by the
Pennsylvania Department of Health’s Bureau of Health Statistics and Research and the claims
records are maintained by the Pennsylvania Health Care Cost Containment Council (PHC4). The
accuracy and validity of these datasets are verified by these relevant agencies.
We identified medical claims for mothers and neonates that were associated with
deliveries using a previously established, enhanced identification method that relies on delivery-

6
related ICD-9 codes and DRGs and is less likely to omit cases with severe complications
(specific codes are detailed in the supplementary materials).15 PHC4 merged the birth certificate
records with the maternal and neonatal delivery-related medical claims databases by (1)
matching on the mother’s social security number and date of birth, available in both the birth
certificate and claims databases, and (2) confirming that the birth certificate neonate date of birth
was between the hospital admission and discharge dates, as recorded on the medical claims.
Using the dataset of merged maternal claims and birth certificate records, we first
identified all cases with adequate information to determine the specific start and end times when
the mother was on the labor floor (i.e., when she was admitted and when she delivered). To
determine times on the labor floor, we used the date and time of birth from the birth certificate
records, and the mother’s length of stay (days) and hour and day of the week of admission from
the medical claims records. Because the claims records do not include the date of admission
(only day of the week), we excluded all cases where the mother’s length of stay was 7 days or
more since we then could not identify when in the hospital stay the admission specifically
occurred (e.g., in a subset of cases there was information such as: length of stay: 10 days;
admission day: Wednesday; delivery date: Friday, January 15, where it would not be possible to
infer whether the admission occurred on Wednesday, January 6 or Wednesday, January 13).
Using these cases where there was adequate information to determine time on the labor floor, we
formed a 16-year census for all labor units in Philadelphia, allowing us to identify how many
women were on each labor floor at any given time between January 1995 and December 2010,
excluding the subset of cases where the mother had an unusually long length of stay.
We constructed two samples for this analysis: (1) the full sample of all mother-neonate
cases where there was adequate information in the claims and birth certificate records to
7
determine times on the labor floor (described above) and for whom we have adequate
information to properly risk adjust (covariates are described below and in the supplementary
materials), and (2) a subset of this full sample that is identified as “low risk” for a cesarean prior
to delivery, as defined by AHRQ’s Inpatient Quality Indicator #33, which excludes all cases with
abnormal presentation, preterm, fetal death, or multiple gestation diagnosis codes, breech
procedure codes, or a previous cesarean. While originally defined based on risk for a cesarean,
this subset has been used in analyses of a range of maternity care outcomes.16–18
The primary outcomes of these analyses were the incidence of interventions designed to
expedite delivery of the neonate (cesarean delivery, episiotomy, artificial rupture of membranes,
and forceps/vacuum). The secondary outcomes were the incidence of adverse maternal health
outcomes (prolonged length of stay, obstetric infection, postpartum hemorrhage, and severe
perineal laceration) and adverse neonatal health outcomes (birth injury, seizure, 5 minute
APGAR score < 7, and NICU admission). We chose these outcomes because they are commonly
audited and reported for hospital quality assurance. As a falsification test, we additionally
analyzed low birth weight, an outcome that would not be influenced by care at the time of
delivery.
The exposure in this study is busyness, measured by the number of other “overlapping”
women who were also admitted to the labor unit prior to delivery, while the index woman was
admitted as well. We focused only on overlaps in the six hours prior to birth rather than the
entire time the woman is on the labor floor in order to: (1) minimize potential for confounding,
given that the total time between admission and delivery is positively correlated with both risk of
complications and the number of overlapping women, and (2) provide a focused window that is
likely to include the full duration of the second stage of labor (the period between full dilation of

8
the cervix and delivery) for most women. During this period, nurses are generally required to be
staffed one-to-one with patients and staffing resources are most strained. In cases where the
woman’ s time between admission and delivery was less than six hours, we focus only on the
window of time that she was on the labor floor.
We used multivariable logistic regression models to evaluate the association between
labor floor busyness and outcomes, controlling for maternal demographic characteristics and
comorbidities that have previously been found relevant when evaluating the risk of interventions
during labor and of adverse health outcomes.19,16–18 Specifically, we included as controls in all
reported specifications the mother’s age; mother’s race; payer/insurer; abnormal indications
(diagnosis of abnormal presentation, preterm, fetal death, or multiple gestation); breech
procedures; and previous cesarean. In addition to mother-specific controls, to further minimize
potential confounding we included fixed effects for the facility, year, and month of birth. By
including these fixed effects we are identifying off of variation in busyness within each facility
within each month-year over the 16-year study period. In other words, the results from these
analyses are not driven by facility-specific factors or time trends. Given that there may be non-
linearity in the relationship between busyness (measured through number of overlapping women)
and the analyzed outcomes, we separately included each number of overlapping women in the
six hours prior to birth in the logistic regressions. As a result, the odds ratios associated with
each number of overlapping women are interpreted compared to the base case of zero
overlapping women (i.e., when the index case is alone on the labor floor). We used statistical
software (Stata, version 14; StataCorp) for data management and analyses.
This study was approved by the Harvard University Committee on the Use of Human
Subjects (IRB15-3616) under expedited review, as well as by the relevant Pennsylvania agencies
9
(the Pennsylvania Health Care Cost Containment Council and the Pennsylvania Department of
Health’s Bureau of Health Statistics and Research).
Results
There were 358,452 delivery-related maternal claims records over the 16-year study
period in Philadelphia. Of these PHC4 successfully matched 317,952 (88.7%) to the birth
certificate records. Just under half of the unmatched cases, 16,477 (4.6% of the claims), were
unmatched due to invalid social security numbers. Working from the 317,952 cases that were
successfully matched, 290,169 (91.3%) had adequate information to determine the mother’s time
and date of admission and delivery (i.e., at what times the woman would be counted in the labor
floor census), and 289,788 cases (99.9%) of these cases had adequate information for risk-
adjustment and were used in the final analytical sample. Of this sample, 221,948 (76.6%)
qualified as “low risk”.
On the neonate side, there were 356,383 newborn discharge claims records over the study
period. Of these, PHC4 successfully matched 274,879 (77.1%) to the birth certificate records.
Most of the unmatched cases were due to an inability to identify the correct matching birth
certificate, though 12,998 (3.6% of the claims) were not attempted due to multiple births (e.g.,
twins). Of the 274,879 successfully matched cases, 230,956 (84.0%) were successfully matched
with a maternal record with adequate information to determine times on the labor floor, and
228,441 (98.9%) of these had adequate risk adjustment information to be included in the main
analyses. Of this sample, 177,008 (77.5%) qualified as “low risk”.
Overall, there was an average of four additional overlapping women on the labor floor in
the six hours prior to delivery for the index woman (i.e., five women in total). The full
distribution of the number of overlapping women in the six hours prior to birth is shown in the
10
supplementary materials (Figure 1). The distribution is right skewed; the median is 3 overlaps
and the 90th percentile is 8 overlaps.
Key demographic and clinical characteristics are similar across different degrees of
exposure to busyness (Table 1). Women across the groups averaged about 26 years old; the most
common racial groups were “Black alone” (44.0%) and “White alone” (29.0%); and the most
common payers were Medicaid (47.5%), Blue Cross (24.0%), and a commercial employer
(20.8%). Most women did not have any of the three “high risk” characteristics of abnormal
indications, breech procedures, or a previous cesarean. On average, the group had an average
cesarean section rate of 25.1%, ranging from 22.0% in the group with 0-1 overlapping women to
28.9% in the group with 6 or more overlapping women.
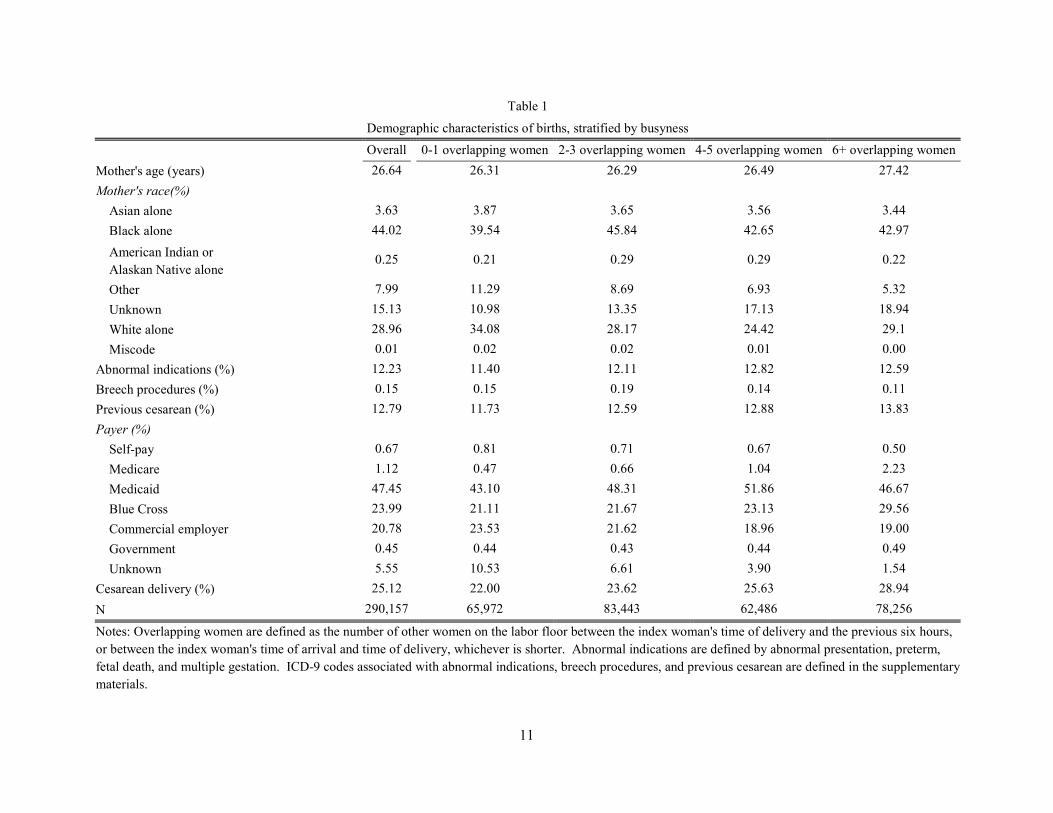
The degree of busyness on the labor floor was significantly associated with an increased
likelihood of interventions. Figure 1 shows the odds ratios, with 95% confidence intervals, of
cesarean delivery, episiotomy, artificial rupture of membranes, and forceps/vacuum for each
number of overlapping women, compared with 0 overlaps (i.e., when the mother is the only one
on the labor floor in the six hours prior to delivery or time between admission and delivery, if
this time is less than 6 hours) and controlling for patient characteristics and the facility, month,
and year. Women on labor floors with average busyness had a significantly higher risk of a
cesarean delivery (odds ratio 1.12, 95% confidence interval 1.06 – 1.17, p<0.00), episiotomy
(odds ratio 1.18, 95% confidence interval 1.12 – 1.25, p<0.00), artificial rupture of membranes
(odds ratio 1.06, 95% confidence interval 1.00 – 1.12 , p=0.04), and use of forceps or vacuum
(odds ratio 1.36, 95% confidence interval 1.27 – 1.45, p<0.00). Reaching the 90th percentile of
busyness (8 overlapping women) was associated with higher risks of interventional procedures
11
Table 1
Demographic characteristics of births, stratified by busyness
Overall
0-1 overlapping women 2-3 overlapping women 4-5 overlapping women 6+ overlapping women
Mother's age (years) 26.64
26.31 26.29 26.49 27.42
Mother's race(%)
Asian alone 3.63
3.87 3.65 3.56 3.44
Black alone 44.02
39.54 45.84 42.65 42.97
American Indian or Alaskan Native alone
0.25
0.21 0.29 0.29 0.22
Other 7.99
11.29 8.69 6.93 5.32
Unknown 15.13
10.98 13.35 17.13 18.94
White alone 28.96
34.08 28.17 24.42 29.1
Miscode 0.01
0.02 0.02 0.01 0.00
Abnormal indications (%) 12.23
11.40 12.11 12.82 12.59
Breech procedures (%) 0.15
0.15 0.19 0.14 0.11
Previous cesarean (%) 12.79
11.73 12.59 12.88 13.83
Payer (%)
Self-pay 0.67
0.81 0.71 0.67 0.50
Medicare 1.12
0.47 0.66 1.04 2.23
Medicaid 47.45
43.10 48.31 51.86 46.67
Blue Cross 23.99
21.11 21.67 23.13 29.56
Commercial employer 20.78
23.53 21.62 18.96 19.00
Government 0.45
0.44 0.43 0.44 0.49
Unknown 5.55
10.53 6.61 3.90 1.54
Cesarean delivery (%) 25.12
22.00 23.62 25.63 28.94
N 290,157 65,972 83,443 62,486 78,256
Notes: Overlapping women are defined as the number of other women on the labor floor between the index woman's time of delivery and the previous six hours, or between the index woman's time of arrival and time of delivery, whichever is shorter. Abnormal indications are defined by abnormal presentation, preterm, fetal death, and multiple gestation. ICD-9 codes associated with abnormal indications, breech procedures, and previous cesarean are defined in the supplementary materials.
12
Notes: the odds ratios comparing each number of overlapping women, in the six hours prior to
birth, to zero overlapping women, adjusted for key covariates, are shown with 95% confidence
intervals. The dark/blue squares show the odds ratios for the full sample; the light/orange
squares show the odds ratios for the ex-ante “low risk” subsample (defined in the supplementary
materials). Outcomes and covariates are measured using claims and birth certificate data;
specific definitions are described in the supplementary materials. Analyses of episiotomy and
forceps/vacuum are restricted to cases of vaginal delivery.

13
(e.g., cesarean delivery odds ratio 1.23, 95% confidence interval 1.16 – 1.31, p<0.00). In general,
the magnitude of the relationship was slightly larger or equal for the “low risk” subgroup.
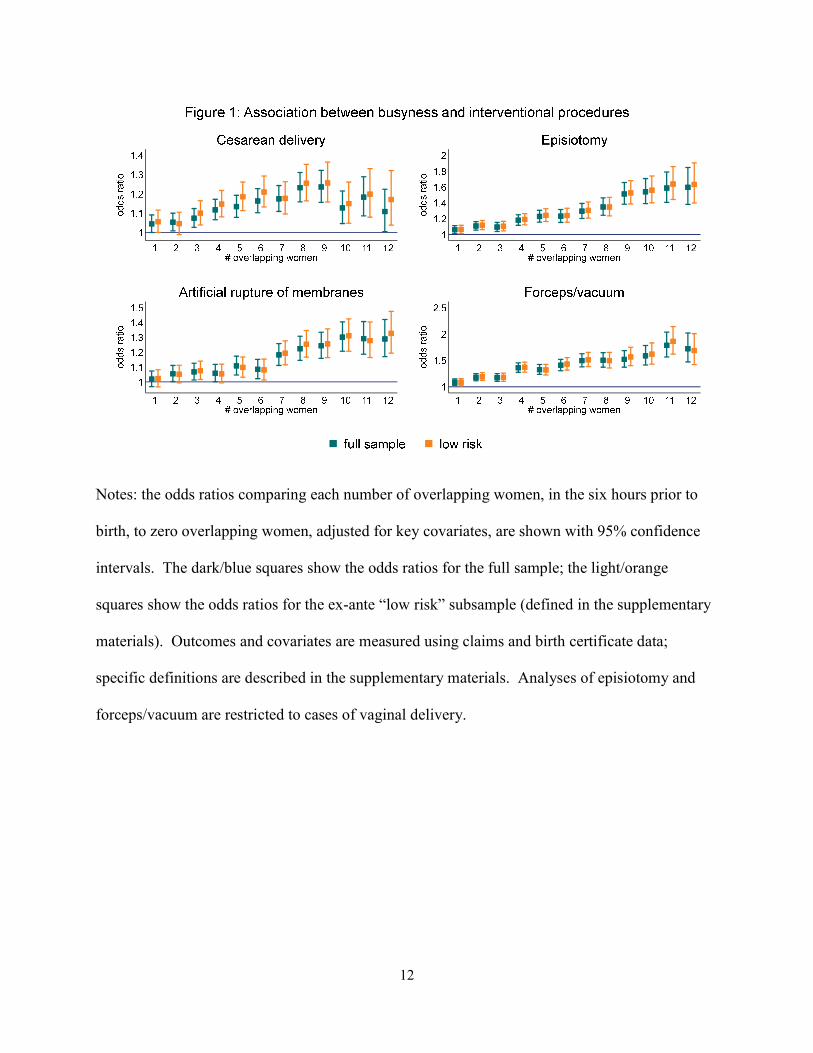
Busyness on the labor floor is also associated with worse maternal health outcomes.
Figure 2 shows that women on labor floors with average busyness had a significantly higher risk
of prolonged length of stay (odds ratio 1.35, 95% confidence interval 1.29 – 1.41, p<0.00),
obstetric infection (odds ratio 1.23, 95% confidence interval 1.13 – 1.34, p<0.00), postpartum
hemorrhage (odds ratio 1.11, 95% confidence interval 1.01 – 1.23, p=0.04), and severe perineal
laceration (odds ratio 1.12, 95% confidence interval 1.02 – 1.23, p=0.02). The magnitudes of
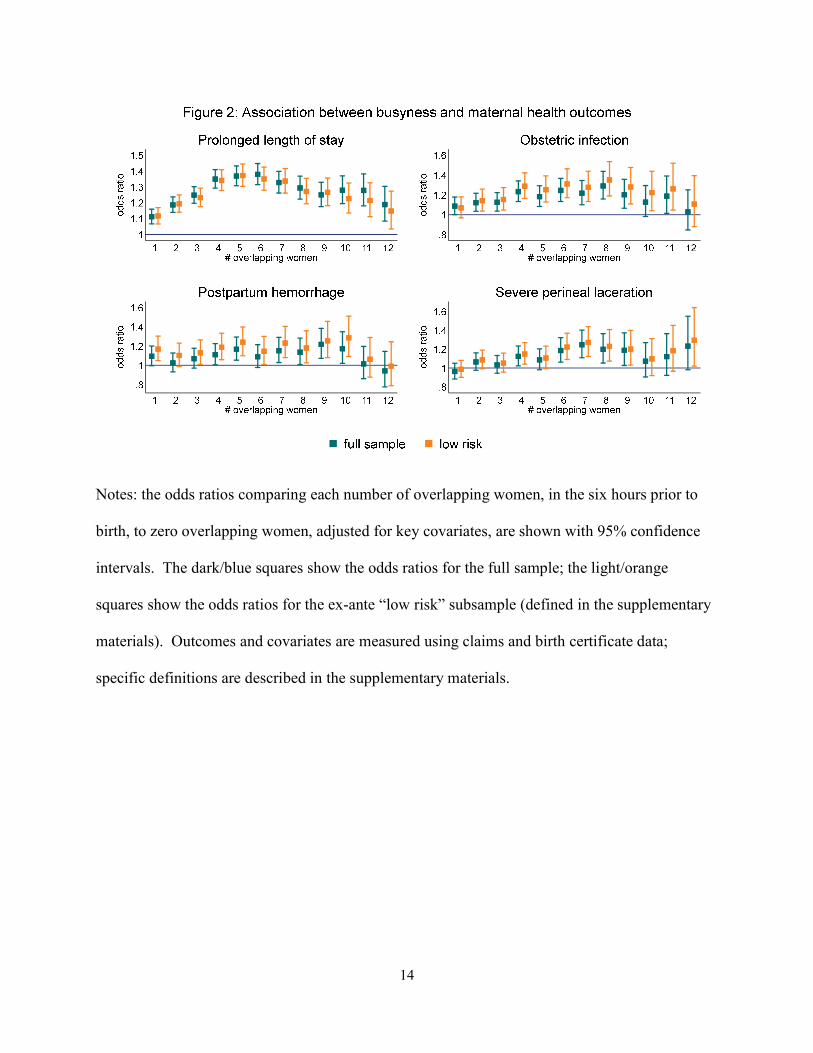
these associations are similar in the low risk subset. Conversely, Figure 3 shows there is no
consistent relationship between busyness and neonatal health outcomes; it does not appear that
neonates born during busier times are more likely to experience birth injury, seizure, 5 minute
APGAR < 7, or a NICU admission. Finally, Figure 2 in the supplementary materials shows that
there is no relationship between busyness and low birth weight.
Discussion
We show that short-term busyness on labor and delivery units is associated with a higher
risk of interventions and of adverse maternal outcomes, while having no measurable impact on
the neonate. These effects hold even while controlling for numerous maternal and facility
characteristics, as well as time trends. Our subsample analyses of low risk deliveries
demonstrate that these effects are common across a range of cases. Our falsification test,
showing no impacts on an outcome that should not be influenced by care at the time of delivery,
provides evidence of the reliability of the analytical approach.
Interventions to expedite delivery, particularly cesarean deliveries, are often performed
with the aim of protecting the neonate. However, there were no associated improvements in
14
Notes: the odds ratios comparing each number of overlapping women, in the six hours prior to
birth, to zero overlapping women, adjusted for key covariates, are shown with 95% confidence
intervals. The dark/blue squares show the odds ratios for the full sample; the light/orange
squares show the odds ratios for the ex-ante “low risk” subsample (defined in the supplementary
materials). Outcomes and covariates are measured using claims and birth certificate data;
specific definitions are described in the supplementary materials.
15
Notes: the odds ratios comparing each number of overlapping women, in the six hours prior to
birth, to zero overlapping women, adjusted for key covariates, are shown with 95% confidence
intervals. The dark/blue squares show the odds ratios for the full sample; the light/orange
squares show the odds ratios for the ex-ante “low risk” subsample (defined in the supplementary
materials). Outcomes and covariates are measured using claims and birth certificate data;
specific definitions are described in the supplementary materials.

16
neonatal morbidity, suggesting that increases in cesareans and other childbirth interventions that
are inherently risky to the mother were not offset by reductions in rates of adverse neonatal
outcomes.
A number of past studies have attempted to analyze the impact of busyness on patient
care, including in the context of maternity care where significant fluctuations in the patient
census are common.19,11,10 These studies’ findings have been inconsistent, partially because they
have used proxy measures of busyness such as daily volume that may instead measure general
busyness that is relatively predictable and therefore relatively easy for the unit to adapt to. By
leveraging a novel identification strategy and a robust dataset combining multiple administrative
records, we were able to measure this relationship with greater precision.
There are multiple potential underlying mechanisms that could explain our findings. It
could be that providers consciously make a decision to perform a cesarean during times of high
patient census to free up a labor floor bed. Alternatively, it could be that providers make
different decisions under cognitively overloaded conditions (e.g., assessing a marginal case as
necessary for a cesarean, or failing to note the severity of potential warning signs). It is also
plausible that differences in use of procedures and in the health outcomes we observed have
different mechanisms. For example, some effects on the use of interventions may be driven by
the need to accelerate bed turnover, while some effects on health outcomes may be driven by
provider neglect or wait times for key resources.
This study has some important limitations. First, we do not have information about what
specific management strategies were available to the hospitals to respond to short-term
fluctuations in labor floor busyness, including policies around staffing, beds, or diversion. Better
understanding of these policies would allow for a more nuanced interpretation of the findings.
17
For example, if increasing staff during busy times is not effective, other limitations such as beds
may be more relevant. Second, our sample only includes births that occurred in Philadelphia,
Pennsylvania – this allowed us to analyze a relatively long period of time across a fairly large
number of hospitals, but may also have implications for generalizability to other regions,
particularly those that are not urban with a relatively high density of hospitals. Third, our
analytical sample only included women who were admitted to the hospital for delivery.
Antepartum women who had been admitted with complications and those who went through
triage but were not admitted all contribute to the overall workload and resource strain on the
labor ward, but are not identifiable with our dataset. While this likely introduces some noise, it
is unlikely to bias these results since we include controls for the individual hospital, and policies
around admission for these cases is likely to vary by hospital. Finally, the time when women are
admitted to the labor floor is not random; in general, women are more likely to be admitted later
in their labor process to busier labor floors, though this effect most likely biases our results
downwards since the busiest times are likely underestimated by our exposure measure.
A better understanding of the specific underlying mechanisms driving our findings will
be essential for adequately responding to them. In sensitivity analyses, we found that the number
of overlapping women is more strongly associated with interventions and adverse health
outcomes than a measure of remaining beds open on the labor floor, providing suggestive
evidence that limitations in staffing resources are more important than limitations in bed
availability. Additionally, it does not appear that the relationship between busyness and adverse
maternal health outcomes is driven primarily by the increased likelihood of interventional
procedures, as controlling for the use of these procedures does not have a strong effect on the
observed relationship with adverse maternal health outcomes.

18
Conclusions
Increasing busyness on the labor floor appears to increase the risk to maternal health.
Future research should investigate the specific underlying factors driving this relationship and
investigate whether earlier recruitment of safety-critical resources can reduce harm.
Funding
This work was funded by the Agency for Healthcare Research and Quality.
19
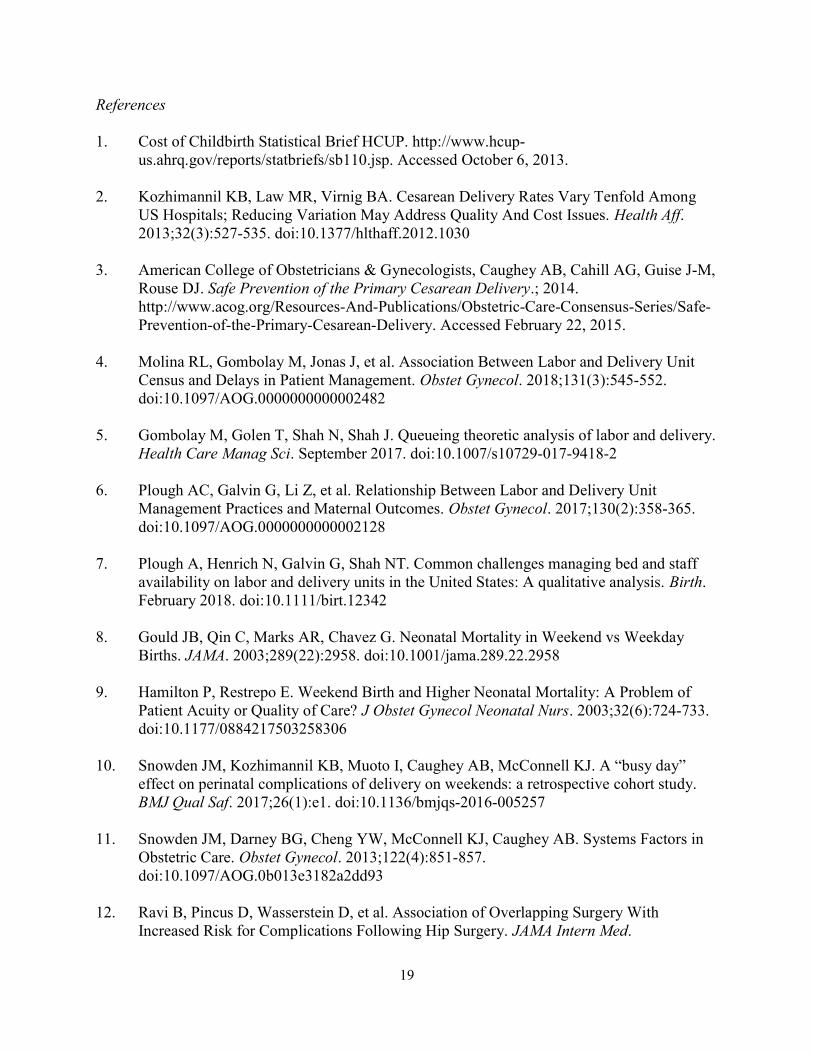
References
1. Cost of Childbirth Statistical Brief HCUP. http://www.hcup-us.ahrq.gov/reports/statbriefs/sb110.jsp. Accessed October 6, 2013.
2. Kozhimannil KB, Law MR, Virnig BA. Cesarean Delivery Rates Vary Tenfold Among
US Hospitals; Reducing Variation May Address Quality And Cost Issues. Health Aff. 2013;32(3):527-535. doi:10.1377/hlthaff.2012.1030
3. American College of Obstetricians & Gynecologists, Caughey AB, Cahill AG, Guise J-M,
Rouse DJ. Safe Prevention of the Primary Cesarean Delivery.; 2014. http://www.acog.org/Resources-And-Publications/Obstetric-Care-Consensus-Series/Safe-Prevention-of-the-Primary-Cesarean-Delivery. Accessed February 22, 2015.
4. Molina RL, Gombolay M, Jonas J, et al. Association Between Labor and Delivery Unit
Census and Delays in Patient Management. Obstet Gynecol. 2018;131(3):545-552. doi:10.1097/AOG.0000000000002482
5. Gombolay M, Golen T, Shah N, Shah J. Queueing theoretic analysis of labor and delivery.
Health Care Manag Sci. September 2017. doi:10.1007/s10729-017-9418-2 6. Plough AC, Galvin G, Li Z, et al. Relationship Between Labor and Delivery Unit
Management Practices and Maternal Outcomes. Obstet Gynecol. 2017;130(2):358-365. doi:10.1097/AOG.0000000000002128
7. Plough A, Henrich N, Galvin G, Shah NT. Common challenges managing bed and staff
availability on labor and delivery units in the United States: A qualitative analysis. Birth. February 2018. doi:10.1111/birt.12342
8. Gould JB, Qin C, Marks AR, Chavez G. Neonatal Mortality in Weekend vs Weekday
Births. JAMA. 2003;289(22):2958. doi:10.1001/jama.289.22.2958 9. Hamilton P, Restrepo E. Weekend Birth and Higher Neonatal Mortality: A Problem of
Patient Acuity or Quality of Care? J Obstet Gynecol Neonatal Nurs. 2003;32(6):724-733. doi:10.1177/0884217503258306
10. Snowden JM, Kozhimannil KB, Muoto I, Caughey AB, McConnell KJ. A “busy day”
effect on perinatal complications of delivery on weekends: a retrospective cohort study. BMJ Qual Saf. 2017;26(1):e1. doi:10.1136/bmjqs-2016-005257
11. Snowden JM, Darney BG, Cheng YW, McConnell KJ, Caughey AB. Systems Factors in
Obstetric Care. Obstet Gynecol. 2013;122(4):851-857. doi:10.1097/AOG.0b013e3182a2dd93
12. Ravi B, Pincus D, Wasserstein D, et al. Association of Overlapping Surgery With
Increased Risk for Complications Following Hip Surgery. JAMA Intern Med.
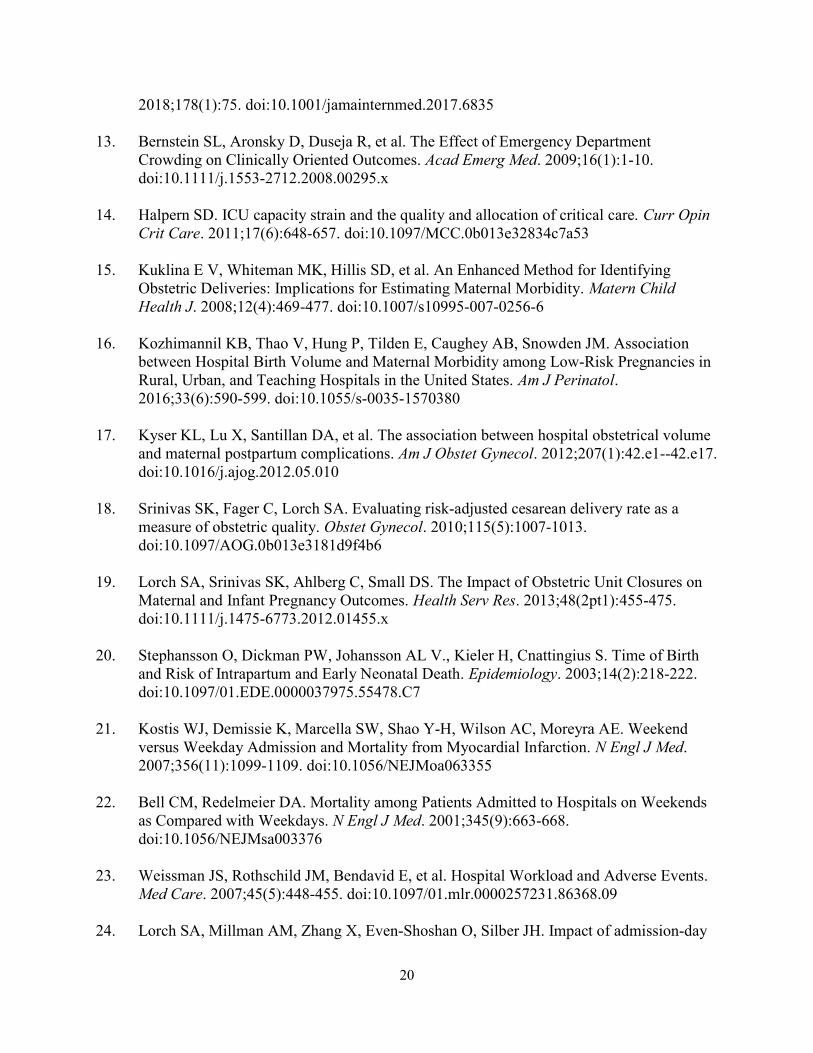
20
2018;178(1):75. doi:10.1001/jamainternmed.2017.6835 13. Bernstein SL, Aronsky D, Duseja R, et al. The Effect of Emergency Department
Crowding on Clinically Oriented Outcomes. Acad Emerg Med. 2009;16(1):1-10. doi:10.1111/j.1553-2712.2008.00295.x
14. Halpern SD. ICU capacity strain and the quality and allocation of critical care. Curr Opin
Crit Care. 2011;17(6):648-657. doi:10.1097/MCC.0b013e32834c7a53 15. Kuklina E V, Whiteman MK, Hillis SD, et al. An Enhanced Method for Identifying
Obstetric Deliveries: Implications for Estimating Maternal Morbidity. Matern Child Health J. 2008;12(4):469-477. doi:10.1007/s10995-007-0256-6
16. Kozhimannil KB, Thao V, Hung P, Tilden E, Caughey AB, Snowden JM. Association
between Hospital Birth Volume and Maternal Morbidity among Low-Risk Pregnancies in Rural, Urban, and Teaching Hospitals in the United States. Am J Perinatol. 2016;33(6):590-599. doi:10.1055/s-0035-1570380
17. Kyser KL, Lu X, Santillan DA, et al. The association between hospital obstetrical volume
and maternal postpartum complications. Am J Obstet Gynecol. 2012;207(1):42.e1--42.e17. doi:10.1016/j.ajog.2012.05.010
18. Srinivas SK, Fager C, Lorch SA. Evaluating risk-adjusted cesarean delivery rate as a
measure of obstetric quality. Obstet Gynecol. 2010;115(5):1007-1013. doi:10.1097/AOG.0b013e3181d9f4b6
19. Lorch SA, Srinivas SK, Ahlberg C, Small DS. The Impact of Obstetric Unit Closures on
Maternal and Infant Pregnancy Outcomes. Health Serv Res. 2013;48(2pt1):455-475. doi:10.1111/j.1475-6773.2012.01455.x
20. Stephansson O, Dickman PW, Johansson AL V., Kieler H, Cnattingius S. Time of Birth
and Risk of Intrapartum and Early Neonatal Death. Epidemiology. 2003;14(2):218-222. doi:10.1097/01.EDE.0000037975.55478.C7
21. Kostis WJ, Demissie K, Marcella SW, Shao Y-H, Wilson AC, Moreyra AE. Weekend
versus Weekday Admission and Mortality from Myocardial Infarction. N Engl J Med. 2007;356(11):1099-1109. doi:10.1056/NEJMoa063355
22. Bell CM, Redelmeier DA. Mortality among Patients Admitted to Hospitals on Weekends
as Compared with Weekdays. N Engl J Med. 2001;345(9):663-668. doi:10.1056/NEJMsa003376
23. Weissman JS, Rothschild JM, Bendavid E, et al. Hospital Workload and Adverse Events.
Med Care. 2007;45(5):448-455. doi:10.1097/01.mlr.0000257231.86368.09 24. Lorch SA, Millman AM, Zhang X, Even-Shoshan O, Silber JH. Impact of admission-day
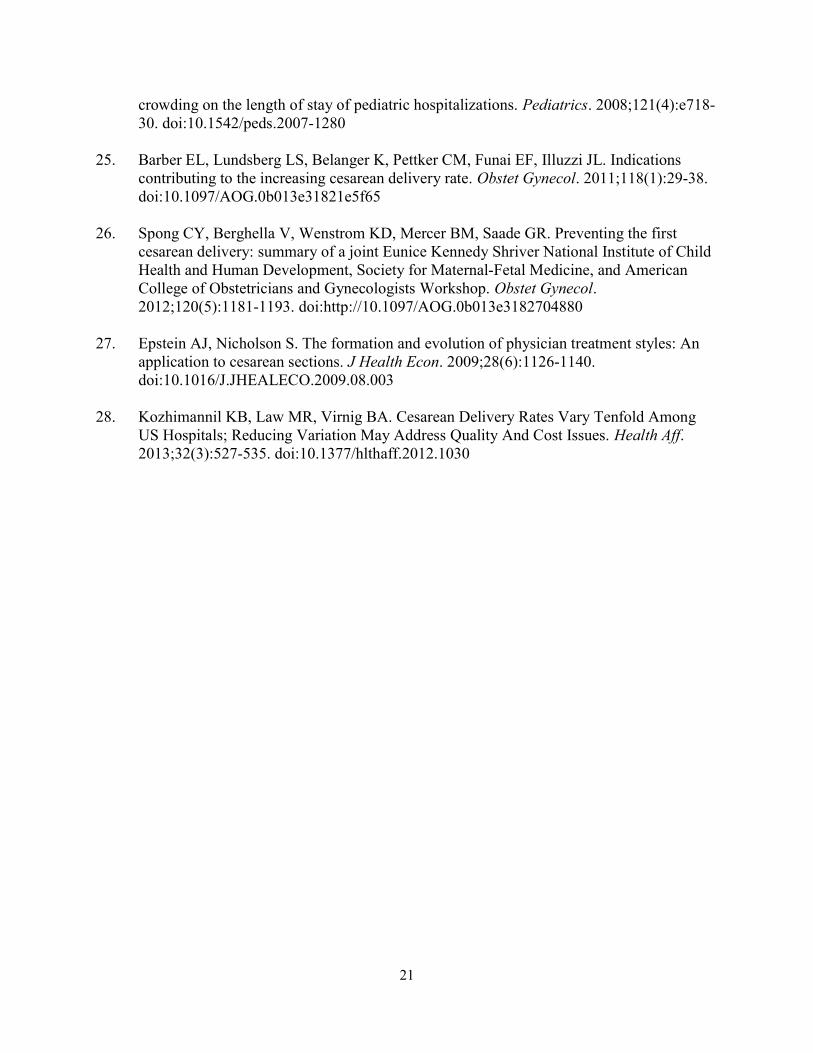
21
crowding on the length of stay of pediatric hospitalizations. Pediatrics. 2008;121(4):e718-30. doi:10.1542/peds.2007-1280
25. Barber EL, Lundsberg LS, Belanger K, Pettker CM, Funai EF, Illuzzi JL. Indications
contributing to the increasing cesarean delivery rate. Obstet Gynecol. 2011;118(1):29-38. doi:10.1097/AOG.0b013e31821e5f65
26. Spong CY, Berghella V, Wenstrom KD, Mercer BM, Saade GR. Preventing the first
cesarean delivery: summary of a joint Eunice Kennedy Shriver National Institute of Child Health and Human Development, Society for Maternal-Fetal Medicine, and American College of Obstetricians and Gynecologists Workshop. Obstet Gynecol. 2012;120(5):1181-1193. doi:http://10.1097/AOG.0b013e3182704880
27. Epstein AJ, Nicholson S. The formation and evolution of physician treatment styles: An
application to cesarean sections. J Health Econ. 2009;28(6):1126-1140. doi:10.1016/J.JHEALECO.2009.08.003
28. Kozhimannil KB, Law MR, Virnig BA. Cesarean Delivery Rates Vary Tenfold Among
US Hospitals; Reducing Variation May Address Quality And Cost Issues. Health Aff. 2013;32(3):527-535. doi:10.1377/hlthaff.2012.1030
22
Chapter 2: Behavioral nudges toward increased consumption of improved maize by young
children: a cluster randomized experiment in Ethiopia
Authors: Katherine Donato, Hugo De Groote, Nilupa Gunaratna, Masresha Tessema, Margaret
McConnell, and Jessica Cohen
Abstract
Background: Improved crop varieties have potential to improve childhood nutrition in
agricultural communities, but their introduction has not yet translated into meaningful nutritional
gains. We tested the impact of a child consumption targeting intervention package in rural
Ethiopia.
Methods: We conducted a non-blinded, cluster randomized trial in 12 rural, maize-growing
kebeles of Oromia, Ethiopia. Clusters of households were stratified by kebele and then
randomized between a basic treatment where an improved maize variety, Quality Protein Maize
(QPM), was offered (320 households, 203 clusters), and a QPM + targeting intervention focused
on increasing young children’s QPM consumption (290 households, 183 clusters). Households
were eligible if they had a child who was 6-35 months old at the time of the baseline survey in
August 2015 (the “index child”) and had chosen to plant QPM in May-June 2015, after the QPM
was offered. In the QPM + targeting clusters, household heads and caregivers for the index
children were given specific instructions about the importance of feeding QPM to the index child
and tools to help them label and earmark the grain and flour for child consumption and cook
specifically for the index child. 304 households in the QPM only group and 266 households in
the QPM + targeting group were evaluated at 6 and 10 months post intervention. The primary
23
outcomes were the index child’s QPM consumption and anthropometric measures for the index
child (weight-for-age, height-for-age, based on WHO growth standards). Secondary outcomes
included QPM storage, whether QPM had been reserved for home consumption, and cooking
specifically for the index child. Impacts were estimated using intention-to-treat analyses.
Results: The intervention package was associated with a 17 percentage point increase in the
probability of the index child consuming QPM in the previous week (95% CI 9 to 25), and an
average increase in days QPM was consumed in the past week of 0.83 days (95% CI 0.33 to
1.33). There were, however, no positive impacts on anthropometric outcomes such as height-
for-age and weight-for-age z-scores. Six months after the consumption targeting intervention
began, households that received the intervention package were more likely to store QPM
separately, increase days in the past week QPM was cooked for the index child, and
differentially increase the index child’s QPM consumption compared to the household head.
These effects were attenuated, but generally persisted, at 10 months post-intervention.
Conclusions: In settings like Ethiopia, child consumption targeting campaigns focused on
improved crop varieties that use behavioral nudges such as labeling and earmarking appear to be
effective at changing food consumption and cooking behaviors. These changes did not,
however, translate into improvements in child anthropometrics, possibly given the short time
frame of the study.
24
Introduction
Undernutrition is the underlying cause of 3.1 million child deaths each year.1 In
Ethiopia, nearly two fifths of children meet the qualifications for stunting (height-for-age z-score
below -2),2 which is associated with poor health outcomes such as reduced cognitive and motor
development.3 Malnutrition is associated with a loss of $4.7 billion each year in the country,
about 16.5% of GDP.4 In order to address the adverse consequences of malnutrition, several
international and national organizations have set ambitious targets, including a reduction by 40
percent of the number of stunted children by 2025, and ending all forms of malnutrition by
2030.5, 6
Poor dietary quality is an important cause of malnutrition, and is particularly prevalent in
Ethiopia. For example, recent data suggest that only 7% of Ethiopian children 6-23 months old
meet the requirements for the WHO’s definition of a minimum acceptable diet, a measure of the
diversity and frequency of food consumption.2 Given the importance of agriculture for much of
Ethiopia and other developing countries, improved crop varieties (e.g., with improved protein
quality) have been proposed as one means of improving children’s dietary quality and reducing
child malnutrition rates. While agronomists have successfully developed a number of these
improved crop varieties, take-up and, particularly, consumption by young children have been
low. There are several reasons for this low take-up in Ethiopia and elsewhere, including (1)
experimenting with new crop varieties is risky and difficult for households given the importance
of agricultural production for the household’s income and own consumption, (2) changing
cooking behaviors is difficult, even when there are clear benefits for some or all of the
household7, (3) much of current agricultural extension and education efforts are not directed at
women, who typically manage feeding for young children, and (4) targeting the improved
25
varieties to young children requires households to keep the improved crops separate from
conventional ones at all stages of production, harvest, post-harvest handling, storage, milling,
cooking, and consumption.
In this paper we report the results of a study designed to test behavioral techniques for
improving targeting of improved crop varieties to young children among households that have
opted to experiment with planting the new varieties. We focus on maize, which is the primary
cereal consumed by Ethiopians.8 The targeting interventions primarily consisted of the provision
of maize earmarking tools for storing and feeding that were labeled for consumption by the
household’s young children. These interventions were motivated by research in financial
contexts, which has shown that small nudges, including labeling or earmarking tools, can induce
substantial behavior changes.9, 10 The goal of this study was to estimate the impact of a package
of targeted consumption interventions on children’s consumption of the improved maize variety
and nutritional status; household cooking practices; and household storage and management of
the improved maize variety. Findings from this study will help inform future policy to drive
behavior change in nutrition interventions.
Methods
Study population and setting
The study took place in the East Wollega and Jimma zones of the Oromia region of
Ethiopia between April 2015 and June 2016. About 90% of the population in Oromia is engaged
in agriculture, and household food needs are largely met through home production. Maize has
become increasingly important both as a crop, with its share of cereal production reaching one
third11, and as a food source, with current consumption reaching 44 kg per person per year.8 The
26
quality of children’s diets in rural Ethiopia is poor; only 6% of children 6-23 months old had
diets that met the requirements for a “minimum acceptable diet”, an indicator measuring the
diversity and frequency of food consumption. Ethiopian households are organized into small
Community Health Groups, designed to facilitate interactions with the local community health
workers.
This study was based in 12 kebeles (a group of villages, the smallest administrative unit
in Ethiopia). 3 to 5 months before the study took place, Nutritious Maize for Ethiopia (NuME, a
project administered by the International Maize and Wheat Improvement Center, CIMMYT)
conducted “demonstrations” of Quality Protein Maize (QPM). QPM refers to the set of
conventionally modified (i.e., not genetically modified) maize varieties that have improved
protein quality (i.e., more available protein) while maintaining other characteristics comparable
with conventional maize varieties (e.g. agronomic, storage, and food preparation qualities).12, 13
In acceptance tests in Ethiopia and other nearby countries, consumers found QPM to be equally
appealing or superior to conventional maize on a range of dimensions, including aroma and
taste.14 In controlled trials, QPM has been shown to improve child growth, but its effectiveness
has not been shown in real-world settings.15 Demonstrations are where community members
attend events on the land of a neighbor who was selected to plant the new maize variety to learn
more about the variety from NuME representatives and observe the quality and pace of the maize
growth. Two QPM varieties were suitable for the study area and demonstrated to study
participants: AMH760Q and BHQPY545.i Prior to these demonstrations, there was little to no
exposure to QPM in the study areas. During the study, QPM seed was not available through the
market or other distribution channels.
i AMH760Q is a late-maturing, white grain and BHQPY545 is a yellow grain with intermediate maturity; both are drought tolerant.
27
Overall study timeline and sample selection
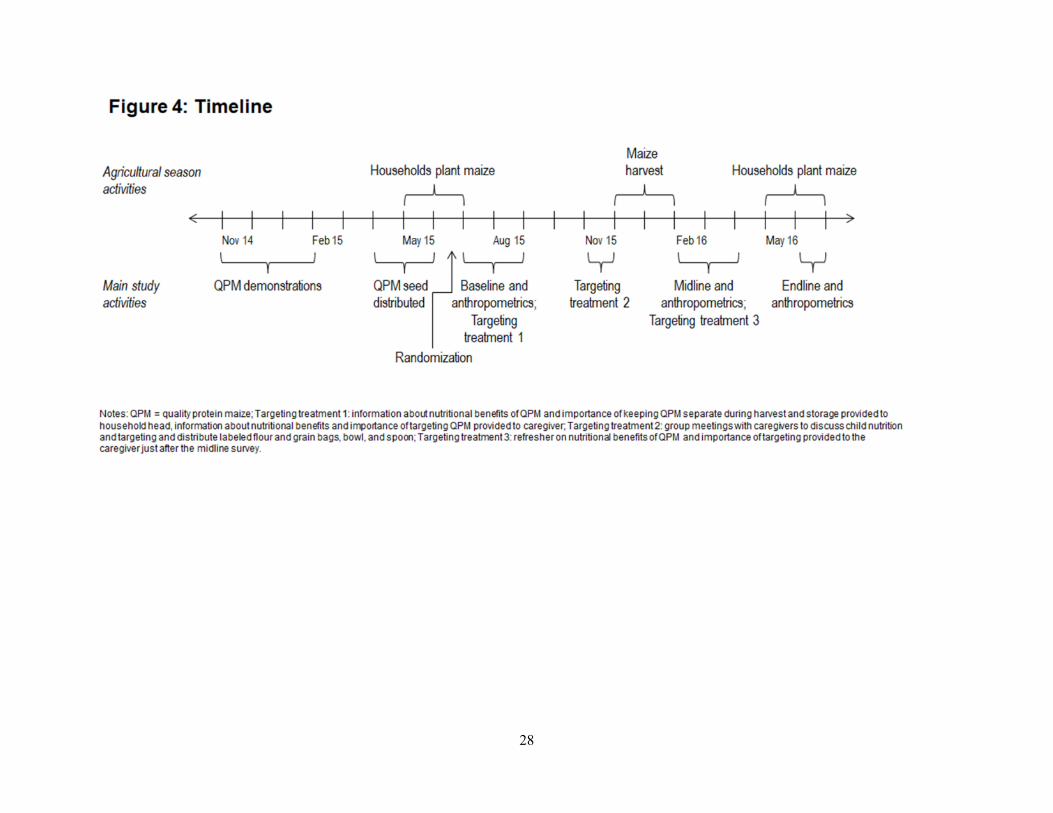
The overall timeline of the study and relevant portions of the agricultural cycle are shown
in Figure 4. There were four QPM demonstrations led by CIMMYT and Sasakawa Global 2000
between November 2014 and January 2015 in each study kebele: 1 demonstration on a Farmer
Training Center plot and 3 on local farmers’ plots. There were several field days over the course
of the season, where community members could learn more about QPM. CIMMYT and SG2000
specifically recruited women to these events, targeting 40% participation at each field day.
During these field days, CIMMYT and SG2000, with the assistance of the local DAs, described
the QPM varieties and their agronomic properties. They emphasized the importance of QPM for
young children and demonstrated how to cook different foods from QPM. Lists of households
potentially eligible for study inclusion were created by government-employed agricultural
extension workers (“Development Agents”, DAs) based on whether the households attended a
demonstration and whether the household had a child that would be 6-35 months old at the start
of data collection. These households were then randomized into a group that would be offered
QPM seed and a group that would not. The latter formed a pure control group to allow for
analysis of the impact of QPM, which will be considered in other work.
The DAs then visited the households selected to receive QPM and offered the
opportunity to order up to three 2 kilogram bags of QPM seed at no cost.i During this visit, the
DAs spoke to the male household head (and primary female caregiver for the index child, if
available) about the nutritional benefits of QPM consumption for young children. The
development agents emphasized the nutritional benefits of QPM relative to conventional maize
i Note that maize seed was typically only available in 12.5 kg bags, which often resulted in farmers sharing maize seed bags since they could not use the full 12.5 kg of seed. Prior work has shown that offering farmers the opportunity to experiment with smaller amounts of seed can increase adoption rates of new varieties. (Jack, et al. 2011. Market Inefficiencies and the adoption of agricultural technologies in developing countries. ATAI White Paper.)
28
29
varieties and explained that children are especially vulnerable to nutritional deficiencies that
QPM can help address. They also provided information about QPM planting, storage, and
preparation, which are similar to traditional maize varieties. 98% of household heads expressed
interest in ordering seed at these visits. Overall, households in the study ordered an average of
2.87 bags of QPM seed (i.e., 5.74 kg).
In order to receive the ordered seed, the household head went to a central location at a
scheduled time about three weeks later. Households were asked not to sell or share with any
other households the ordered seed. The households ordering QPM seed were prospectively
randomized into a QPM only group or a QPM + targeting group. Prospective random assignment
occurred prior to eligibility verification because the eligibility verification, baseline survey, and
initial educational messaging for the targeting intervention all occurred during the same visit. At
the time of the baseline survey, the research team visited households (July/August 2015). They
first assessed eligibility for study inclusion based on the following criteria: (1) at least one
member of the household attended a recent QPM demonstration; (2) the household had a child
who was 6-35 months old; (3) the household had land available for crop cultivation; (4) the
household had not previously grown QPM on its land; and (5) the household intended to stay in
the study area for at least one year. The study focused on food targeting for children who were 6-
35 months old at the start of data collection, the “index child”. If there was more than one child
in a household within this age range, the younger child was chosen as the index child. The study
focused on children in this age range since it excludes the period when exclusive breastfeeding is
recommended (i.e., up to 6 months) and includes a critical period when children are particularly
vulnerable to growth faltering due to inappropriate or inadequate complementary foods.
30
Eligible households were then given a baseline survey, described below, which occurred
just after the time of maize planting (July/August 2015). We then returned for a midline visit 1-3
months after the maize harvest (Feb/March 2016) and an endline visit 5-6 months after the maize
harvest (June 2016).
Treatment arms
The households randomized to receive the targeting treatment received the intervention in
3 stages: educational messaging on three separate occasions, plus several earmarking and
labeling tools during one of these visits, as described in Figure 5. The first targeting messages
were offered at the household after the baseline survey in July-August 2015 (after planting, but
prior to the harvest). During this visit, enumerators reinforced the nutritional benefits of QPM
and then discussed specific strategies that households could use in order to more effectively
target the QPM to the household’s young children. They particularly emphasized the measures
that would need to be taken around the harvest time to keep the QPM separate from the rest of
the household’s maize. Household heads were encouraged to build separate cob storage cribs, or
to partition existing storage cribs, in order to keep their QPM separate from conventional maize
while it was drying. Caregivers were informed that they would be offered tools to help keep
QPM grain and flour separate later in the fall.
The second stage of the targeting treatment occurred in November 2015, just before the
time of the maize harvest. Caregivers in the QPM + targeting group were invited to participate
in a group meeting at a nearby, central location. During this meeting enumerators used an
educational poster (supplementary materials) to re-emphasize nutritional and targeting messages
that had been presented earlier, and engaged participants in a group dialogue to help identify
ways to better target QPM to their young children (e.g., using a separate bowl to feed the child).
31
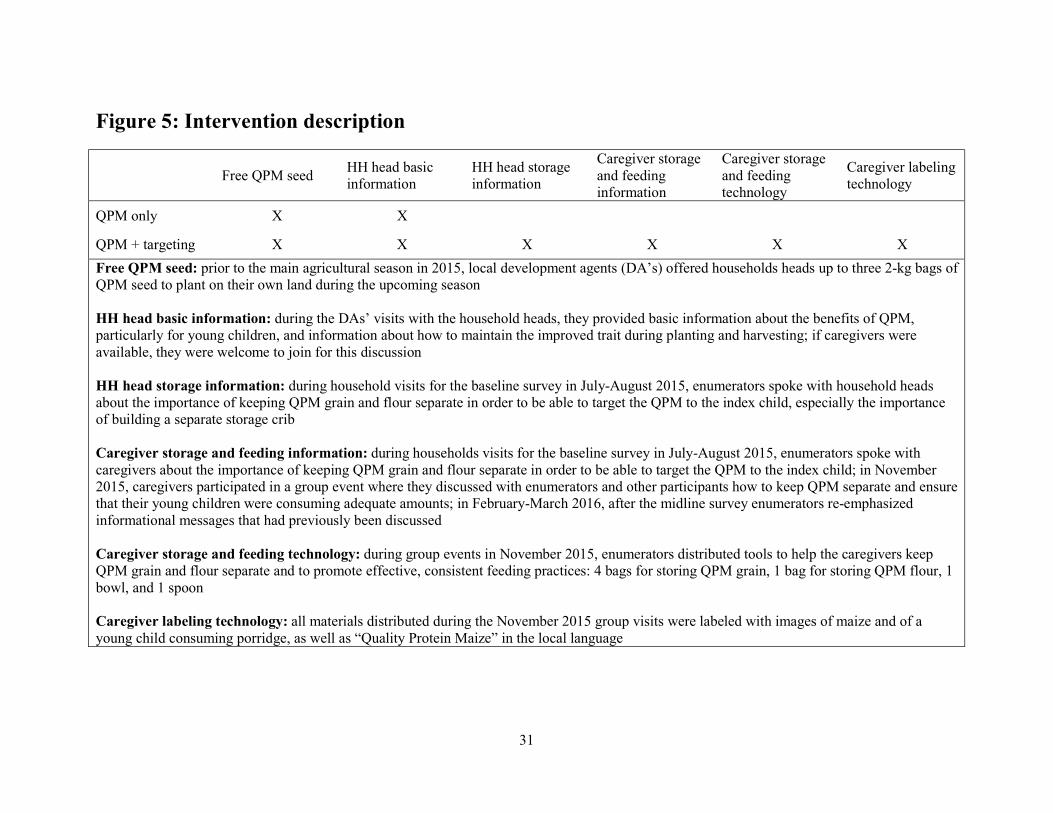
Figure 5: Intervention description
Free QPM seed HH head basic information
HH head storage information
Caregiver storage and feeding information
Caregiver storage and feeding technology
Caregiver labeling technology
QPM only X X
QPM + targeting X X X X X X
Free QPM seed: prior to the main agricultural season in 2015, local development agents (DA’s) offered households heads up to three 2-kg bags of QPM seed to plant on their own land during the upcoming season HH head basic information: during the DAs’ visits with the household heads, they provided basic information about the benefits of QPM, particularly for young children, and information about how to maintain the improved trait during planting and harvesting; if caregivers were available, they were welcome to join for this discussion HH head storage information: during household visits for the baseline survey in July-August 2015, enumerators spoke with household heads about the importance of keeping QPM grain and flour separate in order to be able to target the QPM to the index child, especially the importance of building a separate storage crib Caregiver storage and feeding information: during households visits for the baseline survey in July-August 2015, enumerators spoke with caregivers about the importance of keeping QPM grain and flour separate in order to be able to target the QPM to the index child; in November 2015, caregivers participated in a group event where they discussed with enumerators and other participants how to keep QPM separate and ensure that their young children were consuming adequate amounts; in February-March 2016, after the midline survey enumerators re-emphasized informational messages that had previously been discussed Caregiver storage and feeding technology: during group events in November 2015, enumerators distributed tools to help the caregivers keep QPM grain and flour separate and to promote effective, consistent feeding practices: 4 bags for storing QPM grain, 1 bag for storing QPM flour, 1 bowl, and 1 spoon Caregiver labeling technology: all materials distributed during the November 2015 group visits were labeled with images of maize and of a young child consuming porridge, as well as “Quality Protein Maize” in the local language
32
When participants identified aspects that might be difficult such cooking separate meals for their
young children, the enumerator facilitated a group discussion to help think of ways to make these
challenges easier for the participants to overcome. At the end of the visit, caregivers were
offered several tools to help them keep QPM grain and flour separate from other grains and
flours, and to remember to do so. Each caregiver was given 4 bags for storing grain (each
capable of holding 100 kg), 1 bag for storing flour (capable of holding 50 kg), and a bowl and
spoon. All of these items were marked with a colorful label that had a picture of an infant eating,
images of white and yellow maize, and “quality protein maize” written in the local language
(supplementary materials). Additionally, each caregiver was given a smaller version of the
educational poster used during the meeting. For cases where the caregiver could not attend the
meeting, enumerators attempted to visit the household directly to provide similar messaging and
deliver the targeting tools.
In the third and final stage of the QPM targeting intervention, the targeting messages
were re-emphasized just after the midline survey in February-March 2016 (1-3 months after
maize harvest). Enumerators reviewed a short set of the most important messages, focusing on
the benefits of QPM consumption for young children and targeting foods made with QPM to
them. The scripts for each of the three QPM targeting intervention stages are included in the
supplementary materials.
Data collection
Baseline and midline surveys were conducted with both the male household head and the
female primary caregiver. The endline survey was conducted with only the caregiver. Key
survey modules included 7-day dietary recalls for the index child and other household members,
nutrition knowledge, cooking behaviors, and QPM knowledge, storage practices, and cooking
33
practices. Additionally, anthropometrics were collected for the index children, including height
and weight. Standard anthropometric measurement techniques were used, including ensuring
minimal additional clothing during weighing, re-calibrating the scale between visits, and
measuring children’s length/height lying down or standing depending upon age.
Randomization
Households who ordered QPM seed were randomized with equal probability into the
QPM only group or the QPM + targeting group. Random assignment occurred at the community
health group level and was stratified by kebele. Given the nature of the intervention, neither the
study team nor participants were blinded to the study arm.
Outcomes
The primary outcomes for the study were consumption of QPM by the index child and
index child anthropometrics (height- and weight-for-age z-scores). Secondary outcomes were
meant to capture the pathways by which the targeting intervention could have increased index
child QPM consumption and anthropometrics and included: whether QPM was stored separately
from conventional maize, whether QPM was sold, whether the caregiver cooked QPM
specifically for the index child, and intra-household allocation of QPM.
The index child’s consumption of QPM was measured through 7-day dietary recalls (a
measure of days in the past week that the child consumed QPM). Index child anthropometrics
were evaluated using height-for-age and weight-for-age z-scores based on the 2006 WHO
growth standards. QPM storage practice outcomes include whether the QPM grain and flour
were kept separate during storage, and whether they were stored in the earmarking bags provided
as part of the targeting intervention. The storage outcomes were self-reported at midline (and
reflected how the QPM was previously stored if none was left during the visit) and directly
34
observed by the enumerators at endline (only for those who had any QPM remaining). Sale of
any QPM grain or flour was self-reported by the caregiver. Cooking outcomes include whether
the caregiver cooked anything specifically for the young children in the household, the number
of days the caregiver cooked anything specifically for the young children in the household, and
these two outcomes specifically focused on QPM cooking; all cooking outcomes were self-
reported. Finally, intra-household allocation of was assessed by comparing the number of days
in the past week that the index child consumed QPM to the number of days in the past week that
the household head consumed QPM, both reported by the caregiver during household interviews.
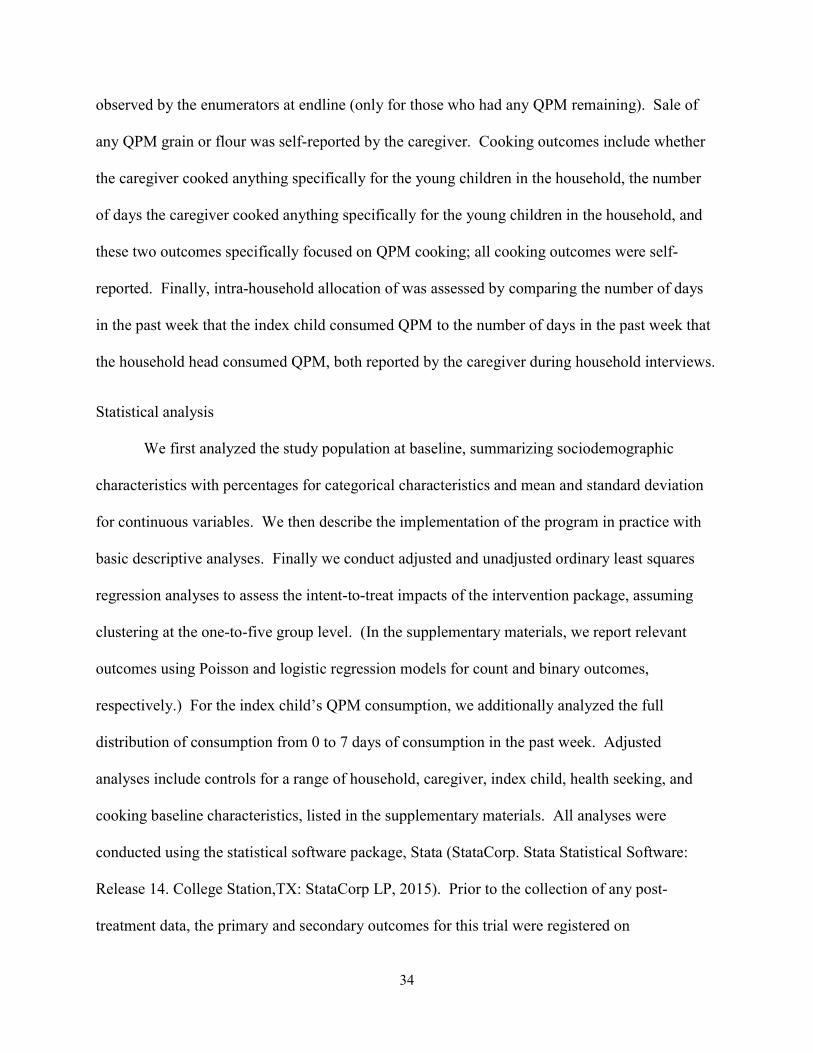
Statistical analysis
We first analyzed the study population at baseline, summarizing sociodemographic
characteristics with percentages for categorical characteristics and mean and standard deviation
for continuous variables. We then describe the implementation of the program in practice with
basic descriptive analyses. Finally we conduct adjusted and unadjusted ordinary least squares
regression analyses to assess the intent-to-treat impacts of the intervention package, assuming
clustering at the one-to-five group level. (In the supplementary materials, we report relevant
outcomes using Poisson and logistic regression models for count and binary outcomes,
respectively.) For the index child’s QPM consumption, we additionally analyzed the full
distribution of consumption from 0 to 7 days of consumption in the past week. Adjusted
analyses include controls for a range of household, caregiver, index child, health seeking, and
cooking baseline characteristics, listed in the supplementary materials. All analyses were
conducted using the statistical software package, Stata (StataCorp. Stata Statistical Software:
Release 14. College Station,TX: StataCorp LP, 2015). Prior to the collection of any post-
treatment data, the primary and secondary outcomes for this trial were registered on
35
clinicaltrials.gov and the American Economic Review’s RCT Registry, numbers NCT02710760
and AEARCTR-0000786, respectively.
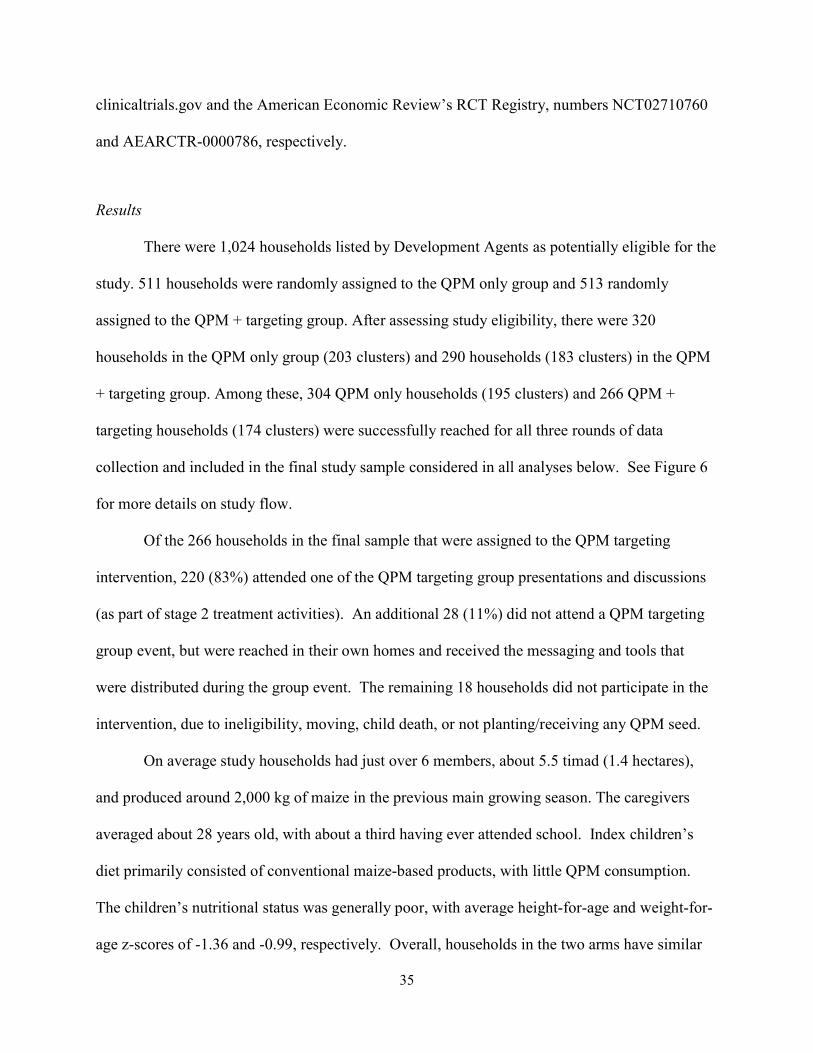
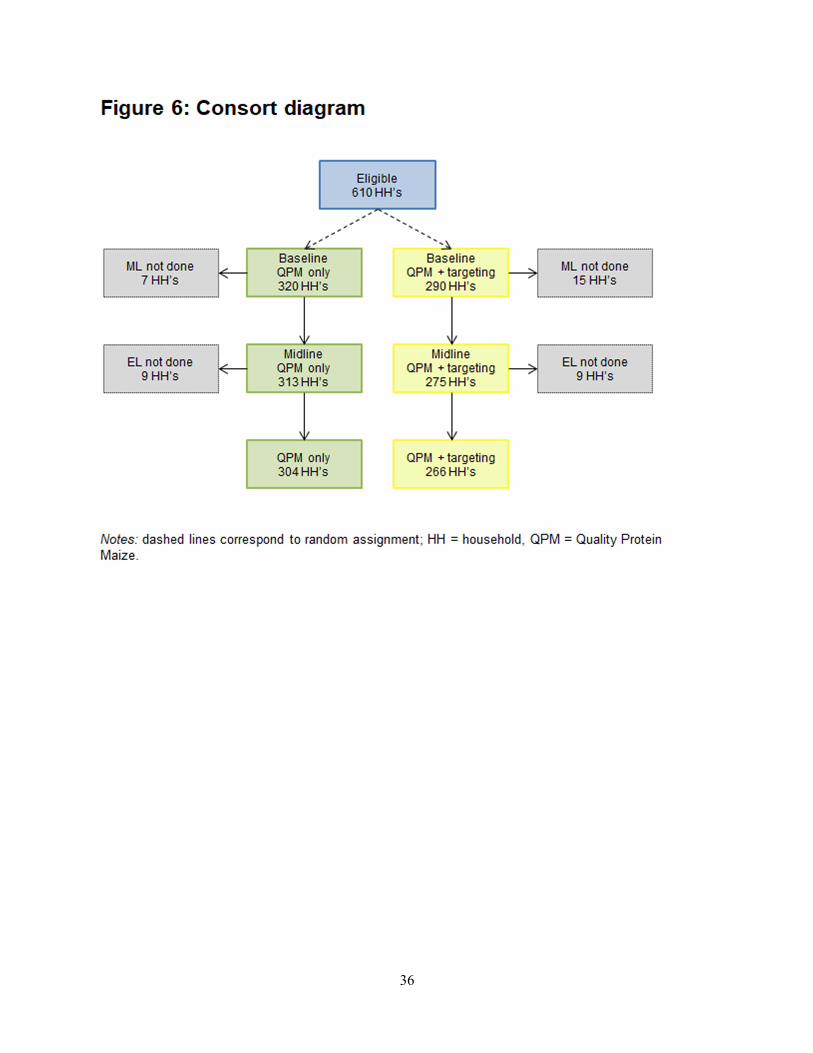
Results
There were 1,024 households listed by Development Agents as potentially eligible for the
study. 511 households were randomly assigned to the QPM only group and 513 randomly
assigned to the QPM + targeting group. After assessing study eligibility, there were 320
households in the QPM only group (203 clusters) and 290 households (183 clusters) in the QPM
+ targeting group. Among these, 304 QPM only households (195 clusters) and 266 QPM +
targeting households (174 clusters) were successfully reached for all three rounds of data
collection and included in the final study sample considered in all analyses below. See Figure 6
for more details on study flow.
Of the 266 households in the final sample that were assigned to the QPM targeting
intervention, 220 (83%) attended one of the QPM targeting group presentations and discussions
(as part of stage 2 treatment activities). An additional 28 (11%) did not attend a QPM targeting
group event, but were reached in their own homes and received the messaging and tools that
were distributed during the group event. The remaining 18 households did not participate in the
intervention, due to ineligibility, moving, child death, or not planting/receiving any QPM seed.
On average study households had just over 6 members, about 5.5 timad (1.4 hectares),
and produced around 2,000 kg of maize in the previous main growing season. The caregivers
averaged about 28 years old, with about a third having ever attended school. Index children’s
diet primarily consisted of conventional maize-based products, with little QPM consumption.
The children’s nutritional status was generally poor, with average height-for-age and weight-for-
age z-scores of -1.36 and -0.99, respectively. Overall, households in the two arms have similar
36
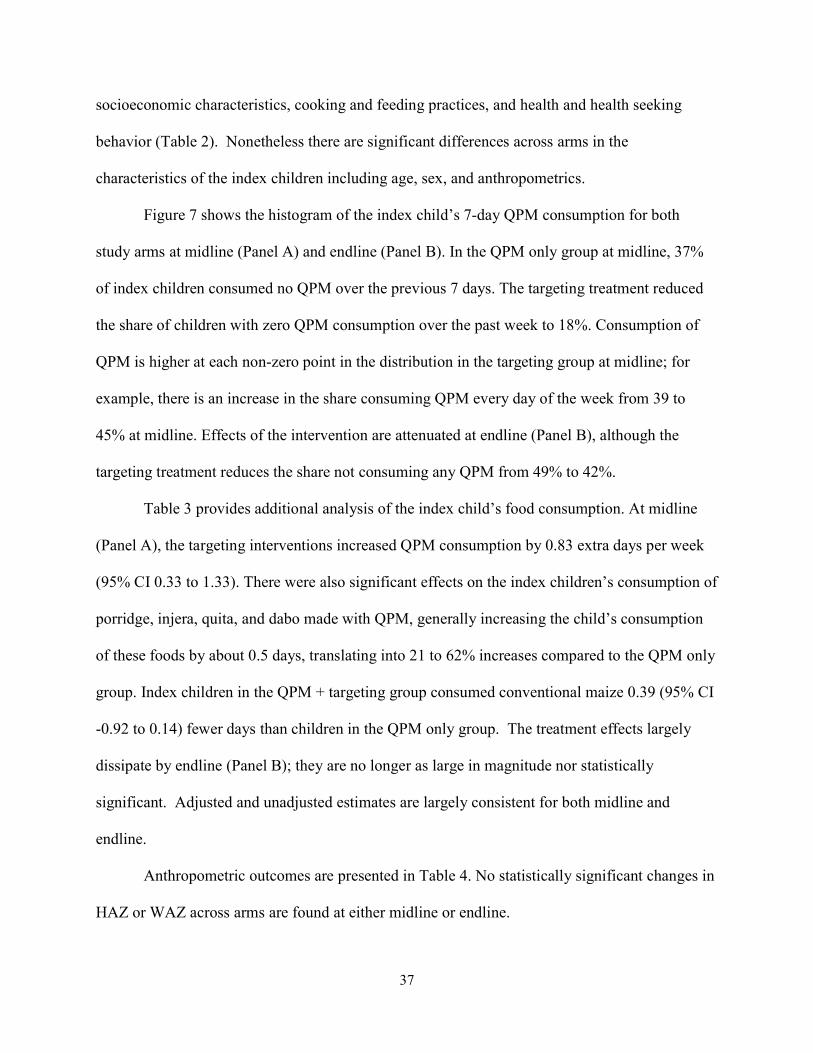
37
socioeconomic characteristics, cooking and feeding practices, and health and health seeking
behavior (Table 2). Nonetheless there are significant differences across arms in the
characteristics of the index children including age, sex, and anthropometrics.
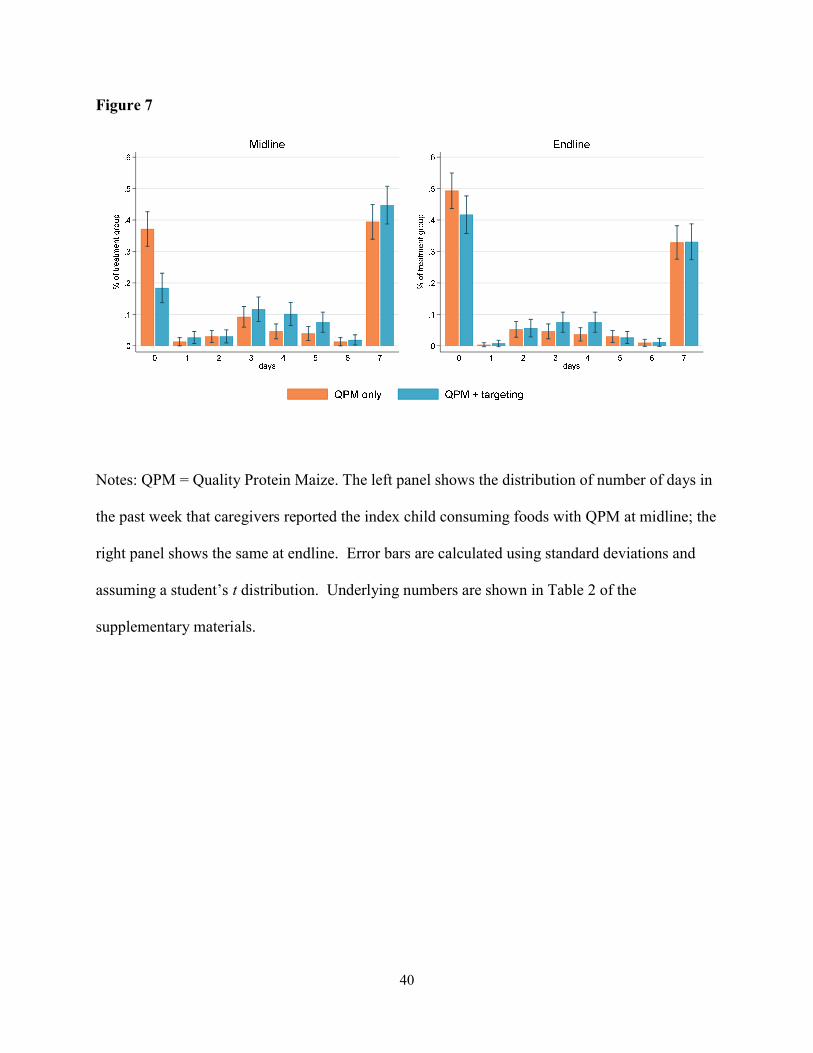
Figure 7 shows the histogram of the index child’s 7-day QPM consumption for both
study arms at midline (Panel A) and endline (Panel B). In the QPM only group at midline, 37%
of index children consumed no QPM over the previous 7 days. The targeting treatment reduced
the share of children with zero QPM consumption over the past week to 18%. Consumption of
QPM is higher at each non-zero point in the distribution in the targeting group at midline; for
example, there is an increase in the share consuming QPM every day of the week from 39 to
45% at midline. Effects of the intervention are attenuated at endline (Panel B), although the
targeting treatment reduces the share not consuming any QPM from 49% to 42%.
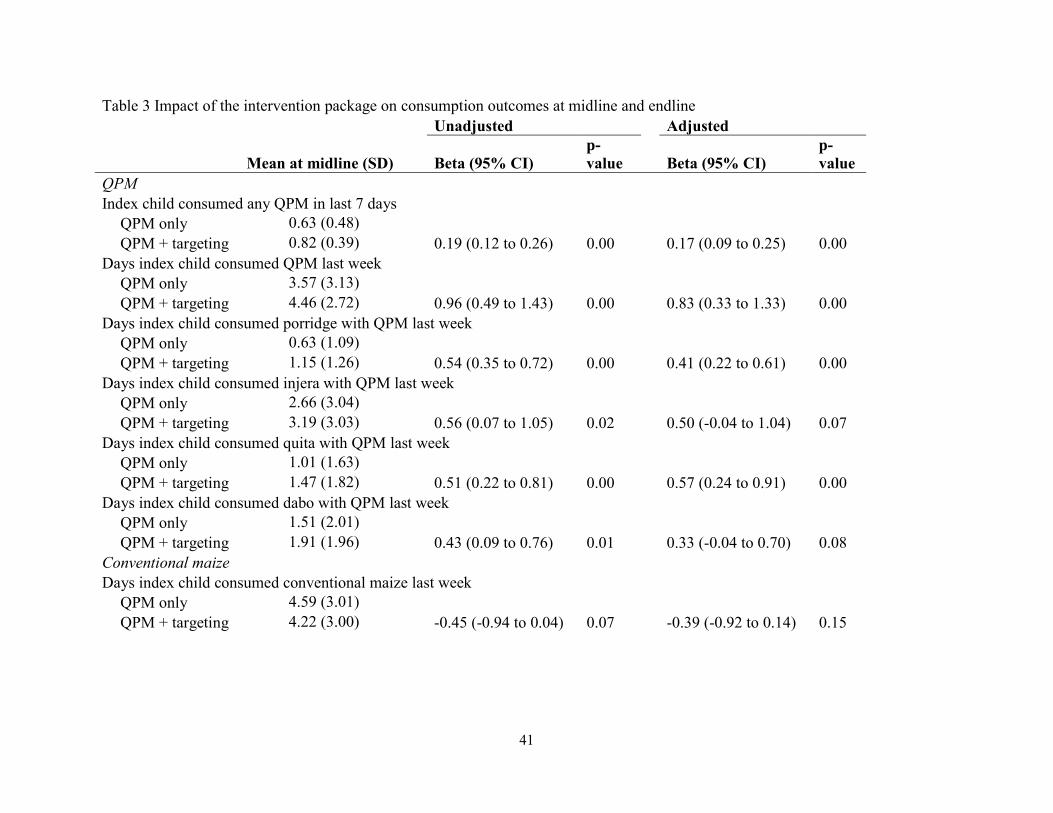
Table 3 provides additional analysis of the index child’s food consumption. At midline
(Panel A), the targeting interventions increased QPM consumption by 0.83 extra days per week
(95% CI 0.33 to 1.33). There were also significant effects on the index children’s consumption of
porridge, injera, quita, and dabo made with QPM, generally increasing the child’s consumption
of these foods by about 0.5 days, translating into 21 to 62% increases compared to the QPM only
group. Index children in the QPM + targeting group consumed conventional maize 0.39 (95% CI
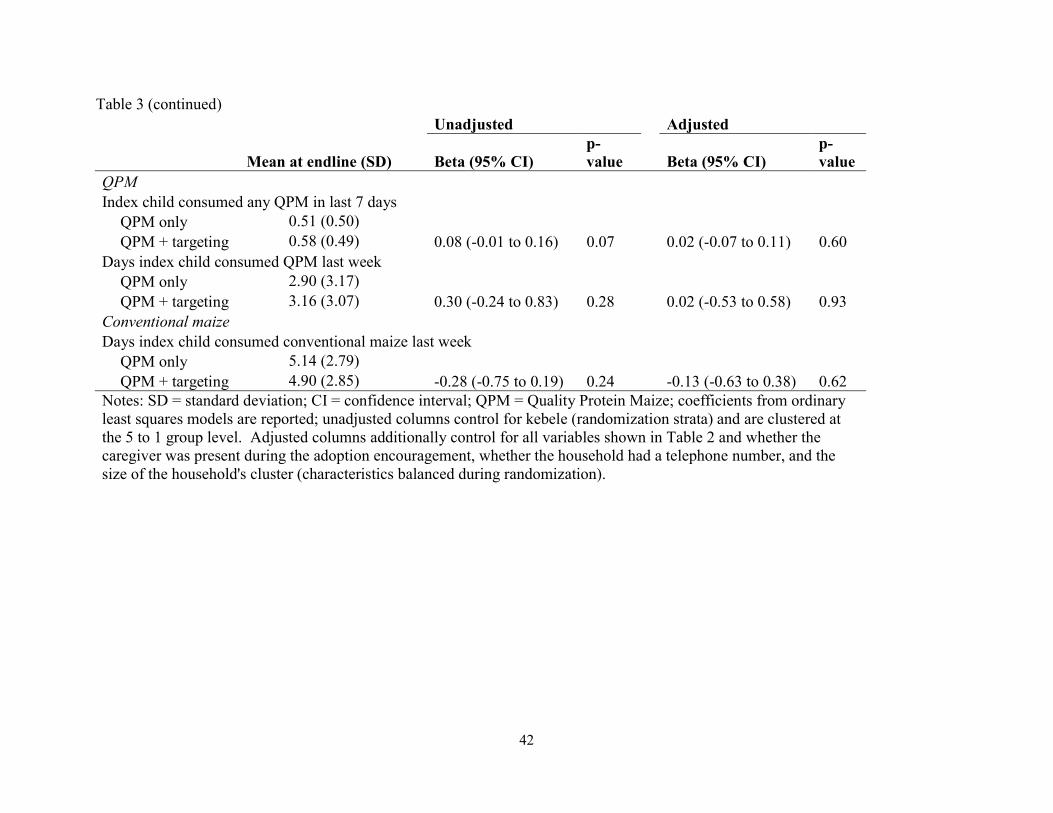
-0.92 to 0.14) fewer days than children in the QPM only group. The treatment effects largely
dissipate by endline (Panel B); they are no longer as large in magnitude nor statistically
significant. Adjusted and unadjusted estimates are largely consistent for both midline and
endline.
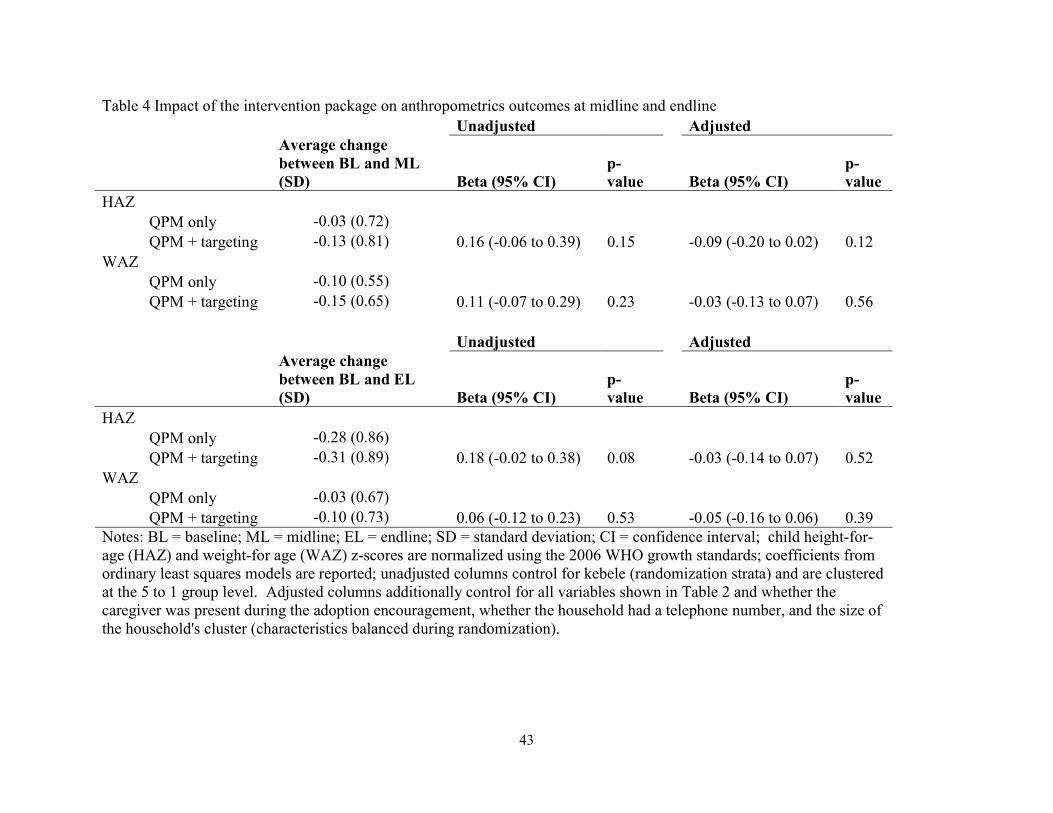
Anthropometric outcomes are presented in Table 4. No statistically significant changes in
HAZ or WAZ across arms are found at either midline or endline.

38
Table 2 Baseline characteristics of the study participants QPM only QPM + targeting Final sample Final sample
(n=304) (n=266) p-value
Household characteristics
Number of household members
6.24 (1.96)
6.20 (2.11) 0.99
High quality roof* 0.61 (0.49) 0.53 (0.50) 0.09 Land owned (timad)* 5.62 (6.62) 5.48 (5.99) 0.64 Maize produced (kg)* 1719.27 (2342.59) 2042.40 (2438.58) 0.45 Caregiver characteristics Age (years) 28.54 (5.67) 28.36 (5.99) 0.82 Attended school 0.30 (0.46) 0.38 (0.49) 0.07 Number of pregnancies 4.48 (2.14) 4.38 (2.38) 0.79 Index child characteristics Age (months) 19.06 (7.89) 20.75 (8.91) 0.02 Male 0.56 (0.50) 0.47 (0.50) 0.06 Height-for-age (z-score) -1.47 (1.36) -1.22 (1.51) 0.04 Weight-for-age (z-score) -1.06 (1.09) -0.90 (1.16) 0.12 Health and health-seeking behavior
Index child sick with diarrhea in past 2 weeks
0.19 (0.39)
0.15 (0.36) 0.32
Index child sick with cough/breathing problems in past 2 weeks
0.18 (0.38)
0.14 (0.35) 0.16
Index child sick with fever in past 2 weeks
0.20 (0.40)
0.18 (0.38) 0.29
Number times CG sought ANC during pregnancy with index child
3.22 (1.65)
3.23 (1.49) 0.93
Cooking & feeding
Days in past week cooked specifically for young child
1.82 (2.24)
1.77 (2.31) 0.94
Days in past week cooked something with maize
5.66 (2.50)
5.72 (2.42) 0.98
Days in past week cooked something with QPM
0.12 (0.73)
0.25 (1.12) 0.14
Days in past week index child ate something with QPM
0.12 (0.73)
0.18 (0.87) 0.57
Days in past week cooked porridge and served to young child
0.78 (1.24)
0.78 (1.22) 0.43
39
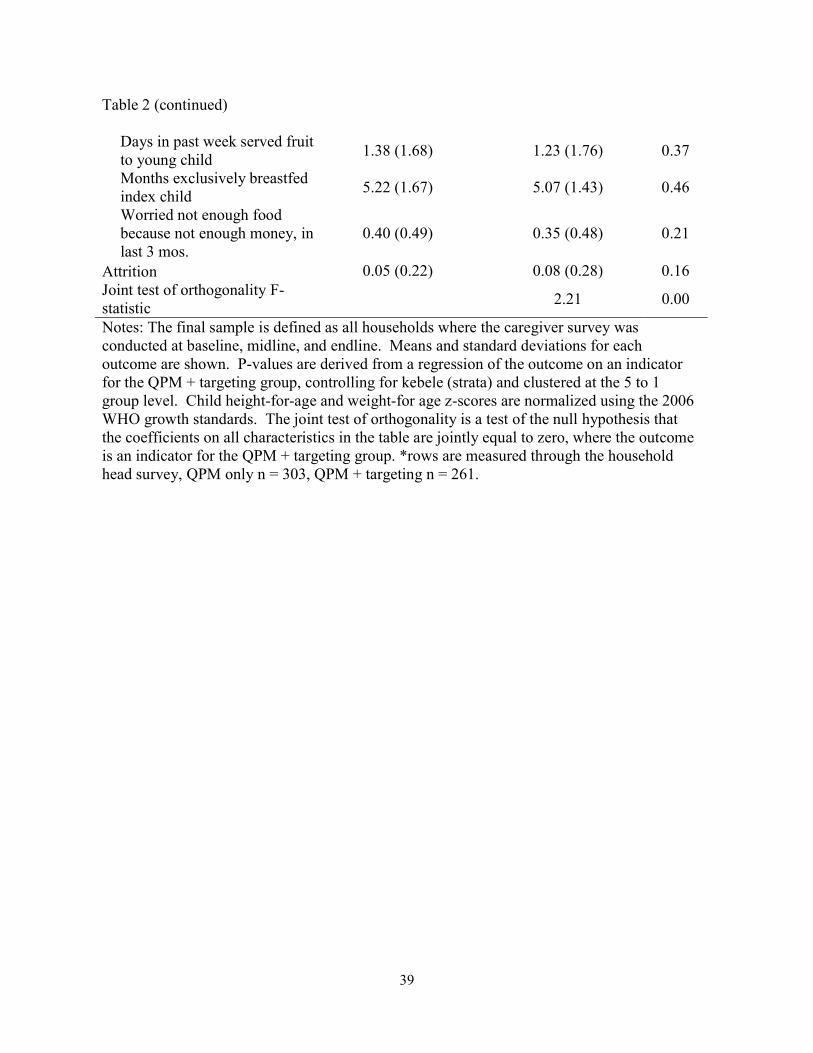
Table 2 (continued)
Days in past week served fruit to young child
1.38 (1.68)
1.23 (1.76) 0.37
Months exclusively breastfed index child
5.22 (1.67)
5.07 (1.43) 0.46
Worried not enough food because not enough money, in last 3 mos.
0.40 (0.49)
0.35 (0.48) 0.21
Attrition 0.05 (0.22) 0.08 (0.28) 0.16 Joint test of orthogonality F-statistic
2.21 0.00
Notes: The final sample is defined as all households where the caregiver survey was conducted at baseline, midline, and endline. Means and standard deviations for each outcome are shown. P-values are derived from a regression of the outcome on an indicator for the QPM + targeting group, controlling for kebele (strata) and clustered at the 5 to 1 group level. Child height-for-age and weight-for age z-scores are normalized using the 2006 WHO growth standards. The joint test of orthogonality is a test of the null hypothesis that the coefficients on all characteristics in the table are jointly equal to zero, where the outcome is an indicator for the QPM + targeting group. *rows are measured through the household head survey, QPM only n = 303, QPM + targeting n = 261.
40
Figure 7
Notes: QPM = Quality Protein Maize. The left panel shows the distribution of number of days in
the past week that caregivers reported the index child consuming foods with QPM at midline; the
right panel shows the same at endline. Error bars are calculated using standard deviations and
assuming a student’s t distribution. Underlying numbers are shown in Table 2 of the
supplementary materials.
41
Table 3 Impact of the intervention package on consumption outcomes at midline and endline Unadjusted Adjusted
Mean at midline (SD) Beta (95% CI) p-value Beta (95% CI)
p-value
QPM Index child consumed any QPM in last 7 days QPM only 0.63 (0.48) QPM + targeting 0.82 (0.39) 0.19 (0.12 to 0.26) 0.00 0.17 (0.09 to 0.25) 0.00 Days index child consumed QPM last week QPM only 3.57 (3.13) QPM + targeting 4.46 (2.72) 0.96 (0.49 to 1.43) 0.00 0.83 (0.33 to 1.33) 0.00 Days index child consumed porridge with QPM last week QPM only 0.63 (1.09) QPM + targeting 1.15 (1.26) 0.54 (0.35 to 0.72) 0.00 0.41 (0.22 to 0.61) 0.00 Days index child consumed injera with QPM last week QPM only 2.66 (3.04) QPM + targeting 3.19 (3.03) 0.56 (0.07 to 1.05) 0.02 0.50 (-0.04 to 1.04) 0.07 Days index child consumed quita with QPM last week QPM only 1.01 (1.63) QPM + targeting 1.47 (1.82) 0.51 (0.22 to 0.81) 0.00 0.57 (0.24 to 0.91) 0.00 Days index child consumed dabo with QPM last week QPM only 1.51 (2.01) QPM + targeting 1.91 (1.96) 0.43 (0.09 to 0.76) 0.01 0.33 (-0.04 to 0.70) 0.08 Conventional maize Days index child consumed conventional maize last week QPM only 4.59 (3.01) QPM + targeting 4.22 (3.00) -0.45 (-0.94 to 0.04) 0.07 -0.39 (-0.92 to 0.14) 0.15
42
Table 3 (continued) Unadjusted Adjusted
Mean at endline (SD) Beta (95% CI) p-value Beta (95% CI)
p-value
QPM Index child consumed any QPM in last 7 days QPM only 0.51 (0.50) QPM + targeting 0.58 (0.49) 0.08 (-0.01 to 0.16) 0.07 0.02 (-0.07 to 0.11) 0.60 Days index child consumed QPM last week QPM only 2.90 (3.17) QPM + targeting 3.16 (3.07) 0.30 (-0.24 to 0.83) 0.28 0.02 (-0.53 to 0.58) 0.93 Conventional maize Days index child consumed conventional maize last week QPM only 5.14 (2.79) QPM + targeting 4.90 (2.85) -0.28 (-0.75 to 0.19) 0.24 -0.13 (-0.63 to 0.38) 0.62 Notes: SD = standard deviation; CI = confidence interval; QPM = Quality Protein Maize; coefficients from ordinary least squares models are reported; unadjusted columns control for kebele (randomization strata) and are clustered at the 5 to 1 group level. Adjusted columns additionally control for all variables shown in Table 2 and whether the caregiver was present during the adoption encouragement, whether the household had a telephone number, and the size of the household's cluster (characteristics balanced during randomization).
43
Table 4 Impact of the intervention package on anthropometrics outcomes at midline and endline Unadjusted Adjusted
Average change between BL and ML (SD) Beta (95% CI)
p-value Beta (95% CI)
p-value
HAZ QPM only -0.03 (0.72) QPM + targeting -0.13 (0.81) 0.16 (-0.06 to 0.39) 0.15 -0.09 (-0.20 to 0.02) 0.12 WAZ QPM only -0.10 (0.55) QPM + targeting -0.15 (0.65) 0.11 (-0.07 to 0.29) 0.23 -0.03 (-0.13 to 0.07) 0.56 Unadjusted Adjusted
Average change between BL and EL (SD) Beta (95% CI)
p-value Beta (95% CI)
p-value
HAZ QPM only -0.28 (0.86) QPM + targeting -0.31 (0.89) 0.18 (-0.02 to 0.38) 0.08 -0.03 (-0.14 to 0.07) 0.52 WAZ QPM only -0.03 (0.67) QPM + targeting -0.10 (0.73) 0.06 (-0.12 to 0.23) 0.53 -0.05 (-0.16 to 0.06) 0.39 Notes: BL = baseline; ML = midline; EL = endline; SD = standard deviation; CI = confidence interval; child height-for-age (HAZ) and weight-for age (WAZ) z-scores are normalized using the 2006 WHO growth standards; coefficients from ordinary least squares models are reported; unadjusted columns control for kebele (randomization strata) and are clustered at the 5 to 1 group level. Adjusted columns additionally control for all variables shown in Table 2 and whether the caregiver was present during the adoption encouragement, whether the household had a telephone number, and the size of the household's cluster (characteristics balanced during randomization).
44
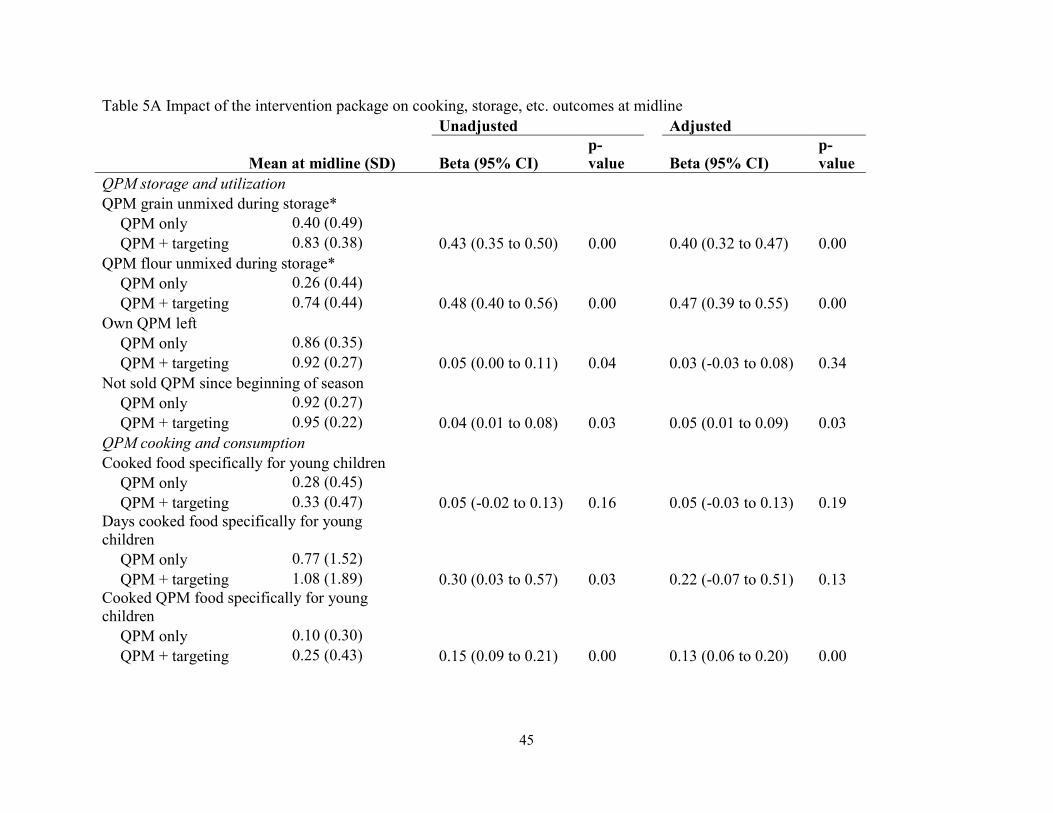
Table 5 presents the impact of the intervention on intermediate outcomes such as QPM
storage and cooking. The targeting interventions increased the probability that QPM grain and
flour are stored separately from other grains and flours by 40 and 47 percentage points at midline
(95% CI 0.32 to 0.47, 0.39 to 0.55) and 22 and 30 percentage points at endline (95% CI 0.13 to
0.31, 0.20 to 0.39). Additionally, at midline the targeting interventions increased the number of
days in the past week that caregivers cooked specifically for young children by 0.22 days (95%
CI -0.07 to 0.51) and the number of days in the past week that they cooked QPM-based foods
specifically for young children by 0.55 days (95% CI 0.31 to 0.79). The difference in number of
days in the past week that the index child consumed QPM compared to the household head
increased by 1.13 days (95% CI 0.21 to 2.05). By endline, the effects on cooking behaviors had
somewhat dissipated.
Discussion
Improved crop varieties have been touted as an effective, sustainable approach to
improving child nutrition in developing countries, and are a key part of the Ethiopian
government’s plans for reaching targeted improvements in child nutrition. This approach
recognizes the importance of agriculture in much of Ethiopian society, but there has been little
evidence, both domestically and globally, of effective means for leveraging agriculture to
improve nutrition and health.12 This study is one of the first to examine the potential for nudges
to induce relevant behavioral changes around QPM production, storage, and cooking to induce
greater targeting of QPM to young children. Findings from the QPM only group from this study
show that even with the free introduction of a biofortified crop and some basic education around
it, targeted individuals (i.e., children) are unlikely to see a substantial benefit through changed
45
Table 5A Impact of the intervention package on cooking, storage, etc. outcomes at midline Unadjusted Adjusted
Mean at midline (SD) Beta (95% CI) p-value Beta (95% CI)
p-value
QPM storage and utilization QPM grain unmixed during storage* QPM only 0.40 (0.49) QPM + targeting 0.83 (0.38) 0.43 (0.35 to 0.50) 0.00 0.40 (0.32 to 0.47) 0.00 QPM flour unmixed during storage* QPM only 0.26 (0.44) QPM + targeting 0.74 (0.44) 0.48 (0.40 to 0.56) 0.00 0.47 (0.39 to 0.55) 0.00 Own QPM left QPM only 0.86 (0.35) QPM + targeting 0.92 (0.27) 0.05 (0.00 to 0.11) 0.04 0.03 (-0.03 to 0.08) 0.34 Not sold QPM since beginning of season QPM only 0.92 (0.27) QPM + targeting 0.95 (0.22) 0.04 (0.01 to 0.08) 0.03 0.05 (0.01 to 0.09) 0.03 QPM cooking and consumption Cooked food specifically for young children QPM only 0.28 (0.45) QPM + targeting 0.33 (0.47) 0.05 (-0.02 to 0.13) 0.16 0.05 (-0.03 to 0.13) 0.19 Days cooked food specifically for young children QPM only 0.77 (1.52) QPM + targeting 1.08 (1.89) 0.30 (0.03 to 0.57) 0.03 0.22 (-0.07 to 0.51) 0.13 Cooked QPM food specifically for young children QPM only 0.10 (0.30) QPM + targeting 0.25 (0.43) 0.15 (0.09 to 0.21) 0.00 0.13 (0.06 to 0.20) 0.00
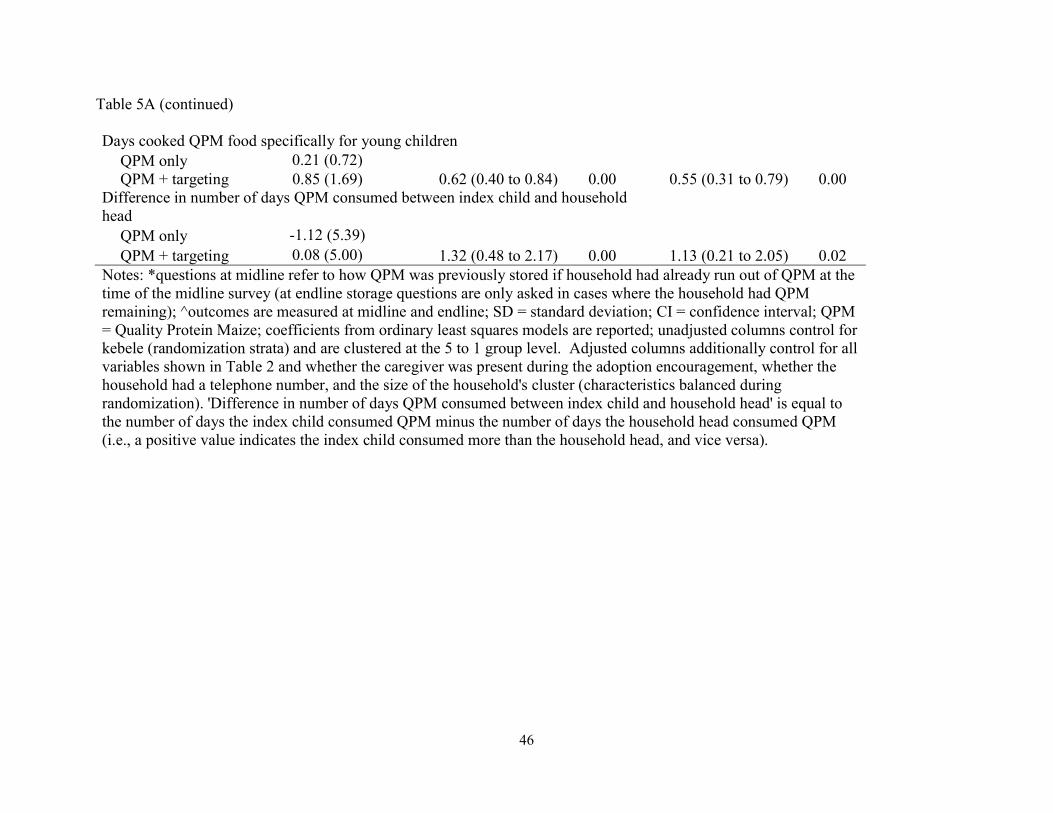
46
Table 5A (continued) Days cooked QPM food specifically for young children QPM only 0.21 (0.72) QPM + targeting 0.85 (1.69) 0.62 (0.40 to 0.84) 0.00 0.55 (0.31 to 0.79) 0.00 Difference in number of days QPM consumed between index child and household head QPM only -1.12 (5.39) QPM + targeting 0.08 (5.00) 1.32 (0.48 to 2.17) 0.00 1.13 (0.21 to 2.05) 0.02 Notes: *questions at midline refer to how QPM was previously stored if household had already run out of QPM at the time of the midline survey (at endline storage questions are only asked in cases where the household had QPM remaining); ^outcomes are measured at midline and endline; SD = standard deviation; CI = confidence interval; QPM = Quality Protein Maize; coefficients from ordinary least squares models are reported; unadjusted columns control for kebele (randomization strata) and are clustered at the 5 to 1 group level. Adjusted columns additionally control for all variables shown in Table 2 and whether the caregiver was present during the adoption encouragement, whether the household had a telephone number, and the size of the household's cluster (characteristics balanced during randomization). 'Difference in number of days QPM consumed between index child and household head' is equal to the number of days the index child consumed QPM minus the number of days the household head consumed QPM (i.e., a positive value indicates the index child consumed more than the household head, and vice versa).
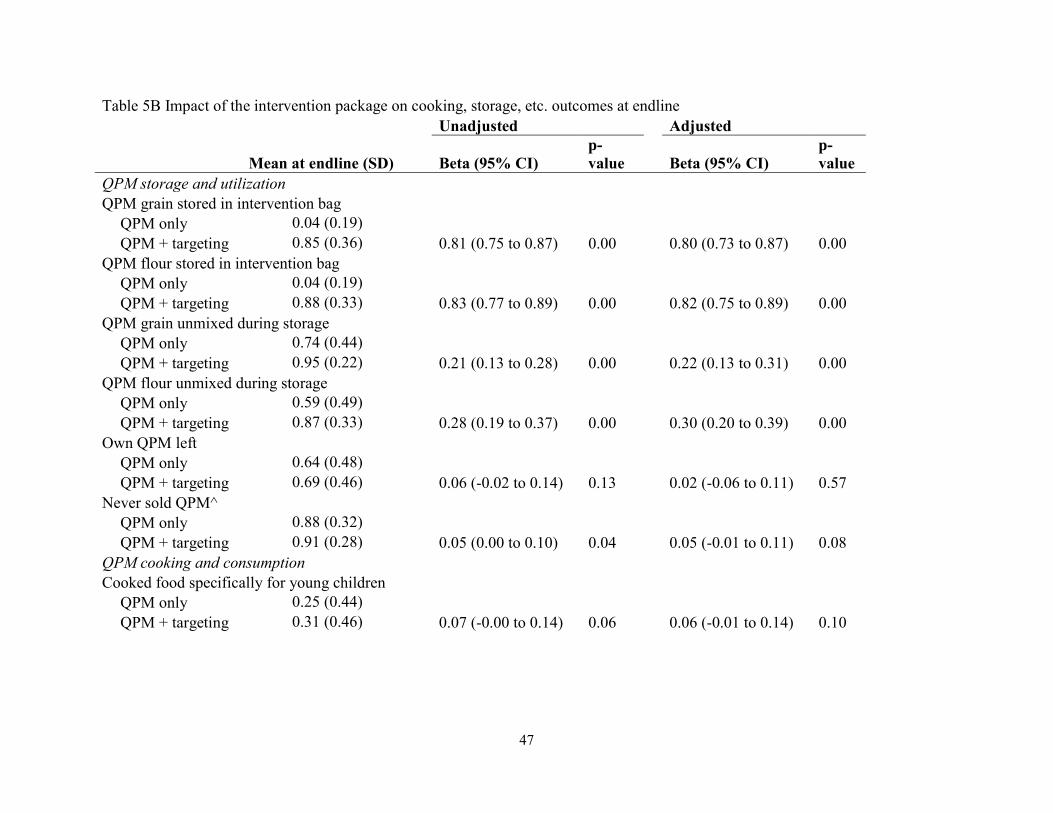
47
Table 5B Impact of the intervention package on cooking, storage, etc. outcomes at endline Unadjusted Adjusted
Mean at endline (SD) Beta (95% CI) p-value Beta (95% CI)
p-value
QPM storage and utilization QPM grain stored in intervention bag QPM only 0.04 (0.19) QPM + targeting 0.85 (0.36) 0.81 (0.75 to 0.87) 0.00 0.80 (0.73 to 0.87) 0.00 QPM flour stored in intervention bag QPM only 0.04 (0.19) QPM + targeting 0.88 (0.33) 0.83 (0.77 to 0.89) 0.00 0.82 (0.75 to 0.89) 0.00 QPM grain unmixed during storage QPM only 0.74 (0.44) QPM + targeting 0.95 (0.22) 0.21 (0.13 to 0.28) 0.00 0.22 (0.13 to 0.31) 0.00 QPM flour unmixed during storage QPM only 0.59 (0.49) QPM + targeting 0.87 (0.33) 0.28 (0.19 to 0.37) 0.00 0.30 (0.20 to 0.39) 0.00 Own QPM left QPM only 0.64 (0.48) QPM + targeting 0.69 (0.46) 0.06 (-0.02 to 0.14) 0.13 0.02 (-0.06 to 0.11) 0.57 Never sold QPM^ QPM only 0.88 (0.32) QPM + targeting 0.91 (0.28) 0.05 (0.00 to 0.10) 0.04 0.05 (-0.01 to 0.11) 0.08 QPM cooking and consumption Cooked food specifically for young children QPM only 0.25 (0.44) QPM + targeting 0.31 (0.46) 0.07 (-0.00 to 0.14) 0.06 0.06 (-0.01 to 0.14) 0.10
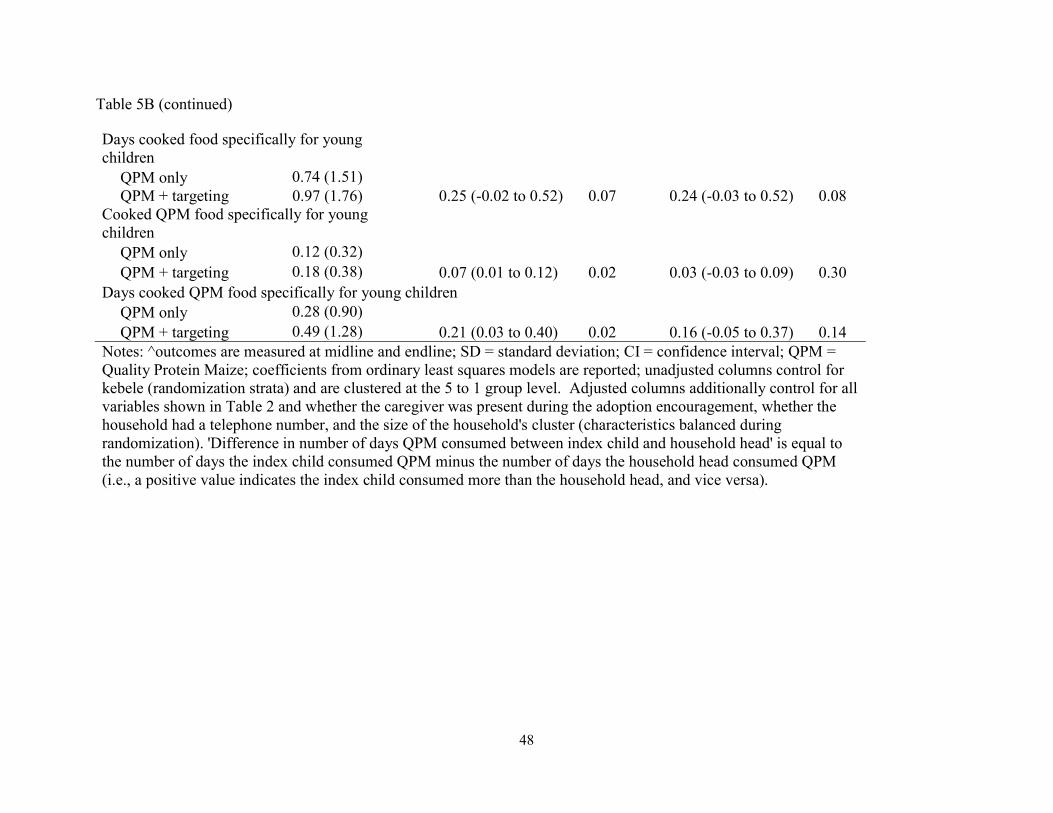
48
Table 5B (continued) Days cooked food specifically for young children QPM only 0.74 (1.51) QPM + targeting 0.97 (1.76) 0.25 (-0.02 to 0.52) 0.07 0.24 (-0.03 to 0.52) 0.08 Cooked QPM food specifically for young children QPM only 0.12 (0.32) QPM + targeting 0.18 (0.38) 0.07 (0.01 to 0.12) 0.02 0.03 (-0.03 to 0.09) 0.30 Days cooked QPM food specifically for young children QPM only 0.28 (0.90) QPM + targeting 0.49 (1.28) 0.21 (0.03 to 0.40) 0.02 0.16 (-0.05 to 0.37) 0.14 Notes: ^outcomes are measured at midline and endline; SD = standard deviation; CI = confidence interval; QPM = Quality Protein Maize; coefficients from ordinary least squares models are reported; unadjusted columns control for kebele (randomization strata) and are clustered at the 5 to 1 group level. Adjusted columns additionally control for all variables shown in Table 2 and whether the caregiver was present during the adoption encouragement, whether the household had a telephone number, and the size of the household's cluster (characteristics balanced during randomization). 'Difference in number of days QPM consumed between index child and household head' is equal to the number of days the index child consumed QPM minus the number of days the household head consumed QPM (i.e., a positive value indicates the index child consumed more than the household head, and vice versa).
49
behaviors, further evidence of the challenges of promoting adoption of improved crop varieties
with the goal of improving child nutrition.
Our study showed that it is possible to elicit changes in targeted behaviors such as grain
storage and targeted child feeding through behavioral nudges such as earmarking and labeling.
Our primary finding that the index child’s consumption of QPM increased by roughly one day
per week corresponds to a nearly 25% increase in QPM consumption. Despite showing that it is
possible to increase consumption and other related behaviors such as cooking and storage, this
study did not demonstrate any significant impacts on child anthropometrics. There are a number
of potential reasons for this, including that the increase in QPM consumption was not enough to
lead to meaningful changes in growth or that the amount of time children had been eating QPM
was not long enough to detect impacts. It is also possible that impurities in the QPM grain
(introduced from sub-optimal planting techniques) resulted in less available protein or that
measurement error in anthropometric measures reduced statistical power for detecting effects.
There are some important limitations to this study. First, many of the key outcomes of
interest are self-reported and subject to response bias. However, the results around one
important behavior change directly related to the behavioral components of the intervention,
QPM storage, were directly observed at endline, and substantial treatment effects were present.
Second, there are several conditions around this study that deviate from natural conditions,
including the free distribution of QPM seed and repeated opportunities to reiterate the
educational messaging. Third, there was significant imbalance in the index children’s baseline
anthropometrics, where the QPM + targeting group appears to have been substantially healthier
and older than the QPM alone group. Finally, it is difficult to disentangle why precisely many of

50
the treatment effects are not sustained; this is likely a combination of the behavioral effect
wearing off and of running out of QPM.
The Ethiopian government has set the goal of converting 20% of the country’s maize
production to QPM within a few years; while this is an important first step, this study shows the
importance of additional, complementary policy initiatives that will help achieve the ultimate
goal of improved crops: improved nutrition.
Ethics approval
The study was been approved by Ethiopian Public Health institute Scientific and Ethical review
committee (SERO-006-02-2015) and Harvard University IRB committee (IRB14-3255).
Funding
This work was funded by Agricultural Technology Adoption Initiative (ATAI). This funding
source had no role in the design of this study, its execution, analyses, interpretation of the data,
or decision to submit results.
51
References
1. Bhutta ZA, Das JK, Rizvi A, Gaffey MF, Walker N, Horton S, et al. Evidence-based interventions for improvement of maternal and child nutrition: what can be done and at what cost? The lancet. 2013;382(9890):452-77. 2. Authority CS. Ethiopia Demographic and Health Survey 20162016. 3. Black R, Allen L, Bhutta Z, Caulfield L, Onis M, Ezzati M, et al. Maternal and child undernutrition: global and regional exposures and health consequences. Lancet Infect Dis. 2008;371(9608):243 - 60. 4. ECA A, NEPAD W. The cost of hunger in Africa social and economic impact of child undernutrition in Egypt, Ethiopia, Swaziland and Uganda. Addis Ababa. 2013. 5. Murray CJ. Shifting to Sustainable Development Goals--Implications for Global Health. The New England journal of medicine. 2015;373(15):1390-3. 6. Onis M, Dewey KG, Borghi E, Onyango AW, Blössner M, Daelmans B, et al. The World Health Organization's global target for reducing childhood stunting by 2025: rationale and proposed actions. Maternal & child nutrition. 2013;9(S2):6-26. 7. Hanna R, Duflo E, Greenstone M. Up in smoke: the influence of household behavior on the long-run impact of improved cooking stoves. American Economic Journal: Economic Policy. 2016;8(1):80-114. 8. Food supply tables 2009 [Internet]. FAO Statistics Division. 2013 [cited 26 June 2013]. 9. Dupas P, Robinson J. Why don't the poor save more? Evidence from health savings experiments. American Economic Review. 2013;103(4):1138-71. 10. Dizon F, Gong E, Jones K. Mental Accounting and Mobile Banking: Can labeling an M-PESA account increase savings? Working paper, UC Davis, Middlebury College, and IFPRI, 2015. 11. FAOSTAT. Agricultural Production Statistics 2012 Rome: FAO Statistics Division; 2013 [updated December 15, 2013January 4, 2014]. Available from: http://faostat.fao.org/site/339/default.aspx. 12. Vasal S. The quality protein maize story. Food and Nutrition Bulletin. 2000;21(4):445-50. 13. Prasanna B, Vasal S, Kassahun B, Singh N. Quality protein maize. 2001.

52
14. De Groote H, Gunaratna NS, Okuro JO, Wondimu A, Chege CK, Tomlins K. Consumer acceptance of quality protein maize (QPM) in East Africa. Journal of the Science of Food and Agriculture. 2014;94(15):3201-12. 15. Gunaratna NS, De Groote H, Nestel P, Pixley KV, McCabe GP. A meta-analysis of community-based studies on quality protein maize. Food Policy. 2010;35(3):202-10.
53
Personalized information and labeled cash transfers to improve child nutrition: evidence
from a randomized controlled trial in Ethiopia
Author: Katherine Donato
Abstract
Even in contexts where caregivers for young children know how to improve a child’s physical
growth, incorrect perceptions of a child’s nutritional status may contribute toward suboptimal
household choices that result in sustained child malnutrition and poor physical growth. I present
here the results of a randomized controlled trial in Oromia, Ethiopia where I test how two
interventions influence key behaviors including child food consumption and household food
spending. Specifically I examine the effects of: (1) providing caregivers with personalized
information about their young child’s nutritional status (i.e., height compared to other children
the same age and gender), and (2) providing caregivers with a small cash transfer, labeled for
child food consumption. I find that caregivers are generally able to understand and retain
information about their child’s nutritional status, and this knowledge translates into small, but
relevant changes in feeding, spending, and child growth. The small cash transfer labeled for the
young child’s food consumption induced substantially larger and wider-ranging improvements
on key outcomes around the quality of the child’s food consumption and household spending
behaviors. There is little evidence of complementary effects of the two interventions when they
are combined.
54
Introduction
Childhood malnutrition is a serious problem in many low-income countries, and accounts
for nearly half of child deaths worldwide.1, 2 Children who are well-nourished are better able to
learn in school and grow into more physically capable adults, allowing them to be more
productive in the long run. Well-nourished children also typically require less health care during
childhood and adulthood, further reducing the chances of poverty for them and their families.3
Given the benefits of reduced childhood malnutrition, the international community has
set the ambitious targets of reducing by 40 percent the number of stuntedi children by 2025, and
ending all forms of malnutrition by 2030.4, 5 Rising national incomes will contribute toward
these goals, but at a much slower rate than could be achieved through direct investment in
improving nutrition, which tends to be highly cost-effective.1 Current nutritional interventions
alone, however, are unlikely to generate these targeted improvements due to factors such as
lagging health system development,5 motivating policy-makers to seek a better understand of the
underlying causes of malnutrition and methods for increasing the impact of existing efforts.
A number of factors that contribute to the persistently high child malnutrition rates in
many low-income settings are well-established, including poor maternal nutrition, inadequate
breastfeeding, and inappropriate complementary feeding.2 A substantial portion of the drivers of
malnutrition, however, remains poorly understood.6 I present here the results of a pilot
intervention in a rural, agricultural region of Oromia, Ethiopia, that was designed to generate
insights into the contribution of (1) caregivers’ knowledge barriers and (2) resource constraints
toward child malnutrition, ultimately allowing for more targeted, cost-effective interventions in
the future.
i Stunting is defined by the World Health Organization as having a height-for-age z-score below -2.
55
The first potential driver of malnutrition considered in this paper, knowledge barriers,
was motivated by data collected during interviews with children’s caregivers during a prior
child-nutrition-focused randomized trial in Ethiopia, upon which this study was built. These data
suggested that insufficient knowledge about how to improve child nutrition was unlikely to be a
limiting constraint with respect to malnutrition. On the other hand, these caregivers were
commonly unaware that their children’s physical size was below average; these misperceptions
persisted over multiple survey rounds over the course of a year. This factual knowledge about
how to provide proper nutritional intake, combined with misperceptions about children’s actual
nutritional status, suggests that one potential means of improving child malnutrition is to provide
personalized information correcting these misperceptions, a hypothesis I test in this study.
The second potential driver of malnutrition considered in this paper, resource constraints,
would be expected in many similar contexts and was verified as a likely relevant factor during
the prior trial. Many children’s diets consisted primarily of products that were directly produced
by the household and improvements to their diets would require purchases from the local
markets, an undertaking that may be – or may be perceived to be – out of reach for most
households in the study area without additional financial resources.
With these motivations and input from government and local non-profit officials, I
developed a set of interventions that tested potential policy measures that leaders could feasibly
implement to reduce rates of malnutrition, while also providing a deeper understanding of the
relationship between knowledge and resource constraints, and how these might inhibit action.
The interventions were implemented through a randomized controlled trial, with two cross-
randomized interventions. In the first intervention, households received personalized information
56
about the height of a young childi in the household compared to the range of heights for
“healthy” children of the same age and gender in East Africa. Notably from a policy and
feasibility perspective, this information was based on data that are already regularly collected by
community health workers in rural Ethiopia, and could easily be presented by these workers to
caregivers during the community health workers’ existing, regular visits to all households with
children under five.ii In the second intervention, households received a small cash transfer
labeled for child food consumption over the following six weeks.
I find that caregivers were able to internalize and recall the personalized information
fairly well, and this knowledge translated into some small but meaningful improvements in
feeding, spending, and growth. For example, index children in the personalized information
group consumed 67 percent more eggs per week as a result of the intervention and gained 0.13
standard deviations in their weight-for-age z-scores. The labeled cash transfer was generally
more effective in improving key outcomes such as the quality of the child’s food consumption
and household spending on key food items. This intervention led to a 166 percent increase in
egg consumption and a 0.11 standard deviation increase in weight-for-age z-scores. There were
no consistent complementarities between the two interventions when they are combined.
This study contributes to three main threads in the research literature: (1) the role of
information – particularly personalized information – in prompting behavior change, (2) the
influence of cash transfers on health behaviors and outcomes, and (3) the impact of labeling on
resource allocation. These results provide a significant contribution to the literature, specifically
i During the prior trial, we identified an “index child” from each household who was 6-35 months old in July 2015, about one year prior to this study. These same index children were the focus of this trial, with ages ranging from 17 to 47 months during the baseline and interventions in this study. ii Currently health workers collect the relevant information but typically share the measured numbers without enough context for the caregiver to form judgments about the quality of her child’s growth or health status.
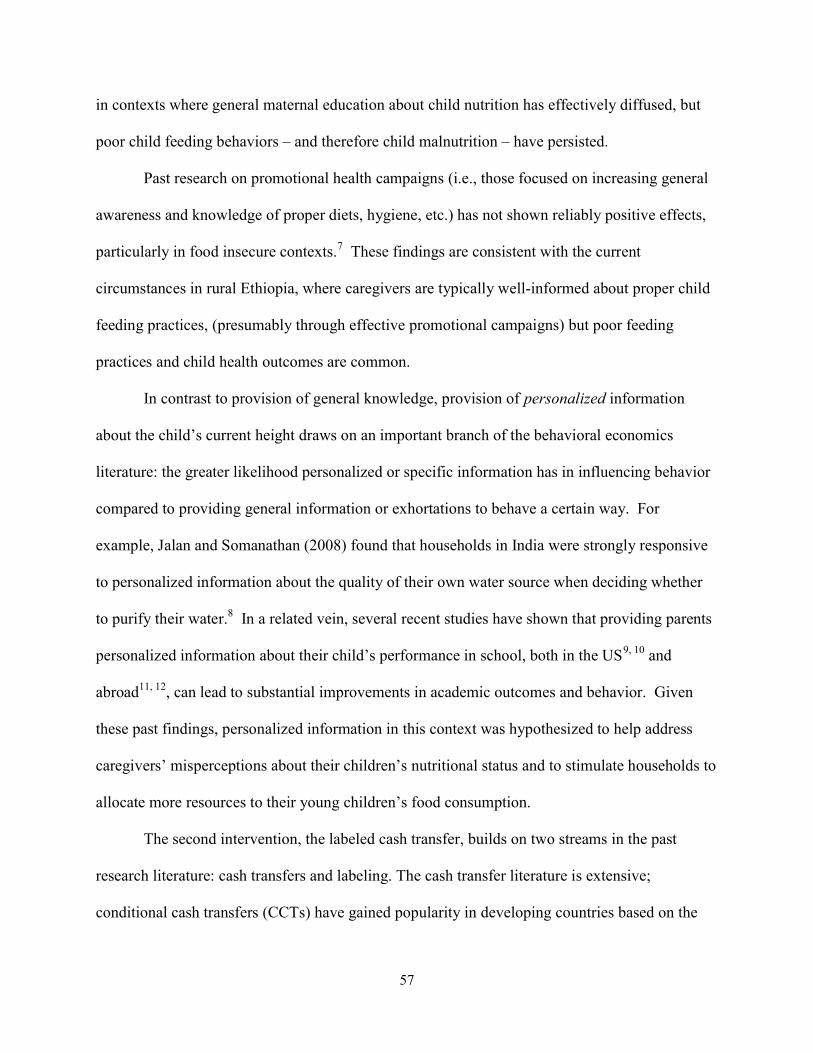
57
in contexts where general maternal education about child nutrition has effectively diffused, but
poor child feeding behaviors – and therefore child malnutrition – have persisted.
Past research on promotional health campaigns (i.e., those focused on increasing general
awareness and knowledge of proper diets, hygiene, etc.) has not shown reliably positive effects,
particularly in food insecure contexts.7 These findings are consistent with the current
circumstances in rural Ethiopia, where caregivers are typically well-informed about proper child
feeding practices, (presumably through effective promotional campaigns) but poor feeding
practices and child health outcomes are common.
In contrast to provision of general knowledge, provision of personalized information
about the child’s current height draws on an important branch of the behavioral economics
literature: the greater likelihood personalized or specific information has in influencing behavior
compared to providing general information or exhortations to behave a certain way. For
example, Jalan and Somanathan (2008) found that households in India were strongly responsive
to personalized information about the quality of their own water source when deciding whether
to purify their water.8 In a related vein, several recent studies have shown that providing parents
personalized information about their child’s performance in school, both in the US9, 10 and
abroad11, 12, can lead to substantial improvements in academic outcomes and behavior. Given
these past findings, personalized information in this context was hypothesized to help address
caregivers’ misperceptions about their children’s nutritional status and to stimulate households to
allocate more resources to their young children’s food consumption.
The second intervention, the labeled cash transfer, builds on two streams in the past
research literature: cash transfers and labeling. The cash transfer literature is extensive;
conditional cash transfers (CCTs) have gained popularity in developing countries based on the
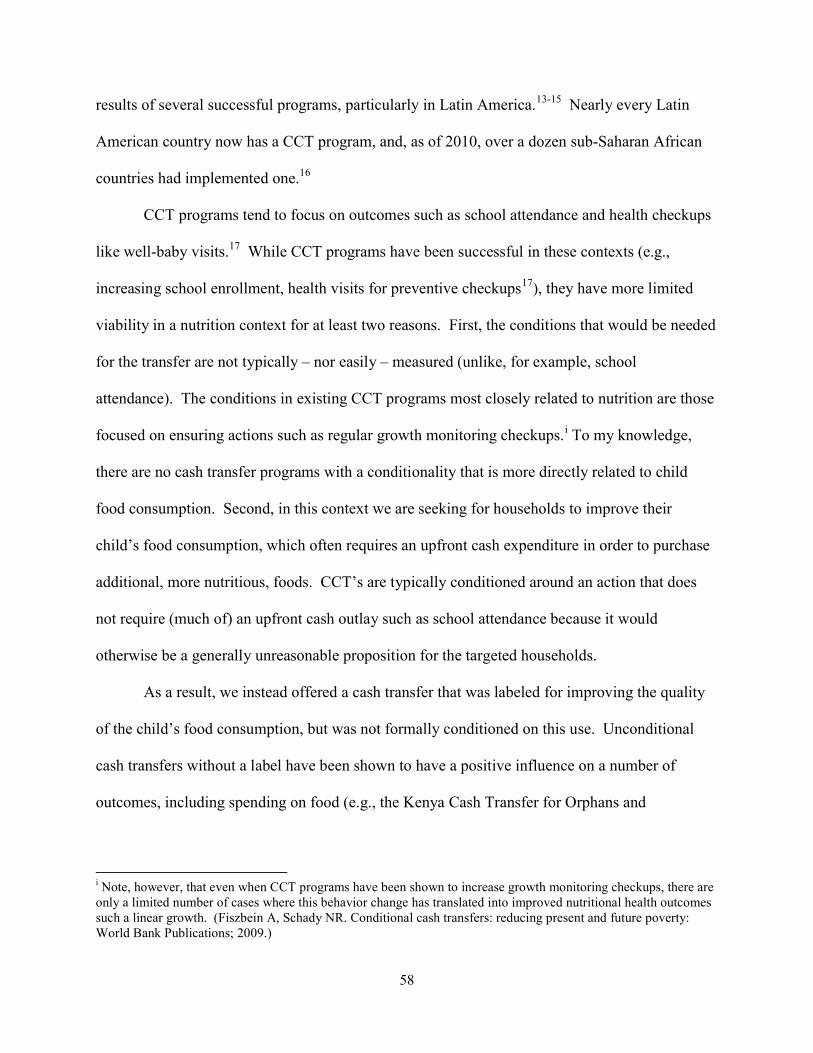
58
results of several successful programs, particularly in Latin America.13-15 Nearly every Latin
American country now has a CCT program, and, as of 2010, over a dozen sub-Saharan African
countries had implemented one.16
CCT programs tend to focus on outcomes such as school attendance and health checkups
like well-baby visits.17 While CCT programs have been successful in these contexts (e.g.,
increasing school enrollment, health visits for preventive checkups17), they have more limited
viability in a nutrition context for at least two reasons. First, the conditions that would be needed
for the transfer are not typically – nor easily – measured (unlike, for example, school
attendance). The conditions in existing CCT programs most closely related to nutrition are those
focused on ensuring actions such as regular growth monitoring checkups.i To my knowledge,
there are no cash transfer programs with a conditionality that is more directly related to child
food consumption. Second, in this context we are seeking for households to improve their
child’s food consumption, which often requires an upfront cash expenditure in order to purchase
additional, more nutritious, foods. CCT’s are typically conditioned around an action that does
not require (much of) an upfront cash outlay such as school attendance because it would
otherwise be a generally unreasonable proposition for the targeted households.
As a result, we instead offered a cash transfer that was labeled for improving the quality
of the child’s food consumption, but was not formally conditioned on this use. Unconditional
cash transfers without a label have been shown to have a positive influence on a number of
outcomes, including spending on food (e.g., the Kenya Cash Transfer for Orphans and
i Note, however, that even when CCT programs have been shown to increase growth monitoring checkups, there are only a limited number of cases where this behavior change has translated into improved nutritional health outcomes such a linear growth. (Fiszbein A, Schady NR. Conditional cash transfers: reducing present and future poverty: World Bank Publications; 2009.)
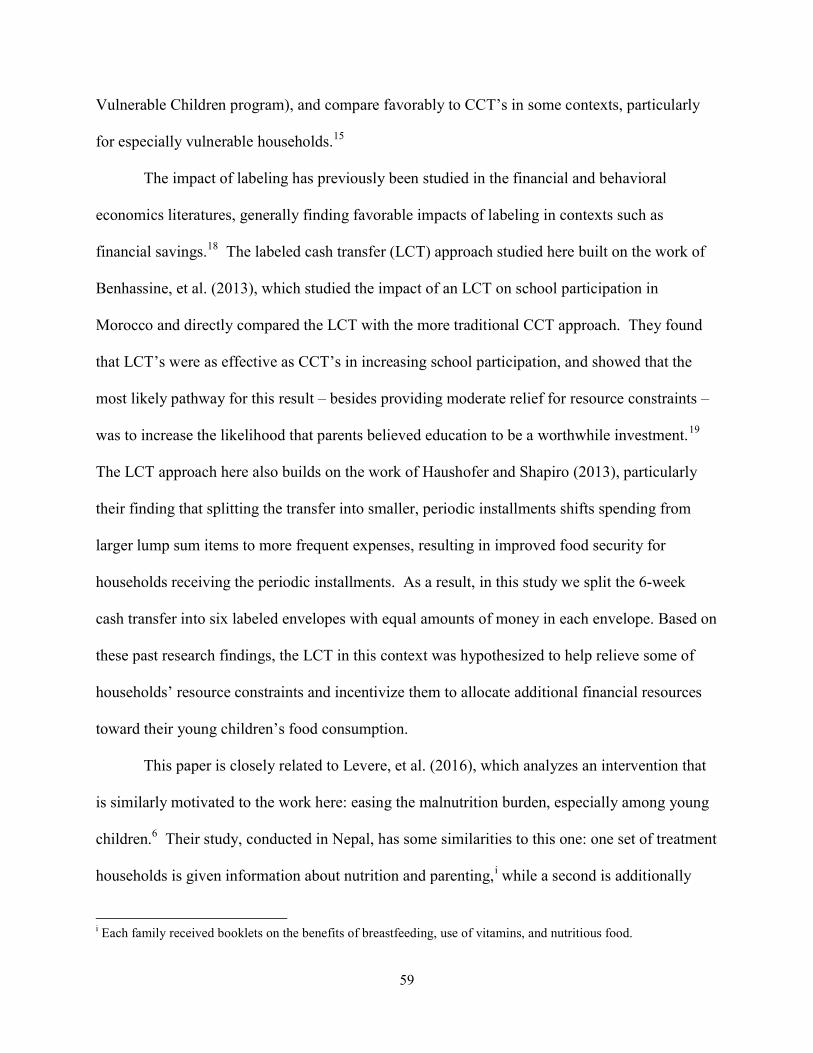
59
Vulnerable Children program), and compare favorably to CCT’s in some contexts, particularly
for especially vulnerable households.15
The impact of labeling has previously been studied in the financial and behavioral
economics literatures, generally finding favorable impacts of labeling in contexts such as
financial savings.18 The labeled cash transfer (LCT) approach studied here built on the work of
Benhassine, et al. (2013), which studied the impact of an LCT on school participation in
Morocco and directly compared the LCT with the more traditional CCT approach. They found
that LCT’s were as effective as CCT’s in increasing school participation, and showed that the
most likely pathway for this result – besides providing moderate relief for resource constraints –
was to increase the likelihood that parents believed education to be a worthwhile investment.19
The LCT approach here also builds on the work of Haushofer and Shapiro (2013), particularly
their finding that splitting the transfer into smaller, periodic installments shifts spending from
larger lump sum items to more frequent expenses, resulting in improved food security for
households receiving the periodic installments. As a result, in this study we split the 6-week
cash transfer into six labeled envelopes with equal amounts of money in each envelope. Based on
these past research findings, the LCT in this context was hypothesized to help relieve some of
households’ resource constraints and incentivize them to allocate additional financial resources
toward their young children’s food consumption.
This paper is closely related to Levere, et al. (2016), which analyzes an intervention that
is similarly motivated to the work here: easing the malnutrition burden, especially among young
children.6 Their study, conducted in Nepal, has some similarities to this one: one set of treatment
households is given information about nutrition and parenting,i while a second is additionally
i Each family received booklets on the benefits of breastfeeding, use of vitamins, and nutritious food.
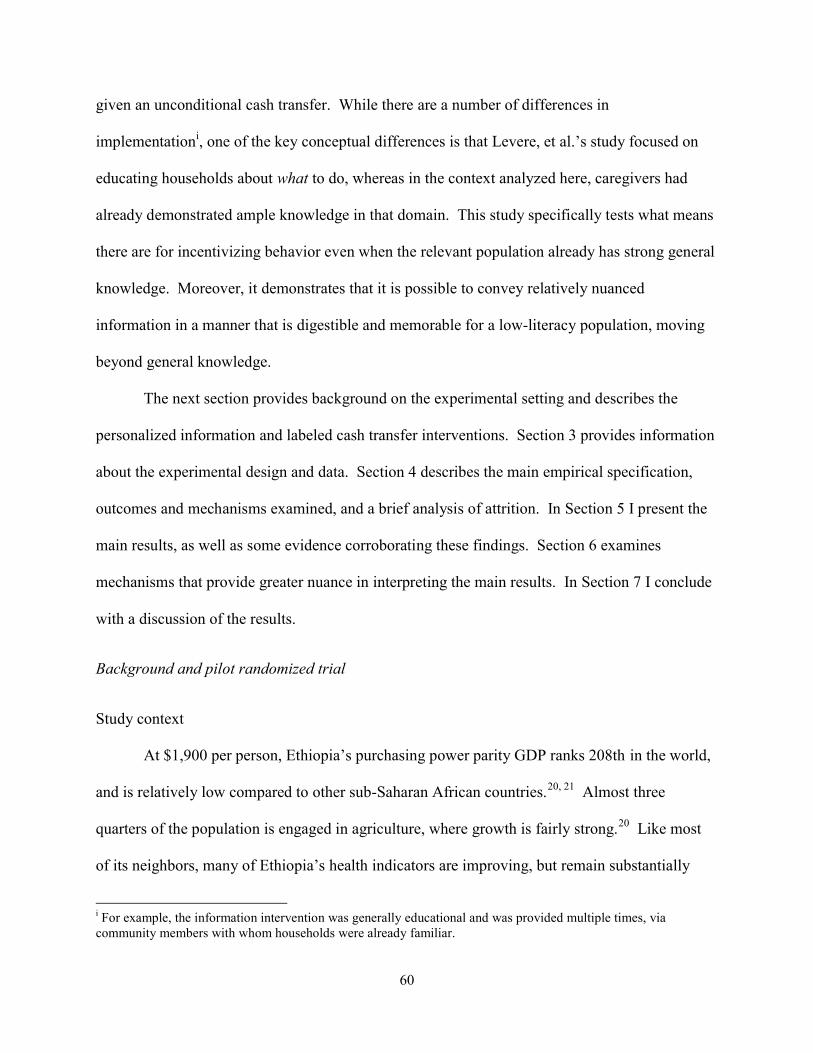
60
given an unconditional cash transfer. While there are a number of differences in
implementationi, one of the key conceptual differences is that Levere, et al.’s study focused on
educating households about what to do, whereas in the context analyzed here, caregivers had
already demonstrated ample knowledge in that domain. This study specifically tests what means
there are for incentivizing behavior even when the relevant population already has strong general
knowledge. Moreover, it demonstrates that it is possible to convey relatively nuanced
information in a manner that is digestible and memorable for a low-literacy population, moving
beyond general knowledge.
The next section provides background on the experimental setting and describes the
personalized information and labeled cash transfer interventions. Section 3 provides information
about the experimental design and data. Section 4 describes the main empirical specification,
outcomes and mechanisms examined, and a brief analysis of attrition. In Section 5 I present the
main results, as well as some evidence corroborating these findings. Section 6 examines
mechanisms that provide greater nuance in interpreting the main results. In Section 7 I conclude
with a discussion of the results.
Background and pilot randomized trial
Study context
At $1,900 per person, Ethiopia’s purchasing power parity GDP ranks 208th in the world,
and is relatively low compared to other sub-Saharan African countries.20, 21 Almost three
quarters of the population is engaged in agriculture, where growth is fairly strong.20 Like most
of its neighbors, many of Ethiopia’s health indicators are improving, but remain substantially
i For example, the information intervention was generally educational and was provided multiple times, via community members with whom households were already familiar.

61
worse than those of developed countries. For example, Ethiopia’s under five mortality rate in
2016 of 59 deaths per 1,000 live births is ten times higher than in OECD nations, but reflects a
significant decline from its 2000 rate of 166.21 Similarly, its under-five stunting rate has fallen
by more than a third over the same period, estimated at 38 percent in 2016.22
Malnutrition has serious consequences for Ethiopia’s economy: the long-term effects of
child undernutrition are estimated to reduce the country’s overall GDP by about a sixth.23
Reflecting the desire to improve childhood nutrition, in the Second Growth and Transformation
Plan the Ethiopian government set the target of reducing its stunting rate to 26 percent by 2020, a
35 percent reduction compared to the baseline rate, 40 percent, in 2015.24 In the Seqota
Declaration, the government pledged to eliminate child malnutrition entirely by 2030.25
Partially targeting these goals, the Ethiopian government has improved supply-side health
care provision. Its Health Extension Program (HEP) was initiated in 2003 as part of the 20-year
Health Sector Development Program in order to help control communicable diseases, equitably
increase access to modern healthcare, and improve awareness and community participation in
healthcare provision.26 The HEP aims to provide promotive, preventive, and some curative
health interventions through its 30,000 government-employed health extension workers (HEWs).
These HEWs are local women with at least a grade 10 education who are given one year of
training. In rural areas, two HEWs are assigned to a health post, typically designed to cover
25,000 people. They are expected to spend about three quarters of their time on outreach,
focusing on households with pregnant women and children under five.27 In practice, households
are visited at least once a month.26 By 2010, almost all rural villages formed of farmers (rather
than nomads) were covered by the HEP, expanding both health services and access to
vaccines.28, 29
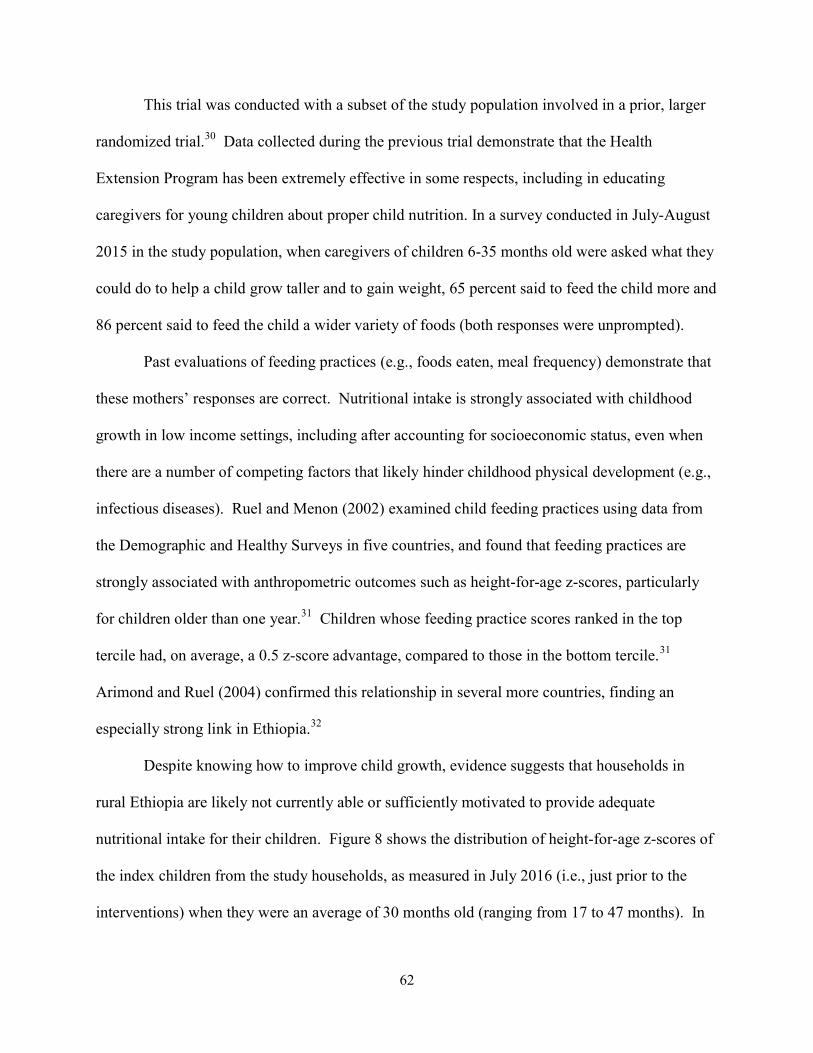
62
This trial was conducted with a subset of the study population involved in a prior, larger
randomized trial.30 Data collected during the previous trial demonstrate that the Health
Extension Program has been extremely effective in some respects, including in educating
caregivers for young children about proper child nutrition. In a survey conducted in July-August
2015 in the study population, when caregivers of children 6-35 months old were asked what they
could do to help a child grow taller and to gain weight, 65 percent said to feed the child more and
86 percent said to feed the child a wider variety of foods (both responses were unprompted).
Past evaluations of feeding practices (e.g., foods eaten, meal frequency) demonstrate that
these mothers’ responses are correct. Nutritional intake is strongly associated with childhood
growth in low income settings, including after accounting for socioeconomic status, even when
there are a number of competing factors that likely hinder childhood physical development (e.g.,
infectious diseases). Ruel and Menon (2002) examined child feeding practices using data from
the Demographic and Healthy Surveys in five countries, and found that feeding practices are
strongly associated with anthropometric outcomes such as height-for-age z-scores, particularly
for children older than one year.31 Children whose feeding practice scores ranked in the top
tercile had, on average, a 0.5 z-score advantage, compared to those in the bottom tercile.31
Arimond and Ruel (2004) confirmed this relationship in several more countries, finding an
especially strong link in Ethiopia.32
Despite knowing how to improve child growth, evidence suggests that households in
rural Ethiopia are likely not currently able or sufficiently motivated to provide adequate
nutritional intake for their children. Figure 8 shows the distribution of height-for-age z-scores of
the index children from the study households, as measured in July 2016 (i.e., just prior to the
interventions) when they were an average of 30 months old (ranging from 17 to 47 months). In
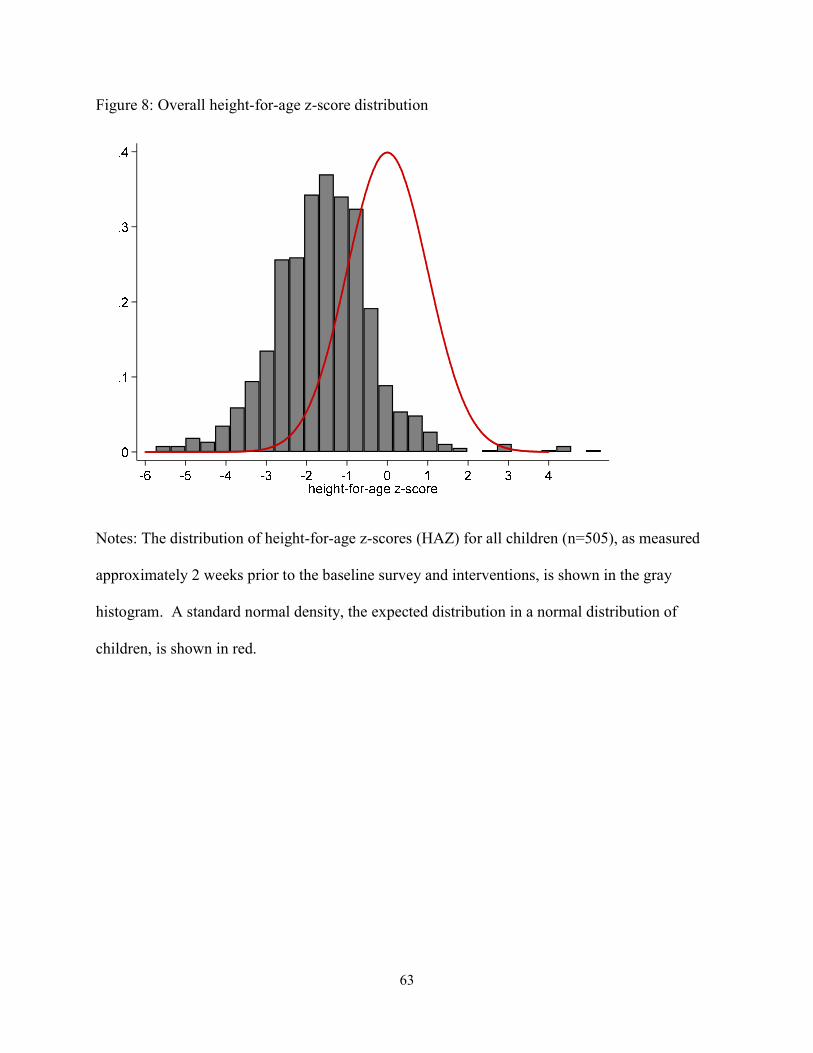
63
Figure 8: Overall height-for-age z-score distribution
Notes: The distribution of height-for-age z-scores (HAZ) for all children (n=505), as measured
approximately 2 weeks prior to the baseline survey and interventions, is shown in the gray
histogram. A standard normal density, the expected distribution in a normal distribution of
children, is shown in red.
64
the average population, this distribution is expected to be centered around 0, as shown by the red
density line, but the mean for children in the study area is much lower, at -1.5. Just over a third
of children fall below the cutoff for moderate malnutrition (HAZ<-2), roughly in line with
Ethiopia’s overall rate.
While there are nutritional deficiencies among children in rural Ethiopia, despite
knowledge among caregivers about how to address these deficiencies, previously collected data
also suggest that caregivers are not fully aware that a problem exists – a pattern that persisted
over multiple survey rounds. In a January 2016 survey, caregivers were asked about their
perceptions of their young child’s growth, and could give answers ranging from “very
concerned” to “very satisfied”. As shown in Figure 9, while concern levels seem to be correlated
with HAZ on average, there are large groups of women whose concern levels do not match with
their child’s actual height status. For example, more than a fifth of children whose mothers were
“very satisfied” with their growth fell below standardized cutoffs for stunting.i
This lack of correlation between the child’s true height status (i.e., how her height
compares to an average population) and the caregiver’s concern may be anticipated for at least
two reasons: (1) caregivers are most commonly comparing their children to other children in the
community, who likely also suffer from similar growth deficiencies, and (2) children suffering
from chronic malnutrition may appear not to have any obvious physical growth deficiencies
since their weight may appear to be appropriate given their height – the issue is most present in
i We also asked caregivers to rank on a scale from 1 to 10 where they believed their child’s height was compared to other children the same age and gender in their village. As shown in Figure 15, caregivers’ beliefs about their child’s actual height status were at times far removed even from their local reality. When comparing to other children in the community, 24 percent of those who ranked their child below average actually had a child who was above the community average in height, and 43 percent of those who ranked their child above average actually had a child who was below the community average in height (standardized for age and gender).
65
Figure 9: Height-for-age z-scores by caregiver concern, pre-intervention
Notes: The distributions of height-for-age z-scores for all children (n=505), as measured in
January 2016, are shown, separated by the caregiver’s concurrent concern level for the child’s
growth (caregivers chose between four options: very concerned, a little concerned, mostly
satisfied, and very satisfied).

66
their height, whose appropriateness is typically difficult to gauge, especially given the first
challenge.
Pilot randomized controlled trial
Study population
The study took place in rural regions of Oromia, Ethiopia, where most households are
engaged in agriculture and have a low socioeconomic status (more detailed demographics are
discussed below and shown in Table 6). Households for this study were randomly selected from
among those who were included in any of the three study groups from a larger study and for
whom relevant data had been collected.i Briefly, inclusion in the larger study required the
household to have a child who was 6-35 months old for the previous study’s baseline survey in
July-August 2015 (referred to as the “index child”ii, 17-47 months at the beginning of this study)
and for the household to have land for crop cultivation. 521 households were initially selected
for this study, with 16 attriters due to relocation or caregiver illness. The geographic area for the
households for this study is shown in Figure 10.
General child nutrition information
All households in the study were given general child nutrition educational messaging,
immediately after the baseline survey and prior to any treatments. This messaging focused on
appropriate child feeding habits complemented by breastfeeding and ways to maintain proper
hygiene during food preparation and consumption.iii The messaging emphasized beneficial
i Households could only be included if we had successfully collected the following information during the previous, larger study: index child’s height, age, gender, whether the caregiver attended school, and the number of people in the household. Randomization into study groups for this study was stratified by the previous study group. ii If there was more than one child in the relevant age range, the youngest child was selected as the index child. iii The messages were adapted for the local context from standard child nutrition guidelines developed by UNICEF, found at: http://www.unicef.org/nutrition/files/counseling_cards_Oct._2012small.pdf.
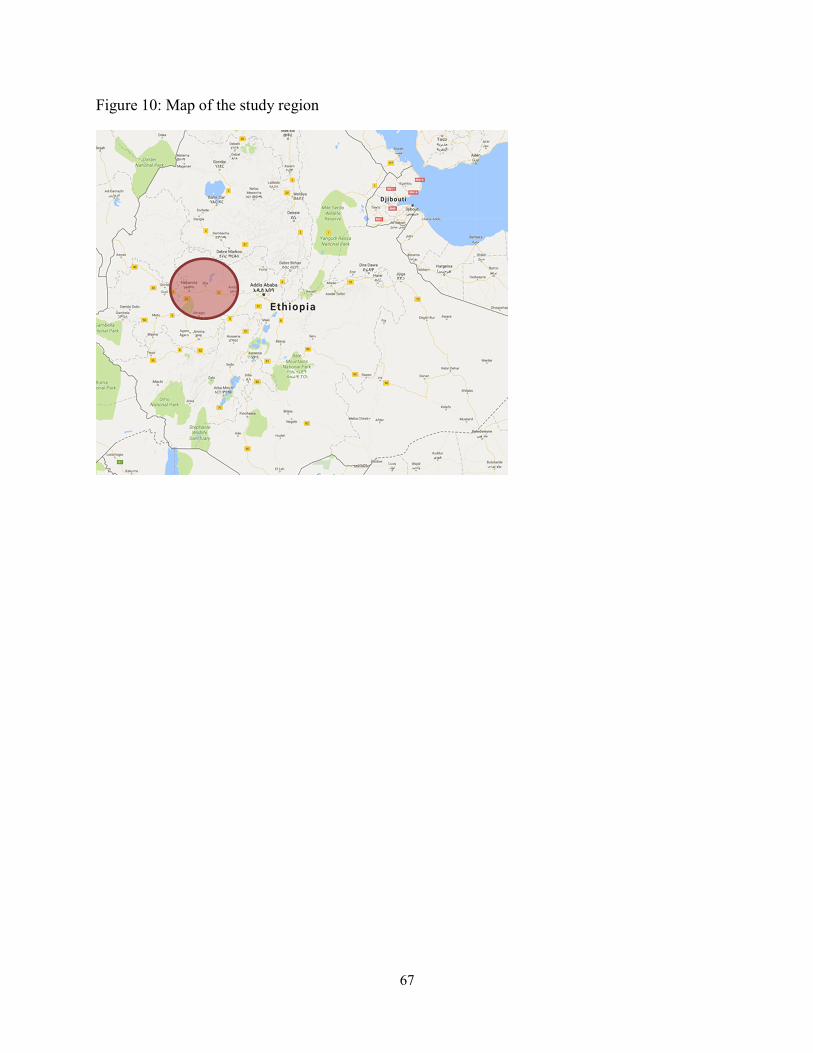
67
Figure 10: Map of the study region

68
actions that were feasible in the context, especially egg consumption.i The specific script and
accompanying visual guide are shown in the supplementary materials.
Treatment 1: Personalized information treatment
In June-July 2016, just prior to this study, we collected anthropometric measures on the
index children, including the children’s height. Based on these data, for households assigned to
the information treatment, enumerators provided personalized information to the index child’s
primary caregiver about the child’s current height. The enumerators carried a small poster that
visually showed where the child’s height fell compared to “healthy” children of the same age and
gender in East Africa. An English version of this card is shown in Figure 11. In practice, a child
was indicated to be in the lowest category (of 5) if her HAZ was <-2, the second if -2<HAZ<-1,
the third (middle) if -1<HAZ<0, the fourth if 0<HAZ<1, and the highest if HAZ>1. A third of
children fell into each of the first two categories, less than a quarter were in the third, and the
remaining 9 percent were in the top two categories.
Before circling the index child’s position on the poster, the enumerators ensured that the
caregivers understood the visual guide by pointing to 3-4 positions on the figure (including at
least once at the second or fourth position, to be sure of an adequate understanding of the more
nuanced positions) and asking the caregiver to explain what such a position indicated. The
enumerators emphasized to the caregivers that short stature is due to poor chronic malnutrition
and is not just attributable to factors such as a family tendency for short stature or a recent
illness. During this visit, the enumerators additionally pointed out that chronic malnutrition is
i Note that the previous study focused on an improved maize variety, Quality Protein Maize, so a subset of the households had recently received educational messaging around protein and its importance for child growth (randomization for this study stratified by previous treatment group).
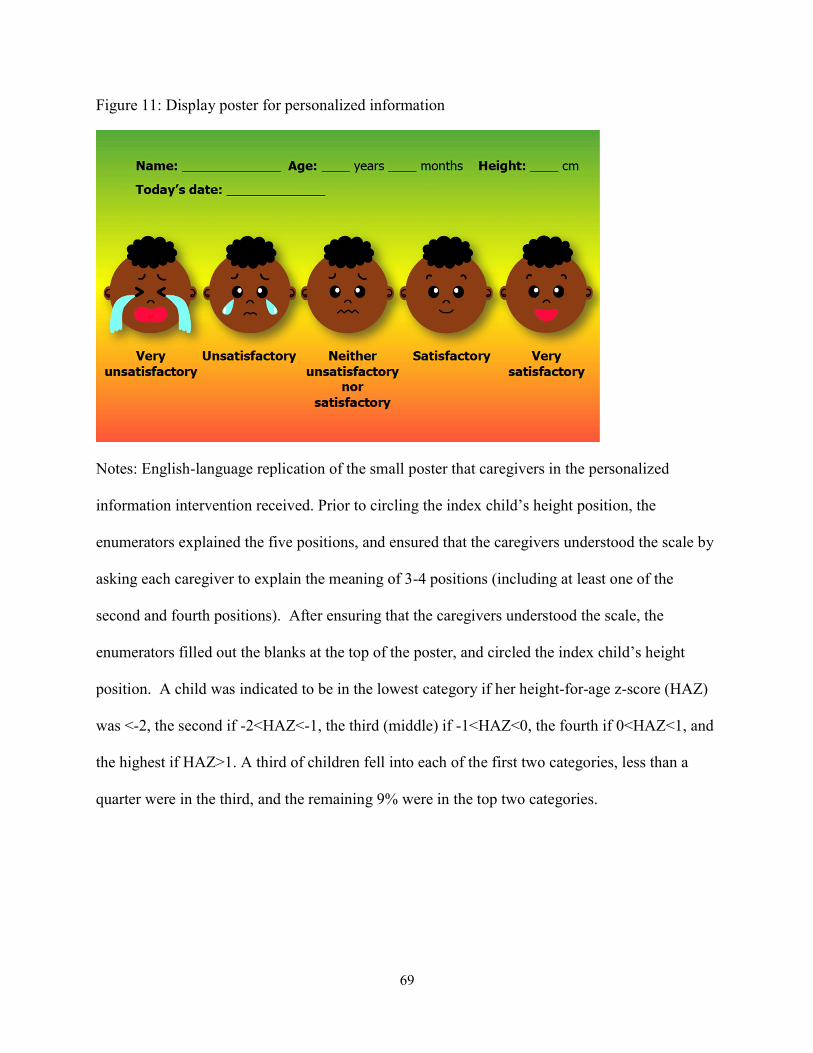
69
Figure 11: Display poster for personalized information
Notes: English-language replication of the small poster that caregivers in the personalized
information intervention received. Prior to circling the index child’s height position, the
enumerators explained the five positions, and ensured that the caregivers understood the scale by
asking each caregiver to explain the meaning of 3-4 positions (including at least one of the
second and fourth positions). After ensuring that the caregivers understood the scale, the
enumerators filled out the blanks at the top of the poster, and circled the index child’s height
position. A child was indicated to be in the lowest category if her height-for-age z-score (HAZ)
was <-2, the second if -2<HAZ<-1, the third (middle) if -1<HAZ<0, the fourth if 0<HAZ<1, and
the highest if HAZ>1. A third of children fell into each of the first two categories, less than a
quarter were in the third, and the remaining 9% were in the top two categories.
70
not immediately life-threatening.i All of the information used for the personalized information is
already regularly collected by community health workers in Ethiopia, but the information was
visually presented in a way that provided context for the caregiver to evaluate her child’s
nutritional status (i.e., physical size).
The personalized information did not focus on weight because: (1) it is generally easier
for parents to identify that their child does not weigh enough (i.e., wasting) compared to knowing
that their child is too short (i.e., stunting) since a child who is wasted will have relatively obvious
markers such as unusually thin limbs, so providing this information is less likely to correct past
misperceptions, and (2) the focus of this study is on addressing chronic malnutrition, which is
better represented by height, rather than acute malnutrition or recent illness, which are more
related to weight.33
Treatment 2: Labeled cash transfer treatment
Caregivers in households assigned to the second treatment received a cash transfer
labeled for child food consumption. The caregivers were told the money is designed to cover
additional spending for food for the index child (and any other younger children in the
household) over the next six weeks, and not to free up money for other household purchases that
would have occurred regardless. The cash transfer had multiple “labeling” dimensions designed
to overcome behavioral biases. First, in order to encourage the caregivers not to spend the
money all at once, the transfer was evenly split and handed to the caregivers in six sealed
envelopes that were labeled with a number 1 to 6 and the dates for the week the money in the
envelope should be spent. Second, in order to encourage the caregivers to use the money only
i Any child who was found to have acute malnutrition would have been referred during the anthropometric measurements prior to the study, and would not be included in the sample.
71
for additional spending for the index child, the index child’s name was written on each of the six
envelopes. Enumerators clearly stated that this was a one-time money transfer, and ensured
privacy when distributing the money to the caregiver, including from other family members.
The total value of the transfer, 150 birr (about $7.50 at the time of the intervention), was
designed to provide sufficient money to purchase eggs 5-7 times per week, as these were found
during piloting and focus groups to be the primary food that caregivers felt they would like to
feed their young children more but cannot afford.i Previously studied cash transfer schemes
have had a wide range of transfer values, ranging from a few percent up to 20 or more percent of
mean household income.17 The per-week cash transfer amount studied here (25 birr, $1.25) is
mid-range, amounting to just over 15 percent of average weekly spending.
Experimental design and data
I evaluate the impact of the randomized trial using two waves of data collection from
study households and local markets; the first round occurred just prior to the interventions and
the second occurred 6 weeks later.ii Baseline surveys were conducted in July 2016 with 515
households across 8 kebelesiii. In the randomly selected treatment households, the interventions
were delivered to the index child’s primary caregiver immediately after the baseline survey.iv
The endline surveys were conducted in August-September 2016, with 505 households. The
entire study occurred over two of the most food insecure months of the year for the average
household in the study area.
i While mothers frequently referenced milk as something they would like to feed their children, it is uncommon in the study area to purchase milk from the market, so eggs were given the most emphasis. ii In practice, follow up surveys occurred 4.3-7.3 weeks after the baseline surveys, with more than three quarters occurring between 5 and 6 weeks after baseline. iii A “kebele” is a group of villages and the smallest administrative unit in Ethiopia, generally covering about 500 households or 3,500-4,000 people. iv In cases where the household was selected for both treatments, the personalized information treatment always preceded the cash transfer treatment.
72
The interventions and survey questions were extensively tested near the study area prior
to the data collection and interventions through focus groups and individual piloting. Many of
the survey questions were drawn from standard questionnaires (e.g., the Demographic and
Health Surveys), with minor modifications to reflect regional differences. The baseline and
endline caregiver surveys were nearly identical, apart from two additional modules that were
included at the endline for households in each of the treatment groups. The surveys included
questions about recent food consumption (7 day and 24 hour recall for the index child, 7 day
recall for other key family members), spending, caregiver perceptions and beliefs about child
growth, parental involvement, satisfaction, empowerment, food security, and child illness.
Additionally, we collected prices for key food items (e.g., maize, eggs, cooking oil) from the
largest market in each study community. The primary outcomes of interest relate to the index
child’s food consumption and the household’s expenditures.
Households were randomly assigned, with equal probability, to one of four study groups:
(1) control, (2) personalized information only, (3) labeled cash transfer only, or (4) personalized
information and labeled cash transfer. The randomization was stratified by treatment group from
the larger study on which this pilot was built and whether the index child’s caregiver had ever
attended school (one third of the sample). The randomization was carried out using the
randomize Stata command, set to achieve balance on the index children’s height-for-age z-
scores, as measured a couple weeks prior to the baseline and intervention, and the household
size, as measured 4-5 months prior to the start of the study. Ultimately there were 124
households in the control group, 126 in the pure personalized information group, 123 in the pure
labeled cash transfer group, and 132 in the joint personalized information plus labeled cash
transfer group.
73
Baseline mean values for index child, caregiver, and household characteristics in each the
study groups are shown in Table 6. The values in the last column show the p-value for an F-test
of equality across the four groups; starred values indicate that the study group is individually
statistically significantly different from the control group, at the indicated levels. The study
groups are statistically indistinguishable at baseline on almost all measures. The one household
characteristic that shows imbalance overall is whether the household’s primary water source is
unprotected, which is significantly more likely to be true for households in the control group.
Among measures of the index child’s food consumption, the number of days in the past week
that the child consumed eggs is not balanced, with one of the cash transfer groups showing
significantly higher baseline magnitudes. The full distribution of baseline 7 day egg
consumption is shown in Figure 17 (supplementary materials), which shows that the imbalance is
driven primarily by a few outlier cases; dropping the four cases where the caregiver reported the
index child consuming eggs every day of the last week results in a p-value from the test of
equality across groups of 0.15. Given that my analyses are conducted accounting for baseline
values and that these high values are present in a treatment group, there is not a strong concern of
bias even with this baseline imbalance.
Overall, Table 6 shows the relatively poor nutritional status of children and low socio-
economic status of households in the study sample. For example, a third of children in the
sample are stunted (HAZ<-2), two thirds of caregivers never attended school, and about a quarter
of the households has no toilet. Index children’s diets most frequently included cereal-based
foods and those made with oil, butter, etc. These values are in line with rural Ethiopia as a whole,
as measured through the 2016 Demographic and Health Survey.
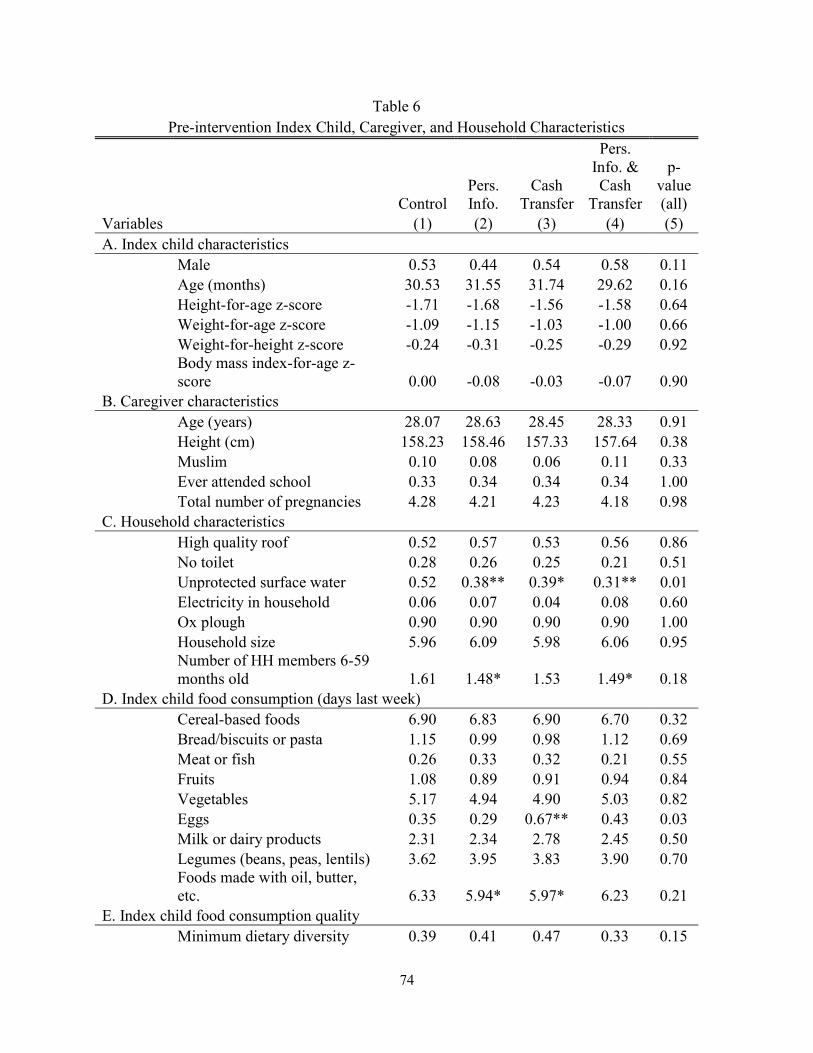
74
Table 6 Pre-intervention Index Child, Caregiver, and Household Characteristics
Control Pers. Info.
Cash Transfer
Pers. Info. & Cash
Transfer
p-value (all)
Variables (1) (2) (3) (4) (5) A. Index child characteristics
Male 0.53 0.44 0.54 0.58 0.11 Age (months) 30.53 31.55 31.74 29.62 0.16 Height-for-age z-score -1.71 -1.68 -1.56 -1.58 0.64 Weight-for-age z-score -1.09 -1.15 -1.03 -1.00 0.66 Weight-for-height z-score -0.24 -0.31 -0.25 -0.29 0.92 Body mass index-for-age z-score 0.00 -0.08 -0.03 -0.07 0.90
B. Caregiver characteristics Age (years) 28.07 28.63 28.45 28.33 0.91 Height (cm) 158.23 158.46 157.33 157.64 0.38 Muslim 0.10 0.08 0.06 0.11 0.33 Ever attended school 0.33 0.34 0.34 0.34 1.00 Total number of pregnancies 4.28 4.21 4.23 4.18 0.98
C. Household characteristics High quality roof 0.52 0.57 0.53 0.56 0.86 No toilet 0.28 0.26 0.25 0.21 0.51 Unprotected surface water 0.52 0.38** 0.39* 0.31** 0.01 Electricity in household 0.06 0.07 0.04 0.08 0.60 Ox plough 0.90 0.90 0.90 0.90 1.00 Household size 5.96 6.09 5.98 6.06 0.95 Number of HH members 6-59 months old 1.61 1.48* 1.53 1.49* 0.18
D. Index child food consumption (days last week) Cereal-based foods 6.90 6.83 6.90 6.70 0.32 Bread/biscuits or pasta 1.15 0.99 0.98 1.12 0.69 Meat or fish 0.26 0.33 0.32 0.21 0.55 Fruits 1.08 0.89 0.91 0.94 0.84 Vegetables 5.17 4.94 4.90 5.03 0.82 Eggs 0.35 0.29 0.67** 0.43 0.03 Milk or dairy products 2.31 2.34 2.78 2.45 0.50 Legumes (beans, peas, lentils) 3.62 3.95 3.83 3.90 0.70 Foods made with oil, butter, etc. 6.33 5.94* 5.97* 6.23 0.21
E. Index child food consumption quality Minimum dietary diversity 0.39 0.41 0.47 0.33 0.15
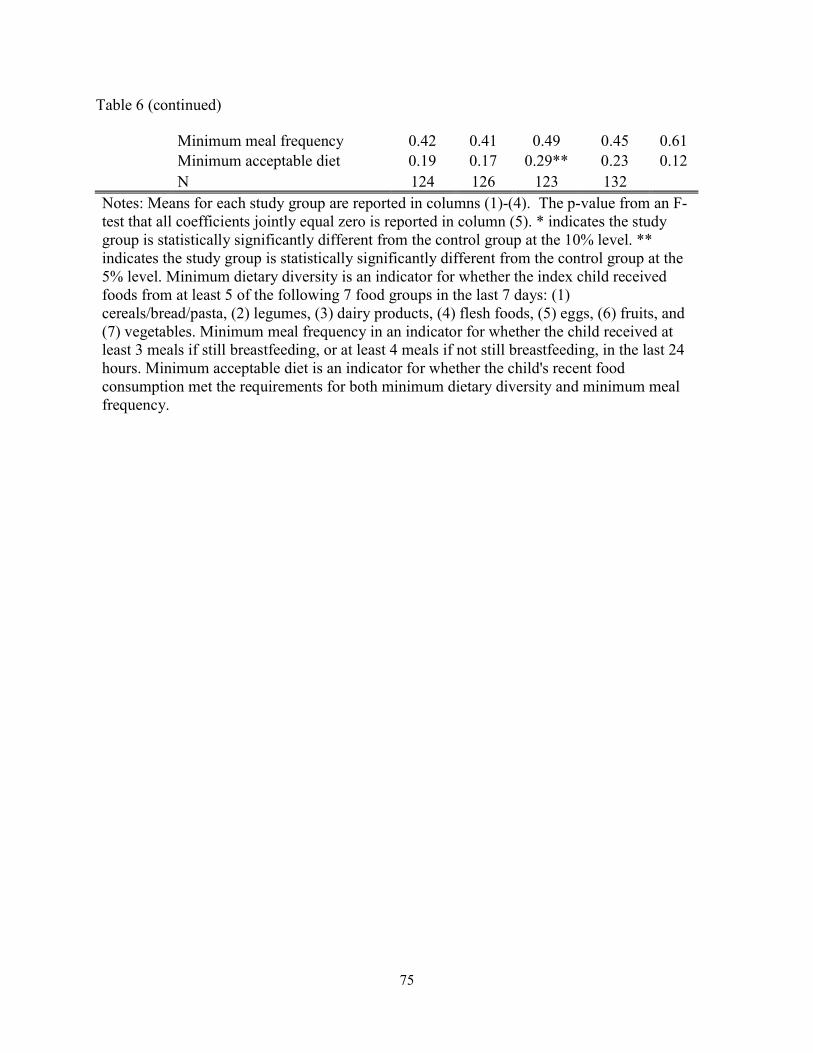
75
Table 6 (continued)
Minimum meal frequency 0.42 0.41 0.49 0.45 0.61 Minimum acceptable diet 0.19 0.17 0.29** 0.23 0.12
N 124 126 123 132 Notes: Means for each study group are reported in columns (1)-(4). The p-value from an F-test that all coefficients jointly equal zero is reported in column (5). * indicates the study group is statistically significantly different from the control group at the 10% level. ** indicates the study group is statistically significantly different from the control group at the 5% level. Minimum dietary diversity is an indicator for whether the index child received foods from at least 5 of the following 7 food groups in the last 7 days: (1) cereals/bread/pasta, (2) legumes, (3) dairy products, (4) flesh foods, (5) eggs, (6) fruits, and (7) vegetables. Minimum meal frequency in an indicator for whether the child received at least 3 meals if still breastfeeding, or at least 4 meals if not still breastfeeding, in the last 24 hours. Minimum acceptable diet is an indicator for whether the child's recent food consumption met the requirements for both minimum dietary diversity and minimum meal frequency.
76
Empirical Strategy
Empirical specification
Given random assignment to each intervention and measurement of almost all outcomes
at both baseline and endline (six weeks apart), we identify short-term causal treatment effects
through the following specification:
𝑦 = 𝛽 + 𝛽 𝑃𝑒𝑟𝑠𝐼𝑛𝑓𝑜 × 𝑃𝑂𝑆𝑇 + 𝛽 𝐿𝐶𝑇 × 𝑃𝑂𝑆𝑇 + 𝛽 𝑃𝐼 × 𝐿𝐶𝑇 × 𝑃𝑂𝑆𝑇 + 𝑃𝑂𝑆𝑇 +
𝛾 𝐼𝑛𝑑𝑒𝑥𝐶ℎ𝑖𝑙𝑑𝐶ℎ𝑎𝑟𝑠 × 𝑃𝑂𝑆𝑇 + 𝛾 𝐻𝐻𝐶ℎ𝑎𝑟𝑠 × 𝑃𝑂𝑆𝑇 + 𝛾 𝑃𝑟𝑒𝑣𝑇𝑥 × 𝑃𝑂𝑆𝑇 + 𝛼 + 𝜖
Where 𝑦 is the outcome for individual/household 𝑖 at time 𝑡
𝑃𝑒𝑟𝑠𝐼𝑛𝑓𝑜 is an indicator equal to 1 if individual/household 𝑖 is selected for the
personalized information treatment
𝐿𝐶𝑇 is an indicator equal to 1 if individual/household 𝑖 is selected for the labeled
cash transfer treatment
𝑃𝑂𝑆𝑇 is an indicator equal to 1 at endline
𝐼𝑛𝑑𝑒𝑥𝐶ℎ𝑖𝑙𝑑𝐶ℎ𝑎𝑟𝑠 is a vector of index child characteristics (age, gender)
𝐻𝐻𝐶ℎ𝑎𝑟𝑠 is a vector of the household characteristics in panel C of Table 6
𝑃𝑟𝑒𝑣𝑇𝑥 is a vector of indicators for treatment groups in the previous study
𝛼 are household (i.e., child) fixed effects
The key coefficients of interest are 𝛽 , 𝛽 , and 𝛽 , which give estimates of the average treatment
effects of the interventions, controlling for baseline values. When analyzing mechanisms (e.g.,
whether the caregiver had attended school), I additionally include the mechanism interacted with

77
all factors involving the indicator for post and interacted with all study group indicators (all
mechanisms are based on characteristics measured at baseline).
Because comparisons across the three treatment groups, in addition to directly with the
control group, are informative when analyzing the interventions, I report p-values for several
tests in the last four rows of the results tables that correspond to various combinations of tests of
equality of groups: (1) personalized information alone = labeled cash transfer alone (𝛽 = 𝛽 ),
(2) personalized information alone = personalized information and labeled cash transfer (𝛽 =
𝛽 ), (3) labeled cash transfer alone = personalized information and labeled cash transfer (𝛽 =
𝛽 ), and (4) an F-test that all coefficients jointly equal zero (𝛽 = 𝛽 = 𝛽 ).
Outcomes and mechanisms examined
The interventions were ultimately aimed at improving the nutritional status (i.e., growth)
of the index children. In addition to children’s growth, we focus the analyses on three key
intermediate outcomes: (1) caregivers’ perceptions of the child’s growth, (2) index children’s
food consumption, and (3) household spending.i
Caregiver beliefs, recall, and concern
I begin with a brief analysis of caregivers’ ability to recall the information we told them
(in the personalized information group) and then of changes in their perceptions about their
children’s nutritional status and growth. Within the personalized information group, we report
how well caregivers were able to recall the information we provided to them 6 weeks prior.
Across all groups, we then briefly examine how the interventions influenced caregivers’
perceptions of their own child’s position on the 5 point Likert scale comparing to other healthy
i The main outcomes were pre-specified on clinicaltrials.gov: NCT02903641.
78
children the same age and gender from East Africa, how that compares with the child’s actual
position, and the impact on caregivers’ concern for their children’s growth. These measures are
useful for establishing whether the information provided to the caregivers was memorable, but
we interpret responses as reflecting both changes in the caregivers’ actual perceptions and their
knowledge of the “correct” responses after being given the new information about their child’s
actual height position.
Index child’s food consumption
In Ethiopia complementary foods (i.e., those fed to children transitioning from
breastfeeding to family foods) tend to be made from cereals or root crops into a thin, starchy
gruel or an unleavened bread.34 It is therefore unsurprising that two thirds of the foods that
Ethiopian children 6-23 months consume are grain-based.35 These grain-based foods are
nutritionally problematic both due to the low protein content and the difficulty for the caregiver
in assessing how much the child has actually consumed.36 As a result, the general nutrition
education that was provided to all caregivers in the study emphasized the importance of protein-
rich foods in young children’s diets. These foods are therefore also the focus in the analyses
below, measured through 7 day food recalls where the caregiver is asked how many days in the
past week the index child consumed a range of food groups, including eggs, meat or fish, and
legumes.
The quality of a child’s food consumption extends beyond what specifically the child
eats, including factors such as the frequency and diversity of consumption. I adapt three
measures the WHO has developed to measure these dimensions of a child’s food consumption
quality37: (1) minimum dietary diversity, (2) minimum meal frequency, and (3) minimum
acceptable diet. The first, minimum dietary diversity, is a binary indicator for whether the index
79
child consumed at least 5 of 7 food groups in the past week: cereals/bread/pasta, legumes, dairy
products, flesh foods, eggs, fruits, and vegetables. The second, minimum meal frequency, is a
binary indicator for whether the child received at least 3 meals if still breastfeeding, or at least 4
meals, if not still breastfeeding, in the last 24 hours. The final, minimum acceptable diet, is a
binary indicator for whether the child met the requirements of both minimum dietary diversity
and minimum meal frequency.
Household spending
For most households in the study area, improving the index child’s food consumption
would require purchasing more or different foods in the market. For example, less than a third of
the households had a hen that produced eggs, and even those who did have a hen would likely
need to purchase some eggs from the market to make a substantial increase in their child’s egg
consumption. As a result, increases in spending on key food items in households receiving the
personalized information treatment should have occurred (at least on average), if the information
was sufficiently compelling (i.e., different from baseline beliefs and believable), the caregiver
knew how to improve the quality of the child’s consumption, and the household had any
budgetary slack or opportunity for reallocating its spending. Considering that the cash transfer
was labeled as being specifically for increasing the quality of the index child’s food
consumption, spending on key food items should plausibly increase among households receiving
this intervention as well.i
In order to measure changes in spending, we asked caregivers about their household’s
spending on a range of food items, as well as most common expenses (e.g., transportation, school
i Other relevant factors, such as budgetary slack, are further considered in Section 6.
80
fees, health expenses), over the past month. Among these regular expenses, food expenses made
up nearly three quarters of spending for the average household.
As with any cash transfer, it is of interest – and potentially concern – whether the cash
leaks into savings or spending on unintended items. Leaks into spending on something like
health expenses or savings may have ambiguous welfare effects – or at least efficiency concerns
since there may be more effective ways to improve these outcomes, whereas increased spending
on vice goods like alcohol or tobacco may have a more clear interpretation. We therefore also
conduct a brief analysis of impacts on non-food spending.
Index child anthropometrics
The ultimate goal of this and other child nutrition-focused interventions is to improve
children’s nutritional status – in other words, the child’s physical growth. Children’s nutritional
status is most commonly measured through age- and gender-standardized z-scores related to the
children’s height and weight. In this study, we analyze three of these common measures: (1)
height-for-age z-score, (2) weight-for-height z-score, and (3) height-for-age z-score, all based on
the 2006 WHO child growth standards. While we may plausibly see short-term improvements in
weight, it typically takes 6-12 months for measurable differences in group-level standardized
measures related to height to become apparent.
Secondary analyses
In order to better understand for what subgroups the interventions were most effective,
we analyze the effects on two key outcomes, the index child’s egg consumption and an indicator
for minimum dietary diversity, stratified by three characteristics: (1) baseline height-for-age z-
score, (2) baseline weight-for-age z-score, and (3) index child’s sex. We may expect that the
81
effects are more or less pronounced for children who are more vulnerable, and these
stratifications provide suggestive evidence around this.
Additionally, because results around feeding and spending are self-reported (while
enumerators were blinded to the treatment when asking these questions, respondents necessarily
were not at endline), we conduct a brief analysis to examine the internal consistency of
respondents’ answers to questions that were asked at different times during the interviews.
Specifically, we examine whether reported changes in consumption of and spending on eggs are
plausible within a household.
Mechanisms
We explore four potential mechanisms that may help explain when the interventions were
most effective: (1) whether the caregiver controls the household’s money, (2) whether the
caregiver attended any school, (3) whether the household faces a particularly strained budget,
and (4) whether the information provided is worse than the caregiver’s prior beliefs. Whether
the caregiver controls the money is an indicator for whether the caregiver reported at baseline
that she, or she with the household head, usually decides how the household’s money is spent.
Budgetary strain is an indicator for the caregiver reporting, at baseline, at least one of: (1) the
household borrowed money in the previous six weeks, or (2) the household had any unexpected
monetary expenses in the past month (e.g., illness, conflict with neighbors). Worse information
is an indicator for cases where the caregiver’s baseline beliefs about where the child falls on the
5 point Likert scale is higher than the child’s actual position (i.e., that the caregiver
overestimated the child’s relative height).
In the first case, it is hypothesized that in cases where the caregiver has control over the
household’s money, both interventions are more likely to be effective since both are targeted at
82
the caregiver. In the second case, it is not clear how greater caregiver education would influence
the effect of the interventions. One hypothesis is that caregivers who had some education would
be more responsive to the interventions given past socioeconomic gradients in responsiveness to
similar interventions. Another compelling ex ante hypothesis is that caregivers with more
education would have already been allocating food in relatively optimal ways, suggesting that
the effect would be larger for those with a lower socioeconomic status. It is also not ex ante
clear how budgetary strain should influence responsiveness to the interventions. Those who are
relatively budget constrained may be more responsive to the cash transfers, but may also be less
able to allocate the unexpected cash infusion in the intended manner. Finally, receiving new
information that the index child is doing worse than the caregiver previously believed may
inspire behavior change, or, conversely, may discourage caregivers.
Attrition
Given that this study was built upon a prior, larger study, attrition was unusually low for
a field study, about 3 percent. There were initially 521 households selected for the study. We
conducted baseline surveys and the interventions with 515 of these, and successfully reached 505
of these for the endline survey. Overall, attrition rates for the four study groups ranged from less
than 1 percent to 4.6 percent.i
Results
Caregiver beliefs, recall, and concerns
I begin by describing caregivers’ beliefs about their child’s nutritional status, as measured
just prior to the interventions. The distributions of true height-for-age z-scores, separated by the
i Attrition across the three study groups was: control: 6/130; personalized information only: 4/130; labeled cash transfer only: 5/128; personalized information and labeled cash transfer: 1/133.
83
caregivers’ pre-intervention beliefs, are shown in Figure 12. Consistent with earlier rounds of
data collection with similar questions, there is not a strong right-ward shift in distributions of the
HAZ scores as caregivers’ perceptions increase. Moreover, there are significant densities of
cases where the caregivers’ perceptions are extremely incorrect (e.g., a belief that the child is
very tall whereas she is truly far below a healthy height).i
Among those who received the personalized information at baseline, 22 percent of
caregivers reported being unable to recall the information they were given about their child’s
height position at the endline 6 weeks later. Among those who did report remembering, 74
percent did actually remember correctly and 87 percent reported a recalled height position within
one position of the child’s actual height position.ii
Index child’s food consumption
In Table 7, I report the impact of the interventions on outcomes related to the index
child’s food consumption. Compared to a baseline mean in the control group of 0.36 days where
eggs were consumed per week, index children in the personalized information group consumed
eggs 0.24 more days per week as a result of the intervention, corresponding to a 67 percent
increase. Children in the cash transfer groups increased their consumption by more than 0.6
days, a 166 percent increase in egg consumption. There do not appear to be any meaningful
differences in egg consumption associated with adding the personalized information treatment to
i The same distributions are shown split by study group in Figure 18; this pattern is consistent across treatment groups. ii In Table 16 of the supplementary materials, I show additional evidence that caregivers gained and internalized new information through the personalized information intervention. Caregivers in the personalized information group reported perceived height positions for their children of 0.4 steps lower (on a 5 point scale), as shown in Column 1. The second specification further shows that the discrepancy between the caregivers’ perceived position for their index child and the child’s actual position decreased by about 0.4 steps for caregivers who received the personalized information. Despite these changes in perception (combined with their knowledge of the “correct” position), there do not appear to be substantial changes in concern about the child’s growth, shown in the final specification.
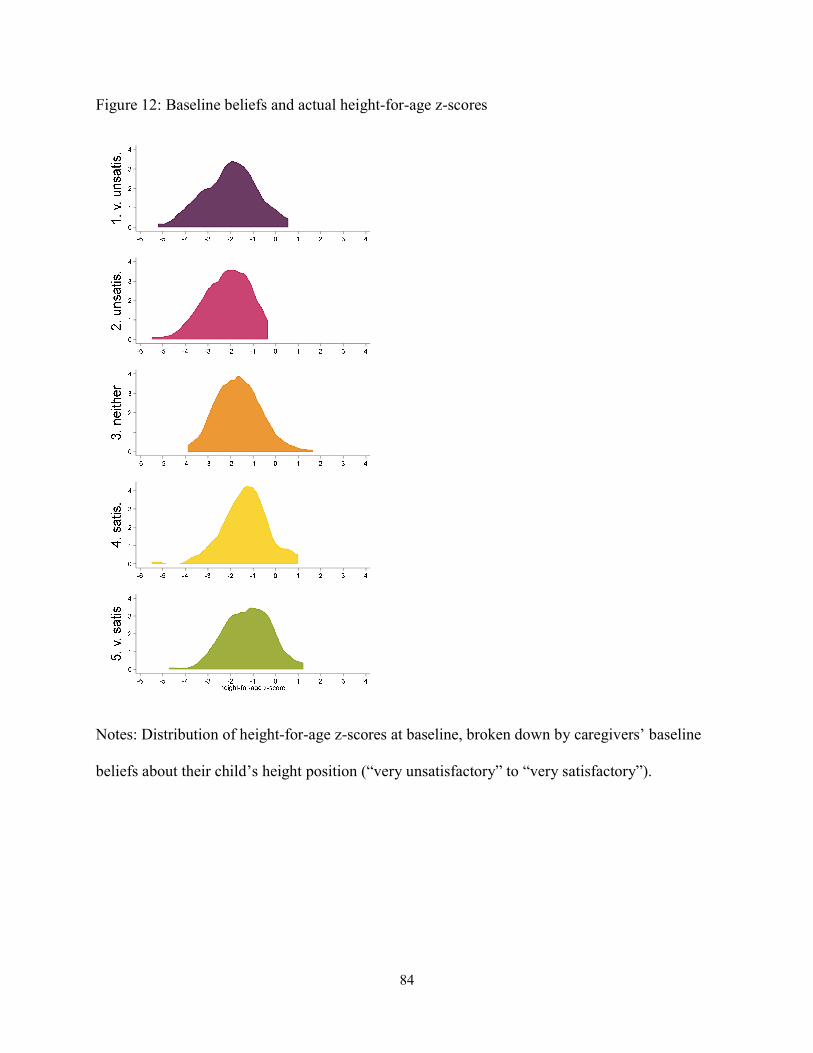
84
Figure 12: Baseline beliefs and actual height-for-age z-scores
Notes: Distribution of height-for-age z-scores at baseline, broken down by caregivers’ baseline
beliefs about their child’s height position (“very unsatisfactory” to “very satisfactory”).
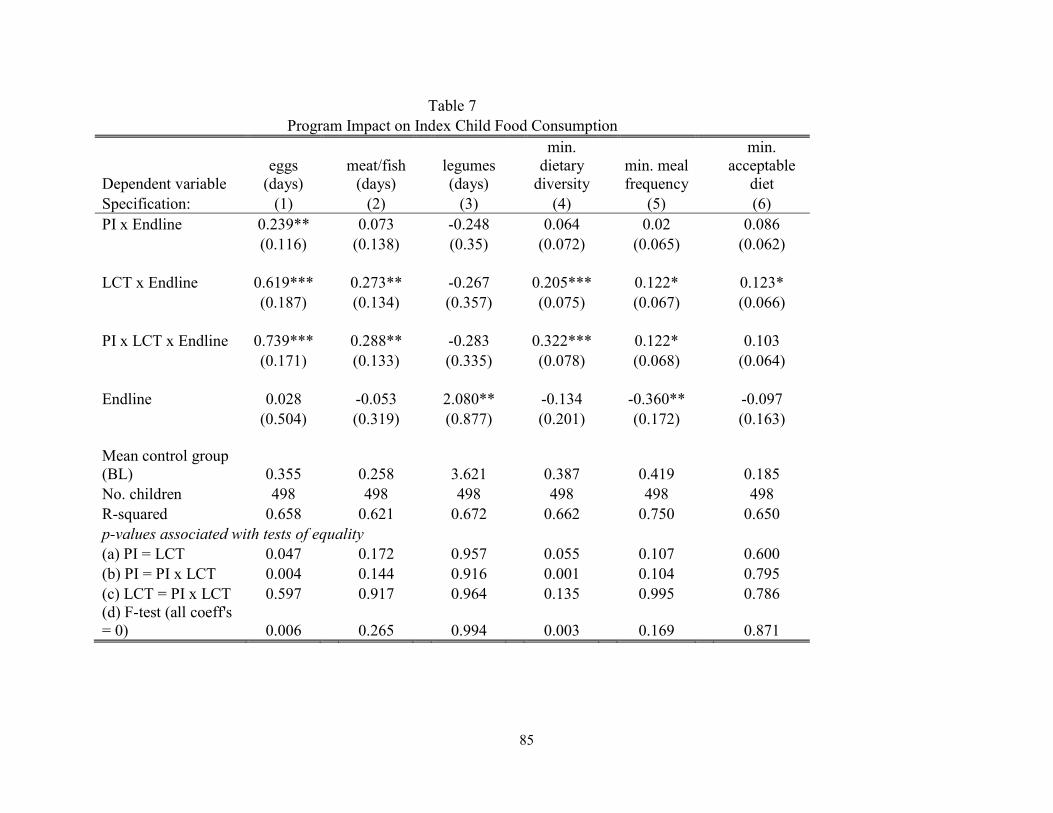
85
Table 7 Program Impact on Index Child Food Consumption
Dependent variable eggs
(days) meat/fish
(days) legumes (days)
min. dietary
diversity min. meal frequency
min. acceptable
diet Specification: (1) (2) (3) (4) (5) (6) PI x Endline 0.239** 0.073 -0.248 0.064 0.02 0.086 (0.116) (0.138) (0.35) (0.072) (0.065) (0.062) LCT x Endline 0.619*** 0.273** -0.267 0.205*** 0.122* 0.123* (0.187) (0.134) (0.357) (0.075) (0.067) (0.066) PI x LCT x Endline 0.739*** 0.288** -0.283 0.322*** 0.122* 0.103 (0.171) (0.133) (0.335) (0.078) (0.068) (0.064) Endline 0.028 -0.053 2.080** -0.134 -0.360** -0.097 (0.504) (0.319) (0.877) (0.201) (0.172) (0.163) Mean control group (BL) 0.355 0.258 3.621 0.387 0.419 0.185 No. children 498 498 498 498 498 498 R-squared 0.658 0.621 0.672 0.662 0.750 0.650 p-values associated with tests of equality (a) PI = LCT 0.047 0.172 0.957 0.055 0.107 0.600 (b) PI = PI x LCT 0.004 0.144 0.916 0.001 0.104 0.795 (c) LCT = PI x LCT 0.597 0.917 0.964 0.135 0.995 0.786 (d) F-test (all coeff's = 0) 0.006 0.265 0.994 0.003 0.169 0.871

86
Table 7 (continued)
Notes: Coefficients from main regression model are reported, with robust standard errors in parentheses. All specifications include controls for the household characteristics listed in Table 6 interacted with an indicator for endline, as well as the index child's age and gender and controls for the household's previous treatment group, all interacted with an indicator for endline. The outcome in column (1) is a measure of the number of days in the past week that the index child consumed eggs, (2) number of days in the past week the index child consumed meat or fish, and (3) number of days in the past week the index child consumed legumes. The outcome in column (4) is an indicator for whether the index child received foods from at least 5 of the following 7 food groups in the last 7 days: (1) cereals/bread/pasta, (2) legumes, (3) dairy products, (4) flesh foods, (5) eggs, (6) fruits, and (7) vegetables. The outcome in column (5) in an indicator for whether the child received at least 3 meals if still breastfeeding, or at least 4 meals if not still breastfeeding, in the last 24 hours. The outcome in column (6) is an indicator for whether the child's recent food consumption met the requirements for both minimum dietary diversity (column 4) and minimum meal frequency (column 5). ***p<0.01, **p<0.05, *p<0.1

87
the labeled cash transfer, though adding the cash transfer does increase the effect compared to
provision of personalized information alone. There are also large and significant increases in
days of meat or fish consumed in the cash transfer groups, but no effects for the personalized
information alone group. Finally, there do not appear to be any effects on legume consumption.
The full set of nine analyzed food groups are shown in Table 17 of the supplementary materials,
where similar patterns of effects are shown for other key food groups.i
When considering the measures of dietary quality, the largest effects are again seen in the
labeled cash transfer groups. In the labeled cash transfer groups, meeting the requirements for
minimum dietary diversity increased by 21 to 32 percentage points, for minimum meal frequency
by 12 percentage points, and for minimum acceptable diet by 10 to 12 percentage points (though
only statistically significant in the labeled cash transfer alone group). There are no statistically
significant differences between the labeled cash transfer alone and labeled cash transfer plus
personalized information groups. Children in Ethiopia have historically performed very poorly
on these measures, particularly minimum dietary diversity; these improvements of more than 50
percent are both generally large and especially important in this context.
Household spending
Table 8 shows overall changes in spending due to the interventions that are consistent
with the previous results: spending on eggs in the past month increased by 9 to 15 birr (45 to 75
i Another major food item to demonstrate positive and statistically significant effects was bread/pasta. The number of days in the past week that index children in the labeled cash transfer groups consumed bread or pasta increased by about 60 percent compared to the control group at baseline. While not necessarily the ideal change from a nutrition perspective, it is not surprising that children in the labeled cash transfer group consumed more bread and pasta. These are items that are typically purchased, rather than produced at home, and therefore more expensive. As a result, there is a perception that the “poorest” eat grain foods, while those with a bit more resources substitute into bread and pasta.
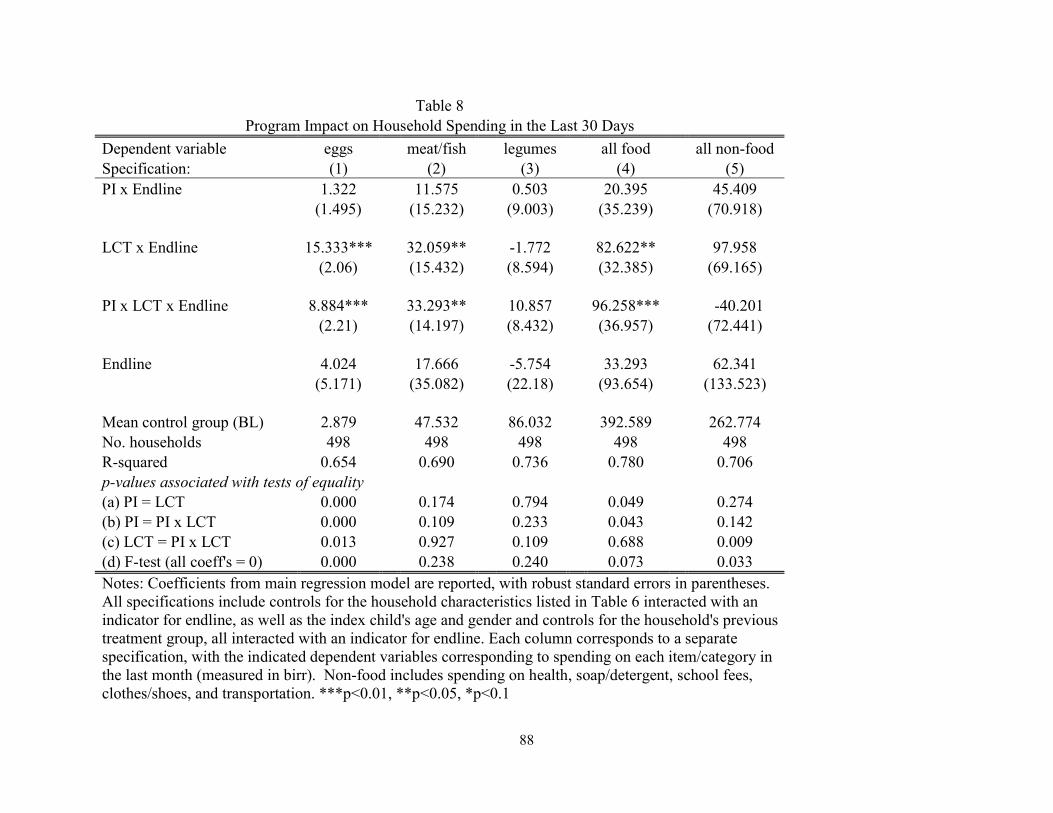
88
Table 8 Program Impact on Household Spending in the Last 30 Days
Dependent variable eggs meat/fish legumes all food all non-food Specification: (1) (2) (3) (4) (5) PI x Endline 1.322 11.575 0.503 20.395 45.409 (1.495) (15.232) (9.003) (35.239) (70.918) LCT x Endline 15.333*** 32.059** -1.772 82.622** 97.958 (2.06) (15.432) (8.594) (32.385) (69.165) PI x LCT x Endline 8.884*** 33.293** 10.857 96.258*** -40.201 (2.21) (14.197) (8.432) (36.957) (72.441) Endline 4.024 17.666 -5.754 33.293 62.341 (5.171) (35.082) (22.18) (93.654) (133.523) Mean control group (BL) 2.879 47.532 86.032 392.589 262.774 No. households 498 498 498 498 498 R-squared 0.654 0.690 0.736 0.780 0.706 p-values associated with tests of equality (a) PI = LCT 0.000 0.174 0.794 0.049 0.274 (b) PI = PI x LCT 0.000 0.109 0.233 0.043 0.142 (c) LCT = PI x LCT 0.013 0.927 0.109 0.688 0.009 (d) F-test (all coeff's = 0) 0.000 0.238 0.240 0.073 0.033 Notes: Coefficients from main regression model are reported, with robust standard errors in parentheses. All specifications include controls for the household characteristics listed in Table 6 interacted with an indicator for endline, as well as the index child's age and gender and controls for the household's previous treatment group, all interacted with an indicator for endline. Each column corresponds to a separate specification, with the indicated dependent variables corresponding to spending on each item/category in the last month (measured in birr). Non-food includes spending on health, soap/detergent, school fees, clothes/shoes, and transportation. ***p<0.01, **p<0.05, *p<0.1
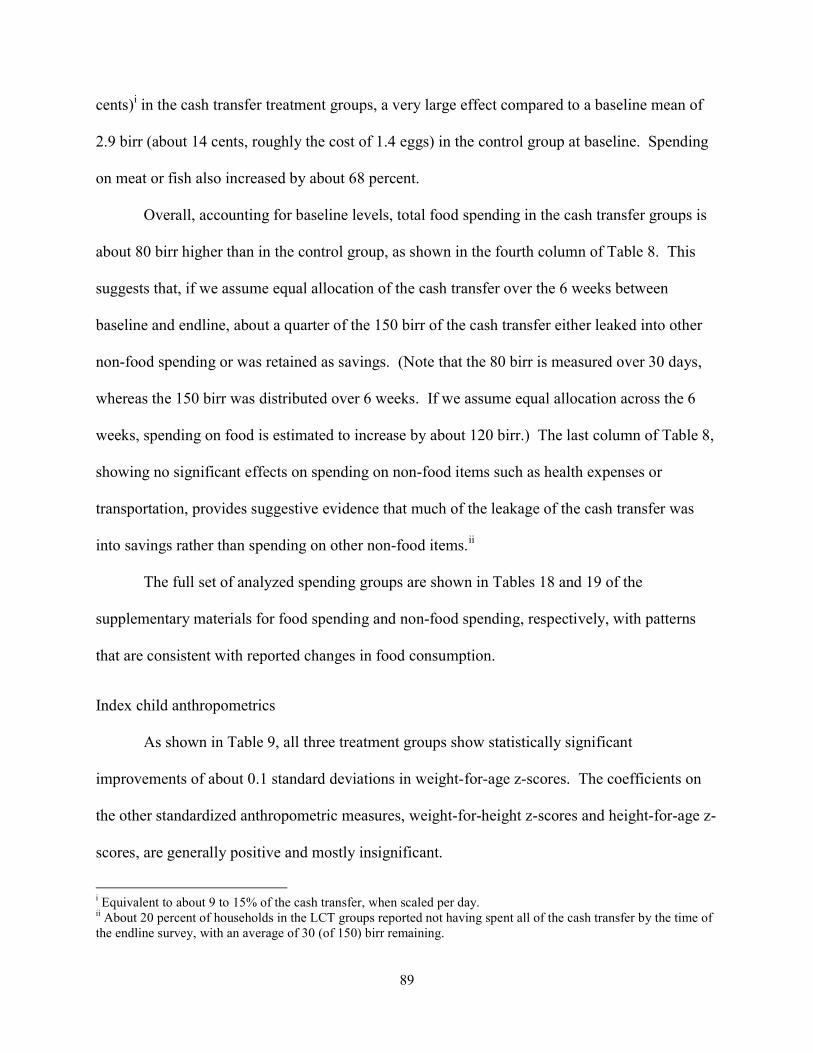
89
cents)i in the cash transfer treatment groups, a very large effect compared to a baseline mean of
2.9 birr (about 14 cents, roughly the cost of 1.4 eggs) in the control group at baseline. Spending
on meat or fish also increased by about 68 percent.
Overall, accounting for baseline levels, total food spending in the cash transfer groups is
about 80 birr higher than in the control group, as shown in the fourth column of Table 8. This
suggests that, if we assume equal allocation of the cash transfer over the 6 weeks between
baseline and endline, about a quarter of the 150 birr of the cash transfer either leaked into other
non-food spending or was retained as savings. (Note that the 80 birr is measured over 30 days,
whereas the 150 birr was distributed over 6 weeks. If we assume equal allocation across the 6
weeks, spending on food is estimated to increase by about 120 birr.) The last column of Table 8,
showing no significant effects on spending on non-food items such as health expenses or
transportation, provides suggestive evidence that much of the leakage of the cash transfer was
into savings rather than spending on other non-food items.ii
The full set of analyzed spending groups are shown in Tables 18 and 19 of the
supplementary materials for food spending and non-food spending, respectively, with patterns
that are consistent with reported changes in food consumption.
Index child anthropometrics
As shown in Table 9, all three treatment groups show statistically significant
improvements of about 0.1 standard deviations in weight-for-age z-scores. The coefficients on
the other standardized anthropometric measures, weight-for-height z-scores and height-for-age z-
scores, are generally positive and mostly insignificant.
i Equivalent to about 9 to 15% of the cash transfer, when scaled per day. ii About 20 percent of households in the LCT groups reported not having spent all of the cash transfer by the time of the endline survey, with an average of 30 (of 150) birr remaining.
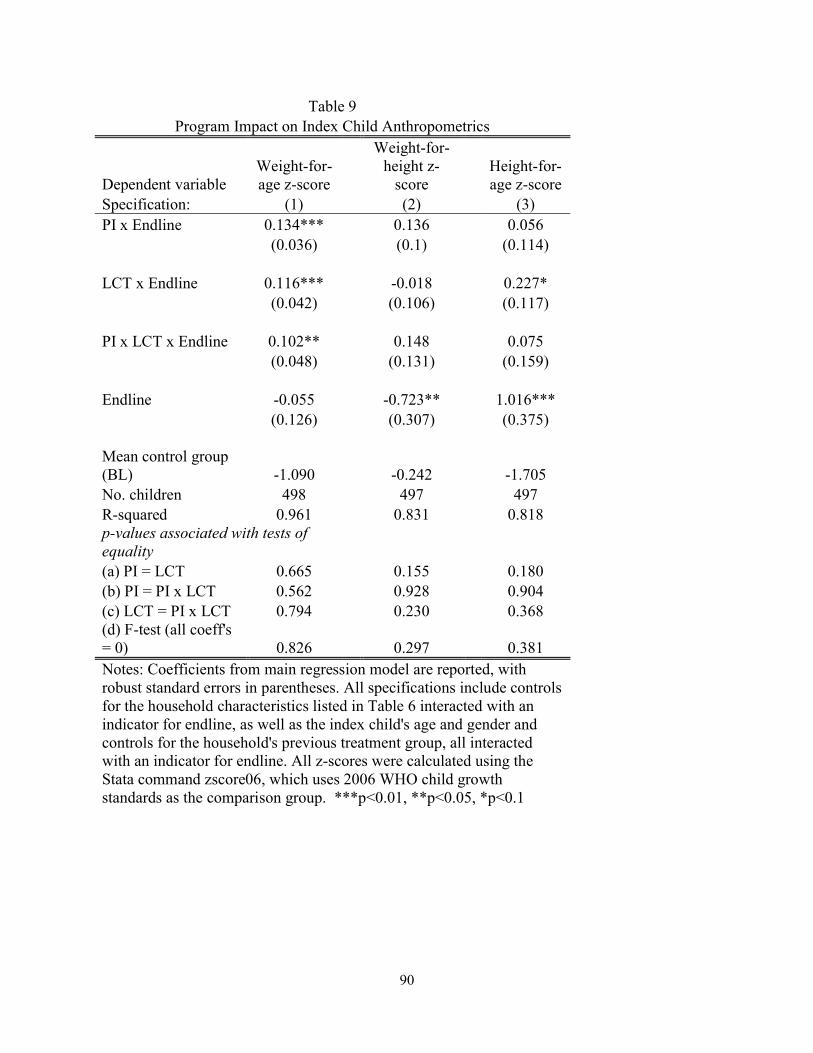
90
Table 9 Program Impact on Index Child Anthropometrics
Dependent variable Weight-for-age z-score
Weight-for-height z-
score Height-for-age z-score
Specification: (1) (2) (3) PI x Endline 0.134*** 0.136 0.056 (0.036) (0.1) (0.114) LCT x Endline 0.116*** -0.018 0.227* (0.042) (0.106) (0.117) PI x LCT x Endline 0.102** 0.148 0.075 (0.048) (0.131) (0.159) Endline -0.055 -0.723** 1.016*** (0.126) (0.307) (0.375) Mean control group (BL) -1.090 -0.242 -1.705 No. children 498 497 497 R-squared 0.961 0.831 0.818 p-values associated with tests of equality (a) PI = LCT 0.665 0.155 0.180 (b) PI = PI x LCT 0.562 0.928 0.904 (c) LCT = PI x LCT 0.794 0.230 0.368 (d) F-test (all coeff's = 0) 0.826 0.297 0.381 Notes: Coefficients from main regression model are reported, with robust standard errors in parentheses. All specifications include controls for the household characteristics listed in Table 6 interacted with an indicator for endline, as well as the index child's age and gender and controls for the household's previous treatment group, all interacted with an indicator for endline. All z-scores were calculated using the Stata command zscore06, which uses 2006 WHO child growth standards as the comparison group. ***p<0.01, **p<0.05, *p<0.1
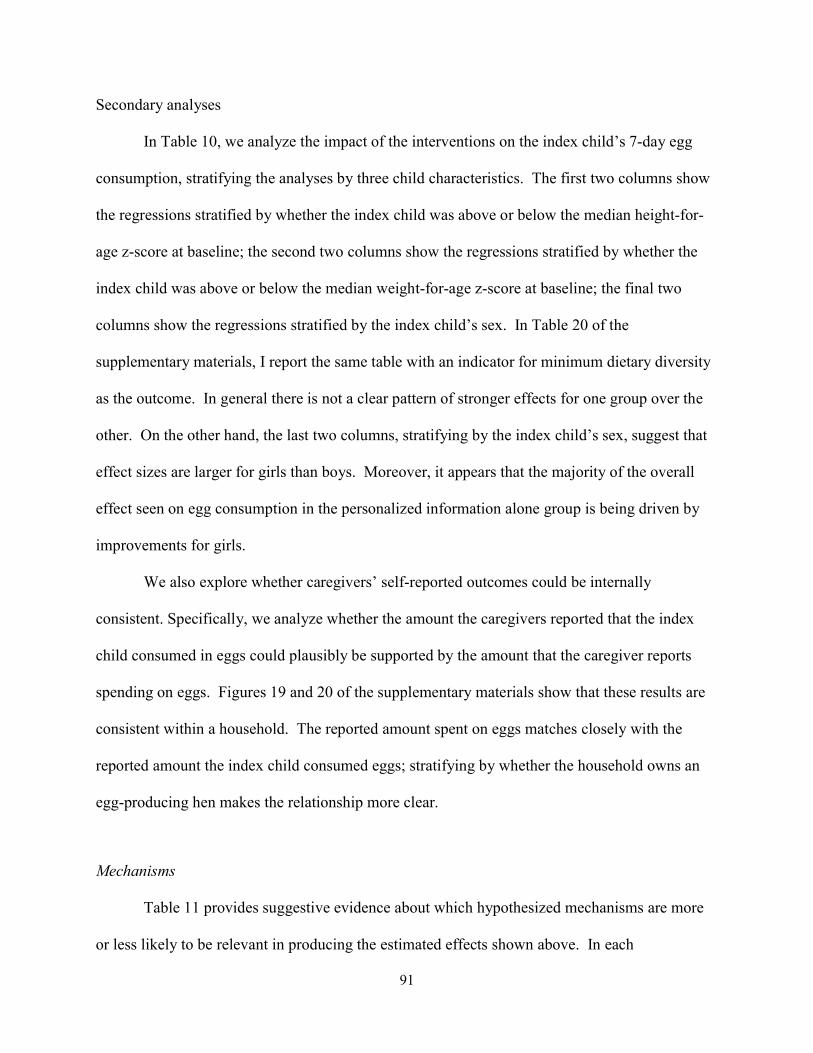
91
Secondary analyses
In Table 10, we analyze the impact of the interventions on the index child’s 7-day egg
consumption, stratifying the analyses by three child characteristics. The first two columns show
the regressions stratified by whether the index child was above or below the median height-for-
age z-score at baseline; the second two columns show the regressions stratified by whether the
index child was above or below the median weight-for-age z-score at baseline; the final two
columns show the regressions stratified by the index child’s sex. In Table 20 of the
supplementary materials, I report the same table with an indicator for minimum dietary diversity
as the outcome. In general there is not a clear pattern of stronger effects for one group over the
other. On the other hand, the last two columns, stratifying by the index child’s sex, suggest that
effect sizes are larger for girls than boys. Moreover, it appears that the majority of the overall
effect seen on egg consumption in the personalized information alone group is being driven by
improvements for girls.
We also explore whether caregivers’ self-reported outcomes could be internally
consistent. Specifically, we analyze whether the amount the caregivers reported that the index
child consumed in eggs could plausibly be supported by the amount that the caregiver reports
spending on eggs. Figures 19 and 20 of the supplementary materials show that these results are
consistent within a household. The reported amount spent on eggs matches closely with the
reported amount the index child consumed eggs; stratifying by whether the household owns an
egg-producing hen makes the relationship more clear.
Mechanisms
Table 11 provides suggestive evidence about which hypothesized mechanisms are more
or less likely to be relevant in producing the estimated effects shown above. In each
92
Table 10 Stratified Program Impact on Index Child Egg Consumption
Dependent variable BL HAZ <
median BL HAZ >
median BL WAZ <
median BL WAZ >
median Boys Girls Specification: (1) (2) (3) (4) (5) (6) PI x Endline 0.280* 0.175 0.175 0.306 0.086 0.486** (0.156) (0.199) (0.142) (0.189) (0.15) (0.19) LCT x Endline 0.592*** 0.608** 0.696*** 0.510* 0.629** 0.713*** (0.209) (0.305) (0.249) (0.29) (0.27) (0.271) PI x LCT x Endline 0.769*** 0.661** 0.828*** 0.570** 0.731*** 0.874*** (0.186) (0.309) (0.215) (0.283) (0.198) (0.317) Endline -0.272 0.227 -0.526 0.568 -0.37 0.337 (0.484) (0.878) (0.607) (0.858) (0.63) (0.775) Mean control group (BL) 0.333 0.379 0.323 0.387 0.439 0.259 No. children 249 249 245 254 261 238 R-squared 0.749 0.609 0.722 0.617 0.718 0.605 p-values associated with tests of equality (a) PI = LCT 0.163 0.135 0.043 0.468 0.040 0.407 (b) PI = PI x LCT 0.010 0.121 0.002 0.365 0.000 0.208 (c) LCT = PI x LCT 0.460 0.890 0.655 0.870 0.724 0.659 (d) F-test (all coeff's = 0) 0.030 0.144 0.004 0.563 0.001 0.384
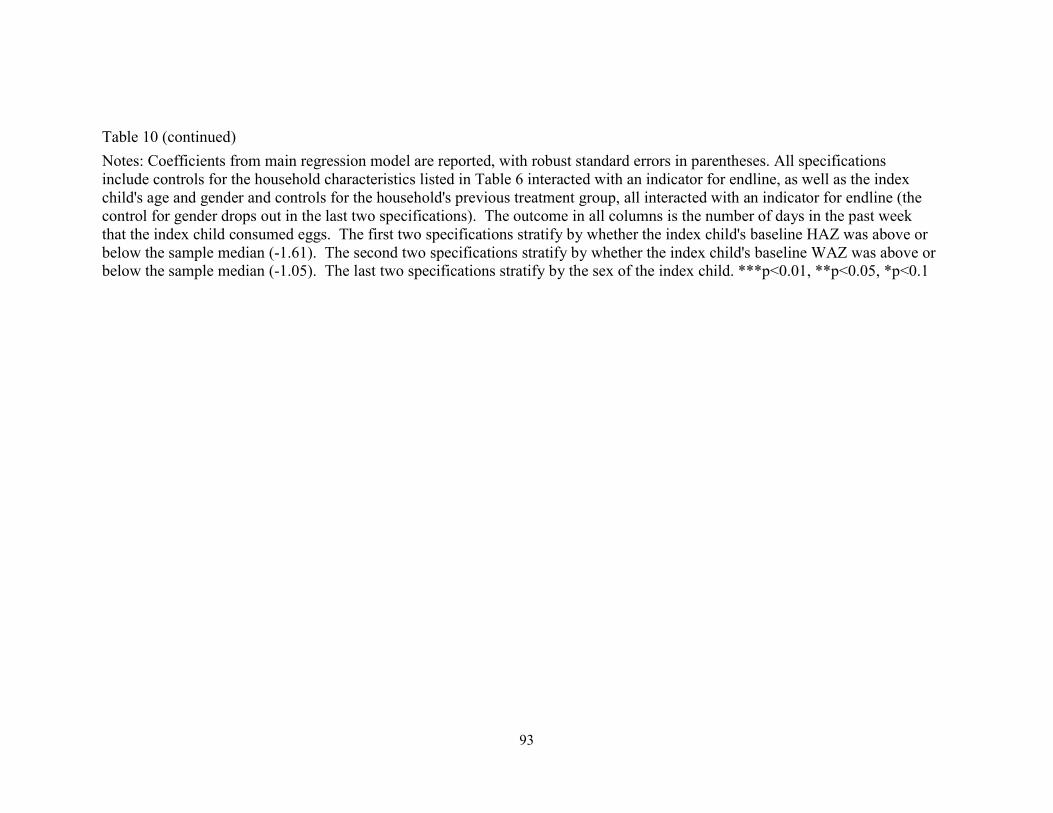
93
Table 10 (continued)
Notes: Coefficients from main regression model are reported, with robust standard errors in parentheses. All specifications include controls for the household characteristics listed in Table 6 interacted with an indicator for endline, as well as the index child's age and gender and controls for the household's previous treatment group, all interacted with an indicator for endline (the control for gender drops out in the last two specifications). The outcome in all columns is the number of days in the past week that the index child consumed eggs. The first two specifications stratify by whether the index child's baseline HAZ was above or below the sample median (-1.61). The second two specifications stratify by whether the index child's baseline WAZ was above or below the sample median (-1.05). The last two specifications stratify by the sex of the index child. ***p<0.01, **p<0.05, *p<0.1

94
Table 11
Program Impact on Index Child Egg Consumption in the Last 7 Days - Mechanisms
Dependent variable
eggs (days)
eggs (days)
eggs (days)
eggs (days)
Specification: (1) (2) (3) (4) PI x Endline x Caregiver controls money
0.182 PI x Endline x Caregiver attended school
-0.154 PI x Endline x Budgetary strain
0.138 PI x Endline x Information is worse
-0.271 (0.217) (0.263) (0.255) (0.253
)
LCT x Endline x Caregiver controls money
0.741**
LCT x Endline x Caregiver attended school
-0.794*
* LCT x Endline x Budgetary strain
0.794**
LCT x Endline x Information is worse
0.098 (0.358) (0.337) (0.364) (0.337
)
PI x LCT x Endline x Caregiver controls money
-0.006 PI x LCT x Endline x Caregiver attended school
0.118 PI x LCT x Endline x Budgetary strain
-0.485 PI x LCT x Endline x Information is worse
0.607 (0.344) (0.345) (0.334) (0.372
)
PI x Caregiver controls money
-0.006 PI x Caregiver attended school
0.118 PI x Budgetary strain
-0.485 PI x Information is worse
0.607 (0.174) (0.236) (0.185) (0.207
)
LCT x Caregiver controls money
-0.006 LCT x Caregiver attended school
0.118 LCT x Budgetary strain
-0.485 LCT x Information is worse
0.607 (0.52) (0.957) (0.507) (0.633
)
PI x LCT x Caregiver controls money
-0.006 PI x LCT x Caregiver attended school
0.118 PI x LCT x Budgetary strain
-0.485 PI x LCT x Information is worse
0.607 (0.741) (1.488) (0.187) (1.398
)
Endline x Caregiver controls money
-0.123 Endline x Caregiver attended school
0.279* Endline x Budgetary strain
-0.079 Endline x Information is worse
-0.113 (0.15) (0.164) (0.17) (0.144
)
Mean control group (BL, caregiver does not control money)
0.195
Mean control group (BL, caregiver did not attend school)
0.410
Mean control group (BL, no budgetary strain)
0.453
Mean control group (BL, Beliefs equal or above reality)
0.122
No. children 498 No. children 498 No. children 498 No. children 498
R-squared 0.662 R-squared 0.663 R-squared 0.667 R-squared 0.662
p-values associated with tests of equality
(a) PI = LCT 0.127 (a) PI = LCT 0.083 (a) PI = LCT 0.090 (a) PI = LCT 0.323
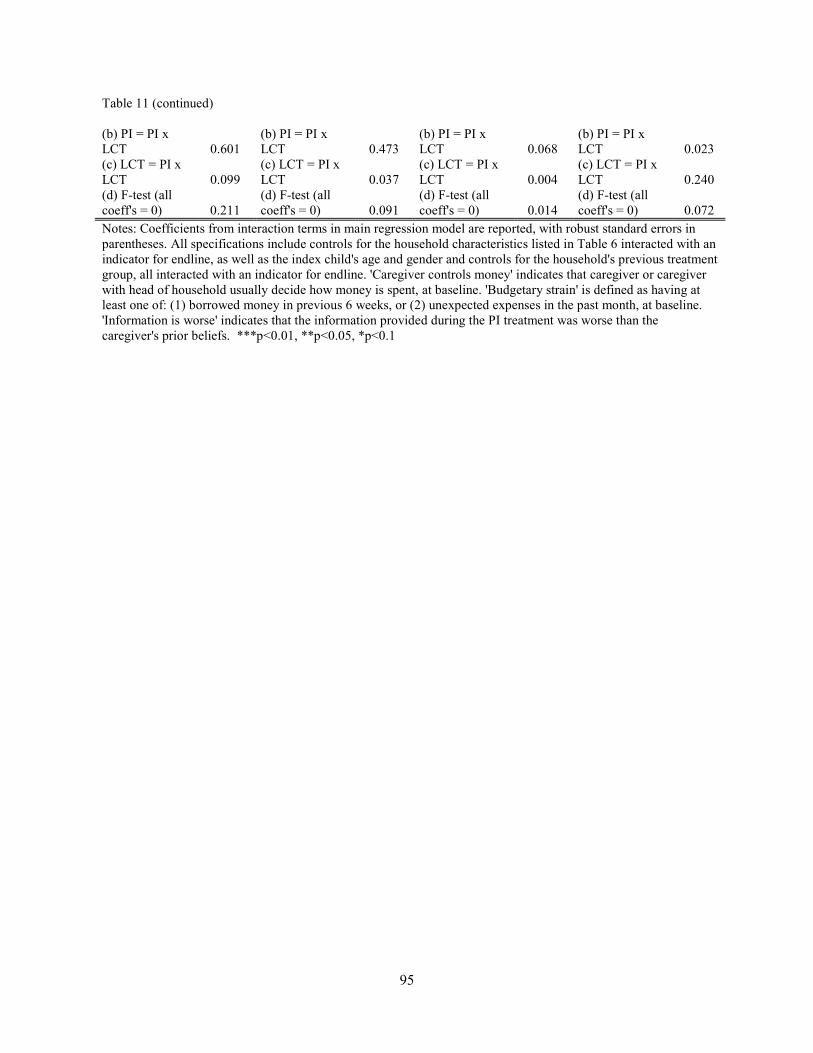
95
Table 11 (continued)
(b) PI = PI x LCT 0.601
(b) PI = PI x LCT 0.473
(b) PI = PI x LCT 0.068
(b) PI = PI x LCT 0.023
(c) LCT = PI x LCT 0.099
(c) LCT = PI x LCT 0.037
(c) LCT = PI x LCT 0.004
(c) LCT = PI x LCT 0.240
(d) F-test (all coeff's = 0) 0.211
(d) F-test (all coeff's = 0) 0.091
(d) F-test (all coeff's = 0) 0.014
(d) F-test (all coeff's = 0) 0.072
Notes: Coefficients from interaction terms in main regression model are reported, with robust standard errors in parentheses. All specifications include controls for the household characteristics listed in Table 6 interacted with an indicator for endline, as well as the index child's age and gender and controls for the household's previous treatment group, all interacted with an indicator for endline. 'Caregiver controls money' indicates that caregiver or caregiver with head of household usually decide how money is spent, at baseline. 'Budgetary strain' is defined as having at least one of: (1) borrowed money in previous 6 weeks, or (2) unexpected expenses in the past month, at baseline. 'Information is worse' indicates that the information provided during the PI treatment was worse than the caregiver's prior beliefs. ***p<0.01, **p<0.05, *p<0.1
96
specification, the number of the days in the past week that the index child consumed eggs is the
outcome, with coefficients on the interactions with each of the four characteristics described
above reported. First, the cash transfer (alone) is more influential in cases where the caregiver
controls the money, in line with the hypothesized effect. Second, the cash transfer is less
effective when the caregiver has some education, consistent with a scenario where more
educated women were already providing relatively improved diets for their children. The third
specification, considering differential effects by budgetary strain, suggests that the cash transfer
is especially effective when there is a particular degree of budgetary strain. Finally, the last
column shows that the effects do not appear to be related to whether or not the caregiver found
out that her child was doing worse than she previously believed.
Discussion
Nearly half of the world’s annual 3.1 million deaths of children under 5 years are caused
by malnutrition.2 While rates of malnutrition have been falling throughout the developing world,
the decrease has been significantly slower than established targets, including in Ethiopia. A
range of factors contribute to malnutrition, and households have varying degrees of control over
these factors. Existing evidence suggests, however, that many caregivers fail to take actions that
would reduce malnutrition, even over things that they seemingly have some influence and
knowledge. This study was designed to assess whether some dimensions of this inaction are due
to behavioral factors and whether greater action can be induced with inexpensive “nudges”
(potentially paired with small amounts of money), ultimately providing policy-relevant
implications.
The main results suggest that the provision of personalized information led to important
and meaningful change on some relevant outcomes, including the index child’s consumption of
97
some protein rich foods and their age- and gender-standardized weight. These results suggest
that providing this personalized information could be an important complement to existing
nutrition-related interventions. In general, the labeled cash transfer intervention appears to have
been more effective, with meaningful impacts on key outcomes such as consumption of protein-
rich foods that were available in the community. These findings provide valuable evidence
toward assessing how financial barriers influence malnutrition, something Bhutta, et al. (2013)
described as “urgently needed” in leading off the 2013 Maternal and Child Nutrition Lancet
series.2 In general, it does not appear that adding the personalized information intervention to
the labeled cash transfer increased effect sizes in statistically meaningful ways.
Secondary analyses provided useful insights into what subgroups benefited most and what
mechanisms are most likely be relevant. For example, it does not in general appear that more
vulnerable children benefit more. And, unsurprisingly, the effects are most pronounced in cases
where the caregiver is relatively empowered and feels that she exerts some control over the
household’s money.
While the labeled cash transfers were, overall, highly successful in achieving the desired
behavioral changes, there are several other factors that are important to consider about these
types of interventions. First, while labeling the money may be the most effective way to tie the
money to behaviors that more directly influence malnutrition (e.g., food consumption versus
growth monitoring checkups) and is a relatively low-cost approach from an implementation
perspective, labeling may be inadequate from a political economy perspective. Wealth
redistribution schemes (i.e., giving money away) may only retain public support if they require
some conditions to be met by the recipients. Second, identifying a means for classifying which
individuals, households, or communities are eligible for the cash transfer is challenging and
98
creates an opportunity for gaming the system by those who are relatively well off.17 As Fiszbein
and Schady (2009) note, however, there are valuable spillover effects in domains such as
management and transparency that may occur as a result of overcoming these types of
implementation challenges.17 Finally, CCTs and LCTs are only as effective as the
complementary services that are available. There is a limit on improvements in child health if,
for example, sanitation and hygiene remain inadequate, regardless of how much nutritional
intake improves.
There are also some important weaknesses specific to this study to consider. First, most
outcomes are self-reported, and households in the treatment groups were clearly not blinded to
their treatment. On the other hand, enumerators were blinded to the households’ treatment status
during the baseline survey (the treatment(s) were only revealed after the end of the electronic
data collection), as well as fully blinded during the endline survey (until questions specific to the
treatment were asked), mitigating concerns about prompting by the enumerators.
Additionally, there were only 6 weeks between the baseline and endline surveys. While
there are important treatment effects, it is not possible to determine whether the treatments have
a longer-term influence from this pilot intervention – and, at times, there may be effects that take
longer to present (see, for example, Evans, et al., 2016).38 Evidence from previous cash transfer
interventions showing long-term effects (e.g., Macours, et al. 2012) provides some encouraging
evidence that longer-term effects are plausible.39
Overall, this study provides important insights into measures that can be taken to nudge
caregivers into beneficial behaviors that have been shown to improve children’s nutritional status
(i.e., physical growth). Given that there have been only limited increases in donor aid for
nutrition since 2008,40 it is valuable to better understand means for increasing the effects of

99
existing interventions. Future studies will be important to understand important nuances that
remain unanswered after this study, including the sustainability of these effects.
Funding
This research was supported by the Foundations of Human Behavior Initiative, Harvard Center
for African Studies, Institute for Quantitative Social Science, Vogelheim Research and Travel
Fund, and Weiss Family Foundation.

100
References
1. The Bill & Melinda Gates Foundation announces new $776 million investment in nutrition to tackle child mortality and help all women and children survive and thrive [press release]. Bill & Melinda Gates Foundation, June 3, 2015 2015. 2. Bhutta ZA, Das JK, Rizvi A, Gaffey MF, Walker N, Horton S, et al. Evidence-based interventions for improvement of maternal and child nutrition: what can be done and at what cost? The lancet. 2013;382(9890):452-77. 3. Shekar M, Heaver R, Lee Y-K. Repositioning nutrition as central to development: A strategy for large scale action: World Bank Publications; 2006. 4. Murray CJ. Shifting to Sustainable Development Goals--Implications for Global Health. The New England journal of medicine. 2015;373(15):1390-3. 5. Onis M, Dewey KG, Borghi E, Onyango AW, Blössner M, Daelmans B, et al. The World Health Organization's global target for reducing childhood stunting by 2025: rationale and proposed actions. Maternal & child nutrition. 2013;9(S2):6-26. 6. Levere M, Acharya G, Bharadwaj P. The role of information and cash transfers on early childhood development: evidence from Nepal. National Bureau of Economic Research, 2016. 7. Bhutta ZA, Ahmed T, Black RE, Cousens S, Dewey K, Giugliani E, et al. What works? Interventions for maternal and child undernutrition and survival. The lancet. 2008;371(9610):417-40. 8. Jalan J, Somanathan E. The importance of being informed: Experimental evidence on demand for environmental quality. Journal of development Economics. 2008;87(1):14-28. 9. Bergman P. Parent-child information frictions and human capital investment: Evidence from a field experiment. 2015. 10. Rogers T, Feller A. Reducing Student Absences at Scale By Involving Families. 11. Dizon-Ross R. Parents’ perceptions and children’s education: Experimental evidence from Malawi. Unpublished Manuscript Massachusetts Institute of Technology http://web mit edu/rdr/www/perceptions pdf. 2014. 12. Berlinski S, Busso M, Dinkelman T, Martinez C. Reducing parent-school information gaps and improving education outcomes: Evidence from high frequency text messaging in Chile. Unpublished Manuscript. 2016. 13. Schultz TP. School subsidies for the poor: evaluating the Mexican Progresa poverty program. Journal of development Economics. 2004;74(1):199-250.

101
14. De Janvry A, Sadoulet E. Making conditional cash transfer programs more efficient: designing for maximum effect of the conditionality. The World Bank Economic Review. 2006;20(1):1-29. 15. Baird S, McIntosh C, Özler B. Cash or condition? Evidence from a cash transfer experiment. The Quarterly Journal of Economics. 2011:qjr032. 16. Garcia M, Moore CG, Moore CM. The cash dividend: the rise of cash transfer programs in sub-Saharan Africa: World Bank Publications; 2012. 17. Fiszbein A, Schady NR. Conditional cash transfers: reducing present and future poverty: World Bank Publications; 2009. 18. Thaler RH. Mental accounting matters. Journal of Behavioral decision making. 1999;12(3):183. 19. Benhassine N, Devoto F, Duflo E, Dupas P, Pouliquen V. Turning a shove into a nudge? A" labeled cash transfer" for education. National Bureau of Economic Research, 2013. 20. Agency CI. The World Factbook. 2017. 21. Bank TW. 2017. Available from: http://www.worldbank.org/en/country/ethiopia/overview. 22. Authority CS. Ethiopia Demographic and Health Survey 20162016. 23. Programs WF. The Cost of Hunger in Ethiopia: Implications for the Growth and Transformation of Ethiopia 2013 [May 1, 2017]. Available from: https://reliefweb.int/report/ethiopia/cost-hunger-ethiopia-implications-growth-and-transformation-ethiopia. 24. Commission NP. Growth and Transformation Plan II. Ethiopia: Federal Democratic Republic of Ethiopia; 2016. 25. Nutrition SU. Ethiopia commits to ending under-nutrition by 2030 with the Seqota Declaration 2015. Available from: http://scalingupnutrition.org/news/ethiopia-commits-to-ending-under-nutrition-by-2030-with-the-seqota-declaration/. 26. Wakabi W. Extension workers drive Ethiopiq's primary health care. Lancet. 2008;372(9642):880-. 27. Koblinsky M, Tain F, Gaym A, Karim A, Carnell M, Tesfaye S. Responding to the maternal health care challenge: The Ethiopian Health Extension Program. Ethiopian Journal of Health Development. 2010;24(1).
102
28. Banteyerga H. Ethiopia's health extension program: improving health through community involvement. MEDICC review. 2011;13(3):46-9. 29. Lemma F, Matji J. Delivery platforms for sustained nutrition in Ethiopia. The Lancet. 2013;382(9891):488. 30. Tessema M, Gunaratna NS, Donato K, Cohen JL, McConnell M, Belayneh D, et al. Translating the impact of quality protein maize into improved nutritional status for Ethiopian children: study protocol for a randomized controlled trial. BMC Nutrition. 2016;2(1):54. 31. Ruel MT, Menon P. Child feeding practices are associated with child nutritional status in Latin America: innovative uses of the demographic and health surveys. The Journal of nutrition. 2002;132(6):1180-7. 32. Arimond M, Ruel MT. Dietary diversity is associated with child nutritional status: evidence from 11 demographic and health surveys. The Journal of nutrition. 2004;134(10):2579-85. 33. Mogeni P, Twahir H, Bandika V, Mwalekwa L, Thitiri J, Ngari M, et al. Diagnostic performance of visible severe wasting for identifying severe acute malnutrition in children admitted to hospital in Kenya. Bulletin of the World Health Organization. 2011;89:900-6. 34. Mulualem D, Henry CJ, Berhanu G, Whiting SJ. The effectiveness of nutrition education: Applying the Health Belief Model in child-feeding practices to use pulses for complementary feeding in Southern Ethiopia. Ecology of food and nutrition. 2016;55(3):308-23. 35. CSA I. Ethiopia demographic and health survey 2011. Addis Ababa, Ethiopia and Calverton, Maryland, USA: Central Statistical Agency and ICF International. 2012. 36. Mosha T, Laswai H, Tetens I. Nutritional composition and micronutrient status of home made and commercial weaning foods consumed in Tanzania. Plant Foods for Human Nutrition (Formerly Qualitas Plantarum). 2000;55(3):185-205. 37. Organization WH. Indicators for assessing infant and young child feeding practices. 2010. 38. Evans DK, Holtemeyer B, Kosec K. Cash transfers and health: evidence from Tanzania. The World Bank Economic Review. 2017:lhx001. 39. Macours K, Schady N, Vakis R. Cash transfers, behavioral changes, and cognitive development in early childhood: evidence from a randomized experiment. American Economic Journal: Applied Economics. 2012;4(2):247-73. 40. Horton R, Lo S. Nutrition: a quintessential sustainable development goal. The Lancet. 2013;382(9890):371.
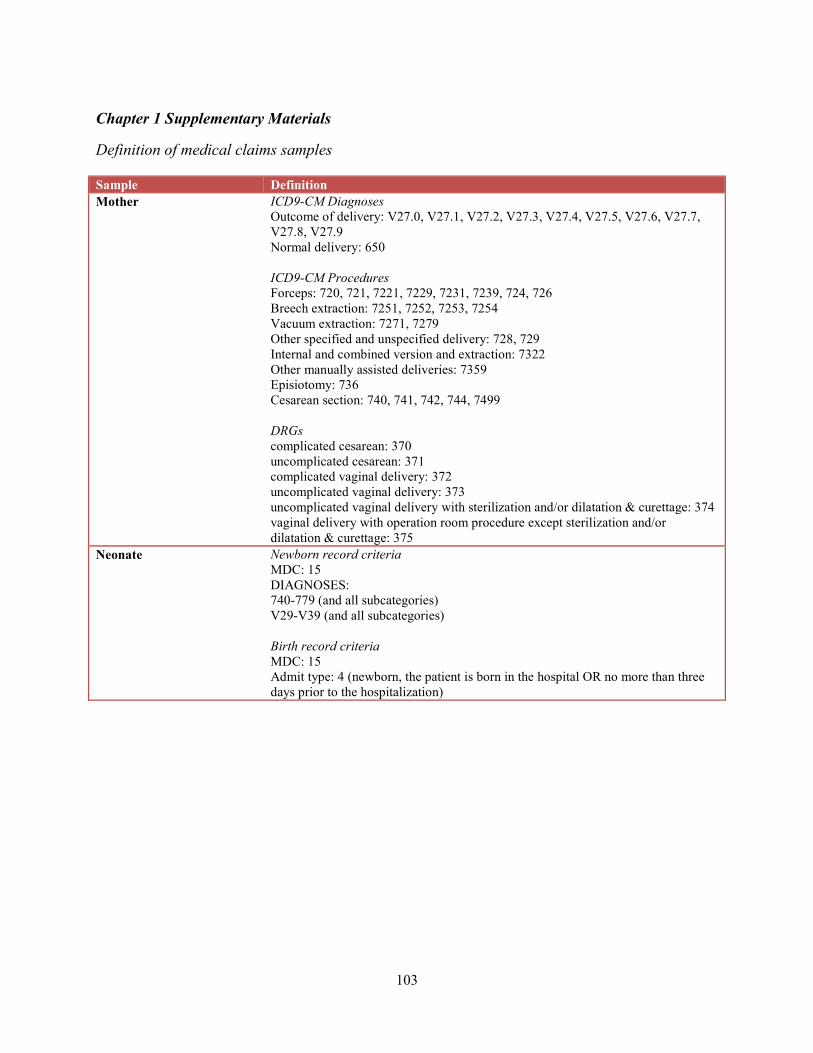
103
Chapter 1 Supplementary Materials
Definition of medical claims samples Sample Definition Mother ICD9-CM Diagnoses
Outcome of delivery: V27.0, V27.1, V27.2, V27.3, V27.4, V27.5, V27.6, V27.7, V27.8, V27.9 Normal delivery: 650 ICD9-CM Procedures Forceps: 720, 721, 7221, 7229, 7231, 7239, 724, 726 Breech extraction: 7251, 7252, 7253, 7254 Vacuum extraction: 7271, 7279 Other specified and unspecified delivery: 728, 729 Internal and combined version and extraction: 7322 Other manually assisted deliveries: 7359 Episiotomy: 736 Cesarean section: 740, 741, 742, 744, 7499 DRGs complicated cesarean: 370 uncomplicated cesarean: 371 complicated vaginal delivery: 372 uncomplicated vaginal delivery: 373 uncomplicated vaginal delivery with sterilization and/or dilatation & curettage: 374 vaginal delivery with operation room procedure except sterilization and/or dilatation & curettage: 375
Neonate Newborn record criteria MDC: 15 DIAGNOSES: 740-779 (and all subcategories) V29-V39 (and all subcategories) Birth record criteria MDC: 15 Admit type: 4 (newborn, the patient is born in the hospital OR no more than three days prior to the hospitalization)
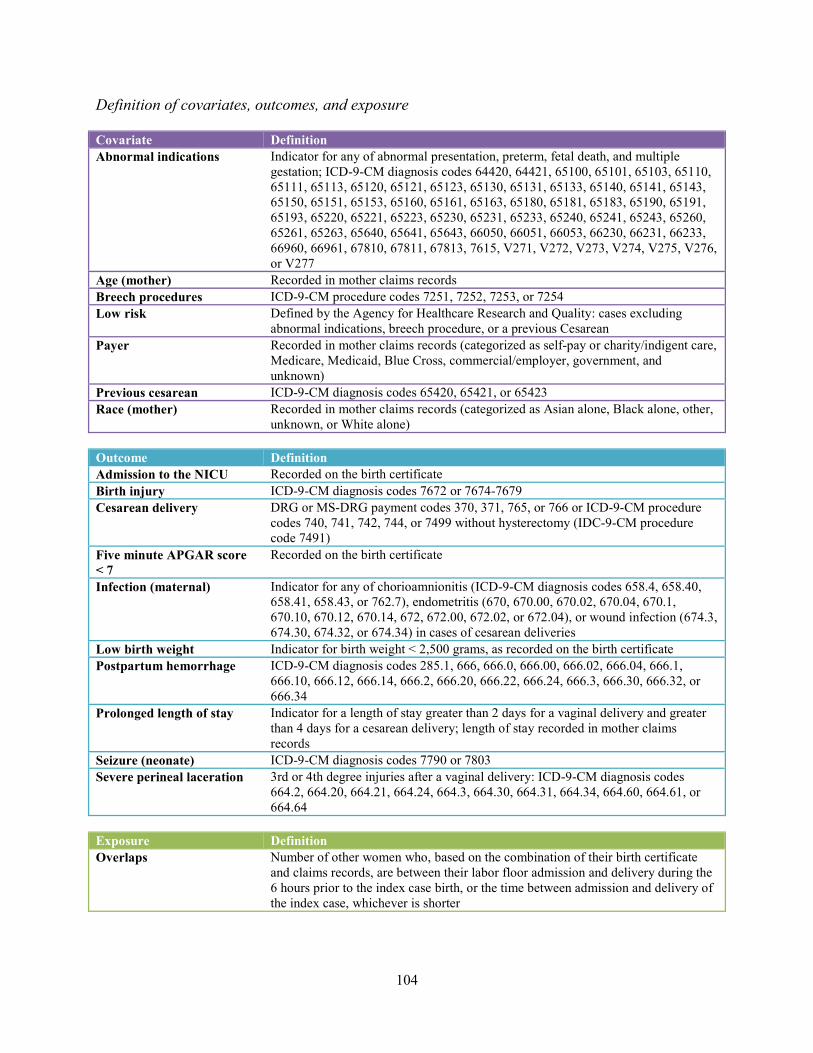
104
Definition of covariates, outcomes, and exposure Covariate Definition Abnormal indications Indicator for any of abnormal presentation, preterm, fetal death, and multiple
gestation; ICD-9-CM diagnosis codes 64420, 64421, 65100, 65101, 65103, 65110, 65111, 65113, 65120, 65121, 65123, 65130, 65131, 65133, 65140, 65141, 65143, 65150, 65151, 65153, 65160, 65161, 65163, 65180, 65181, 65183, 65190, 65191, 65193, 65220, 65221, 65223, 65230, 65231, 65233, 65240, 65241, 65243, 65260, 65261, 65263, 65640, 65641, 65643, 66050, 66051, 66053, 66230, 66231, 66233, 66960, 66961, 67810, 67811, 67813, 7615, V271, V272, V273, V274, V275, V276, or V277
Age (mother) Recorded in mother claims records Breech procedures ICD-9-CM procedure codes 7251, 7252, 7253, or 7254 Low risk Defined by the Agency for Healthcare Research and Quality: cases excluding
abnormal indications, breech procedure, or a previous Cesarean Payer Recorded in mother claims records (categorized as self-pay or charity/indigent care,
Medicare, Medicaid, Blue Cross, commercial/employer, government, and unknown)
Previous cesarean ICD-9-CM diagnosis codes 65420, 65421, or 65423 Race (mother) Recorded in mother claims records (categorized as Asian alone, Black alone, other,
unknown, or White alone) Outcome Definition Admission to the NICU Recorded on the birth certificate Birth injury ICD-9-CM diagnosis codes 7672 or 7674-7679 Cesarean delivery DRG or MS-DRG payment codes 370, 371, 765, or 766 or ICD-9-CM procedure
codes 740, 741, 742, 744, or 7499 without hysterectomy (IDC-9-CM procedure code 7491)
Five minute APGAR score < 7
Recorded on the birth certificate
Infection (maternal) Indicator for any of chorioamnionitis (ICD-9-CM diagnosis codes 658.4, 658.40, 658.41, 658.43, or 762.7), endometritis (670, 670.00, 670.02, 670.04, 670.1, 670.10, 670.12, 670.14, 672, 672.00, 672.02, or 672.04), or wound infection (674.3, 674.30, 674.32, or 674.34) in cases of cesarean deliveries
Low birth weight Indicator for birth weight < 2,500 grams, as recorded on the birth certificate Postpartum hemorrhage ICD-9-CM diagnosis codes 285.1, 666, 666.0, 666.00, 666.02, 666.04, 666.1,
666.10, 666.12, 666.14, 666.2, 666.20, 666.22, 666.24, 666.3, 666.30, 666.32, or 666.34
Prolonged length of stay Indicator for a length of stay greater than 2 days for a vaginal delivery and greater than 4 days for a cesarean delivery; length of stay recorded in mother claims records
Seizure (neonate) ICD-9-CM diagnosis codes 7790 or 7803 Severe perineal laceration 3rd or 4th degree injuries after a vaginal delivery: ICD-9-CM diagnosis codes
664.2, 664.20, 664.21, 664.24, 664.3, 664.30, 664.31, 664.34, 664.60, 664.61, or 664.64
Exposure Definition Overlaps Number of other women who, based on the combination of their birth certificate
and claims records, are between their labor floor admission and delivery during the 6 hours prior to the index case birth, or the time between admission and delivery of the index case, whichever is shorter
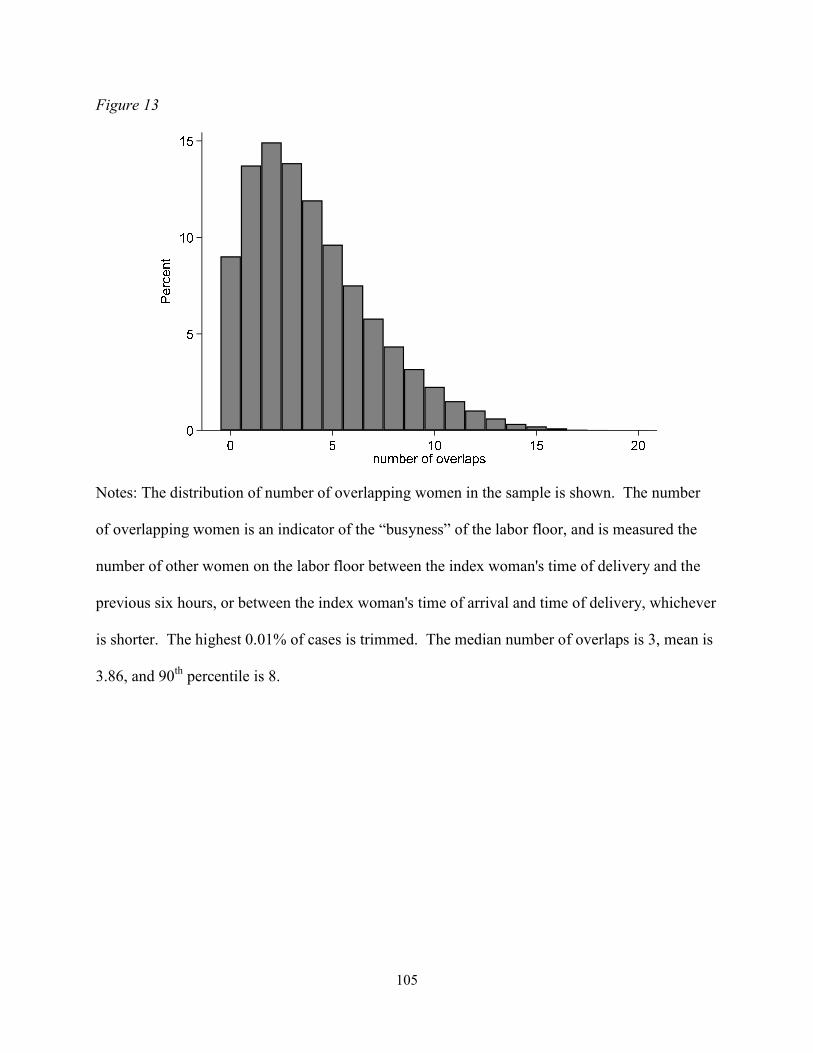
105
Figure 13
Notes: The distribution of number of overlapping women in the sample is shown. The number
of overlapping women is an indicator of the “busyness” of the labor floor, and is measured the
number of other women on the labor floor between the index woman's time of delivery and the
previous six hours, or between the index woman's time of arrival and time of delivery, whichever
is shorter. The highest 0.01% of cases is trimmed. The median number of overlaps is 3, mean is
3.86, and 90th percentile is 8.
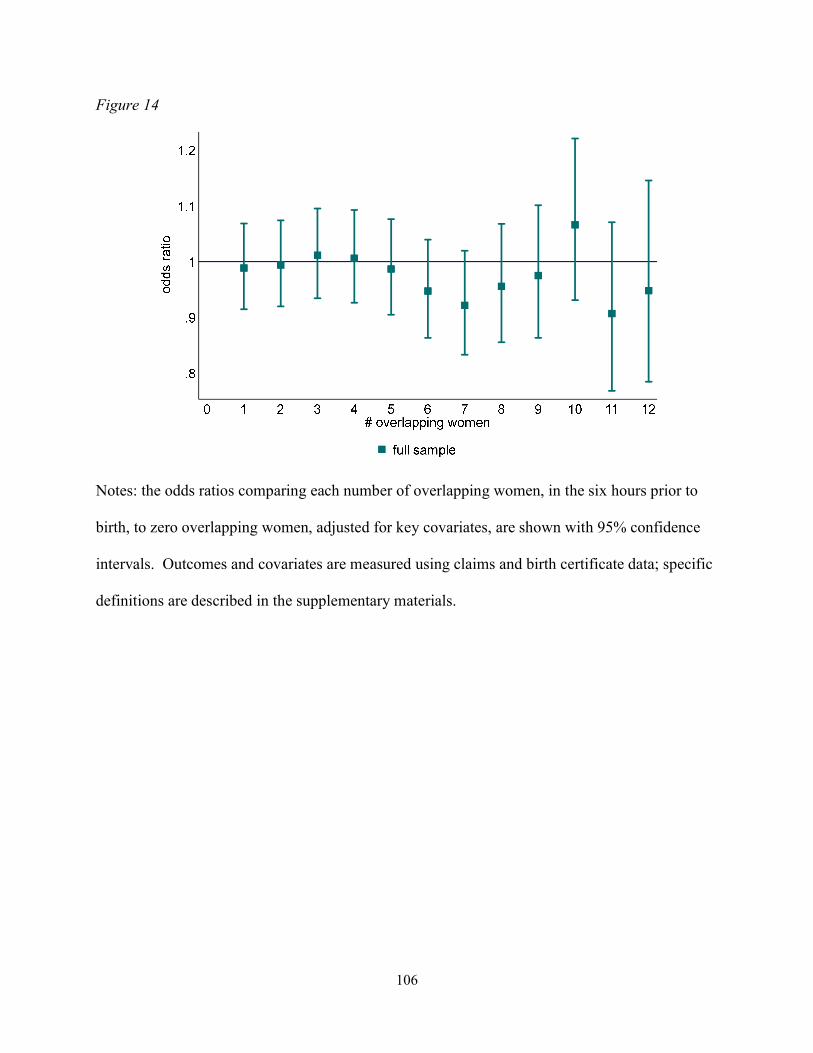
106
Figure 14
Notes: the odds ratios comparing each number of overlapping women, in the six hours prior to
birth, to zero overlapping women, adjusted for key covariates, are shown with 95% confidence
intervals. Outcomes and covariates are measured using claims and birth certificate data; specific
definitions are described in the supplementary materials.

107
Chapter 2 Supplementary Materials
Education poster used during QPM targeting meeting – November 2015
Label used for earmarking bags and bowls
QPM targeting messages at baseline – July/August 2015 As you may remember from a few months ago when you were offered QPM, these
improved maize varieties are more nutritious because they have more available protein,
which is important for height, weight, health, and learning. They are very similar to

108
typical maize varieties in other ways though, including how they are cultivated and how
they can be prepared into food.
Young children, especially those under three years old, are vulnerable to nutritional
deficiencies that can lead to malnutrition, so it is important to specifically target your
QPM to them. With improved protein intake, children grow taller and gain weight faster,
learn better, and are less likely to get sick. This will also help them to be healthier and
more productive as adults.
Because of the benefits of QPM for young children in particular, it is useful to keep the
maize separate for them and to only use it for feeding your very young children who are
three years old and younger. This includes green maize.
In particular, you should avoid selling your QPM or feeding it to chickens or other
livestock. Whenever you have a choice, feed your QPM to your young children, rather
than the adults in your household. By taking these steps, you can be sure to have enough
QPM to feed to your young children for a long time.
In order to target your QPM to your young children, you will need a way to keep your
QPM separate from the rest of your maize once it is harvested. To do this, your
household will need to either partition your maize crib or build a separate one before the
harvest begins.
Later this year, we will also provide you with a separate special bag for storing QPM
grain and one for storing QPM flour, as well as markers to indicate which of your grain
bags in storage contain QPM. This will help you keep track of which grain should be
targeted specifically to your children who are three years old and younger. We’ll also
discuss strategies for preparing separate foods for your young children at that time.

109
QPM targeting group meetings – November 2015 Greetings & Introductions (5 minutes)
Materials
- Attendance sheet
Key Points
- Introduce yourself (and participants)
- Warmly welcome all participants and thank them for coming
- Today I’d like to talk to you about the QPM we gave you earlier this year and the
importance of feeding this specifically to your young children.
- At the end of today’s meeting we will give you some tools to help you target the QPM
to your young children and ensure that they are eating enough of it.
Action Items
- Check off attendance, record date
- Ensure there are only women from your list present in the group; politely ask others to
leave
- Send partner to retrieve others if missing women from list
Educational Messages(10 minutes)
Materials
n/a
Key Points
- Growth and nutrition are important

110
o First I’d like to take some time to discuss the importance of growth and nutrition,
especially for young children.
o Proper nutrition during the first few years of life is important for optimal growth,
health, and development.
o It is difficult to compensate later in life for the consequences of early-life poor
nutrition.
o Protein is especially important for children’s growth, health, school performance,
and learning ability
o Some foods, like meat, milk, eggs, beans, and peas, have good protein and should
be fed to children.
- QPM has protein and is especially good for young children
o However, sometimes infants and small children may not be able to eat these foods
every day.
o Therefore, we are trying to make everyday food have stronger protein. Quality
protein maize is one of these everyday foods with better protein.
o QPM is especially good for children, and it is especially important that they eat
foods made from it.
o Therefore we want to encourage you to specifically feed QPM to your youngest
children, and offer you some guidance and materials to help you do this.
- Keeping QPM separate and using it to cook for your young children is important
o It is very important that you keep QPM separate from your other maize and other
grains so that you know specifically when you have cooked with QPM. It is

111
important to keep QPM separate from your conventional maize at all the different
stages:
During planting
During harvest
While transporting maize from fields to home or storage cribs
While shelling
While storing grain in bags
Bringing to and from the mill
While storing flour before cooking
While cooking
Finally, while eating
o To help with storing the grain and flour separately, we will share with you today:
4 special storage bags for grain
1 special storage bag for flour
o As often as you can, you should cook foods with QPM specifically for your
young children. For example, porridge is especially good to make with QPM to
serve to young children.
o Similarly, whenever you cook foods with QPM, you’ll want to take special care to
make sure your young children eat enough of these foods.
To help ensure your young child eats enough of QPM-based foods, we are
giving you this special plate that you should fill with these foods for
him/her.

112
- How to get kids to eat better
o Finally, I’d like to spend some time discussing how best to feed young children,
to help with targeting QPM to them.
o Babies and children have smaller stomachs, and can’t eat as much at one time. As
a result, they need small, frequent feeds.
o Feed your child slowly and patiently, and encourage children to eat QPM-based
foods, but do not force them.
o Minimize distractions during meals if the child loses interest easily, especially
when the child is eating QPM.
o Congratulate the child when he/she eats QPM and finishes the food.
o Feeding a child from his/her own plate helps, this will help you know if the child
is getting enough of the QPM-based food.
o To help you target QPM foods to your young children, we are sharing a special
plate that you can use for feeding your young child. Whenever you make
something with QPM, you can fill the plate for the child so you can be sure he/she
has eaten the food.
Action Items
n/a
Group Discussion/Obstacles and How to Overcome Them (10 minutes)
Materials
n/a

113
Key Points
- Do you have any questions that we haven’t already discussed?
- How will you need to work with your husband in order to be successful in targeting QPM to
your young children?
- How do you think you will cook QPM for your young child/children? Porridge? Other
foods?
- Is there anything that you think would be difficult to do that we haven’t already discussed?
How do you think we could overcome that obstacle?
Help women think about ways to overcome any obstacles they identify
Action Items
n/a
Distribution of Materials (10 minutes)
Materials
- Grain and flour bags
- Plates
- Attendance sheet
Key Points
- Bags and plates are for your household to use, so please keep them and don’t give them to
anyone else

114
Action Items
- Distribute 4 grain bags, 1 flour bag, and 1 plate to each woman on your pre-specified list
** Make sure to check people off the list**
- Record number of these items that each woman received on attendance sheet
QPM targeting messages at midline – February/March 2016 Protein is especially important for young children’s growth, health, school performance,
and learning ability
QPM has more protein than other maize and is especially good for children, so it is
especially important that they eat foods made from it.
Therefore we want to encourage you to specifically feed QPM to your youngest children,
and gave you some tools to help you do this a few months ago, including flour and seed
bags to keep QPM separate and special plates and spoons for feeding your young
children.
As often as you can, you should cook foods with QPM specifically for your young
children. For example, porridge is especially good to make with QPM to serve to young
children.
Similarly, whenever you cook foods with QPM, you’ll want to take special care to make
sure your young children eat enough of these foods. You can use the special plates to
help make sure your children have eaten enough.
Controls included in adjusted regressions Household size
Household has high quality roof
Amount of land owned
115
Total maize produced during last year’s major season
Caregiver age
Caregiver ever attended school
Caregiver’s total number of pregnancies
Index child age
Index child sex
Index child had diarrhea in past two weeks (BL)
Index child had a cough or breathing problems in past two weeks (BL)
Index child had a fever in the past two weeks (BL)
Number of time caregiver received antenatal care during pregnancy with index child
Days the caregiver cooked for the index child in the last week (BL)
Days the caregiver cooked food with maize for the index child in the last week (BL)
Days the caregiver cooked food with QPM for the index child in the last week (BL)
Days the index child consumed food with QPM in the past week (BL)
Days the caregiver cooked porridge for the index child in the last week (BL)
Days the caregiver served fruit to the index child in the last week (BL)
Months the caregiver exclusively breastfed the index child
Caregiver worried about having enough food due to money, in the past 3 months (BL)
Index child height-for-age z-score (BL)
Index child weight-for-age z-score (BL)
Caregiver was present during QPM seed offer
Household has a telephone
Size of the household’s community health group
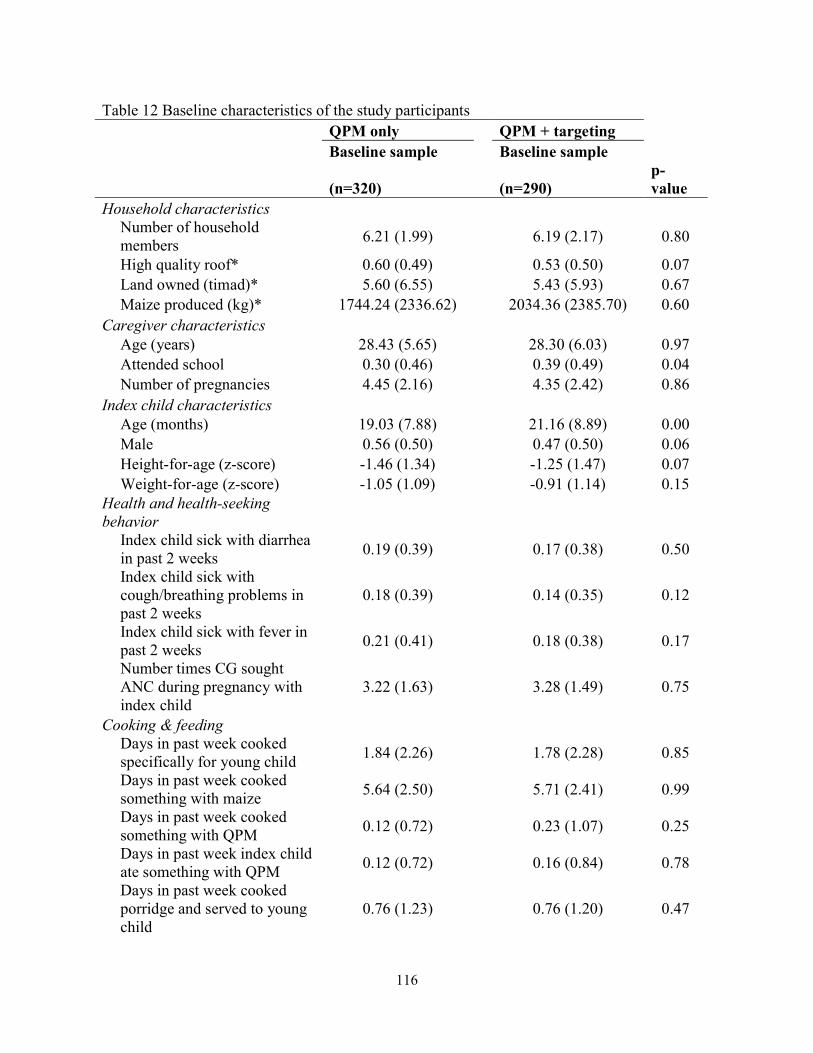
116
Table 12 Baseline characteristics of the study participants QPM only QPM + targeting Baseline sample Baseline sample
(n=320) (n=290) p-value
Household characteristics
Number of household members
6.21 (1.99)
6.19 (2.17) 0.80
High quality roof* 0.60 (0.49) 0.53 (0.50) 0.07 Land owned (timad)* 5.60 (6.55) 5.43 (5.93) 0.67 Maize produced (kg)* 1744.24 (2336.62) 2034.36 (2385.70) 0.60 Caregiver characteristics Age (years) 28.43 (5.65) 28.30 (6.03) 0.97 Attended school 0.30 (0.46) 0.39 (0.49) 0.04 Number of pregnancies 4.45 (2.16) 4.35 (2.42) 0.86 Index child characteristics Age (months) 19.03 (7.88) 21.16 (8.89) 0.00 Male 0.56 (0.50) 0.47 (0.50) 0.06 Height-for-age (z-score) -1.46 (1.34) -1.25 (1.47) 0.07 Weight-for-age (z-score) -1.05 (1.09) -0.91 (1.14) 0.15 Health and health-seeking behavior
Index child sick with diarrhea in past 2 weeks
0.19 (0.39)
0.17 (0.38) 0.50
Index child sick with cough/breathing problems in past 2 weeks
0.18 (0.39)
0.14 (0.35) 0.12
Index child sick with fever in past 2 weeks
0.21 (0.41)
0.18 (0.38) 0.17
Number times CG sought ANC during pregnancy with index child
3.22 (1.63)
3.28 (1.49) 0.75
Cooking & feeding
Days in past week cooked specifically for young child
1.84 (2.26)
1.78 (2.28) 0.85
Days in past week cooked something with maize
5.64 (2.50)
5.71 (2.41) 0.99
Days in past week cooked something with QPM
0.12 (0.72)
0.23 (1.07) 0.25
Days in past week index child ate something with QPM
0.12 (0.72)
0.16 (0.84) 0.78
Days in past week cooked porridge and served to young child
0.76 (1.23)
0.76 (1.20) 0.47
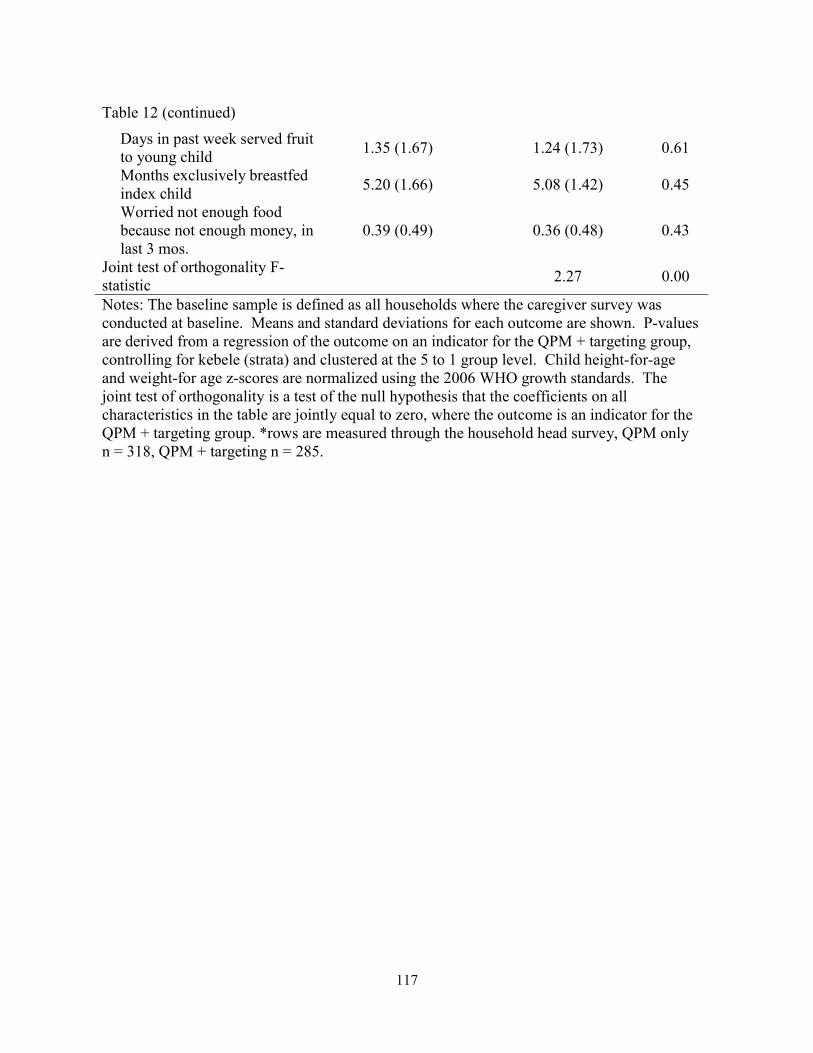
117
Table 12 (continued)
Days in past week served fruit to young child
1.35 (1.67)
1.24 (1.73) 0.61
Months exclusively breastfed index child
5.20 (1.66)
5.08 (1.42) 0.45
Worried not enough food because not enough money, in last 3 mos.
0.39 (0.49)
0.36 (0.48) 0.43
Joint test of orthogonality F-statistic
2.27 0.00
Notes: The baseline sample is defined as all households where the caregiver survey was conducted at baseline. Means and standard deviations for each outcome are shown. P-values are derived from a regression of the outcome on an indicator for the QPM + targeting group, controlling for kebele (strata) and clustered at the 5 to 1 group level. Child height-for-age and weight-for age z-scores are normalized using the 2006 WHO growth standards. The joint test of orthogonality is a test of the null hypothesis that the coefficients on all characteristics in the table are jointly equal to zero, where the outcome is an indicator for the QPM + targeting group. *rows are measured through the household head survey, QPM only n = 318, QPM + targeting n = 285.
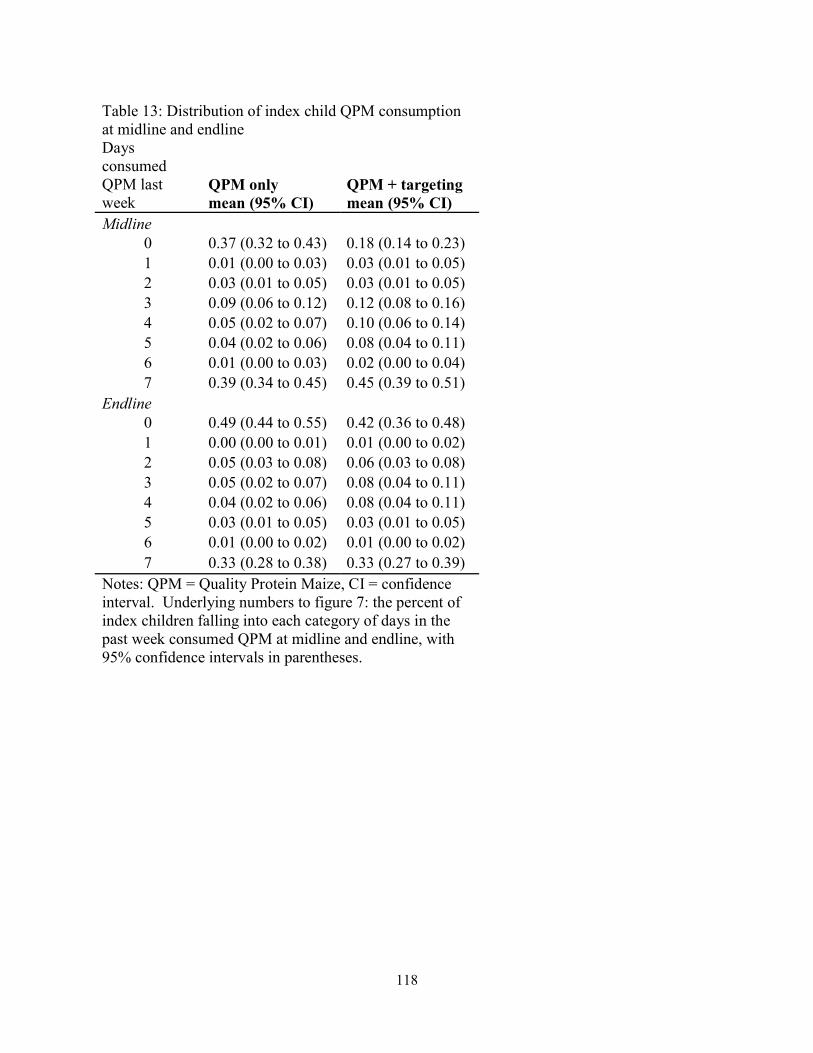
118
Table 13: Distribution of index child QPM consumption at midline and endline Days consumed QPM last week
QPM only mean (95% CI)
QPM + targeting mean (95% CI)
Midline 0 0.37 (0.32 to 0.43) 0.18 (0.14 to 0.23) 1 0.01 (0.00 to 0.03) 0.03 (0.01 to 0.05) 2 0.03 (0.01 to 0.05) 0.03 (0.01 to 0.05) 3 0.09 (0.06 to 0.12) 0.12 (0.08 to 0.16) 4 0.05 (0.02 to 0.07) 0.10 (0.06 to 0.14) 5 0.04 (0.02 to 0.06) 0.08 (0.04 to 0.11) 6 0.01 (0.00 to 0.03) 0.02 (0.00 to 0.04) 7 0.39 (0.34 to 0.45) 0.45 (0.39 to 0.51)
Endline 0 0.49 (0.44 to 0.55) 0.42 (0.36 to 0.48) 1 0.00 (0.00 to 0.01) 0.01 (0.00 to 0.02) 2 0.05 (0.03 to 0.08) 0.06 (0.03 to 0.08) 3 0.05 (0.02 to 0.07) 0.08 (0.04 to 0.11) 4 0.04 (0.02 to 0.06) 0.08 (0.04 to 0.11) 5 0.03 (0.01 to 0.05) 0.03 (0.01 to 0.05) 6 0.01 (0.00 to 0.02) 0.01 (0.00 to 0.02) 7 0.33 (0.28 to 0.38) 0.33 (0.27 to 0.39)
Notes: QPM = Quality Protein Maize, CI = confidence interval. Underlying numbers to figure 7: the percent of index children falling into each category of days in the past week consumed QPM at midline and endline, with 95% confidence intervals in parentheses.
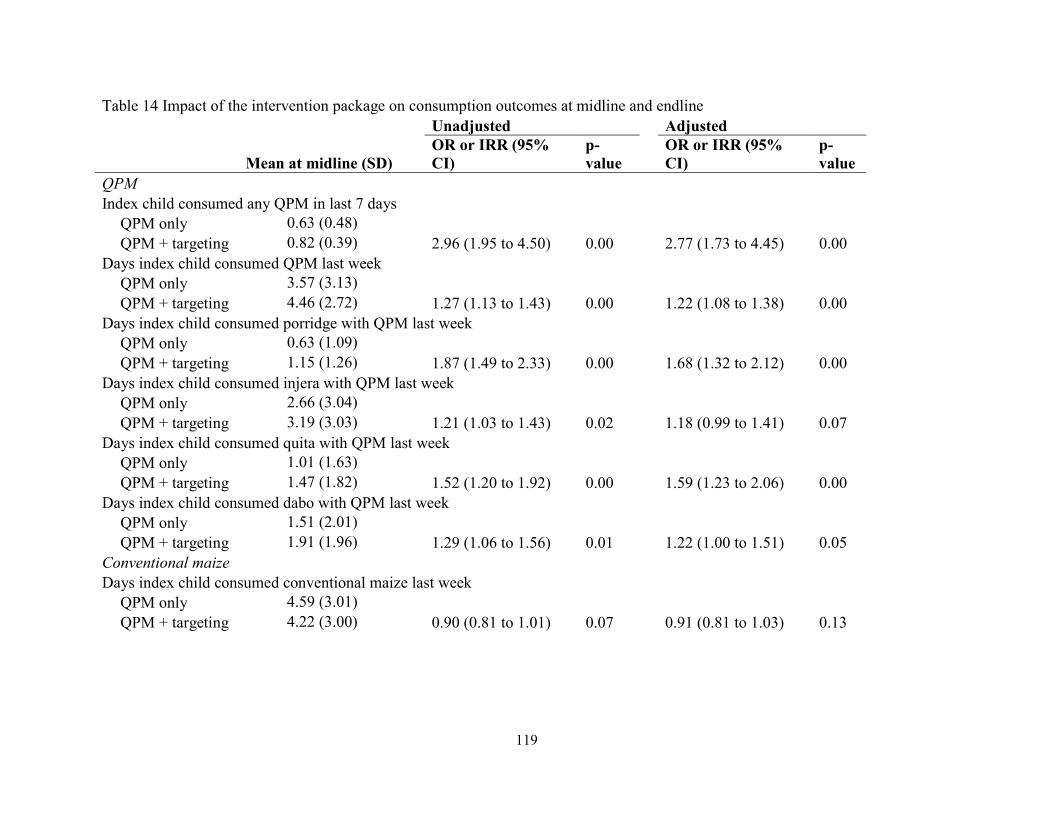
119
Table 14 Impact of the intervention package on consumption outcomes at midline and endline Unadjusted Adjusted
Mean at midline (SD) OR or IRR (95% CI)
p-value
OR or IRR (95% CI)
p-value
QPM Index child consumed any QPM in last 7 days QPM only 0.63 (0.48) QPM + targeting 0.82 (0.39) 2.96 (1.95 to 4.50) 0.00 2.77 (1.73 to 4.45) 0.00 Days index child consumed QPM last week QPM only 3.57 (3.13) QPM + targeting 4.46 (2.72) 1.27 (1.13 to 1.43) 0.00 1.22 (1.08 to 1.38) 0.00 Days index child consumed porridge with QPM last week QPM only 0.63 (1.09) QPM + targeting 1.15 (1.26) 1.87 (1.49 to 2.33) 0.00 1.68 (1.32 to 2.12) 0.00 Days index child consumed injera with QPM last week QPM only 2.66 (3.04) QPM + targeting 3.19 (3.03) 1.21 (1.03 to 1.43) 0.02 1.18 (0.99 to 1.41) 0.07 Days index child consumed quita with QPM last week QPM only 1.01 (1.63) QPM + targeting 1.47 (1.82) 1.52 (1.20 to 1.92) 0.00 1.59 (1.23 to 2.06) 0.00 Days index child consumed dabo with QPM last week QPM only 1.51 (2.01) QPM + targeting 1.91 (1.96) 1.29 (1.06 to 1.56) 0.01 1.22 (1.00 to 1.51) 0.05 Conventional maize Days index child consumed conventional maize last week QPM only 4.59 (3.01) QPM + targeting 4.22 (3.00) 0.90 (0.81 to 1.01) 0.07 0.91 (0.81 to 1.03) 0.13
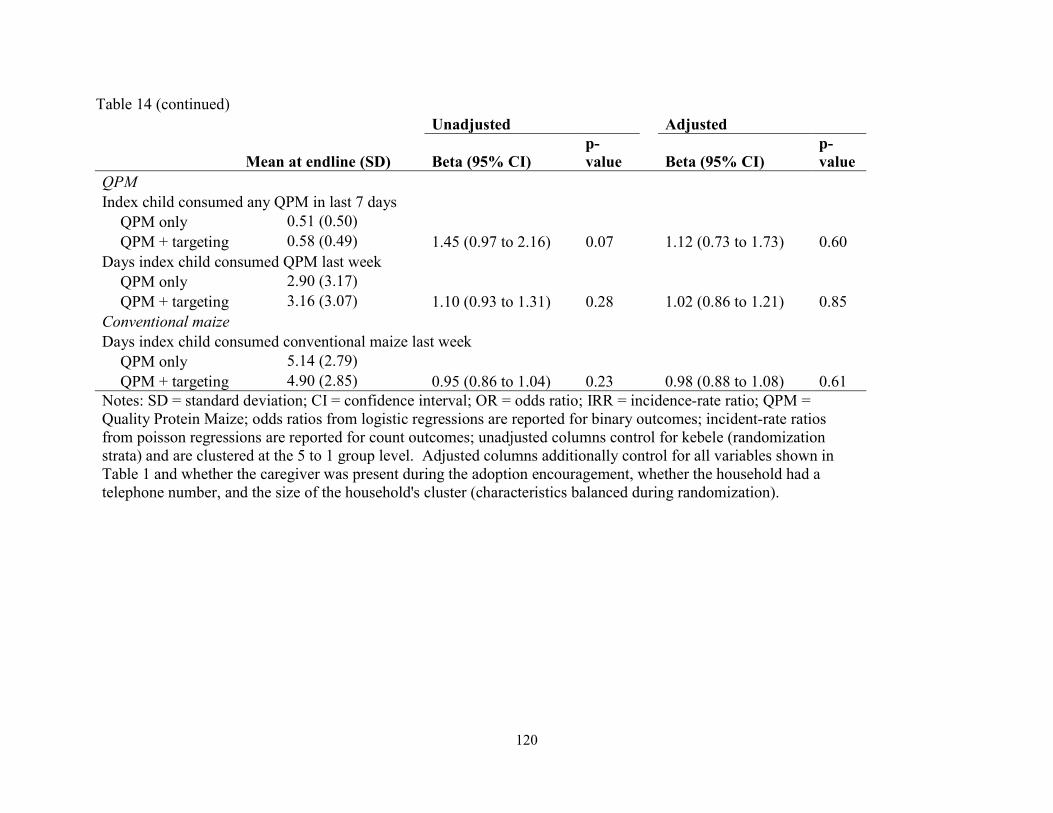
120
Table 14 (continued) Unadjusted Adjusted
Mean at endline (SD) Beta (95% CI) p-value Beta (95% CI)
p-value
QPM Index child consumed any QPM in last 7 days QPM only 0.51 (0.50) QPM + targeting 0.58 (0.49) 1.45 (0.97 to 2.16) 0.07 1.12 (0.73 to 1.73) 0.60 Days index child consumed QPM last week QPM only 2.90 (3.17) QPM + targeting 3.16 (3.07) 1.10 (0.93 to 1.31) 0.28 1.02 (0.86 to 1.21) 0.85 Conventional maize Days index child consumed conventional maize last week QPM only 5.14 (2.79) QPM + targeting 4.90 (2.85) 0.95 (0.86 to 1.04) 0.23 0.98 (0.88 to 1.08) 0.61 Notes: SD = standard deviation; CI = confidence interval; OR = odds ratio; IRR = incidence-rate ratio; QPM = Quality Protein Maize; odds ratios from logistic regressions are reported for binary outcomes; incident-rate ratios from poisson regressions are reported for count outcomes; unadjusted columns control for kebele (randomization strata) and are clustered at the 5 to 1 group level. Adjusted columns additionally control for all variables shown in Table 1 and whether the caregiver was present during the adoption encouragement, whether the household had a telephone number, and the size of the household's cluster (characteristics balanced during randomization).
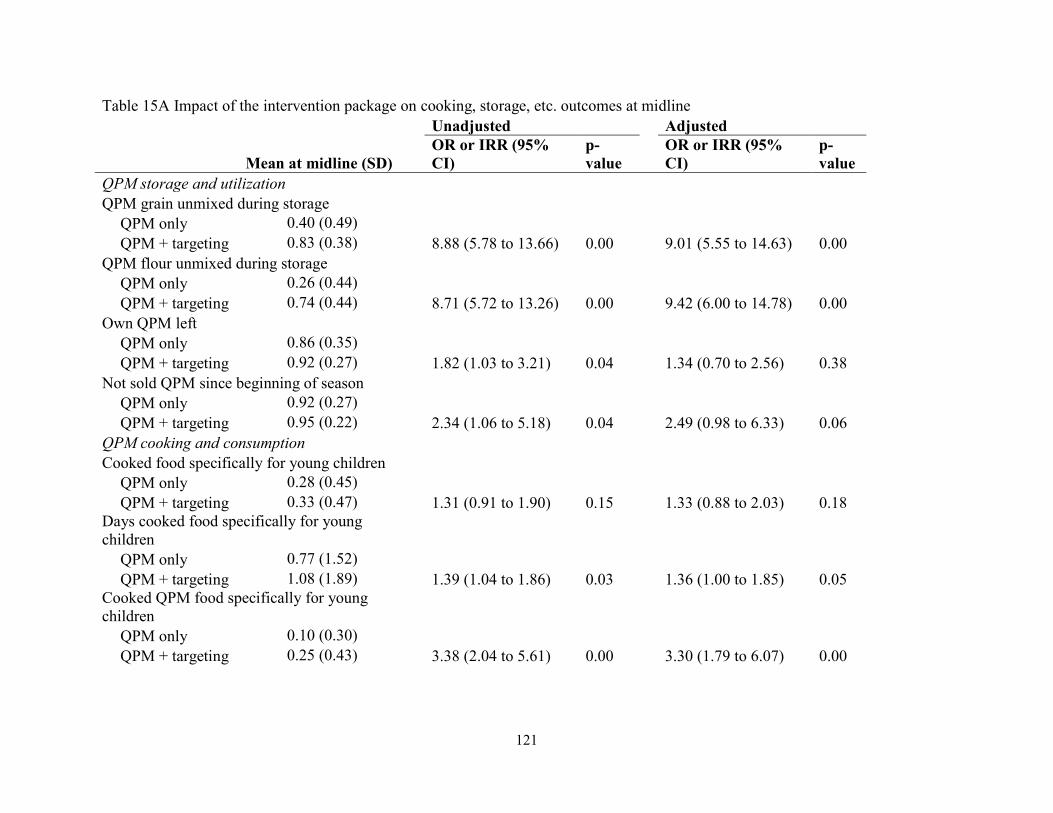
121
Table 15A Impact of the intervention package on cooking, storage, etc. outcomes at midline Unadjusted Adjusted
Mean at midline (SD) OR or IRR (95% CI)
p-value
OR or IRR (95% CI)
p-value
QPM storage and utilization QPM grain unmixed during storage QPM only 0.40 (0.49) QPM + targeting 0.83 (0.38) 8.88 (5.78 to 13.66) 0.00 9.01 (5.55 to 14.63) 0.00 QPM flour unmixed during storage QPM only 0.26 (0.44) QPM + targeting 0.74 (0.44) 8.71 (5.72 to 13.26) 0.00 9.42 (6.00 to 14.78) 0.00 Own QPM left QPM only 0.86 (0.35) QPM + targeting 0.92 (0.27) 1.82 (1.03 to 3.21) 0.04 1.34 (0.70 to 2.56) 0.38 Not sold QPM since beginning of season QPM only 0.92 (0.27) QPM + targeting 0.95 (0.22) 2.34 (1.06 to 5.18) 0.04 2.49 (0.98 to 6.33) 0.06 QPM cooking and consumption Cooked food specifically for young children QPM only 0.28 (0.45) QPM + targeting 0.33 (0.47) 1.31 (0.91 to 1.90) 0.15 1.33 (0.88 to 2.03) 0.18 Days cooked food specifically for young children QPM only 0.77 (1.52) QPM + targeting 1.08 (1.89) 1.39 (1.04 to 1.86) 0.03 1.36 (1.00 to 1.85) 0.05 Cooked QPM food specifically for young children QPM only 0.10 (0.30) QPM + targeting 0.25 (0.43) 3.38 (2.04 to 5.61) 0.00 3.30 (1.79 to 6.07) 0.00
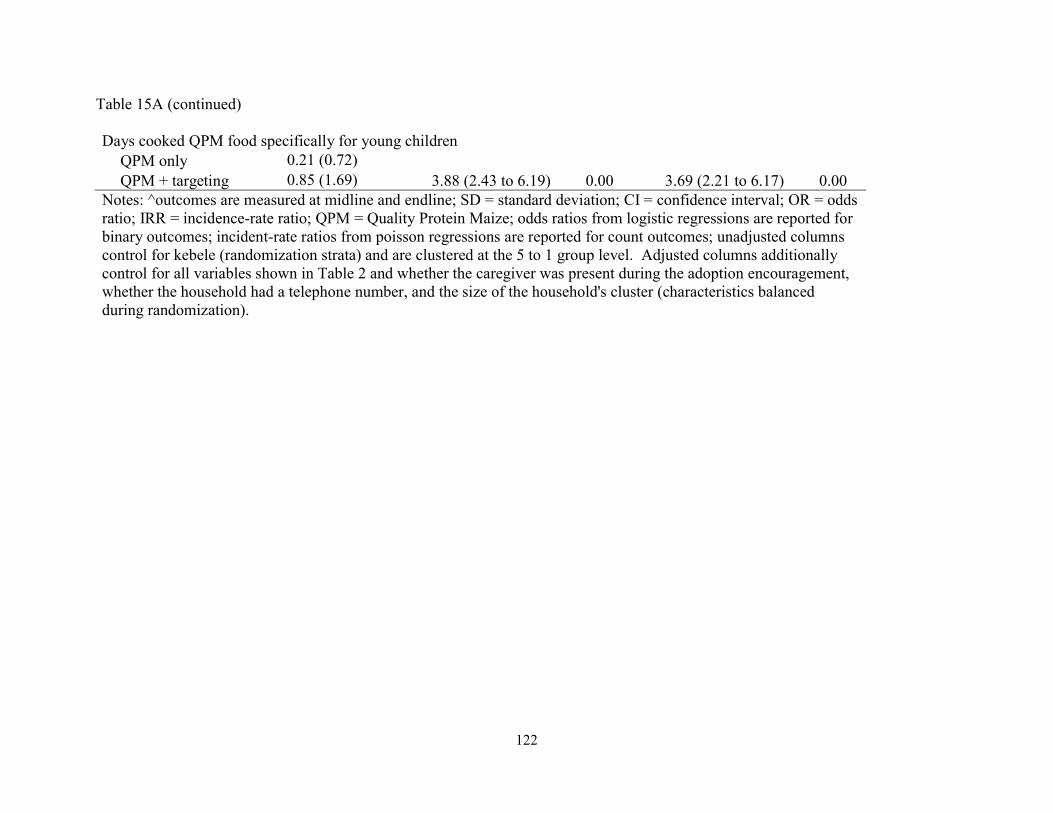
122
Table 15A (continued) Days cooked QPM food specifically for young children QPM only 0.21 (0.72) QPM + targeting 0.85 (1.69) 3.88 (2.43 to 6.19) 0.00 3.69 (2.21 to 6.17) 0.00 Notes: ^outcomes are measured at midline and endline; SD = standard deviation; CI = confidence interval; OR = odds ratio; IRR = incidence-rate ratio; QPM = Quality Protein Maize; odds ratios from logistic regressions are reported for binary outcomes; incident-rate ratios from poisson regressions are reported for count outcomes; unadjusted columns control for kebele (randomization strata) and are clustered at the 5 to 1 group level. Adjusted columns additionally control for all variables shown in Table 2 and whether the caregiver was present during the adoption encouragement, whether the household had a telephone number, and the size of the household's cluster (characteristics balanced during randomization).
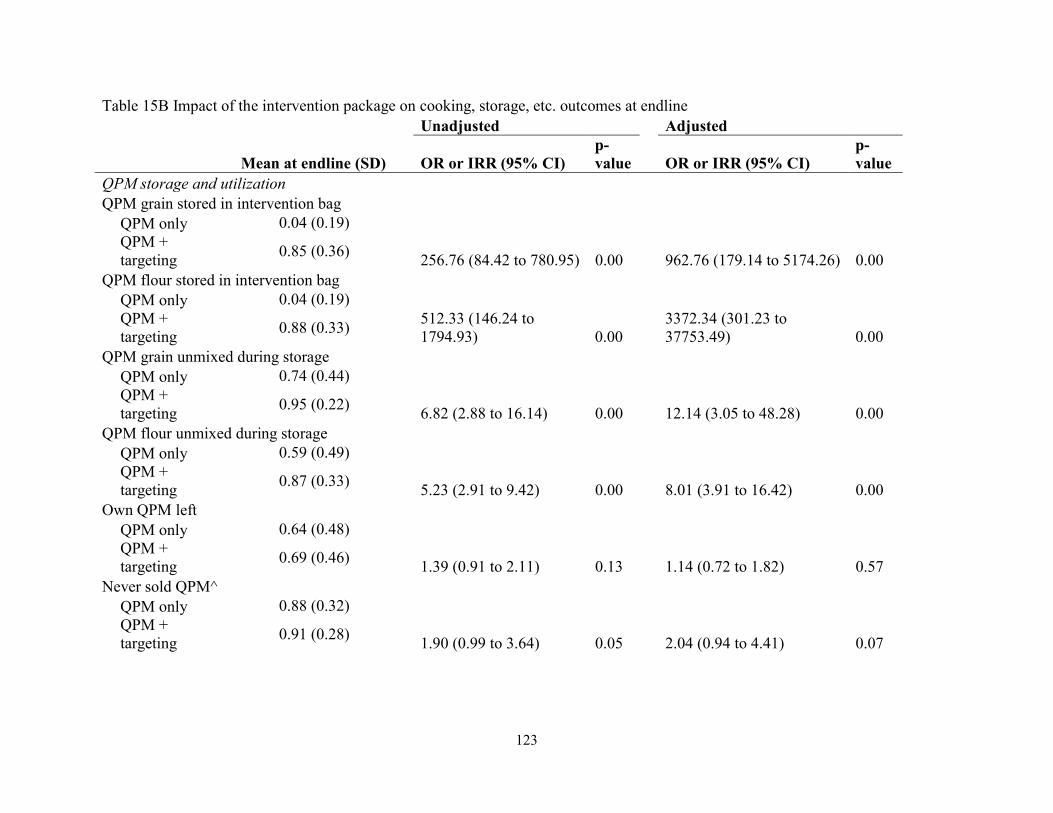
123
Table 15B Impact of the intervention package on cooking, storage, etc. outcomes at endline Unadjusted Adjusted
Mean at endline (SD) OR or IRR (95% CI) p-value OR or IRR (95% CI)
p-value
QPM storage and utilization QPM grain stored in intervention bag QPM only 0.04 (0.19)
QPM + targeting
0.85 (0.36) 256.76 (84.42 to 780.95) 0.00 962.76 (179.14 to 5174.26) 0.00
QPM flour stored in intervention bag QPM only 0.04 (0.19)
QPM + targeting
0.88 (0.33)
512.33 (146.24 to 1794.93) 0.00
3372.34 (301.23 to 37753.49) 0.00
QPM grain unmixed during storage QPM only 0.74 (0.44)
QPM + targeting
0.95 (0.22) 6.82 (2.88 to 16.14) 0.00 12.14 (3.05 to 48.28) 0.00
QPM flour unmixed during storage QPM only 0.59 (0.49)
QPM + targeting
0.87 (0.33) 5.23 (2.91 to 9.42) 0.00 8.01 (3.91 to 16.42) 0.00
Own QPM left QPM only 0.64 (0.48)
QPM + targeting
0.69 (0.46) 1.39 (0.91 to 2.11) 0.13 1.14 (0.72 to 1.82) 0.57
Never sold QPM^ QPM only 0.88 (0.32)
QPM + targeting
0.91 (0.28) 1.90 (0.99 to 3.64) 0.05 2.04 (0.94 to 4.41) 0.07
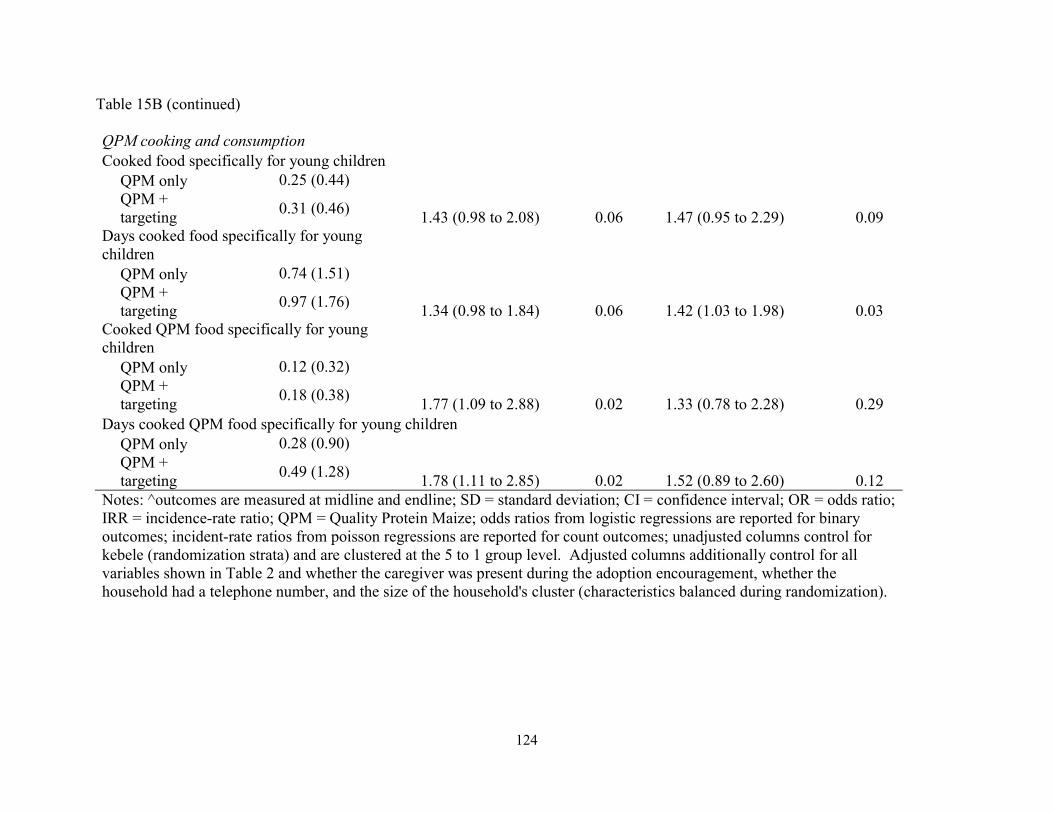
124
Table 15B (continued) QPM cooking and consumption Cooked food specifically for young children QPM only 0.25 (0.44)
QPM + targeting
0.31 (0.46) 1.43 (0.98 to 2.08) 0.06 1.47 (0.95 to 2.29) 0.09
Days cooked food specifically for young children QPM only 0.74 (1.51)
QPM + targeting
0.97 (1.76) 1.34 (0.98 to 1.84) 0.06 1.42 (1.03 to 1.98) 0.03
Cooked QPM food specifically for young children QPM only 0.12 (0.32)
QPM + targeting
0.18 (0.38) 1.77 (1.09 to 2.88) 0.02 1.33 (0.78 to 2.28) 0.29
Days cooked QPM food specifically for young children QPM only 0.28 (0.90)
QPM + targeting
0.49 (1.28) 1.78 (1.11 to 2.85) 0.02 1.52 (0.89 to 2.60) 0.12
Notes: ^outcomes are measured at midline and endline; SD = standard deviation; CI = confidence interval; OR = odds ratio; IRR = incidence-rate ratio; QPM = Quality Protein Maize; odds ratios from logistic regressions are reported for binary outcomes; incident-rate ratios from poisson regressions are reported for count outcomes; unadjusted columns control for kebele (randomization strata) and are clustered at the 5 to 1 group level. Adjusted columns additionally control for all variables shown in Table 2 and whether the caregiver was present during the adoption encouragement, whether the household had a telephone number, and the size of the household's cluster (characteristics balanced during randomization).
125
Chapter 3 Supplementary Materials
Scripts
General information script Immediately following the baseline surveys with the index child’s caregiver, the enumerators
delivered a brief educational message to all households, adapted from UNICEF guidelines found
at https://www.unicef.org/nutrition/files/counseling_cards_Oct._2012small.pdf. In delivering
this message, the enumerators followed the following script, assisted by the visual guide shown
in Figure .
Continue to breastfeed (until at least 2 years) and feed a variety of foods at each meal to your
young child. For example:
Animal source foods (meat, chicken, fish, liver), and eggs, milk, and milk products
Staples (maize, wheat, rice, teff, and sorghum); roots and tubers (cassava, potatoes)
Legumes (beans, lentils, peas, groundnuts) and seeds (sesame)
Vitamin-A rich fruits and vegetables (mango, papaya, passion fruit, oranges, dark-
green leaves, carrots, yellow sweet potato, and pumpkin) and other fruit and
vegetables (banana, pineapple, watermelon, tomatoes, avocado, eggplant, and
cabbage)
Maintain safe preparation and storage methods:
Wash your hands with soap before preparing food, and before feeding your baby.
Your baby’s hands should be washed also.
Wash your hands after changing nappies or going to the toilet.
Wash all bowls, cups and utensils with clean water and soap. Keep covered before
using.

126
Prepare food in a clean area and keep it covered. A baby should have his or her own
cup and bowl.
Serve food immediately after preparation.
Other notes:
Introduce animal source foods early to babies and young children and give them as
often as possible. Cook well and chop fine.
Additional nutritious snacks (extra food between meals) such as pieces of ripe mango,
papaya, banana, avocado, other fruits and vegetables, boiled potato, sweet potato and
fresh and fried bread products can be offered once or twice per day.
Try to feed a variety of foods at each meal.
Avoid giving sugary drinks or sweet biscuits.

127
Personalized information script
In households selected for the personalized information intervention, enumerators explained to
caregivers about the index child’s height quality using the visual in Figure 4 and script shown
below.
As you know, the quality of a child’s nutrition during the first few years has a large
impact on his/her schooling, health, and adult outcomes, and it is difficult to make up for
poor growth later in life.
In order to understand whether a child is receiving proper nutrition during his/her first
few years, we often focus on the child’s height.
We focus on a child’s height, rather than weight, as a measure of nutritional status since it
reflects longer-term influences, especially the quality of the child’s nutritional intake over
time. Height is not influenced by recent illnesses or recent differences in food
availability the way that weight might be.
As you know, we have measured [INDEX CHILD]’s height and weight several times
over the past year. Since it is sometimes difficult to know whether a child’s height is
appropriate given their age, I want to provide some additional guidance to you today
about your child’s height.
Since children in different parts of the world may grow differently, I will show you
information on how your child’s height compares to other healthy children like those
living in East Africa who are also boys/girls.
SHOW CARD WITH CHILD’S CURRENT HEIGHT EVALUATIONS

128
As we discussed during the interview, this visual here is designed to visually show the
quality of a child’s height.
Each of the five positions represents the relative rank of a child’s height, compared to
other children who are the same age and gender from East Africa.
o For example, if a child was very short compared to other children her age and
gender from East Africa, her height would be represented by this first position.
o A child who was very tall compared to her peers would be represented by this last
position.
o Those who are about average would be represented by this middle space.
o Those who are relatively short, but not the shortest, would be in the second
position, and those who are relatively tall, but not the tallest, would be in the
fourth position.
Finally, I want to emphasize that if your child’s current height is unsatisfactory, this is
not indicative of an acute problem. Rather, you may want to consider how you can
improve your child’s growth going forward, and the health extension worker can help
provide guidance. If our measurements of your child indicated an acute problem, we
would have referred him/her to a health facility when we recently measured your child.
Based on our recent measurements of your child, his/her current height, compared to
other healthy East African children who are the same age and gender is very satisfactory /
somewhat satisfactory / neither satisfactory nor unsatisfactory / somewhat unsatisfactory /
very unsatisfactory.
Do you have any questions?

129
Labeled cash transfer script
In households selected for the labeled cash transfer intervention, enumerators found a private
location and followed the following script when giving the 6 cash-filled envelopes to the
caregivers.
We know that it is sometimes difficult to afford the food that you would most like to feed
[INDEX CHILD], so today I have a small cash transfer to offer you in order to buy a few
more healthy foods for [INDEX CHILD] over the next 6 weeks.
I have a total of 150 birr to offer to you, which has been evenly divided into these 6
envelopes. Each envelope has 25 birr. Each week, you should use the money in one
envelope to purchase additional healthy foods for [INDEX CHILD] that you would not
otherwise typically feed to the child. In other words, this money should not be used for
foods that you already normally buy for [INDEX CHILD].
For example, you may wish to purchase enough eggs to feed to the index child several
times per week.
To make it easier to keep track of the money, each envelope is numbered and has
[INDEX CHILD]’s name. You should only open one envelope each week.
It is important that you use this money only for purchasing healthy foods for [INDEX
CHILD], so that he/she may grow a healthy amount over the next 6 weeks.
You may also wish to use the money for purchasing foods for any other younger children
in your household since it is also very important for these young children to consume
healthy foods.
Your household has been randomly selected to receive this one-time cash transfer, and
there are no current plans to extend this cash transfer program in the future.

130
Do you have any questions?
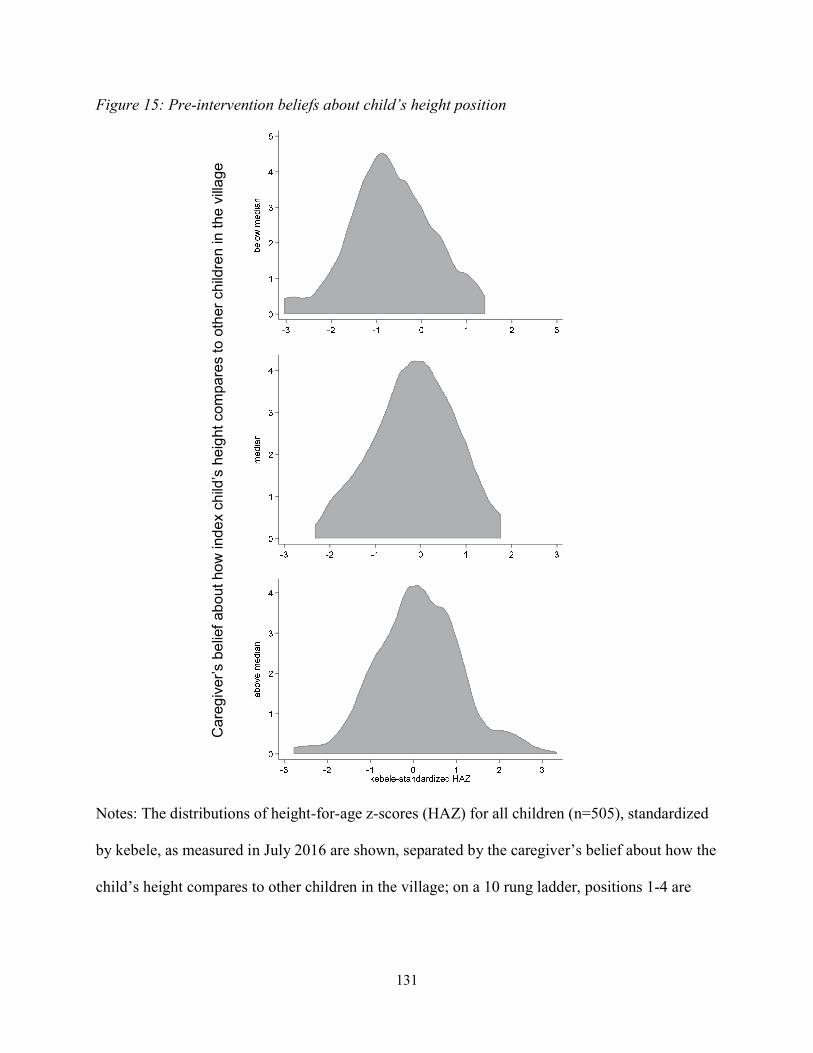
131
Figure 15: Pre-intervention beliefs about child’s height position
Notes: The distributions of height-for-age z-scores (HAZ) for all children (n=505), standardized
by kebele, as measured in July 2016 are shown, separated by the caregiver’s belief about how the
child’s height compares to other children in the village; on a 10 rung ladder, positions 1-4 are
Car
egiv
er’s
be
lief
abou
t ho
w in
de
x ch
ild’s
hei
ght
com
pare
s to
oth
er c
hild
ren
in t
he v
illa
ge

132
depicted as “below median”, 5 is depicted as “median”, and 6-10 are depicted as “above
median”. 12%, 34%, and 54% of cases fall into each of the three bins.
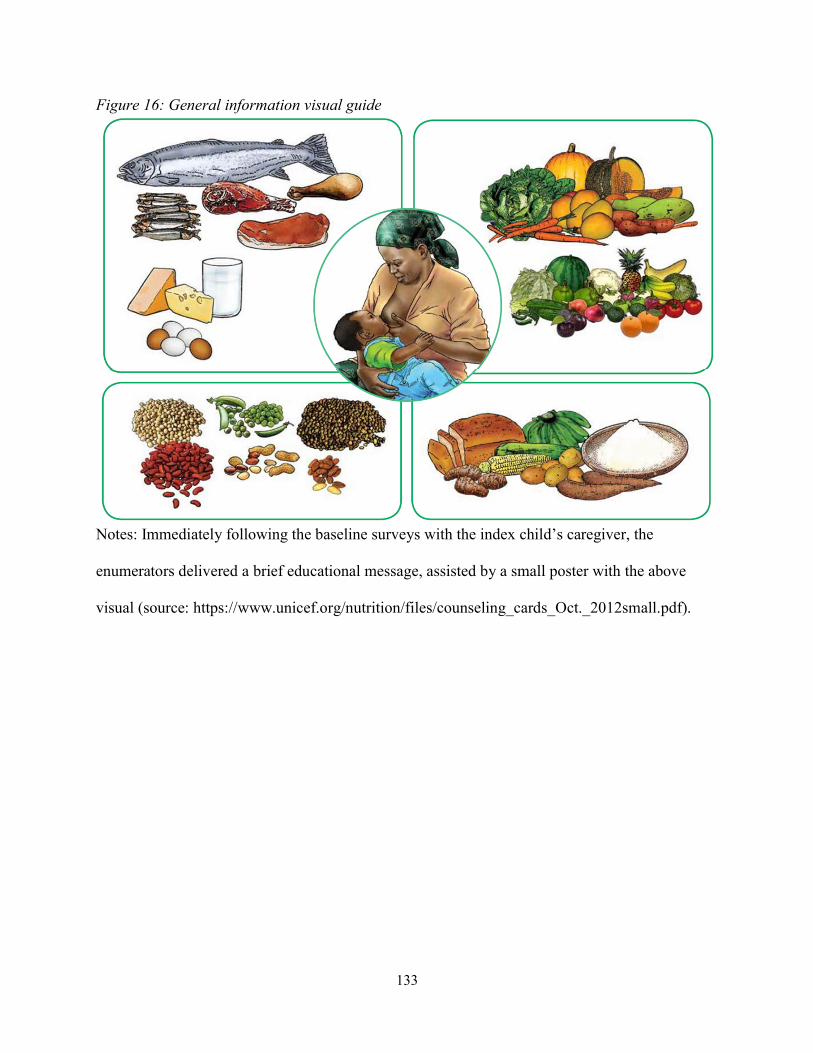
133
Figure 16: General information visual guide
Notes: Immediately following the baseline surveys with the index child’s caregiver, the
enumerators delivered a brief educational message, assisted by a small poster with the above
visual (source: https://www.unicef.org/nutrition/files/counseling_cards_Oct._2012small.pdf).
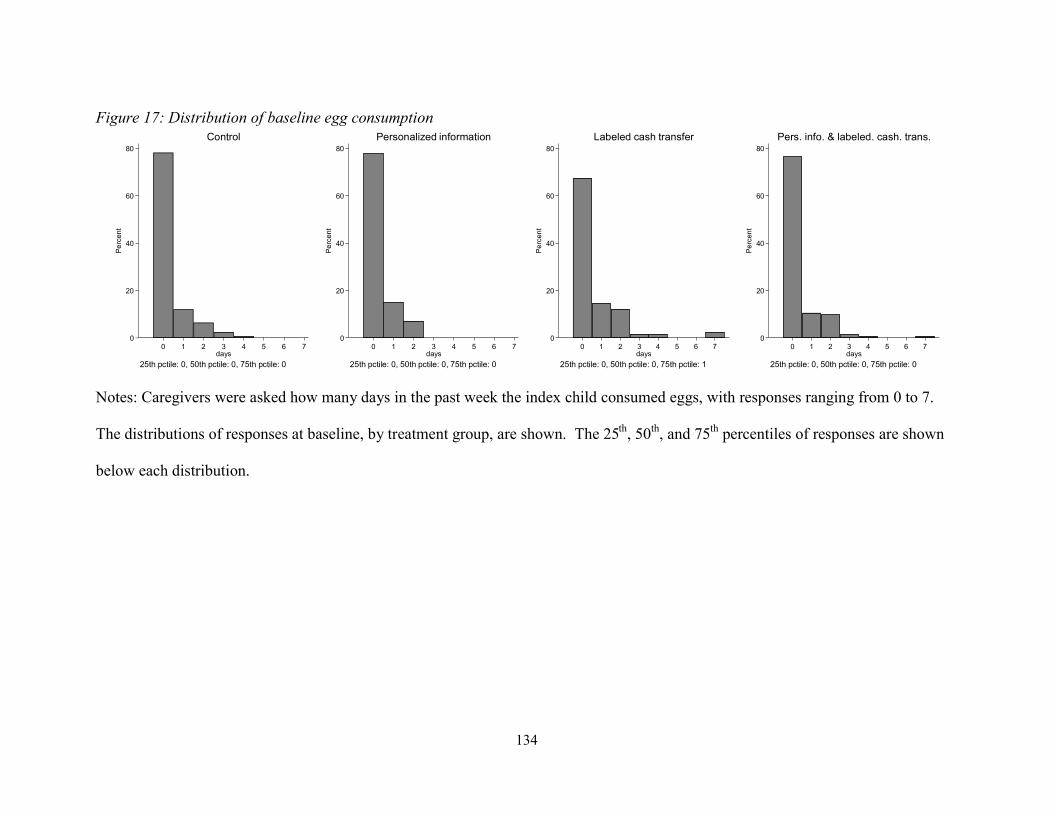
134
Figure 17: Distribution of baseline egg consumption
Notes: Caregivers were asked how many days in the past week the index child consumed eggs, with responses ranging from 0 to 7.
The distributions of responses at baseline, by treatment group, are shown. The 25th, 50th, and 75th percentiles of responses are shown
below each distribution.
0
20
40
60
80
Pe
rcen
t
0 1 2 3 4 5 6 7days
25th pctile: 0, 50th pctile: 0, 75th pctile: 0
Control
0
20
40
60
80
Pe
rcen
t
0 1 2 3 4 5 6 7days
25th pctile: 0, 50th pctile: 0, 75th pctile: 0
Personalized information
0
20
40
60
80
Pe
rcen
t
0 1 2 3 4 5 6 7days
25th pctile: 0, 50th pctile: 0, 75th pctile: 1
Labeled cash transfer
0
20
40
60
80
Pe
rcen
t
0 1 2 3 4 5 6 7days
25th pctile: 0, 50th pctile: 0, 75th pctile: 0
Pers. info. & labeled. cash. trans.
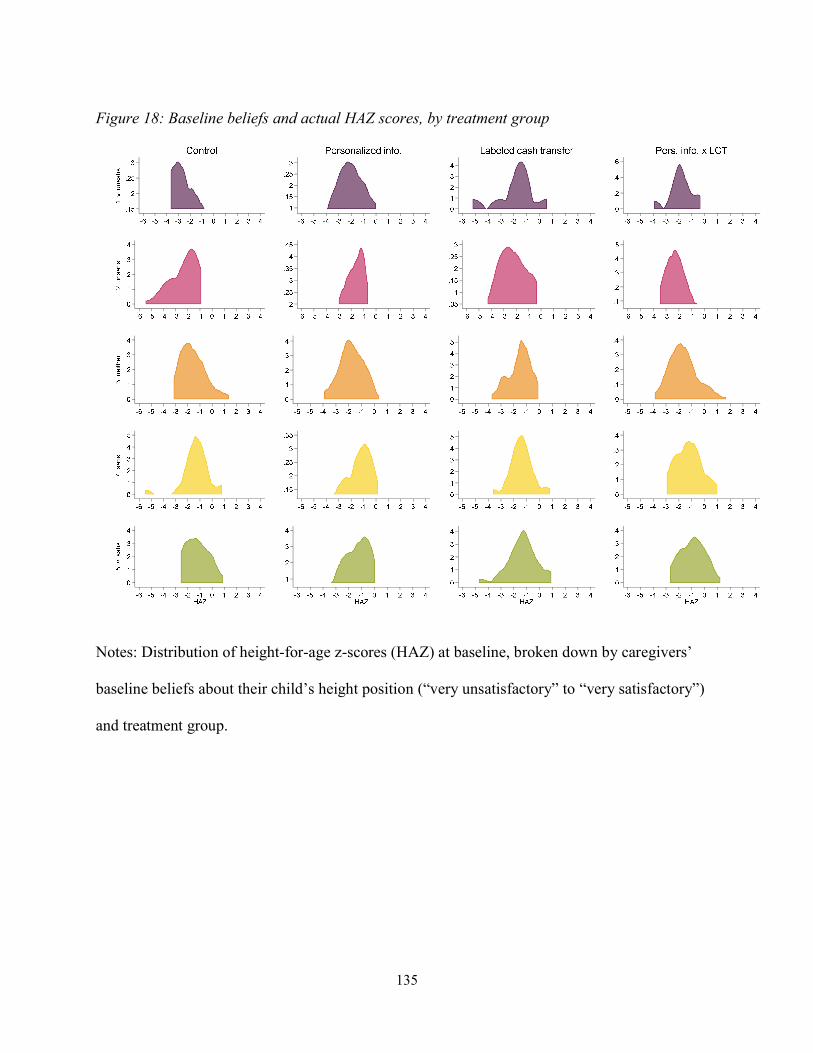
135
Figure 18: Baseline beliefs and actual HAZ scores, by treatment group
Notes: Distribution of height-for-age z-scores (HAZ) at baseline, broken down by caregivers’
baseline beliefs about their child’s height position (“very unsatisfactory” to “very satisfactory”)
and treatment group.
136
Figures 19 and 20 below show that reported spending and consumption are plausibly consistent.
In both figures, the x-axis shows the reported number of days in the past week that the index child
consumed eggs.1 The y-axis shows the “predicted” number of eggs available through purchase by the
household in the past week – calculated by dividing spending on eggs in the past 30 days by four (to get a
rough weekly spending amount), and then dividing by the price of eggs.2 The gray, dashed line in each
figure is drawn at 45 degrees, indicating a case where the predicted number of purchased eggs available in
the household per week exactly equals the number of days in the past week when the index child was
reported to have consumed eggs.
Figure 19 shows the relationship between reported egg consumption days in the past week and
predicted number of eggs purchased by the household for the lowest and highest prices reported for eggs
(i.e., an upper and lower bound for number of available purchased eggs), and shows that responses on egg
consumption and spending appear fairly consistent, especially if children are receiving at most one egg
per day, as was found to be the case during focus groups and piloting prior to the intervention.
About a third of households reported owning a hen that was currently laying eggs at the time of
the survey. In Figure 20, I again consider the relationship between reported days of egg consumption in
the past week with predicted number of eggs purchased (using the median egg price), split by whether the
household currently has an egg-laying hen. As expected, the predicted number of eggs purchased based
on reported spending is higher for households without an egg-laying hen. Moreover, the predicted
number of eggs purchased is almost always greater than days reported of index child egg consumption for
these households – further corroboration of the internal consistency of respondents’ self-reported
spending and food consumption.
1 Because only one respondent answered “5 days” in the past week, this observation was dropped when constructing the figures. 2 Egg prices were collected from markets in each kebele during the baseline and endline surveys. Endline prices are used for this exercise to be consistent with the other values used in the figure.
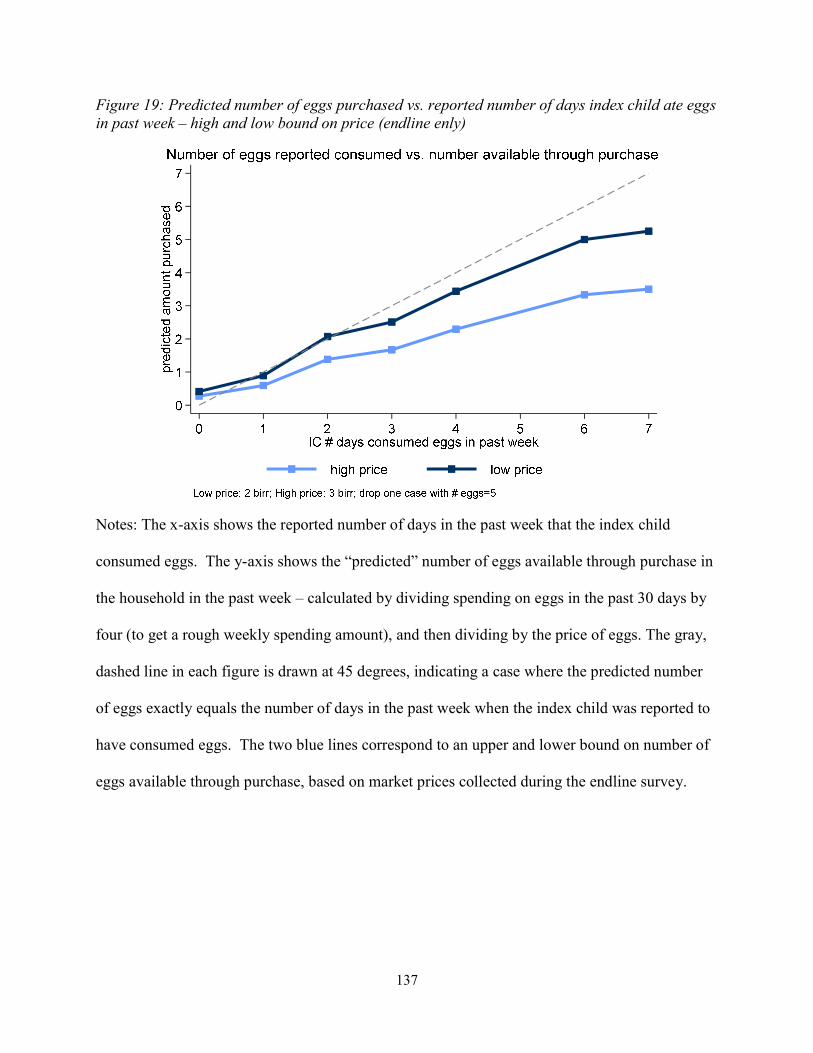
137
Figure 19: Predicted number of eggs purchased vs. reported number of days index child ate eggs in past week – high and low bound on price (endline enly)
Notes: The x-axis shows the reported number of days in the past week that the index child
consumed eggs. The y-axis shows the “predicted” number of eggs available through purchase in
the household in the past week – calculated by dividing spending on eggs in the past 30 days by
four (to get a rough weekly spending amount), and then dividing by the price of eggs. The gray,
dashed line in each figure is drawn at 45 degrees, indicating a case where the predicted number
of eggs exactly equals the number of days in the past week when the index child was reported to
have consumed eggs. The two blue lines correspond to an upper and lower bound on number of
eggs available through purchase, based on market prices collected during the endline survey.
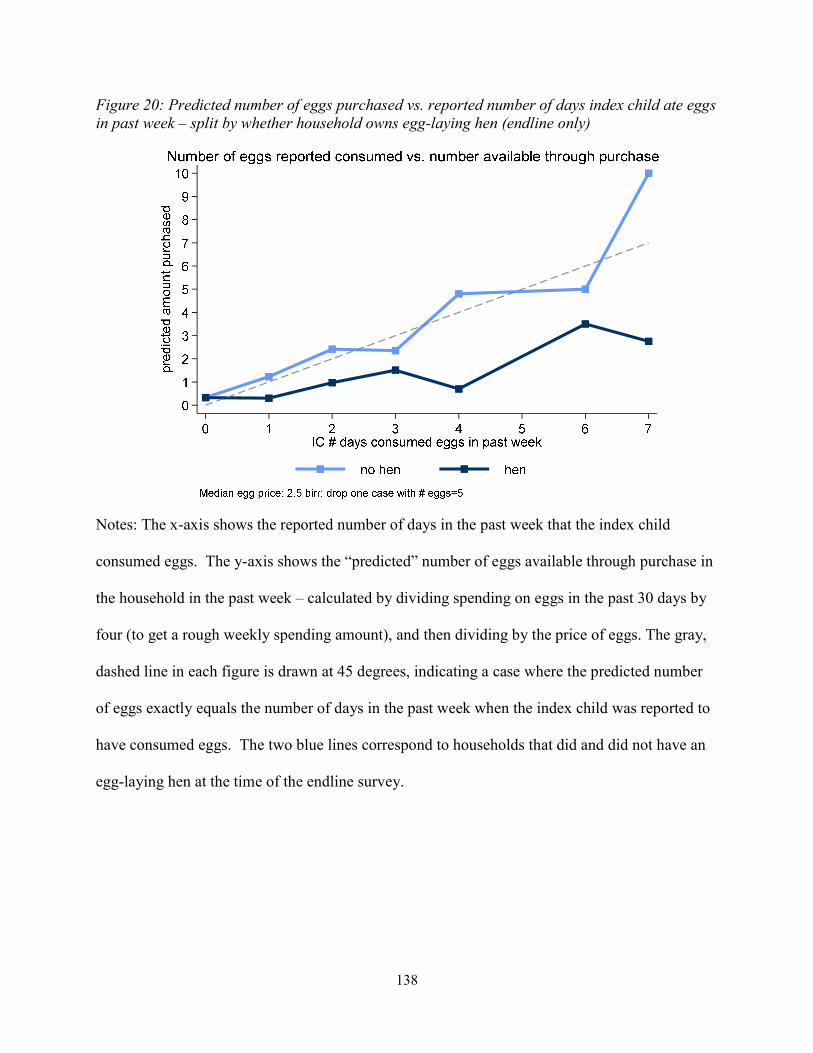
138
Figure 20: Predicted number of eggs purchased vs. reported number of days index child ate eggs in past week – split by whether household owns egg-laying hen (endline only)
Notes: The x-axis shows the reported number of days in the past week that the index child
consumed eggs. The y-axis shows the “predicted” number of eggs available through purchase in
the household in the past week – calculated by dividing spending on eggs in the past 30 days by
four (to get a rough weekly spending amount), and then dividing by the price of eggs. The gray,
dashed line in each figure is drawn at 45 degrees, indicating a case where the predicted number
of eggs exactly equals the number of days in the past week when the index child was reported to
have consumed eggs. The two blue lines correspond to households that did and did not have an
egg-laying hen at the time of the endline survey.
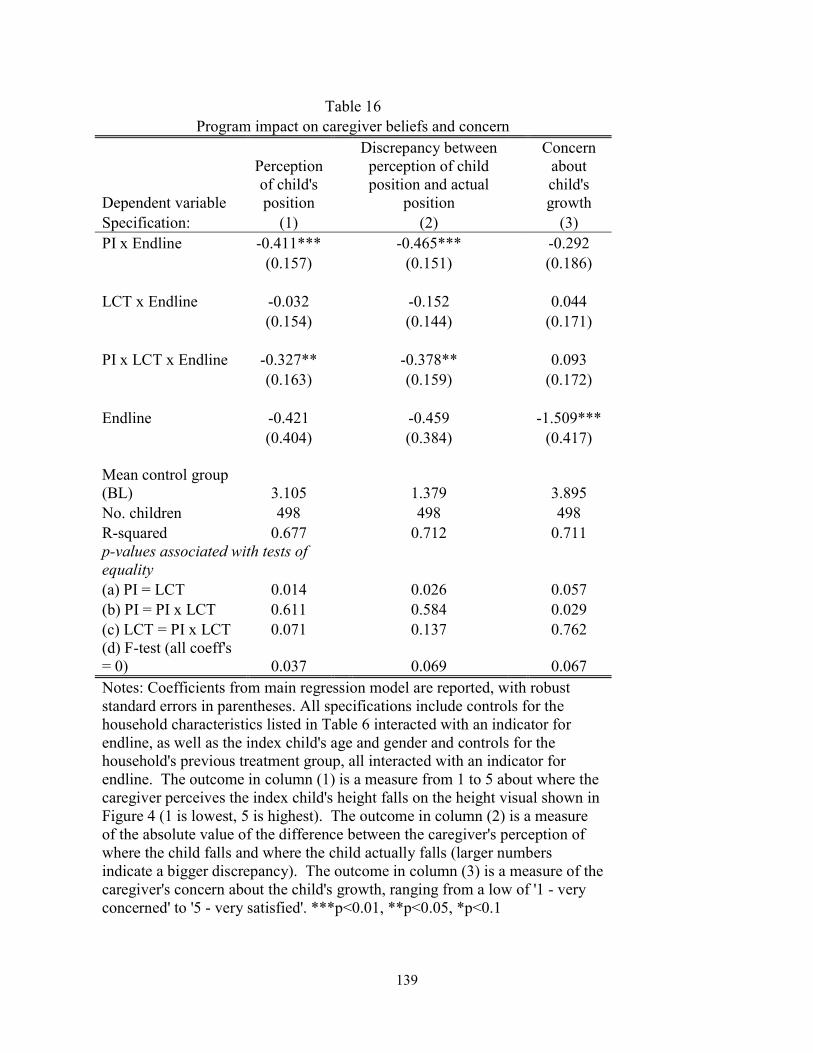
139
Table 16 Program impact on caregiver beliefs and concern
Dependent variable
Perception of child's position
Discrepancy between perception of child position and actual
position
Concern about child's growth
Specification: (1) (2) (3) PI x Endline -0.411*** -0.465*** -0.292 (0.157) (0.151) (0.186) LCT x Endline -0.032 -0.152 0.044 (0.154) (0.144) (0.171) PI x LCT x Endline -0.327** -0.378** 0.093 (0.163) (0.159) (0.172) Endline -0.421 -0.459 -1.509*** (0.404) (0.384) (0.417) Mean control group (BL) 3.105 1.379 3.895 No. children 498 498 498 R-squared 0.677 0.712 0.711 p-values associated with tests of equality (a) PI = LCT 0.014 0.026 0.057 (b) PI = PI x LCT 0.611 0.584 0.029 (c) LCT = PI x LCT 0.071 0.137 0.762 (d) F-test (all coeff's = 0) 0.037 0.069 0.067 Notes: Coefficients from main regression model are reported, with robust standard errors in parentheses. All specifications include controls for the household characteristics listed in Table 6 interacted with an indicator for endline, as well as the index child's age and gender and controls for the household's previous treatment group, all interacted with an indicator for endline. The outcome in column (1) is a measure from 1 to 5 about where the caregiver perceives the index child's height falls on the height visual shown in Figure 4 (1 is lowest, 5 is highest). The outcome in column (2) is a measure of the absolute value of the difference between the caregiver's perception of where the child falls and where the child actually falls (larger numbers indicate a bigger discrepancy). The outcome in column (3) is a measure of the caregiver's concern about the child's growth, ranging from a low of '1 - very concerned' to '5 - very satisfied'. ***p<0.01, **p<0.05, *p<0.1
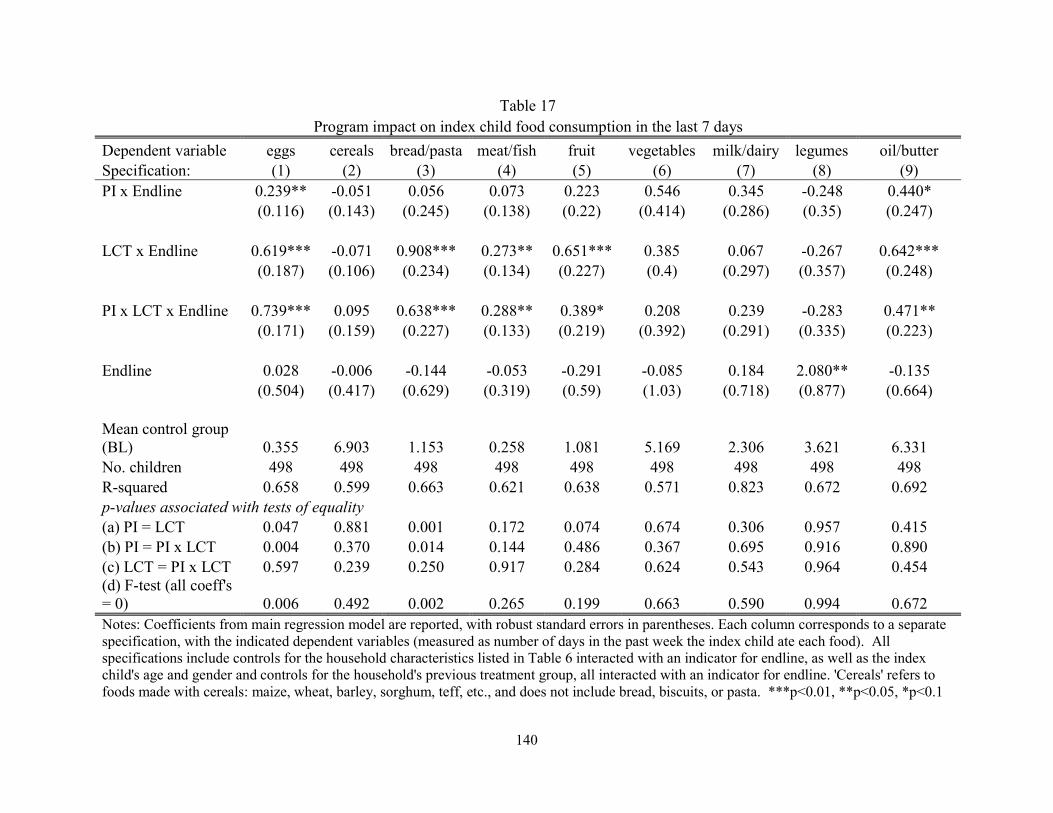
140
Table 17 Program impact on index child food consumption in the last 7 days
Dependent variable eggs cereals bread/pasta meat/fish fruit vegetables milk/dairy legumes oil/butter Specification: (1) (2) (3) (4) (5) (6) (7) (8) (9) PI x Endline 0.239** -0.051 0.056 0.073 0.223 0.546 0.345 -0.248 0.440*
(0.116) (0.143) (0.245) (0.138) (0.22) (0.414) (0.286) (0.35) (0.247)
LCT x Endline 0.619*** -0.071 0.908*** 0.273** 0.651*** 0.385 0.067 -0.267 0.642*** (0.187) (0.106) (0.234) (0.134) (0.227) (0.4) (0.297) (0.357) (0.248)
PI x LCT x Endline 0.739*** 0.095 0.638*** 0.288** 0.389* 0.208 0.239 -0.283 0.471** (0.171) (0.159) (0.227) (0.133) (0.219) (0.392) (0.291) (0.335) (0.223)
Endline 0.028 -0.006 -0.144 -0.053 -0.291 -0.085 0.184 2.080** -0.135 (0.504) (0.417) (0.629) (0.319) (0.59) (1.03) (0.718) (0.877) (0.664)
Mean control group (BL) 0.355 6.903 1.153 0.258 1.081 5.169 2.306 3.621 6.331 No. children 498 498 498 498 498 498 498 498 498 R-squared 0.658 0.599 0.663 0.621 0.638 0.571 0.823 0.672 0.692 p-values associated with tests of equality (a) PI = LCT 0.047 0.881 0.001 0.172 0.074 0.674 0.306 0.957 0.415 (b) PI = PI x LCT 0.004 0.370 0.014 0.144 0.486 0.367 0.695 0.916 0.890 (c) LCT = PI x LCT 0.597 0.239 0.250 0.917 0.284 0.624 0.543 0.964 0.454 (d) F-test (all coeff's = 0) 0.006 0.492 0.002 0.265 0.199 0.663 0.590 0.994 0.672 Notes: Coefficients from main regression model are reported, with robust standard errors in parentheses. Each column corresponds to a separate specification, with the indicated dependent variables (measured as number of days in the past week the index child ate each food). All specifications include controls for the household characteristics listed in Table 6 interacted with an indicator for endline, as well as the index child's age and gender and controls for the household's previous treatment group, all interacted with an indicator for endline. 'Cereals' refers to foods made with cereals: maize, wheat, barley, sorghum, teff, etc., and does not include bread, biscuits, or pasta. ***p<0.01, **p<0.05, *p<0.1
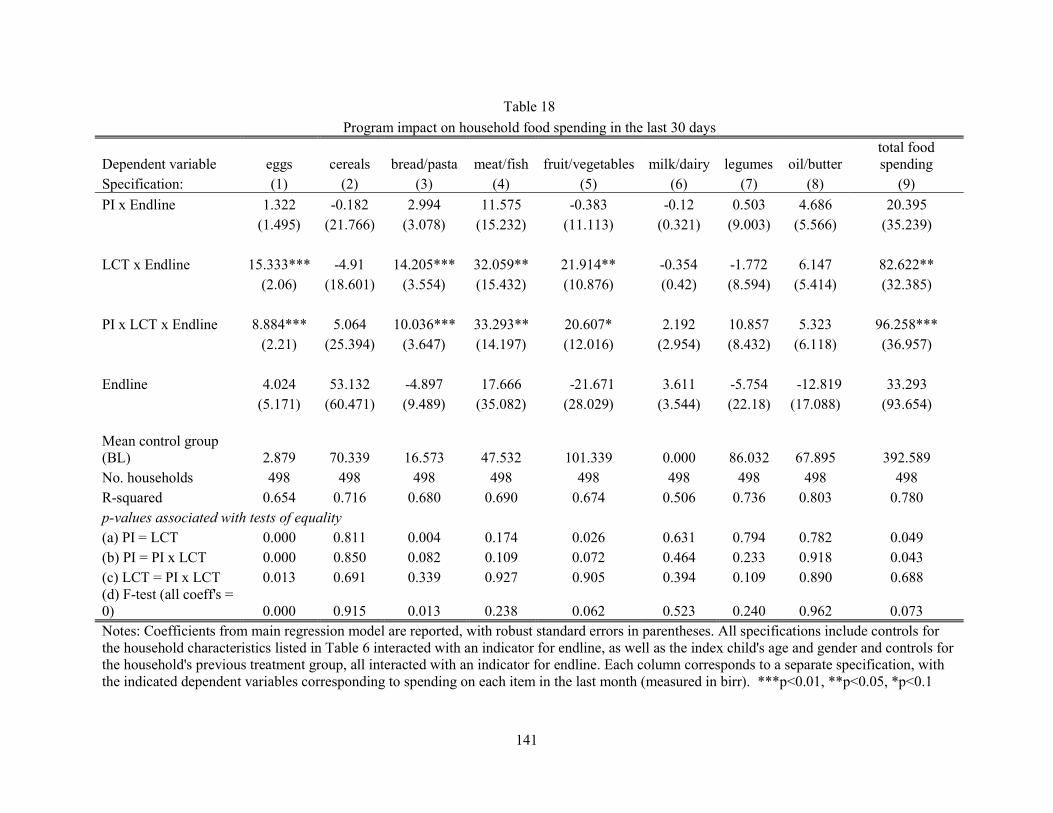
141
Table 18
Program impact on household food spending in the last 30 days
Dependent variable eggs cereals bread/pasta meat/fish fruit/vegetables milk/dairy legumes oil/butter total food spending
Specification: (1) (2) (3) (4) (5) (6) (7) (8) (9)
PI x Endline 1.322 -0.182 2.994 11.575 -0.383 -0.12 0.503 4.686 20.395 (1.495) (21.766) (3.078) (15.232) (11.113) (0.321) (9.003) (5.566) (35.239)
LCT x Endline 15.333*** -4.91 14.205*** 32.059** 21.914** -0.354 -1.772 6.147 82.622** (2.06) (18.601) (3.554) (15.432) (10.876) (0.42) (8.594) (5.414) (32.385)
PI x LCT x Endline 8.884*** 5.064 10.036*** 33.293** 20.607* 2.192 10.857 5.323 96.258*** (2.21) (25.394) (3.647) (14.197) (12.016) (2.954) (8.432) (6.118) (36.957)
Endline 4.024 53.132 -4.897 17.666 -21.671 3.611 -5.754 -12.819 33.293 (5.171) (60.471) (9.489) (35.082) (28.029) (3.544) (22.18) (17.088) (93.654)
Mean control group (BL) 2.879 70.339 16.573 47.532 101.339 0.000 86.032 67.895 392.589 No. households 498 498 498 498 498 498 498 498 498 R-squared 0.654 0.716 0.680 0.690 0.674 0.506 0.736 0.803 0.780 p-values associated with tests of equality (a) PI = LCT 0.000 0.811 0.004 0.174 0.026 0.631 0.794 0.782 0.049 (b) PI = PI x LCT 0.000 0.850 0.082 0.109 0.072 0.464 0.233 0.918 0.043 (c) LCT = PI x LCT 0.013 0.691 0.339 0.927 0.905 0.394 0.109 0.890 0.688 (d) F-test (all coeff's = 0) 0.000 0.915 0.013 0.238 0.062 0.523 0.240 0.962 0.073 Notes: Coefficients from main regression model are reported, with robust standard errors in parentheses. All specifications include controls for the household characteristics listed in Table 6 interacted with an indicator for endline, as well as the index child's age and gender and controls for the household's previous treatment group, all interacted with an indicator for endline. Each column corresponds to a separate specification, with the indicated dependent variables corresponding to spending on each item in the last month (measured in birr). ***p<0.01, **p<0.05, *p<0.1
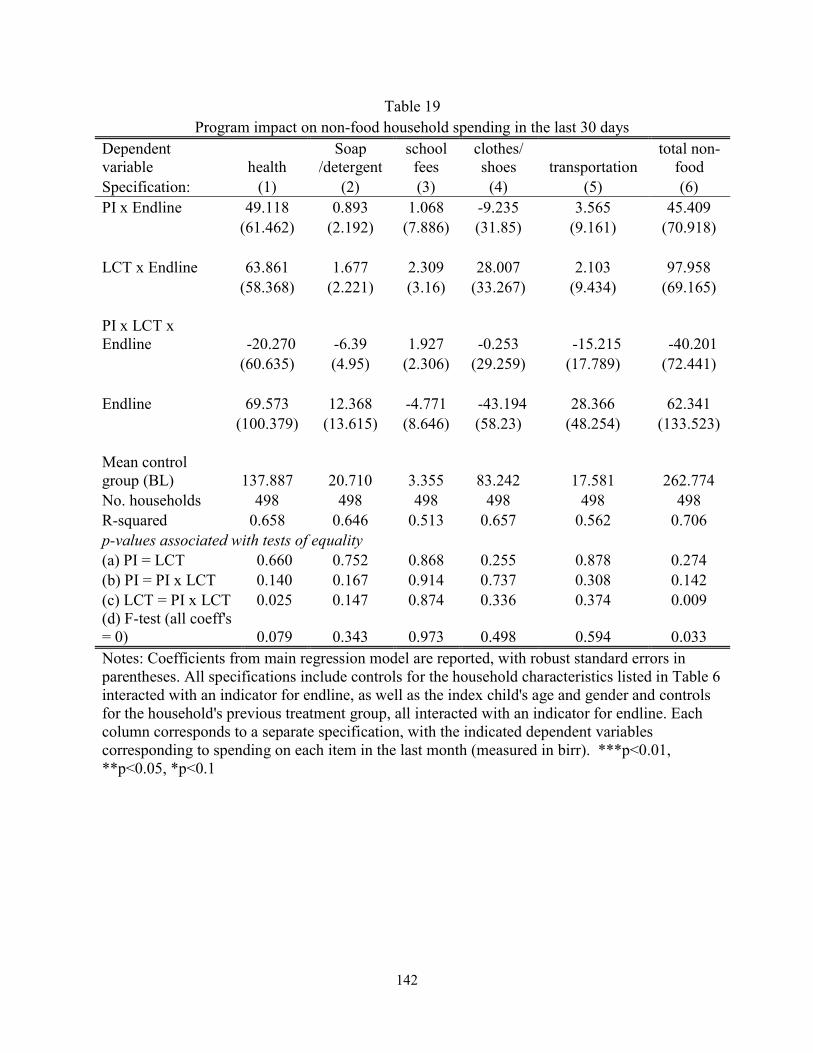
142
Table 19 Program impact on non-food household spending in the last 30 days
Dependent variable health
Soap /detergent
school fees
clothes/ shoes transportation
total non-food
Specification: (1) (2) (3) (4) (5) (6) PI x Endline 49.118 0.893 1.068 -9.235 3.565 45.409
(61.462) (2.192) (7.886) (31.85) (9.161) (70.918)
LCT x Endline 63.861 1.677 2.309 28.007 2.103 97.958 (58.368) (2.221) (3.16) (33.267) (9.434) (69.165)
PI x LCT x Endline -20.270 -6.39 1.927 -0.253 -15.215 -40.201
(60.635) (4.95) (2.306) (29.259) (17.789) (72.441)
Endline 69.573 12.368 -4.771 -43.194 28.366 62.341 (100.379) (13.615) (8.646) (58.23) (48.254) (133.523)
Mean control group (BL) 137.887 20.710 3.355 83.242 17.581 262.774 No. households 498 498 498 498 498 498 R-squared 0.658 0.646 0.513 0.657 0.562 0.706 p-values associated with tests of equality (a) PI = LCT 0.660 0.752 0.868 0.255 0.878 0.274 (b) PI = PI x LCT 0.140 0.167 0.914 0.737 0.308 0.142 (c) LCT = PI x LCT 0.025 0.147 0.874 0.336 0.374 0.009 (d) F-test (all coeff's = 0) 0.079 0.343 0.973 0.498 0.594 0.033 Notes: Coefficients from main regression model are reported, with robust standard errors in parentheses. All specifications include controls for the household characteristics listed in Table 6 interacted with an indicator for endline, as well as the index child's age and gender and controls for the household's previous treatment group, all interacted with an indicator for endline. Each column corresponds to a separate specification, with the indicated dependent variables corresponding to spending on each item in the last month (measured in birr). ***p<0.01, **p<0.05, *p<0.1
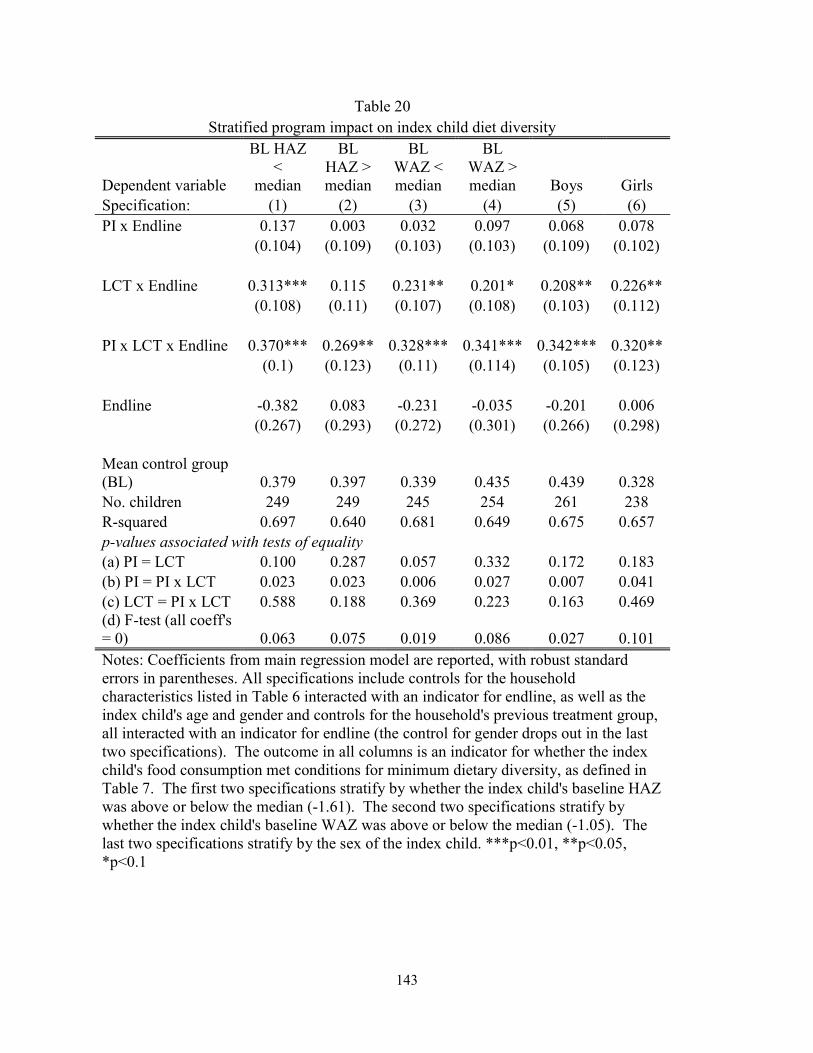
143
Table 20 Stratified program impact on index child diet diversity
Dependent variable
BL HAZ <
median
BL HAZ > median
BL WAZ < median
BL WAZ > median Boys Girls
Specification: (1) (2) (3) (4) (5) (6) PI x Endline 0.137 0.003 0.032 0.097 0.068 0.078
(0.104) (0.109) (0.103) (0.103) (0.109) (0.102)
LCT x Endline 0.313*** 0.115 0.231** 0.201* 0.208** 0.226** (0.108) (0.11) (0.107) (0.108) (0.103) (0.112)
PI x LCT x Endline 0.370*** 0.269** 0.328*** 0.341*** 0.342*** 0.320** (0.1) (0.123) (0.11) (0.114) (0.105) (0.123)
Endline -0.382 0.083 -0.231 -0.035 -0.201 0.006 (0.267) (0.293) (0.272) (0.301) (0.266) (0.298)
Mean control group (BL) 0.379 0.397 0.339 0.435 0.439 0.328 No. children 249 249 245 254 261 238 R-squared 0.697 0.640 0.681 0.649 0.675 0.657 p-values associated with tests of equality (a) PI = LCT 0.100 0.287 0.057 0.332 0.172 0.183 (b) PI = PI x LCT 0.023 0.023 0.006 0.027 0.007 0.041 (c) LCT = PI x LCT 0.588 0.188 0.369 0.223 0.163 0.469 (d) F-test (all coeff's = 0) 0.063 0.075 0.019 0.086 0.027 0.101 Notes: Coefficients from main regression model are reported, with robust standard errors in parentheses. All specifications include controls for the household characteristics listed in Table 6 interacted with an indicator for endline, as well as the index child's age and gender and controls for the household's previous treatment group, all interacted with an indicator for endline (the control for gender drops out in the last two specifications). The outcome in all columns is an indicator for whether the index child's food consumption met conditions for minimum dietary diversity, as defined in Table 7. The first two specifications stratify by whether the index child's baseline HAZ was above or below the median (-1.61). The second two specifications stratify by whether the index child's baseline WAZ was above or below the median (-1.05). The last two specifications stratify by the sex of the index child. ***p<0.01, **p<0.05, *p<0.1