
ESPQ: A New Object Oriented Design Metric for Software Quality … · M.V. Vijaya Saradhi et al. /...
15
M.V. Vijaya Saradhi et al. / International Journal of Engineering Science and Technology Vol. 2(3), 2010, 194-208 ESPQ: A New Object Oriented Design Metric for Software Quality Measurement M.V.Vijaya Saradhi 1 B.R.Sastry 2 1 Assoc.Prof, Dept. of Computer Science and Engineering (CSE), ASTRA, Hyderabad, India. 2 Director, ASTRA, Bandlaguda, Hyderabad, India. [email protected] Abstract In this paper we deliver, a unique new tracing approach for a metric that delivers the system quality based on coactions and cooperation between classes. The proposed metric determines the class level relations in terms of coactions and relations between classes based on the paths of flow in control and their number of occurrences. The proposed model conflicts with majority of existing systems in the context of input. Most of the existing systems rely on direct and exact values to evaluate a given design where as proposed model considers more relative values, for example, to identify classes that are sever in risk in a relative approach. An empirical study performed on different open source java based projects. Some of well known metrics compared with this new metric to evaluate the significance. PCA (Principal Components Analysis) method was used to perform this evaluation. The existing metrics used for evaluation under coupling, volume, complexness, inheritance and cohesion. The results represents that the proposed metric delivers the information alone that other metrics provides. Keywords: OO Metrics, Conditional Complexity, ESPQ Metric, EFG, PCA Method 1. Introduction Object-Oriented design and development is becoming very popular in today's software development environment. Object Oriented development requires not only a different approach to design and implementation, it requires a different approach to software metrics. Since Object-Oriented technology uses objects and not algorithms as its fundamental building blocks, the approach to software metrics for Object-Oriented programs must be different from the standard metrics set. However, it is not apparent for a developer or a project manager to select the metrics that are more useful. Furthermore, these metrics are not completely independent. Using several metrics at the same time is time consuming and can generate a quite large data set, which may be difficult to analyze and interpret. These days Object-Oriented Metrics emerged as adequate in several domains of Software Engineering [1, 5]. Various parameters in connection with the software products and processes are assessed through the use of Software Metrics. By applying these metrics to software, it becomes possible to gather numerical data that quantifiable, related to context dimensions. The ability of external elements like rely, testing and maintenance of software influence the accuracy of the resultant values of metrics [2, 7]. Metrics are then used to predict software quality [3]. In literature we can find the proposal of Object-Oriented Metrics that significant in assessing different elements of the software like cohesion, size, coupling and complexity. However, there is a little understanding of the empirical proposal intended to explain observations and usage model of metrics [4, 6, 8, 9, 10]. It is fact that neither programming official nor QA official, project manager apparent to select useful metrics. Moreover, these metrics are mostly emerged as dependent one on other [10, 11]. The information furnished by most of these metrics is sometimes found to be redundant. Sometimes when the software system itself is huge and of a complex nature, the process of collection of data regarding these metrics becomes very time consuming, and even after collection of such huge amounts of data, the next step of analyzing and interpreting the data becomes a humongous task! Hence, we need to identify and limit ourselves to a set of metrics which can provide us relevant and useful data. In order to assess classes in Object-Oriented Systems (OOS), a new metric called the Execution Streaming Probabilities for Quality (ESPQ) is suggested through this paper. The main purpose of this metric is to collected data, in an integrated approach, regarding the testability and the maintainability of the Object-Oriented Systems rather than focusing on all possible software quality measuring parameters. By doing so, the simultaneous usage of a ISSN: 0975-5462 194
Transcript of ESPQ: A New Object Oriented Design Metric for Software Quality … · M.V. Vijaya Saradhi et al. /...

M.V. Vijaya Saradhi et al. / International Journal of Engineering Science and Technology Vol. 2(3), 2010, 194-208
ESPQ: A New Object Oriented Design Metric for Software Quality Measurement
M.V.Vijaya Saradhi 1 B.R.Sastry 2
1 Assoc.Prof, Dept. of Computer Science and Engineering (CSE), ASTRA, Hyderabad, India.
2 Director, ASTRA, Bandlaguda, Hyderabad, India.
Abstract
In this paper we deliver, a unique new tracing approach for a metric that delivers the system quality based on coactions and cooperation between classes. The proposed metric determines the class level relations in terms of coactions and relations between classes based on the paths of flow in control and their number of occurrences. The proposed model conflicts with majority of existing systems in the context of input. Most of the existing systems rely on direct and exact values to evaluate a given design where as proposed model considers more relative values, for example, to identify classes that are sever in risk in a relative approach. An empirical study performed on different open source java based projects. Some of well known metrics compared with this new metric to evaluate the significance. PCA (Principal Components Analysis) method was used to perform this evaluation. The existing metrics used for evaluation under coupling, volume, complexness, inheritance and cohesion. The results represents that the proposed metric delivers the information alone that other metrics provides.
Keywords: OO Metrics, Conditional Complexity, ESPQ Metric, EFG, PCA Method
1. Introduction
Object-Oriented design and development is becoming very popular in today's software development environment. Object Oriented development requires not only a different approach to design and implementation, it requires a different approach to software metrics. Since Object-Oriented technology uses objects and not algorithms as its fundamental building blocks, the approach to software metrics for Object-Oriented programs must be different from the standard metrics set. However, it is not apparent for a developer or a project manager to select the metrics that are more useful. Furthermore, these metrics are not completely independent. Using several metrics at the same time is time consuming and can generate a quite large data set, which may be difficult to analyze and interpret.
These days Object-Oriented Metrics emerged as adequate in several domains of Software Engineering [1, 5]. Various parameters in connection with the software products and processes are assessed through the use of Software Metrics. By applying these metrics to software, it becomes possible to gather numerical data that quantifiable, related to context dimensions. The ability of external elements like rely, testing and maintenance of software influence the accuracy of the resultant values of metrics [2, 7]. Metrics are then used to predict software quality [3]. In literature we can find the proposal of Object-Oriented Metrics that significant in assessing different elements of the software like cohesion, size, coupling and complexity. However, there is a little understanding of the empirical proposal intended to explain observations and usage model of metrics [4, 6, 8, 9, 10]. It is fact that neither programming official nor QA official, project manager apparent to select useful metrics. Moreover, these metrics are mostly emerged as dependent one on other [10, 11]. The information furnished by most of these metrics is sometimes found to be redundant. Sometimes when the software system itself is huge and of a complex nature, the process of collection of data regarding these metrics becomes very time consuming, and even after collection of such huge amounts of data, the next step of analyzing and interpreting the data becomes a humongous task! Hence, we need to identify and limit ourselves to a set of metrics which can provide us relevant and useful data.
In order to assess classes in Object-Oriented Systems (OOS), a new metric called the Execution Streaming Probabilities for Quality (ESPQ) is suggested through this paper. The main purpose of this metric is to collected data, in an integrated approach, regarding the testability and the maintainability of the Object-Oriented Systems rather than focusing on all possible software quality measuring parameters. By doing so, the simultaneous usage of a
ISSN: 0975-5462 194
M.V. Vijaya Saradhi et al. / International Journal of Engineering Science and Technology Vol. 2(3), 2010, 194-208
number of metrics can be avoided. Instead of just focusing on the bare static structure of the system, the metric that is being proposed can replace many of the existing Object-Oriented Metrics (OOM). The primary objective is to identify the extent to which the proposed ESPQ metric can replace some of the widely known Object-Oriented Metrics. As mentioned earlier, the purpose is not to evaluate a specific design through provision of absolute values, but by the use of more relative values.
The advantages of the metric can be included that defining and distinguishing the high-risk classes which need a comparatively greater effort of testing to ensure the quality of the software, identifying the classes which are prone to fault and assessing the effect of a modification on one class on the other classes. As is well known, the testing and maintenance phases of the SDLC can be quite expensive and critical and hence they are two important parameters which indicate the efficiency of the software. As the Object-Oriented Systems (OOS) become more and more complex, the need for a set of metrics which can be easily measured related to the quality of the software arises.
An important trait of the metric being proposed through this paper is that it is multi-dimensional. Though not directly, the metric helps to capture a number of parameters in connection with the various internal attributes of the software, including complexity as well as the interactions between the classes, otherwise called as coupling. Three of the widely used metrics are size, complexity as well as coupling and it is proven that they can be linked to the different quality attributes like fault-proneness, testability and maintainability. So, this metric is being proposed in order to consolidate various Object-Oriented Metrics (OOM) that are widely used and accepted – in fact, the metric being proposed has been used with programs based on Java as well. Various Java systems which differ not only in size and structure but also in nature and domain of application have been analyzed and the proposed metric is compared to a couple of well known Object-Oriented metrics, through the Principal Components Analysis (PCA) method.
It is observed the proposed metric encompasses to a large extent, most of the information that the other metric provide. As the correlation is now established between the proposed metric and the existing metrics, it is expected that the proposed metric can be used to assess the quality of the software in a unified manner by taking into consideration various parameters. The objective of this paper, as a subsequent step, is to establish the proposed metric as a good predictor of certain external parameters including testability and maintenance and use it for supporting various activities related to both testing and maintenance. The couple of initial experiments carried out provide results which are quite encouraging and clearly establish the correlation of the proposed metric with the attributes related to testability and changeability.
Section 2 of this paper provides a concise description of the Object-Oriented Metrics (OOM) considered for this study, while Section 3 presents the proposed metric and describes it in detail. Section 4 describes the experiments carried out; the observations made and also discuss the results documented. Section 5 furnishes the conclusions along with a couple of pointers for future exploration and experimentation.
2. OO Metrics Choosen for Empirical Analysis
A couple of metrics used to evaluate various attributes of the Object-Oriented System have been selected, including: CBO, MIC, MPC, LCOM, TCC, DIT, RFC, WMC, LOC, and NOO. This section compares these metrics with the proposed metric and highlights the validity in considering such a metric.
2.1 Coupling between Objects (CBO) refers number of classes to which a class coupled [12]. Two classes are said to be coupled when methods declared in one class use methods or instance variables defined by the other class.
2.2 Method Invocation Coupling (MIC) is defined as the relative number of classes that receive messages from a particular class. Modularity of classes is inversely proportional to coupling between those classes [16]. Reduced coupling between classes improve the modularity [17]. Low coupling between classes in OOS is tendency of current software engineering practices that facilitates the easy evolution [17]. Besides, Class coupling at higher level tends to ripple-effect (Higher changes required for version updates) that addresses the maintenance issues. The ability to analyze of a highly coupled class is difficult since analysis of the coupled classes need to be done simultaneously. Fault proneness is correlated with few of existing coupling metrics and their relationship [3].
2.3 Lack of Cohesion in Methods (LCOM) measures the dissimilarity of methods in a class [12]. Let C1 is class with methods f1, f2… fn and a set of instance variables {Ii}. Then for any method fi we can define the partitioned set and LCOM.
if P = {(Ii, Ij) | Ii ∩ Ij = φ} and Q = {(Ii, Ij) | Ii ∩ Ij ≠ φ} then LCOM = |P| - |Q|, if |P| > |Q| else LCOM=0
ISSN: 0975-5462 195

M.V. Vijaya Saradhi et al. / International Journal of Engineering Science and Technology Vol. 2(3), 2010, 194-208
Henderson-Sellers revise the LCOM metric to normalize it for the number of methods and variables that represent in the class [13]:
Where the number of methods is m and the number of instance variables (attributes) a set of {Aj} (j=1, 2… a). Let μ (Aj) be the number of methods which access each datum. With this new measure the metric is simplified and normalized.
2.4 Tight Class Cohesion (TCC): The Tight Class Cohesion metric measures the cohesion between the public methods of a class. That is the relative number of directly connected public methods in the class [14].In the scope of a class two methods are said to be connected if and only if they are using common instance of that class. Let N is number of methods in a class, NP is total possible connections and NDC is number of direct connections. The NP can be measured as follow
NP = N * (N-1) / 2
Then TCC can be measured as NDC / NP; In Object Oriented System High maintainability and reusability is proportional to cohesiveness of class components [14, 15]. The cohesion of a component allows the measurement of its structure quality can be measured by using cohesion of a class component.
2.5 Depth of Inheritance Tree (DIT): The Hierarchy from Root class to the class on which DIT measured is called Depth of Inheritance Tree that is number of ancestor classes for a class on which DIT measured [12]. Code reusability is high with inheritance.
2.6 Response for a Class (RFC): RFC is defined as the count of class methods invoked and methods directly called by these methods in response [12]. High end testing efforts required when RFC of a class is high which indicates the high level complexity.
2.7 Weighted Methods per Class (WMC): This metric is the sum of complexities of methods defined in a class [12]. It therefore represents the complexity of a class as a whole and this measure can be used to indicate the development and maintenance effort for the class. Fault proneness effectively represented by conditional complexity. Complexity and risk of faults in the class are mutually proportional [5, 18].
2.8 Lines of Code (LOC): total lines of code indicates the metric LOC. Risk factor of faults is higher in the context of high value of LOC since class with high LOC tends to complexity in maintainability, reusability and understandability to update [18]. Loc is the good predictor of maintainability [19].
2.9 Number of Operations Overriden by a Subclass (NOO): Total number of functions in a class represented by NOO [Henderson-Sellers 96]. Degree of reusability and cohesion is inversely proportional to NOO.
2.10 Message Passing Coupling (MPC): The number of method invocations in a class. Measure MPC is defined as the “number of send statements defined in a Class”.
3. Execution Streaming Probabilities for Quality (ESPQ)
Execution streaming probabilities for Quality (ESPQ) of Classes, reduced format of the call graphs is the base for proposed metric called ESPQ. In general most of the existing metrics considers only the class interactions and collaboration between them, where as the proposed metric along with class interactions and their collaboration also considers the related controls. Further, the proposed metric incorporates function call probabilities. This incorporation occurs depending on the execution flow. The ESPQ metric is used to support Object-Oriented System integration testing with value between ZERO and ONE.
3.1 Execution Flow Graphs (EFG)
Reduced form of a CFG morphs into EFG. The nodes that represent method invocation instructions will only be considered under EFG. Function F Lines of code can find at Figure 1a. Code lines that are not method calls represented by N. Function F reduced format for EFG given in figure 1b. Call graph and Execution Flow Graph derived from function F given in figure 1c and figure 1d respectively. The Execution Flow Graphs can represent structure of function calls and execution flow paths that reflects interaction between functions effectively.
ISSN: 0975-5462 196

M.V. Vijaya Saradhi et al. / International Journal of Engineering Science and Technology Vol. 2(3), 2010, 194-208
F(){ F1(); Cond?F2():F3(); Cond?N1:N2; N3; N4; While(Boolean expression) { F4; Cond?N5:N6; F5; } F6; } Figure: 1a
F(){ F1(); Cond?F2():F3(); While(Boolean expression) { F4; F5; } F6; } Figure: 1b
Figure: 1c
Figure: 1d
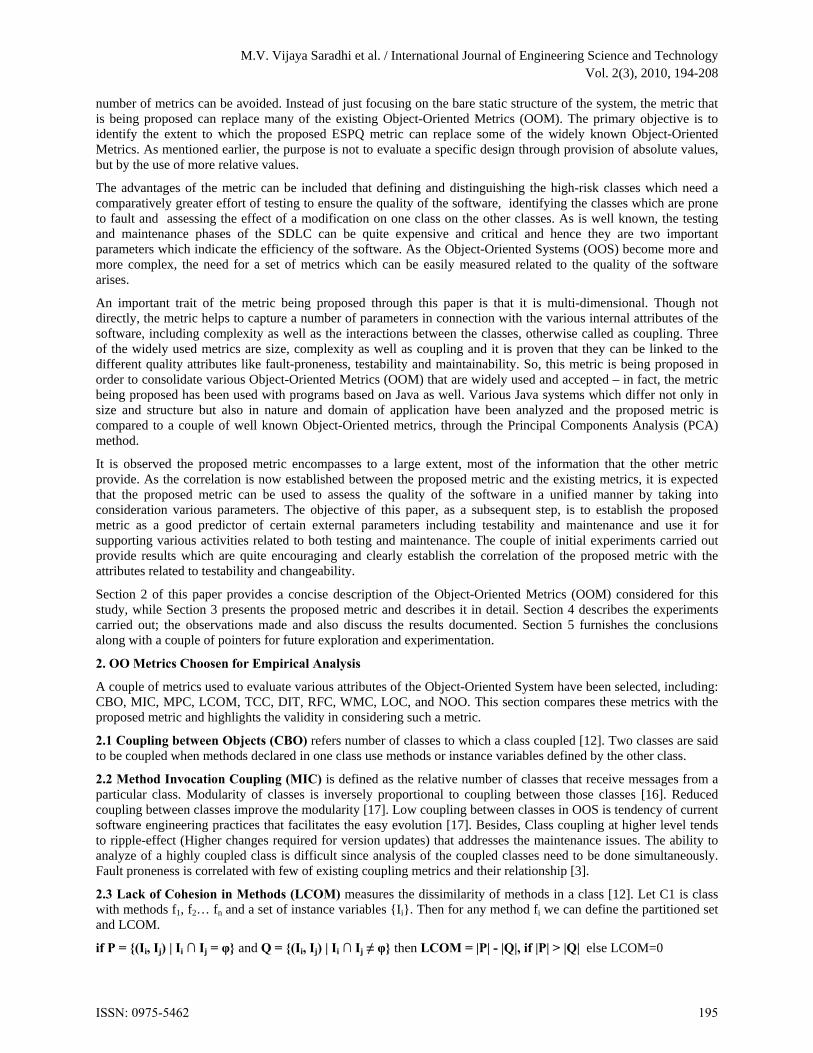
3.2 Morphing EFG under Polymorphism
Statistical analysis of code is not sufficient to capture the polymorphism. Besides, dynamic binding, which refers to the effective call of a virtual method while carrying out the execution, happens. TO mark the polymorphic call possibilities in EFG first we find the polymorphic messages in that EFG and then a polygon with one increment to n number of sides will be used to represent that polymorphic call. Here “n” is sum of overloads and overrides of polymorphic method traced in EFG. The directed arcs are being used to link the vertices of the polygon to the virtual methods that responds to the function call. Fig 1e represents the updated EFG that represents method invocation under polymorphism.
ISSN: 0975-5462 197
M.V. Vijaya Saradhi et al. / International Journal of Engineering Science and Technology Vol. 2(3), 2010, 194-208
Figure: 1e
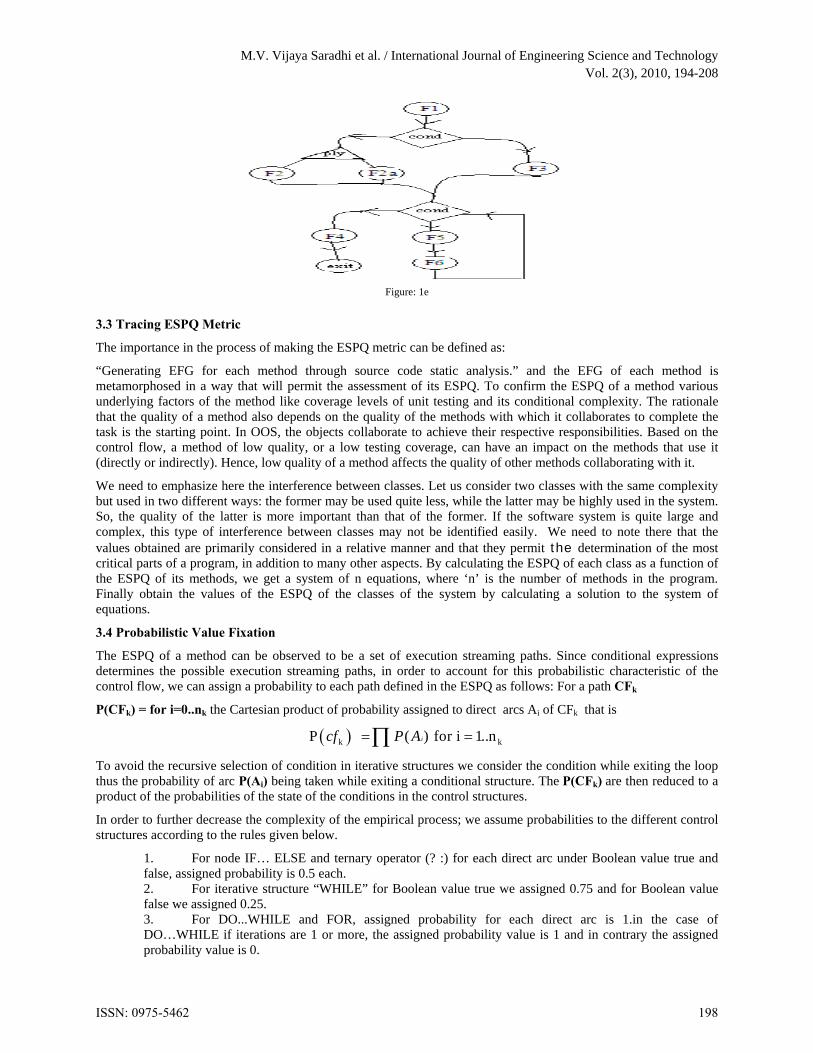
3.3 Tracing ESPQ Metric
The importance in the process of making the ESPQ metric can be defined as:
“Generating EFG for each method through source code static analysis.” and the EFG of each method is metamorphosed in a way that will permit the assessment of its ESPQ. To confirm the ESPQ of a method various underlying factors of the method like coverage levels of unit testing and its conditional complexity. The rationale that the quality of a method also depends on the quality of the methods with which it collaborates to complete the task is the starting point. In OOS, the objects collaborate to achieve their respective responsibilities. Based on the control flow, a method of low quality, or a low testing coverage, can have an impact on the methods that use it (directly or indirectly). Hence, low quality of a method affects the quality of other methods collaborating with it.
We need to emphasize here the interference between classes. Let us consider two classes with the same complexity but used in two different ways: the former may be used quite less, while the latter may be highly used in the system. So, the quality of the latter is more important than that of the former. If the software system is quite large and complex, this type of interference between classes may not be identified easily. We need to note there that the values obtained are primarily considered in a relative manner and that they permit the determination of the most critical parts of a program, in addition to many other aspects. By calculating the ESPQ of each class as a function of the ESPQ of its methods, we get a system of n equations, where ‘n’ is the number of methods in the program. Finally obtain the values of the ESPQ of the classes of the system by calculating a solution to the system of equations.
3.4 Probabilistic Value Fixation
The ESPQ of a method can be observed to be a set of execution streaming paths. Since conditional expressions determines the possible execution streaming paths, in order to account for this probabilistic characteristic of the control flow, we can assign a probability to each path defined in the ESPQ as follows: For a path CFk
P(CFk) = for i=0..nk the Cartesian product of probability assigned to direct arcs Ai of CFk that is
k kP ( ) for i 1..nicf P A
To avoid the recursive selection of condition in iterative structures we consider the condition while exiting the loop thus the probability of arc P(Ai) being taken while exiting a conditional structure. The P(CFk) are then reduced to a product of the probabilities of the state of the conditions in the control structures.
In order to further decrease the complexity of the empirical process; we assume probabilities to the different control structures according to the rules given below.
1. For node IF… ELSE and ternary operator (? :) for each direct arc under Boolean value true and false, assigned probability is 0.5 each. 2. For iterative structure “WHILE” for Boolean value true we assigned 0.75 and for Boolean value false we assigned 0.25. 3. For DO...WHILE and FOR, assigned probability for each direct arc is 1.in the case of DO…WHILE if iterations are 1 or more, the assigned probability value is 1 and in contrary the assigned probability value is 0.
ISSN: 0975-5462 198
M.V. Vijaya Saradhi et al. / International Journal of Engineering Science and Technology Vol. 2(3), 2010, 194-208
4. For branching (SWITCH…CASE) for each direct arc the assigned probability value is 1/t, where t is total branches (cases). 5. For static and dynamic binding the assigned probability for is direct arc is 1/t, where n is total overload and override count of the method. 6. For Exception Handling The assigned probability is 0.75 if direct arc connects to try block ,in contrary the assigned probability values is 0.25 if direct arc connects to catch block.
Through a tool that we developed, these values are assigned automatically during the static analysis of the source code when generating the different ESPQ models. Alternatively, according to the operational profile of the program, the probability values can also be obtained by dynamic analysis; the programmers can also assign the values based on their knowledge of the program. Dynamic analysis is not part of this study and shall consider in future.
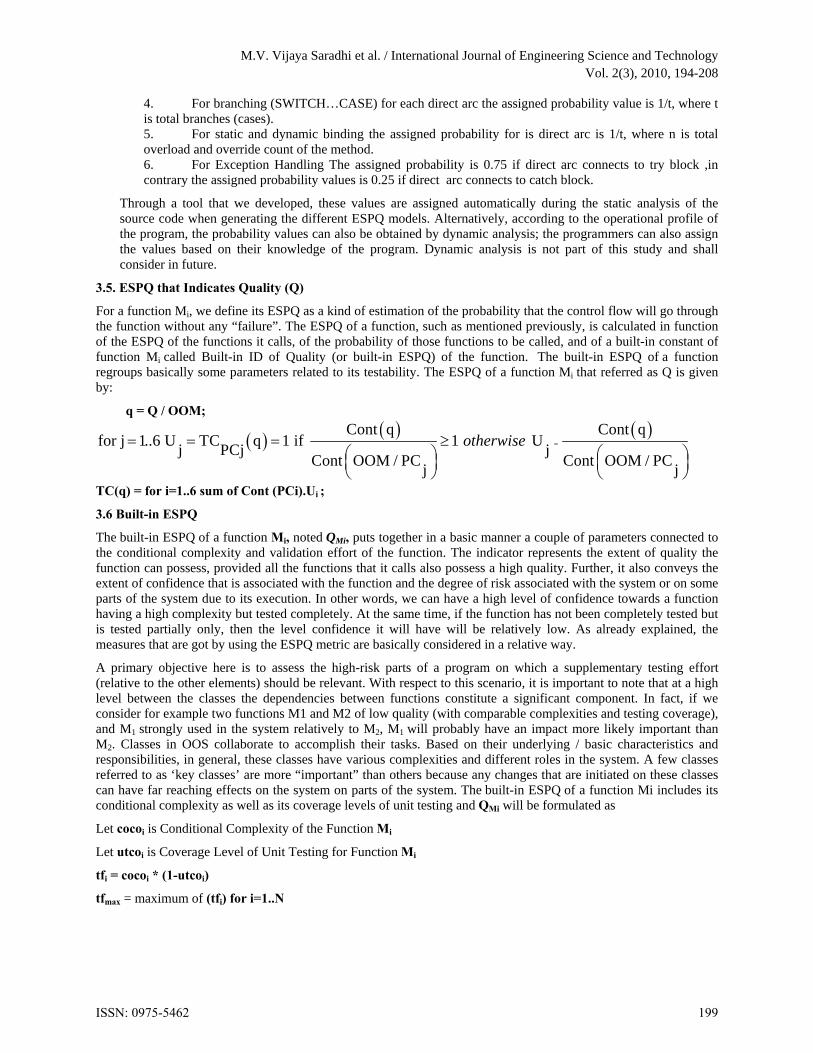
3.5. ESPQ that Indicates Quality (Q)
For a function Mi, we define its ESPQ as a kind of estimation of the probability that the control flow will go through the function without any “failure”. The ESPQ of a function, such as mentioned previously, is calculated in function of the ESPQ of the functions it calls, of the probability of those functions to be called, and of a built-in constant of function Mi called Built-in ID of Quality (or built-in ESPQ) of the function. The built-in ESPQ of a function regroups basically some parameters related to its testability. The ESPQ of a function Mi that referred as Q is given by:
q = Q / OOM;
Cont q Cont qfor j 1..6 U TC q 1 if 1 U
j PCj jCont OOM / PC Cont OOM / PC
j j
otherwise
TC(q) = for i=1..6 sum of Cont (PCi).Ui ;
3.6 Built-in ESPQ
The built-in ESPQ of a function Mi, noted QMi, puts together in a basic manner a couple of parameters connected to the conditional complexity and validation effort of the function. The indicator represents the extent of quality the function can possess, provided all the functions that it calls also possess a high quality. Further, it also conveys the extent of confidence that is associated with the function and the degree of risk associated with the system or on some parts of the system due to its execution. In other words, we can have a high level of confidence towards a function having a high complexity but tested completely. At the same time, if the function has not been completely tested but is tested partially only, then the level confidence it will have will be relatively low. As already explained, the measures that are got by using the ESPQ metric are basically considered in a relative way.
A primary objective here is to assess the high-risk parts of a program on which a supplementary testing effort (relative to the other elements) should be relevant. With respect to this scenario, it is important to note that at a high level between the classes the dependencies between functions constitute a significant component. In fact, if we consider for example two functions M1 and M2 of low quality (with comparable complexities and testing coverage), and M1 strongly used in the system relatively to M2, M1 will probably have an impact more likely important than M2. Classes in OOS collaborate to accomplish their tasks. Based on their underlying / basic characteristics and responsibilities, in general, these classes have various complexities and different roles in the system. A few classes referred to as ‘key classes’ are more “important” than others because any changes that are initiated on these classes can have far reaching effects on the system on parts of the system. The built-in ESPQ of a function Mi includes its conditional complexity as well as its coverage levels of unit testing and QMi will be formulated as
Let cocoi is Conditional Complexity of the Function Mi
Let utcoi is Coverage Level of Unit Testing for Function Mi
tfi = cocoi * (1-utcoi)
tfmax = maximum of (tfi) for i=1..N
ISSN: 0975-5462 199

M.V. Vijaya Saradhi et al. / International Journal of Engineering Science and Technology Vol. 2(3), 2010, 194-208
imax
Q(M ) 1itf
tf
The inherent risk of a program can be determined based on its complexity and conditional complexity is found to be a good indicator of fault proneness. Research indicates the presence of a clear correlation between a program’s conditional complexity and its error frequency. It is found that a low conditional complexity contributes to the program’s understandability. Another parameter that is indicated by Conditional complexity is testability. It is found that the testing effort of a program is high if the conditional complexity of the function is high. It is assumed that while a testing coverage of 1 corresponds to a completely tested function, a testing coverage of 0 corresponds to a function not tested at all. The Execution Streaming Probabilities of a function that does not call any other function is reduced to its Built-in Execution Streaming Probabilities. And hence if a function does not call any other function, and if it is fully tested, then its ESPQ value would be 1.
3.7 Formulation of the ESPQ measurement
i1
Q C (( ))n
j
j
Q M
where Mj is method of class Ci, ‘n’ represents the class size
The above formulation defined by measuring the Q for individual methods. A non linear model used to obtain the equation mentioned above and the number of methods of the program indicates its size. An iterative method like the method of successive approximations used to reduce the system to a fixed point problem. The following equation represents the multi variant polynomial model used to define the simplified formulation mentioned above.
*M
1
Q * ( )* k
n
M j M
j
Q P c Q
This equation should apply to all methods M1, M2,……… Mi………. where i<=N
‘N’ represents size of the class ‘C’. Computation should be done for n iterations to obtain an error, where error in the order of 10-5. The ESPQ of a class is defined as the product of the ESPQ of its public methods. A software tool we developed to calculate the ESPQ.
4. Empirical Analysis
The study involving the experimentation and observation for evaluating the ESPQ metric and the selected OOM is explained in this section. The process used to compile and process the metrics data for the selected systems is also explained in detail.
4.1. Approach
A custom software tool is developed and used for computing the ESPQ. The unit testing coverage is limited to 75% for each of the methods of the analyzed systems. Other values of the testing coverage have also been evaluated and the results obtained were found to be considerably similar in a relative manner. The methodology implemented for the initial series of the experiments is based on a Principal Components Analysis (PCA). The analysis is done on the ESPQ and input data set of the metrics considered for use. In the process of percentage evaluation of the information captured by ESPQ we consider 7 Java projects that are licensed as GNU open source from various domains as follows have been chosen:
1. JAVASIGN(http://javasign.sourceforge.net): 15 versions chosen
2. JFlex-a scanner generator for lexical analysis (http://jflex.de):12 versions chosen.
3. JPcap(http://jpcap.sourceforge.net): 11 versions chosen
4. JRadiousClient(http://jradius-client.sourceforge.net): 10 versions chosen
5. SOHT_javaClient(http://www.ericdaugherty.com/dev/soht): 9 versions chosen
6. GnuJSP(http://www.klomp.org/gnujsp/): v1.0.1 chosen.
7. Lucene(http://www.apache.org): v 2.0.2 chosen
ISSN: 0975-5462 200

M.V. Vijaya Saradhi et al. / International Journal of Engineering Science and Technology Vol. 2(3), 2010, 194-208
4.2. Statistics
Information related to descriptive statistics on the systems that have been analyzed is provided in Table 2. Total software models considered for analysis representing the following
Around 500000 lines of code
Approx 6000 classes and 35000 methods.
About 9.3% of classes inherit from a basic class that is not “Object class”
Table 2 provides only the latest version for the systems selected in several versions. The Inheritance presented in the set of selected systems used to evaluate the ESPQ metric in presence of inheritance. The variables that are influenced by various access-specifies like private and public in the analyzed systems allow us to evaluate how the ESPQ behave regarding the encapsulation aspect. Minimum, maximum and mean values of the selected metrics are provided in Table 1.
Application JAVASIGN JFLEX JPCAP JRadiousClient SOHT_JAVA
CLIENT GNUJSP LUCENE
WMC 1-319-21.5 0-235-25.75
0-202-26.28
1-87-22.81 0-265-15.7 o-138-13.2
0-280-20.64
LOC 3-2275-151.4
2-2539-166.19
3-872-125.12
4-481-141.2 0-1253-81.2 3-1233-95.9
3-1233-95.9
TCC 0-101-12.11 0-100-12.67
0-100-45.53
0-100-14.17 0-99-8.2 0-100-10.20
0-100-10.21
RFC 1-627-131.28
0-435-45.74
0-117-48.3
1-88-37.2 1-356-27.9 0-180-34.55
0-180-34.55
MPC 0-424-4.29 0-233-25.23
0-235-33.89
0-99-29.7 0-145-13.7 0-289-17.6
0-253-22.1
NOO 0-238-8.2 0-48-7.82
0-91-7.1 0-24-7.36 0-26-4.2 0-69-7.79 0-69-7.71
MIC 0-20-1.98 0-26-3.92
0-43-3.53
0-22-8.11 0-15-2.1 0-10-0.91 0-10-0.93
DIT 0-8-2.39 0-5-1246
0-3-1.56 0-4-1.1 0-5-1.3 0-4-1.52 0-5-1.6
LCOM 0-32248-121.4
0-674-37.56
0-3512-62.34
0-76-11.5 0-182-11.67 0-420-24.88
0-24.39-42.25
CBO 0-126-12.6 0-29-5.11
0-61-8.93
0-31-8.2 0-23-4.69 0-37-3.69 0-25-4.71
ESPQ 0.18-1-0.94 0.17-1-0.94
0.14-1-0.82
0.1-1-0.54 0.1-1-0.90 0.01-1-0.94
0.18/1/0.92
Table 1
ISSN: 0975-5462 201

M.V. Vijaya Saradhi et al. / International Journal of Engineering Science and Technology Vol. 2(3), 2010, 194-208
Figure 2: Bar Chart and Line Chart Representation of Averages from Table 1
CBO LCOM DOIH LOC ESPQ JAVASIGN 1 1 1 0.909593 0.807 JPCAP 0.805295 0.515773 0.649735 0.752936 0.723 JRADIOUSCLIENT 0.728656 0.095992 0.48189 0.873941 0.54 LUCEN 0.53107 0.348529 0.731525 0.576875 0.939 JFLEX 0.460375 0.309649 0.550353 1.0 0.943 GNU_JSP 0.332133 0.205275 0.670936 0.401349 0.819 SOHT_JAVACLIENT 0.428044 0.096141 0.621466 0.488802 0.904
Table 2
ISSN: 0975-5462 202

M.V. Vijaya Saradhi et al. / International Journal of Engineering Science and Technology Vol. 2(3), 2010, 194-208
4.3 Analysis of relations between metrics using PCA
To analyze the relation between considered metrics we use Principal Components Analysis (PCA).PCA identifies the intrinsic orthogonal dimensions that explain relations between metrics. Principal Components (PCs) are linear combinations of the standardized independent variables. While there are various applications for PCA, this paper pertains to the study and visualization of correlations between variables. PCA is based on a projection principle. It projects the observations from a space at d dimensions of the d variables to a space at d1 dimensions where d1 < d such that a maximum of information is kept on the first dimensions. “Total variance of the cloud of points” model will be measurement model to measure the information. Interpretation of the graph will be easier if graph limited to total observations of the dimensions in the range 2 to 3. To limit to 2 to 3 dimensions it is obvious that information associated to the first 2 or 3 axes should represent a sufficient percentage of the total variance of the cloud of points. As this facilitates the determination of the basic elements that furnish maximum information, it is a significant component of software measurement.
PCA uses a matrix that indicates the degree of similarity between variables to calculate the matrices that will allow projecting the variable into a new space. It is common to use as a similitude indicator the Pearson correlation. Once the PCA stage is completed, the next step will be to compute the global contribution of each metric on the first components representing 95% of the information furnished. ESPQ will be used to calculate the percentage of capture of the information provided by each metric, which will help us ascertain the extent to which ESPQ can be used to replace the widely used metrics.
ISSN: 0975-5462 203

M.V. Vijaya Saradhi et al. / International Journal of Engineering Science and Technology Vol. 2(3), 2010, 194-208
Figure 3: inclination of the metrics considered
A couple of the selected OOM along with the ESPQ are indicated in Figure 3 and the observations made from the first results are as follows:
The highest coupling values (CBO) are observed for JAVASIGN, JPCAP and JRADIOUSCLIENT with respectively 12.6, 8.93 and 8.11. The rest of the analyzed systems present average values lower than 6.0. Coupling is, therefore, low for GNU_JSP and SOHT_JAVACLIENT with respectively 3.69 and 4.69.
High values of cohesion (low LCOM) are observed for JRADIOUSCLIENT and SOHT_JAVACLIENT with 11.5 and 11.67 respectively. The lowest cohesion is observed in JAVASIGN with 121.4 and JPCAP with 62.34.
The average size of the compilation units vary between 81.2 lines of code for SOHT_JAVACLIENT and JFLEX with 166.19 as LOC.
The use of inheritance is more present in JAVASIGN with an average value of 2.264. However, it is almost equal for the other programs, where the lowest value is found in JRADIOUSCLIENT with 1.1.
For ESPQ, the mean values are observed between 0.54 for JRADIOUSCLIENT and 0.94 for JFLEX
In order to ensure at least 95% of the information captured by the metrics, which is largely sufficient, the first 6 principal components are retained. The distribution of information on the first components is uniform enough for the different projects and is more concentrated on the first components for GNU_JSP. So, the information provided below ignores the other components.
When a PCA is performed on the same data set without ESPQ, a decrease in the variability of the first components is observed. This implies that the execution streaming probabilities not only capture the information provided by several metrics, but also bring in additional information. So, it is better to center the information on the first component. The percentage of the informational data of the first Principal Component (PC1) before and after the integration of the Execution Streaming Probabilities in the analysis is furnished in Table 3 and Table 4.
ISSN: 0975-5462 204

M.V. Vijaya Saradhi et al. / International Journal of Engineering Science and Technology Vol. 2(3), 2010, 194-208
Table 3: without ESPQ JAVASIGN 44657
JPCAP 54841
JRADIOUSCLIENT 59710
SOHT_JAVACLIENT 47614
LUCENE 58353
JFLEX 52833
GNU_JSP 64768
Table 4: with ESPQ JAVASIGN 46631
JPCAP 54966
JRADIOUSCLIENT 61129
SOHT_JAVACLIENT 50504
LUCENE 59516
JFLEX 52854
GNU_JSP 66856
PriComp1 PriComp2 PriComp3 priComp4 PriComp5 PriComp6 CBO 10.299 6.301 6.890 4.251 5.681 10.201 DIT 0.027 44.601 8.651 17.480 3.333 6.362 ESPQ 10.020 1.339 1.969 5.336 7.557 10.200 LCOM 6.569 4.958 9.645 15.421 26.939 16.330 LOC 13.741 1.689 2.732 4.914 8.543 6.039 MIC 5.659 4.491 8.492 9.050 19.729 21.455 MPC 14.356 0.712 3.211 1.643 2.246 5.889 NOO 11.911 5.234 5.511 1.117 10.861 9.773 RFC 14.351 0.711 3.204 1.641 2.243 5.875 TCC 0.020 7.401 49.222 34.831 2.941 0.565 WMC 13.976 4.382 0.626 3.171 6.221 5.758
Table 5: Statistical Mean Values of the Metrics for 6 different Principle Components
4.4 Involvement of the Metrics
PCA gives the contribution of each metric on the obtained components. As mentioned earlier, to confirm that at least 95% of the information is captured by the metrics and to also give adequate focus for the first components, we need to list out all the metrics captured by the ESPQ and also indicate the extent to which each of them is captured in terms of percentage.
The extent of information (mean value for the selected systems) provided by each metric on the Principle Components is furnished by Table 5. For each Principle Component, it is possible to quantify the amount of information provided by the execution stream probabilities ESPQ vis-à-vis the other metrics and each PC can be associated to a quality attribute as follows:
PriComp1 can be associated to size as it mainly regroups the size metrics including LOC and RFC. In addition, other metrics like MPC (a coupling metric) and WMC (a complexity metric) also have correlation with LOC and RFC and have a significant contribution
DIT is the only metric giving a constant contribution to the informational data, even if certain other metrics (in some projects) have a significant gain. It is the case for RFC for projects SOHT_JAVACLIENT, JAVASIGN, JFLEX and for TCC for project GNU_JSP. We then associate PriComp2 to inheritance
PriComp3 regroups a large quantity of information from the TCC metric, which is a cohesion metric and details are fallowing
o JRADIOUSCLIENT 86.6% o SOHT_JAVACLIENT 25.6% o LUCENE 91.26% o JPCAP 43.17% o JFLEX 91.46%
ISSN: 0975-5462 205
M.V. Vijaya Saradhi et al. / International Journal of Engineering Science and Technology Vol. 2(3), 2010, 194-208
In projects GNU_JSP and JAVASIGN, LCOM represents the highest scores, respectively 27.90% and 24.51%. We then associate PriCom3 to cohesion
PriComp4 associates a cohesion metric (TCC) and an inheritance metric (DIT). Moreover, in this component, coupling per invocation metric brings information in some cases. We then do not associate this component to any attribute. However, it remains highly tainted with cohesion
Due to the irregular contributions of the different metrics in their composition, it is not simple to explain PriCom5 and PriCom6
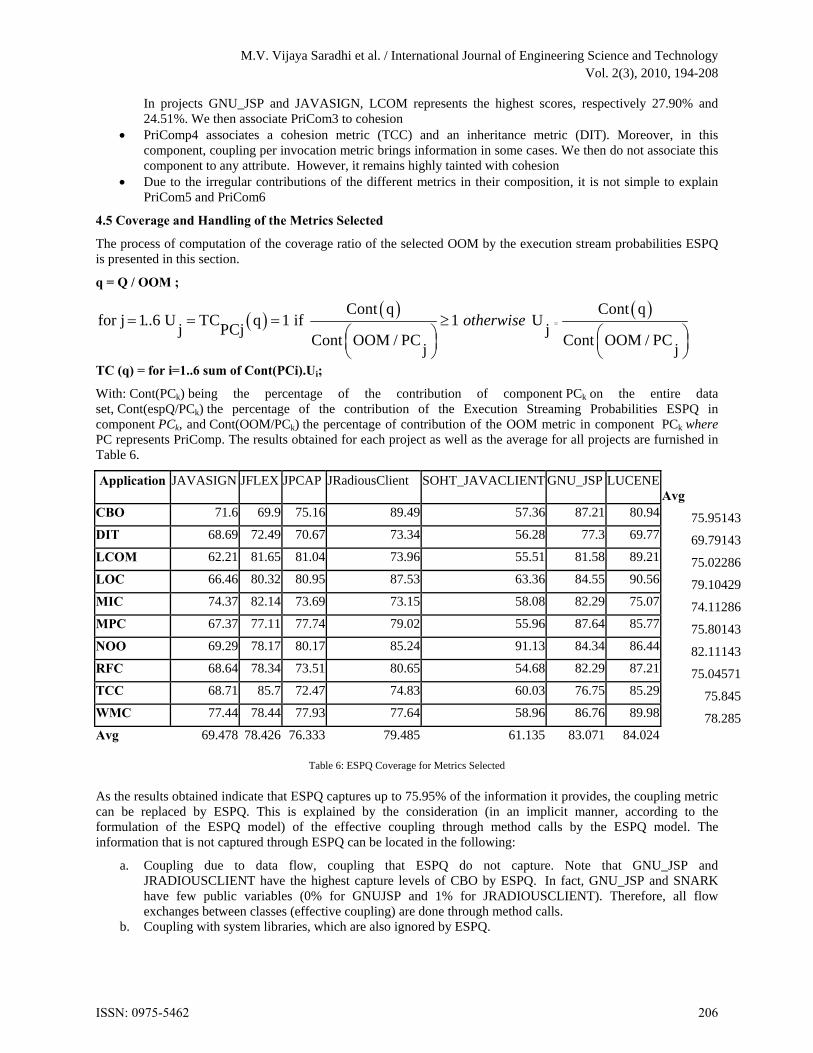
4.5 Coverage and Handling of the Metrics Selected
The process of computation of the coverage ratio of the selected OOM by the execution stream probabilities ESPQ is presented in this section.
q = Q / OOM ;
Cont q Cont qfor j 1..6 U TC q 1 if 1 U
j PCj jCont OOM / PC Cont OOM / PC
j j
otherwise
TC (q) = for i=1..6 sum of Cont(PCi).Ui;
With: Cont(PCk) being the percentage of the contribution of component PCk on the entire data set, Cont(espQ/PCk) the percentage of the contribution of the Execution Streaming Probabilities ESPQ in component PCk, and Cont(OOM/PCk) the percentage of contribution of the OOM metric in component PCk where PC represents PriComp. The results obtained for each project as well as the average for all projects are furnished in Table 6.
Application JAVASIGN JFLEX JPCAP JRadiousClient SOHT_JAVACLIENT GNU_JSP LUCENEAvg
CBO 71.6 69.9 75.16 89.49 57.36 87.21 80.94 75.95143DIT 68.69 72.49 70.67 73.34 56.28 77.3 69.77 69.79143LCOM 62.21 81.65 81.04 73.96 55.51 81.58 89.21 75.02286LOC 66.46 80.32 80.95 87.53 63.36 84.55 90.56 79.10429MIC 74.37 82.14 73.69 73.15 58.08 82.29 75.07 74.11286MPC 67.37 77.11 77.74 79.02 55.96 87.64 85.77 75.80143NOO 69.29 78.17 80.17 85.24 91.13 84.34 86.44 82.11143RFC 68.64 78.34 73.51 80.65 54.68 82.29 87.21 75.04571TCC 68.71 85.7 72.47 74.83 60.03 76.75 85.29 75.845WMC 77.44 78.44 77.93 77.64 58.96 86.76 89.98 78.285Avg 69.478 78.426 76.333 79.485 61.135 83.071 84.024
Table 6: ESPQ Coverage for Metrics Selected
As the results obtained indicate that ESPQ captures up to 75.95% of the information it provides, the coupling metric can be replaced by ESPQ. This is explained by the consideration (in an implicit manner, according to the formulation of the ESPQ model) of the effective coupling through method calls by the ESPQ model. The information that is not captured through ESPQ can be located in the following:
a. Coupling due to data flow, coupling that ESPQ do not capture. Note that GNU_JSP and JRADIOUSCLIENT have the highest capture levels of CBO by ESPQ. In fact, GNU_JSP and SNARK have few public variables (0% for GNUJSP and 1% for JRADIOUSCLIENT). Therefore, all flow exchanges between classes (effective coupling) are done through method calls.
b. Coupling with system libraries, which are also ignored by ESPQ.
ISSN: 0975-5462 206

M.V. Vijaya Saradhi et al. / International Journal of Engineering Science and Technology Vol. 2(3), 2010, 194-208
DIT metric is partially captured (69.8%) by ESPQ. However, we mentioned previously that ESPQ becomes sensitive to DIT solely when the inheritance is present in the project. The results obtained indicate we can use ESPQ instead of DIT to detect the effects of a very complex inheritance mechanism in a project.
ESPQ does not have a direct relation to cohesion in terms of LCOM. However, ESPQ captures this metric to a large extent, as much as 75.01% and this can be ascribed to the interactions between the methods that ESPQ captures, in addition to the indirect use of a coupling metric. As it is known that a low cohesion leads to a high coupling, ESPQ obviously as to decrease.
ESPQ captures almost 79.02% of this metric and this is explained by the fact that the size of a system changes the same way the complexity does and also the way some of the other metrics do.
WMC metric is captured by the ESPQ to an extent of 78.11%, which is due to the fact that it is present in the Execution Streaming Probabilities model through the Intrinsic Execution Streaming Probabilities of the methods. The rest of the information on complexity constitutes the arcs of the graph that do not lead to method calls and hence is not taken into consideration by the current model proposed.
It is observed that the higher coverage values of ESPQ are for the projects Gnujsp, JRADIOUSCLIENT and Lucene, with respectively 82.6, 79.48 and 84.1. This is explained by the fact that the percentage of public variables is low in these projects, which implies that the control flow is more significant than the data flow in these projects.
5. Conclusions
This paper presents an innovative model which can be used to evaluate various attributes of OOS. The model, called Execution Streaming Probabilities (ESPQ), uses control flow paths and probabilities, and captures the collaboration between classes. Several Java projects have been used for carrying out experiments and observations were made through a large data set. Using the Principal Component Analysis, the new model has been compared with various widely used OOM, which are grouped into five categories, namely: coupling, cohesion, inheritance, complexity and size.
The results documented through the study indicate that the proposed model captures more than 75% of the information provided by the selected metrics: CBO, MIC, LCOM, TCC, DIT, RFC, WMC, LOC and NOM, NOO. While some of these metric are captured directly, other metrics like the WMC, NOM and CBO are captured indirectly in the proposed model. It is also observed that the proposed ESPQ capture DIT only when the inheritance is significant in the analyzed system. Further, it is noted that in order to make sense of the results obtained through the proposed model and to draw meaningful conclusions, it is essential to encapsulate the data, which is a preferred attribute of a majority of the OOS.
The main advantage of this new model being proposed is that it unifies the various OOS attributes and helps to capture much more than the simple static structure of a system. In order to ensure application of this model in a more generalized manner, we need to replicate this study on other large projects in addition to assessing the validity of the model for predicting the testability, fault proneness and maintainability. The results obtained as of now clearly support such feasibility and hence the aim of this paper is to propose the use of this new model with respect to various tasks connected with the testing and maintenance of OOS.
References
[1] Predicting Software Metrics at Design Time, Lecture Notes in Computer Science, Springer Berlin / Heidelberg, DOI 10.1007/978-3-540-69566-0, June-2008
[2] Should we try to measure software quality attributes directly?, Software Quality Journal, Springer Netherlands, Volume 17, Number / June-2009, 10.1007/s11219-008-9071-6
[3] Software Metrics Data Clustering for Quality Prediction, Springer Berlin / Heidelberg, Volume 4114/2006, 10.1007/11816171, September, 2006
[4] An Empirical Assessment of function point-like Object-Oriented Metrics, Del Bianco, V.; Lavazza, L., Software Metrics, 2005. 11th IEEE International Symposium, Sept. 2005
[5] A Validation of Object-Oriented Design Metrics as Quality Indicators, IEEE Transactions on Software Engineering Volume 22, Issue 10 (October 1996)
[6] Journal of Systems and Software, n.fenton, Volume 47, Issues 2-3, 1 July 1999. [7] Software Technological roles, usability, and reusability, Burgin, M.; Lee, H.K.; Debnath, N., Information Reuse and Integration, 2004. IRI
2004. Proceedings of the 2004 IEEE International Conference on Volume, Issue, 8-10 Nov. 2004 [8] Hakim Lounis, Lynda Ait-Mehedine, "Machine-Learning Techniques for Software Product Quality Assessment," qsic, pp.102-109, Quality
Software, Fourth International Conference on (QSIC'04), 2004 [9] Using a Combination of Measurement Tools to Extract Metrics from Open Source Projects, N.S.A.A. Bakar and C. Boughton (Australia),
Acta press, Software Engineering and Applications – 2008
ISSN: 0975-5462 207

M.V. Vijaya Saradhi et al. / International Journal of Engineering Science and Technology Vol. 2(3), 2010, 194-208
[10] Empirical Study of Object-Oriented Metrics, Published by ETH Zurich, Chair of Software Engineering JOT, 2006 [11] An Empirical Study on Object-Oriented Metrics, Mei-Huei Tang Ming-Hung Kao Mei-Hwa Chen, Digital Object Identifier:
10.1109/METRIC.1999.809745 [12] A Metrics Suite for Object-Oriented Design, Chidamber, S.R.; Kemerer, C.F., Software Engineering, IEEE Transactions on Volume 20,
Issue 6, Jun 1994 [13] Henderson-Sellers, B., Object-Oriented Metrics: measures of complexity, Prentice-Hall, , 1996. [14] Cohesion and Reuse in an Object-Oriented System, J.M. Bieman, B.K. Kang, Proceedings of the ACM Symposium on Software
Reusability,1995. [15] Object-Oriented Metrics that Predict Maintainability”, S. Henry and W. Li Journal of Systems and Software, vol. 23, 1993
[16] Using Coupling Measurement for Impact Analysis in Object-Oriented Systems, H. Lounis, L.C. Briand and J. Wust, ICSM Aug./Sept. 1999.
M.V.Vijaya Saradhi is Currently Associated Professor in the Department of Computer Science and Engineering (CSE) at Aurora's Scientific, Technological and Research Academy, (ASTRA), Bandlaguda, Hyderabad, India, where he teaches Several Courses in the area of Computer Science. He is Currently Pursuing the PhD degree in Computer Science at Osmania University, Faculty of Engineering, Hyderabad, India. His main research interests are Software Metrics, Distributed Systems, Object-Oriented Modeling (UML), Object-Oriented Software Engineering, Data Mining, Design Patterns, Object- Oriented Design Measurements and Empirical Software Engineering. He is a life member of various professional bodies like MIETE, MCSI, MIE, MISTE. E-mail: [email protected]
Dr. B. R. Sastry is currently working as Director, Astra, Hyderabad, India. He earlier worked for 12 years in Industry that developed indigenous computer systems in India. His areas of research includes Computer Architecture, Network Security, Software Engineering, Data Mining and Natural Language Processing, He is currently concentrating on improving academic standards and imparting quality engineering
ISSN: 0975-5462 208