
espm 111 Energy - Rausser College of Natural Resources
25
2/11/2013 1 ESPM 111 Ecosystem Ecology ENERGY & ECOSYSYEM ECOLOGY Dennis Baldocchi ESPM University of California, Berkeley 2/11/2013 Overview • Concepts and Units of Work and Energy • Solar Energy – How Much, When and Where • Net Radiation Balance – shortwave and longwave energy • Energy Partitioning – Sensible and Latent Heat Exchange • Radiation Transfer through Vegetation ESPM 111 Ecosystem Ecology
Transcript of espm 111 Energy - Rausser College of Natural Resources

2/11/2013
1
ESPM 111 Ecosystem Ecology
ENERGY & ECOSYSYEM ECOLOGY
Dennis BaldocchiESPM
University of California, Berkeley
2/11/2013
Overview
• Concepts and Units of Work and Energy
• Solar Energy– How Much, When and Where
• Net Radiation Balance– shortwave and longwave energy
• Energy Partitioning– Sensible and Latent Heat Exchange
• Radiation Transfer through Vegetation
ESPM 111 Ecosystem Ecology

2/11/2013
2
ESPM 111 Ecosystem Ecology
‘Our bodies are stardust;Our lives are sunlight’
Oliver Morton, 2008 Eating the Sun: How Plants Power the Planet
ESPM 111 Ecosystem EcologyZhu et al. 2010 Ann Rev Plant Biol
Eating the Sun: Converting Solar Energy to Biomass on an Ideal Summer DayNot the Annual Efficiency

2/11/2013
3
• 8 Photons per CO2 molecule fixed
• 4 e- released with each water molecule that is split
• 496 kJ/mole CO2, Energetics of photosynthesis– 4 e- times 125 kJ mole e-
• 13%, Maximum Efficiency of sunlight to stored carbon
• 9%, Ideal photosynthetic efficiency– Considering photorespiration and leaf absorptance
• 2%, Typical Maximum Efficiency Observed in the field
• Potential Gross Primary Productivity using Annual Average Sunlight– 12 g/mole C * 0.02 mol C/mole quanta * Rg/2 *4.6 (mole quanta
m-2 )– 12 * 0.02 * 161/2 * 4.6e-6 * 12*3600*365=1401 gC m-2 y-1
ESPM 111 Ecosystem Ecology
Theoretical and Potential Photosynthetic Efficiencies
ESPM 111 Ecosystem EcologyBurgin et al 2011 Frontiers Ecology
2/11/2013
4
ESPM 111 Ecosystem Ecology
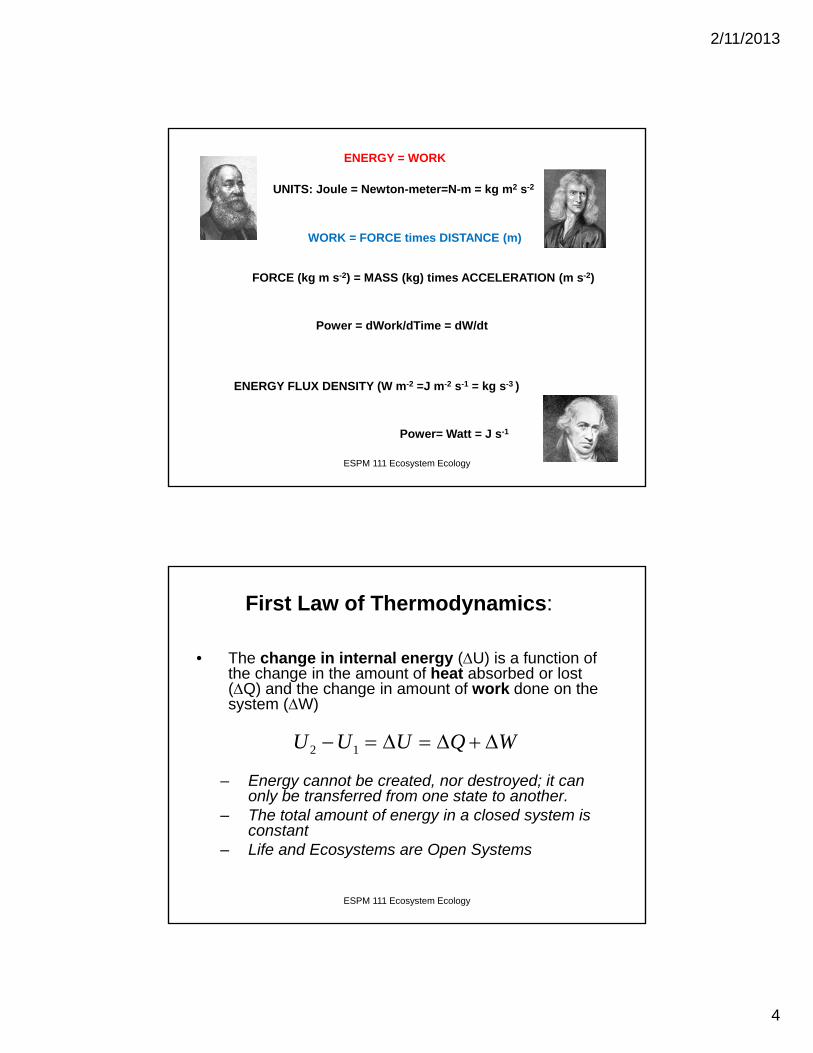
ENERGY = WORK
WORK = FORCE times DISTANCE (m)
ENERGY FLUX DENSITY (W m-2 =J m-2 s-1 = kg s-3 )
FORCE (kg m s-2) = MASS (kg) times ACCELERATION (m s-2)
UNITS: Joule = Newton-meter=N-m = kg m2 s-2
Power= Watt = J s-1
Power = dWork/dTime = dW/dt
ESPM 111 Ecosystem Ecology
First Law of Thermodynamics:
• The change in internal energy (U) is a function of the change in the amount of heat absorbed or lost (Q) and the change in amount of work done on the system (W)
– Energy cannot be created, nor destroyed; it can only be transferred from one state to another.
– The total amount of energy in a closed system is constant
– Life and Ecosystems are Open Systems
U U U Q W2 1

2/11/2013
5
ESPM 111 Ecosystem Ecology
Allen and Martin, 2007 Nature
Light (‘Hill’) Z Reactions:PS II and Ps I
680 nm
700 nm
• Light Energy (400 to 700 nm) is absorbed by pigments
• This energy splits water and releases 4 electrons, e-
• These Electrons produce biochemical energy compounds, ATP and NADPH
• Photosystem II uses 680 nm energy to generate ATP (non-cyclic electron transport)
• PS I uses 700 nm solar energy to generate NADPH (cyclic electron transport).
• 8 Photons per CO2 molecule are fixed
• Excess energy is lost as heat or fluorescence.
Solar Energy Produces Chemical Energy Used by Life
ESPM 111 Ecosystem Ecology
Energy from Redox, e.g. Microbial Battery
Reduction, Gain of Electrons (GER)Oxidant + e- ==> Product
Oxidation, Loss of Electrons, (LEO)Reductant ==> Product + e-
Oxidizing agent is Reduced and gains Electrons, so it is also the Electron Acceptor, e.g. O2 and SO4--
A Reducing agent is Oxidized and looses Electrons, so it is also the Electron Donor, e.g. (CH2O)n
OIL (Oxidation is Loss) RIG (Reduction is Gain)

2/11/2013
6
ESPM 111 Ecosystem Ecology
CH2O => C4+ + 4 e- + H2O
CarboHydrate is an electron donor
Aerobic Respiration of CarboHydrates Produce Energy for Life
Oxygen is an electron acceptor
O2 + 4e- + 4H+ => H2O + energy
Change in Gibbs free Energy, G = -125 kJ mole-1 e-
ESPM 111 Ecosystem Ecology
Nerst Equation
Computes Redox Cell Potential
0
[ ]ln
[ tan ]i
RT oxidantE E
nF reduc t
(voltage, or Electromotive Force)
G = (Ei-E0) n F
Gibbs Free Energy, G
n is charge numberF is Faraday constant, 96.84 kJ per volt gram equivalent

2/11/2013
7
ESPM 111 Ecosystem Ecology
ESPM 111 Ecosystem Ecology
Reductions Pe0
(Water@pH=7) = log(K)
Eh(mv) =RT ln K/nF
G = Eh nFkJ/e-
A ¼ O2 + H+ + e- = ½ H20 13.75 809 78B 1/5 NO3- + 6/5 H+ + e- = 1/10 N2 + 3/5
H2O12.65 744 72
CD 1/8NO3- + 5/4 H+ + e- = 1/8 NH4+ + 3/8
H2O6.15 362 35
EF ½ CH2O + H+ + e- = ½ CH3OH -3.01 -177 -17G 1/8 SO4
-- + 9/8 H+ + e- = 1/8 HS- + ½ H2O
-3.75 -221 -21
H 1/8 CO2 + H+ + e- = 1/8 CH4 + ¼ H2O -4.13 -243 -23J 1/6 N2 + 4/3 H+ + e- = 1/3 NH4
+ -4.68 -275 -26.7
Oxidation Pe0 (Water @ pH=7) = -log(K)
L ¼ CH2O + ¼ H2O = ¼ CO2 + H+ + e- -8.20 -482 -46.7L1 ½ HCOO- = ½ CO2 + ½ H+ + e- -8.73 -513 -49.7L2 ½ CH2O + ½ H2O = ½ HCOO- + 3/2 H+ +
e-
-7.68 -452 -43.8
L3L4 ½ CH4 + ½ H2O = ½ CH3OH + H+ + e- 2.88 169 16.4M 1/8 HS- + ½ H2O = 1/8 SO4
-- + 9/8 H+ + e-
-3.75 -221 -21.4
NO 1/8 NH4+ + 3/8 H2O => 1/8 NO-3 + 5/4 H+
+ e-6.15 -362 35
P
Derived from Strumm and Morgan
Redox Equations for Life

2/11/2013
8
ESPM 111 Ecosystem Ecology
E(red)-E(ox) G kJ e- eq-1 Energy, kJ
Aerobic respiration A + L -(78 - -47) -125 3000 kJ/mole C6H12O6
Denitrification B + L -(72 - -47) -119 2856 kJ/ mole C6H12O6
Nitrate reduction D + L -(35 - -47) -82
Fermentation F + L -(-17 - -47) -30 240 kJ/mole C6H12O6
Sulfate reduction G + L -(-21 - -47) -25
Methane fermentation H + L -(-23 - -47) -24 576 kJ/ mole C6H12O6
N fixation J + L -(-27 - -47) -20
Sulfide oxidation A + M -(78 - -21) -100
Nitrification A + O -(78 – 35) -43 344 kJ/mole NH4
+
Energy Yields from CarboHydrates
ESPM 111 Ecosystem Ecology
Solar Facts
• Solar Constant: 1366 W m-2
• Solar Radiative Temperature: 5770 K

2/11/2013
9
ESPM 111 Ecosystem Ecology
http://www.globalwarmingart.com/images/4/4c/Solar_Spectrum.png
ESPM 111 Ecosystem Ecology
Planck’s Law
k is the Boltzmann constant, 1.381 10-23 J molecule-1 K-1
h is Planck's constant, 6.626 10-34 J s
c is speed of light, 2.99972 * 108 m s-1
(m)
0.1 1
E(
,T)
0
2e+13
4e+13
6e+13
8e+13
1e+14
Tsun = 5770KFaint Sun (70% of contemporary), T=5213 K)1)(exp(
2),(
),(
5
2*
kThc
hcTE
d
TdE

2/11/2013
10
ESPM 111 Ecosystem Ecology
Distribution of Solar Energy by Waveband:Color is a function of the Black Body Temperature
Monteith and Unsworth
Waveband (nm) Energy %
0-300 1.2
300-400, ultra-violet 7.8 SUNBURN
400-700, visible/PAR 39.8 PHOTOSYNTHESIS
700-1500, near infrared
38.8 SUNSTROKE/OVERHEATING
1500 to infinity 12.4 Heat Emission
ESPM 111 Ecosystem Ecology
L TkA 4
LONGWAVE ENERGY EMISSION is a Function of Temperature to the 4th power
is the Stefan-Bolztmann constant, 5.67 10-8 W m-2 K-4.
4),( TLdTE
Area under the Curve of Planck’s Law
is emissivity, 0 to 1; for leaves

2/11/2013
11
ESPM 111 Ecosystem Ecology
(m)
0.1 1 10 100
E(
,T)
1e+3
1e+4
1e+5
1e+6
1e+7
1e+8
1e+9
1e+10
1e+11
1e+12
1e+13
1e+14
1e+15
T=5770 K
T=298 K
Solar shortwave energy
Terrestrial Longwave energy
WaveLength
Comparative Energy Spectra:Note Magnitude and Wavelength
ESPM 111 Ecosystem Ecology
Grassland 2001
Day
0 50 100 150 200 250 300 350
Ra
dia
tio
n F
lux
De
ns
ity
(MJ
m-2
d-1
)
0
10
20
30
40
Amount of Radiation Available to an Ecosystem, in California:Sets Upper Limit for Utilizing Biofuels for Energy
6474 MJ m-2 year-1

2/11/2013
12
ESPM 111 Ecosystem Ecology
The radiation normal to a surface is a function of the projection of area normal to incident rays on a flat surface:
Lambert’s Cosine Law
Zenith Angle
Elevation angle
FLUXNET database
Latitude
0 10 20 30 40 50 60 70 80 90
Rg
(MJ
m-2
y-1
)
0
2000
4000
6000
8000
Energy Drives Metabolism:How Much Energy is Available and Where
Solar Radiation Decreases with increaseing Latitude, except near the Tropics due to Clouds

2/11/2013
13
ESPM 111 Ecosystem Ecology
R R L Ln g B A( )1
R R L Tn g s B ( )1 4
• Net Radiation is comprised of the balance between incoming and outgoing Solar (shortwave) and Terrestrial (Longwave) Radiation
ESPM 111 Ecosystem Ecology
FLUXNET database
Latitude
0 10 20 30 40 50 60 70 80 90
Rn
(M
J m
-2 y
-1)
0
1000
2000
3000
4000
5000
Net Radiation Budgets across the Globe:Affected by Vegetation, Albedo, Surface and Air Temperature

2/11/2013
14
ESPM 111 Ecosystem Ecology
( ) ( ) ( ) 1
Absorption + Reflectance + Transmission = 1
What Happens to Photons Hitting a Leaf?
Transmittance
Reflectance
Incidence
Absorptance
ESPM 111 Ecosystem Ecology
Blue oak leaf
Wavelength, nm
500 1000 1500 2000 2500 3000
Re
flect
an
ce
0.0
0.2
0.4
0.6
0.8
Leaf Reflectance Spectrum, shortwave energy

2/11/2013
15
2/11/2013 ESPM 129 Biometeorology 29
Reflectance spectra of an annual grassland
Data collected by M. Falk, Ma, Baldocchi
ESPM 111 Ecosystem Ecology
Planetary ALBEDO
Earth ~ 30%

2/11/2013
16
ESPM 111 Ecosystem Ecology
GLOBAL ALBEDO
ESPM 111 Ecosystem Ecology
The Real ‘ALBEDO’
Wavelength (nm)
300 400 500 600 700 800 900 1000
Re
flect
ance
0.0
0.2
0.4
0.6
0.8
1.0
His Spectral Reflectance

2/11/2013
17
ESPM 111 Ecosystem Ecology
Vegetation Albedo differs with Canopy Structure
Orick, CA
Dark, Old Growth Redwoods and Brighter Logged and Regrowth Patches
ESPM 111 Ecosystem Ecology
Ogunjemiyo et al., 2005
Tall, Rough, Forests Trap more Sunlight:Douglas fir Forest, Pacific Northwest

2/11/2013
18
Albedo varies with canopy Nutrition
ESPM 111 Ecosystem EcologyOllinger et al. 2008 PNAS
ESPM 111 Ecosystem Ecology
Snow Reflectance Differs with the Presence and Absence of Trees
Notice the dark spots from the interception of light by the boreal forest, even though the landscape is covered with snow, a larger scale example of the one demonstrated in the previous figure
http://modland.nascom.nasa.gov/gallery/?JamesBay.A2000055.1645.1110x840.jpg

2/11/2013
19
ESPM 111 Ecosystem Ecology
R H E G S Pn s
• Net Radiation is partitioned into– Sensible Heat Exchange (H)
– Latent Heat Exchange (E)
– Soil Heat Exchange (G)
– Heat Storage in the Air and Vegetation (S)
– Photosynthesis (Ps)
Units: J m-2 s-1 = W m-2
Radiation Budget
ESPM 111 Ecosystem Ecology
BorealForest
PBL3000 m
PBL 1500 m
25 m
S = 0.03 R nG = 0.02 R n
S = 0.07 R nG = 0.03 Rn
10 m
LE = 0.65 R n
H = 0.3 R n
LE = 0.25 R n
H = 0.65 Rn = 0.10 R g Rn = 0.87 R g
= 0.10 R g Rn = 0.87 R g
Temperate Forest
Comparative Energy Fluxes

2/11/2013
20
ESPM 111 Ecosystem Ecology
Light transmission through a forest canopy
Sunlight passing through gaps comes from the sun and from the sky. Leaves intercept, absorb, reflect and transmit light. This causes complementary radiation
Pt. Reyes National Seashore, Allomere Falls trail, August 2002
ESPM 111 Ecosystem Ecology
Patterns of Sunflecks, Umbra and Penumbra
Gap Fraction, Probability of Beam Penetration, P0

2/11/2013
21
ESPM 111 Ecosystem Ecology
Sun Angles and the probability of beam penetration, P0
leaf area index
0 1 2 3 4 5 6
P0(L
)
0.0
0.1
0.2
0.3
0.4
0.5
0.6
0.7
0.8
0.9
1.0
90o
30o
45o
600
spherical distribution, G=0.5
PLG LG
sun sun0 exp(
cos) exp(
sin)
L: Leaf area IndexG: direction cosine, leaf normal vs solar zenith angle
Beer’s Law
(-kL)=P0 exp
ESPM 111 Ecosystem Ecology
Probability of beam penetration with clumped and randomly distributed foliage
leaf area index
0 1 2 3 4 5 6
P0(L
)
0.0
0.1
0.2
0.3
0.4
0.5
0.6
0.7
0.8
0.9
1.0
random distribution
clumped distribution
spherical distribution, G=0.5, =45o
)sin
G L(-exp=P0
, clumping coef
(-kL)=P0 exp
Beer’s Law

2/11/2013
22
ESPM 111 Ecosystem Ecology
Points To Ponder
• How much Energy is Available to a square meter of soil over a Year?
• How does this integrate over the area of the State or Nation?
• How does this number compare with the Energy we use to travel, heat our homes, produce our food and fiber and support our recreation?
• Change Land Use Change, with a change in Albedo, function as a way to offset Global Warming?
ESPM 111 Ecosystem Ecology

2/11/2013
23
ESPM 111 Ecosystem Ecology
How Does Energy Availability Compare with Energy Use?
• US Energy Use: 105 EJ/year– 1018J per EJ– 3.5 1011 J/capita/year
• US Land Area: 9.8 106 km2=9.8 1012 m2
• Energy Use per unit area: 1.07 107 J m-2
• Potential, Incident Solar Energy: 6.47 109 J m-2
– Ione, CA
• A solar system (solar panels, biomass) must be 0.1% efficient, working year round, over the entire surface area of the US is needed to capture the energy we use to offset fossil fuel consumption– Alternatively, a 1% efficient system, on 10% of the surface area,
will provide US Energy, assuming available water and not considering energy inputs to drive the system
ESPM 111 Ecosystem Ecology
2/11/2013
24
ESPM 111 Ecosystem Ecology
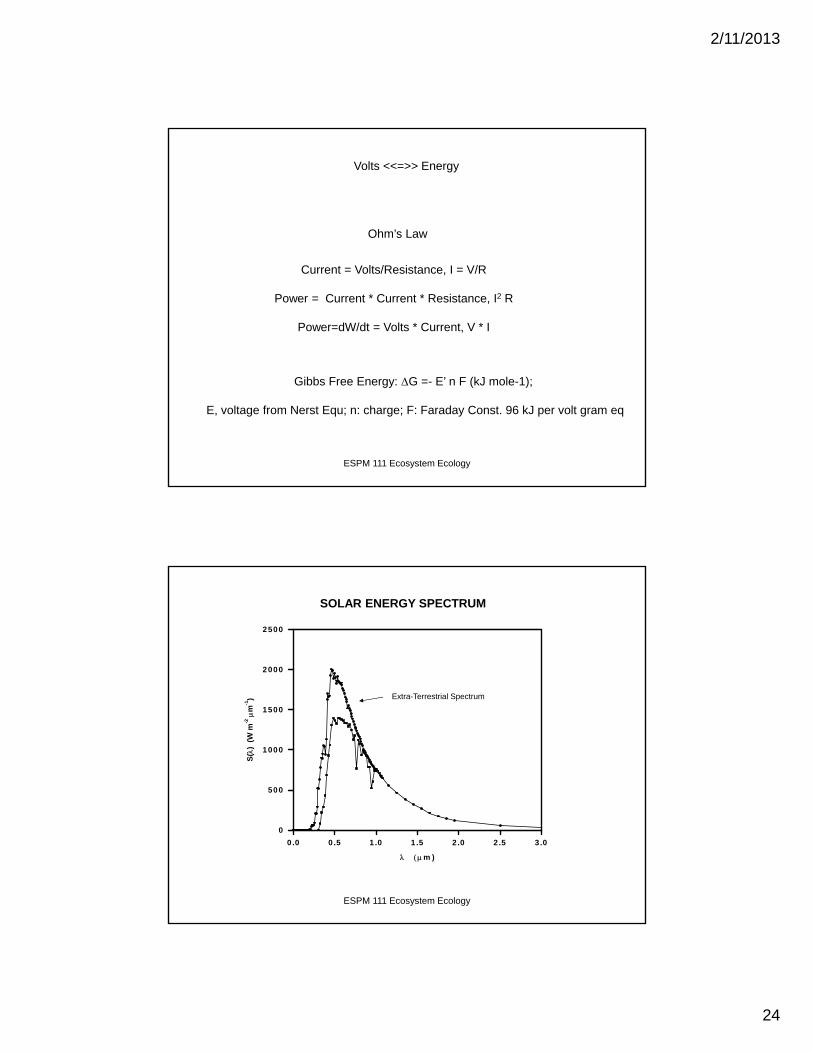
Ohm’s Law
Current = Volts/Resistance, I = V/R
Power = Current * Current * Resistance, I2 R
Power=dW/dt = Volts * Current, V * I
Gibbs Free Energy: G =- E’ n F (kJ mole-1);
E, voltage from Nerst Equ; n: charge; F: Faraday Const. 96 kJ per volt gram eq
Volts <<=>> Energy
ESPM 111 Ecosystem Ecology
m )
0.0 0 .5 1 .0 1 .5 2 .0 2 .5 3 .0
S(
) (
W m
-2
m-1
)
0
500
1000
1500
2000
2500
SOLAR ENERGY SPECTRUM
Extra-Terrestrial Spectrum

2/11/2013
25
RedoxPotential (mv)
Energy Release (J/mole e-)
Reduction of O2
812 125
Reduction of NO3-
747 118.9
Reduction of Mn4+ to Mn2+
526 97.4
Reduction of Fe3+ to Fe2+
-47 42.2
Reduction of SO42- to H2S
-221 24.6
Reduction of CO2 to CH4
-244 23.4
2 24 4 2O H e H O
3 2 22 2NO H e NO H O
2 4 28 8 2CO H e CH H O
Schlesinger, 1997
24 2 210 8 4SO H e H S H O
22 24 2 2MnO H e Mn H O
22( ) 3 3Fe OH H e Fe H O
Microbes prefer Hierarchy of Energy Yields


