
ESNSurvey 2005
65
Authors: Ewa Krzaklewska, Seweryn Krupnik Erasmus Student Network Research Report Erasmus Student Network Survey 2005 in partnership with Petrus Communications
-
Upload
erasmus-student-network-aisbl -
Category
Documents
-
view
219 -
download
2
description
The experience of studying abroad for exchange students in Europe.
Transcript of ESNSurvey 2005

Authors:Ewa Krzaklewska, Seweryn Krupnik
Erasmus Student Network
Research Report Erasmus Student Network Survey 2005
in partnership with Petrus Communications
Papier: 250 gr. karton, nakład: 750 ark., folia: błysk

The experience of studying abroad
for exchange students in Europe
Erasmus Student Network Survey 2005 in partnership with Petrus Communications
Research Report
Ewa Krzaklewska, Seweryn KrupnikErasmus Student Network

Index
1. Introduction 32. Key results 43. Methodology 64. Acknowledgements 6
5. Studentsí characteristics 7 5.1 Main categories of respondents 7 5.2 Demographic profi le 8 5.3 Educational background 9 5.4 Income/Parental status 10 5.5 Disabled students 13
6. Experience of studying abroad 13 6.1 Motivation for going abroad 14 6.2 Activities during the stay 16 6.3 Language acquisition and communication 18 6.4 Non-formal learning dimension 20
7. Studentsí satisfaction with stay abroad 23 7.1 Aspects of stay 24 7.2 Financial situation 27 7.3 Satisfaction with host country 31
8. Satisfaction with student organisations 32 8.1 Erasmus Student Network 32 8.2 Satisfaction with ESN 34 8.3 Services of ESN 36 8.4 Cultural dimension of stay 41
9. Studentsí mobility 44
10. Recommendations 50
Annex 1: ESN Survey Questionnaire 52Annex 2: List of fi gures 61Annex 3: About ESN 63Annex 4: About Petrus Communications 64
Copyright © 2006 by Ewa Krzaklewska and Seweryn Krupnik
Research Report. The experience of studying abroad for exchange students in Europe. Ewa Krzaklewska, Seweryn KrupnikPublished by Erasmus Student Network Printed by Petrus Communications
Design of report by TSP Drukarnia Towarzystwa S≥owakÛw w Polscetel.: +48 (012) 634-11-27 fax: +48 (012) 632-20-80 Poland | www.tsp.org.pl
Back cover photo by Ewa Krzaklewska
2 | The experience of studying abroad for exchange students in Europe

Research Report | 3
1. Introduction
Th is report will present results of the research done by the Erasmus Student
Network in partnership with Petrus Communications. Th e aim of the research was to
evaluate the experience of studying abroad and the quality of services off ered to foreign
exchange students at European universities. Th e research was performed during June
and July, 2005. Th e online survey was fi lled out by 7754 exchange students from
universities around Europe.
Student mobility is a key issue in providing excellence in European education. Making a success of mobility is crucial for institutions, and of course for the students themselves. We feel strongly that successful international exchange and study programmes play a major role in economic and social stability worldwide. Of equal importance, it is a unique personal experience for students who have a new opportunity to develop both their academic and non-academic skills.
Th e aims of the Erasmus Student Network (ESN) are to support and enhance student mobility. At 200 Higher Educational Institutions’ ESN local branches, groups of ESN volunteers, often former exchange students, help local students during their period abroad. Th ey assist them, mostly at the beginning of their stay, to adapt and to solve practical problems, all to make their stay abroad worthwhile.
We launched this survey to identify the motivations and learning experiences of international and exchange students, and above all to look at the ‘success’ of their experience from a number of perspectives. We particularly wanted to identify themes that contribute to the success or failure of international educational experiences. What is more, we wanted to see if and how incoming students benefi t from the presence of student organisations at the receiving institution. Analysis will show how specifi c services prove indispensable while studying abroad and how, through the active participation of local students, a university can become a friendly and hospitable place for exchange students.
Th e phenomenal response we received for this project in such a short time (7754 responses in 2 months) strongly underlines that educational issues and mobility are topics that concern and motivate youth all over Europe. If you want to participate in the next edition of the ESN Survey, please write to Ewa Krzaklewska at [email protected].

4 | The experience of studying abroad for exchange students in Europe
2. Key results Exchange students who answered to our survey were mostly studying abroad
through the Socrates/Erasmus Programme (85,7% of all respondents). Others went abroad through several other exchange programmes that last no longer than a year (12,6%). A small number of students who had enrolled normally at the university abroad (1,75% – i.e. not part of an exchange programme) also answered the survey but this report does not include results concerning this group.
Th e respondents were more often female (61,5%), and were, on average, 23,5 years old. Th ey studied business/management (20%), engineering/technology (19%), languages and philological studies (11%), social sciences (8%) and many other fi elds of studies. Most students were from Western European countries (78%); the other 22% of students came from Central and Eastern European countries.
All students spent an average of 7 months abroad, mostly (86%) in 2004 and 2005. Th e main host countries were Spain (13%), Italy (12%), Germany (10%), Sweden (9%) and France (8%).
Motivations for going abroad varied for diff erent groups of students. While the top motivations were generally to practice a foreign language, to have new experiences and to enhance future career prospects, female students and students from Central and Eastern Europe were more often academically oriented.
Most of the respondents (68%) were very satisfi ed with their stay abroad and 26% were rather satisfi ed. Students neither satisfi ed nor dissatisfi ed, rather dissatisfi ed or very dissatisfi ed constitute a clear minority (4%, 0,9% and 0,5% respectively). Students were generally less satisfi ed with their studies than with their stay (4,0 compared to 4,6 at the fi ve point scale).
Our respondents were most satisfi ed with the social dimension of their stay (social life, atmosphere of the city and country, contact with the host country culture). Th ey were less satisfi ed with the problem-solving dimension (information before and after the stay, fi nances, International Offi ce assistance). Despite some of the areas of dissatisfaction, 98% of respondents would recommend studying abroad to their friends.
As far as learning processes are concerned, students considered study abroad programmes an opportunity to acquire cultural skills and knowledge (92% of respondents believed they have learned more about the culture of the host country) and to enrich one’s academic life. It was a time for self-development, and becoming more independent. Students not only learned new skills but also developed social networks. Furthermore, it gave them an opportunity to explore new places and new possibilities and to decide about future career tracks.

Research Report | 5
As far as student activities are concerned, most of the students took courses at the university (94%) during their stay. 27% of students worked on their thesis and 33% did independent study. A little over a quarter of students did laboratory work (27%). When it comes to extracurricular activities, 73% took language courses, 18% of the sample worked, 13% did internships and 7% did volunteer work. Almost all of the students (93%) travelled around the host country.
Students who took part in extracurricular activities such as internships (13%) or volunteer work (7%) were more satisfi ed with their contact with the local culture and local students.
57% of respondents had heard of the Erasmus Student Network. Students whose universities had an ESN section were in contact with ESN on average several times a month. 71% of students are (very or rather) satisfi ed with the ESN section at their host university, 22% were neither dissatisfi ed nor satisfi ed, 5% were only rather dissatisfi ed and 2% were very dissatisfi ed.
Th e respondents were most satisfi ed with the help of ESN in following aspects: – providing information about the stay and about studying after arrival – enhancing contacts with other exchange students– social and cultural activities: trips, visiting tours, parties.Th e more frequent contact students had with ESN, the more satisfi ed they were with
the ESN’s work and, additionally, the more satisfi ed they were with the stay in general.
Th e research demonstrates that the higher a student’s satisfaction is with an organisation whose role is taking care of exchange students (like ESN or any student organisation working with visiting students), the higher his/her level of satisfaction with his/her stay and studies is likely to be.
Disabled students articulated slightly lower levels of satisfaction with their stay. In their case we identifi ed a relation between satisfaction with the Buddy/mentor/tutor system provided by ESN and the overall level of satisfaction. We conclude that ESN can enhance the satisfaction of disabled students via the Buddy system.
28% of respondents were aware of another student organisation taking care of exchange students.
79,3% of respondents would consider moving to a foreign country; 14,8% are undecided and only 5,9% would not consider it. Of the students who would consider moving to foreign country, 69% would prefer to move there for a long time but not permanently. Students from Western Europe are more mobile than students from Central and Eastern Europe.
Th e Erasmus Student Network has a slight but statistically signifi cant infl uence on respondents’ attitude to mobility, which is related to enhancing their satisfaction with the social aspects of their stay.

6 | The experience of studying abroad for exchange students in Europe
3. MethodologyTh e ESN Survey was developed by ESN Survey team, led by the ESN
Vice President, Ewa Krzaklewska, and with the support of Petrus Communications. Th e questionnaire was available online during June and July, 2005, on the ESN
website at www.esn.org/questionnaire. Students were able to complete the survey entirely online and only in English. Beforehand, it was piloted online among approximately 100 students. It was then launched to university-level students throughout Europe, who had completed or were in the process of completing an international exchange or independent study programmes abroad.
Th e information about the survey was spread through the local branches of the Erasmus Student Network, Petrus Communications’ contacts and other associations concerned with educational issues (European Association of International Education, European Universities Association, AEGEE), as well as through the international offi ces of individual universities. Students received emails notifying them about the project and were informed about the possibility of winning 5 travel vouchers, each worth 100 Euros, if they would fi ll out the questionnaire. As a verifi cation procedure respondents were supposed to use a code at the beginning of the questionnaire.
In sum, we received 7754 valid questionnaires for analysis.
4. AcknowledgementsWe would particularly like to thank all the ESN sections that worked hard
to make the survey a success. Th e most active sections were ESN Linköping, ESN Copenhagen, ESN at Universidad Autonoma de Barcelona and ESN Roma.
We would also like to express our appreciation to EAIE, as through its structures we managed to gather about 1500 questionnaires. Additionally, the following organisations helped in the distribution of the survey: European University Association, AEGEE, the Italian National Socrates Agency and the Polish National Socrates Agency.
And fi nally, thanks to the ESN Survey Team: Patrick Fiquet, Katja Boh, Nicola Casati, Natalia Drela, and Karin Siöö, as well as Davide Capecchi, Karri Teikari; Gill Willson for her expertise and all ESN members and supporters – especially Petrus Communications – that helped us in the research process and the publication of this report.

Research Report | 7
5. Studentsí characteristics 5.1 Main categories of respondents
We divided the respondents into three main categories:
1. Students who studied abroad within the Socrates/Erasmus Programme (85,7% of all respondents)
2. Students who did short term exchanges within other educational study abroad programmes, which lasted not more than 12 months, through bilateral agreements or programmes of other foundations (DAAD, Campus Europea etc.) (12,6%)
3. Students who were enrolled at the university abroad (1,75%).
Figure 1. Main categories of students who took part in the survey (n=6975)
In this report we will concentrate on the analysis of Socrates/Erasmus students (hereafter Erasmus students) and we will compare them to students who spent not more than a year in a foreign university (hereafter non Erasmus students). We did not include data concerning long-term students in this report.
Programme category

8 | The experience of studying abroad for exchange students in Europe
5.2 Demographic profi le
Th e average age of respondents was 23 years. Erasmus students’ mean age was 23,4 compared to non Erasmus students who were on average 23,7 years old. Th e youngest respondents come from the United Kingdom (21,5) and Belgium (21,8), and the oldest (on average about 25 years old) from Scandinavian countries such as Norway, Sweden, Denmark, as well as Switzerland and Bulgaria.
Concerning gender, 61,5% of our respondents were female and 38,5% male. Th is ratio mirrors the tendency among those doing exchange abroad and does not diff er much between Erasmus and non Erasmus students.
Students came from 100 countries within and outside of Europe, with much higher participation for European countries. Most students are from Western European countries (78%), while only 22% of students came from Central and Eastern European countries1. However, we observe higher numbers of students from Central and Eastern Europe among Erasmus students than among non Erasmus students.
Figure 2. Region of birth of Erasmus and non Erasmus students (n=6004)
1 In this report, the countries included in the category Central and Eastern Europe are: Albania, Belarus, Bosnia-Herz., Bulgaria, Croatia, Czech Republic, Estonia, Hungary, Latvia, Lithuania, Macedonia, Moldavia, Poland, Romania, Slovakia, Slovenia, Ukraine and Yugoslavia. Th e Western Europe category includes: Austria, Belgium, Cyprus, Denmark, Finland, France, Germany, Greece, Ireland, Italy, Liechtenstein, Luxembourg, Malta, the Netherlands, Norway, Portugal, Spain, Sweden, Switzerland and the United Kingdom.
22%
14%
78%
86%
0% 10% 20% 30% 40% 50% 60% 70% 80% 90% 100%
Erasmus
non Erasmus
Central and Eastern Europe Western Europe

Research Report | 9
5.3 Educational background
Students studied at more than 1200 diff erent universities, but the majority of responses came from 300 of these. Universities were located in 45 countries, mostly European.
Figure 3. Country where the home university is located (n=5928)
Among all respondents, 43% were Bachelor (BA) students and 57% Master (MA) students. Within Erasmus students there were more MA students than BA students, while for other exchange students the numbers of MA and BA students were almost equal. Most respondents will graduate in 2005, 2006 or 2007.
Figure 4. Level of studies of Erasmus and non Erasmus students (n=6012)
42%
51%
58%
49%
0% 20% 40% 60% 80% 100%
Erasmus
non Erasmus
BA (3-4 years) MA (5-6 years)
Country N Percent Country N PercentItaly 1197 20,2 Czech Republic 122 2,1Germany 705 11,9 Netherlands 116 2,0France 437 7,4 Austria 115 1,9Poland 427 7,2 Slovenia 104 1,8Spain 424 7,2 Denmark 86 1,5Finland 374 6,3 Romania 79 1,3Switzerland 317 5,3 Norway 72 1,2Hungary 247 4,2 Greece 70 1,2Sweden 223 3,8 Bulgaria 37 0,6Belgium 184 3,1 Slovakia 26 0,4Portugal 169 2,9 Estonia 23 0,4United Kingdom 169 2,9 Ireland 18 0,3Lithuania 130 2,2 Latvia 16 0,3

10 | The experience of studying abroad for exchange students in Europe
Th e most popular major subjects among the respondents were: business studies/management sciences (20%), engineering/technology (19%), languages and philological studies (11%) and social sciences (8%). When it comes to diff erences among the programmes, non Erasmus students did medical studies or business more often than Erasmus, while Erasmus students more often than non Erasmus studied languages.
Figure 5. Majors of Erasmus and non Erasmus students (n=6012)
5.4 Income/Parental status
61% of all the respondents described their family’s income as average. 31% described it as above the country’s average. 8% described it as below the country’s average. Non Erasmus students evaluated their income as above their country’s average more often than Erasmus students did.
20,1
18,8
10,7
8,2
5,6
5,6
4,9
4,9
4,6
4,2
2,8
2,6
2,5
2,2
1,2
1,0
0 5 10 15 20 25
business studies/management sciences
engineering/technology
languages and philological studies
social sciences
humanities
law
natural sciences
other subject areas
communication
medical sciences
art and design
mathematics
architecture, urban studies
education, teacher training
agricultural sciences
geography, geology
%

Research Report | 11
Figure 6. Family’s income of Erasmus and non Erasmus students (n=6507)
Figure 7. Family’s income and the educational attainment of the parents (n=5853)
30,0%
38,5%
61,8%
54,1%
8,2%
7,4%
0% 20% 40% 60% 80% 100%
Erasmus
non Erasmus
Above my country average Average Below my country average
15,6%
26,4%
41,1%
45,7%
70,4%
65,8%
54,3%
51,0%
13,9%
7,9%
4,5%
3,3%
0% 20% 40% 60% 80% 100%
None
Mother
Father
Both
Above my country average Average Below my country average

12 | The experience of studying abroad for exchange students in Europe
Among the respondents, there were more students from Central and Eastern Europe than from Western Europe with both parents university educated (42% to 27%). Th e number of students from the families where none of the parents has a higher education degree was much higher among Western Europeans (43% to 31% for Central and Eastern Europe). While Central Eastern European students may come from the families of more educated parents, still more of them declared that their family’s income is below the country’s average.
Figure 8. Who in family has a higher education degree? – family’s educational attainment for students
from Western Europe and Central and Eastern Europe (n=5938)
Most of our respondents came from a town or a small city (42%) or from a big city (22,6%). 16,7% of students came from a country village and 15,1% from the suburbs. Only 3,6% came from a farm or a home in the countryside. Students who came from the suburbs of a big city and big cities indicated their income as higher, and furthermore their parents had a better educational attainment.
13%
10%
14%
21%
42%
27%
31%
43%
0% 10% 20% 30% 40% 50% 60% 70% 80% 90% 100%
Central and EasternEurope
Western Europe
Mother Father Both None

Research Report | 13
Figure 9. Areas where the students’ family lives (n=5938)
5.5 Disabled students
Disabled students constituted only 2,2% (141 students) of the respondents. 92% of these studied within the Socrates/Erasmus Programme. Th ey come mostly from Western Europe (62%), but the number of Central and Eastern European students was higher than for all the respondents (38% compared to 22%). Th ey described their income as above average (28%) and average (62%), which did not diff er signifi cantly from the income of all the respondents.
42,0 22,6 16,7 15,1 3,60
10
20
30
40
50
A town or asmall city
A big city A country village The suburbs of abig city
A farm or homein the
countryside
[%]

14 | The experience of studying abroad for exchange students in Europe
6. Experience of studying abroadStudents spent on average 7 months abroad, mostly (86%) in 2004 and 2005. Th e
countries they have chosen most frequently were Spain (13%), Italy (12%), Germany (10%), Sweden (9%) and France (8%).
6.1 Motivation for going abroad
Top motivations for students for going abroad were to practice a foreign language (60% for Erasmus, 41% for non Erasmus), to have new experiences (53%, 49%), to enhance future career prospects (41%, 40%) and to learn about diff erent cultures (32%, 33%). While for Erasmus students language motivation was indisputably the highest, the career dimension and the opportunity to have new experiences were more important for non Erasmus students. Th e chance to improve one’s academic knowledge, even if it was not a top priority for any of the groups, was higher for non Erasmus students (29% compared to 23%). Cultural motivation (to learn about diff erent cultures and to live abroad) was also quite high for both of the groups.
Motivations diff ered between various groups.1. Gender:
– female students more often chose learning about diff erent cultures, practicing a foreign language and enhancing future employment opportunities as their motivation to go abroad
– more female than male Erasmus students studied abroad in order to improve their academic knowledge
– male students wanted to have fun and to meet new people more often than female students 2. Age:
– the youngest group of students (up to 21 years old) more often had academic motivations but also more often wanted to have fun and to meet new people
– the students aged 22-25 more often than others chose as a motivation “to have new experiences”3. Income:
– students who reported their income as below average had more often than others motivation to improve their academic knowledge; they also more often wanted to live in a foreign country
– students with income above average more often than others wanted to have fun

Research Report | 15
Figure 10. Motivation for going abroad for Erasmus and non Erasmus students (n=6975)
4. Region:
– students from Central and Eastern Europe wanted more often than others to improve their academic knowledge, to learn about diff erent education systems, to live in a foreign country and to learn a foreign language, but at the same time they also wanted to have new experiences
5. Erasmus vs. non Erasmus:
– Erasmus students more often than non Erasmus wanted to go abroad to practise a foreign language, to have new experiences and to meet new people
– non Erasmus students were more often academically motivated
Motivation for going abroad
0
10
20
30
40
50
60
70
practice a language
new experiences
employm
ent prospects
different cultures
live abroad
meet new people
academic knowledge
different educ. system
have fun
develop as a person
be independent
%
Erasmus
non Erasmus

16 | The experience of studying abroad for exchange students in Europe
6.2 Activities during the stay
Most of the students took courses at the university during their stay. 27% of students work on their thesis and 33% did an independent study. A bit more than a quarter of students did laboratory work (27%). When it comes to extracurricular activities, 73% took language courses. 18% of the researched sample of students worked, 13% did internships and 7% volunteer work. Almost all of the students (93%) travelled around the host country.
Figure 11. Activities during the stay for all the respondents (n varies from 5975 to 6743)
Diff erences between both groups are present only when it comes to the participation in language courses: 75% for Erasmus comparing to 59% for non Erasmus, and volunteer work: 7% for Erasmus comparing to 13% for non Erasmus.
7
13
18
27
27
33
73
93
94
0 20 40 60 80 100
did volunteer w ork
did an internship
w orked
w orked on thesis
did laboratory w ork
did independent study
took a language course
travelled
university courses

Research Report | 17
In order to see how the behaviour abroad diff ers among diff erent nationalities, we compared three countries: France (Western European country), Italy (Southern European country) and Poland (new EU country). Th e results show that Polish students more often wrote their thesis while abroad, as well as they more often had jobs.
Figure 12. During your stay, did you work on your thesis? Results for France, Italy and Poland
(n=1978)
Figure 13. During your stay, did you work? Results for France, Italy and Poland (n=1930)
24 24
51
76 76
49
0%
10%
20%
30%
40%
50%
60%
70%
80%
90%
100%
France Italy Poland
no
yes
23 20
37
77 80
63
0%
10%
20%
30%
40%
50%
60%
70%
80%
90%
100%
France Italy Poland
no
yes
18 | The experience of studying abroad for exchange students in Europe
6.3 Language acquisition and communication
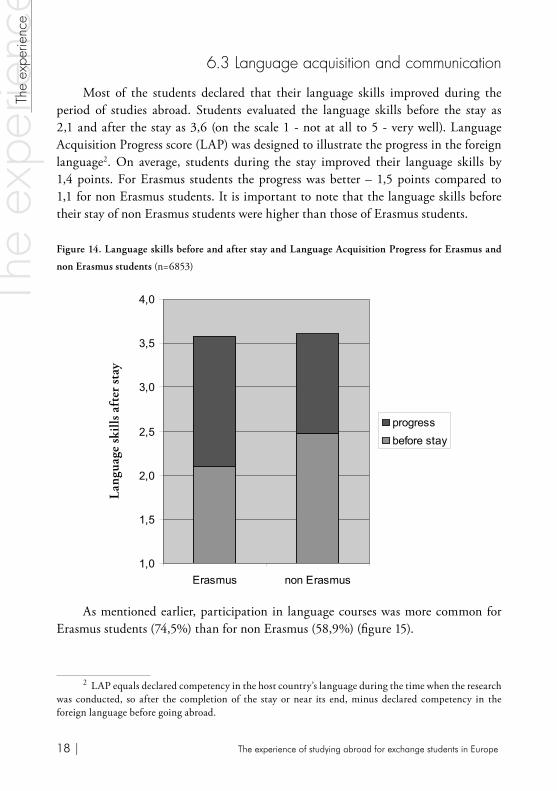
Most of the students declared that their language skills improved during the period of studies abroad. Students evaluated the language skills before the stay as 2,1 and after the stay as 3,6 (on the scale 1 - not at all to 5 - very well). Language Acquisition Progress score (LAP) was designed to illustrate the progress in the foreign language2. On average, students during the stay improved their language skills by 1,4 points. For Erasmus students the progress was better – 1,5 points compared to 1,1 for non Erasmus students. It is important to note that the language skills before their stay of non Erasmus students were higher than those of Erasmus students.
Figure 14. Language skills before and after stay and Language Acquisition Progress for Erasmus and
non Erasmus students (n=6853)
As mentioned earlier, participation in language courses was more common for Erasmus students (74,5%) than for non Erasmus (58,9%) (fi gure 15).
2 LAP equals declared competency in the host country’s language during the time when the research
was conducted, so after the completion of the stay or near its end, minus declared competency in the foreign language before going abroad.
1,0
1,5
2,0
2,5
3,0
3,5
4,0
Erasmus non Erasmus
progressbefore stay
Lan
guag
e sk
ills
aft
er s
tay
Research Report | 19
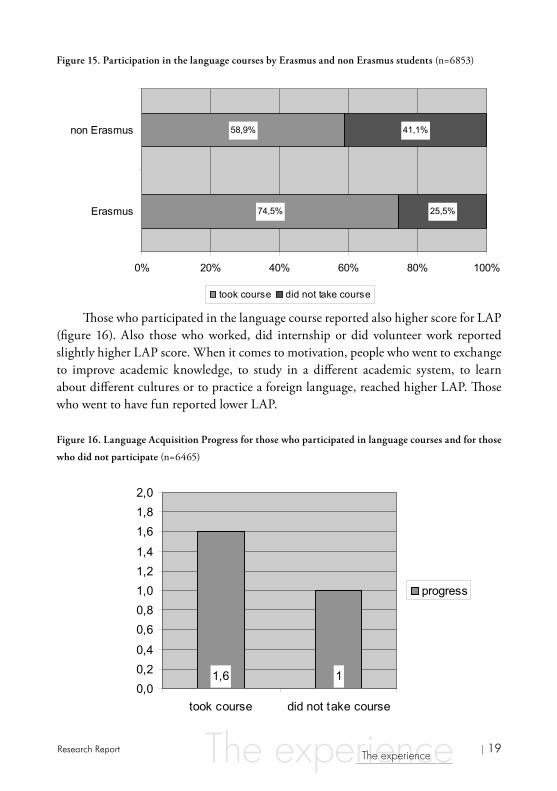
Figure 15. Participation in the language courses by Erasmus and non Erasmus students (n=6853)
Th ose who participated in the language course reported also higher score for LAP (fi gure 16). Also those who worked, did internship or did volunteer work reported slightly higher LAP score. When it comes to motivation, people who went to exchange to improve academic knowledge, to study in a diff erent academic system, to learn about diff erent cultures or to practice a foreign language, reached higher LAP. Th ose who went to have fun reported lower LAP.
Figure 16. Language Acquisition Progress for those who participated in language courses and for those
who did not participate (n=6465)
1,6 10,00,20,4
0,60,81,01,21,4
1,61,82,0
took course did not take course
progress
74,5%
58,9%
25,5%
41,1%
0% 20% 40% 60% 80% 100%
Erasmus
non Erasmus
took course did not take course

20 | The experience of studying abroad for exchange students in Europe
Students communicated in the local language or in English during their stay. Both Erasmus and non Erasmus used both options almost equally frequently, although English was a little less used by Erasmus students. Th ose who communicated in the local language outside and at the university reported higher score for LAP. Th ose who communicated mostly in English may have improved their English language skills, but this progress was not measured by our questionnaire.
Figure 17. Communication in local language and in English at the university and outside the university
for Erasmus and non Erasmus students
6.4 Non-formal learning dimension
Aside from formal academic and language courses, an active informal and non-formal learning takes place while students stay abroad. Non-formal learning can take place during internships, voluntary work or participation in projects outside of university. But the learning processes are going on throughout whole stay abroad.
To identify what are the soft skills that students acquire, respondents were asked to answer the open question: What is the most important thing you learned as an exchange student?
0
10
20
30
40
50
60
70
80
90
Locallanguage at
the university
Locallanguage
outside theuniversity
English at theuniversity
Englishoutside theuniversity
Erasmus
non Erasmus
Research Report | 21
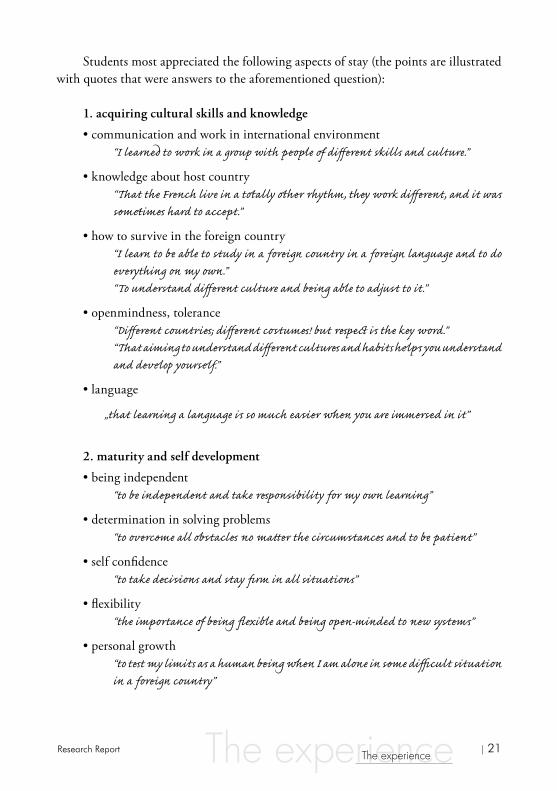
Students most appreciated the following aspects of stay (the points are illustrated with quotes that were answers to the aforementioned question):
1. acquiring cultural skills and knowledge
• communication and work in international environment“I learned to work in a group with people of diff erent skills and culture.”
• knowledge about host country “Th at the French live in a tot ally ot her rhythm, they work diff erent, and it was somet imes hard to accept.”
• how to survive in the foreign country“I learn to be able to study in a foreign country in a foreign language and to do everything on my own.” “To understand diff erent culture and being able to adjust to it.”
• openmindness, tolerance “Diff erent countries ; diff erent costumes ! but res pect i s the key word.” “Th at aiming to understand diff erent cultures and habits helps you understand and develop yourself.”
• language
„that learning a language i s so much easier wh en you are immersed in it”
2. maturity and self development
• being independent“to be independent and take res ponsibility for my own learning”
• determination in solving problems“to overcome all obstacles no matt er the circumstances and to be patient”
• self confi dence“to take dec i sions and stay fi rm in all situations”
• fl exibility “the importance of being fl ex ible and being open-minded to new sy stems”
• personal growth “to tes t my limits as a human being wh en I am alone in some diffi cult situation in a foreign country”

22 | The experience of studying abroad for exchange students in Europe
3. social networks
• creation of friendships “build a net work around the world”“to integrate in a group of international of foreign students with diff erent backgrounds”
• how to live together“share the kitchen”
• communication skills“to speak with all people more easily”“communicate easy with foreign people (students and non-students)”
4. academic enrichment
• adaptation to diff erent academic system “a view into a very diff erent educational sy stem”
• planning career path due to exchange “wh at I’d like to be, my main fi eld of activity in the future”
5. value of discovery and exploring new possibilities
• openness to new“to live your life at the moment & not worr y to much about the future bec ause the people in Spain don’t care to much about their cars; houses but live. To try everything new; and not to be afr aid about new ex periences ”
• grabbing opportunities“to avail ones elf of the opp ortunity”
As we see the active process of growing and maturation takes places for most of exchange students. Th ey are very refl ective about their own development and they appreciate new qualities acquired and skills learned.

Research Report | 23
7. Studentsí satisfaction with stay abroadStudents’ satisfaction with their stay was measured using four categories of
questions concerning:– satisfaction with stay;– satisfaction with studies (concerning the academic dimension of stay);– recommendation to a friend to spend a period abroad (which is treated as an
indicator of satisfaction);– satisfaction with twelve aspects of stay3.
Answers for the fi rst three questions are summarised in fi gure 18. While answers for all questions were positive, students were more likely to recommend the stay to their friends than to indicate that they were “very satisfi ed” with their stay or studies. Furthermore, students were generally less satisfi ed with their studies than with their stay. It is worth mentioning that satisfaction with stay is a better predictor than satisfaction with studies for a recommendation to a friend.4
Figure 18. Variables describing students’ satisfaction (scale: 4 – rather yes, 5 – defi nitely yes for
recommendation to a friend and 4 – rather satisfi ed, 5 – very satisfi ed for two other variables; n=6700)
3 Satisfaction overall as well as of specifi c aspects was measured on the fi ve point scale from 1 – very dissatisfi ed to 5 – very satisfi ed. Th e rule is valid for the whole report.
4 Pearson’s correlation coeffi cients 0,45 and 0,2, respectively.
4 4
4,6 4,6
4,9 4,9
3
4
5
Erasmus non Erasmus
satisfaction with studies
satisfaction with stay
recommendation to a friend
24 | The experience of studying abroad for exchange students in Europe
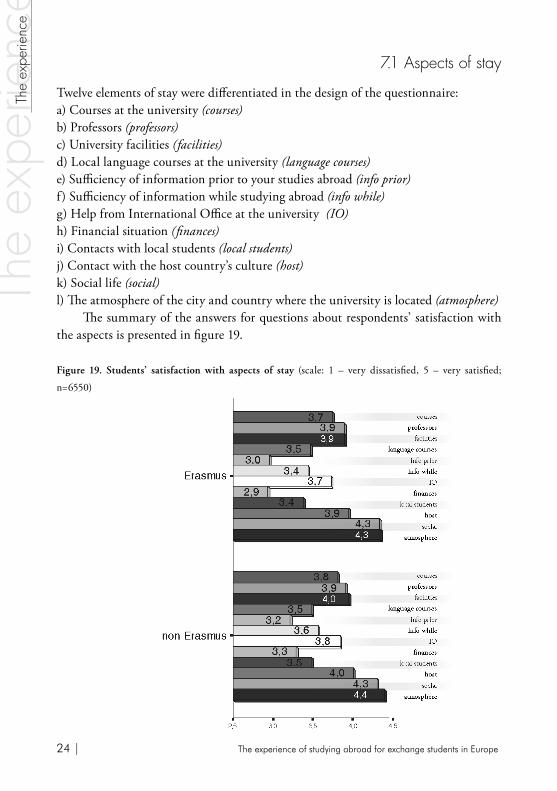
7.1 Aspects of stay
Twelve elements of stay were diff erentiated in the design of the questionnaire:a) Courses at the university (courses) b) Professors (professors)c) University facilities (facilities) d) Local language courses at the university (language courses) e) Suffi ciency of information prior to your studies abroad (info prior) f ) Suffi ciency of information while studying abroad (info while)g) Help from International Offi ce at the university (IO)h) Financial situation (fi nances)i) Contacts with local students (local students)j) Contact with the host country’s culture (host)k) Social life (social) l) Th e atmosphere of the city and country where the university is located (atmosphere)
Th e summary of the answers for questions about respondents’ satisfaction with the aspects is presented in fi gure 19.
Figure 19. Students’ satisfaction with aspects of stay (scale: 1 – very dissatisfi ed, 5 – very satisfi ed;
n=6550)

Research Report | 25
Figure 20. Mean students’ satisfaction with aspects of stay (scale: 1 – very dissatisfi ed, 5 – very satisfi ed;
n=6550)
Students were most satisfi ed with social life and with the atmosphere of the city and country where the university was located and least satisfi ed with the level of information they received before their arrival, as well as with their fi nancial situation.
By using ‘principal component analysis’, the twelve aspects of studying abroad were grouped into three factors:5 the fi rst refl ects academic dimension of stay and it included professors, courses and university facilities; the second factor represents social dimension incorporating social life, contact with local students and atmosphere of the city and the country where university is located; the third factor presents a problem-solving dimension by including the provision of information, help from the International Offi ce and fi nancial situation.
5 In order to interpret the data a principal component analysis was conducted on the correlations of the twelve aspects of stay. Th ree components were extracted with eigenvalues of more than one. Th e factors were rotated with both varimax and direct oblimin, giving essentially similar results. Th e three factors accounted for 56% of the total variance.
ERASMUS NON ERASMUS
courses 3,7 3,8
professors 3,9 3,9
facilities 3,9 4
language courses 3,5 3,5
info prior 3 3,2
info while abroad 3,4 3,6
International Offi ce 3,7 3,8
fi nances 2,9 3,3
local students 3,4 3,5
host country’s culture 3,9 4
social life 4,3 4,3
atmosphere 4,3 4,4

26 | The experience of studying abroad for exchange students in Europe
Figure 21. Th ree dimensions of stay abroad and their elements
Students were most satisfi ed with the social dimension and least satisfi ed with the problem-solving dimension. However, non Erasmus students’ scores within this problem-solving dimension were higher than those of Erasmus students (fi gure 22).
Figure 22. Students’ satisfaction with dimensions of stay (n=6550)

Research Report | 27
While all dimensions had an infl uence on respodents’ satisfaction with stay, studies and recommendation, the academic dimension had the most signifi cant infl uence on satisfaction with studies6 and the social dimension had the greatest signifi cant infl uence on overall satisfaction7 and recommendation8.
7.2 Financial situation
Th e level of grant received towards overall expenses signifi cantly infl uenced the satisfaction with students’ fi nancial situation. While this infl uence was hardly unexpected, there is one element of it which is surprising – respondents who have not received a scholarship were more satisfi ed with their fi nancial situation that the ones whose grant covered only a small part of their expenses (fi gure 23).
Figure 23. Th e infl uence of the part of the overall expenses covered by the grant on the satisfaction with
fi nancial situation (n=6707)
6 partial correlation coeffi cient = 0.497 partial correlation coeffi cient = 0.48 partial correlation coeffi cient = 0.2
3,8 3,5 3,1 2,9 2,6 2,91
1,5
2
2,5
3
3,5
4
Almost all Most of Around half Around aquarter
A smallpart
I did notreceive

28 | The experience of studying abroad for exchange students in Europe
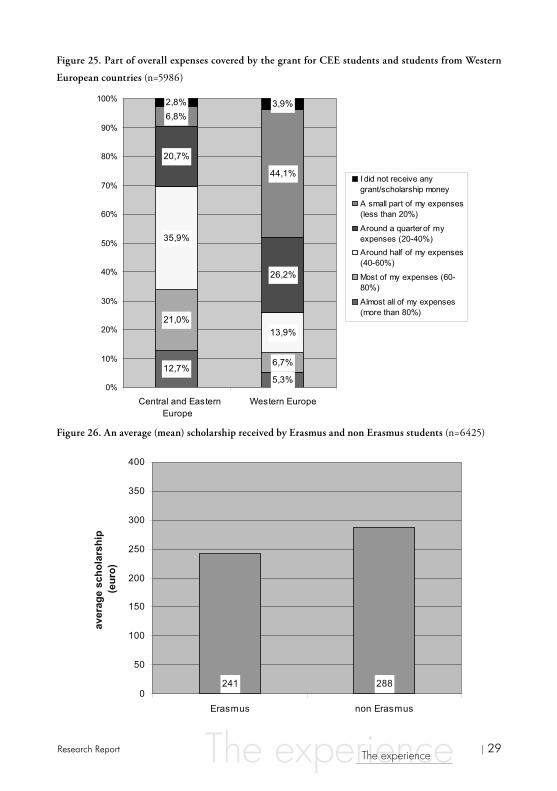
Students from Central and Eastern European countries (CEE) received on average 298 euros per month while students from Western countries (West) about 226 euros (fi gure 24). Moreover, CEE students declared that their grant covered a signifi cant part of their expenses (fi gure 25), even if among CEE students there are more families whose income is below country’s average, so they probably could count on a smaller family support.
Mean scores of satisfaction with fi nancial situation are lower for Western students (2,94 compared to 3,10 of CEE students). Still, that does not mean that their fi nancial situation abroad was objectively worse. Western students might be used to the higher standard of living; this is why their fi nancial expectations are higher. Also, a bigger percentage of students from Poland worked to get money, which could improve their fi nancial situation (fi gure 13).
Figure 24. An average (mean) scholarship received by students from CEE and Western countries
(n=5801)
Region of birth
WestCEE
Ave
rage
gra
nt/s
chol
arsh
ip
320
300
280
260
240
220
200
226
298
Research Report | 29
Figure 25. Part of overall expenses covered by the grant for CEE students and students from Western
European countries (n=5986)
Figure 26. An average (mean) scholarship received by Erasmus and non Erasmus students (n=6425)
12,7%5,3%
21,0%
6,7%
35,9%
13,9%
20,7%
26,2%
6,8%
44,1%
2,8% 3,9%
0%
10%
20%
30%
40%
50%
60%
70%
80%
90%
100%
Central and EasternEurope
Western Europe
I did not receive anygrant/scholarship money
A small part of my expenses(less than 20%)
Around a quarter of myexpenses (20-40%)Around half of my expenses(40-60%)
Most of my expenses (60-80%)
Almost all of my expenses(more than 80%)
241 2880
50
100
150
200
250
300
350
400
Erasmus non Erasmus
aver
age
scho
lars
hip
(eur
o)

30 | The experience of studying abroad for exchange students in Europe
Figure 27. Part of overall expenses covered by grant for Erasmus and non Erasmus students (n=6641)
While comparing Erasmus students with non Erasmus students following conclusions were drawn:
– taken altogether, a large number of students came from families with an income greater than their country’s average. However, Erasmus students were more likely than non Erasmus students to come from families whose income is below their country’s average;
– the average value of received scholarships was higher for non Erasmus than for Erasmus students (288 and 241 euros, respectively). At the same time, 23,3% of non Erasmus students did not receive any grant or scholarship money compared with 2,9% of Erasmus students (fi gure 27);
– grants for non Erasmus students, if received, covered a larger part of their expenses (fi gure 27).
6,1%13,7%
9,7%
12,3%
18,9%
14,5%
25,3% 14,5%
37,1%
21,6%
2,9%
23,3%
0%
10%
20%
30%
40%
50%
60%
70%
80%
90%
100%
Erasmus non Erasmus
I did not receive anygrant/scholarship money
A small part of my expenses(less than 20%)
Around a quarter of myexpenses (20-40%)Around half of my expenses(40-60%)
Most of my expenses (60-80%)
Almost all of my expenses(more than 80%)

Research Report | 31
7.3 Satisfaction with host country
Th ere are three aspects of stay which we can call country-specifi c:– atmosphere of the city and the country where the university is located;– contacts with local students;– contact with the host country culture.Figure 28 presents respondents’ satisfaction with these aspects for fourteen
European countries. It should be noted that due to the low number of respondents from some countries the results are not representative in the narrow sense of the word. In the table, there are listed the countries with more than 100 respondents.
Th e fi ve countries that had the highest overall mean scores were: Poland, Italy, Austria, France and Czech Republic.
Figure 28. Respondents’ satisfaction with specifi c aspects of host country
Host country The atmosphere of
the city and country
Contacts with local students
Contact with the host country
culture Overall
Mean Rank Mean Rank Mean Rank Mean Rank N Austria 4,26 12 3,57 1 3,94 1 3,94 3 121
Belgium 4,38 4 3,26 13 3,82 12 3,82 11 146
Czech Republic 4,44 2 3,38 7 3,91 6 3,91 5 142
Denmark 4,32 8 3,26 12 3,82 13 3,82 12 368
Finland 4,22 13 3,35 8 3,80 8 3,80 13 253
France 4,33 7 3,43 3 3,92 3 3,92 4 469
Germany 4,34 6 3,38 6 3,89 7 3,89 7 556
Italy 4,35 5 3,42 4 3,96 4 3,96 2 776
Netherlands 4,3 10 3,33 9 3,83 9 3,83 9 292
Poland 4,45 1 3,54 2 3,99 2 3,99 1 170
Spain 4,43 3 3,31 11 3,91 10 3,91 8 780
Sweden 4,31 9 3,39 5 3,85 5 3,85 8 528
Switzerland 4,18 14 3,25 14 3,75 14 3,75 14 122
United Kingdom 4,29 11 3,31 10 3,83 11 3,83 10 326

32 | The experience of studying abroad for exchange students in Europe
8. Satisfaction with student organisations8.1 Erasmus Student Network
57,5% Erasmus students and 55,7% non Erasmus students have heard about Erasmus Student Network. The differences between those two categories of students are also small as far as questions about ESN’s sections at home and host university are concerned. 72,8% Erasmus Socrates students and 61,6% non Erasmus students declared that there was an ESN section at their host university. The ratio is lower for home university: 42,2% and 40,3%, respectively. The difference between declarations concerning ESN sections at home and host universities may be explained by the fact that students on exchange were more likely to be exposed to an ESN section.
Figure 29. Ratio of respondents who declared that there is an ESN section at their host university
(n=3806)
Respondents have learned about the ESN from the following sources:– an ESN section at the receiving university 37%;– an ESN section at the home university 19%;– a friend 17%;– International Relations Offi ce 15%;– internet 12%.
72,8
61,6
8,0
14,0
19,2
24,4
0% 20% 40% 60% 80% 100%
Erasmus
non Erasmus
yes
no
I do not know
Research Report | 33
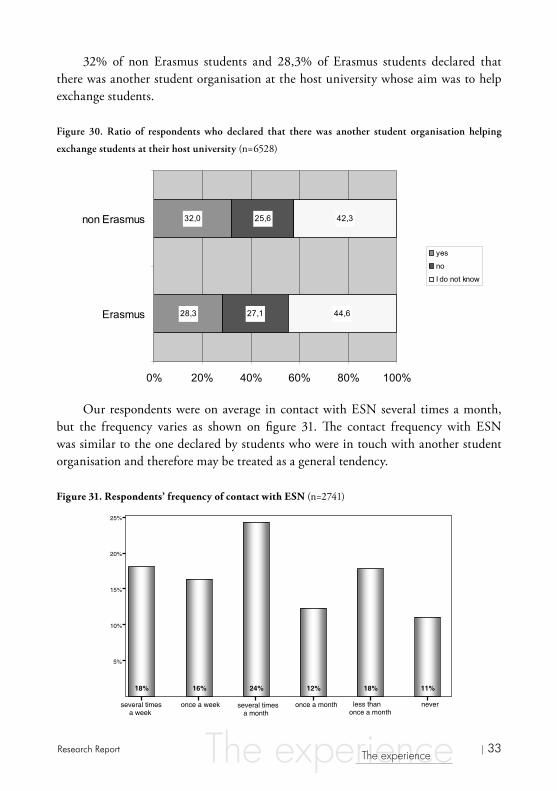
32% of non Erasmus students and 28,3% of Erasmus students declared that there was another student organisation at the host university whose aim was to help exchange students.
Figure 30. Ratio of respondents who declared that there was another student organisation helping
exchange students at their host university (n=6528)
Our respondents were on average in contact with ESN several times a month, but the frequency varies as shown on fi gure 31. Th e contact frequency with ESN was similar to the one declared by students who were in touch with another student organisation and therefore may be treated as a general tendency.
Figure 31. Respondents’ frequency of contact with ESN (n=2741)
28,3
32,0
27,1
25,6
44,6
42,3
0% 20% 40% 60% 80% 100%
Erasmus
non Erasmus
yes
no
I do not know
several timesa week
once a week several timesa month
once a month less than once a month
never
5%
10%
15%
20%
25%
18% 16% 24% 12% 18% 11%

34 | The experience of studying abroad for exchange students in Europe
8.2 Satisfaction with ESN
Overall satisfaction with ESN and other student organisations is about 3,9. Th e satisfaction with ESN for non Erasmus students was slightly lower than with other student organisations, most probably due to the fact that the number of non Erasmus respondents was lower.
Figure 32. Satisfaction with ESN and other student organisations (n=4002)
Erasmus students who contacted ESN frequently were more likely to express their satisfaction with ESN. 51% of respondents who have contacted ESN several times a week were very satisfi ed with it. Th e same ratio for students who contacted ESN less than once a month amounts to 13,1% (fi gure 33).
3,92
3,87
3,81
3,94
3,50
3,75
4,00
satisfaction with ESN satisfaction with other student organisations
Erasmus non Erasmus

Research Report | 35
Figure 33. Th e infl uence of frequency of contact with ESN on satisfaction with ESN (n=2409)
Th e same infl uence may be observed for general satisfaction with stay. 79% of Erasmus respondents who contacted ESN several times a week were very satisfi ed with their overall stay abroad. Th e same ratio for students who contacted ESN less than once a month amounts to 69% (fi gure 34).
Figure 34. Th e infl uence of frequency of contact with ESN on satisfaction with stay (n=2778)
very dissatisfied rather dissatisfied
neither dissatisfied nor satisfied rather satisfiedvery satisfied
satisfaction with esn
0% 25% 50% 75% 100%
several times a week
once a week
several times a month
once a month
less than once a month
Fre
qu
ency
of
con
tact
wit
h E
SN
very dissatisfied
rather dissatisfied
neither dissatisfied nor satisfied
rather satisfied
very satisfied
satisfaction with stay
10% 20% 30% 40% 50% 60% 70% 80% 90%
several times a week
once a week
several times a month
once a month
less than once a month
never
Fre
qu
ency
of
con
tact
wit
h E
SN

36 | The experience of studying abroad for exchange students in Europe
8.3 Services of ESN
Sixteen elements of ESN service were diff erentiated in the design of the questionnaire:
a) providing information before arrival
b) providing information after arrival
c) helping with fi nding accommodation before arrival
d) helping with fi nding accommodation after arrival
e) helping with settling in a new place (visa, banking)
f ) intervening on your behalf when having problems
g) getting in contact with local students
h) getting in contact with other exchange students
i) helping to understand more about the culture of the host country
j) practicing your foreign language skills
k) buddy/mentor/tutor system
l) tandem project/language exchange programme
m) organising trips and visiting tours
n) organising parties and informal meetings
o) informing about upcoming events
p) helping with fi nding a job.

Research Report | 37
Figure 35. Satisfaction with elements of ESN’s service for Erasmus and non Erasmus
students (n=2287)

38 | The experience of studying abroad for exchange students in Europe
Respondents were most satisfi ed with ESN help in their social contacts with exchange students during parties, trips etc. Th ere is still a lot to be done as far as contacts with local students are concerned. Students were least satisfi ed with ESN’s help in fi nding a job, which is due to the fact that this is a secondary occupation of ESN sections. Satisfaction for Erasmus students with factors such as information before arrival and fi nding accommodation before arrival is also low, as most of the students become aware of ESN section after they arrive at the host university.
Figure 36. Mean scores of satisfaction with elements of ESN’s service for Erasmus and non Erasmus
students and for both groups (n=2287)
Erasmusnon
ErasmusTotal
providing information before arrival 3,27 3,42 3,28
providing information after arrival 3,96 3,91 3,96
helping with fi nding accommodation before arrival 3,19 3,39 3,21
helping with fi nding accommodation after arrival 3,29 3,37 3,30
helping with settling in a new place (visa, banking) 3,35 3,56 3,37
intervening on your behalf when having problems 3,58 3,66 3,59
getting in contact with local students 3,37 3,46 3,38
getting in contact with other exchange students 4,38 4,33 4,37
helping to understand more about the culture of the host country 3,83 3,85 3,83
practicing your foreign language skills 3,63 3,71 3,64
buddy/mentor/tutor system 3,62 3,57 3,62
tandem project/language exchange programme 3,43 3,32 3,43
organising trips and visiting tours 4,21 4,09 4,20
organising parties and informal meetings 4,26 4,18 4,26
informing about upcoming events 4,24 4,19 4,24
helping with fi nding a job 2,43 2,68 2,46
All the elements can be divided into two factors using principal component analysis9. Th e fi rst factor seemed to refl ect the problem-solving dimension of ESN’s
9 In order to interpret the data a principal component analysis was conducted on the correlations of the sixteen elements of ESN’s service. Two components were extracted with eigenvalues of more than one. Th e factors were rotated with both varimax and direct oblimin, giving essentially similar results. Th e two factors accounted for 68% of the total variance.

Research Report | 39
service (fi gure 37). Th e second factor appeared to represent the social dimension of ESN’s help (fi gure 38).
Figure 37. Problem-solving dimension of ESN’s service
Figure 38. Social dimension of ESN’s service
Both Erasmus and non Erasmus students were more satisfi ed with the social dimension of ESN’s service (fi gure 39). Th e discrepancy between satisfactions with both dimensions is larger for Erasmus students.

40 | The experience of studying abroad for exchange students in Europe
3,1 3,23,8 3,33
3,2
3,4
3,6
3,8
4
Erasmus non Erasmus
problem solving dimension
social dimension
Figure 39. Satisfaction with problem-solving and social dimension of ESN’s service among Erasmus and
non Erasmus students (n=1196)
Figure 40 shows that both dimensions of ESN’s service (social and problem-solving dimension) infl uence overall satisfaction. Th e problem-solving dimension has a more signifi cant impact on enhancing students’ satisfaction with the academic dimension of stay (third column) and satisfaction with studies abroad (fi fth column).
Figure 40. Interdependence between satisfactions with dimensions of ESN’s service and aspects of stay
(correlation coeffi cient)
*n=1205 ** n=219

Research Report | 41
Almost half of the students who did not use the help of either ESN or any other student organisation did so because they did not know that these organisations existed. Only one third declared that they did not need help (fi gure 41).
Figure 41. Reasons for not using help of ESN nor of other student organisation (n=4380)
8.4 Cultural dimension of stay
As it was said before, the cultural dimension is a very important one for students and it is both a motivation for going abroad and the main learning outcome. Cultural learning had two sources: local culture and local students, and contact with other exchange students.
When it comes to the contact with the local culture, 92% of respondents believed they have learned more about the culture of the host country and their satisfaction with this dimension was quite high: 74% of students declared that they are satisfi ed. Th e ratio of satisfi ed students was a bit lower for Erasmus students as compared with non Erasmus (73,9% and 76,3% respectively). Students were less satisfi ed with the contact with local students (Erasmus 49,1%, non Erasmus 54,4%).
What are the aspects that can enhance cultural learning?First of all, the knowledge of the local language is the key to the local culture.
Th ose who communicated in the local language at the university as well as outside of the university obtained higher scores of satisfaction with contact with local students and local culture.

42 | The experience of studying abroad for exchange students in Europe
Figure 42. Communication in the local language at the university and satisfaction with contact with
local students and local culture
Communication in the local language at the university
Satisfaction with contact with local students
Satisfaction with contact with the host country culture
Yes Mean 3,42 4,03
N 3882 3881
No Mean 3,31 3,8
N 1844 1844
Total Mean 3,38 3,96
N 5726 5725
Figure 43. Communication in the local language outside the university and satisfaction with contact
with local students and local culture
Communication in the local language outside the university
Satisfaction with contact with local students
Satisfaction with contact with the host country culture
Yes Mean 3,41 4,03
N 4331 4331
No Mean 3,3 3,75
N 1373 1372
Total Mean 3,39 3,96
N 5704 5703
What is more, extracurricular activity also aff ects both of these aspects. Th ose students who did internship or volunteer work during their exchange were more satisfi ed with their contacts with the local students and with the contact with the local culture.
Figure 44. Volunteer work and satisfaction with contact with local students and local culture
Volunteer work Satisfaction with contact with local students
Satisfaction with contact with the host country culture
Yes Mean 3,57 4
N 412 410
No Mean 3,37 3,95
N 4869 4871
Total Mean 3,38 3,96
N 5281 5281

Research Report | 43
38,1%
40,4%
57,2%
0% 10% 20% 30% 40% 50% 60% 70%
dissatisfied
neutral
satisfied
satisfied with contact with local students
satis
fact
ion
with
Bud
dyFigure 45. Internship and satisfaction with contact with local students and local culture
Internship Satisfaction with contact with local students
Satisfaction with contact with the host country culture
Yes Mean 3,55 4,09
N 645 646
No Mean 3,36 3,94
N 4646 4646
Total Mean 3,38 3,96
N 5291 5292
Th ird, a direct bridge to the local culture can be a Buddy – a personal mentor who assists a foreign student while s/he is abroad, starting from the arrival and even answering questions before leaving. Most ESN sections try to off er this service to some or all of their students. Th e more satisfi ed the students are with their Buddy, the more satisfi ed they are with the contact with local students (fi gure 46). It is important to assure the quality of this help: it seems crucial that students who arrive at the university have their own personal mentor who guides them and provides information, as well as helps to fi nd accommodation, a job and intervenes on their behalf when they face problems.
Figure 46. Satisfaction with Buddy/mentor system versus satisfaction with contact with local students
(n=1385)
Th e cultural dimension does not rely solely on the contact with the local culture. Interaction with other exchange students is also very important. ESN’s help in getting in contact with other exchange students was rated very highly, particularly by Erasmus students (see fi gure 35).

44 | The experience of studying abroad for exchange students in Europe
All students declared strong willingness to move to a foreign country. When asked about considering moving abroad, positive answers (“yes” and “defi nitely yes”) were given by 83% non Erasmus and 78% Erasmus students.
9. Studentsí mobility
Respondents’ mobility was measured with the following:• Th e longest period spent abroad before going on exchange;• Willingness to move to a foreign country (destination and period of stay);• Plans to continue studies in a foreign country;• Considering serious relationship with a person from a foreign country.
Almost all (84%) Erasmus students had been abroad before going on exchange. 41% had spent between one week and one month abroad. In comparison with other students more Erasmus students had been abroad before, but they had spent less time there. Figure 47. Period of staying abroad before going for exchange for Erasmus and non Erasmus students
(n=6769)
16 5 41 24 1420 3 26 28 220
5
10
15
20
25
30
35
40
45
50
never abroad less than a w eek 1 w eek - 1 month 1 month - 6 months more than 6months
perc
ent
Erasmus
non Erasmus

Research Report | 45
17 69 1418 68 140
10
20
30
40
50
60
70
80
90
100
permanently long not permanently short time
perc
ent
Erasmus
non Erasmus
3 4 15 31 473 3 11 25 580
5
10
15
20
25
30
35
40
45
50
definitely not rather not undecided rather yes definitely yes
perc
ent
Erasmus
non Erasmus
Figure 48. Considering moving abroad for Erasmus and non Erasmus students (n=6765)
Figure 49. Desired period of staying abroad for Erasmus and non Erasmus students (n=6299)

46 | The experience of studying abroad for exchange students in Europe
66
12
11
10
61
15
13
9
0 10 20 30 40 50 60 70
Europe
All over the w orld
Other
I do not know
percent
Erasmus non Erasmus
Most of the students would like to move to a place somewhere in Europe. Th e proportion is slightly higher for Erasmus students (66%) than for non Erasmus ones (61%). A relatively low group of respondents (15% of non Erasmus and 12% of Erasmus students) indicated that their desired destination is anywhere/all over the world. Th e results show that student mobility is limited to European countries and this trend is stronger among Erasmus students (fi gure 50).
Figure 50. Desired destination of moving abroad for Erasmus and non Erasmus students (n=6070)

Research Report | 47
Respondents vary a lot as far as the question about their plans to continue studies is concerned. Similar number of respondents answered “undecided”, “defi nitely yes” and “defi nitely not”. Students’ plans are strongly infl uenced by their age. Th e younger the respondent the more likely s/he is to consider continuing studies abroad.
Figure 51. Plans to continue studies in a foreign country (n=7754)
Figure 52. Plans to continue studies in a foreign country for respondents of diverse age categories (scale:
1 – defi nitely not, 5 – defi nitely yes; n=6550)
3,3 3,3 3,2 3 2,9 2,8 2,91
1,5
2
2,5
3
3,5
4
20 and less 21 22 23 24 25 26 and more
0% 5% 10% 15% 20%
definitely not
rather not
hard to say
rather yes
definitely yes
21%
14%
24%
19%
22%

48 | The experience of studying abroad for exchange students in Europe
3,8 41
2
3
4
5
CEE Western Europe
0,145
0,126
0,1
0,12
0,14
0,16
satisfaction with stay
Would you consider moving to aforeign country*
Serious relationship with a personfrom a foreign country**
Pea
rson
s' c
orre
latio
n co
effic
ient
57,3% of students would consider having a serious relationship with a person from another country (those from Western countries are more likely than their counterparts from CEE).
Figure 53. Considering serious relationship with a person from a foreign country
(scale: 1 – defi nitely not, 5 – defi nitely yes; n=6363)
* n = 6728 ** n = 6442
Th e future mobility indicators are infl uenced by students’ satisfaction with their stay. Students who are more satisfi ed are more likely to declare that they would consider moving abroad and that they would consider a serious relationship with a foreigner.
Figure 54. Th e infl uence of satisfaction with stay on a future mobility’s indicators

Research Report | 49
period of desired stay in a foreign country
for a short time
long, not permanently
permanently
Per
cent
80
60
40
20
0
Country of birth
France
Italy
Poland
14
60
20
10
68
17
10
71
12
Th ree countries were chosen in order to illustrate the infl uence of the country of birth on a declared mobility: France, Italy and Poland. Th ese countries had high numbers of respondents and vary as far as cultural factors are concerned. Students from France are the most mobile out of the analysed group of students. 71% of the respondents from this country who consider moving abroad would like to stay abroad for a longer time but not permanently (as compared to 68% for Italy and 60% for Poland). Respondents from Italy are situated in between students from France and Poland.
Figure 55. Desired period of staying abroad for students from France, Italy and Poland (n=2005)
At the same time, when asked about the length of desired stay abroad students from Poland declared more often that they would like to stay permanently abroad and less frequently that they would like to stay for long but not permanently. To conclude, students from Poland are less mobile but if they consider moving abroad they lean more often toward permanent migration.
Th e respondents from France and Italy declared more often their consideration of a serious relationship with a person from a foreign country than students from Poland (4,0 compared to 3,8 on 1-5 scale where 1 means “defi nitely not” and 5 means “defi nitely yes”).
50 | The experience of studying abroad for exchange students in Europe
10. RecommendationsWritten with Davide Capecchi, ESN President
Th ere is clear evidence, and therefore we recommend, that mobility of a higher quality for a lower number of students is better than one of lower quality for a higher number. We are concerned about this as it seems that the recent decision of the European Commission to increase the number of Erasmus students to 3.000.000 in the period 2007-2011 tends to link, as a mechanism, this impressive number with the success of the programme itself. We would like to stress that increasing the number of students should lead to an increase in funding and to a continuous eff ort to constantly improve the quality of the programme.
Examples from our survey confi rm that the Erasmus students who received no money at all were more satisfi ed than those who received a small and insuffi cient amount. Th is is an unambiguous signal for us to recommend concentrating scholarships on a lower number of students, and to support these with services of higher quality. Taking into account all assisting bodies, those students who were given frequent support from Erasmus Student Network or other student organisations, were more satisfi ed with the stay in general compared with those given less frequent support.
Th erefore, we state that the new generation of Erasmus students requires:– actions for fi nding a balance between diff erent groups, between the genders,
encouraging more disabled students to participate, supporting those of lower family status;
– that a project is undertaken to provide more equal access to the Erasmus programme for students coming from the Eastern and Central Europe compared to the Westerners;
– fostering the learning processes of the host language, both in the form of courses and through informal learning processes, with the aim of increasing the overall satisfaction with the stay and the level of cultural integration;
– a dramatic improvement in provision of information about the reality of what the student should expect in the host country; and more information about the programme in general prior to departure, as well as help with fi nding inexpensive and decent accommodation;

Research Report | 51
– tools for limiting the barriers between the Erasmus and the local students by fostering the initiative of the local students, as well as supporting and recognising the participation of exchange students in extracurricular activities such as internships and volunteer work;
– fi nally and consequently, to foster and auspicate creation of a student organisation which supports the mobility of students at all Higher Education Institutions that take part in the exchange programmes.
Given that 66% of Erasmus students declare that they would like to stay in Europe for a long (but not permanent) period after fi nishing their studies, in the framework of the Lisbon Strategy, and in view of the Erasmus Mundus programme, it would be worthy to consider corresponding data for students in other parts of the world, and compare them as a fl ux, in order to understand, also diachronically, how the attractiveness of the European Higher Education Area increases or decreases among the young generations. Th is would be a real indicator of the state of the Strategy as a whole.

52 | The experience of studying abroad for exchange students in Europe
Annex 1: ESN Survey Questionnaire
YOUR STUDY ABROAD EXPERIENCE
Dear Exchange Student!
Th e Erasmus Student Net work aims to ass ist each and every ex change student by making their stay at universities in Europe and bey ond as benefi cial and as enjoy able as poss ible. We would like you to help us in achieving thi s by providing us with information about your ex periences as an ex change student. It will help us improve our services for those wh o will study abroad in the future.
Please fi ll in the ques tionnaire below prepared by Erasmus Student Net work and Pet rus Communications. It consist s of 4 parts, and should take about 15-20 minutes to complet e. It i s anonymous, so you can be tot ally hones t.
WIN A TRAVEL VOUCHER WORTH 100 EUROS!All those wh o fully complet e the ques tionnaire, will have a chance to win one of 5 travel vouchers, each worth 100 Euros, for travel anywhere in Europe. Full det ails are provided at the end of the ques tionnaire.
PART 1. YOUR STAY AS AN EXCHANGE STUDENT
1. What is the name of university you are studying/studied at as an exchange student? (please refer to your most recent exchange) ..............................................................2. City where this university is located: ...................................................................3. Country where this university is located: ...........................................................4. When did you start your stay abroad? Month: ................ Year: ................5. How long was the period of your stay there? ................ Months
6. Th rough which program did you study abroad?a) Socrates/Erasmus Programb) Other:

Research Report | 53
7. Why did you decide to study abroad as an exchange student? Choose a maximum of three answers.
– to improve my academic knowledge– to study in a diff erent educational system– to have new experiences– to learn about diff erent cultures– to have fun– to meet new people
– to practice a foreign language– to be independent– to live in a foreign country– to develop as a person– to enhance future employment prospects– other:
8. During your stay, did you:
a) take courses at the university Yes No f) travel around the host country Yes No
b) work on your thesis Yes No g) work Yes No
c) do an independent study Yes No h) do an internship Yes No
d) take a language course Yes No i) do volunteer work Yes No
e) do laboratory work Yes No j) learn more about the culture of the host country Yes No
9. During your stay, did you communicate in:
a) the local language at the university Yes No c) English at the university Yes No
b) the local language outside the university Yes No d) English outside the university Yes No
10. How well did you know the language of the country you studied in before arrival? (1=not at all, 5=very well)
Not at all 1. 2. 3. 4. 5. Very well
11. How well do you know the language of the country you studied in now, after your stay?
Not at all 1. 2. 3. 4. 5. Very well
12. Amount of received grant/scholarship?
......................................... Euros/month13. What part of your overall expenses did the grant cover?
– Almost all of my expenses (more than 80%)– Most of my expenses (60-80%)– Around half of my expenses (40-60%)– Around a quarter of my expenses (20-40%)– A small part of my expenses (less than 20%)

54 | The experience of studying abroad for exchange students in Europe
14. Please evaluate the following aspects of your stay
very
dissatisfi ed
rather
dissatisfi ed
neither
dissatisfi ed
nor satisfi ed
rather
satisfi ed
very
satisfi ed
a) Courses at the university 1 2 3 4 5b) Professors 1 2 3 4 5c) University facilities 1 2 3 4 5d) Local language courses at the university 1 2 3 4 5e) Suffi ciency of information prior to your
studies abroad (from your home university) 1 2 3 4 5
f) Suffi ciency of information while studying
abroad (from your host university) 1 2 3 4 5
g) Help from International Offi ce at the
university 1 2 3 4 5
h) Financial situation 1 2 3 4 5i) Contacts with local students 1 2 3 4 5j) Contact with the host country’s culture 1 2 3 4 5k) Social life 1 2 3 4 5l) Th e atmosphere of the city and country
where the university is located 1 2 3 4 5
15. What is your overall level of satisfaction with your studies as an exchange student?
Very dissatisfi ed 1. 2. 3. 4. 5. Very satisfi ed
16. What is your overall level of satisfaction with your stay abroad as an exchange student?
Very dissatisfi ed 1. 2. 3. 4. 5. Very satisfi ed
17. Would you recommend a foreign exchange to your friends?
Defi nitely not 1. 2. 3. 4. 5. Defi nitely yes
18. What is the most important thing you learned as an exchange student?
PART 2. ABOUT ERASMUS STUDENT NETWORK (ESN)
19. Have you ever heard of Erasmus Student Network?a) Yesb) No – Go to question 29
Research Report | 55
20. If yes, how did you learn about it?a) from a friendb) from an ESN section at my home universityc) from the ESN section at the receiving universityd) from my International Relations Offi cee) on the internetf) other:
21. Is there an ESN section at your home university?a) Yesb) Noc) I don’t know
22. Is there an ESN section at your host university?a) Yesb) No – Go to question 29c) I don’t know – Go to question 29
23. During your stay as an exchange student, how often did you have contact with Erasmus Student Network?
a) several times a weekb) once a weekc) several times a monthd) once a monthe) less than once a monthf) never – Go to question 29
24. Please evaluate the help of ESN in the following areas.
very
dissatisfi ed
rather
dissatisfi ed
neither
dissatisfi ed
nor satisfi ed
rather
satisfi ed
very
satisfi ed
I did not
use (not
applicable)
a) providing information before
arrival 1 2 3 4 5 NA
b) providing information after
arrival 1 2 3 4 5 NA
c) helping with fi nding
accommodation before arrival 1 2 3 4 5 NA
d) helping with fi nding
accommodation after arrival 1 2 3 4 5 NA
e) helping with settling in a new
place (visa, banking) 1 2 3 4 5 NA
f) intervening on your behalf when
having problems 1 2 3 4 5 NA

56 | The experience of studying abroad for exchange students in Europe
very
dissatisfi ed
rather
dissatisfi ed
neither
dissatisfi ed
nor satisfi ed
rather
satisfi ed
very
satisfi ed
I did not
use (not
applicable)
g) getting in contact with local
students 1 2 3 4 5 NA
h) getting in contact with other
exchange students 1 2 3 4 5 NA
i) helping to understand more about
the culture
of the host country
1 2 3 4 5 NA
j) practicing your foreign language
skills 1 2 3 4 5 NA
25. Please evaluate the services of ESN
very
dissatisfi ed
rather
dissatisfi ed
neither
dissatisfi ed nor
satisfi ed
rather
satisfi ed
very
satisfi ed
I did not
use (not
applicable)a) buddy/mentor/tutor system 1 2 3 4 5 NAb) tandem project/language exchange program
1 2 3 4 5 NA
c) organising trips and visiting tours
1 2 3 4 5 NA
d) organising parties and informal meetings
1 2 3 4 5 NA
e) informing about upcoming events
1 2 3 4 5 NA
f) helping with fi nding a job 1 2 3 4 5 NA
26. Did ESN help you in any other way? How? In what area?
27. Were there any areas/issues where ESN could have provided you with additional assistance, but did not do so? Please explain.
28. What is your overall level of satisfaction with the help provided by the Erasmus Student Network?
Very dissatisfi ed 1. 2. 3. 4. 5. Very satisfi ed
29. Was there any other student organisation at your host university helping exchange students?
(please refer to the one that helped you most)a) Yes – name of organisation:

Research Report | 57
b) No – go to question 36c) I don’t know – go to question 36
30. During your stay as an exchange student, how often did you have contact with this organisation?
a) Several times a weekb) Once a weekc) Several times a monthd) Once a monthe) Less than once a monthf) Never – go to question 36
31. Please evaluate the help of this organisation in the following areas:
very dissatisfi ed
rather dissatisfi ed
neither dissatisfi ed nor satisfi ed
rather satisfi ed
very satisfi ed
I did not use (not
applicable)a) providing information before arrival
1 2 3 4 5 NA
b) providing information after arrival
1 2 3 4 5 NA
c) helping with fi nding accommodation before arrival
1 2 3 4 5 NA
d) helping with fi nding accommodation after arrival
1 2 3 4 5 NA
e) helping with settling in a new place (visa, banking)
1 2 3 4 5 NA
f) intervening on your behalf when having problems
1 2 3 4 5 NA
g) getting in contact with local students
1 2 3 4 5 NA
h) getting in contact with other exchange students
1 2 3 4 5 NA
i) helping to understand more about the culture of the host country
1 2 3 4 5 NA
j) practicing your foreign language skills
1 2 3 4 5 NA
32. Please evaluate the services of this organisation:
very dissatisfi ed
rather dissatisfi ed
neither dissatisfi ed nor satisfi ed
rather satisfi ed
very satisfi ed
I did not use (not
applicable)a) buddy/mentor/tutor system 1 2 3 4 5 NAb) tandem project/language exchange program
1 2 3 4 5 NA
c) organising trips and visiting tours
1 2 3 4 5 NA
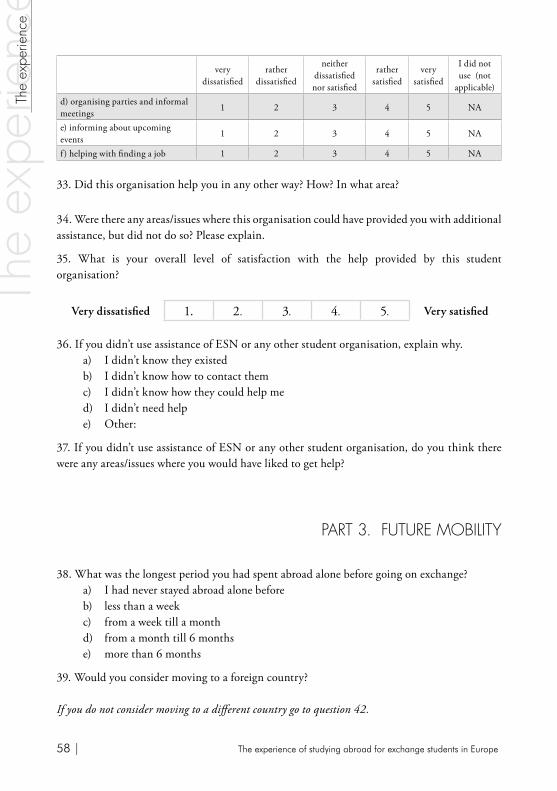
58 | The experience of studying abroad for exchange students in Europe
very dissatisfi ed
rather dissatisfi ed
neither dissatisfi ed nor satisfi ed
rather satisfi ed
very satisfi ed
I did not use (not
applicable)d) organising parties and informal meetings
1 2 3 4 5 NA
e) informing about upcoming events
1 2 3 4 5 NA
f) helping with fi nding a job 1 2 3 4 5 NA
33. Did this organisation help you in any other way? How? In what area?
34. Were there any areas/issues where this organisation could have provided you with additional assistance, but did not do so? Please explain.
35. What is your overall level of satisfaction with the help provided by this student organisation?
Very dissatisfi ed 1. 2. 3. 4. 5. Very satisfi ed
36. If you didn’t use assistance of ESN or any other student organisation, explain why.a) I didn’t know they existedb) I didn’t know how to contact themc) I didn’t know how they could help med) I didn’t need helpe) Other:
37. If you didn’t use assistance of ESN or any other student organisation, do you think there were any areas/issues where you would have liked to get help?
PART 3. FUTURE MOBILITY
38. What was the longest period you had spent abroad alone before going on exchange?a) I had never stayed abroad alone beforeb) less than a weekc) from a week till a monthd) from a month till 6 monthse) more than 6 months
39. Would you consider moving to a foreign country?
If you do not consider moving to a diff erent country go to question 42.

Research Report | 59
40. Where? ........................................
41. For how long?a) permanentlyb) long time, but not permanentlyc) for a short time
42. Do you plan to continue your studies in a foreign country?
Defi nitely not 1. 2. 3. 4. 5. Defi nitely yes
If you do not consider continuing your studies in the diff erent country go to question 44.
43. Where? ..............................
44. Do you have any other plans to work, travel, or live abroad? Describe them in a few words.
45. Would you consider being in a serious relationship with a person from a foreign country?
Defi nitely not 1. 2. 3. 4. 5. Defi nitely yes
PART 4. PERSONAL INFORMATION
46. Age: ...................
47. Gender:a) femaleb) male
48. Country of birth: .............................................
49. Home university: ..............................................
50. City where your home university is located: .......................................
51. Country where your home university is located: ..............................
52. Major/area of studies: .....................................................
53. Year of study at your home university: ................................................
54. Level/type of studies:a) BA (3-4 years)

60 | The experience of studying abroad for exchange students in Europe
b) MA (5-6 years) c) PhD, doctoral studies
55. Year of graduation: ...............................................
56. Are you a disabled student?a) Yesb) No
57. Are you married?a) Yesb) No
58. Who in your family has a higher education degree? (such as a university degree)a) Motherb) Fatherc) Bothd) None
59. Which phrase below best describes the area where your family lives?a) A big cityb) Th e suburbs of a big cityc) A town or a small cityd) A country villagee) A farm or home in the countryside
60. How would you describe your family’s income?a) Above my country averageb) Averagec) Below my country average
Th ank you for fi lling out the questionnaire!!!

Research Report | 61
Annex 2: List of fi gures
Figure 1. Main categories of students who took part in the survey (n=6975)
Figure 2. Region of birth of Erasmus and non Erasmus students (n=6004)
Figure 3. Country where the home university is located (n=5928)
Figure 4. Level of studies of Erasmus and non Erasmus students (n=6012)
Figure 5. Majors of Erasmus and non Erasmus students (n=6012)
Figure 6. Family’s income of Erasmus and non Erasmus students (n=6507)
Figure 7. Family’s income and the educational attainment of the parents (n=5853)
Figure 8. Who in family has a higher education degree? – family’s educational attainment for students from Western Europe and Central and Eastern Europe (n=5938)
Figure 9. Areas where the students’ family lives (n=5938)
Figure 10. Motivation for going abroad for Erasmus and non Erasmus students (n=6975)
Figure 11. Activities during the stay for all the respondents (n varies from 5975 to 6743)
Figure 12. During your stay, did you work on your thesis? Results for France, Italy and Poland (n=1978)
Figure 13. During your stay, did you work? Results for France, Italy and Poland (n=1930)
Figure 14. Language skills before and after stay and Language Acquisition Progress for Erasmus and non Erasmus students (n=6853)
Figure 15. Participation in the language courses by Erasmus and non Erasmus students (n=6853)
Figure 16. Language Acquisition Progress for those who participated in language courses and for those who did not participated (n=6465)
Figure 17. Communication in local language and in English at the university and outside the university for Erasmus and non Erasmus students
Figure 18. Variables describing students’ satisfaction (n=6700)
Figure 19. Students’ satisfaction with aspects of stay (n=6550)
Figure 20. Mean students’ satisfaction with aspects of stay (n=6550)
Figure 21. Th ree dimensions of stay abroad and their elements
Figure 22. Students’ satisfaction with dimensions of stay (n=6550)
Figure 23. Th e infl uence of the part of the overall expenses covered by the grant on the satisfaction with fi nancial situation (n=6707)
Figure 24. An average (mean) scholarship received by students from CEE and Western countries (n=5801)
Figure 25. Part of overall expenses covered by the grant for CEE students and students from Western European countries (n=5986)
Figure 26. An average (mean) scholarship received by Erasmus and non Erasmus students (n=6425)
Figure 27. Part of overall expenses covered by grant for Erasmus and non Erasmus students (n=6641)

62 | The experience of studying abroad for exchange students in Europe
Figure 28. Respondents’ satisfaction with specifi c aspects of host country
Figure 29. Ratio of respondents who declared that there is an ESN section at their host university (n=3806).
Figure 30. Ratio of respondents who declared that there was another student organisation helping exchange students at their host university (n=6528)
Figure 31. Respondents’ frequency of contact with ESN (n=2741)
Figure 32. Satisfaction with ESN and other student organisations (n=4002)
Figure 33. Th e infl uence of frequency of contact with ESN on satisfaction with ESN (n=2409)
Figure 34. Th e infl uence of frequency of contact with ESN on satisfaction with stay (n=2778)
Figure 35. Satisfaction with elements of ESN’s service for Erasmus and non Erasmus students (n=2287)
Figure 36. Mean scores of satisfaction with elements of ESN’s service for Erasmus and non Erasmus students and for both groups (n=2287)
Figure 37. Problem-solving dimension of ESN’s service
Figure 38. Social dimension of ESN’s service
Figure 39. Satisfaction with problem-solving and social dimension of ESN’s service among Erasmus and non Erasmus students (n=1196)
Figure 40. Interdependence between satisfactions with dimensions of ESN’s service and aspects of stay (correlation coeffi cient)
Figure 41. Reasons for not using help of ESN nor other student organisation (n=4380)
Figure 42. Communication in the local language at the university and satisfaction with contact with local students and local culture
Figure 43. Communication in the local language outside the university and satisfaction with contact with local students and local culture
Figure 44. Volunteer work and satisfaction with contact with local students and local culture
Figure 45. Internship and satisfaction with contact with local students and local culture
Figure 46. Satisfaction with Buddy/mentor system versus satisfaction with contact with local students (n=1385)
Figure 47. Period of staying abroad before going for exchange for Erasmus and non Erasmus (n=6769)
Figure 48. Considering moving abroad for Erasmus and non Erasmus students (n=6765)
Figure 49. Desired period of staying abroad for Erasmus and non Erasmus students (n=6299)
Figure 50. Desired destination of moving abroad for Erasmus and non Erasmus students (n=6070)
Figure 51. Plans to continue studies in a foreign country (n=7754)
Figure 52. Plans to continue studies in a foreign country for respondents of diverse age categories (n=6550)
Figure 53. Considering serious relationship with a person from a foreign country (n=6363)
Figure 54. Th e infl uence of satisfaction with stay on a future mobility’s indicators
Figure 55. Desired period of staying abroad for students from France, Italy and Poland (n=2005)

Research Report | 63
Annex 3: About ESN
Erasmus Student Network (ESN) is the widest European student organisation concerned with student mobility. We are a non-political, non-profi t and non-religious organisation counting with over 2500 members from 207 local sections in 28 countries. Our network provides its services annually to about 150.000 international students in Europe.
Th e aims of ESN
• To promote the social and personal integration of the exchange students• To represent the needs and expectations of exchange students on the local, national and
international level• To provide relevant information about academic exchange programs and student mobility
ESN is operating on three levels:
• 207 Local Sections. Every ESN Section is run by a Board, composed normally by President, Vice President, Secretary, Treasurer and Webmaster. In addition, many volunteers are helping in a variable number with the buddy/mentor programme, the language exchange and other similar activities;
• 28 Countries (Austria, Belgium, Cyprus, Czech Republic, Denmark, Estonia, Finland, France, Germany, Greece, Hungary, Ireland, Italy, Latvia, Lithuania, Morocco, Norway, Poland, Portugal, Romania, Slovak Republic, Slovenia, Spain, Sweden, Switzerland, the Netherlands, Turkey and the United Kingdom);
• International Level. Th e International Board is working in the new Headquarters in Brussels, rue du Trône 98.
Th e 207 Local ESN Sections, even if in a broad variation one to another, are off ering daily help and guidance to a number of exchange students that ranges from 80.000 to 150.000. Such help is provided before and during the stay abroad. Namely, the services generally off ered at a local level are
• Mentor Program• Orientation Week• Help in fi nding accommodation• Language exchange• Help with visas, banking, and any other relevant practical issues• Parties and trips around host country• Informal meetings and gatherings• Information to local students about opportunities of exchange.ESN has developed important projects at the international level, like a survey on
students’ satisfaction. Our Membership card has been produced in 35.000 exemplars and distributed around Europe to 32.000 exchange students (at the date). We were invited and actively participated in many international events and numerous local conferences meant to refl ect and to elaborate suggestions upon issues related with mobility and in general the governance of Higher Education in the European Higher Education Area.
Contact us:Erasmus Student Network c\o CRUI-CNRRue du Trone, 98 B-1050 Brussels Belgium
tel.: +32 (0) 2 2902 271 fax: +32 (0) 2 2902 280www.esn.org | e-mail: [email protected]

64 | The experience of studying abroad for exchange students in Europe
Annex 4: About Petrus Communications
Petrus Communications Specialises in market research and direct marketing among students and recent
graduates all over Europe. Our aim is to help graduate recruiters, educational institutions and organisations understand and engage with students to achieve their recruitment objectives.
What Petrus DoesEducation in Europe is changing rapidly, as are the communication tools used by students
and those who advise and teach them. When designing communication campaigns, or advising on target institutions, we don’t just look at the students themselves, but the broader issues aff ecting their decisions.
We off er services in two broad areas:
Market Research– Desk research and market information– Focus groups and student panels– Online and face to face surveys.
Direct and Campus Marketing– Organising events and campus activities– Implementing Email and web campaigns– Facilitating partnerships with institutions and organisations.
Petrus off ers tailor made or off the shelf services which range from getting posters put up in 10 countries, to developing a pan European business game or partnerships with key target institutions.
If you would be interested in having a more detailed analysis on the survey data, please contact Petrus Communications.
Kirsten Williamson, Managing DirectorPetrus CommunicationsStudio Albatros52 Rue du Sergent Bobillot93100 Montreuil-sous-BoisParis, Francetel. +33 (0)1 48 58 39 14fax. +33 (0)1 48 58 52 [email protected]


