ESMA Annual Statistical Report EU Derivatives Markets · ESMA Annual Statistical Report on EU...
57
ESMA Annual Statistical Report EU Derivatives Markets 2019 9 December 2019 ESMA 50-157-2025
Transcript of ESMA Annual Statistical Report EU Derivatives Markets · ESMA Annual Statistical Report on EU...
ESMA Annual Statistical Report
EU Derivatives Markets 2019
9 December 2019
ESMA 50-157-2025

ESMA Annual Statistical Report on EU Derivatives Markets 2019 2
ESMA Annual Statistical Report on EU Derivatives Markets 2019
© European Securities and Markets Authority, Paris, 2019. All rights reserved. Brief excerpts may be reproduced or translated provided the source is cited adequately. The reporting period of this document is 1 January 2018 to 31 December 2018, unless indicated otherwise. Legal reference of this report: Regulation (EU) No 1095/2010 of the European Parliament and of the Council of 24 November 2010 establishing a European Supervisory Authority (European Securities and Markets Authority), amending Decision No 716/2009/EC and repealing Commission Decision 2009/77/EC, Article 32 ‘Assessment of market developments’, 1. ‘The Authority shall monitor and assess market developments in the area of its competence and, where necessary, inform the European Supervisory Authority (European Banking Authority), and the European Supervisory Authority (European Insurance and Occupational Pensions Authority), the ESRB and the European Parliament, the Council and the Commission about the relevant micro-prudential trends, potential risks and vulnerabilities. The Authority shall include in its assessments an economic analysis of the markets in which financial market participants operate, and an assessment of the impact of potential market developments on such financial market participants.’ This report contributes to ESMA’s risk assessment activities. The report and its contents do not prejudice or impair ESMA’s regulatory, supervisory or convergence activities, or the obligations of market participants thereunder. Charts and analyses in this report are based on data provided by trade repositories to ESMA under the European Market Infrastructure Regulation (EMIR) and on other data that are publicly available (e.g. Legal Entity Identifier (LEI) data provided by the Global Legal Entity Identifier Foundation (GLEIF) and euro-exchange rates provided by the ECB).ESMA uses these data in good faith and does not take responsibility for their accuracy or completeness. ESMA is committed to constantly improving its data sources and reserves the right to alter data sources at any time.
ISBN 978-92-95202-28-3 ISSN 2599-8331 DOI 10.2856/00897 EK-AB-19-001-EN-N
European Securities and Markets Authority (ESMA) Risk Assessment and Economics Department 201-203 Rue de Bercy FR-75012 Paris [email protected]

ESMA Annual Statistical Report on EU Derivatives Markets 2019 3
Table of contents
Executive summary 4
Market monitoring 6
Market structure ................................................................................................................ 7
Market trends .................................................................................................................. 19
Statistical methods 25
Data quality improvements .............................................................................................. 26
Intragroup transactions .................................................................................................... 30
Derivatives statistics 39
Market structure .............................................................................................................. 40
Market trends .................................................................................................................. 44
Annex 52
Statistical annotations ..................................................................................................... 53
Glossary .......................................................................................................................... 54
List of abbreviations ........................................................................................................ 56

ESMA Annual EU Derivatives Markets Report 2019 4
Executive summary
Market monitoring
Market structure: The EU derivatives market at the end of 2018 had EUR 735tn in total notional amount
outstanding in 66mn open trades. Over 85% of the notional amount was held by investment firms, credit
institutions and central counterparties (CCPs). About 10% of total notional amount was between
counterparties in the same group (EUR 78tn). The market continued to be dominated by interest rate
derivatives (IRDs) at 76% of notional amount. About 15% of the notional amount was in currency, with
another 6% in equity, credit and commodities. Over-the-counter (OTC) contracts accounted for 90% of
outstanding notional amount in 4Q18 with the remainder in exchange traded derivatives (ETDs). However,
7% of the total notional amount was in OTC contracts executed on trading venues with characteristics
comparable to ETD. For IRDs 63% of the outstanding notional amount was centrally cleared, with 25%
cleared for credit derivatives (CDs). The UK remained at the centre of derivative trading in Europe and with
third countries.
Market trends: Key trends in European derivatives markets in 2018 included: growth in the total notional
amount from EUR 665tn in 1Q18 to EUR 735tn by 4Q18. Central clearing rates grew for IRDs outstanding
from 61% to 63% and ended 2018 broadly unchanged for CDs at 25%. Rates of clearing for recently
executed contracts were higher (at around 80% for IRDs and 50% for CDs). The proportion of ETD contracts
over all assets was stable at around 10% through the year. However, OTC contracts executed on trading
venues grew strongly for currencies, IRDs and CDs, and over all asset classes grew from 3% to 7% of
notional amount. Interconnectedness tended to decrease slightly but remained high in all asset classes.
Finally, the proportion of short maturities (less than one year) over all asset classes fell in 4Q18 because of
fewer short maturities in credit, commodities and currencies. The distribution of maturities remained stable
for other asset classes.
Statistical methods
Data quality improvements: EMIR data are vast and contain detailed information about European derivatives
markets. The data are based on reports from EEA counterparties that are provided to trade repositories
(TRs), which in turn report to ESMA. An important change for this year’s report was the implementation of
new RTS and ITS in November 2017 which significantly increased data usability and quality. To assess the
post-RTS/ITS data, we performed several analyses of data quality. This revealed that reporting in 2018 was
not always consistent. We identified very substantial over-reporting to one TR by some counterparties during
1H18 and several other cases of inconsistent reporting. For the purpose of this statistical report, data
cleaning and correction methods were developed and applied to correct this. The descriptive statistics of the
data after cleaning and correction suggest that the data used for this report are of a comparable level of
quality to those of last year’s report.
Intragroup transactions: Intragroup transactions under EU regulation are those between two entities in the
same group, subject to certain conditions. They help firms to minimise costs and manage risks (e.g. liquidity,
currency risks) within the group and in many cases between jurisdictions. Intragroup usage is higher in equity
markets (27% of the total notional amount in equities), in commodities (24%) and in currency markets (19%).
Usage is lower in credit (10%) and in interest rate derivatives (7%). Instruments particularly used in
intragroup transactions are equity options, which make up 86% of the total intragroup notional amount in
equities, currency CFDs, which make up 41% of the currency total, and commodity swaps which make up
56% of the total notional amount for intragroup commodity derivatives. Investment firms, non-financials and
credit institutions are the main users of intragroup trades. As expected, CCPs are absent given the
exemption from mandatory clearing for these trades. Finally, the analysis of intragroup transactions in
products subject to mandatory clearing reveals that a substantial part of intragroup trading occurs between
UK and third-country legal entities in the same group, with the UK serving as an entry point to EU markets.
ESMA Annual EU Derivatives Markets Report 2019 5
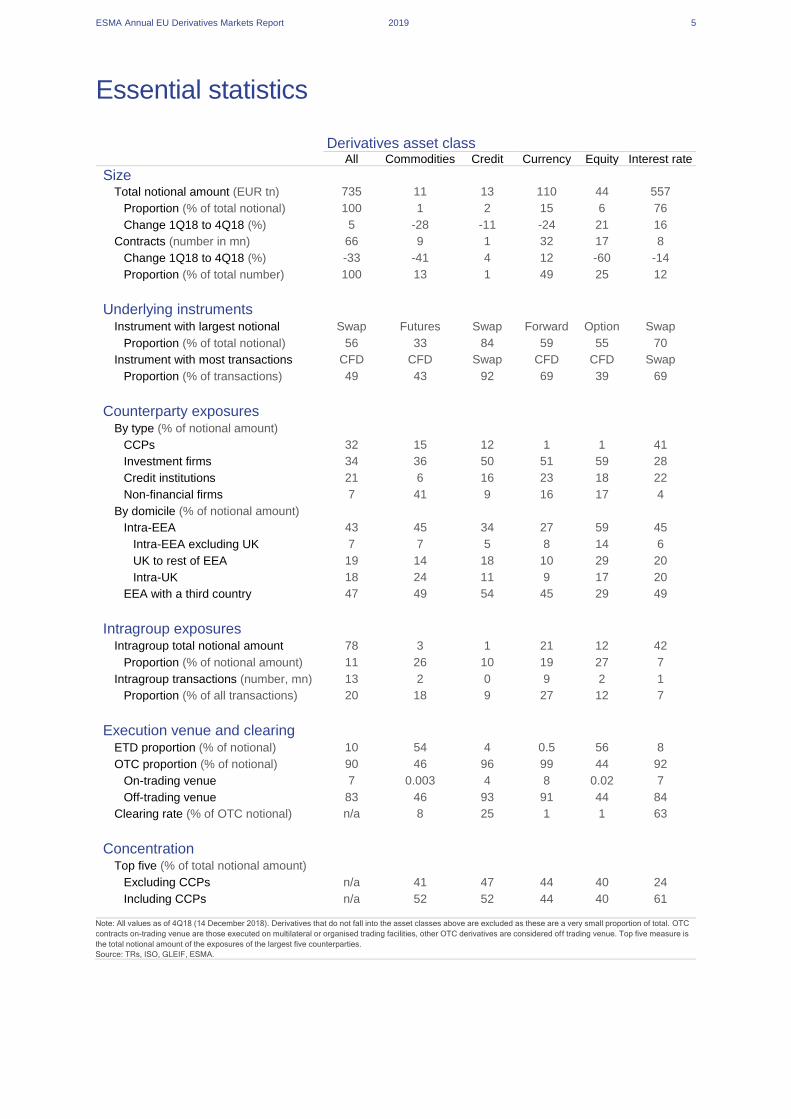
Essential statistics
Derivatives asset class
All Commodities Credit Currency Equity Interest rate
Size Total notional amount (EUR tn) 735 11 13 110 44 557
Proportion (% of total notional) 100 1 2 15 6 76
Change 1Q18 to 4Q18 (%) 5 -28 -11 -24 21 16
Contracts (number in mn) 66 9 1 32 17 8
Change 1Q18 to 4Q18 (%) -33 -41 4 12 -60 -14
Proportion (% of total number) 100 13 1 49 25 12
Underlying instruments
Instrument with largest notional amount
Swap Futures Swap Forward Option Swap
Proportion (% of total notional) 56 33 84 59 55 70
Instrument with most transactions CFD CFD Swap CFD CFD Swap
Proportion (% of transactions) 49 43 92 69 39 69
Counterparty exposures By type (% of notional amount)
CCPs 32 15 12 1 1 41
Investment firms 34 36 50 51 59 28
Credit institutions 21 6 16 23 18 22
Non-financial firms 7 41 9 16 17 4
By domicile (% of notional amount)
Intra-EEA 43 45 34 27 59 45 Intra-EEA excluding UK 7 7 5 8 14 6 UK to rest of EEA 19 14 18 10 29 20 Intra-UK 18 24 11 9 17 20
EEA with a third country 47 49 54 45 29 49
Intragroup exposures
Intragroup total notional amount (EUR tn)
78 3 1 21 12 42
Proportion (% of notional amount) 11 26 10 19 27 7
Intragroup transactions (number, mn) 13 2 0 9 2 1
Proportion (% of all transactions) 20 18 9 27 12 7
Execution venue and clearing
ETD proportion (% of notional) 10 54 4 0.5 56 8
OTC proportion (% of notional) 90 46 96 99 44 92
On-trading venue 7 0.003 4 8 0.02 7
Off-trading venue 83 46 93 91 44 84
Clearing rate (% of OTC notional) n/a 8 25 1 1 63
Concentration
Top five (% of total notional amount)
Excluding CCPs n/a 41 47 44 40 24
Including CCPs n/a 52 52 44 40 61
Note: All values as of 4Q18 (14 December 2018). Derivatives that do not fall into the asset classes above are excluded as these are a very small proportion of total. OTC
contracts on-trading venue are those executed on multilateral or organised trading facilities, other OTC derivatives are considered off trading venue. Top five measure is
the total notional amount of the exposures of the largest five counterparties.
Source: TRs, ISO, GLEIF, ESMA.

Market monitoring
ESMA Annual Statistical Report on EU Derivatives Markets 2019 7
Market structure The EU derivatives market at the end of 2018 had EUR 735tn in total notional amount outstanding in 66mn
open trades. Over 85% of the notional amount was held by investment firms, credit institutions and central
counterparties (CCPs). About 10% of total notional amount was between counterparties in the same group
(EUR 78tn). The market continued to be dominated by interest rate derivatives (IRDs) at 76% of notional
amount. About 15% of the notional amount was in currency, with another 6% in equity, credit and
commodities. Over-the-counter (OTC) contracts accounted for 90% of outstanding notional amount in 4Q18
with the remainder in exchange traded derivatives (ETDs). However, 7% of the total notional amount was in
OTC contracts executed on trading venues with characteristics comparable to ETD. For IRDs 63% of the
outstanding notional amount was centrally cleared, with 25% cleared for credit derivatives (CDs). The UK
remained at the centre of derivative trading in Europe and with third countries.
The EU derivatives market in 20181
In 4Q18 there were 66mn open derivative
transactions (covering trades and positions).
Overall, these accounted for a total notional
amount outstanding of around EUR 735tn,
including both OTC and ETDs, and presented an
11% increase from the EUR 660tn we reported
for 4Q17.2
In this year’s report we also identify intragroup
transactions,3 those between counterparties in
the same group. These account for just under
EUR 80tn in aggregate notional amount and
about 13m of the transactions outstanding.
Therefore, excluding those reported as
intragroup, the total number of transactions in
4Q18 is about 53mn and the total notional
amount outstanding is about EUR 655tn.
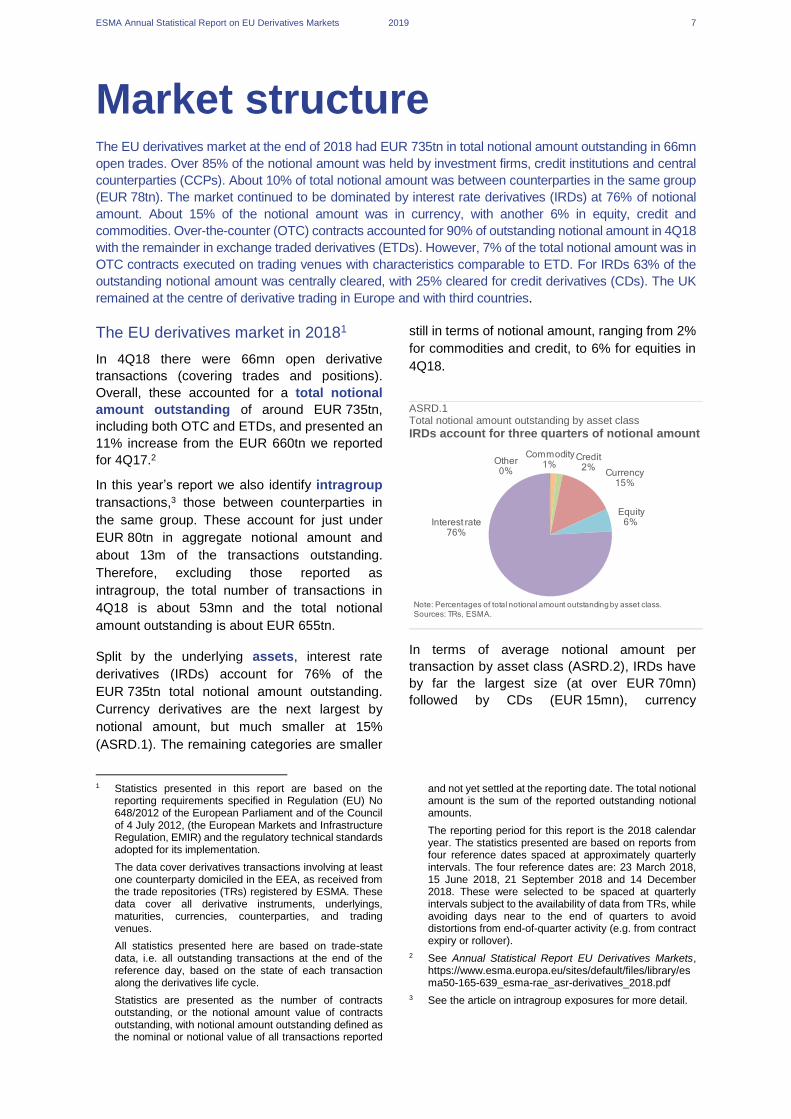
Split by the underlying assets, interest rate
derivatives (IRDs) account for 76% of the
EUR 735tn total notional amount outstanding.
Currency derivatives are the next largest by
notional amount, but much smaller at 15%
(ASRD.1). The remaining categories are smaller
1 Statistics presented in this report are based on the
reporting requirements specified in Regulation (EU) No 648/2012 of the European Parliament and of the Council of 4 July 2012, (the European Markets and Infrastructure Regulation, EMIR) and the regulatory technical standards adopted for its implementation.
The data cover derivatives transactions involving at least one counterparty domiciled in the EEA, as received from the trade repositories (TRs) registered by ESMA. These data cover all derivative instruments, underlyings, maturities, currencies, counterparties, and trading venues.
All statistics presented here are based on trade-state data, i.e. all outstanding transactions at the end of the reference day, based on the state of each transaction along the derivatives life cycle.
Statistics are presented as the number of contracts outstanding, or the notional amount value of contracts outstanding, with notional amount outstanding defined as the nominal or notional value of all transactions reported
still in terms of notional amount, ranging from 2%
for commodities and credit, to 6% for equities in
4Q18.
ASRD.1 Total notional amount outstanding by asset class
IRDs account for three quarters of notional amount
In terms of average notional amount per
transaction by asset class (ASRD.2), IRDs have
by far the largest size (at over EUR 70mn)
followed by CDs (EUR 15mn), currency
and not yet settled at the reporting date. The total notional amount is the sum of the reported outstanding notional amounts.
The reporting period for this report is the 2018 calendar year. The statistics presented are based on reports from four reference dates spaced at approximately quarterly intervals. The four reference dates are: 23 March 2018, 15 June 2018, 21 September 2018 and 14 December 2018. These were selected to be spaced at quarterly intervals subject to the availability of data from TRs, while avoiding days near to the end of quarters to avoid distortions from end-of-quarter activity (e.g. from contract expiry or rollover).
2 See Annual Statistical Report EU Derivatives Markets, https://www.esma.europa.eu/sites/default/files/library/esma50-165-639_esma-rae_asr-derivatives_2018.pdf
3 See the article on intragroup exposures for more detail.
Commodity1%
Credit2%
Currency15%
Equity6%Interest rate
76%
Other0%
Note: Percentages of total notional amount outstanding by asset class.
Sources: TRs, ESMA.

ESMA Annual Statistical Report on EU Derivatives Markets 2019 8
(EUR 3.4mn), equities (EUR 3mn) and
commodities (EUR 1.2mn).4
ASRD.2 Notional amount per transaction by asset class
IRDs have the largest notional amount per transaction
The relative proportions of notional amount
outstanding are similar to a year earlier, except
that 8% of notional amount categorised in 4Q17
as ‘other’ or ‘unclassified’ has moved to explicit
categories in 2018, in particular to the IRD and
currency categories. This improved reporting is
likely to be due in part to the Regulatory Technical
Standards (RTS) implemented in November
2017.
ASRD.3 New Regulatory Technical Standards came into effect
Improved reporting standards
On 1 November 2017 a new EMIR RTS came into effect.5
Along with the implementing technical standards (ITS), these
introduced major reporting changes. These included:
— improved reporting on derivative product types (e.g. adding swaptions, spreadbets, consistent instrument categories for ETD and OTC);
— more comprehensive and detailed reporting on collateral (e.g. initial margin, variation margin, excess collateral reporting);
— new reporting for credit default swaps (e.g. on seniority, reference entities, attachment and detachment points);
— position- and transaction-level reporting;
— refinements to identify buyer and seller counterparties;
— improved validation to enhance reporting quality, for example on counterparties.
The changes resulting from the RTS mean that we are
receiving large amounts of new data and information. This
annual report begins the task of presenting statistics based on
this new information. However, given the scale of the data, this
4 Note that as transactions can include positions which
combine multiple trades and net notional amount, the metric of average size here is more informative as to the relative size of trades between asset classes, rather than on the average amount per trade.
5 Commission Delegated Regulation (EU) 2017/104 https://eur-lex.europa.eu/legal-content/EN/TXT/ PDF/?uri=CELEX:32017R0104&from=EU.
6 Some over-reporting of trades was identified in the 2018 data. In particular, a disproportionate number of trades were reported to a particular TR in 1H18. The Statistical
will be an ongoing process. For example, statistics on collateral
and trade activity will be developed for future reports.
In addition, the RTS changes, and the challenges TRs and reporting counterparties faced in adjusting to them, will mean there are structural differences in EMIR data before and after 1 November 2017. These may affect comparisons between this report and last year’s annual report.
The distribution of derivative instruments looks
quite different in terms of the number of
transactions6 compared with notional amounts.
Under this size metric, currency derivatives
accounted for just under half (49%) of the
outstanding trades reported to us in 4Q18, equity
derivatives accounted for 25%, commodities
accounted for 13%, IRDs accounted for 12%, and
credit derivatives accounted for 1% (ASRD.4).
ASRD.4 Number of transactions by asset class
Currencies account for half of transactions
The distribution of total notional amount in terms
of the currency of denomination was similar to
4Q17, with 43% in USD, 31% in EUR and 11% in
GBP (ASRD.5). As expected, given that IRDs
account for most of the notional amount, these
proportions were driven by the distribution of
currencies for IRDs (39% in USD, 32% in EUR
and 11% in GBP).
For currency derivatives, the distribution in 4Q18
was 63% in USD, 30% in EUR and 4% in GBP.
Commodities were largely denominated in USD,
with 86% of the total notional amount associated
with contracts in USD, 10% in EUR and 3% in
GBP. CDs were almost evenly split between EUR (50%) and USD (48%). Equity derivatives were
the most diversified, reflecting the geographical
Methods article in this report provides details on the over-reporting identification and data-cleaning steps taken. In addition, in the 4Q18 statistics there is also a significant drop in the number of trades reported to the same TR in some asset classes. This appears to be a correction to remove data that were over-reported to that TR. Given this, the cleaning needed earlier in 2018 and the structural break resulting from the new RTS, in this report we refrain from comparing the numbers of transactions in 4Q18 and 4Q17, as these may be unrepresentative. Comparisons focus instead on notional amounts.
0
20
40
60
80
CR CO CU EQ IR
Note: Notional amount per outstanding transaction in EUR millions. CR - credit,CO - commodity, CU - currency, EQ - equity, and IR - interest rate.Sources: TRs, ESMA.
Commodity13%
Credit1%
Currency49%
Equity25%
Interest rate12%
Other0%
Note: Percentages of outstanding derivative contracts by asset class.
Sources: TRs, ESMA.

ESMA Annual Statistical Report on EU Derivatives Markets 2019 9
diversity of the underlying equities. Here the
distribution was 32% in USD, 26% in EUR, 19%
in GBP and 13% in JPY.
ASRD.5 Total notional amount by currency of denomination
US dollar and Euro dominate in each asset class
Following the implementation of the new RTS,
entities now report contract types with more
granularity (ASRD.6). Before the RTS, there were
five main types of derivatives contracts: forwards,
futures, options, swaps and contracts for
difference (CFDs). With the new RTS, two
reporting categories were added: swaptions and
spreadbets.7
ASRD.6 Total notional amount by contract type
Swaps dominate IRDs and credit, forwards dominate currency, options dominate equity
Overall, the distribution of notional amount by
contract type and instrument has not changed
much since the previous report, except for
changes that are due to the improved
categorisation from the new RTS.
Swaps accounted for the vast majority of notional
amount among both IRDs (70%) and CDs (84%)
(ASRD.6). They also accounted for over a quarter
(29%) of the notional amount in commodities. As
a result of the relatively large proportion of
7 A swaption provides the buyer with the option to enter into
a swap. Spreadbets are similar to CFDs but have an expiry date and a different tax treatment in some jurisdictions. For further details on spreadbets see, for
notional amount in IRDs, more than half of the
overall notional amount (56%) was in swaps.
Forward rate agreements (FRAs) accounted for
14% of IRD notional amount at the end of 2018.
Forwards dominated currency derivatives at 59%
of the total notional amount and accounted for 9%
of the notional amount in commodities. Futures
accounted for the largest amount of notional
amount in commodities at 33%. In equities
futures accounted for 25% of the notional
amount.
Options were by far the largest instrument by
notional amount in equities, accounting for 55%
of the total notional amount. They were also the
second largest instrument in commodities,
accounting for about 26% of the total notional
amount there. Swaptions, one of the new RTS
categories, accounted for 9% and 4% of the
notional amount in credit derivatives and IRDs
respectively.
CFDs accounted for 22% of the notional amount
in currency derivatives, 3% in equities and 4% of
the overall notional amount. In contrast,
spreadbets – which are similar to CFDs – only
accounted for a very small amount of the overall
notional amount. Their notional amount was
almost entirely in equities, where they accounted
for only 0.07% of the notional amount.
The asset and instrument type together provide
an indication of the largest derivative markets by
notional amount in 4Q18 (ASRD.7). The four
largest markets by notional amount (interest rate
swaps, interest rate FRAs, currency forwards and
interest rate options) account for over 75% of the
total notional amount at the end of 2018.
In terms of the numbers of outstanding
transactions, CFDs are the most common (49%),
followed by swaps (16%), forwards (11%),
futures (11%) and options (8%). Within asset
classes, swaps account for most of the
transactions in IRDs (69%) and credit (93%).
CFDs are the most numerous in currency (69%),
commodities (43%) and equity (39%). Forwards
are also relatively numerous among currency
transactions (21%). Options also account for a
significant proportion of equity derivatives (25%).
example, https://www.etxcapital.com/en-gb/education/learn-spread-betting/spread-betting-versus-CFDs.
0%
20%
40%
60%
80%
100%
All CO CR CU EQ IR
AUD CAD EUR GBP JPY USD
Note: Proportions of total notional amount outstanding by currency and asset
class, in %.Sources: TRs, ESMA.
0%
20%
40%
60%
80%
100%
All CO CR CU EQ IRCFD Forward FRA Futures Option
Spreadbet Swap Swaption OtherNote: Proportions of total notional amount outstanding by contract type and asset
class, in %.Sources: TRs, ESMA.
ESMA Annual Statistical Report on EU Derivatives Markets 2019 10
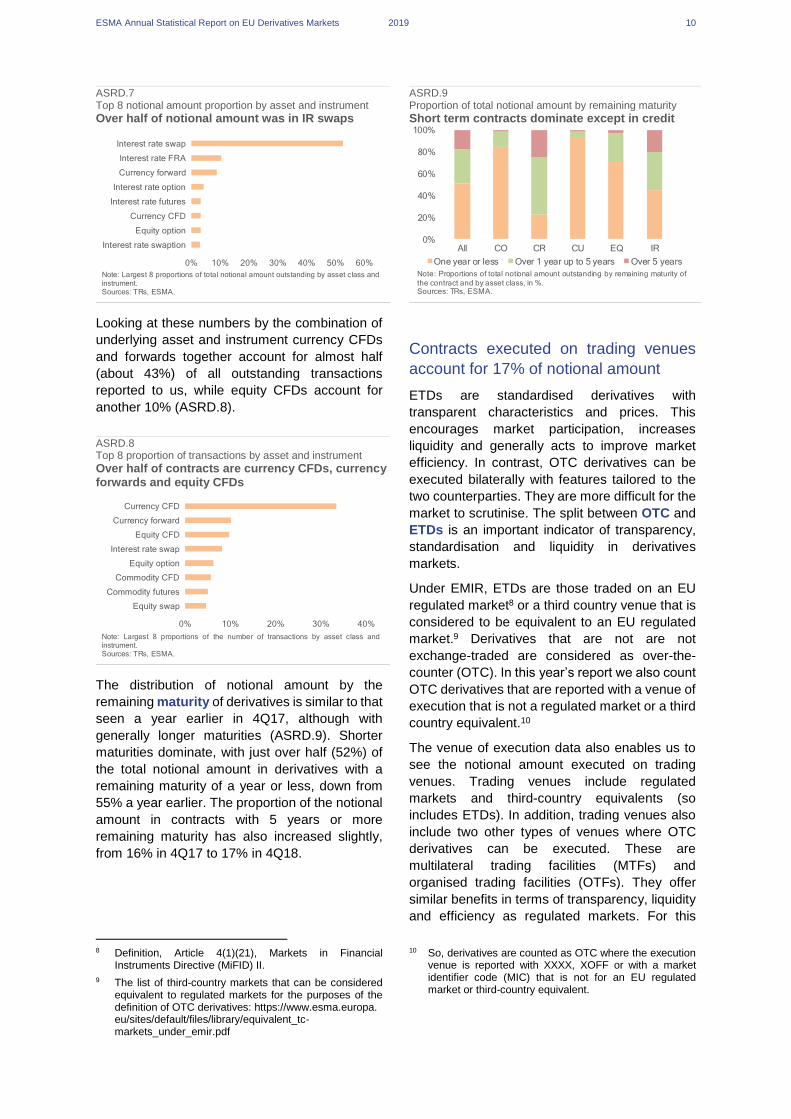
ASRD.7 Top 8 notional amount proportion by asset and instrument
Over half of notional amount was in IR swaps
Looking at these numbers by the combination of
underlying asset and instrument currency CFDs
and forwards together account for almost half
(about 43%) of all outstanding transactions
reported to us, while equity CFDs account for
another 10% (ASRD.8).
ASRD.8 Top 8 proportion of transactions by asset and instrument
Over half of contracts are currency CFDs, currency forwards and equity CFDs
The distribution of notional amount by the
remaining maturity of derivatives is similar to that
seen a year earlier in 4Q17, although with
generally longer maturities (ASRD.9). Shorter
maturities dominate, with just over half (52%) of
the total notional amount in derivatives with a
remaining maturity of a year or less, down from
55% a year earlier. The proportion of the notional
amount in contracts with 5 years or more
remaining maturity has also increased slightly,
from 16% in 4Q17 to 17% in 4Q18.
8 Definition, Article 4(1)(21), Markets in Financial
Instruments Directive (MiFID) II.
9 The list of third-country markets that can be considered equivalent to regulated markets for the purposes of the definition of OTC derivatives: https://www.esma.europa.eu/sites/default/files/library/equivalent_tc-markets_under_emir.pdf
ASRD.9 Proportion of total notional amount by remaining maturity
Short term contracts dominate except in credit
Contracts executed on trading venues
account for 17% of notional amount
ETDs are standardised derivatives with
transparent characteristics and prices. This
encourages market participation, increases
liquidity and generally acts to improve market
efficiency. In contrast, OTC derivatives can be
executed bilaterally with features tailored to the
two counterparties. They are more difficult for the
market to scrutinise. The split between OTC and
ETDs is an important indicator of transparency,
standardisation and liquidity in derivatives
markets.
Under EMIR, ETDs are those traded on an EU
regulated market8 or a third country venue that is
considered to be equivalent to an EU regulated
market.9 Derivatives that are not are not
exchange-traded are considered as over-the-
counter (OTC). In this year’s report we also count
OTC derivatives that are reported with a venue of
execution that is not a regulated market or a third
country equivalent.10
The venue of execution data also enables us to
see the notional amount executed on trading
venues. Trading venues include regulated
markets and third-country equivalents (so
includes ETDs). In addition, trading venues also
include two other types of venues where OTC
derivatives can be executed. These are
multilateral trading facilities (MTFs) and
organised trading facilities (OTFs). They offer
similar benefits in terms of transparency, liquidity
and efficiency as regulated markets. For this
10 So, derivatives are counted as OTC where the execution venue is reported with XXXX, XOFF or with a market identifier code (MIC) that is not for an EU regulated market or third-country equivalent.
0% 10% 20% 30% 40% 50% 60%
Interest rate swap
Interest rate FRA
Currency forward
Interest rate option
Interest rate futures
Currency CFD
Equity option
Interest rate swaption
Note: Largest 8 proportions of total notional amount outstanding by asset class andinstrument.Sources: TRs, ESMA.
0% 10% 20% 30% 40%
Currency CFD
Currency forward
Equity CFD
Interest rate swap
Equity option
Commodity CFD
Commodity futures
Equity swap
Note: Largest 8 proportions of the number of transactions by asset class andinstrument.Sources: TRs, ESMA.
0%
20%
40%
60%
80%
100%
All CO CR CU EQ IR
One year or less Over 1 year up to 5 years Over 5 years
Note: Proportions of total notional amount outstanding by remaining maturity of
the contract and by asset class, in %.Sources: TRs, ESMA.

ESMA Annual Statistical Report on EU Derivatives Markets 2019 11
reason, these OTC derivatives – executed on
trading venues – are arguably more like ETDs
than conventional OTC contracts executed
bilaterally.11
In 4Q18, ETDs accounted for 10% of the total
notional amount, on-trading-venue OTC
derivatives for 7%, and off-trading-venue OTC
derivatives for 83% (ASRD.10). The proportion of
ETDs is similar to the 11% we reported for 4Q17.
ASRD.10 ETD versus OTC proportion of total notional amount
OTC dominates except in commodities and equities
Looking at the split by underlying asset class
(ASRD.10), commodities and equities have
relatively large proportions of ETDs. This is to be
expected given the greater proportion of
instruments in these asset classes, such as
futures, that are traded on regulated markets. As
of 4Q18, the proportion of notional amount in
ETDs exceeded that for OTC contracts in both
with 56% ETDs for equity, and 54% ETDs for
commodities. These compare with corresponding
proportions of ETDs in 4Q17 of 47% and 35% for
equities and commodities respectively.
In other classes, OTC derivatives still account for
most of the notional amount outstanding and
show little change from a year earlier, even with
OTCs on trading venues included in 2018.
Notional amount proportions for OTCs were 92%
for IRDs, 99% for currency, 97% for credit
derivatives in 4Q18 (ASRD.10). The
corresponding OTC proportions in 4Q17, which
do not include OTCs on trading venues, were
11 In what follows, we described OTC derivatives traded on
MTFs or OTFs as ‘on trading venue’; other OTC contracts are described as ‘off trading venue’. This terminology follows the EMIR definition of OTC, which may not be consistent with MiFID II usage. In MiFID II contexts, OTC can exclude contracts traded on trading venues. This is the case, for example, in the ESMA Questions and Answers on MiFID II and MiFIR investor protection and intermediaries topics (see p.19, fn.10), available at: https://www.esma.europa.eu/sites/default/files/library/esma35-43-349_mifid_ii_qas_on_investor_protection_topics.pdf
92% for IRD, and 97% for both currency and
credit.
Over all asset classes, 17% of the proportion of
outstanding notional amount was executed on
trading venues. Contracts executed on MTFs and
OTFs are particularly significant for currency
derivatives, at 8% of notional amount (ASRD.11).
For credit and interest rate derivatives the
proportion of notional amount executed on MTFs
and OTFs is close to that for ETDs. In credit
derivatives, 4% of the notional amount is OTC on
trading venue (compared with 4% for ETD), while
for interest rate derivatives 7% of notional amount
is OTC on trading venue (compared with 8% for
ETD). The trading of IRDs and CDs on MTFs and
OTFs is likely to be related to the Markets in
Financial Instruments Directive (MiFID) II
derivative trading obligation.12 For commodities
and equities, the notional amounts for OTCs
executed on MTFs and OTFs is extremely small.
ASRD.11 Proportion of total notional amount on trading venues
OTC on trading venue significant for interest rate, credit and currency derivatives.
In summary, proportions of ETDs and OTC
derivatives are similar to 4Q17. However, OTC
notional amounts on trading venues are
significant for currencies, CDs and IRDs.
ASRD.12 Comparing EMIR statistics with those from other sources
EMIR and BIS OTC market size measures The Bank of International Settlements (BIS) publishes amounts of global OTC derivatives outstanding semi-annually. These BIS estimates are based on dealers in 13 countries reporting gross notional amount at the end of June
12 The MIFIDII trading obligation sets out the derivatives subject to the EMIR clearing obligation that are to be executed on trading venues. This includes some interest rate and credit derivatives. See Commission Delegated Regulation (EU) 2017/2417, available at: https://eur-lex.europa.eu/legal-content/EN/TXT/PDF/?uri=CELEX:32017R2417&from=EN
0%
20%
40%
60%
80%
100%
All CO CR CU EQ IR
ETD OTC on trading venue OTC off trading venue
Note: Proportions of total notional outstanding by ETD, OTC on trading venue
and OTC off trading venue, in %.Sources: TRs, ISO, ESMA.
0%
10%
20%
30%
40%
50%
60%
All CO CR CU EQ IR
ETD OTC on MTF OTC on OTF
Note: Proportions of total notional on trading venues (ETD, OTC executed on
MTFs and OTFs), in %.Sources: TRs, ISO, ESMA.
ESMA Annual Statistical Report on EU Derivatives Markets 2019 12
and December in a survey sent to the NCBs for the countries in which they are headquartered.13 We understand the gross notional amount reported should reflect balance sheet notional amount for the consolidated groups.14 The national central banks (NCBs) in turn aggregate this to country level which they provide to the BIS for aggregation to global level.15
Both the BIS and EMIR data on OTC derivatives amounts outstanding aim to increase transparency on derivatives markets, to improve understanding of derivatives markets and to help to better identify risks. The BIS has a global focus, while EMIR data is focused on Europe (EEA). The nature of the data collected is different, the EMIR data is based on mandatory transaction reporting for all counterparties involved in a derivative contract to trade repositories (TRs), while the BIS estimates are based on aggregated consolidated positions as reported by dealers in surveys.
In the BIS statistics, the global notional amount outstanding in OTC derivatives in 2018 totalled USD 595tn at the end of 1H and USD 544tn at year end.16 As these estimates are of the global OTC market in aggregate notional amount to be reported without netting,17 they offer a comparator for the total EEA OTC notional amount outstanding that we calculate using EMIR data.
To perform the comparison, we first remove the notional amounts associated with intragroup exposures (because the BIS estimates are based on the derivative exposures of consolidated groups). Removing intragroup exposures and converting to USD, we measure using EMIR data 2018 total notional amount of USD 773tn in Q2 and USD 530tn at year end (28/12/2018). Comparing the two measures of OTC market size, the EMIR data counterintuitively yields similar-sized or larger values for a smaller region (the EEA) than the BIS global measures.
To understand the possible sources of this result, we also analysed the notional amount reported by a small number of European banks in their consolidated global accounts (similar to those reported to NCBs and the BIS), and compared these with the aggregate EU notional amount for these groups, using data reported to us through TRs. This showed:18
— considerable differences between some of the total notional amounts reported in the accounts and those calculated using EMIR data.
— large discrepancies for some banks and asset classes, with a closer match for others.
— variability over time in the firms’ aggregate notional amount calculated using the EMIR data, with noticeable drops just before year-end.
The variability over time is visible in the aggregate notional
amount reported to us across all firms. The chart below
(ASRD.11) shows the percentage change in outstanding
notional amount reported to us between our Q4 reference
13 The BIS also has a Triennial Survey that provides data on
amounts outstanding for a larger set of reporting dealers in more countries than the semi-annual survey. Notional amounts are also reported on a consolidated basis. For supplementary information please refer to https://www.bis.org/publ/qtrpdf/r_qt1509e.htm.
14 BIS OTC statistics should reflect balance sheet information on a consolidated basis/ See p.3-4 of https://www.bis.org/ifc/publ/ifcb43_zf_rh.pdf.
15 For further details on the approach, see https://www.bis.org/statistics/about_derivatives_stats.htm?m=6%7C32%7C639.
16 See https://www.bis.org/statistics/d5_1.pdf.
17 See p.4 of the Reporting guidelines for semi-annual OTC derivatives statistics at end-December 2017: https://www.scb.se/contentassets/33bdc993c23f4e77b643b230332d326f/guidelines-otc-derivatives.pdf.
18 As part of the work we also compared the intragroup flag in our data with entity relationship data in the Global Legal
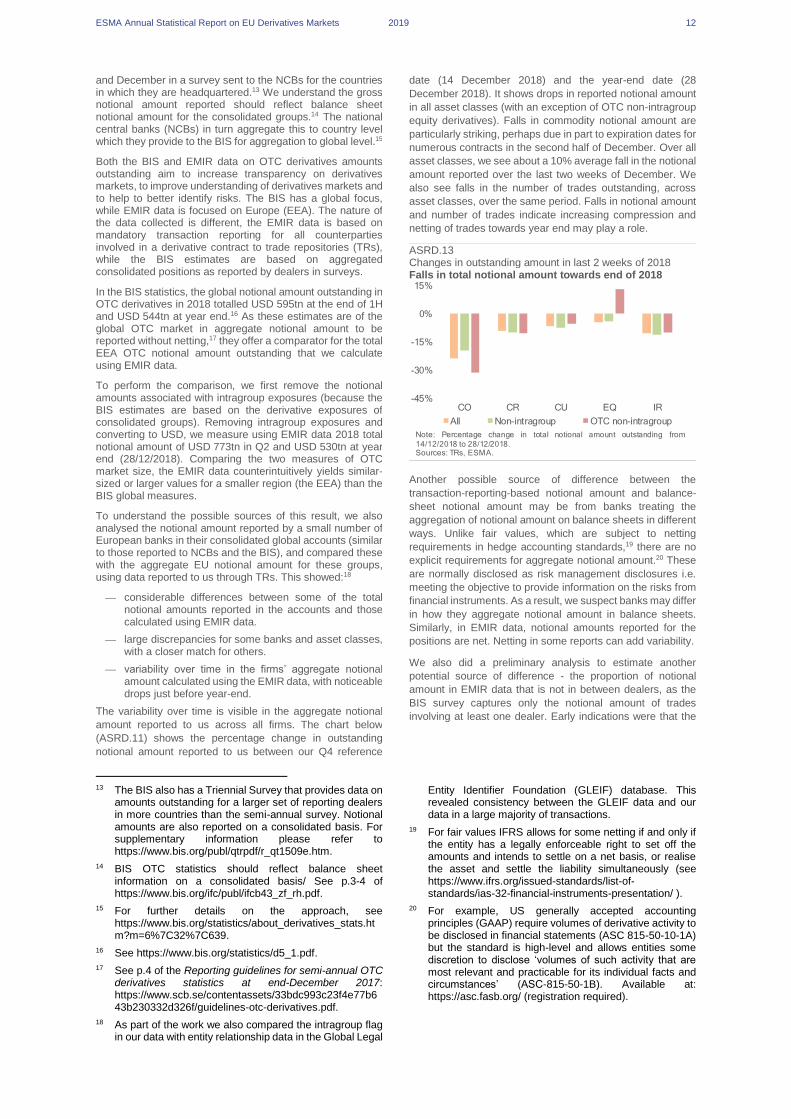
date (14 December 2018) and the year-end date (28
December 2018). It shows drops in reported notional amount
in all asset classes (with an exception of OTC non-intragroup
equity derivatives). Falls in commodity notional amount are
particularly striking, perhaps due in part to expiration dates for
numerous contracts in the second half of December. Over all
asset classes, we see about a 10% average fall in the notional
amount reported over the last two weeks of December. We
also see falls in the number of trades outstanding, across
asset classes, over the same period. Falls in notional amount
and number of trades indicate increasing compression and
netting of trades towards year end may play a role.
ASRD.13 Changes in outstanding amount in last 2 weeks of 2018 Falls in total notional amount towards end of 2018
Another possible source of difference between the
transaction-reporting-based notional amount and balance-
sheet notional amount may be from banks treating the
aggregation of notional amount on balance sheets in different
ways. Unlike fair values, which are subject to netting
requirements in hedge accounting standards,19 there are no
explicit requirements for aggregate notional amount.20 These
are normally disclosed as risk management disclosures i.e.
meeting the objective to provide information on the risks from
financial instruments. As a result, we suspect banks may differ
in how they aggregate notional amount in balance sheets.
Similarly, in EMIR data, notional amounts reported for the
positions are net. Netting in some reports can add variability.
We also did a preliminary analysis to estimate another
potential source of difference - the proportion of notional
amount in EMIR data that is not in between dealers, as the
BIS survey captures only the notional amount of trades
involving at least one dealer. Early indications were that the
Entity Identifier Foundation (GLEIF) database. This revealed consistency between the GLEIF data and our data in a large majority of transactions.
19 For fair values IFRS allows for some netting if and only if the entity has a legally enforceable right to set off the amounts and intends to settle on a net basis, or realise the asset and settle the liability simultaneously (see https://www.ifrs.org/issued-standards/list-of-standards/ias-32-financial-instruments-presentation/ ).
20 For example, US generally accepted accounting principles (GAAP) require volumes of derivative activity to be disclosed in financial statements (ASC 815-50-10-1A) but the standard is high-level and allows entities some discretion to disclose ‘volumes of such activity that are most relevant and practicable for its individual facts and circumstances’ (ASC-815-50-1B). Available at: https://asc.fasb.org/ (registration required).
-45%
-30%
-15%
0%
15%
CO CR CU EQ IR
All Non-intragroup OTC non-intragroup
Note: Percentage change in total notional amount outstanding from
14/12/2018 to 28/12/2018.Sources: TRs, ESMA.
ESMA Annual Statistical Report on EU Derivatives Markets 2019 13
proportion of notional amount in trades not involving a
counterparty in a dealer’s group is relatively small.
More broadly, differences between our measures and those
of the BIS may also arise from the different natures of the
datasets and their collection. Data quality issues could also
lead to discrepancies. For example, the analysis here
depends on the quality of the EMIR intragroup flag. Further
work would be needed to determine the extent to which
divergences are driven by these or other possible causes.
Central clearing of OTC derivatives:
almost entirely in interest rate and credit
The EMIR clearing obligation21 requires that
certain OTC derivatives contracts be cleared
through authorised central counterparties
(CCPs).22 It is a key part of EMIR, aiming to
increase financial stability and to enhance OTC
market resilience.
At the end of 2018, the clearing obligation applied
to specified classes of interest rate and credit
OTC derivatives. The IRD classes subject to the
obligation were basis swaps, fixed-to-float
interest rate swaps, forward rate agreements,
and overnight index swaps. For CDs certain
European untranched index credit default swap
(CDS) classes were subject to the obligation.
For derivatives classes currently subject to the
clearing obligation, the clearing obligation came
into effect at different points in time depending on
whether the contract-holders are above or below
the clearing thresholds.23 No new derivative
21 Under EMIR, as amended by EMIR Refit text, two types
of counterparties are subject to the obligation: Financial counterparties (FC) (such as banks, insurers, and asset managers) which decide not to calculate their aggregate month-end average position in OTC derivatives or the result of which is above any of the clearing thresholds, and non-financial counterparties (NFCs) which include any EU firm whose positions in OTC derivatives contracts (unless for hedging purposes) exceed the EMIR clearing thresholds. Intra-group transactions are exempted from central clearing under certain conditions. The exemption of pension funds from the clearing obligation expired on 17 August 2018, though an additional temporary extension is granted under EMIR Refit (see https://www.esma.europa.eu/regulation/post-trading/otc-derivatives-and-clearing-obligation.)
22 As of 31 December 2018, 16 CCPs were authorised to operate in the EU, incl. Nasdaq OMX Clearing AB, European Central Counterparty N.V., KDPW_CCP, Eurex Clearing AG, Cassa di Compensazione e Garanzia S.p.A. (CCG), LCH SA, European Commodity Clearing, LCH Ltd, Keler CCP, CCP Austria Abwicklungsstelle für Börsengeschäfte GmbH (CCP.A), LME Clear Ltd, BME Clearing, OMIClear - C.C., S.A., ICE Clear Netherlands B.V., Athens Exchange Clearing House (Athex Clear) and ICE Clear Europe Limited (ICE Clear Europe).
23 See Commission Delegated Regulation (EU) 2015/2205 for IRDs in G4 currencies (https://eur-lex.europa.eu/legal-content/EN/TXT/?uri=uriserv:OJ.L_.2015.314.01.0013.01.ENG), Commission Delegated Regulation (EU)
classes became subject to the clearing obligation
during 2018 for all counterparty types.24
As in our report for 2017, the EMIR data for 4Q18
again shows central clearing taking place
almost entirely in asset classes with products
already subject to the clearing obligation.
For IRDs overall, the clearing ratio was 63%, for
CDs the clearing ratio was 25%. IRDs show an
increase (5 percentage points higher) in clearing
from 4Q17, while the clearing rate for CDs shows
a slight decrease (2 percentage points lower)
(ASRD.14).25
The lower clearing rate for CDs than in 2017
appears to be due to a lower level of notional
amount cleared outside of the EEA, which could
be due to compression of cleared trades.
Counterparties: investment firms, credit
institutions and CCPs are the largest
The exposures that counterparties have to
different derivatives products provides useful
information on counterparty risks in EU derivative
markets. The new RTS implemented in late 2017
enables us to present more information on
counterparty exposures for 2018, for example, on
non-financial firms.
2016/1178 for IRDs in NOK, PLN and SEK (https://eur-lex.europa.eu/legal-content/EN/TXT/PDF/?uri=CELEX:32016R1178&from=EN) and Commission Delegated Regulation (EU) 2016/592 for European Index CDSs (https://eur-lex.europa.eu/legal-content/EN/TXT/?uri=uriserv%3AOJ.L_.2016.103.01.0005.01.ENG).
24 The derogation for counterparties in Category 4 (broadly speaking non-financial counterparties above the clearing threshold, NFCs+) expired on 21 December 2018, for the IRDs denominated in the G4 currencies subject to the clearing obligation. This would have brought more IRDs in G4 currencies transactions under the clearing obligation. However, given that EMIR Refit will apply the clearing obligation only to NFCs+ in the asset class(es) where their level of activity is above the clearing threshold, ESMA recommended that national competent authorities (NCAs) not prioritise the supervision of the 21 December 2018 deadline. (see https://www.esma.europa.eu/sites/default/files/library/esma70-151-1773_public_statement_on_co_and_to_for_intragroup_as_well_as_cat_4.pdf )
25 Clearing ratios are calculated here over all interest rate and credit derivatives, some of which are not subject to the clearing obligation, so we would not expect clearing rates here to be 100%.

ESMA Annual Statistical Report on EU Derivatives Markets 2019 14
ASRD.14 Proportion of OTC notional amount cleared
Clearing concentrated in IRD and credit
As in 2017, our data again shows that investment
firms and credit institutions were key
counterparties in derivative markets in 2018.
Together they account for about 55% of the
notional amount in the market (ASRD.15), with
proportions of 34% and 21% respectively.
Investment firms hold particularly significant
exposures across all derivative classes, ranging
from 28% of IRDs to 59% of equity derivatives.
They also account for about half of the notional
amount in both currency and credit derivatives
and for over a third of the notional amount in
commodities (36%).26
For credit institutions the main exposures are in
IRDs (22% of notional), currency (23% of
notional), equities (18% of notional) and credit
(16% of notional).
However, the exposure measures for investment
firms and credit institutions will overstate these
firms’ exposures to some extent because these
firms can conduct trading on behalf of end clients
that are not captured in EMIR data.
CCPs had sizeable exposures. They accounted
for 32% of the total notional amount outstanding.
As might be expected, given their role in central
clearing, their exposures were mainly in
derivative classes with OTC products subject to
the clearing obligation. CCP exposures account
for 41% of the total notional amount in IRDs, and
12% in credit derivatives.27 With the exception of
commodities (where their exposures account for
15% of total notional) CCPs account for very
small notional amount proportions in other
categories.
26 Note that these proportions are reduced from the 2017
figures because of CCPs, Non-financial firms and assurance firms now also figure as counterparties in our calculations.
ASRD.15 Notional amount by sector of counterparty
CCPs have major exposures in IRDs and credit, non-financials in commodities
Non-financial firms account for 7% of the overall
notional amount. As might be expected, their
exposures account for a large amount of the
commodity derivatives, at 41% of the notional
amount in commodities. They also account for
significant proportions in equity derivatives (17%)
and in currency derivatives (16%).
Similar to 2017, alternative investment funds
are have significant exposures in CDs (5% of the
notional) IRDs (4% of the notional) and currency
derivatives (3%). Undertakings for collective
investment in transferable securities (UCITS)
remain minor players in the market, with their
most significant presence in credit and currency
derivatives (4% of notional amount in each).
Assurance firms, insurance firms and pension
funds have relatively small presences.
Assurance firms account for 3% of the notional
amount in credit derivatives and 2% in currency
derivatives. Pension funds register their largest
proportion in currency derivatives with just 1% of
the notional amount. Insurance firms account for
the smallest notional amount, with their
exposures accounting for only 0.1% of the total
notional amount overall. However, these
exposures are likely to materially understate
exposures of these firms, since these types of
firms are likely to be the end clients of some of
the exposures captured under other counterparty
types in EMIR.
Importantly, the concentration of market activities
become even more visible by matching
exposures between counterparties. The table
below (ASRD.16) presents exposures between
counterparties for interest rate derivatives. Here
the largest exposures are between CCPs and
27 These percentages are not based on reconciled transactions and do not exclude intragroup transactions, so are not comparable to the clearing ratios presented above.
0
20
40
60
80
100
CO CR CU EQ IR
Note: Proportion of OTC notional amount outstanding cleared by asset class,
in %.Sources: TRs, ESMA:
0%
20%
40%
60%
80%
100%
All CO CR CU EQ IR
AIF Assurance CCPCredit institution Pension fund InsuranceInvestment firm Non-financial firm UCITS
Note: Proportion of total notional amount outstanding (not reconciled) by
counterparty and assetclass, in %.Sources: TRs, ESMA.

ESMA Annual Statistical Report on EU Derivatives Markets 2019 15
investment firms (28%) and between CCPs and
credit institutions (25%).
ASRD.16 Whom-to-whom matrix of cross sectoral exposures - IRDs
CCPs to credit institutions and to investment firms accounts for over half of the total
CI IF AIF PF UCITS CCP NF
IC 0.3 1.7 0.1
CI 3.8 6.5 3.9 0.1 0.2 25.4 2.4
IF 7.6 1.5 0.2 0.4 27.9 7.1
AIF 0.1 0.3
CCP 10
Note: Cross sectoral notional amounts between EU counterparties, as a percentage of the total. Empty cases are either zeros or lower than 0.1% of the total. Columns or rows with only empty cells are omitted. Counterparty sectors as self-reported by counterparties. CI=Credit Institution; IF=Investment Firm; IC=Insurance Company; AIF=Alternative Investment Fund; PF=Pension Fund; CCP=Central Counterparty; NF=Non-Financial. Sources: TRs, GLEIF, ESMA.
Other substantive exposures are those in
between investment firms (8%) and those
between investment firms and credit institutions
(7%). Non-financials are exposed to derivatives
markets through CCPs (10%), investment firms
(7%) and credit institutions (2%). Exposures in
between credit institutions and between
alternative investment funds and credit
institutions each account for about 4%.
Exposures among other counterparties are
relatively small.
For credit derivatives, CCPs are also important,
although to a lesser extent than IRDs. Here their
exposures to investment firms, credit institutions
and non-financials respectively amount to 12%,
9% and 5% of the total notional amount.
Investment firms’ exposures to credit institutions,
non-financials and other investment firms make
up most of the remaining exposures at 20%, 17%
11% of the total, respectively.
For commodity derivatives, non-financials’
exposures to investment firms make up 40% of
the total, while CCPs’ exposures to investment
firms amount to 19%, which reflects the wide
usage of these derivatives by non-financials to
hedge physical operations, mostly on regulated
markets or through brokers.
Nearly a third (30%) of the equity derivative
notional amount is held between investment
firms. Exposures of these investment firms to
28 Conventionally, HHI is a measure of concentration based
on the sum of the squares of market shares (which gives greater weight to larger shares). According to the EC guidelines (in the context of competition law) an HHI value of below 0.1 indicates low concentration and an HHI value of between 0.1 and 0.2 indicates medium concentration. See Council Regulation (EC) No 139/2004 of 20 January 2004 on the control of concentrations between
credit institutions (18%) and non-financials (17%)
are also substantial.
Finally, for currency derivatives credit institutions’
exposures to investment firms are the largest,
followed by exposures between credit institutions
and non-financials. This signals a two-tiered
market in which non-financials trade with
investment firms and credit institutions, while the
latter two trade with each other.
Concentration and connectedness: some
counterparties strongly linked
To assess the extent to which derivatives’
exposures are held by relatively few
counterparties, we use three measures to assess
concentration. The first is the proportion of
notional amount outstanding held by the top five
largest counterparties. The second is the
Herfindahl-Hirschman Index (HHI). It is based on
the sum of the squares of notional amount
proportions for all counterparties.28 It also
captures the concentration for counterparties
outside the top five. Lastly, we use the number of
counterparties in each asset class, measured by
the number of unique reporting counterparties.29
The top five measure (ASRD.17), excluding
CCPs, shows credit and currency markets are the
most concentrated with the top five holding 47%
and 44% of the outstanding notional amount
respectively in each. For currency, equity and
interest rate derivatives the figures are 41%, 40%
and 24% respectively. Including CCPs increases
the proportion of exposures held by the top five
for commodities, credit and interest rates. For
interest rates the effect is particularly dramatic
(from 24% to 61%) because CCPs are among the
largest counterparties in that market.
For the HHI the concentration picture is similar to
that for the top five (ASRD.17). Including CCPs,
IRDs again have the most concentrated
exposures among asset classes. The lower HHI
if one leaves out CCPs for IRDs shows – like the
top five measure – that concentration in IRDs is
predominantly in CCPs. This is intuitive given the
significant volumes cleared by a few large CCPs
in this asset class.
undertakings and “Guidelines on the assessment of horizontal mergers under the Council Regulation on the control of concentrations between undertakings” https://eur-lex.europa.eu/legal-content/EN/TXT/HTML/?uri=CELEX:52004XC0205(02)&from=EN.
29 This will under-report counterparties because only firms domiciled in the EU or EEA report trades under EMIR.

ESMA Annual Statistical Report on EU Derivatives Markets 2019 16
Also relevant is the number of counterparties in
each market. In 4Q18, there were about 4,000 in
credit, 8,000 in commodities, 25,000 in equities,
60,000 in currency and 85,000 in interest rate
derivatives (see ASRD-S.30, ASRD-S.42, ASRD-
S.54, ASRD-S.66 and ASRD-S.78).
ASRD.17 Concentration measures: the HHI and top-five counterparties
IRD has higher concentration because of CCPs
The top five levels are not too different from 2017
except for a sizeable fall in concentration for
commodities compared with a year earlier, which
appears to be due to a fall in concentration in
4Q18 (see ASRD-S.77).
Overall, while there are large numbers of
counterparties in each asset class, the top five
counterparties still hold between 40% and 60% of
total notional amounts. The relative concentration
between asset classes is similar using the top five
measure and the HHI. Under both concentration
measures, IRDs are the most concentrated once
CCPs are included.
To supplement these concentration measures,
we also look at the interconnectedness of
markets using statistics on the connections
between counterparties.30
Looking at the average number of connections of
counterparties, ranked by how connected they
are, we see that the top 0.01% most connected
reporting counterparties in each asset class have
very large numbers of connections (ASRD.18).
For example, in commodities there is only one
counterparty in the top 0.01% and it is connected
to over 200,000 other counterparties.31 Credit
also has only one reporting counterparty in the
top 0.01% and it is connected to about 4,000
counterparties. In interest rate derivatives, there
are nine reporting counterparties in the top most
connected 0.01%. On average, these are each
connected to over 7,000 counterparties.
30 A connection is counted when a reporting counterparty
reports one or more outstanding positions with another counterparty.
ASRD.18 Average connections by quantile of how connected:
A few counterparties are very widely connected
At the other extreme, each asset class also has a
large proportion of counterparties with very few
connections. In particular, in every asset class
except credit, between 70% and 80% of the
reporting counterparties have one counterparty.
This shows how connections are concentrated in
a very small proportion of counterparties.
The next chart (ASRD.19) shows the distribution
of counterparty connections. It shows, for
example, that the top 0.01% most connected
counterparties’ connections account for almost
20% of all the connections into reporting
counterparties. Moreover, the top 1% of most
connected reported counterparties in each of the
asset classes account for over half of the
connections. Proportions for the top 1% range
from 58% in credit to 94% in commodities.
ASRD.19 Distribution of connections by quantile of how connected
The top 1% have over half the connections
Together the two charts show that in each asset
class a few counterparties are connected to many
others, while a large majority of counterparties
are connected to very few, very often to just one
other counterparty. They also show variation in
the extent of concentration across asset classes,
31 Figures here include non-reporting counterparties so can be exceed those presented earlier, which only included reporting counterparties.
-
0.04
0.08
0.12
0.16
0.20
0%
20%
40%
60%
80%
100%
CO CR CU EQ IRTop 5 excl. CCPs Top 5 incl. CCPsHHI excl. CCPs (r.h.axis) HHI incl. CCPs (r.h.axis)
Note: HHI and notional amount share in % of top-five counterparties calculated
on aggregated notional positions of counterparties. HHI normalised between 0and 1.Sources: TRs, ESMA.
1
10
100
1,000
10,000
100,000
1,000,000
CO CR CU EQ IR
Bottom 90% (least connected) 90% to 99%
99% to 99.9% 99.9% to 99.99%
Top 0.01% (most connected)Note: Average connections per reporting counterparty (y axis, log scale) by
quantile of how connected.Sources:TRs, ESMA
0%
15%
30%
45%
60%
CO CR CU EQ IR
Bottom 90% (least connected) 90% to 99%
99% to 99.9% 99.9% to 99.99%
Top 0.01% (most connected)Note: Proportion of all counterparty connections (y axis) in quantiles of
reporting counterparties ranked by connectedness.Sources: TRs, ESMA
ESMA Annual Statistical Report on EU Derivatives Markets 2019 17
with connections in credit and interest rate
derivatives less extremely concentrated than in
commodities, equities and currencies. This is
likely to be linked with specific instruments, for
example CFDs, that are more prevalent in these
asset classes, where a few large counterparties
transact with a large number of counterparties
with only one derivative position.
European and global distribution: United
Kingdom exposures dominate
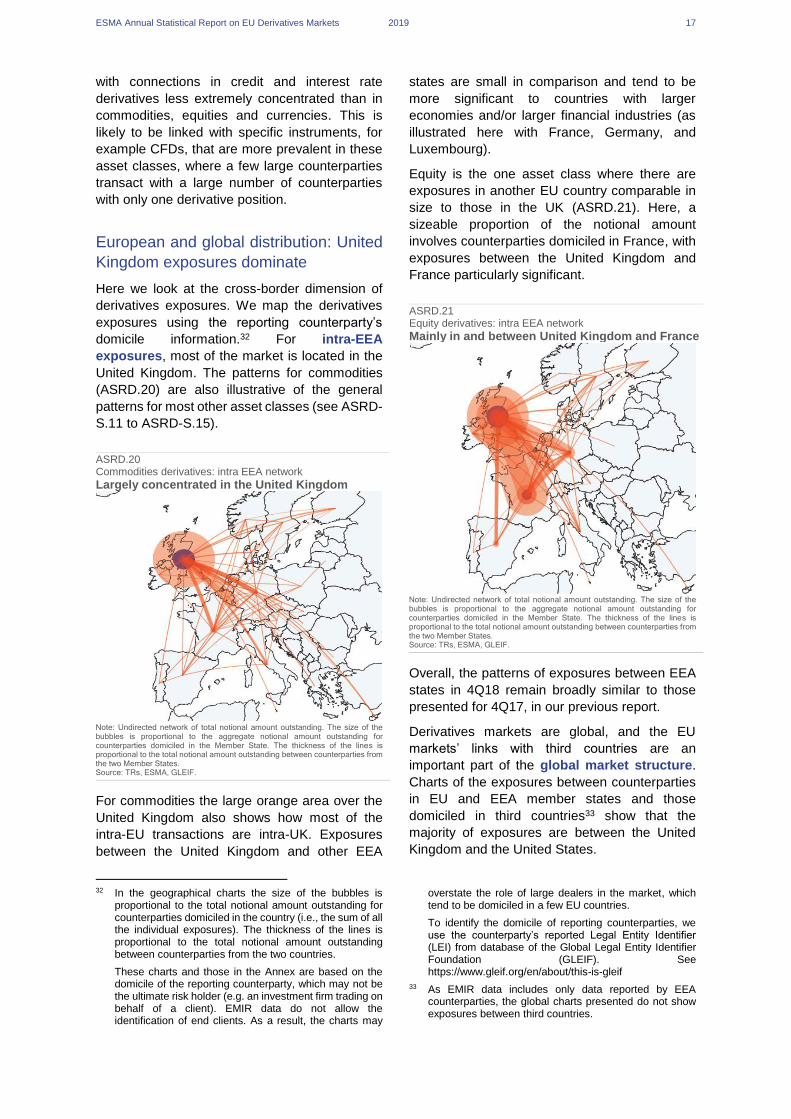
Here we look at the cross-border dimension of
derivatives exposures. We map the derivatives
exposures using the reporting counterparty’s
domicile information.32 For intra-EEA
exposures, most of the market is located in the
United Kingdom. The patterns for commodities
(ASRD.20) are also illustrative of the general
patterns for most other asset classes (see ASRD-
S.11 to ASRD-S.15).
ASRD.20 Commodities derivatives: intra EEA network
Largely concentrated in the United Kingdom
Note: Undirected network of total notional amount outstanding. The size of the bubbles is proportional to the aggregate notional amount outstanding for counterparties domiciled in the Member State. The thickness of the lines is proportional to the total notional amount outstanding between counterparties from the two Member States. Source: TRs, ESMA, GLEIF.
For commodities the large orange area over the
United Kingdom also shows how most of the
intra-EU transactions are intra-UK. Exposures
between the United Kingdom and other EEA
32 In the geographical charts the size of the bubbles is
proportional to the total notional amount outstanding for counterparties domiciled in the country (i.e., the sum of all the individual exposures). The thickness of the lines is proportional to the total notional amount outstanding between counterparties from the two countries.
These charts and those in the Annex are based on the domicile of the reporting counterparty, which may not be the ultimate risk holder (e.g. an investment firm trading on behalf of a client). EMIR data do not allow the identification of end clients. As a result, the charts may
states are small in comparison and tend to be
more significant to countries with larger
economies and/or larger financial industries (as
illustrated here with France, Germany, and
Luxembourg).
Equity is the one asset class where there are
exposures in another EU country comparable in
size to those in the UK (ASRD.21). Here, a
sizeable proportion of the notional amount
involves counterparties domiciled in France, with
exposures between the United Kingdom and
France particularly significant.
ASRD.21 Equity derivatives: intra EEA network
Mainly in and between United Kingdom and France
Note: Undirected network of total notional amount outstanding. The size of the bubbles is proportional to the aggregate notional amount outstanding for counterparties domiciled in the Member State. The thickness of the lines is proportional to the total notional amount outstanding between counterparties from the two Member States. Source: TRs, ESMA, GLEIF.
Overall, the patterns of exposures between EEA
states in 4Q18 remain broadly similar to those
presented for 4Q17, in our previous report.
Derivatives markets are global, and the EU
markets’ links with third countries are an
important part of the global market structure.
Charts of the exposures between counterparties
in EU and EEA member states and those
domiciled in third countries33 show that the
majority of exposures are between the United
Kingdom and the United States.
overstate the role of large dealers in the market, which tend to be domiciled in a few EU countries.
To identify the domicile of reporting counterparties, we use the counterparty’s reported Legal Entity Identifier (LEI) from database of the Global Legal Entity Identifier Foundation (GLEIF). See https://www.gleif.org/en/about/this-is-gleif
33 As EMIR data includes only data reported by EEA counterparties, the global charts presented do not show exposures between third countries.
ESMA Annual Statistical Report on EU Derivatives Markets 2019 18
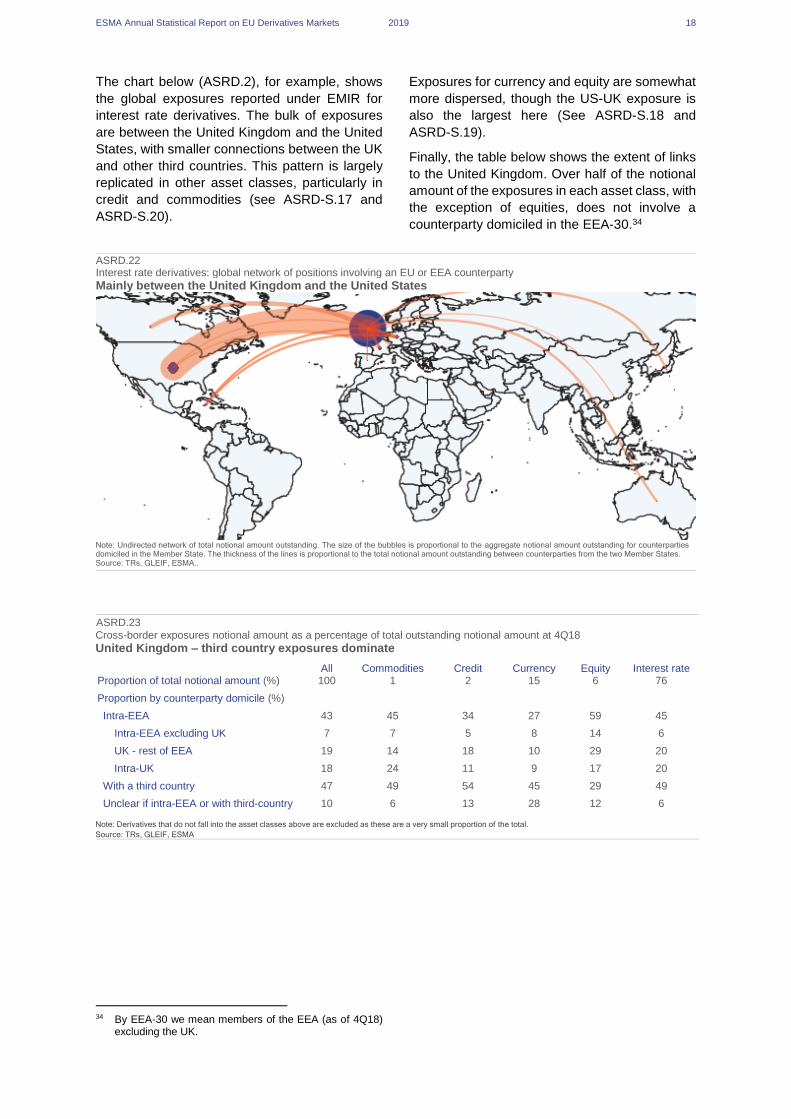
The chart below (ASRD.2), for example, shows
the global exposures reported under EMIR for
interest rate derivatives. The bulk of exposures
are between the United Kingdom and the United
States, with smaller connections between the UK
and other third countries. This pattern is largely
replicated in other asset classes, particularly in
credit and commodities (see ASRD-S.17 and
ASRD-S.20).
Exposures for currency and equity are somewhat
more dispersed, though the US-UK exposure is
also the largest here (See ASRD-S.18 and
ASRD-S.19).
Finally, the table below shows the extent of links
to the United Kingdom. Over half of the notional
amount of the exposures in each asset class, with
the exception of equities, does not involve a
counterparty domiciled in the EEA-30.34
ASRD.22 Interest rate derivatives: global network of positions involving an EU or EEA counterparty
Mainly between the United Kingdom and the United States
Note: Undirected network of total notional amount outstanding. The size of the bubbles is proportional to the aggregate notional amount outstanding for counterparties domiciled in the Member State. The thickness of the lines is proportional to the total notional amount outstanding between counterparties from the two Member States. Source: TRs, GLEIF, ESMA..
ASRD.23 Cross-border exposures notional amount as a percentage of total outstanding notional amount at 4Q18 United Kingdom – third country exposures dominate
All Commodities Credit Currency Equity Interest rate Proportion of total notional amount (%) 100 1 2 15 6 76
Proportion by counterparty domicile (%)
Intra-EEA 43 45 34 27 59 45
Intra-EEA excluding UK 7 7 5 8 14 6
UK - rest of EEA 19 14 18 10 29 20
Intra-UK 18 24 11 9 17 20
With a third country 47 49 54 45 29 49
Unclear if intra-EEA or with third-country 10 6 13 28 12 6
Note: Derivatives that do not fall into the asset classes above are excluded as these are a very small proportion of the total.
Source: TRs, GLEIF, ESMA
34 By EEA-30 we mean members of the EEA (as of 4Q18)
excluding the UK.
ESMA Annual Statistical Report on EU Derivatives Markets 2019 19
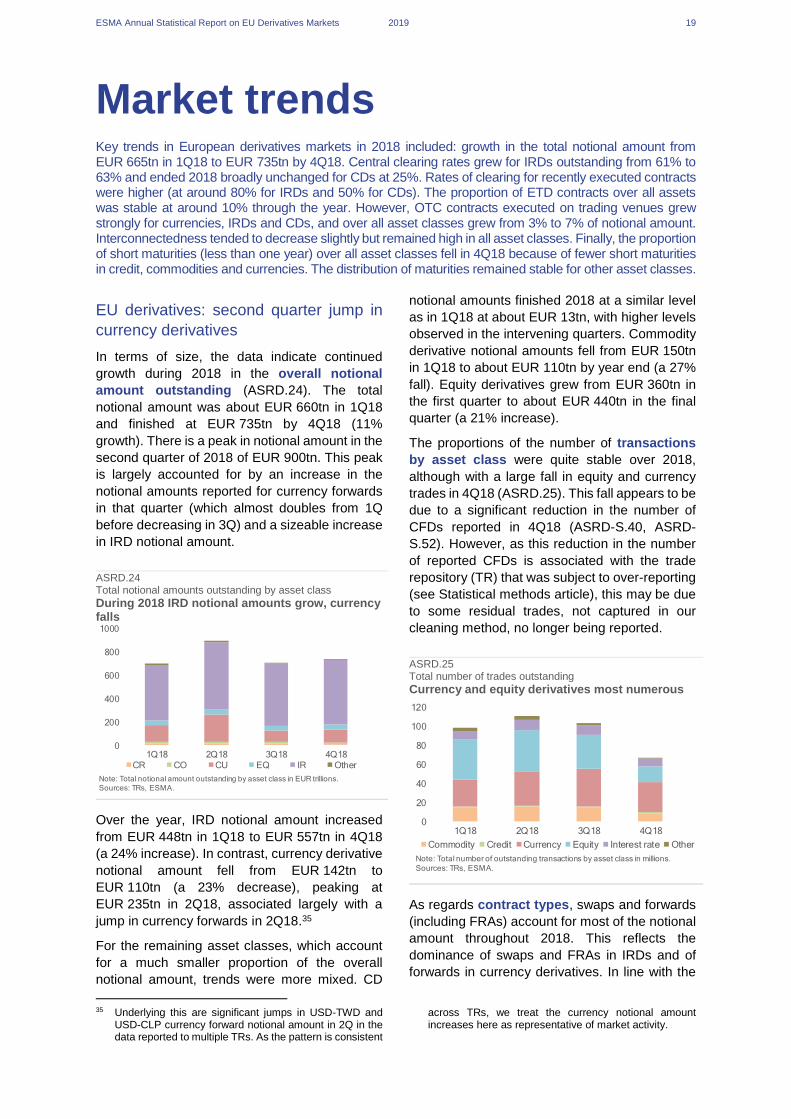
Market trends Key trends in European derivatives markets in 2018 included: growth in the total notional amount from EUR 665tn in 1Q18 to EUR 735tn by 4Q18. Central clearing rates grew for IRDs outstanding from 61% to 63% and ended 2018 broadly unchanged for CDs at 25%. Rates of clearing for recently executed contracts were higher (at around 80% for IRDs and 50% for CDs). The proportion of ETD contracts over all assets was stable at around 10% through the year. However, OTC contracts executed on trading venues grew strongly for currencies, IRDs and CDs, and over all asset classes grew from 3% to 7% of notional amount. Interconnectedness tended to decrease slightly but remained high in all asset classes. Finally, the proportion of short maturities (less than one year) over all asset classes fell in 4Q18 because of fewer short maturities in credit, commodities and currencies. The distribution of maturities remained stable for other asset classes.
EU derivatives: second quarter jump in
currency derivatives
In terms of size, the data indicate continued
growth during 2018 in the overall notional
amount outstanding (ASRD.24). The total
notional amount was about EUR 660tn in 1Q18
and finished at EUR 735tn by 4Q18 (11%
growth). There is a peak in notional amount in the
second quarter of 2018 of EUR 900tn. This peak
is largely accounted for by an increase in the
notional amounts reported for currency forwards
in that quarter (which almost doubles from 1Q
before decreasing in 3Q) and a sizeable increase
in IRD notional amount.
ASRD.24 Total notional amounts outstanding by asset class
During 2018 IRD notional amounts grow, currency falls
Over the year, IRD notional amount increased
from EUR 448tn in 1Q18 to EUR 557tn in 4Q18
(a 24% increase). In contrast, currency derivative
notional amount fell from EUR 142tn to
EUR 110tn (a 23% decrease), peaking at
EUR 235tn in 2Q18, associated largely with a
jump in currency forwards in 2Q18.35
For the remaining asset classes, which account
for a much smaller proportion of the overall
notional amount, trends were more mixed. CD
35 Underlying this are significant jumps in USD-TWD and
USD-CLP currency forward notional amount in 2Q in the data reported to multiple TRs. As the pattern is consistent
notional amounts finished 2018 at a similar level
as in 1Q18 at about EUR 13tn, with higher levels
observed in the intervening quarters. Commodity
derivative notional amounts fell from EUR 150tn
in 1Q18 to about EUR 110tn by year end (a 27%
fall). Equity derivatives grew from EUR 360tn in
the first quarter to about EUR 440tn in the final
quarter (a 21% increase).
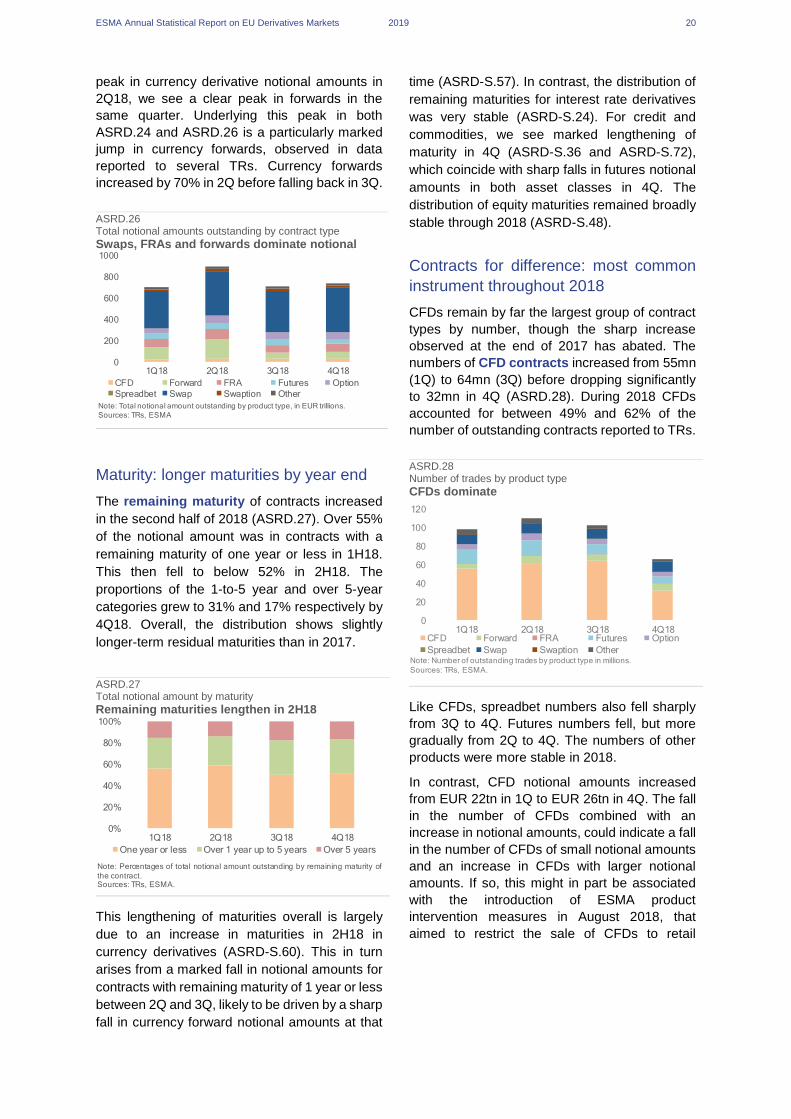
The proportions of the number of transactions
by asset class were quite stable over 2018,
although with a large fall in equity and currency
trades in 4Q18 (ASRD.25). This fall appears to be
due to a significant reduction in the number of
CFDs reported in 4Q18 (ASRD-S.40, ASRD-
S.52). However, as this reduction in the number
of reported CFDs is associated with the trade
repository (TR) that was subject to over-reporting
(see Statistical methods article), this may be due
to some residual trades, not captured in our
cleaning method, no longer being reported.
ASRD.25 Total number of trades outstanding
Currency and equity derivatives most numerous
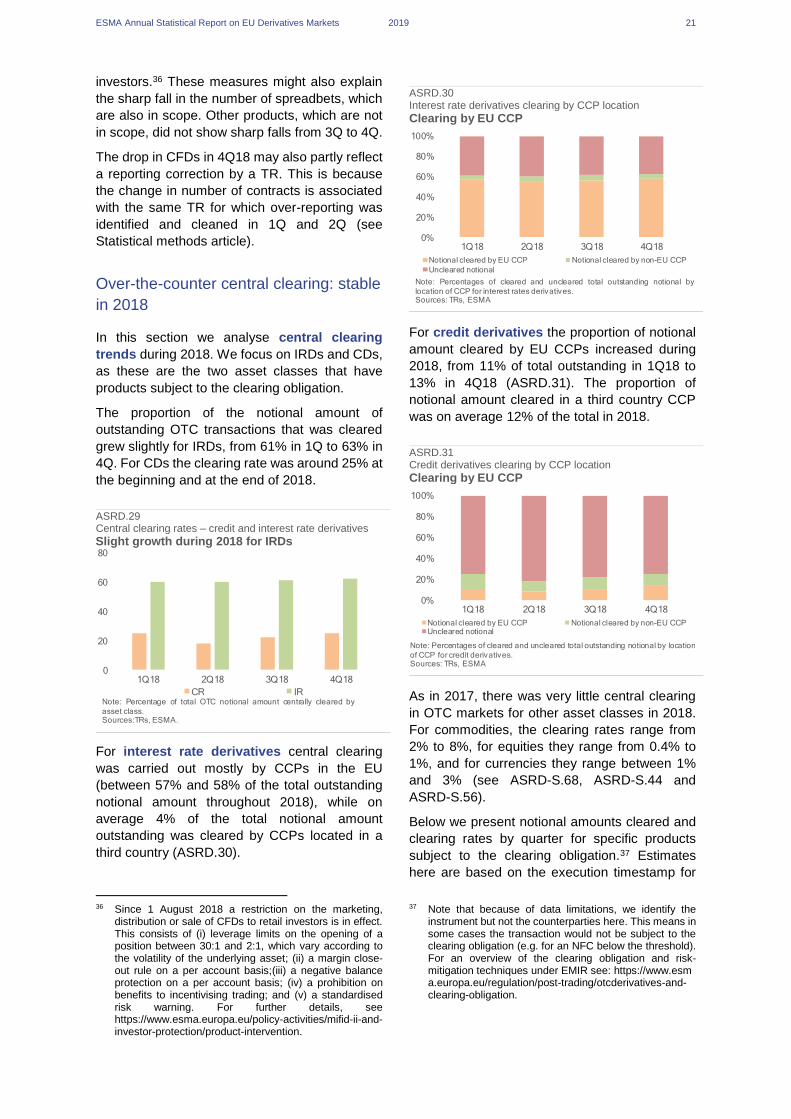
As regards contract types, swaps and forwards
(including FRAs) account for most of the notional
amount throughout 2018. This reflects the
dominance of swaps and FRAs in IRDs and of
forwards in currency derivatives. In line with the
across TRs, we treat the currency notional amount increases here as representative of market activity.
0
200
400
600
800
1000
1Q18 2Q18 3Q18 4Q18
Tri
llio
ns
CR CO CU EQ IR Other
Note: Total notional amount outstanding by asset class in EUR trillions.
Sources: TRs, ESMA.
0
20
40
60
80
100
120
1Q18 2Q18 3Q18 4Q18
Commodity Credit Currency Equity Interest rate Other
Note: Total number of outstanding transactions by asset class in millions.
Sources: TRs, ESMA.
ESMA Annual Statistical Report on EU Derivatives Markets 2019 20
peak in currency derivative notional amounts in
2Q18, we see a clear peak in forwards in the
same quarter. Underlying this peak in both
ASRD.24 and ASRD.26 is a particularly marked
jump in currency forwards, observed in data
reported to several TRs. Currency forwards
increased by 70% in 2Q before falling back in 3Q.
ASRD.26 Total notional amounts outstanding by contract type
Swaps, FRAs and forwards dominate notional
Maturity: longer maturities by year end
The remaining maturity of contracts increased
in the second half of 2018 (ASRD.27). Over 55%
of the notional amount was in contracts with a
remaining maturity of one year or less in 1H18.
This then fell to below 52% in 2H18. The
proportions of the 1-to-5 year and over 5-year
categories grew to 31% and 17% respectively by
4Q18. Overall, the distribution shows slightly
longer-term residual maturities than in 2017.
ASRD.27 Total notional amount by maturity
Remaining maturities lengthen in 2H18
This lengthening of maturities overall is largely
due to an increase in maturities in 2H18 in
currency derivatives (ASRD-S.60). This in turn
arises from a marked fall in notional amounts for
contracts with remaining maturity of 1 year or less
between 2Q and 3Q, likely to be driven by a sharp
fall in currency forward notional amounts at that
time (ASRD-S.57). In contrast, the distribution of
remaining maturities for interest rate derivatives
was very stable (ASRD-S.24). For credit and
commodities, we see marked lengthening of
maturity in 4Q (ASRD-S.36 and ASRD-S.72),
which coincide with sharp falls in futures notional
amounts in both asset classes in 4Q. The
distribution of equity maturities remained broadly
stable through 2018 (ASRD-S.48).
Contracts for difference: most common
instrument throughout 2018
CFDs remain by far the largest group of contract
types by number, though the sharp increase
observed at the end of 2017 has abated. The
numbers of CFD contracts increased from 55mn
(1Q) to 64mn (3Q) before dropping significantly
to 32mn in 4Q (ASRD.28). During 2018 CFDs
accounted for between 49% and 62% of the
number of outstanding contracts reported to TRs.
ASRD.28 Number of trades by product type
CFDs dominate
Like CFDs, spreadbet numbers also fell sharply
from 3Q to 4Q. Futures numbers fell, but more
gradually from 2Q to 4Q. The numbers of other
products were more stable in 2018.
In contrast, CFD notional amounts increased
from EUR 22tn in 1Q to EUR 26tn in 4Q. The fall
in the number of CFDs combined with an
increase in notional amounts, could indicate a fall
in the number of CFDs of small notional amounts
and an increase in CFDs with larger notional
amounts. If so, this might in part be associated
with the introduction of ESMA product
intervention measures in August 2018, that
aimed to restrict the sale of CFDs to retail
0
200
400
600
800
1000
1Q18 2Q18 3Q18 4Q18
CFD Forward FRA Futures Option
Spreadbet Swap Swaption Other
Note: Total notional amount outstanding by product type, in EUR trillions.
Sources: TRs, ESMA
0%
20%
40%
60%
80%
100%
1Q18 2Q18 3Q18 4Q18
One year or less Over 1 year up to 5 years Over 5 years
Note: Percentages of total notional amount outstanding by remaining maturity of
the contract.Sources: TRs, ESMA.
0
20
40
60
80
100
120
1Q18 2Q18 3Q18 4Q18CFD Forward FRA Futures Option
Spreadbet Swap Swaption OtherNote: Number of outstanding trades by product type in millions.
Sources: TRs, ESMA.
ESMA Annual Statistical Report on EU Derivatives Markets 2019 21
investors.36 These measures might also explain
the sharp fall in the number of spreadbets, which
are also in scope. Other products, which are not
in scope, did not show sharp falls from 3Q to 4Q.
The drop in CFDs in 4Q18 may also partly reflect
a reporting correction by a TR. This is because
the change in number of contracts is associated
with the same TR for which over-reporting was
identified and cleaned in 1Q and 2Q (see
Statistical methods article).
Over-the-counter central clearing: stable
in 2018
In this section we analyse central clearing
trends during 2018. We focus on IRDs and CDs,
as these are the two asset classes that have
products subject to the clearing obligation.
The proportion of the notional amount of
outstanding OTC transactions that was cleared
grew slightly for IRDs, from 61% in 1Q to 63% in
4Q. For CDs the clearing rate was around 25% at
the beginning and at the end of 2018.
ASRD.29 Central clearing rates – credit and interest rate derivatives
Slight growth during 2018 for IRDs
For interest rate derivatives central clearing
was carried out mostly by CCPs in the EU
(between 57% and 58% of the total outstanding
notional amount throughout 2018), while on
average 4% of the total notional amount
outstanding was cleared by CCPs located in a
third country (ASRD.30).
36 Since 1 August 2018 a restriction on the marketing,
distribution or sale of CFDs to retail investors is in effect. This consists of (i) leverage limits on the opening of a position between 30:1 and 2:1, which vary according to the volatility of the underlying asset; (ii) a margin close-out rule on a per account basis;(iii) a negative balance protection on a per account basis; (iv) a prohibition on benefits to incentivising trading; and (v) a standardised risk warning. For further details, see https://www.esma.europa.eu/policy-activities/mifid-ii-and-investor-protection/product-intervention.
ASRD.30 Interest rate derivatives clearing by CCP location
Clearing by EU CCP
For credit derivatives the proportion of notional
amount cleared by EU CCPs increased during
2018, from 11% of total outstanding in 1Q18 to
13% in 4Q18 (ASRD.31). The proportion of
notional amount cleared in a third country CCP
was on average 12% of the total in 2018.
ASRD.31 Credit derivatives clearing by CCP location
Clearing by EU CCP
As in 2017, there was very little central clearing
in OTC markets for other asset classes in 2018.
For commodities, the clearing rates range from
2% to 8%, for equities they range from 0.4% to
1%, and for currencies they range between 1%
and 3% (see ASRD-S.68, ASRD-S.44 and
ASRD-S.56).
Below we present notional amounts cleared and
clearing rates by quarter for specific products
subject to the clearing obligation.37 Estimates
here are based on the execution timestamp for
37 Note that because of data limitations, we identify the instrument but not the counterparties here. This means in some cases the transaction would not be subject to the clearing obligation (e.g. for an NFC below the threshold). For an overview of the clearing obligation and risk-mitigation techniques under EMIR see: https://www.esma.europa.eu/regulation/post-trading/otcderivatives-and-clearing-obligation.
0
20
40
60
80
1Q18 2Q18 3Q18 4Q18
CR IRNote: Percentage of total OTC notional amount centrally cleared by
asset class.Sources:TRs, ESMA.
0%
20%
40%
60%
80%
100%
1Q18 2Q18 3Q18 4Q18
Notional cleared by EU CCP Notional cleared by non-EU CCP
Uncleared notional
Note: Percentages of cleared and uncleared total outstanding notional by
location of CCP for interest rates derivatives.Sources: TRs, ESMA
0%
20%
40%
60%
80%
100%
1Q18 2Q18 3Q18 4Q18
Notional cleared by EU CCP Notional cleared by non-EU CCPUncleared notional
Note: Percentages of cleared and uncleared total outstanding notional by location
of CCP for credit derivatives.Sources: TRs, ESMA
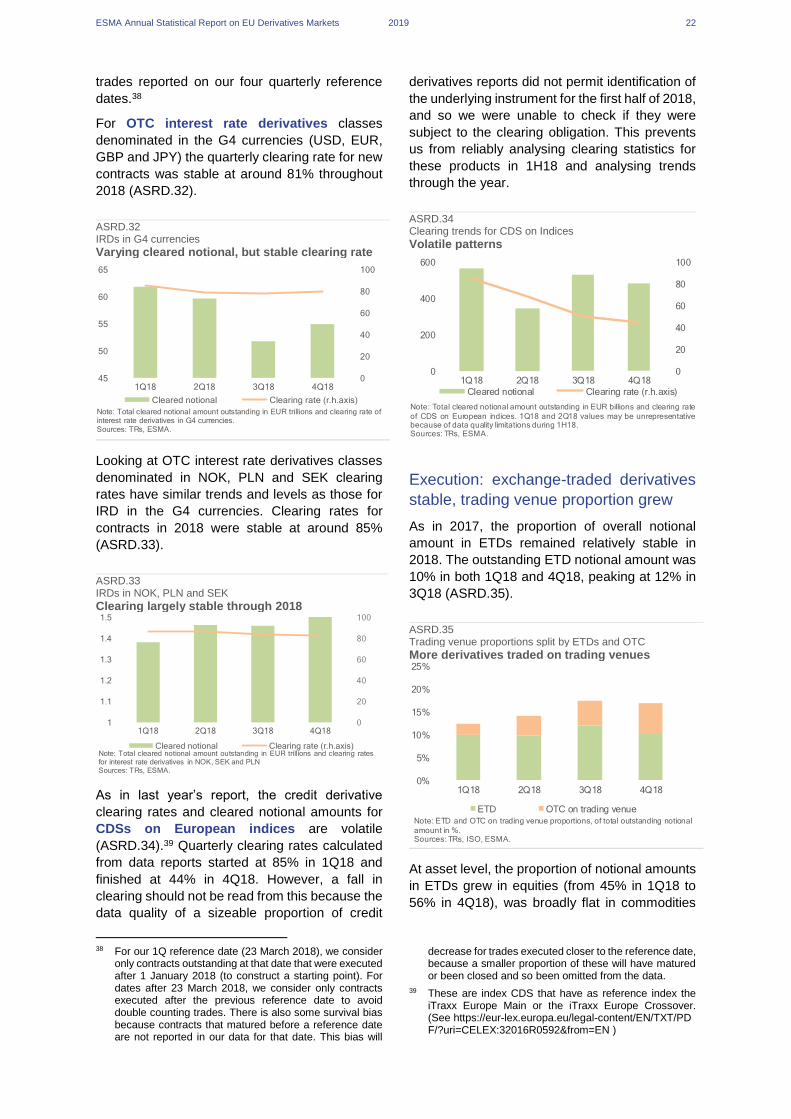
ESMA Annual Statistical Report on EU Derivatives Markets 2019 22
trades reported on our four quarterly reference
dates.38
For OTC interest rate derivatives classes
denominated in the G4 currencies (USD, EUR,
GBP and JPY) the quarterly clearing rate for new
contracts was stable at around 81% throughout
2018 (ASRD.32).
ASRD.32 IRDs in G4 currencies
Varying cleared notional, but stable clearing rate
Looking at OTC interest rate derivatives classes
denominated in NOK, PLN and SEK clearing
rates have similar trends and levels as those for
IRD in the G4 currencies. Clearing rates for
contracts in 2018 were stable at around 85%
(ASRD.33).
ASRD.33 IRDs in NOK, PLN and SEK
Clearing largely stable through 2018
As in last year’s report, the credit derivative
clearing rates and cleared notional amounts for
CDSs on European indices are volatile
(ASRD.34).39 Quarterly clearing rates calculated
from data reports started at 85% in 1Q18 and
finished at 44% in 4Q18. However, a fall in
clearing should not be read from this because the
data quality of a sizeable proportion of credit
38 For our 1Q reference date (23 March 2018), we consider
only contracts outstanding at that date that were executed after 1 January 2018 (to construct a starting point). For dates after 23 March 2018, we consider only contracts executed after the previous reference date to avoid double counting trades. There is also some survival bias because contracts that matured before a reference date are not reported in our data for that date. This bias will
derivatives reports did not permit identification of
the underlying instrument for the first half of 2018,
and so we were unable to check if they were
subject to the clearing obligation. This prevents
us from reliably analysing clearing statistics for
these products in 1H18 and analysing trends
through the year.
ASRD.34 Clearing trends for CDS on Indices
Volatile patterns
Execution: exchange-traded derivatives
stable, trading venue proportion grew
As in 2017, the proportion of overall notional
amount in ETDs remained relatively stable in
2018. The outstanding ETD notional amount was
10% in both 1Q18 and 4Q18, peaking at 12% in
3Q18 (ASRD.35).
ASRD.35 Trading venue proportions split by ETDs and OTC
More derivatives traded on trading venues
At asset level, the proportion of notional amounts
in ETDs grew in equities (from 45% in 1Q18 to
56% in 4Q18), was broadly flat in commodities
decrease for trades executed closer to the reference date, because a smaller proportion of these will have matured or been closed and so been omitted from the data.
39 These are index CDS that have as reference index the iTraxx Europe Main or the iTraxx Europe Crossover. (See https://eur-lex.europa.eu/legal-content/EN/TXT/PDF/?uri=CELEX:32016R0592&from=EN )
0
20
40
60
80
100
45
50
55
60
65
1Q18 2Q18 3Q18 4Q18
Cleared notional Clearing rate (r.h.axis)
Note: Total cleared notional amount outstanding in EUR trillions and clearing rate ofinterest rate derivatives in G4 currencies.Sources: TRs, ESMA.
0
20
40
60
80
100
1
1.1
1.2
1.3
1.4
1.5
1Q18 2Q18 3Q18 4Q18
Tri
llio
ns
Cleared notional Clearing rate (r.h.axis)Note: Total cleared notional amount outstanding in EUR trillions and clearing ratesfor interest rate derivatives in NOK, SEK and PLNSources: TRs, ESMA.
0
20
40
60
80
100
0
200
400
600
1Q18 2Q18 3Q18 4Q18
Cleared notional Clearing rate (r.h.axis)
Note: Total cleared notional amount outstanding in EUR billions and clearing rate
of CDS on European indices. 1Q18 and 2Q18 values may be unrepresentativebecause of data quality limitations during 1H18.Sources: TRs, ESMA.
0%
5%
10%
15%
20%
25%
1Q18 2Q18 3Q18 4Q18
ETD OTC on trading venue
Note: ETD and OTC on trading venue proportions, of total outstanding notional
amount in %.Sources: TRs, ISO, ESMA.
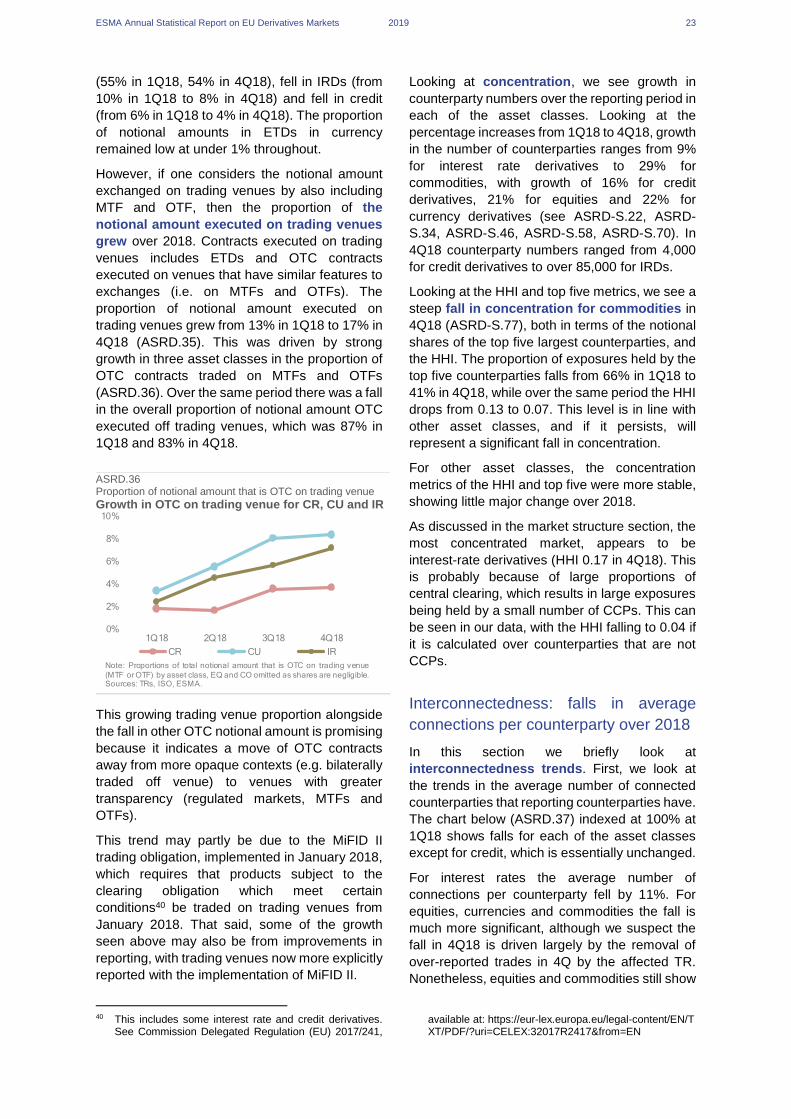
ESMA Annual Statistical Report on EU Derivatives Markets 2019 23
(55% in 1Q18, 54% in 4Q18), fell in IRDs (from
10% in 1Q18 to 8% in 4Q18) and fell in credit
(from 6% in 1Q18 to 4% in 4Q18). The proportion
of notional amounts in ETDs in currency
remained low at under 1% throughout.
However, if one considers the notional amount
exchanged on trading venues by also including
MTF and OTF, then the proportion of the
notional amount executed on trading venues
grew over 2018. Contracts executed on trading
venues includes ETDs and OTC contracts
executed on venues that have similar features to
exchanges (i.e. on MTFs and OTFs). The
proportion of notional amount executed on
trading venues grew from 13% in 1Q18 to 17% in
4Q18 (ASRD.35). This was driven by strong
growth in three asset classes in the proportion of
OTC contracts traded on MTFs and OTFs
(ASRD.36). Over the same period there was a fall
in the overall proportion of notional amount OTC
executed off trading venues, which was 87% in
1Q18 and 83% in 4Q18.
ASRD.36 Proportion of notional amount that is OTC on trading venue
Growth in OTC on trading venue for CR, CU and IR
This growing trading venue proportion alongside
the fall in other OTC notional amount is promising
because it indicates a move of OTC contracts
away from more opaque contexts (e.g. bilaterally
traded off venue) to venues with greater
transparency (regulated markets, MTFs and
OTFs).
This trend may partly be due to the MiFID II
trading obligation, implemented in January 2018,
which requires that products subject to the
clearing obligation which meet certain
conditions40 be traded on trading venues from
January 2018. That said, some of the growth
seen above may also be from improvements in
reporting, with trading venues now more explicitly
reported with the implementation of MiFID II.
40 This includes some interest rate and credit derivatives.
See Commission Delegated Regulation (EU) 2017/241,
Looking at concentration, we see growth in
counterparty numbers over the reporting period in
each of the asset classes. Looking at the
percentage increases from 1Q18 to 4Q18, growth
in the number of counterparties ranges from 9%
for interest rate derivatives to 29% for
commodities, with growth of 16% for credit
derivatives, 21% for equities and 22% for
currency derivatives (see ASRD-S.22, ASRD-
S.34, ASRD-S.46, ASRD-S.58, ASRD-S.70). In
4Q18 counterparty numbers ranged from 4,000
for credit derivatives to over 85,000 for IRDs.
Looking at the HHI and top five metrics, we see a
steep fall in concentration for commodities in
4Q18 (ASRD-S.77), both in terms of the notional
shares of the top five largest counterparties, and
the HHI. The proportion of exposures held by the
top five counterparties falls from 66% in 1Q18 to
41% in 4Q18, while over the same period the HHI
drops from 0.13 to 0.07. This level is in line with
other asset classes, and if it persists, will
represent a significant fall in concentration.
For other asset classes, the concentration
metrics of the HHI and top five were more stable,
showing little major change over 2018.
As discussed in the market structure section, the
most concentrated market, appears to be
interest-rate derivatives (HHI 0.17 in 4Q18). This
is probably because of large proportions of
central clearing, which results in large exposures
being held by a small number of CCPs. This can
be seen in our data, with the HHI falling to 0.04 if
it is calculated over counterparties that are not
CCPs.
Interconnectedness: falls in average
connections per counterparty over 2018
In this section we briefly look at
interconnectedness trends. First, we look at
the trends in the average number of connected
counterparties that reporting counterparties have.
The chart below (ASRD.37) indexed at 100% at
1Q18 shows falls for each of the asset classes
except for credit, which is essentially unchanged.
For interest rates the average number of
connections per counterparty fell by 11%. For
equities, currencies and commodities the fall is
much more significant, although we suspect the
fall in 4Q18 is driven largely by the removal of
over-reported trades in 4Q by the affected TR.
Nonetheless, equities and commodities still show
available at: https://eur-lex.europa.eu/legal-content/EN/TXT/PDF/?uri=CELEX:32017R2417&from=EN
0%
2%
4%
6%
8%
10%
1Q18 2Q18 3Q18 4Q18
CR CU IR
Note: Proportions of total notional amount that is OTC on trading venue
(MTF or OTF) by asset class, EQ and CO omitted as shares are negligible.Sources: TRs, ISO, ESMA.

ESMA Annual Statistical Report on EU Derivatives Markets 2019 24
falls to 3Q of about 15% each. In contrast, for
currencies the average number of counterparties
remains stable up to and including 3Q. Overall,
this suggests, with the exception of credit and
currency, that markets became slightly less
connected over 2018.
ASRD.37 Average connections per counterparty
Falls for most assets in 2018
Next, we look trends using another measure
(ASRD.38). Eigenvector interconnectedness
measures the extent to which the connections in
a market tend to be centralised in a few very
highly connected counterparties. In doing so, it
also takes into account the connections of these
counterparties to other highly connected
counterparties in the network. It ranges from 0
(lowest interconnectedness) to 1 (highest). With
this measure, concentration of connections fell
for all assets in 2018, except for IRDs for which it
increased slightly.
ASRD.38 Eigenvector interconnectedness by asset
Falls for all assets in 2018 except for IR
Despite the falls in the average number of
connections per counterparty and in the
eigenvector interconnectedness for most assets,
connections remain very highly concentrated
among a very small proportion of counterparties
in each of these markets (see ASRD.18 and
ASRD.19).
Summary
Key trends from 1Q18 to 4Q18 were as follows.
— Interest-rate derivatives: IRDs increased in
size in terms of the outstanding notional
amounts (up by 24%) while the number of
transactions fell (by 12%). Clearing rates grew
from 61% in 1Q18 to 63% in 4Q18. Over the
same period, the notional amount of contracts
executed on trading venues grew from 12% to
16% of all the outstanding notional amount.
— Credit derivatives: CDs were rather stable in
size with clearing rates also ranging from 18%
to 25% throughout 2018. The ETD notional
amount grew before falling in 4Q along with a
sharp fall in futures outstanding. This was also
associated with a decrease in the proportion
of contracts with short-term maturities. OTC
contracts executed on trading venues grew
from 2% to 4% of the notional amount.
— Equity derivatives: For equity derivatives,
notional amounts increased while the number
of transactions fell over the year. The number
of CFDs, by far the largest category in terms
of number of transactions, fell in the second
half of the year (probably in part because of a
correction to remove over-reported trades).
Trading venue notional amount, almost
entirely ETDs, grew over the year from 45% to
56% of the outstanding notional amount.
— Currency derivatives: Currency derivatives
experienced a jump in notional amount in
2Q18, associated with a spike in currency
forwards, before falling back down and ending
the year 23% lower than in 1Q18. The trading
venue notional amount, largely OTC, grew
from 4% to 9% of the total amount.
— Commodity derivatives: Commodities were
stable in size until 4Q18 when there was a
marked fall in notional amounts and number
of trades. This was associated with a sharp fall
in futures outstanding in 4Q18. Overall, the
notional amount outstanding fell by 27% from
1Q18 to 4Q18. The ETD notional amount
stood at 55% in 1Q18 and grew up to 3Q18
before falling back to 54% 4Q18. This is
probably associated with the sharp drop in
futures transactions in 4Q18. Concentration
also fell sharply in 4Q18 on all measures.
0%
25%
50%
75%
100%
125%
1Q18 2Q18 3Q18 4Q18
CO CR CU EQ IR
Note: Average connections per reporting counterparty as a percentage of
1Q18 value. Sources: TRs, ESMA.
0.30
0.40
0.50
0.60
1Q18 2Q18 3Q18 4Q18
CO CR CU EQ IRNote: Eigenvector interconnectedness indicator by asset. This measures a
participant's influence based on the number of links it has to otherparticipants within the network and takes into account the connections ofthese participants through the network. It ranges from 0 (lowest) to 1(highest interconnectedness).
Sources: TRs, ESMA.

Statistical methods
Data quality improvements EMIR data are vast and contain detailed information about European derivatives markets. The data are based on reports from EEA counterparties that are provided to trade repositories (TRs), which in turn report to ESMA. An important change for this year’s report was the implementation of new RTS and ITS in November 2017 which significantly increased data usability and quality. To assess the post-RTS/ITS data, we performed several analyses of data quality. This revealed that reporting in 2018 was not always consistent. We identified very substantial over-reporting to one TR by some counterparties during 1H18 and several other cases of inconsistent reporting. For the purpose of this statistical report, data cleaning and correction methods were developed and applied to correct this. The descriptive statistics of the data after cleaning and correction suggest that the data used for this report are of a comparable level of quality to those of last year’s report.
Introduction
In the previous year’s report, we provided an
extensive overview of the main steps that we
undertook to prepare the data for the report.41 In
the same spirit, this year’s methodological
section gives a short overview and update on
EMIR data. First, it summarises the new RTS and
ITS that came into force in November 2017 and
how it facilitated the production of this report. The
second part is devoted to the major data quality
analysis performed by ESMA and highlights key
challenges that we encountered with the 2018
data. In addition, we describe a slight change in
the outlier method that allows more robust
identification of abnormal values. Finally, we
provide descriptive statistics on the data resulting
from the cleaning/correction steps we performed
and show how these affected the presented
aggregates.
European Markets Infrastructure
Regulation data overview
The cornerstone of this report is the underlying
data reported under Article 9 of EMIR. Article 9
requires all counterparties concluding derivatives
transactions located in the EEA42 to report their
trade, (double-reporting regime). The information
is reported by both counterparties separately but
with the same identifier (i.e. trade ID) to a TR. The
TRs then disseminate these reports, filtered
according to access rights, to the relevant
authorities. These authorities can include the
41 Please find the previous edition of the report here:
https://www.esma.europa.eu/press-news/esma-news/esma-data-analysis-values-eu-derivatives-market-%E2%82%AC660-trillion-central-clearing.
42 Also the AIF that are managed by AIFM authorised or registered under Directive 2011/61/EU
43 For an updated list of registered TRs see https://www.esma.europa.eu/supervision/trade-repositories/list-registered-trade-repositories .
European supervisory authorities, national
competent authorities (NCAs) or central banks.
Like last year, we used data coming from all TRs
that were registered in 2018.43 For this year, data
were accessed solely through the TRACE
system.44
Essentially, TRs provide three types of reports to
the authorities: trade-activity, trade-state and
position data. The first, trade-activity data are
very granular, showing each lifecycle event of a
transaction (e.g. creation, valuation, modification,
termination). The next type provided is trade-
state data (also referred to as stock data). In this
aggregation the trade-activity messages are
applied to each outstanding transaction. Hence,
these data show a snapshot with the latest
information on each individual derivative. The
third type of report, position data, provides the
information on outstanding derivatives between
two counterparties at an instrument level.45
As in last year’s report, we use trade state data
because we aim to quantify the whole European
market at a given point in time. We capture all
open transactions within the EEA and between
the EEA and a third country. For each of the
quarterly datapoints we select a Friday in the
middle of the month to avoid potential effects
caused by the expiry dates of ETDs and the
regular compression exercises that happen on
the last Friday of the month. As we use quarterly
data, our four datapoints are based on the
following four months: March, June, September
and December (2018). The number of records in
these four quarterly dates (after the rigorous
44 TRACE is the Access to Trade Repositories System. ESMA’s TRACE provides a single point of access to trade repository data for authorities.
45 For more information please see the guidelines here: https://www.esma.europa.eu/sites/default/files/library/esma70-151-1272_guidelines_on_position_calculation_by_trade_repositories_under_emir_final_report.pdf

ESMA Annual Statistical Report on EU Derivatives Markets 2019 27
cleaning exercise explained below) ranges from
84mn to 145mn.
Data quality improves after the new
regulatory technical standards in 2017
Since the introduction of the new RTS46 and
ITS,47 which came into force on 1 November
2017, we observe an improvement in data
quality as a result of new reporting fields and the
efforts to streamline existing ones. In the
following we focus on the changes that have an
impact on this year’s annual statistical report. The
most important change that significantly
improved data quality was the introduction of the
mandatory fields, ‘asset class’ and ‘contract type’.
As outlined in the previous report, the definition of
these characteristics was quite challenging for
ETDs because the information was not explicitly
reported for these. Hence, we relied on a
proprietary algorithm to classify these contracts.
Under the new RTS this additional data-
processing step became redundant as now every
new transaction needed to be allocated to a
specific asset class (e.g. equity, currency) and a
contract type (e.g. option, future). This improved
the breadth and accuracy of these fields.
An additional change is the new distinction
introduced between trade level and position level
reporting, which allow for a clear identification of
the reports made at position level. The
counterparties can report post-trade events at
position level when certain conditions are met,
i.e. where the trade reports relate to products that
are fungible with each other and where the
original trade reports were correctly reported and
terminated (it is not allowed to report only
positions).48 The possibility to report in this way
alleviates regulatory burdens while still enabling
the same level of risk assessment for the
authorities. In this report we do not systematically
distinguish between the two.
Data quality assessments and
corrections
In preparing this report we extended our data
quality analysis and procedures extensively to
ensure the reliability of our calculations. In the
next two sections we present an analysis on
46 Please see here for the legal text of the RTS: https://eur-
lex.europa.eu/legal-content/EN/TXT/?uri=uriserv:OJ.L_.2017.017.01.0001.01.ENG&toc=OJ:L:2017:017:TOC
47 Please see here for the legal text of the ITS: https://eur-lex.europa.eu/legal-content/EN/TXT/?uri=uriserv:OJ.L_.2017.017.01.0017.01.ENG&toc=OJ:L:2017:017:TOC
reporting consistency for EEA entities and its key
results. The subsequent section presents a
problem of over-reporting to one TR that needed
to be addressed to provide reliable results.
EEA reporting consistency
We conducted a major assessment of data
quality for this report by investigating the
consistency of the reporting of notional amounts
within the EEA. This was possible due to the
double-sided reporting regime mandated within
EMIR, whereby counterparties residing in the
EEA must each report their transaction to a TR.
Our assessment compared the two reported
notional amounts for trades for which both
counterparties were in the EEA to check if
notional amounts matched. A limitation of the
approach was that it excluded trades with a third-
country counterparty, as these have only one
reporting counterparty.
The assessment was based on the cleaned data
(removal of outliers and cleaning procedures as
described below). First, the aggregated notional
amount outstanding was calculated separately
for each of the two reporting counterparties and
compared with each other. Differences in this
amount indicated a reporting inconsistency which
could indicate misreporting. Alternatively, it could
also indicate a disagreement between the two
counterparties over the notional amount, a key
metric in derivatives trading, which could pose an
operational risk for the two counterparties.
This analysis also allows the identification of
entities that systematically over-report,
under-report or do not report at all. One major
example of systematic over-reporting, which was
identified and corrected using this method, is
presented in the following section.
Example of an entity that misreported
Based on the analysis outlined above we
identified one entity that reported a suspiciously
high notional amount in a particular asset class.
This unusual notional amount was identified from
the inter-country exposure map where the
country of this entity stood out.
48 All conditions necessary for reporting at position level are specified in the TR question 17 in the EMIR Q&A under https://www.esma.europa.eu/questions-and-answers

ESMA Annual Statistical Report on EU Derivatives Markets 2019 28
Further analysis revealed that at its peak, in
3Q18, almost 80% of the outstanding notional
amount in one inter-country relationship was
associated with this entity. Comparing the
notional amount positions of this entity with those
reported by its corresponding foreign
counterparties, showed a significant mismatch.
The corresponding counterparties reported less
than 0.1% of the entity’s reported notional
amount and less than 1% of its reported
derivative positions. It was also observed that the
same derivative positions appeared to be
reported multiple times, but each with a new trade
ID issued and assigned. Under the reporting logic
within EMIR this meant that each of these trades
was treated as a new derivative even though
contractually speaking it was not.
From this it became clear that the counterparty
was systematically over-reporting. Hence, we
decided to consider only derivatives reported by
the other counterparties against this entity as
valid and to correct the double reporting as
follows. First, all reports by the affected entity
were removed. Second, the other counterparty’s
notional amounts were assigned to the entity, but
with the buy-sell side identifier reversed.
This method cannot be used for trades involving
a non-EEA entity (such as US-based entities).
These are neglected because they do not fall
under the double-reporting regime. Therefore,
this cleaning procedure is not applicable to all
reports. Nonetheless, it provides a useful method
(assuming the accuracy of the other
counterparty) when faced with systematic data
mismatches between reporting counterparties. In
future reports, we intend to extend this type of
data cleaning more broadly to further reduce data
quality problems from this kind of over-reporting.
Removing trades over-reported to a
trade repository
In 1Q18 and 2Q18 a disproportionate number of
trades was reported to a particular TR. This over-
reporting of trades grew during 1H18. At its
peak in mid-2018, the TR was reporting about
200mn outstanding trades. This was well in
excess of the total number of trades reported to
all other TRs.
Investigating this, we found that many trades in
1H18 were absent from later reports in 2018 and
had inconsistent execution and reporting times.
Therefore, in order to clean the data, trades with
inconsistent execution data and those later
absent in 2018 were removed.
The number of trades for the affected TR (and
overall) decreased significantly in both 1Q18 and
2Q18 when this cleaning procedure was applied.
Trades removed were across all contract types,
but with CFDs particularly represented.
Finally, in the 4Q18 statistics there was also a
significant drop in the number of trades reported
to the same TR in certain asset classes, which
appeared to be a correction made to remove data
that were over-reported to that TR. Given this, the
significant cleaning needed for 1H18, and the
structural break from the introduction of the RTS,
we refrain in the report from comparisons of the
number of transactions in 4Q18 with the 4Q17
figures from the previous year’s report as these
may be unrepresentative. Comparisons instead
focus on notional amounts.
Results and statistics from the cleaning
and correcting process
For the threshold calculation, we introduce this
year an additional correction because some
derivatives are too rarely traded to yield a sample
size that is large enough to allow a sensible
statistical threshold calculation. Whenever we
encounter such a small population of derivatives
they are matched against close neighbours with
valid thresholds (defined by the similarity in the
outlier defining fields). If we encounter two or
more neighbours that have a similar distance, we
select the lower threshold. The outlier removal
exercise reduces the notional amount to EUR
4,297tn while keeping 99.745% of the records
(ASRD.39). The total notional amount is slightly
higher than in 2017, where we observed EUR
4,041tn after outlier removal.
ASRD.39
Cleaning and reconciliation results EMIR data need complex cleaning steps
Raw Outliers removed
Double reporting removed
Expired trades
removed
Commodity 12,872 86 58 58
Credit 7,253 73 57 57
Currency 4,723,712 752 586 586
Equity 472,920 245 160 160
Interest rate 4,836,108 3,082 2,113 2,113
Other 573,586 60 35 35
Total 10,626,452 4,297 3,009 3,009
Note: Total notional amounts in EUR trillions. ‘Raw’ indicates the total notional amount before any outlier identification and treatment. ‘Outliers removed’ indicates the total notional amount after the removal of the outliers. ‘Double reporting removed’ indicates the total notional amount after the removal of double reporting; ‘Expired trades removed’ indicates the total notional amount after expired trades removed. Sources: TRs, ESMA.
ESMA Annual Statistical Report on EU Derivatives Markets 2019 29
In the next step we account for the double
reporting of EMIR. As a large proportion of
derivative transactions are conducted between
EEA counterparties, we see a significant decline
in the notional amount down to EUR 3,009tn.
Interestingly, the relatively large notional amount
removed at this step also indicates how much is
traded among EEA counterparties relative to the
other categories. We can observe that currency
and credit derivatives for which less of the
notional amount is removed at his step, are
traded the most with counterparties in third
countries (e.g. U.S. or Japan). On the other side,
equity, commodity and “other” derivatives, for
which more of the notional amount is removed,
are traded more with the EEA and less with third
countries.
In the final step trades that are expired were
removed. Hardly any records (0.01% of the
sample) and a non-substantial notional amount
(EUR 0.089tn) are affected in this final step.
Conclusion and outlook
In this section we provided a brief overview of the
EMIR data set and the challenges we faced using
it. Regarding the streamlined reporting under the
new RTS/ITS we observed an increase of data
quality which helped us to prepare this report,
using four dates of Trade State data.
Nevertheless, the data preparation was
challenging as we faced a substantial
over-reporting issues. To further increase the
reliability of our calculations we conducted
additional data quality checks using only data
subject to double reporting. This analysis
unveiled other cases of inaccurate reporting
which we addressed. In addition, we introduced
some small adjustments in the outlier
methodology for rarely-traded instruments.
ESMA continues to improve the data quality with
several initiatives in cooperation with the NCAs.
In 2019 ESMA and several NCAs performed the
peer review into supervisory actions aiming at
enhancing the quality of data reported under
EMIR. The exercise found room for improvement
at NCAs and sets out good practices to enhance
data quality supervision.49 Another initiative is the
in 2014 established ‘Data Quality Action Plan’
(DQAP) which is a joint effort by NCAs to improve
data quality in several highly important areas.
ESMA expects further improvement of data
quality thanks to its supervision and the diligent
work of the NCAs.
49 Please see here for the final report:
https://www.esma.europa.eu/press-news/esma-news/esma-sees-significant-room-improvement-in-national-regulators%E2%80%99-supervision
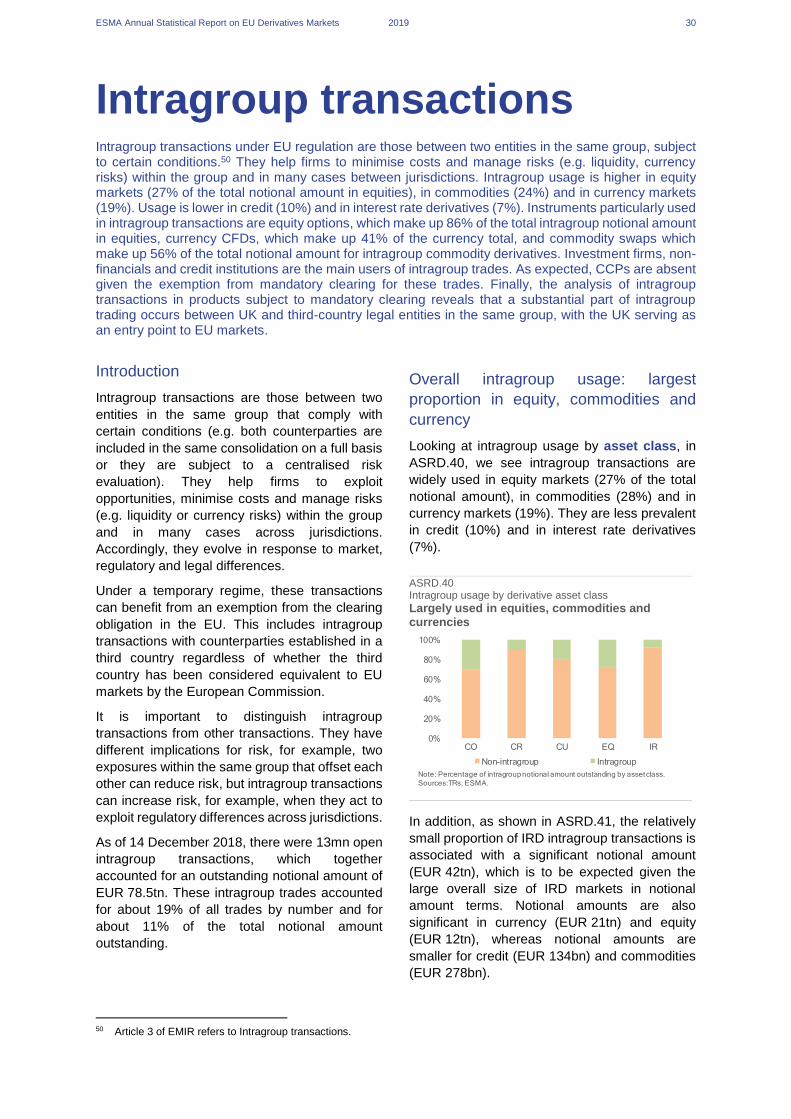
ESMA Annual Statistical Report on EU Derivatives Markets 2019 30
Intragroup transactions Intragroup transactions under EU regulation are those between two entities in the same group, subject to certain conditions.50 They help firms to minimise costs and manage risks (e.g. liquidity, currency risks) within the group and in many cases between jurisdictions. Intragroup usage is higher in equity markets (27% of the total notional amount in equities), in commodities (24%) and in currency markets (19%). Usage is lower in credit (10%) and in interest rate derivatives (7%). Instruments particularly used in intragroup transactions are equity options, which make up 86% of the total intragroup notional amount in equities, currency CFDs, which make up 41% of the currency total, and commodity swaps which make up 56% of the total notional amount for intragroup commodity derivatives. Investment firms, non-financials and credit institutions are the main users of intragroup trades. As expected, CCPs are absent given the exemption from mandatory clearing for these trades. Finally, the analysis of intragroup transactions in products subject to mandatory clearing reveals that a substantial part of intragroup trading occurs between UK and third-country legal entities in the same group, with the UK serving as an entry point to EU markets.
Introduction
Intragroup transactions are those between two
entities in the same group that comply with
certain conditions (e.g. both counterparties are
included in the same consolidation on a full basis
or they are subject to a centralised risk
evaluation). They help firms to exploit
opportunities, minimise costs and manage risks
(e.g. liquidity or currency risks) within the group
and in many cases across jurisdictions.
Accordingly, they evolve in response to market,
regulatory and legal differences.
Under a temporary regime, these transactions
can benefit from an exemption from the clearing
obligation in the EU. This includes intragroup
transactions with counterparties established in a
third country regardless of whether the third
country has been considered equivalent to EU
markets by the European Commission.
It is important to distinguish intragroup
transactions from other transactions. They have
different implications for risk, for example, two
exposures within the same group that offset each
other can reduce risk, but intragroup transactions
can increase risk, for example, when they act to
exploit regulatory differences across jurisdictions.
As of 14 December 2018, there were 13mn open
intragroup transactions, which together
accounted for an outstanding notional amount of
EUR 78.5tn. These intragroup trades accounted
for about 19% of all trades by number and for
about 11% of the total notional amount
outstanding.
50 Article 3 of EMIR refers to Intragroup transactions.
Overall intragroup usage: largest
proportion in equity, commodities and
currency
Looking at intragroup usage by asset class, in
ASRD.40, we see intragroup transactions are
widely used in equity markets (27% of the total
notional amount), in commodities (28%) and in
currency markets (19%). They are less prevalent
in credit (10%) and in interest rate derivatives
(7%).
ASRD.40 Intragroup usage by derivative asset class
Largely used in equities, commodities and currencies
In addition, as shown in ASRD.41, the relatively
small proportion of IRD intragroup transactions is
associated with a significant notional amount
(EUR 42tn), which is to be expected given the
large overall size of IRD markets in notional
amount terms. Notional amounts are also
significant in currency (EUR 21tn) and equity
(EUR 12tn), whereas notional amounts are
smaller for credit (EUR 134bn) and commodities
(EUR 278bn).
0%
20%
40%
60%
80%
100%
CO CR CU EQ IR
Non-intragroup Intragroup
Note: Percentage of intragroup notional amount outstanding by assetclass.
Sources:TRs, ESMA.
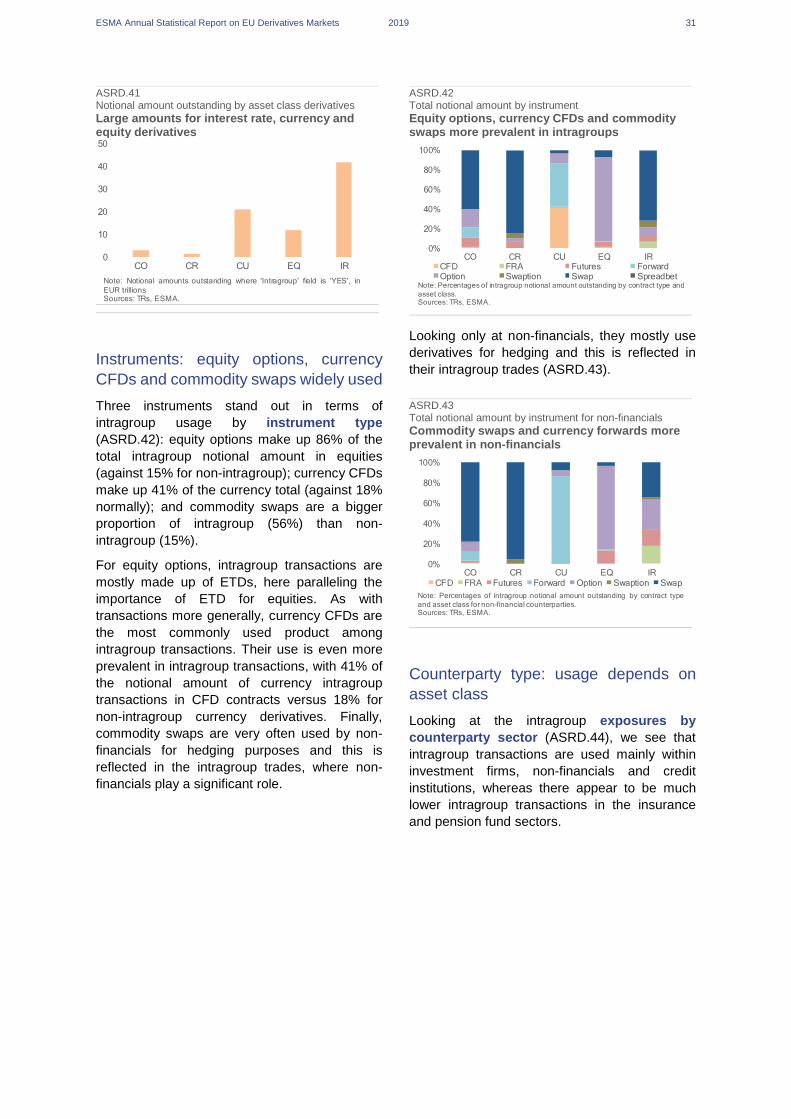
ESMA Annual Statistical Report on EU Derivatives Markets 2019 31
ASRD.41 Notional amount outstanding by asset class derivatives
Large amounts for interest rate, currency and equity derivatives
Instruments: equity options, currency
CFDs and commodity swaps widely used
Three instruments stand out in terms of
intragroup usage by instrument type
(ASRD.42): equity options make up 86% of the
total intragroup notional amount in equities
(against 15% for non-intragroup); currency CFDs
make up 41% of the currency total (against 18%
normally); and commodity swaps are a bigger
proportion of intragroup (56%) than non-
intragroup (15%).
For equity options, intragroup transactions are
mostly made up of ETDs, here paralleling the
importance of ETD for equities. As with
transactions more generally, currency CFDs are
the most commonly used product among
intragroup transactions. Their use is even more
prevalent in intragroup transactions, with 41% of
the notional amount of currency intragroup
transactions in CFD contracts versus 18% for
non-intragroup currency derivatives. Finally,
commodity swaps are very often used by non-
financials for hedging purposes and this is
reflected in the intragroup trades, where non-
financials play a significant role.
ASRD.42 Total notional amount by instrument
Equity options, currency CFDs and commodity swaps more prevalent in intragroups
Looking only at non-financials, they mostly use
derivatives for hedging and this is reflected in
their intragroup trades (ASRD.43).
ASRD.43 Total notional amount by instrument for non-financials
Commodity swaps and currency forwards more prevalent in non-financials
Counterparty type: usage depends on
asset class
Looking at the intragroup exposures by
counterparty sector (ASRD.44), we see that
intragroup transactions are used mainly within
investment firms, non-financials and credit
institutions, whereas there appear to be much
lower intragroup transactions in the insurance
and pension fund sectors.
0
10
20
30
40
50
CO CR CU EQ IR
Tri
llio
ns
Note: Notional amounts outstanding where 'Intragroup' field is 'YES', in
EUR trillionsSources: TRs, ESMA.
0%
20%
40%
60%
80%
100%
CO CR CU EQ IRCFD FRA Futures ForwardOption Swaption Swap Spreadbet
Note: Percentages of intragroup notional amount outstanding by contract type and
asset class.Sources: TRs, ESMA.
0%
20%
40%
60%
80%
100%
CO CR CU EQ IRCFD FRA Futures Forward Option Swaption Swap
Note: Percentages of intragroup notional amount outstanding by contract type
and asset class for non-financial counterparties.Sources: TRs, ESMA.

ESMA Annual Statistical Report on EU Derivatives Markets 2019 32
ASRD.44 Notional amount by type of counterparty
Notional amount concentrated in three sectors
Usage in asset classes varies widely by
counterparty type (ASRD.45), reflecting different
business needs. Notional amounts of commodity
intragroup transactions are mainly associated
with non-financials (69% of total notional amount)
and investment firms (29%), with credit
institutions at 3%. For currency, 67% of
intragroup notional amount is in investment firms,
24% in non-financials, 6% in credit institutions
and 3% in pension funds. Exceptionally, among
asset classes, pension funds are represented in
intragroup currency transactions.
For credit, the distribution is similar to
commodities, with investment firms at 35% and
non-financials at 51%, but with a difference:
UCITS here make up 9% of the intragroup
notional amount for this market, which is in line
with a previous analysis.51 For equity and IRDs,
most trading occurs within the investment firm
sector, but credit institutions are also more
present than for other asset classes (with 21%
and 22% of the total notional amounts
respectively). Insurance intragroup exposure
culminates at EUR 41bn for IRDs, less than
0.01% of the total notional amount.
ASRD.45 Notional amount by type of counterparty
Usage in all sectors but insurance
51 Use of derivatives by UCITS equity funds, ESMA, TRV 2
2019.
Maturities: slightly less notional amount
proportion in short-term maturities than
non-intragroup
The proportion of notional amount where the
initial maturity of the contract is less than
1-year is slightly smaller for intragroup
transactions than for non-intragroup ones, across
all asset classes (ASRD.46). For currency
derivatives the proportion of notional amount of
products with maturity of one year or less stands
at 79% (versus 86% for non-intragroup
transactions, for commodities it is 67% (versus
79%), for equities it is 52% (versus 65%), and for
IRDs it is 22% (versus 32%).
ASRD.46 Initial trade maturity
Slightly less notional amount in short-term trades than non-intragroup
The picture also looks similar for average time
remaining to maturity, as of 4Q18 (ASRD.47),
although with shorter maturities given that time
has passed since origination.
ASRD.47 Remaining maturity
Even less in long-term trades for CR and IR
Average trade-size: lower for intragroup,
except for currency derivatives
Average trade-sizes are slightly lower for
intragroup trades than non-intragroup
0
50
100
150
200
250
Non-intragroup Intragroup
Note: Total intragroup versus non-intragroup amounts outstanding by sector of
the counterparty, in EUR trillions. AIF - Alternative Investment Funds.Sources: TRs, ESMA.
0%
20%
40%
60%
80%
100%
CO CR CU EQ IR
Insurance Credit institution Investment firms
AIF Pension fund UCITS
Non-financial
Note: Percentages of total notional amounts by sector of the reporting
counterparty and assetclass.Sources: TRs, ESMA.
0%
20%
40%
60%
80%
100%
CO CR CU EQ IROne year or less Over 1 year up to 5 years Over 5 years
Note: Percentage of total notional amounts outstanding by initial trade maturiy
and asset class.Sources: TRs, ESMA.
0%
20%
40%
60%
80%
100%
CO CR CU EQ IROne year or less Over 1 year up to 5 years Over 5 years
Note: Percentage of total notional amounts outstanding by time to maturity and
asset class.Sources: TRs, ESMA.

ESMA Annual Statistical Report on EU Derivatives Markets 2019 33
transactions (ASRD.48) for equity (EUR 2.2mn
as against EUR 6.1mn for non-intragroup
transactions), commodities (EUR 1.1mn as
against EUR 2mn), interest rates (EUR 71mn as
against EUR 80mn) and credit (EUR 15mn as
against EUR 17mn).52
ASRD.48 Average trade notional amount by asset class
Smaller intragroup trade size for all but CUs
The exception is currency derivatives, where the
average intragroup transaction size is a larger
(EUR 3.9mn versus. EUR 2.4mn for non-
intragroup transactions). This could be explained
by the fact that currency derivatives are mostly
OTC non-cleared derivatives where the post-
trade bundling of different trades into positions is
much less common than for other asset classes.
Type of trading: as for the overall market
dominance of OTC except for equity
In terms of split by type of execution venue
(ASRD.49), 53% of the equity intragroup notional
amount is ETD (against 60% for non-intragroup
transactions). This is in clear contrast to other
asset classes, which are predominantly or almost
entirely OTC by notional amount. Proportions in
ETDs are 17%, 10% and 9% for commodities,
credit and interest rate derivatives respectively
(against 69%, 2% and 9%, respectively for non-
intragroup transactions). Only 0.4% of currency
derivatives are ETDs. Except for credit
derivatives, the proportion of ETDs is thus
smaller or similar for intragroup transactions than
for non-intragroup transactions.
ETD numbers for intragroup transactions may,
however, be an underestimate given that
counterparties to an ETD transaction are not
expected to report whether or not it is an
intragroup transaction.
52 Note that as transactions can include positions which
combine multiple trades, the metric of average size here is more informative about the relative size of trades
Geographical exposures: mainly
between the United Kingdom and the
United States
Cross-border exposures of groups are important
indicators of firms’ structuring their derivative
businesses to adjust to and exploit market,
regulatory and legal differences between states.
In addition, given the important role of the United
Kingdom in derivatives markets, it also sheds
light on the extent to the United Kingdom is used
to channel business between the EEA and third
countries and within the EEA, as for non-
intragroup transactions.
ASRD.49 EEA intragroup transactions: geographical network
Dominated by the UK
Note: Undirected network of total notional amount outstanding. The size of the bubbles is proportional to the total notional amount outstanding for counterparties domiciled in the Member State. The thickness of the line is proportional to the total notional amount outstanding between counterparties from the two Member States. The orange bubbles represent intra-country transactions. Sources: TRs, GLEIF, ESMA.
Focusing on intra-EEA transactions, it is
immediately clear that a significant proportion of
the intragroup transactions involves United
Kingdom counterparties. Most firms that have
cross-EEA exposures within their groups have an
entity in the United Kingdom as a counterparty.
The United Kingdom also has the largest
intragroup exposures by notional amount
(ASRD.50).
Zooming out to include intragroup exposures with
counterparties outside the EEA (ASRD.51), we
can see that intragroup transactions between UK
and third-country counterparties are substantial.
A pattern emerges of big third-country groups,
with headquarters located for example in the
United States, trading with their United Kingdom
subsidiaries in order to access the EU market.
between asset classes, than about the average amount per trade.
0
20
40
60
80
100
CO CR CU EQ IR
Millio
ns
Non-intragroup Intragroup
Note: Average trade size of intragroup versus non-intragroup trades, in EUR
millions.Sources: TRs, ESMA.

ESMA Annual Statistical Report on EU Derivatives Markets 2019 34
ASRD.50 Overall intragroup transactions: geographical network
Big UK versus third country notional amounts
Note: Undirected network of total notional amount outstanding. The size of the bubbles is proportional to the total notional amount outstanding for counterparties domiciled in the Member State. The thickness of the line is proportional to the total notional amount outstanding between counterparties from the two Member States. Sources: TRs, GLEIF, ESMA.
Intragroup transactions and the clearing
obligation
Intragroup transactions between EU
counterparties are exempt from mandatory
clearing. Intragroup transactions with a
counterparty established in a third country are
only temporarily exempted from the clearing
obligation until 21 December 2020, if no
equivalence decision has been adopted in the
meantime with the third country of establishment.
In this context, it is important to monitor various
characteristics of these intragroup trades that are
subject to an exemption from the clearing
obligation. Trade sizes, and the extent to which
they are between EU and third country
counterparties as well as between EU-27 and UK
counterparties, are of particular importance to
assess the impact of the exemption regime.
Three categories of derivative products are
subject to OTC mandatory clearing in the EU:
1) basis, fixed-to-float and overnight
indexed interest rate swaps as well as
FRAs denominated in the G4 currencies
(EUR, GBP, USD or JPY), all of which
were the first classes of instrument to be
subject to mandatory clearing, and which
came into effect in 2016;
2) index credit default swaps, which
followed in 2017;
3) FRA and fixed-to-float swaps in NOK,
PLN and SEK, which also came into
effect in 2017.
A first interesting finding is that, whereas for the
credit derivatives virtually no central clearing
occurs, around 8% of the intragroup notional
amount for the two interest rate subclasses are
cleared, despite the intragroup exemption.
IRDs denominated in G4 currencies:
intragroup transactions increase in 2018
For interest rate derivatives denominated in one
of the G4 currencies (EUR, USD, GBP, JPY),
intragroup notional amount volumes increased
from EUR 20tn (6% of total notional amount) in
1Q18 to EUR 34tn (9%) in 4Q18 (ASRD.52).
ASRD.51 IRD G4 total notional amounts outstanding
Large relative increase in intragroup notional amount
In terms of number of trades outstanding, there
were about 290,000 intragroup transactions for
these products in 1Q18, which had increased to
330,000 by 4Q18.
As discussed above for derivatives in general, the
average size of an intragroup transactions is
0
100
200
300
400
500
1Q18 2Q18 3Q18 4Q18
Tri
llio
ns
Non-intragroup Intragroup
:Note: Total notional amounts outstanding in IRDs denominated in NOK, PLN or
SEK, in EUR trillions.Sources: TRs, ESMA.

ESMA Annual Statistical Report on EU Derivatives Markets 2019 35
smaller for IRDs, unlike other assets (ASRD.48).
This holds also for the average size of an
intragroup trade in IRDs subject to the clearing
obligation –– here intragroup trades are also
smaller than the non-intragroup ones. One
possible explanation is that non-intragroup
transactions in IRDs subject to the clearing
obligation are bundled and reported as part of
bigger positions, unlike intragroup trades that are
not subject to the clearing obligation. The same
pattern is also present for the other two classes
of instruments subject to clearing obligation.
Looking now at the geographical distribution of
intragroup transactions for interest rate
derivatives denominated in G4 currencies, we
see that most of the notional amount is in
exposures between UK and non-EEA
counterparties. The notional amount (ASRD.53)
also increased over the year. almost doubling
between 1Q18 and 4Q18.
ASRD.52 Intragroup IRD G4: total notional amount by counterparty location
Mainly between United Kingdom and third-countries
Nevertheless, looking at the number of
transactions (ASRD.54), intra-EEA-3053 trades
53 EEA-30 refers to EEA states excluding the United
Kingdom as of 4Q18.
are relatively more important than in terms of
notional amounts making intra EEA trades bigger
on average than the others. The increasing trend
seen in the notional amounts is also absent as
the number of outstanding transactions is
decreasing over the year.
ASRD.53 Intragroup IRD G4 – trades by counterparty location
Higher number of trades within the EEA
The extent of the UK-to-third-country exposures
is even clearer in the map below (ASRD.55)
which shows cross-country intragroup notional
amount aggregates globally. The bulk of the EU
market for IRDs in the four big currencies occur
between the United Kingdom and third countries,
especially Japan and the United States. Big
international groups here are accessing the EU
market through their United Kingdom
subsidiaries.
0
5
10
15
20
25
30
Intra-EEA30 EEA30-TC EEA30-UK UK-TC Intra-UK
Tri
llio
ns
1Q18 2Q18 3Q18 4Q18
Note: Notional amounts oustanding by zone of both counterparties, in EUR trillions.
TC denotes third-country (not EEA-30 and not UK).Sources: TRs, ESMA.
0
50
100
150
200
250
Intra-EEA30 EEA30-TC EEA30-UK UK-TC Intra-UK
Th
ou
sa
nd
s
1Q18 2Q18 3Q18 4Q18
Note: Number of transactions by zone of both counterparties, in thousands. TC
denotes third-country (not EEA-30 and not UK).Sources: TRs, ESMA.

ESMA Annual Statistical Report on EU Derivatives Markets 2019 36
ASRD.54 IRS G4 intragroup notional amount outstanding
Intra-EEA and UK-US exposures dominate
Note: Undirected network of total notional amount outstanding. The size of the bubbles is proportional to the total notional amount outstanding for counterparties domiciled in the Member State. The thickness of the line is proportional to the total notional amount outstanding between counterparties from the two Member States. Sources: TRs, ESMA. GLEIF.
Looking more closely at intra-EEA exposures the
picture is similar to the full IRD market, with the
main exposures between the United Kingdom
and a few continental European countries,
particularly France (ASRD.56).
ASRD.55 EEA intragroup transactions: geographical network – IRDs in G4
Dominated by the United Kingdom and France
Note: Undirected network of total notional amount outstanding. The size of the bubbles is proportional to the total notional amount outstanding for counterparties domiciled in the Member State. The thickness of the line is proportional to the total notional amount outstanding between counterparties from the two Member States. The orange bubbles represent intra-country transactions. Sources: TRs, GLEIF, ESMA.
CDS indices: intragroup transactions
mainly between the UK and the US
In this section we turn to credit default swap
indices subject to the clearing obligation (ITraxx
Europe Main and ITraxx Europe-Crossover). For
these, the number of transactions and the
proportion of intragroup notional amounts
increase in 2018, and substantially in 4Q.
However, these trends are unlikely to reflect the
market because in 1H18 for a sizeable proportion
of credit derivatives, data quality did not permit
identification of the underlying instrument. This
hampers categorisation of products as subject to
the clearing obligation in this time period.
As the data had improved significantly by 4Q18,
we focus on 4Q18 here. Looking at ASRD.57 we
see that the vast majority of the intragroup
notional amount outstanding is in between UK
and third country counterparties. The very large
size of UK-to-third-country exposures relative to
other exposures is much more pronounced than
for IRDs in G4 currencies.
ASRD.56 Intragroup CDS ITraxx – total notional amount by counterparty location
Mainly between the United Kingdom and third-countries in 4Q
In addition, the vast majority of UK to third-
country intragroup transactions are between UK
and US counterparties, with some between UK
and Japanese counterparties (ASRD.58).
10
100
1,000
10,000
100,000
1,000,000
Millio
ns
Intra-EEA30 EEA30-UK UK-TC Intra-UK
Note: Total notional amounts outstanding by zone of both counterparties, in EUR
millions. Logarithmic scale. TC refers to third-country (non-EEA-30 and non-UK).Sources: TRs, ESMA.
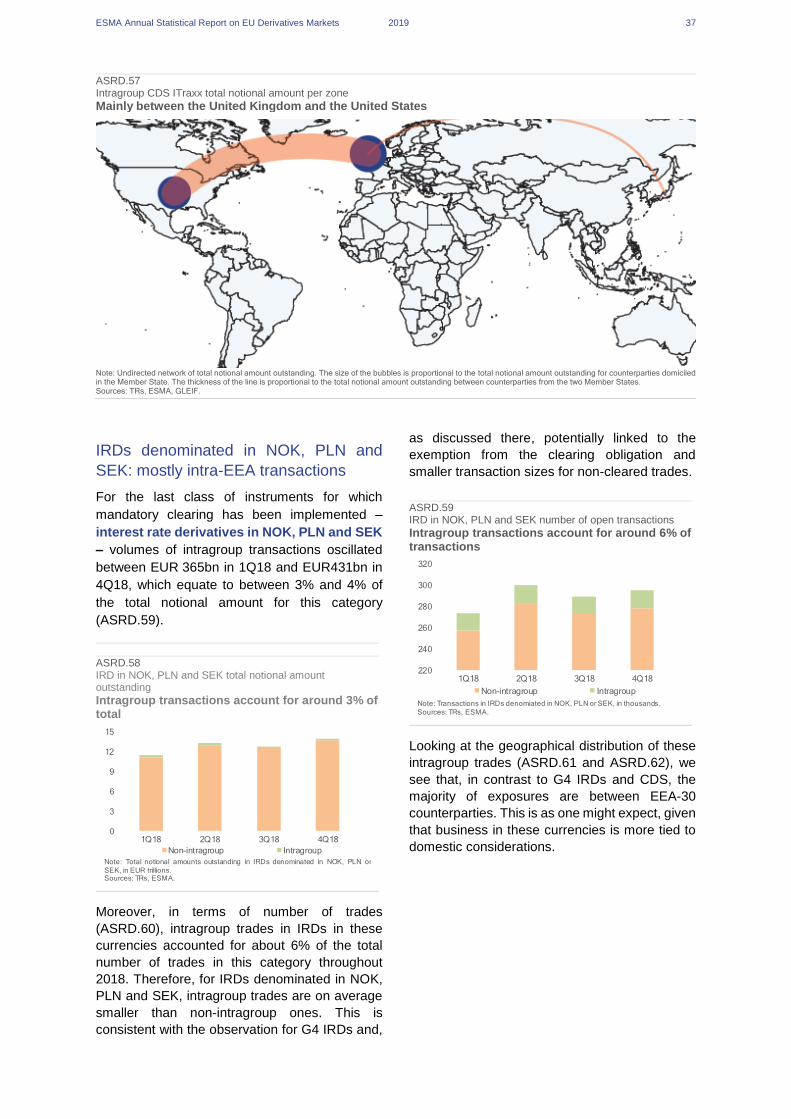
ESMA Annual Statistical Report on EU Derivatives Markets 2019 37
ASRD.57 Intragroup CDS ITraxx total notional amount per zone
Mainly between the United Kingdom and the United States
Note: Undirected network of total notional amount outstanding. The size of the bubbles is proportional to the total notional amount outstanding for counterparties domiciled in the Member State. The thickness of the line is proportional to the total notional amount outstanding between counterparties from the two Member States. Sources: TRs, ESMA, GLEIF.
IRDs denominated in NOK, PLN and
SEK: mostly intra-EEA transactions
For the last class of instruments for which
mandatory clearing has been implemented –
interest rate derivatives in NOK, PLN and SEK
– volumes of intragroup transactions oscillated
between EUR 365bn in 1Q18 and EUR431bn in
4Q18, which equate to between 3% and 4% of
the total notional amount for this category
(ASRD.59).
ASRD.58 IRD in NOK, PLN and SEK total notional amount outstanding
Intragroup transactions account for around 3% of total
Moreover, in terms of number of trades
(ASRD.60), intragroup trades in IRDs in these
currencies accounted for about 6% of the total
number of trades in this category throughout
2018. Therefore, for IRDs denominated in NOK,
PLN and SEK, intragroup trades are on average
smaller than non-intragroup ones. This is
consistent with the observation for G4 IRDs and,
as discussed there, potentially linked to the
exemption from the clearing obligation and
smaller transaction sizes for non-cleared trades.
ASRD.59 IRD in NOK, PLN and SEK number of open transactions
Intragroup transactions account for around 6% of transactions
Looking at the geographical distribution of these
intragroup trades (ASRD.61 and ASRD.62), we
see that, in contrast to G4 IRDs and CDS, the
majority of exposures are between EEA-30
counterparties. This is as one might expect, given
that business in these currencies is more tied to
domestic considerations.
0
3
6
9
12
15
1Q18 2Q18 3Q18 4Q18
Tri
llio
ns
Non-intragroup Intragroup
Note: Total notional amounts outstanding in IRDs denominated in NOK, PLN or
SEK, in EUR trillions.Sources: TRs, ESMA.
220
240
260
280
300
320
1Q18 2Q18 3Q18 4Q18
Th
ou
sa
nd
s
Non-intragroup Intragroup
Note: Transactions in IRDs denomiated in NOK, PLN or SEK, in thousands.
Sources: TRs, ESMA.
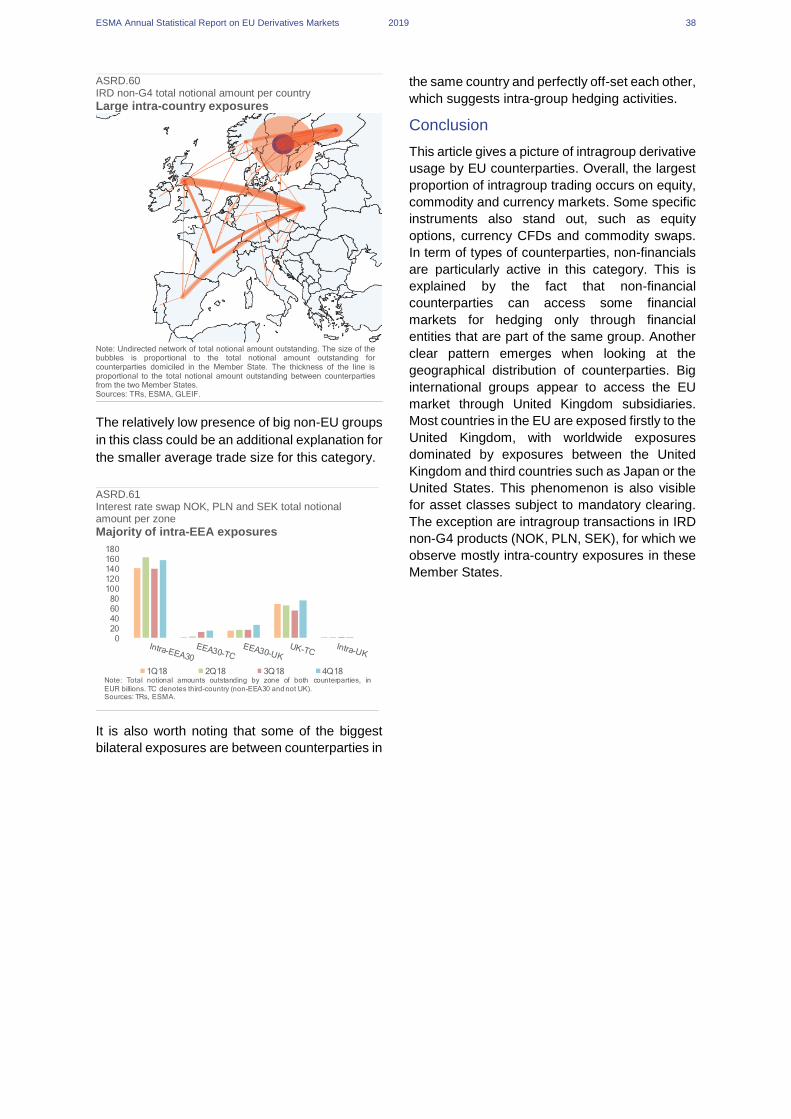
ESMA Annual Statistical Report on EU Derivatives Markets 2019 38
ASRD.60 IRD non-G4 total notional amount per country
Large intra-country exposures
Note: Undirected network of total notional amount outstanding. The size of the bubbles is proportional to the total notional amount outstanding for counterparties domiciled in the Member State. The thickness of the line is proportional to the total notional amount outstanding between counterparties from the two Member States. Sources: TRs, ESMA, GLEIF.
The relatively low presence of big non-EU groups
in this class could be an additional explanation for
the smaller average trade size for this category.
ASRD.61 Interest rate swap NOK, PLN and SEK total notional amount per zone
Majority of intra-EEA exposures
It is also worth noting that some of the biggest
bilateral exposures are between counterparties in
the same country and perfectly off-set each other,
which suggests intra-group hedging activities.
Conclusion
This article gives a picture of intragroup derivative
usage by EU counterparties. Overall, the largest
proportion of intragroup trading occurs on equity,
commodity and currency markets. Some specific
instruments also stand out, such as equity
options, currency CFDs and commodity swaps.
In term of types of counterparties, non-financials
are particularly active in this category. This is
explained by the fact that non-financial
counterparties can access some financial
markets for hedging only through financial
entities that are part of the same group. Another
clear pattern emerges when looking at the
geographical distribution of counterparties. Big
international groups appear to access the EU
market through United Kingdom subsidiaries.
Most countries in the EU are exposed firstly to the
United Kingdom, with worldwide exposures
dominated by exposures between the United
Kingdom and third countries such as Japan or the
United States. This phenomenon is also visible
for asset classes subject to mandatory clearing.
The exception are intragroup transactions in IRD
non-G4 products (NOK, PLN, SEK), for which we
observe mostly intra-country exposures in these
Member States.
020406080
100120140160180
Billio
ns
1Q18 2Q18 3Q18 4Q18Note: Total notional amounts outstanding by zone of both counterparties, in
EUR billions. TC denotes third-country (non-EEA30 and not UK).Sources: TRs, ESMA.
ESMA Annual Statistical Report on EU Derivatives Markets 2019 39
Derivatives statistics

ESMA Annual Statistical Report on EU Derivatives Markets 2019 40
Market structure
EU derivatives market
ASRD-S.1 ASRD-S.2
Total notional amount by asset class Number of derivative contracts by asset class
ASRD-S.3 ASRD-S.4
Total notional amount by contract type Total notional amount by remaining maturity
ASRD-S.5 ASRD-S.6
Total notional amount by maturity at execution Total notional amount by sector of counterparty
ASRD-S.7 ASRD-S.8
Total notional amount by type of execution Clearing rates
Commodity1%
Credit2%
Currency15%
Equity6%Interest rate
76%
Other0%
Note: Percentages of total notional amount outstandingby asset class.
Sources: TRs, ESMA.
Commodity13%
Credit1%
Currency49%
Equity25%
Interest rate12%
Other0%
Note: Percentages of outstanding derivative contracts by asset class.
Sources: TRs, ESMA.
0%
20%
40%
60%
80%
100%
All CO CR CU EQ IRCFD Forward FRA Futures Option
Spreadbet Swap Swaption OtherNote: Proportions of total notional amount outstanding by contract type and asset
class, in %.Sources: TRs, ESMA.
0%
20%
40%
60%
80%
100%
All CO CR CU EQ IR
One year or less Over 1 year up to 5 years Over 5 years
Note: Proportions of total notional amount outstanding by remaining maturity of
the contract and by asset class, in %.Sources: TRs, ESMA.
0%
20%
40%
60%
80%
100%
All CO CR CU EQ IR
One year or less Over 1 year up to 5 years Over 5 yearsNote: Proportions of total notional amount outstanding by maturity at execution
of the contract and asset class, in %.Sources: TRs, ESMA.
0%
20%
40%
60%
80%
100%
All CO CR CU EQ IR
AIF Assurance CCPCredit institution Pension fund InsuranceInvestment firm Non-financial firm UCITS
Note: Proportions of total notional amount outstanding (not reconciled) by
counterparty and assetclass, in %.Sources: TRs, ESMA.
0%
20%
40%
60%
80%
100%
All CO CR CU EQ IR
ETD OTC
Note: Percentages of total notional amount outstanding by ETD and OTC by
asset class.Sources: TRs, ESMA.
0
20
40
60
80
100
CO CR CU EQ IR
Note: Proportions of OTC notional amount outstanding cleared by asset
class, in %.Sources: TRs, ESMA:

ESMA Annual Statistical Report on EU Derivatives Markets 2019 41
ASRD-S.9 ASRD-S.10
Concentration: HHI and top-five counterparties Total notional amount by currency
ASRD-S.11 ASRD-S.12
Interest rate derivatives: Intra-EEA network Credit derivatives: Intra-EEA network
ASRD-S.13 ASRD-S.14 Currency derivatives: Intra-EEA network Equity derivatives: Intra-EEA network
ASRD-S.15 Commodity derivatives: Intra-EEA network
-
0.04
0.08
0.12
0.16
0.20
0%
20%
40%
60%
80%
100%
CO CR CU EQ IRTop 5 excl. CCPs Top 5 incl. CCPsHHI excl. CCPs (r.h.axis) HHI incl. CCPs (r.h.axis)
Note: HHI and notional amount share in % of top-five counterparties calculated
on aggregated notional positions of counterparties. HHI normalised between 0and 1.Sources: TRs, ESMA.
0%
20%
40%
60%
80%
100%
All CO CR CU EQ IR
AUD CAD EUR GBP JPY USD
Note: Proportions of total notional amount outstanding by currency and asset
class, in %.Sources: TRs, ESMA.
Note: Undirected network of total notional amount outstanding. The size of the bubbles is proportional to the total notional amount outstanding for counterparties domiciled in the Member State. The thickness of the line is proportional to the total notional amount outstanding between counterparties from the two Member States. Sources: TRs, GLEIF, ESMA.
Note: Undirected network of total notional amount outstanding. The size of the bubbles is proportional to the total notional amount outstanding for counterparties domiciled in the Member State. The thickness of the line is proportional to the total notional amount outstanding between counterparties from the two Member States. Sources: TRs, GLEIF, ESMA.
Note: Undirected network of total notional amount outstanding. The size of the bubbles is proportional to the total notional amount outstanding for counterparties domiciled in the Member State. The thickness of the line is proportional to the total notional amount outstanding between counterparties from the two Member States. Sources: TRs, GLEIF, ESMA. Sources: TRs, GLEIF, ESMA.
Note: Undirected network of total notional amount outstanding. The size of the bubbles is proportional to the total notional amount outstanding for counterparties domiciled in the Member State. The thickness of the line is proportional to the total notional amount outstanding between counterparties from the two Member States. Sources: TRs, GLEIF, ESMA.
Note: Undirected network of total notional amount outstanding. The size of the bubbles is proportional to the total notional amount outstanding for counterparties domiciled in the Member State. The thickness of the line is proportional to the total notional amount outstanding between counterparties from the two Member States. Sources: TRs, GLEIF, ESMA.

ESMA Annual Statistical Report on EU Derivatives Markets 2019 42
ASRD-S.16 Interest rate derivatives: global network involving EU or EEA counterparty
ASRD-S.17 Credit derivatives: global network involving EU or EEA counterparty
ASRD-S.18 Currency derivatives: global network involving EU or EEA counterparty
ASRD-S.19 Equity derivatives: global network involving EU or EEA counterparty
Note: Undirected network of total notional amount outstanding. The size of the bubbles is proportional to the total notional amount outstanding for counterparties domiciled in the Member State. The thickness of the line is proportional to the total notional amount outstanding between counterparties from the two Member States. Sources: TRs, GLEIF, ESMA. .
Note: Undirected network of total notional amount outstanding. The size of the bubbles is proportional to the total notional amount outstanding for counterparties domiciled in the Member State. The thickness of the line is proportional to the total notional amount outstanding between counterparties from the two Member States. Sources: TRs, GLEIF, ESMA.
Note: Undirected network of total notional amount outstanding. The size of the bubbles is proportional to the total notional amount outstanding for counterparties domiciled in the Member State. The thickness of the line is proportional to the total notional amount outstanding between counterparties from the two Member States. Sources: TRs, GLEIF, ESMA. .
Note: Undirected network of total notional amount outstanding. The size of the bubbles is proportional to the total notional amount outstanding for counterparties domiciled in the Member State. The thickness of the line is proportional to the total notional amount outstanding between counterparties from the two Member States. Sources: TRs, GLEIF, ESMA. .

ESMA Annual Statistical Report on EU Derivatives Markets 2019 43
ASRD-S.20 Commodity derivatives: global network involving EU or EEA counterparty
Note: Undirected network of total notional amount outstanding. The size of the bubbles is proportional to the total notional amount outstanding for counterparties domiciled in the Member State. The thickness of the line is proportional to the total notional amount outstanding between counterparties from the two Member States. Sources: TRs, GLEIF, ESMA.

ESMA Annual Statistical Report on EU Derivatives Markets 2019 44
Market trends
Interest rate derivatives market
ASRD-S.21 ASRD-S.22
Total notional amount by contract type Number of transactions by contract type
ASRD-S.23 ASRD-S.24
Total notional amount by sector of counterparty Total notional amount by remaining maturity
ASRD-S.25 ASRD-S.26
Total notional amount by maturity at execution ETD versus OTC
ASRD-S.27 ASRD-S.28
Trading venue notional amounts OTC and ETDs Clearing rates
0
150
300
450
600
1Q18 2Q18 3Q18 4Q18
CFD Forward FRA Futures Option
Spreadbet Swap Swaption OtherNote: Total notional amount outstanding by contract type, in EUR trillions.
Sources: TRs, ESMA.
0
3
6
9
12
1Q18 2Q18 3Q18 4Q18CFD Forward FRA Futures Option
Spreadbet Swap Swaption Other
Note: Number of transactions by contract type, in millions.
Sources: TRs, ESMA.
0%
20%
40%
60%
80%
100%
1Q18 2Q18 3Q18 4Q18AIF Assurance CCPCredit institution Pension fund InsuranceInvestment firm Non-Financial firm UCITS
Note: Proportions of total notional amount outstanding (not reconciled) by
counterparty, in %.Sources: TRs, ESMA.
0%
20%
40%
60%
80%
100%
1Q18 2Q18 3Q18 4Q18
One year or less Over 1 year up to 5 years Over 5 yearsNote: Proportions of total notional amount outstanding by remaining maturity of
the contract, in %.Sources: TRs, ESMA.
0%
20%
40%
60%
80%
100%
1Q18 2Q18 3Q18 4Q18
One year or less Over 1 year up to 5 years Over 5 years
Note: Proportions of total notional amount outstanding by maturity at execution
of the contract, in %.Sources: TRs, ESMA.
0%
20%
40%
60%
80%
100%
1Q18 2Q18 3Q18 4Q18
ETD OTC
Note: Proportions of total notional amount outstanding, in %.
Sources: TRs, ISO, ESMA.
0%
5%
10%
15%
20%
0
15
30
45
60
1Q18 2Q18 3Q18 4Q18ETDOTC on trading venueTrading venue as % of total (r.h.axis)
Note: Notional outstanding ETD and OTC on trading venue in EUR trillions,
and trading venue notional amount as a proportion of total outstandingnotional amount in % (r.h. axis).Sources: TRs, ISO, ESMA.
0
20
40
60
80
1Q18 2Q18 3Q18 4Q18
Note: Percentages of OTC notional amount outstanding centrally cleared.
Sources:TRs, ESMA.

ESMA Annual Statistical Report on EU Derivatives Markets 2019 45
ASRD-S.29 ASRD-S.30
Concentration: HHI and top-five counterparties Concentration: Number of unique counterparties
ASRD-S.31 ASRD-S.32
Average connections per counterparty Eigenvector interconnectedness
Credit derivatives market
ASRD-S.33 ASRD-S.34
Total notional amount by contract type Number of transactions by contract type
ASRD-S.35 ASRD-S.36
Total notional amount by sector of counterparty Total notional amount by remaining maturity
0
0.1
0.2
0.3
0.4
0.5
0.6
0.7
1Q18 2Q18 3Q18 4Q18HHI Top5
Note: HHI and total notional amount of top-five counterparties as a proportion of
the total notional amount. HHI normalised between 0 and 1.Sources: TRs, ESMA.
70,000
80,000
90,000
1Q18 2Q18 3Q18 4Q18
Note: Number of unique counterparties.
Sources: TRs, ESMA.
0
1
2
3
4
5
6
1Q18 2Q18 3Q18 4Q18
Note: Average number of connections (i.e. other counterparties connected
to it) each reporting counterparty has.Sources: TRs, ESMA.
0.36
0.37
0.38
0.39
0.40
1Q18 2Q18 3Q18 4Q18Note: The eigenvector interconnectedness indicator measures a participant's
influence based on the number of links it has to other participants within thenetwork. It also takes into account the connections of these participants throughthe network. It ranges from 0 (lowest) to 1 (highest interconnectedness).Sources: TRs, ESMA.
0
4
8
12
16
20
1Q18 2Q18 3Q18 4Q18
CFD Forward Futures OptionSpreadbet Swap Swaption Other
Note: Total notional amount outstanding by contract type, in EUR trillions.
Sources: TRs, ESMA.
0
0.2
0.4
0.6
0.8
1
1Q18 2Q18 3Q18 4Q18
CFD Forward Futures OptionSpreadbet Swap Swaption Other
Note: Number of transactions by contract type, in millions.
Sources: TRs, ESMA.
0%
20%
40%
60%
80%
100%
1Q18 2Q18 3Q18 4Q18AIF Assurance CCPCredit institution Pension fund InsuranceInvestment firm Non-Financial firm UCITS
Note: Proportions of total notional amount outstanding (not reconciled) by
counterparty, in %.Sources: TRs, ESMA.
0%
20%
40%
60%
80%
100%
1Q18 2Q18 3Q18 4Q18
One year or less Over 1 year up to 5 years Over 5 yearsNote: Proportions of total notional amount outstanding by remaining maturity of
the contract, in %.Sources: TRs, ESMA.

ESMA Annual Statistical Report on EU Derivatives Markets 2019 46
ASRD-S.37 ASRD-S.38
Total notional amount by maturity at execution ETD versus OTC
ASRD-S.39 ASRD-S.40
Trading venue notional amounts OTC and ETDs Clearing rates
ASRD-S.41 ASRD-S.42
Concentration: HHI and top-five counterparties Concentration: Number of unique counterparties
ASRD-S.43 ASRD-S.44
Average connections per counterparty Eigenvector interconnectedness
0%
20%
40%
60%
80%
100%
1Q18 2Q18 3Q18 4Q18
One year or less Over 1 year up to 5 years Over 5 yearsNote: Proportions of total notional amount outstanding by maturity at execution of
the contract, in %.Sources: TRs, ESMA.
0%
20%
40%
60%
80%
100%
1Q18 2Q18 3Q18 4Q18
ETD OTC
Note: Proportions of total notional amount outstanding, in %.
Sources: TRs, ESMA.
0%
5%
10%
15%
0
0.5
1
1.5
2
1Q18 2Q18 3Q18 4Q18ETDOTC on trading venueTrading venue as % of total (r.h.axis)
Note: Notional amounts outstanding ETD and OTC on trading venue in
EUR trillions, and trading venue notional amount as a proportion of totaloutstanding notional amount in % (r.h. axis).Sources: TRs, ISO, ESMA.
0
5
10
15
20
25
30
1Q18 2Q18 3Q18 4Q18
Note: Percentages of OTC notional amount outstanding centrally cleared.
Sources:TRs, ESMA.
0
0.1
0.2
0.3
0.4
0.5
0.6
1Q18 2Q18 3Q18 4Q18
HHI Top5
Note: HHI and total notional amount of top-five counterparties as a proportion of
the total notional amount. HHI normalised between 0 and 1.Sources: TRs, ESMA.
3,300
3,600
3,900
4,200
1Q18 2Q18 3Q18 4Q18
Note: Number of unique counterparties.
Sources: TRs, ESMA.
0
2
4
6
8
10
1Q18 2Q18 3Q18 4Q18
Note: Average number of connections (i.e. other counterparties connected
to it) each reporting counterparty has.Sources: TRs, ESMA.
0.36
0.38
0.4
0.42
0.44
0.46
0.48
1Q18 2Q18 3Q18 4Q18Note: The eigenvector interconnectedness indicator measures a participant's
influence based on the number of links it has to other participants within thenetwork. It also takes into account the connections of these participants throughthe network. It ranges from 0 (lowest) to 1 (highest interconnectedness).Sources: TRs, ESMA.
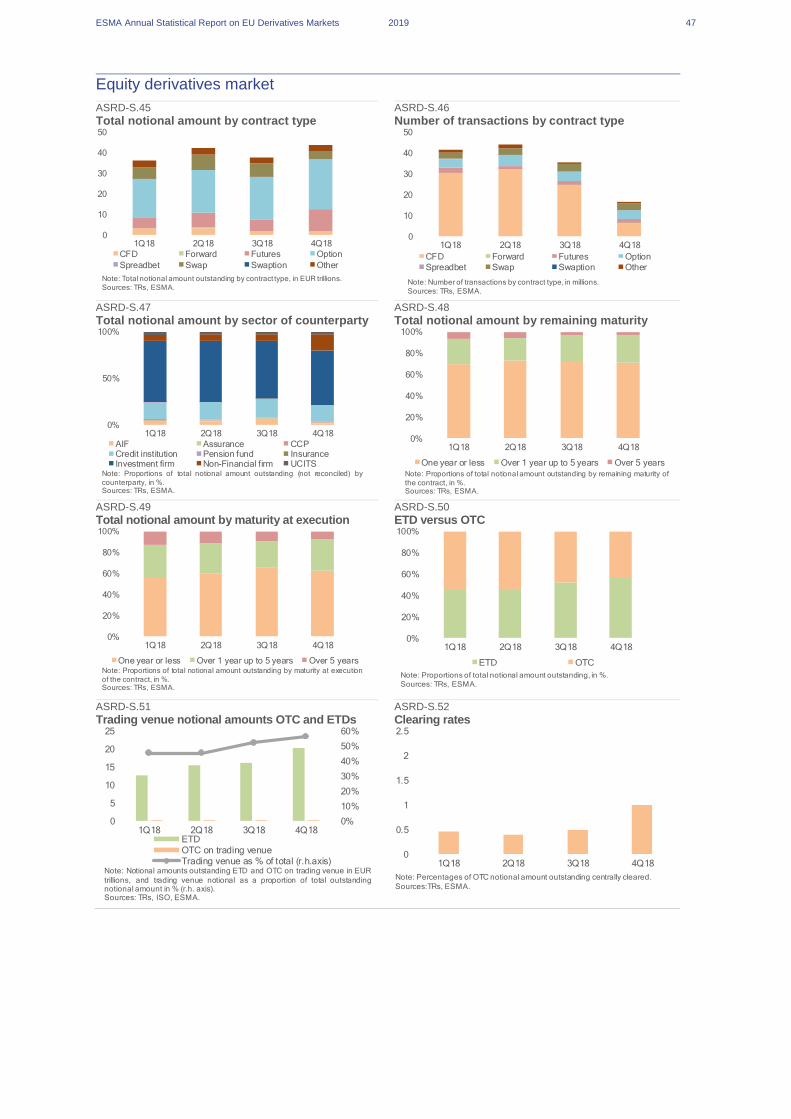
ESMA Annual Statistical Report on EU Derivatives Markets 2019 47
Equity derivatives market
ASRD-S.45 ASRD-S.46
Total notional amount by contract type Number of transactions by contract type
ASRD-S.47 ASRD-S.48
Total notional amount by sector of counterparty Total notional amount by remaining maturity
ASRD-S.49 ASRD-S.50
Total notional amount by maturity at execution ETD versus OTC
ASRD-S.51 ASRD-S.52
Trading venue notional amounts OTC and ETDs Clearing rates
0
10
20
30
40
50
1Q18 2Q18 3Q18 4Q18
CFD Forward Futures Option
Spreadbet Swap Swaption Other
Note: Total notional amount outstanding by contract type, in EUR trillions.
Sources: TRs, ESMA.
0
10
20
30
40
50
1Q18 2Q18 3Q18 4Q18
CFD Forward Futures Option
Spreadbet Swap Swaption Other
Note: Number of transactions by contract type, in millions.
Sources: TRs, ESMA.
0%
50%
100%
1Q18 2Q18 3Q18 4Q18
AIF Assurance CCPCredit institution Pension fund InsuranceInvestment firm Non-Financial firm UCITS
Note: Proportions of total notional amount outstanding (not reconciled) by
counterparty, in %.Sources: TRs, ESMA.
0%
20%
40%
60%
80%
100%
1Q18 2Q18 3Q18 4Q18
One year or less Over 1 year up to 5 years Over 5 years
Note: Proportions of total notional amount outstanding by remaining maturity of
the contract, in %.Sources: TRs, ESMA.
0%
20%
40%
60%
80%
100%
1Q18 2Q18 3Q18 4Q18
One year or less Over 1 year up to 5 years Over 5 yearsNote: Proportions of total notional amount outstanding by maturity at execution
of the contract, in %.Sources: TRs, ESMA.
0%
20%
40%
60%
80%
100%
1Q18 2Q18 3Q18 4Q18
ETD OTC
Note: Proportions of total notional amount outstanding, in %.
Sources: TRs, ESMA.
0%
10%
20%
30%
40%
50%
60%
0
5
10
15
20
25
1Q18 2Q18 3Q18 4Q18ETDOTC on trading venueTrading venue as % of total (r.h.axis)
Note: Notional amounts outstanding ETD and OTC on trading venue in EUR
trillions, and trading venue notional as a proportion of total outstandingnotional amount in % (r.h. axis).Sources: TRs, ISO, ESMA.
0
0.5
1
1.5
2
2.5
1Q18 2Q18 3Q18 4Q18
Note: Percentages of OTC notional amount outstanding centrally cleared.
Sources:TRs, ESMA.
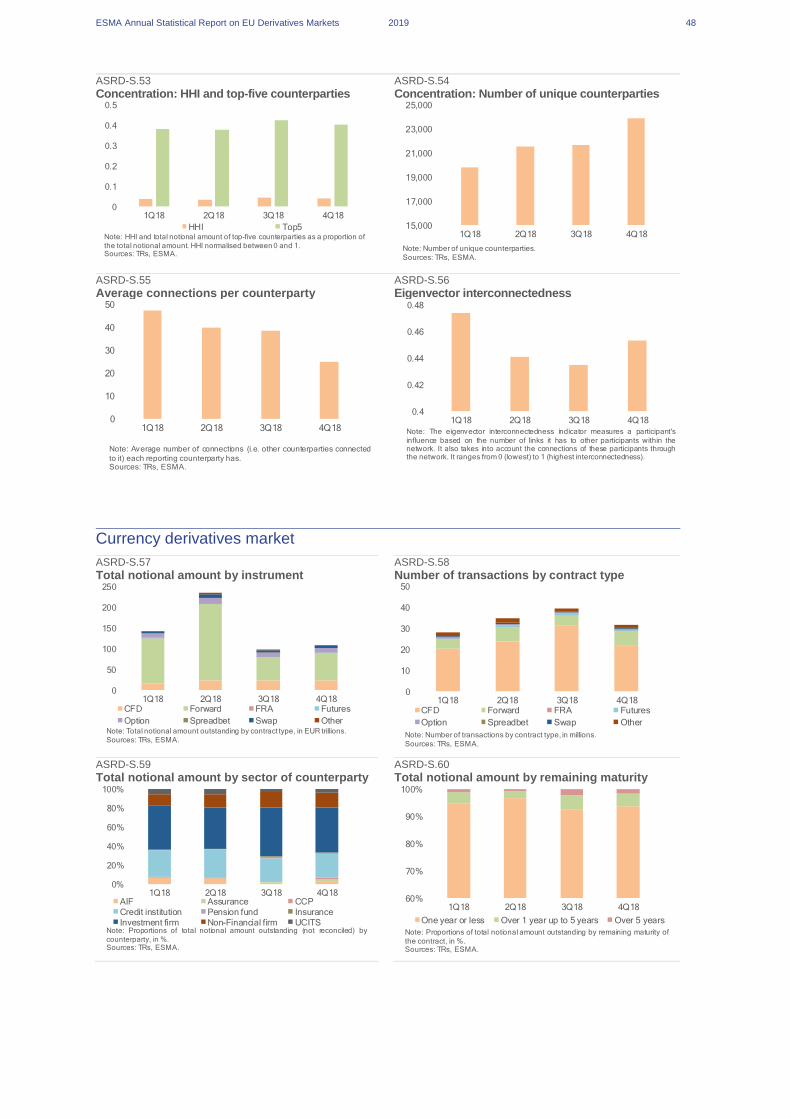
ESMA Annual Statistical Report on EU Derivatives Markets 2019 48
ASRD-S.53 ASRD-S.54
Concentration: HHI and top-five counterparties Concentration: Number of unique counterparties
ASRD-S.55 ASRD-S.56
Average connections per counterparty Eigenvector interconnectedness
Currency derivatives market
ASRD-S.57 ASRD-S.58
Total notional amount by instrument Number of transactions by contract type
ASRD-S.59 ASRD-S.60
Total notional amount by sector of counterparty Total notional amount by remaining maturity
0
0.1
0.2
0.3
0.4
0.5
1Q18 2Q18 3Q18 4Q18
HHI Top5Note: HHI and total notional amount of top-five counterparties as a proportion of
the total notional amount. HHI normalised between 0 and 1.Sources: TRs, ESMA.
15,000
17,000
19,000
21,000
23,000
25,000
1Q18 2Q18 3Q18 4Q18
Note: Number of unique counterparties.
Sources: TRs, ESMA.
0
10
20
30
40
50
1Q18 2Q18 3Q18 4Q18
Note: Average number of connections (i.e. other counterparties connected
to it) each reporting counterparty has.Sources: TRs, ESMA.
0.4
0.42
0.44
0.46
0.48
1Q18 2Q18 3Q18 4Q18
Note: The eigenvector interconnectedness indicator measures a participant's
influence based on the number of links it has to other participants within thenetwork. It also takes into account the connections of these participants throughthe network. It ranges from 0 (lowest) to 1 (highest interconnectedness).
0
50
100
150
200
250
1Q18 2Q18 3Q18 4Q18CFD Forward FRA Futures
Option Spreadbet Swap OtherNote: Total notional amount outstanding by contract type, in EUR trillions.
Sources: TRs, ESMA.
0
10
20
30
40
50
1Q18 2Q18 3Q18 4Q18CFD Forward FRA Futures
Option Spreadbet Swap Other
Note: Number of transactions by contract type, in millions.
Sources: TRs, ESMA.
0%
20%
40%
60%
80%
100%
1Q18 2Q18 3Q18 4Q18AIF Assurance CCP
Credit institution Pension fund Insurance
Investment firm Non-Financial firm UCITSNote: Proportions of total notional amount outstanding (not reconciled) by
counterparty, in %.Sources: TRs, ESMA.
60%
70%
80%
90%
100%
1Q18 2Q18 3Q18 4Q18
One year or less Over 1 year up to 5 years Over 5 years
Note: Proportions of total notional amount outstanding by remaining maturity of
the contract, in %.Sources: TRs, ESMA.

ESMA Annual Statistical Report on EU Derivatives Markets 2019 49
ASRD-S.61 ASRD-S.62
Total notional amount by maturity at execution ETD versus OTC
ASRD-S.63 ASRD-S.64
Trading venue notional amounts OTC and ETDs Clearing rates
ASRD-S.65 ASRD-S.66
Concentration: HHI and top-five counterparties Concentration: Number of counterparties
ASRD-S.67 ASRD-S.68
Average connections per counterparty Eigenvector interconnectedness
60%
70%
80%
90%
100%
1Q18 2Q18 3Q18 4Q18
One year or less Over 1 year up to 5 years Over 5 yearsNote: Proportions of total notional amount outstanding by maturity at execution
of the contract, in %.Sources: TRs, ESMA.
0%
20%
40%
60%
80%
100%
1Q18 2Q18 3Q18 4Q18
ETD OTC
Note: Proportions of total notional amount outstanding, in %.
Sources: TRs, ESMA.
0%
2%
4%
6%
8%
10%
0
5
10
15
1Q18 2Q18 3Q18 4Q18ETD
OTC on trading venue
Trading venue as % of total (r.h.axis)Note: Notional amounts outstanding ETD and OTC on trading venue in
EUR trillions, and trading venue notional amount as a proportion of totaloutstanding notional amount in % (r.h. axis).Sources: TRs, ISO, ESMA.
0
1
2
3
4
1Q18 2Q18 3Q18 4Q18
Note: Percentages of OTC notional amount outstanding centrally cleared.
Sources:TRs, ESMA.
0
0.1
0.2
0.3
0.4
0.5
1Q18 2Q18 3Q18 4Q18
HHI Top5
Note: HHI and total notional amount of top-five counterparties as a proportion of
the total notional amount. HHI normalised between 0 and 1.Sources: TRs, ESMA.
40,000
45,000
50,000
55,000
60,000
65,000
1Q18 2Q18 3Q18 4Q18
Note: Number of unique counterparties.
Sources: TRs, ESMA.
0
10
20
30
40
1Q18 2Q18 3Q18 4Q18
Note: Average number of connections (i.e. other counterparties connected
to it) each reporting counterparty has.Sources: TRs, ESMA.
0
0.1
0.2
0.3
0.4
0.5
1Q18 2Q18 3Q18 4Q18
Note: The eigenvector interconnectedness indicator measures a participant's
influence based on the number of links it has to other participants within thenetwork. It also takes into account the connections of these participants throughthe network. It ranges from 0 (lowest) to 1 (highest interconnectedness).Sources: TRs, ESMA.
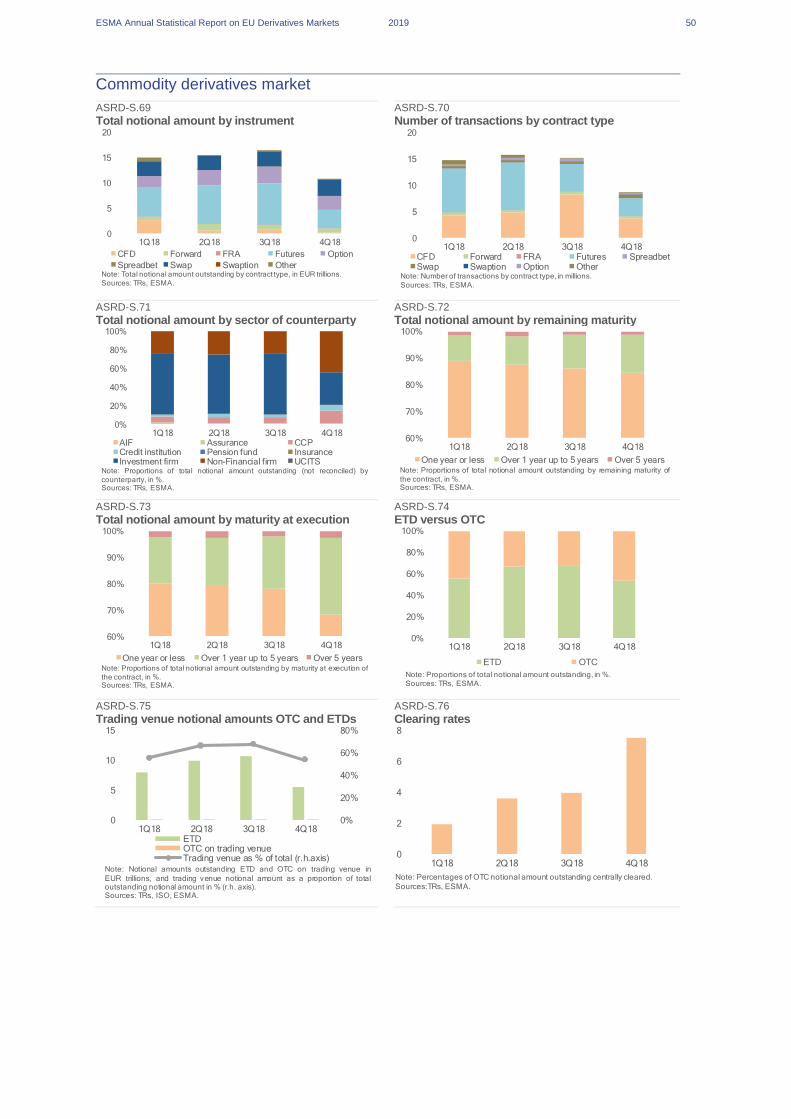
ESMA Annual Statistical Report on EU Derivatives Markets 2019 50
Commodity derivatives market
ASRD-S.69 ASRD-S.70
Total notional amount by instrument Number of transactions by contract type
ASRD-S.71 ASRD-S.72
Total notional amount by sector of counterparty Total notional amount by remaining maturity
ASRD-S.73 ASRD-S.74
Total notional amount by maturity at execution ETD versus OTC
ASRD-S.75 ASRD-S.76
Trading venue notional amounts OTC and ETDs Clearing rates
0
5
10
15
20
1Q18 2Q18 3Q18 4Q18
CFD Forward FRA Futures Option
Spreadbet Swap Swaption OtherNote: Total notional amount outstanding by contract type, in EUR trillions.
Sources: TRs, ESMA.
0
5
10
15
20
1Q18 2Q18 3Q18 4Q18CFD Forward FRA Futures SpreadbetSwap Swaption Option Other
Note: Number of transactions by contract type, in millions.
Sources: TRs, ESMA.
0%
20%
40%
60%
80%
100%
1Q18 2Q18 3Q18 4Q18AIF Assurance CCPCredit institution Pension fund InsuranceInvestment firm Non-Financial firm UCITS
Note: Proportions of total notional amount outstanding (not reconciled) by
counterparty, in %.Sources: TRs, ESMA.
60%
70%
80%
90%
100%
1Q18 2Q18 3Q18 4Q18
One year or less Over 1 year up to 5 years Over 5 yearsNote: Proportions of total notional amount outstanding by remaining maturity of
the contract, in %.Sources: TRs, ESMA.
60%
70%
80%
90%
100%
1Q18 2Q18 3Q18 4Q18
One year or less Over 1 year up to 5 years Over 5 yearsNote: Proportions of total notional amount outstanding by maturity at execution of
the contract, in %.Sources: TRs, ESMA.
0%
20%
40%
60%
80%
100%
1Q18 2Q18 3Q18 4Q18
ETD OTC
Note: Proportions of total notional amount outstanding, in %.
Sources: TRs, ESMA.
0%
20%
40%
60%
80%
0
5
10
15
1Q18 2Q18 3Q18 4Q18ETDOTC on trading venueTrading venue as % of total (r.h.axis)
Note: Notional amounts outstanding ETD and OTC on trading venue in
EUR trillions, and trading venue notional amount as a proportion of totaloutstanding notional amount in % (r.h. axis).Sources: TRs, ISO, ESMA.
0
2
4
6
8
1Q18 2Q18 3Q18 4Q18
Note: Percentages of OTC notional amount outstanding centrally cleared.
Sources:TRs, ESMA.

ESMA Annual Statistical Report on EU Derivatives Markets 2019 51
ASRD-S.77 ASRD-S.78
Concentration: HHI and top-five counterparties Concentration: Number of counterparties
ASRD-S.79 ASRD-S.80
Average connections per counterparty Eigenvector interconnectedness
0
0.2
0.4
0.6
0.8
1Q18 2Q18 3Q18 4Q18
HHI Top5
Note: HHI and total notional amount of top-five counterparties as a proportion of
the total notional amount. HHI normalised between 0 and 1.Sources: TRs, ESMA.
4,000
5,000
6,000
7,000
8,000
1Q18 2Q18 3Q18 4Q18
Note: Number of unique counterparties.
Sources: TRs, ESMA.
0
40
80
120
160
200
1Q18 2Q18 3Q18 4Q18
Note: Average number of connections (i.e. other counterparties connected
to it) each reporting counterparty has.Sources: TRs, ESMA.
0.4
0.45
0.5
0.55
0.6
0.65
1Q18 2Q18 3Q18 4Q18Note: The eigenvector interconnectedness indicator measures a participant's
influence based on the number of links it has to other participants within thenetwork. It also takes into account the connections of these participants throughthe network. It ranges from 0 (lowest) to 1 (highest interconnectedness).Sources: TRs, ESMA.

ESMA Annual Statistical Report on EU Derivatives Markets 2019 52
Annex
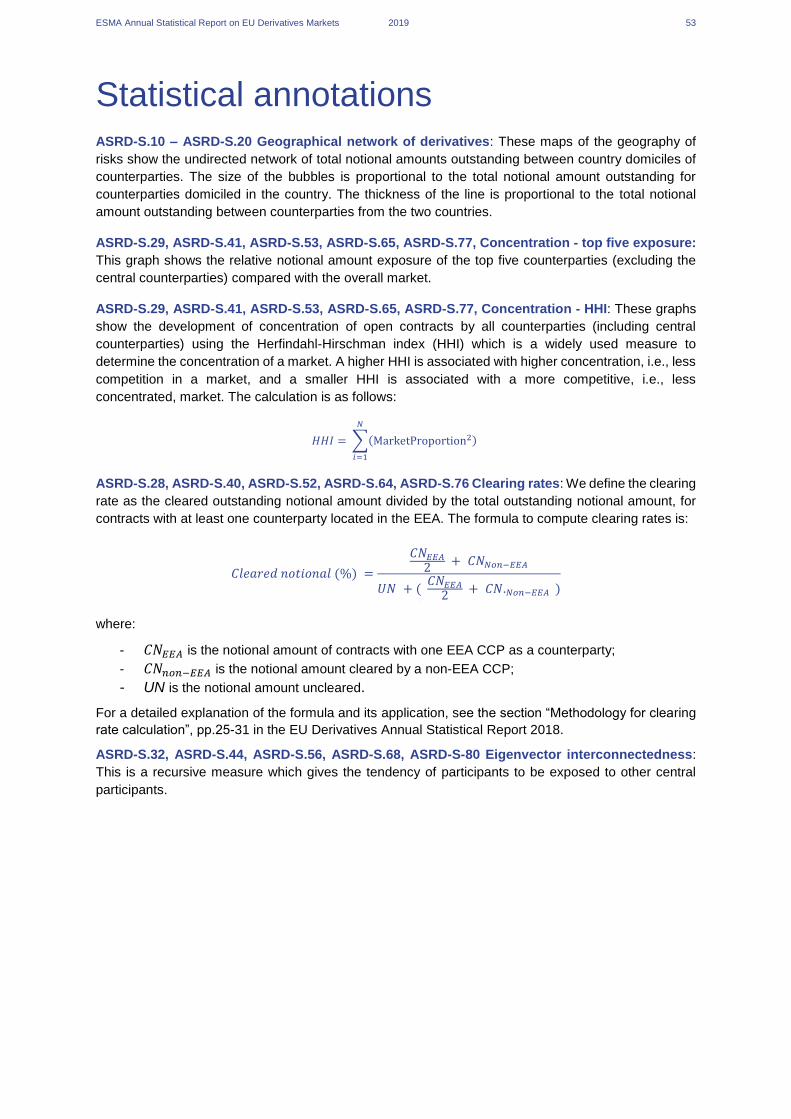
ESMA Annual Statistical Report on EU Derivatives Markets 2019 53
Statistical annotations ASRD-S.10 – ASRD-S.20 Geographical network of derivatives: These maps of the geography of
risks show the undirected network of total notional amounts outstanding between country domiciles of
counterparties. The size of the bubbles is proportional to the total notional amount outstanding for
counterparties domiciled in the country. The thickness of the line is proportional to the total notional
amount outstanding between counterparties from the two countries.
ASRD-S.29, ASRD-S.41, ASRD-S.53, ASRD-S.65, ASRD-S.77, Concentration - top five exposure:
This graph shows the relative notional amount exposure of the top five counterparties (excluding the
central counterparties) compared with the overall market.
ASRD-S.29, ASRD-S.41, ASRD-S.53, ASRD-S.65, ASRD-S.77, Concentration - HHI: These graphs
show the development of concentration of open contracts by all counterparties (including central
counterparties) using the Herfindahl-Hirschman index (HHI) which is a widely used measure to
determine the concentration of a market. A higher HHI is associated with higher concentration, i.e., less
competition in a market, and a smaller HHI is associated with a more competitive, i.e., less
concentrated, market. The calculation is as follows:
𝐻𝐻𝐼 = ∑(MarketProportion2)
𝑁
𝑖=1
ASRD-S.28, ASRD-S.40, ASRD-S.52, ASRD-S.64, ASRD-S.76 Clearing rates: We define the clearing
rate as the cleared outstanding notional amount divided by the total outstanding notional amount, for
contracts with at least one counterparty located in the EEA. The formula to compute clearing rates is:
where:
- 𝐶𝑁𝐸𝐸𝐴 is the notional amount of contracts with one EEA CCP as a counterparty;
- 𝐶𝑁𝑛𝑜𝑛−𝐸𝐸𝐴 is the notional amount cleared by a non-EEA CCP;
- UN is the notional amount uncleared.
For a detailed explanation of the formula and its application, see the section “Methodology for clearing
rate calculation”, pp.25-31 in the EU Derivatives Annual Statistical Report 2018.
ASRD-S.32, ASRD-S.44, ASRD-S.56, ASRD-S.68, ASRD-S-80 Eigenvector interconnectedness:
This is a recursive measure which gives the tendency of participants to be exposed to other central
participants.
𝐶𝑙𝑒𝑎𝑟𝑒𝑑 𝑛𝑜𝑡𝑖𝑜𝑛𝑎𝑙 (%) =
𝐶𝑁𝐸𝐸𝐴
2 + 𝐶𝑁𝑁𝑜𝑛−𝐸𝐸𝐴
𝑈𝑁 + ( 𝐶𝑁𝐸𝐸𝐴
2 + 𝐶𝑁.𝑁𝑜𝑛−𝐸𝐸𝐴 )
-
ESMA Annual Statistical Report on EU Derivatives Markets 2019 54
Glossary
Central counterparty: an entity that interposes itself between the two sides of a transaction, becoming the buyer to every seller and the seller to every buyer.
Clearing: the process of establishing positions, including the calculation of net obligations, and ensuring that financial instruments, cash, or both, are available to secure the exposures arising from those positions.
Clearing member: an undertaking that participates in a CCP and that is responsible for discharging the financial obligations arising from that participation.
Client: an undertaking with a contractual relationship with a clearing member of a CCP that enables that undertaking to clear its transactions with that CCP.
Commodity forward: a contract between two parties to purchase or sell a commodity or commodity index at an agreed price on a future date.
Commodity option: a contract that gives the buyer the right (but not the obligation) to purchase or sell a commodity or commodity index at an agreed price at or by a specified date.
Commodity swap: a contract between two parties to exchange sequences of payments during a specified period, whereby at least one sequence of payments is tied to a commodity price or commodity index.
Counterparty: an entity that takes the opposite side of a financial contract, for example, the borrower in a loan contract, or the buyer in a sales transaction.
Credit default swap: a contract whereby the seller commits to repay an obligation (e.g. bond) underlying the contract at par in the event of a default. To produce this guarantee, a regular premium is paid by the buyer during a specified period.
Credit derivative: a derivative whose redemption value is linked to specified credit-related events, such as bankruptcy, credit downgrade, non-payment or default of a borrower. For example, a lender might use a credit derivative to hedge the risk that a borrower might default. Common credit derivatives include credit default swaps (CDS), total return swaps and credit spread options.
Currency option: a contract that gives the buyer the right (but not the obligation) to purchase or sell a currency at an agreed exchange rate at or by a specified date.
Currency swap: a contract between two parties to exchange sequences of payments during a specified period, whereby each sequence is tied to a different currency. At the end of the swap, principal amounts in the different currencies are usually exchanged.
Derivative: a financial instrument whose value depends on some underlying financial asset, commodity or predefined variable. Derivative, or derivative contract, means a financial instrument as set out in points (4) to (10) of Section C of Annex I to Directive 2004/39/EC, as implemented by Article 38 and 39 of Regulation (EC) No 1287/2006.
Equity forward: a contract between two parties to purchase or sell an equity or equity basket at a set price at a future date.
Equity option: a contract that gives the buyer the right (but not the obligation) to purchase or sell an equity security or basket of equities at an agreed price at or by a specified date.
Equity swap: a contract between two parties to exchange sequences of payments during a specified period, where at least one sequence is tied to an equity price or an equity index.
Exchange rate: the price of one country's currency in relation to another.
Exchange Traded Derivative: A derivative that is traded on a regulated market or on a third-country market considered to be equivalent to a regulated market in accordance with Article 28 of MiFIR (Regulation (EU) No 600/2014 of the European Parliament and of the Council of 15 May 2014 on markets in financial instruments and amending Regulation (EU) No 648/2012), and as such does not fall within the definition of an OTC derivative as defined in Article 2(7) of Regulation (EU) No 648/2012, according to Article 2 of MiFIR.
Financial counterparty: an investment firm authorised in accordance with Directive 2004/39/EC; a credit institution authorised in accordance with Directive 2006/48/EC; an insurance undertaking authorised in accordance with Directive 73/239/EEC; an assurance undertaking authorised in accordance with Directive 2002/83/EC; a reinsurance undertaking authorised in accordance with
ESMA Annual Statistical Report on EU Derivatives Markets 2019 55
Directive 2005/68/EC; a UCITS and, where relevant, its management company, authorised in accordance with Directive 2009/65/EC; an institution for occupational retirement provision within the meaning of Article 6(a) of Directive 2003/41/EC; and an alternative investment fund managed by AIFMs authorised or registered in accordance with Directive 2011/61/EU.
First counterparty basis: a methodology whereby positions are allocated to the primary party to a contract.
Insurance: for this report, insurance is the aggregation of an insurance undertaking authorised in accordance with Directive 73/239/EEC; an assurance undertaking authorised in accordance with Directive 2002/83/EC; and a reinsurance undertaking authorised in accordance with Directive 2005/68/EC.
Interconnectedness: interconnectedness is a market-level centralisation measure based on the network-centrality scores of each counterparty in the market, while the market is defined as all derivatives outstanding within an asset class. This is done using the R package igraph.54 The underlying formula is:
Interconnectedness(market)=sum( max(c(w), w) - c(v),v)
where c(v) is the centrality of counterparty v. The market-level centrality score is then normalized by dividing it by the maximum theoretical score for a theoretical market with the same number of counterparties. It ranges between 0 and 1, 0 being the minimum level of interconnectedness and 1 the maximum. For eigenvector interconnectedness the most centralized structure is the graph with a single edge (and potentially many isolates).
Interest rate option: a contract that gives the buyer the right (but not the obligation) to pay or receive an agreed interest rate on a predetermined principal at or by a specified date.
Interest rate swap: a contract to exchange periodic payments related to interest rates on a single currency. It can be fixed for floating, or floating for floating based on different indices. This group includes those swaps whose notional amount principal is amortised according to a fixed schedule independent of interest rates.
Notional amount outstanding: total nominal or notional amount value of all derivatives contracts concluded and not yet settled on the reporting date.
Over the counter: an ‘OTC derivative’ or ‘OTC derivative contract’ means a derivative contract the execution of which does not take place on a regulated market as within the meaning of Article 4(1)(14) of Directive 2004/39/EC or on a third-country market considered as equivalent to a regulated market in accordance with Article 19(6) of Directive 2004/39/EC.
Pension funds: for this report, an institution for occupational retirement provision within the meaning of Article 6(a) of Directive 2003/41/EC.
Portfolio compression: portfolio compression is defined in MIFIR as a risk reduction service in which two or more counterparties wholly or partially terminate some or all of the derivatives submitted by those counterparties for inclusion in the portfolio compression and replace the terminated derivatives with another derivative whose combined notional amount value is less than the combined notional amount value of the terminated derivatives.
Remaining maturity: the period from the reference date until the final contractually scheduled payment.
Swap: financial derivative in which two parties agree to exchange payment streams based on a specified notional amount for a specified period.
Trade repository: a legal person that centrally collects and maintains the records of derivatives.
54 Csardi G, Nepusz T: The igraph software package for complex network research, InterJournal, Complex Systems 1695. 2006.
http://igraph.org

ESMA Annual Statistical Report on EU Derivatives Markets 2019 56
List of abbreviations
AIF Alternative Investment Fund BIS Bank for International Settlements CCP Central Counterparty CDs Credit Derivatives CDS Credit Default Swap CR Credit CFD Contract for Difference CM Clearing Member CO Commodity Derivatives CTPY Counterparty CU Currency Derivatives EEA European Economic Area EMIR European Markets Infrastructure Regulation EQ Equity Derivatives ETDs FC
Exchange Traded Derivatives Financial Counterparty
FRA Forward Rate Agreement FSB HHI
Financial Stability Board Herfindahl-Hirschman Index
IR Interest Rate IRD Interest Rate Derivatives IRS Interest Rate Swaps ISDA International Swaps and Derivatives Association LEI Legal Entity Identifier MIC Market Identifier Code MiFIR Markets in financial instruments Regulation MTF Multilateral Trading Facility NCA National Competent Authority NFC Non-Financial Counterparty OTF Organised Trading Facility OTC RTS
Over the Counter Regulatory Technical Standard
TR Trade Repository UCITS Undertakings for Collective Investment in Transferable Securities Countries abbreviated according to ISO standards Currencies abbreviated according to ISO standards

ESMA Annual Statistical Report on EU Derivatives Markets 2019 57
c6dc753b04500f08d4070e0f17cef281