ESMA Annual Statistical Report EU Alternative …...ESMA Annual Statistical Report on EU Alternative...
90
ESMA Annual Statistical Report EU Alternative Investment Funds 2019 7 March 2019 ESMA50-165-748
Transcript of ESMA Annual Statistical Report EU Alternative …...ESMA Annual Statistical Report on EU Alternative...

ESMA Annual Statistical Report
EU Alternative Investment Funds 2019
7 March 2019
ESMA50-165-748

ESMA Annual Statistical Report on EU Alternative Investment Funds 2019 2
ESMA Annual Statistical Report on EU Alternative Investment Funds 2019
No. 1, 2019
© European Securities and Markets Authority, Paris, 2019. All rights reserved. Brief excerpts may be reproduced or translated provided the source is cited adequately. The reporting period of this document is 31 December 2017, unless indicated otherwise. Legal reference of this report: Regulation (EU) No 1095/2010 of the European Parliament and of the Council of 24 November 2010 establishing a European Supervisory Authority (European Securities and Markets Authority), amending Decision No 716/2009/EC and repealing Commission Decision 2009/77/EC, Article 32 ‘Assessment of market developments’, 1. ‘The Authority shall monitor and assess market developments in the area of its competence and, where necessary, inform the European Supervisory Authority (European Banking Authority), and the European Supervisory Authority (European Insurance and Occupational Pensions Authority), the ESRB and the European Parliament, the Council and the Commission about the relevant micro-prudential trends, potential risks and vulnerabilities. The Authority shall include in its assessments an economic analysis of the markets in which financial market participants operate, and an assessment of the impact of potential market developments on such financial market participants.’ This report contributes to ESMA’s risk assessment activities. The report and its contents do not prejudice or impair ESMA’s regulatory, supervisory or convergence activities, nor the obligations of market participants thereunder. Charts and analyses in this report are based on data provided by national competent authorities to ESMA under the alternative investment fund managers directive (AIFMD). ESMA uses these data in good faith and does not take responsibility for their accuracy or completeness. ESMA is committed to constantly improving its data sources and reserves the right to alter data sources at any time.
Print/PDF ISBN: 978-92-95202-20-7 doi: 10.2856/608848 ISSN: 2599-8951 EK-AE-19-001-EN-N
European Securities and Markets Authority (ESMA) Risk Assessment and Economics Department 103 Rue de Grenelle FR–75007 Paris [email protected]

ESMA Annual Statistical Report on EU Alternative Investment Funds 2019 3
Table of contents
Editorial 4
Executive summary 5
Market monitoring 7
Market structure and developments 8
Funds of Funds 15
Real Estate Funds 18
Hedge Funds 21
Private Equity Funds 25
Other AIFs 28
Statistical methods 32
Fundamental issues in AIFMD data handling and statistics 33
The structure of the EU and US Hedge Funds industry 48
Statistical annex 52
Market overview 53
Funds of Funds 58
Real Estate Funds 63
Hedge Funds 69
Private Equity Funds 75
Other AIFs 81
Glossary 87
Data inventory 88

ESMA Annual Statistical Report on EU Alternative Investment Funds 2019 4
Editorial Dear Reader –
With this edition, the European Securities and Markets Authority presents its first statistical report on
EU Alternative Investment Funds, to be published in the future on an annual basis.
Collecting data on Alternative Funds and making operational use of them has been one of the most
important policy initiatives in response to the global financial crisis. In 2009 G20 leaders agreed that
Hedge Funds or their managers should be registered and should be required to disclose appropriate
information on an ongoing basis to supervisors or regulators. In the EU this commitment was
translated into reporting requirements under the Alternative Investment Fund Managers Directive
(AIFMD), such that since July 2014 Alternative Investment Fund Managers have reported detailed
information on the Alternative Investment Funds they manage to national competent authorities.1
Most importantly, AIFMD data help authorities in their supervision of alternative investment funds.
Supplementing this entity-level work, this report provides, for the first time, a comprehensive market-
level view of EU Alternative Investment Funds, based on a set of AIFMD data as reported by managers
to national competent authorities and to ESMA. Its primary objective is to contribute to our risk
assessment work at ESMA, supplementing the ESMA report on Trends, Risks and Vulnerabilities and
ESMA’s Risk Dashboards, through which we will continue to monitor developments and risks on a
quarterly basis, as well as other ESMA Annual Statistical Reports, such as the EU Derivatives Markets
report. In doing so, this report also informs our regulatory assessment of Alternative Investment Funds.
And — through the data standardisation and statistical methods developed for this analysis — we aim
to facilitate the oversight of entities by national competent authorities and contribute to supervisory
convergence.
The report contains three elements. First, in the chapter on market monitoring, we provide an analysis
of structures and trends in the European Alternative Investment Funds Sector, building on the
indicators developed for risk monitoring. Second, the chapter on statistical methods is dedicated to
topical issues in developing and exploring AIFMD data. Third, the chapter on Alternative Investment
Funds market statistics offers a full list of indicators and metrics monitored by ESMA.
With this first edition of the report, we are still at an early point in exploring, analysing and displaying
statistics on EU Alternative Investment Funds. Statistics presented here should be read with the
imitations in terms of data coverage and quality in mind, which we specify in this report in detail. AIFMD
data offer unprecedented reach and detail, yet they need further improvement. In particular, we aim
at enhancing data coverage, which currently stands at around 80%. Also, we work on further improving
overall data quality, for example on fund leverage as a key risk measure. In addition, Alternative
Investment Funds evolve quickly, as do statistical and analytical techniques. Thus, future editions of
this report will include more extensive data coverage, more risk indicators and possibly also revisions
of data and methods. To help us improve our reporting, we would be grateful if readers could send
any feedback or suggestions on this report to [email protected].
Operationalising the use of AIFMD data has been — and will continue to be — a challenging task for
IT experts, data managers, statisticians and analysts across numerous institutions involved in
Alternative Fund supervision in Europe and around the world. We thank all colleagues in our
community, especially in national authorities, for their invaluable advice on our reporting so far, as well
as ESMA staff for their dedicated work.
We at ESMA are pleased to share this part of our surveillance work with a wider audience, and we
hope that our report will contribute to the understanding of the risks in EU Alternative Investment
Funds.
1 Directive 2011/61/EU of the European Parliament and of the Council of 8 June 2011 on Alternative Investment Fund Managers (AIFMD), Article 24.

ESMA Annual Statistical Report on EU Alternative Investment Funds 2019 5
Executive summary
Market structure and developments
The EU AIF market: The EU Alternative Investment Fund (AIF) universe is defined by the EU
Alternative Investment Fund Managers Directive (AIFMD), and covers a range of different types of
funds, investing in diverse asset classes. Based on AIFMD data, the AIF industry had a net asset value
(NAV) of EUR 4.9 tn at the end of 2017. 2 Funds of Funds account for 16% of the NAV, followed by Real
Estate Funds (11%), Hedge Funds (5%) and Private Equity Funds (4%). The residual category ‘Other
AIFs’ accounts for 63% of the NAV. Professional investors own most of the shares of AIFs, although
retail investors account for a significant share (19%). AIFs invest predominantly in the European
Economic Area (EEA) and across several asset classes. Use of leverage by AIFs is limited, with the
notable exception of Hedge Funds. There are signs of potential liquidity risks at short-term horizons as
the liquidity offered to investors is greater than the liquidity of the assets.
Funds of Funds: Funds of Funds (FoFs) account for 16% of the NAV of EU AIFs, at around
EUR 770bn. FoFs are mainly sold to professional investors, yet they have the largest share of retail
investors among AIF types (31%). FoFs have significant exposures to funds from the same managers
and make little use of leverage. Overall, FoFs faces limited mismatch, with investors able to redeem
83% of the NAV within one week, while 77% of assets could be liquidated within this time frame.
Real Estate Funds: Real Estate Funds (RE) account for 11% of the NAV of AIFs, at EUR 540bn,
invested mainly in Commercial Real Estate (CRE), and the industry is concentrated in a few countries.
Most RE funds are sold throughout the EU, mainly to professional investors, although RE funds have
one of the highest shares of retail investors (26% of NAV), which, given potential liquidity risk, is a
concern. Indeed, RE funds are mostly exposed to illiquid physical assets. RE funds make limited use
of synthetic leverage but they do use financial leverage, with some RE types engaged in short-term
borrowing. The financing liquidity risk is amplified by the largest liquidity mismatch among AIF types:
within one week investors can redeem up to 20% of NAV while RE funds can only liquidate 8% of their
assets.
Hedge Funds: The Hedge Funds (HF) sector amounted to EUR 264bn in NAV at the end of 2017, or
5% of all AIFs. However, when measured by gross exposures, HFs account for 64% of AIFs since they
make substantial use of derivatives. HFs make limited use of the EU passport and their investor base
is more diversified than other AIFs. Leverage is very high at 780% (7.8 times the NAV), particularly for
some strategies highly reliant on derivatives. HFs are exposed to limited liquidity mismatch, as they
typically invest in liquid instruments. HFs are exposed to financing risk, as one third of their financing is
overnight, but they tend to maintain large cash buffers, which mitigate the risk.
Private Equity Funds: Private Equity Funds (PE) account for 4% of the NAV of all AIFs, or EUR 204bn.
They follow a range of strategies and are almost exclusively sold to professional investors. PE funds
make little use of synthetic and financial leverage and invest mainly in illiquid securities (unlisted
securities). Overall, liquidity risk is limited, given that PE funds are overwhelmingly closed-ended.
Other AIFs: The regulatory category of ‘Other AIFs’ — a residual category — in practice accounts for
63% of the NAV of EU AIFs, at around EUR 3.1tn. This residual category covers a range of strategies,
with fixed income and equity strategies accounting for 70% of the NAV and an additional residual
category amounting to 27%. A more detailed analysis of underlying strategies and potential
classification issues in the ‘Other AIFs’ category will be provided in future editions of this report. Other
AIFs are mainly sold to professional investors, although there is a larger retail investors’ presence in
the residual category. They make little use of financial or synthetic leverage. While most types of other
AIFs have very limited liquidity risk, the residual category faces some liquidity mismatch.
2 AIFMD data as reported to ESMA remain subject to quality limitations. The statistics cover around 80% of the market in terms of the number of AIFMs and the NAV of AIFs.
ESMA Annual Statistical Report on EU Alternative Investment Funds 2019 6
Statistical methods
Handling AIFMD data — methods and challenges: Extensive reporting obligations introduced by the
AIFMD for AIFs and their managers allow national competent authorities (NCAs) to oversee whether
alternative investment fund managers (AIFMs) are properly addressing risks associated with their
activities. AIFMD data currently cover around 80% of the EU AIF market, in terms of both the number
of fund managers and the NAV of AIFs. We provide key features of AIFMD data and the specificities in
their statistical evaluation. We will also describe the remaining data-quality issues, with a focus on
reported leverage data. In addition, we provide a first overview of the AIFMD national private placement
regime (NPPR) market.
The structure of the EU and US Hedge Fund industries: As in this edition, we take a first look at the
EU AIF data sourced from AIFMD reporting systems, it makes sense in particular to compare the picture
that emerges to other jurisdictions hosting substantial AIF industries. One noteworthy and relevant
comparison — especially for the HF segment of the AIF universe — is the US market, where HFs
emerged as early as the 1920s and today comprise a vital part of the local investment universe. Our
analysis shows that risk indicators derived from EU and US sources provide a similar message.
Leverage tends to be concentrated in specific HF strategies, such as relative value or macro. HFs
relying on derivatives have a larger amount of unencumbered cash than other HFs to meet future
margins call on derivatives exposures. At the aggregate level, EU HFs have lower funding leverage but
their funding is more short term than US funds. EU and US HFs face limited liquidity mismatch overall,
with higher levels of liquidity in US funds.
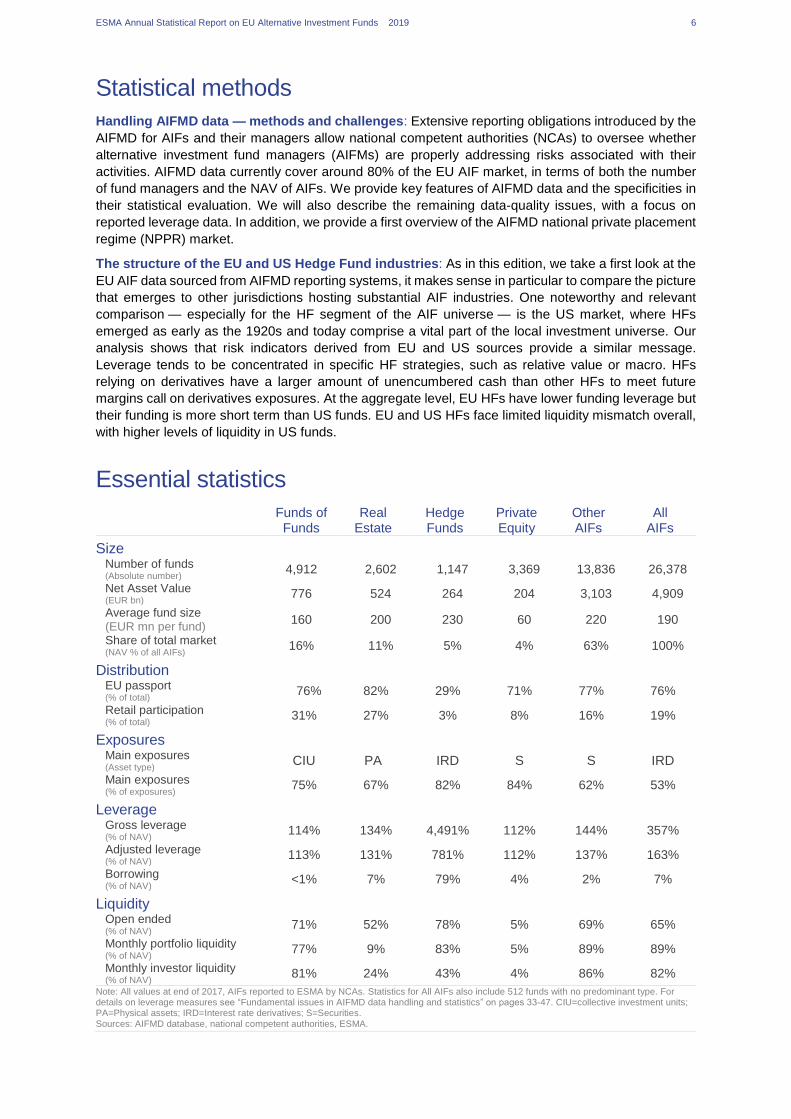
Essential statistics
Funds of Funds
Real Estate
Hedge Funds
Private Equity
Other AIFs
All AIFs
Size
Number of funds (Absolute number)
4,912 2,602 1,147 3,369 13,836 26,378
Net Asset Value (EUR bn)
776 524 264 204 3,103 4,909
Average fund size (EUR mn per fund)
160 200 230 60 220 190
Share of total market (NAV % of all AIFs)
16% 11% 5% 4% 63% 100%
Distribution
EU passport (% of total)
76% 82% 29% 71% 77% 76%
Retail participation (% of total)
31% 27% 3% 8% 16% 19%
Exposures
Main exposures (Asset type)
CIU PA IRD S S IRD
Main exposures (% of exposures)
75% 67% 82% 84% 62% 53%
Leverage
Gross leverage (% of NAV)
114% 134% 4,491% 112% 144% 357%
Adjusted leverage (% of NAV)
113% 131% 781% 112% 137% 163%
Borrowing (% of NAV)
<1% 7% 79% 4% 2% 7%
Liquidity
Open ended (% of NAV)
71% 52% 78% 5% 69% 65%
Monthly portfolio liquidity (% of NAV)
77% 9% 83% 5% 89% 89%
Monthly investor liquidity (% of NAV)
81% 24% 43% 4% 86% 82%
Note: All values at end of 2017, AIFs reported to ESMA by NCAs. Statistics for All AIFs also include 512 funds with no predominant type. For details on leverage measures see “Fundamental issues in AIFMD data handling and statistics” on pages 33-47. CIU=collective investment units; PA=Physical assets; IRD=Interest rate derivatives; S=Securities. Sources: AIFMD database, national competent authorities, ESMA.

ESMA Annual Statistical Report on EU Alternative Investment Funds 2019 7
Market monitoring

ESMA Annual Statistical Report on EU Alternative Investment Funds 2019 8
Market structure and developments The EU Alternative Investment Funds (AIF) universe covers a range of different types of funds, investing
in diverse asset classes. AIFMD data offer unprecedented reach and detail on AIFs, part of which is
still to be improved further to ensure adequate quality of the data. In particular, data coverage, which
currently stands at around 80% in terms of both the number of AIFMs and the NAV of AIFs, will improve
over time. Based on AIFMD data, the AIF industry had a NAV of EUR 4.9trn at the end of 2017. Among
AIF types, FoFs account for 16% of the NAV, followed by RE funds (11%), HFs (5%) and PE funds
(4%). The last category of ‘Other AIFs’ accounts for 63% of the NAV, including a residual category
accounting for 17% of the NAV of all AIFs, pointing to potential classification issues by AIFMs.
Professional investors own most of the shares of AIFs, yet retail investors account for a significant share
at 20% of the NAV. AIFs invest predominantly in the EEA and across several asset classes. The use
of leverage by AIFs is limited, with the notable exception of HFs, which acquire leverage mainly through
derivatives. At the aggregate level there are signs of potential liquidity risk at short horizons, as the
liquidity offered to investors is greater than the liquidity of the assets.
Introduction
In the aftermath of the global financial crisis, the
G20 stressed, at its 2008 summit in Washington,
the need for consistent international regulation
and oversight with respect to every financial
market participant and financial product. In
response to this, the Financial Stability Board
(FSB) advanced a programme of financial
reforms to build a more resilient and less
procyclical financial system. The work of the FSB
in this regard emphasised the need to create
global monitoring capabilities to capture the scale
and trends in non-bank financial intermediation
(FSB, 2011).
In this context, in 2009 the European
Commission issued a proposal for a directive on
alternative investment fund managers (AIFMD),3
aimed at laying the regulatory foundations for a
secure financial system to support and stimulate
the real economy. With the AIFMD, the EU
alternative fund industry would, for the first time,
be comprehensively regulated at EU level and
supervised. The European Parliament and the
Council finally adopted the directive4 in June
2011.5
3 The glossary provides an overview of the concepts and abbreviation used in this report.
4 Directive 2011/61/EU.
Main objectives of the AIFMD
The overarching objective of the AIFMD is to
provide an internal market and a harmonised
regulatory and supervisory framework for the
activities within the EU of all AIFMs, regardless of
whether they have their registered office in a
Member State (EU AIFMs) or a third non-EU
country (non-EU AIFMs).
As a post-crisis regulatory initiative, the AIFMD
aimed at strengthening investor protection and
financial market stability. The features of this
initiative include:
— the enhancement of intermediary specific
oversight and the integrity of the internal
market to provide legal certainty for its
participants, for example professional
investors, competent authorities and other
stakeholders;
— an incentive structure aiming to avoid
excessive risk-taking by imposing cross-
sector rules on remuneration schemes and
governance;
— a focus on systemic risk and consistent
requirements regarding risk-management
procedures and processes;
5 The AIFMD was published in the Official Journal of the
European Union on 1 July 2011 and entered into force on
21 July 2011.

ESMA Annual Statistical Report on EU Alternative Investment Funds 2019 9
— extensive reporting obligations;
— close cooperation between all NCAs and
ESMA.
In broad terms, the AIFMD lays down rules for the
authorisation, ongoing operation and
transparency of AIFMs.
The AIFMD extends appropriate regulation and
oversight to all actors and activities that may
entail significant risks by introducing a coherent
European framework for regulating AIFMs and
increasing their accountability, with the goal of
protecting investors, depositors and financial
markets while strengthening and deepening the
European single market.
The directive does not address the funds
themselves, but rather the fund managers and
their current business activities, independent of
the specific strategy or business model.
The AIF regulatory framework
In the EU, investment funds are regulated under
two main regimes: the UCITS directive6 and the
AIFMD. Funds authorised under the UCITS
directive are typically targeted at retail investors.
UCITS are subject to specific requirements,
including diversification, limits on counterparty
risk and restrictions on leverage (ASR-AIF.1). In
contrast, AIFs are funds that typically target
professional investors. They can invest in a wide
range of assets (including asset classes not
eligible for UCITS) and have no restrictions on
leverage. AIFs include HFs, some FoFs, PE
funds and RE funds and other types of funds.
Even if the AIFMD only regulates the manager,
the AIF product could be regulated at the national
level. A number of Member States have defined
rules about the investment policy of the AIFs
(mainly as far as AIFs targeted at retail investors
are concerned). Inter alia, depending on the
adopted national approach, those rules can
include: risk spreading’s limits, the maximum
level of the portfolio’s exposure and constraint in
terms of the form that the AIF can take (e.g. in
some Member States the RE funds are open-
ended funds, while in others they are closed-
ended funds). Accordingly, the portfolio’s risk
6 Directive 2009/65/EC of the European Parliament and of the Council of 13 July 2009 on the coordination of laws, regulations and administrative provisions relating to undertakings for collective investment in transferable securities.
profile and the leverage’s use could be affected
by the national legal framework.
Under AIFMD, authorised EU AIFMs can market
their EU-domiciled AIFs by using the EU
marketing passport. The EU passport allows
them to market their AIFs to professional
investors in any Member States of the EU.
ASR-AIF.1 Regulatory framework overview
Comparison of UCITS and AIFs
UCITS AIF
Fund set-up
Targeted investors Retail investors
Professional investors
Passport Always Not always
Restrictions and requirements
Redemption policy
Only open-ended
Open- or closed-ended
Restrictions on eligible assets
Yes (only liquid instruments)
No
Diversification requirements Yes Not always
Counterparty risk limits Yes No
Restrictions on leverage Yes
No, but NCAs can set leverage limits
Size
Number of funds at the end of 2017
31,974 28,231
Total net assets (EUR bn) 9,714 5,909
Note: Main characteristics and size of UCITS funds and AIFs. Sources: EFAMA, NCAs, ESMA.
AIFMD reporting obligations
The AIFMD sets out extensive reporting
requirements to NCAs for AIFMs.7 The reporting
requirements include data on the characteristics
of the AIF (type, strategy, concentration of
investors) along with detailed information on
assets (principal exposures, exposures by asset
type and regional investment focus), as well as
several risk features (market risk, liquidity profile,
use of leverage and stress test results).
Reporting requirements vary depending on the
characteristics of the AIFM and the complexity of
the AIF, which are reflected in different reporting
thresholds (ASR-AIF.2).
7 NCAs transfer received AIF reports to the ESMA central database.

ESMA Annual Statistical Report on EU Alternative Investment Funds 2019 10
ASR-AIF.2 AIFM reporting thresholds
Higher reporting frequency for larger AIFMs
Annually Semi-annually Quarterly
AIF
M r
eport
ing
≤ EUR 100mn (leveraged AIF)
≤ EUR 500mn (unleveraged AIF)
All unleveraged AIFs (above the thresholds) investing in non‑listed companies to acquire control
≥ EUR 100mn (leveraged AIF)
≥ EUR 500m (unleveraged AIF)
≤ EUR 1bn
> EUR 1bn
Note: Reporting frequencies indicated by level ii regulation for authorised AIFMs based on the managers’ characteristics and AIFs managed. Thresholds based on regulatory asset under management (AuM), full diagrams on the reporting frequencies available in the ESMA guidelines on reporting obligations. Source: ESMA.
Scope of the report
This report is based on data submitted by NCAs
to ESMA, covering authorised EU and sub-
threshold AIFMs on behalf of the AIFs they
manage. The data do not cover products
marketed by non-EU AIFMs under an NPPR.
The data refer to annual reports for 2017 and are
based on reports transmitted to ESMA by 24
NCAs. The data cover 1,873 authorised full-
scope EU AIFMs, amounting to 78% of EU AIFMs
according to ESMA registers, and 2,389 sub-
threshold managers. Around 30,000 AIF reports
were transmitted to ESMA, with varying coverage
across Member States. Among those reports, we
excluded around 1,650 nil reports (empty reports
sent by new AIFs) and reports that missed out
critical information (such as fund identification or
investment strategy). The final sample is
comprised of around 26,400 AIFs.
The report provides data and risk indicators for
AIFs at the EU level, rather than at the national
level. The report relies on aggregate indicators by
AIF types, but subsequent editions may look at
the distribution of risk indicators within AIF types
to identify pockets of vulnerabilities and inform
NCAs’ supervisory work.
The report relies on a set of risk indicators, a
subset of the data provided under the AIFMD.
The risk indicators were chosen based on their
relevance for risk analysis and the quality of the
data.8 Looking forward, ongoing cooperation with
NCAs should allow ESMA to improve the set of
8 The data inventory on pages 86-87 summarises the coverage of each indicator used in this report.
risk indicators, along with coverage, in future
editions.
Data quality
AIFMD reporting obligations cover a wide range
of indicators with different degrees of complexity
for their calculation. Some very important
indicators, such as leverage reported by AIFs,
cannot be used at this stage due to data-quality
issues. A variety of reporting errors (formatting,
monetary values instead of percentages, etc.)
prevent us from using the reported leverage
indicators. Some other indicators are not always
mandatory and may not be requested at national
level (e.g. the redemption frequency for open-
ended AIFs), which makes the use of aggregate
data more difficult. In this report, when the data
used for the analysis is based on a subset of our
sample, this is specified.
The detailed inventory of analysed data and
indicators is provided in the inventory section at
the end of the report. A detailed discussion of
data-related issues and coverage, including
NPPR, is provided in the article “Fundamental
issues in AIFMD data handling and statistics”,
pp.32-45.
Definition of terms
Under the AIFMD, some concepts might have a
different meaning than commonly used by the
industry. For clarification a glossary is provided at
the end of the report. The main concepts used are
the following:
— Regulatory assets under management
(AuM): value of all assets in portfolio,
including all assets acquired through use of
leverage (borrowing of cash or securities
and leverage embedded in derivative
positions). This concept of AuM is different
from the industry approach of AuM, which
typically relates to the assets on the balance
sheet of the AIF;
— NAV: the net value of the assets of the AIF
(as opposed to the NAV per unit or share of
the AIF). The NAV is equal to the unit shares
of the AIF, i.e. the money placed in the AIF
by investors, which correspond to the
concept of total net assets sometimes used
by the industry.

ESMA Annual Statistical Report on EU Alternative Investment Funds 2019 11
Size of the EU AIF market: around
EUR 5tn NAV
The AIF industry accounts for a significant share
of the investment fund activity in the EU: the NAV
of AIFs in the EU amounted to around EUR 4.9tn
at the end of 2017 (ASR-AIF.8). This compares
to a NAV of around EUR 5.9tn according to
EFAMA data. Thus, coverage of AIFMD data
currently stands at more than 80% in terms of
NAV. By comparison, the NAV of UCITS
amounted to EUR 9.7tn at the end of 2017
according to EFAMA. Therefore, AIFs account for
one third of the EU fund industry.9
AIF types: One of the main features of the AIF
market is the diversity in the types, strategies and
risk profiles of AIFs. FoFs account for 16% of the
NAV, followed by RE funds (11%), HFs (5%) and
PE funds (4%). Within the last category of ‘Other
AIFs’, which accounts for 63% of the NAV
(ASR-AIF.9), around 27% of the NAV is attributed
to a residual category (which amounts to 17% of
the NAV of all AIFs), pointing to potential
classification issues for AIFMs. Another
explanation for the very large share of ‘Other
AIFs’ could be that existing AIF types (FoFs, RE
funds, HFs and PE funds) do not cover AIFs that
might implement simple strategies also used by
UCITS. For example, AIFMs might classify their
AIF bond or equity funds under ‘Other AIFs’.
These issues will be explored further in future
editions of this report.
AIF distribution: In terms of cross-country
distribution, the AIF industry is concentrated in a
few countries, with the top five accounting for
more than 85% of the NAV (ASR-AIF.10). In
countries with a large asset-management
industry (Luxembourg, Ireland, France), FoFs
also account for a significant share of the NAV.
The HF industry is heavily concentrated in the
United Kingdom, with more than 80% of the NAV
managed by UK AIFMs. In most EU Member
States, ‘Other AIFs’ account for most of the NAV.
Most AIFs have access to the EU passport
(76%), allowing AIFs to be sold throughout the
EU (ASR-AIF.11).
A full cross-country analysis is beyond the scope
of this report due to data-quality issues and the
fact that some countries have not yet transmitted
their AIFMD data to ESMA.
9 For an earlier overview of the EU AIF market and risks indicators monitored by ESMA, see Ferrari (2018).
10 For an overview of retail AIFs, see ESMA (2018).
Moreover, an analysis of the countries where the
AIFs are actually distributed, and on the
differences between countries where the AIFs
are managed and countries where the AIFs are
marketed, cannot be carried out. Indeed, the
AIFMD reporting does not include information
such as the investors’ domicile or the countries
where the subscriptions are collected.
AIF investors: AIFs should principally target
professional investors rather than retail investors.
Professional investors account for around 80% of
the NAV, while direct retail investors’ participation
is more limited, but quite significant at 20% of the
NAV (ASR-AIF.3).10 Retail investors’ participation
might be underestimated since they could
purchase banking or insurance products which
are invested into AIFs.
ASR-AIF.3 AIF investors
Mainly professional investors
Among professional investors, unitholders are
diversified across AIF types (ASR-AIF.4).
Professional investors, such as pension funds
and insurance companies, are the main investors
as they account for 26% and 17% of the NAV
respectively.11 Banks and other funds account for
8% each, and other financial institutions for 7%.
Remaining investor categories are small, except
for ‘unknown’ investors (17% of the NAV).
11 Van der Veer et al. (2017) report similar results using data for Dutch AIFs.
0% 20% 40% 60% 80% 100%
FoF
Hedge fund
Private equity
Real estate
Other AIF
Total EU
Retail investors Professional investors
Note: Clients of AIFs managed and/or marketed by authorised EU AIFMs and sub-threshold managers registered only in national jurisdictions, end of 2017, in % ofNAV. FoF=Fund of funds. Data for 24 EEA countries.
Sources: AIFMD database, National Competent Authorities, ESMA.

ESMA Annual Statistical Report on EU Alternative Investment Funds 2019 12
ASR-AIF.4 AIF investors types
Diversified investor base
AIF shares: The AIF industry is characterised by
a very high concentration of investors: the top five
holders account for around 80% of the NAV on
aggregate (ASR-AIF.12). For at least 50% of
AIFs, the five main investors hold all the units of
the AIF. This pattern applies across AIF types,
except for PE funds, which tend to have a less
concentrated participation. The high degree of
concentration can be explained by two dominant
factors. First, before the AIFMD, funds could be
set up under national law for a single investor.
When the AIFMD entered into force those funds
were converted into AIFs, resulting in a highly
concentrated pariticpation, although under the
directive AIFs must raise capital from a number
of investors. Second, professional investors are
the main investors in AIFs, and they typically hold
a large share of the funds they invest in, which
could also explain the concentration of
ownership.
AIF geographical investment focus: AIFs
invest mainly in the EEA (60%), followed by North
America (16%) and supranational issuers (9%).
Other regions account for less than 15% of the
NAV (ASR-AIF.5).
12 Gross notional exposures use the gross notional value of the IRDs, with no adjustment for duration. However, under the commitment approach, IRDs are adjusted for duration. IOSCO has recently published a consultation paper aimed at harmonising the definition of leverage for
ASR-AIF.5 Regional investment focus
Most exposures towards the EEA
Leverage and liquidity risks
Gross exposures: AIFs are exposed to a wide
range of asset classes, with variation across AIF
types (ASR-AIF.13). RE funds, PE funds and
FoFs are by construction heavily exposed to the
underlying assets (physical assets for RE funds,
(unlisted) securities for PE funds and collective
investment units for FoFs). HF exposures are
overwhelmingly biased towards interest rate
derivatives (IRDs) — partly due to the way IRDs
are reported.12 The exposures of ‘Other AIFs’ are
more diversified, reflecting the diversity of
strategies used within this residual category.
Leverage: The AIF industry is characterised by
significant differences in the use of leverage,
measured by the ratio of gross exposures
(excluding IRDs) to NAV (ASR-AIF.6). Most AIFs
have limited use of leverage, with the notable
exception of HFs (ASR-AIF.14). The high
leverage of HFs stems mainly from the use of
derivatives (synthetic leverage) rather than
outright borrowing (financial leverage).
funds (IOSCO (2018)). The report includes a proposal for an adjustment of gross notional exposures for IRDs based either on duration or on the conversion of IRDs exposures into 10-year bond equivalents.
0% 20% 40% 60% 80% 100%
None
Other AIF
Real estate
Private equity
Hedge fund
FoF
Total EU
Banks General gov. HouseholdsInsurances Non-profit NoneOth. CIU Oth. fin. institu tions Pension fundsUnknown
Note: Ownershi p of units in AIFs managed and/or marketed by authorised EUAIFMs, end of 2017, in % of NAV. F oF=Fund of funds; None=No predominant type.Data for 24 EEA countries.
Sources: AIFMD database, National Competent Authorities, ESMA.
Asia5%
EEA83%
Other Europe4%
North America7%
Supra National1%
Rest>1%
Note: R egional i nvestm ent focus of real estate funds managed and/or marketed byauthorised EU AIFMs and sub-threshold managers registered only in nationaljurisdictions, end of 2017, in % of NAV. Geo-focus determined accordi ng to the
domicile of investments and the supr anational category including investmentswithout a predominant geo-focus. Data for 24 EEA countries.Sources: AIFMD database, National Competent Authorities, ESMA.

ESMA Annual Statistical Report on EU Alternative Investment Funds 2019 13
ASR-AIF.6 Measures of leverage
Different definitions of leverage
Leverage can be measured by different metrics.
Financial leverage (also called balance-sheet leverage) involves outright borrowing and is defined as the ratio of total assets to equity (or NAV for funds).
Synthetic leverage is defined as the ratio of exposures, acquired through the use of derivatives, to the NAV. Exposures can be gross (long and short exposures are added) or net.
Under the AIFMD, leverage is defined according to two measures:
— Commitment leverage is defined as the sum of the absolute value of all transactions, after netting and hedging, divided by the NAV;
— Gross leverage is the sum of the absolute values of all transactions (‘gross exposures’), excluding cash in the currency of the AIF, divided by the NAV.
Two other measures of gross leverage can also be computed: (i) the ratio of regulatory AuM to NAV, where regulatory AuM includes the value of all assets in the portfolio, including through the use of leverage by outright borrowing of cash and securities and leverage embedded in derivatives; and (ii) the ratio of gross exposures excluding IRDs to NAV.
In this report we measure leverage by gross exposures excluding IRDs to NAV (adjusted gross leverage), unless otherwise specified.
Liquidity risk: Most AIFs are open-ended funds
(65% of NAV), with variation across types. Open-
ended AIFs tend to offer daily liquidity to investors
(ASR-AIF.15). However, AIFs more likely to be
exposed to illiquid assets such as PE funds, RE
funds and HFs tend to have longer redemption
frequencies (weekly to monthly). At the
aggregate level, AIFs’ liquidity profile points to
potential liquidity risk: within a week, investors
can redeem up to 69% of the NAV, while only
57% of the assets can be liquidated within this
time frame (AIFR.S.7). However, this liquidity risk
is very different across AIFs types, and
subsequent sections show the differences across
sub-segments. Additionally, relying on aggregate
figures may hide individual risks, as funds with
excess liquidity might compensate for funds with
liquidity mismatch. A final assessment of fund
liquidity risks requires a supervisory analysis at
entity level, along with a review of liquidity
management tools (LMTs) available at the fund
level.13
ASR-AIF.7 Liquidity profile
Potential liquidity risk at the short end
13 Under Article 24(2), AIFMs have to report, the measures adopted to ensure consistency between the redemption policies and the liquidity profiles of the managed AIFs. These LMTs include: the presence of a lock-up period or side pockets, the adoption of redemption gates or redemption notice periods that specify how many days in
advance investors have to notify that they wish to redeem, the suspension of dealing arrangements as any other special arrangement arising from assets’ illiquid nature. Liquidity management tools and procedures employed by AIFMs are beyond the scope of this report, as current data limitations may impair the accuracy of the analysis.
39%
69%75%
79% 83%
85%100%
31%
57%
80%
91% 94% 95%
0%
25%
50%
75%
100%
1 day or
less
2-7 days 8-30
days
31-90
days
91-180
days
181-365
days
> 365
days
Investor Por tfolioNote: Portfolio and i nvestors liqui dity profiles of AIFs m anaged and/or m arketed byauthorised EU AIFMs, end of 2017. Portfolio profile determined by percentage ofthe funds’ portfolios capable of being liquidated within each specified period,
investor liquidity pr ofile depend on shortes t period withi n each fund could bewithdrawn or inves tors could receive redemption payments. d=Days. Data for 24EEA countries.Sources: AIFMD database, National Competent Authorities, ESMA.

ESMA Annual Statistical Report on EU Alternative Investment Funds 2019 14
ASR-AIF.8 ASR-AIF.9 Size of the AIF industry AIF industry by type
Large AIF market Other AIFs largest type
ASR-AIF.10 ASR-AIF.11 Size of AIF by type and country EU passport
Concentration in a few countries Most AIFs can be passported
ASR-AIF.12 ASR-AIF.13
Distribution of ownership Gross exposures
High concentration of ownership Diverse exposures by AIF type
ASR-AIF.14 ASR-AIF.15
Leverage Redemption frequency
High leverage of HFs Daily frequency for most open-ended AIFs
776524
264 20449
3103
0
800
1,600
2,400
3,200
FoF Real
estateHedge
fundPrivate
equityNone Other
Note: Net Asset Value by AIF type, in EUR bn, end of 2017. FoF=Funds of funds,None=No predominant type.Sources: AIFMD database, National Competent Authorities, ESMA.
FoF16%
Hedge fund5%
Priv ate equity4%
Real estate11%
Other63%
None1%
Note: NAV by type of AIFs managed and/or m arketed by authorised EU AIFMs andsub-threshol d managers registered only i n nati onal jurisdictions, end of 2017, in %.FoF=Fund of funds, None=No predominant type. Data for 24 EEA countries.
Sources: AIFMD database, National Competent Authorities, ESMA.
1597
1030
659559 524 551
0
450
900
1,350
1,800
DE UK NL FR LU Rest
FoF HF PE RE Other None
Note: Net Asset Value by AIFs type, in EUR bn, end-2017.Sources: AIFMD database, National Competent Authorities, ESMA.
EU passport76%
EU w /o passport17%
Non-EU w /o passport3%
Non-EU not marketed in EU 4%
Note: NAV of AIFs by manager's access to AIFMD passport, end of 2017, in %.Authorised EU AIFMs with access to AIFMD passport or marketing non-EU AIFs w/opassport, sub-threshold managers registered only in nati onal juridisdicti ons w/o
passporting rights. Data for 24 EEA countries.Sources: AIFMD database, National Competent Authorities, ESMA.
0%
25%
50%
75%
100%
FoF Hedge fund Private
equity
Real estate Other
AIF
EU passport Median Average
Note: Investor concentrati on of EU-passported AIFs, end of 2017, in % of NAV.Investor concentrati on computed as share of AIF equity beneficially owned by the 5largest investors. FoF=Fund of funds. Data for 24 EEA countries.
Sources: AIFMD database, National Competent Authorities, ESMA.
0%
25%
50%
75%
100%
Tota l EU FoF Hedge
fund
Private
equity
Real
estate
Other
AIF
None
Securi ties CIUs Physical assetsIRDs FX CDSOther derivatives
Note: Share of gross exposures by AIF type, end of 2017, in % of total. AIFsmanaged and/or marketed by authorised EU AIFMs. FoF=Fund of funds, None=Nopredominant type. Data for 24 EEA countries.
Sources: AIFMD database, National Competent Authorities, ESMA.
0%
1200%
2400%
3600%
4800%
0%
200%
400%
600%
800%
FoF Hedge
fund
Private
equity
Real
estate
Other
AIF
None
Adjusted gross leverage AuM/NAV (rhs)
Note: Adj usted gross l everage of AIFs managed and/or marketed by authorised EUAIFMs, end of 2017, in % of NAV. Adjusted gross leverage does not include IRDs.FoF= Fund of funds, None=No predominant type. Data for 24 EEA countries.
Sources: AIFMD database, National competent authorities, ESMA.
0%
25%
50%
75%
100%
Tota l
EUFoF Hedge
fundPrivate
equityReal
estateOther
AIFNone
Daily Weekly
to monthly
Quarterly Quarterly
to yearly
Other
Note: Inves tor redempti on frequenci es all owed by open-end AIFs managedand/or marketed by authorised EU AIFMs, end of 2017, in % of NAV. EU andnon-EU AIFs by authorised EU AIFMs m arketed, r espec tively, w/ and w/o
passport. FoF=Fund of Funds, N one=No Predominant Type. Data for 24 EEAcountries.Sources: AIFMD database, National Competent Authorities, ESMA.

ESMA Annual Statistical Report on EU Alternative Investment Funds 2019 15
Funds of FundsFunds of Funds (FoFs) account for 16% of the NAV of EU AIFs, at around EUR 770bn. FoFs are mainly
sold to professional investors, yet among AIF types they have the largest share of retail investors (31%).
FoFs have significant exposures to funds from the same managers. They make little use of financial or
synthetic leverage. The largest type of FoFs faces limited mismatch, with investors able to redeem 83%
of the NAV within a week, while 77% of asset could be liquidated within this time frame. However, for
the mismatch to occur, investor redemptions would need to be several multiples higher than historical
episodes.
Funds of Funds: market size and
structure
Size: The size of the FoFs sector amounts to
EUR 776bn, or 16% of all AIFs. Unlike other AIFs,
FoFs are spread across EU countries
(ASR-AIF.20), with a larger presence in countries
with a large asset-management industry (United
Kingdom, Germany, Luxembourg and France).
Funds of funds types: Most FoFs pursue
strategies beyond investing in PE funds or HFs.
FoFs investing in HFs and PE funds only account
for 9% and 8% of the NAV (ASR-AIF.21)
respectively.
Distribution: Like most types of AIF, FoFs have
access to the EU passport to a large extent, with
76% able to be sold throughout the EU (ASR-
AIF.22).
Funds of Fund investors: FoFs are mainly sold
to professional investors (69%), although among
AIF types they have the largest share of retail
investors (ASR-AIF.16). The share of retail
investors varies significantly between FoF
strategies — below 10% for funds of PE funds
and funds of HFs at one end, and close to 40 %
for ‘Other FoFs’. Among professional investors,
pension funds and insurance companies are the
main investors, accounting for 18% and 11% of
the NAV (ASR-AIF.23) respectively, with an even
larger share for FoFs investing in PE and HFs
(36% for pension funds and 8% for insurance
companies).
ASR-AIF.16 AIF investors
Predominantly professional investors
Geographical investment focus. FoFs invest
primarily in the EEA (57%), followed by
supranational issuers (27%) and North America
(8%) (ASR-AIF.24). Since the supranational
issuers category also covers ‘multiple regions’,
FoFs may invest in geographically diversified
funds, rather than in supranational issuers
specifically.
Leverage and liquidity risks
Gross exposures: FoFs are predominantly
exposed to other funds (84% of exposures), in
line with the strategy used (ASR-AIF.25). FoFs
have a large share of their fund holdings (36%)
invested in funds from the same manager
(ASR-AIF.17).
0% 20% 40% 60% 80% 100%
Other FoF
Fund of HF
Fund of
PE
Retail investors Professional investors
Note: Clients of funds of funds managed and/or marketed by authorised EU AIFMsand sub-threshold managers registered only in nati onal jurisdictionsat, end of 2017,in % of NAV. F oF=Fund of funds, PE= Private equity fund, HF=Hedge fund. D ata for
24 EEA countries.Sources: AIFMD database, National Competent Authorities, ESMA.

ESMA annual statistical report on EU alternative investment funds 2019 16
ASR-AIF.17 Share of fund holdings for FoFs
Significant cross investment
Leverage: FoFs have limited use of leverage:
regulatory AuM to NAV is 115% on aggregate,
with some variation by type (ASR-AIF.26).
Relatively low leverage levels come from limited
exposures to derivatives and little use of financial
leverage (less than 1% of NAV).
Liquidity risk: Most FoFs are open-ended funds
(71%), with the exception of funds of PE funds.
Most open-ended FoFs offer daily liquidity to
investors (ASR-AIF.27). At the aggregate level,
FoFs’ liquidity profile points to very limited
liquidity mismatch: within a week investors can
redeem up to 83% of the NAV, while 77% of the
assets can be liquidated within this time frame.
For the liquidity mismatch to crystallise at the
aggregate level, investors would need to redeem
more than 77% of the NAV, which is extreme.
However, by construction the liquidity of the
portfolio of FoFs depends on the liquidity of the
underlying funds, which can be difficult to
measure.
ASR-AIF.18 Liquidity profile
Some liquidity mismatch
Unencumbered cash, i.e. a fund’s position in
cash or cash-like securities not subject to legal
claims by another party (for example from
collateral pledges or securities lending activities),
is an important indicator for a fund’s ability to
mobilise funds fast to meet redemption claims.14
FoFs have relatively low levels of unencumbered
cash, at around 2.5% of the NAV. (ASR-AIF.19).
ASR-AIF.19 Unencumbered cash
Cash buffers relatively low
14 The concept of unencumbered cash is not defined in the ESMA guidelines to the AIFMD reporting. See the section on ‘Fundamental issues in AIFMD data handling and statistics”, pp. 32-45, for further details.
CIUs by the AIFM
36%
CIUs by others53%
ETF by the AIFM
2%
ETF by others
5%
M M Fs by the AIFM
2%
M M Fs by others
2%
Note: Share of collective investment undertaki ngs held by funds of funds in 4Q17.AIFs managed and/or marketed by authorised EU AIFMs. CIUs=CollectiveInvestment Undertakings. Data for 24 EEA countries.
Sources: AIFMD database, National Competent Authorities, ESMA
49%
83%
91%92%
93% 95%
41%
77%86% 89%
94% 96% 100%
0%
25%
50%
75%
100%
1 day or
less
2-7 d 8-30 d 31-90 d 91-180 d 181-365
d
> 365 d
Investor Portfolio
Note: Portfolio and investor liquidity profiles of funds of funds pursui ng s trategiesclassified as "other" managed and/or marketed by authorised EU AIFMs, end of2017. Portfolio profile determined by percentage of the funds’ portfolios capabl e of
being liquidated within each specified period, inves tor liquidity profile depend onshortest period withi n each fund could be withdrawn or investors could receiveredemption payments. d= Days. Data for 24 EEA countries.Sources: AIFMD database, National Competent Authorities, ESMA.
0%
2%
3%
5%
Fund of HF Fund of PE Other FoF
Unencumbered cash
Note: U nencumber ed cash held by funds of funds , end of 2017, i n % of NAV. EUand non-EU AIFs by authorised EU AIFMs marketed, respec tively, w/ and w/opassport. FoF=Funds of funds, HF=Hedge fund, PE=Private equity fund. Data
for 24 EEA countries.Sources: AIFMD database, National Competent Authorities, ESMA.

ESMA Annual Statistical Report on EU Alternative Investment Funds 2019 17
ASR-AIF.20 ASR-AIF.21 Size of FoFs FoF strategies
Spread across countries Mainly outside of PE funds and HFs
ASR-AIF.22 ASR-AIF.23 EU passport FoFs investors
Most FoFs can be passported Mainly professional investors
ASR-AIF.24 ASR-AIF.25
Regional investment focus Gross exposures
Mainly EEA Mainly investment in funds
ASR-AIF.26 ASR-AIF.27
Leverage Redemption frequencies
Limited leverage Mostly daily and weekly
161150 146
129
51
139
0
45
90
135
180
UK DE LU FR NL Rest
Note: Net Asset Value of Funds of Funds, in EUR bn, end of 2017.Sources:AIFMD database, National Competent Authorities, ESMA
Fund of HF9%
Fund of PE8%
Other FoF83%
Note: Investment strategies of funds of funds , end of 2017, in % of NAV. Funds offunds managed and/or marketed by authorised EU AIFMs and sub-thresholdmanagers registered only in nati onal jurisdicti ons. FoF=Fund of funds, PE=Private
equity fund, HF=Hedge fund. Data for 24 EEA countries.Sources: AIFMD databaseNational Competent Authorities, ESMA.
EU passport76%
EU w /o passport17%
Non-EU w /o passport3%
Non-EU not marketed in EU 4%
Note: NAV of funds of funds by manager's access to AIFMD passport, end of 2017,in %. Authorised EU AIFMs with access to AIFMD passport or m arketing non-EUAIFs w/o passport, sub-threshold managers are registered only i n national
juridisdictions w/o passporting rights. Data for 24 EEA countries.Sources: AIFMD database, National Competent Authorities, ESMA.
0% 20% 40% 60% 80% 100%
Other FoF
Fund of PE
Fund of HF
Banks General government HouseholdInsurances Non-profit NoneOther CIUs Oth. fin. institu tions Pension fundsUnknown
Note: Ownershi p of units in funds of funds managed and/or marketed by authorisedEU AIFMs, end of 2017, in % of N AV. FoF=Fund of funds ; PE=Private equity fund,HF=Hedge fund. Data for 24 EEA countries.
Sources: AIFMD database, National Competent Authorities, ESMA.
Asia2%
EEA57%
Other Europe4%
North America
8%
Supra National
27%
Rest2%
Note: R egional i nvestment focus of funds of funds managed and/or marketed byauthorised EU AIFMs and sub-threshold managers registered only i n nati onaljurisdictions, end of 2017, in % of NAV. Geo-focus determined according to the
domicile of investments and the supr anational category including inves tmentswithout a predominant geo-focus. Data for 24 EEA countries.Sources: AIFMD database, National Competent Authorities, ESMA.
0%
25%
50%
75%
100%
Fund of HF Fund of PE Other FoF
Securi ties CIUs Physical assetsIRDs FX CDSOther derivatives
Note: Share of exposures by funds of funds' investment strategies, end of 2017, in% of total. AIFs managed and/or marketed by authorised EU AIFMs. FoF=Fund offunds, PE=Private equity fund, HF=Hedge fund. Data for 24 EEA countries.
Sources: AIFMD database, National Competent Authorities, ESMA.
0%
40%
80%
120%
160%
Fund of HF Fund of PE Other FoF
Leverage (AuM/NAV)
Note: Lever age of funds of funds managed and/or marketed by authorised EUAIFMs and sub-threshold managers registered only i n nati onal jurisdicti ons, end of2017, in % of NAV. Leverage computed as AuM/NAV ratio. FoF=Fund of funds ,
HF=Hedge fund, PE=Private equity fund. Data for 24 EEA countries.Sources: AIFMD database, National competent authorities, ESMA.
0%
25%
50%
75%
100%
Fund of HF Fund of PE Other FoF
Daily Weekly
to monthly
Quarterly Quarterly
to yearly
Other
Note: Inves tor redempti on fr equenci es allow ed by open-end funds of fundsmanaged and/or marketed by authorised EU AIFMs, end of 2017, in % of NAV.EU and non-EU AIFs by authorised EU AIFMs marketed, r espectively, w/ and
w/o passport. FoF=Fund of funds, PE=Private equity fund, HF=Hedge Fund.Data for 24 EEA countries.Sources: AIFMD database, National Competent Authorities, ESMA.

ESMA Annual Statistical Report on EU Alternative Investment Funds 2019 18
Real Estate FundsReal Estate Funds (RE) account for 11% of the NAV of AIFs, at EUR 523bn, invested mainly in
Commercial Real Estate (CRE), and the industry is concentrated in a few countries. Most RE funds are
sold throughout the EU, mainly to professional investors, although RE funds have one of the highest
shares of retail investors (26% of NAV), which given potential liquidity risk is a major concern. RE funds
are mostly exposed to illiquid physical assets which take time to sell. RE funds make limited use of
synthetic leverage, but they use financial leverage, with some RE types reliant on short-term borrowing.
The financing liquidity risk is amplified by the potential liquidity mismatch among AIF types: within a
week investors can redeem up to 20% of NAV while funds can only liquidate 8% of their assets.
Real Estate Funds: market size
and structure
Size: RE funds are the third-largest AIF type by
size, with a NAV of EUR 523bn, or 11% of all
AIFs. The RE fund industry is concentrated in a
few countries (ASR-AIF.33), with the top five
accounting for 85% of the NAV.
Real Estate fund types: RE investment
strategies focus mainly on CRE with 62% of the
NAV; exposure to residential markets is limited,
with 12% of the NAV (ASR-AIF.34).
Distribution: Among AIFs, RE funds have the
largest access to the EU passport, with 82% able
to be sold throughout the EU (ASR-AIF.35). This
high share could be explained by investor
demand to get exposures to specific housing
markets in the EU (UK or French housing markets
for example), assuming that RE funds invest
mainly in the country where they are domiciled.
Real Estate fund investors: RE funds are sold
mainly to professional investors (74%). Among
AIF types, RE funds have one of the largest
shares (after FoFs) of retail investors, especially
for CRE, with a share of 35% of the NAV
(ASR-AIF.28). Among professional investors,
pension funds and insurance companies are the
main investors, accounting for 27% and 13% of
the NAV (ASR-AIF.36) respectively. Other funds
also account for a sizeable share of RE fund
ownership, with 10% of the NAV. Banks have
limited exposures to RE funds, except for
residential RE funds for which banks hold 23% of
the NAV.
ASR-AIF.28 AIF investors
Predominantly professional investors
Geographical investment focus: RE funds
invest overwhelmingly in the EEA (83%), with
very limited exposures to other regions. The
second largest exposure, North America,
accounts for only 7% of the NAV (ASR-AIF.37).
Leverage and liquidity risks
Gross exposures: RE gross exposures are
concentrated in physical assets (around 70% of
exposures, across most RE types), in line with the
strategy used (ASR-AIF.38).
Leverage: RE funds make limited use of
leverage. Regulatory AuM to NAV is 136% on
aggregate, as they have limited exposures to
derivatives, with low dispersion across RE fund
types (ASR-AIF.39). However, RE funds do use
financial leverage, with outright borrowing
amounting to 7% of the NAV, the second largest
by AIF type (after HFs) (ASR-AIF.29).
0% 20% 40% 60% 80% 100%
Residential
Other
Multi-strategy
Industr ial
Commercial
Retail investors Professional investors
Note: Clients of real estate funds managed and/or marketed by authorised EUAIFMs and sub-threshold managers registered only in nati onal jurisdictions, end of2017, in % of NAV. RE = Real estate. Data for 24 EEA countries.
Sources: AIFMD database, National Competent Authorities, ESMA.

ESMA Annual Statistical Report on EU Alternative Investment Funds 2019 19
ASR-AIF.29 Financial leverage
Sizeable secured borrowing
Most available borrowing is relatively long,
implying limited financing liquidity risk for most
RE funds. However, for ‘other’ RE funds, very
short-term borrowing (overnight) amounts to 36%
of financing liquidity (ASR-AIF.30).
ASR-AIF.30 Financing liquidity risk
Low short-term borrowings for most RE funds
Liquidity risk: Around half of RE funds are open-
ended funds (52% of the NAV), and there is
considerable heterogeneity regarding
redemption frequencies for open-ended RE funds
(ASR-AIF.40). RE funds offering daily to monthly
liquidity account for 63% of the NAV, ranging from
20% for industrial RE funds to 72% for residential
RE funds. At the aggregate level, RE funds’
liquidity profile points to potential liquidity
mismatch: within a week, investors can redeem
up to 20% of the NAV, while only 8% of the assets
can be liquidated within this time frame. The
liquidity mismatch relates mainly to CRE funds,
the largest RE fund category: 25% of the NAV
can be redeemed weekly whereas only 6% of
15 Data currently available to ESMA show that the adoption of redemption gates and other liquidity arrangements arising from the illiquid nature of the assets as measure to manage liquidity risk is limited.
assets can be liquidated within a week
(ASR-AIF.31). The liquidity mismatch is more
likely to occur than for other types of AIF,
especially at the 1-month horizon, since in the
past funds have experienced outflows of the
order of 30% of the NAV, for example during the
Brexit referendum (ESMA (2016)).
ASR-AIF.31 Liquidity profile
Potential liquidity mismatch
The liquidity mismatch can be mitigated by cash
to some extent: unencumbered cash for RE
funds is higher compared to other AIF categories
(respectively 6% and 4.5% of the NAV,
ASR-AIF.32). However, within a 3-month horizon,
cash buffers are significantly lower than the
potential liquidity mismatch that could arise if
investors were to redeem. In that context, funds
may have to rely on LMTs, provided that they are
available at the fund level. Based on partial data,
around two thirds of open-ended CRE AIFs
require a notice period. Among them, more than
50% foresee a minimum period of 5 months for
notifying redemptions, while only 18% impose a
lock-up period for investors.15
ASR-AIF.32 Unencumbered cash
Cash buffers may be too small
0%
2%
4%
5%
Unsecured
borrowing
Secured via
PB
Reverse
repo
Secured via
other
Securi ties
borrowed
for shor ting
Note: Cash and securities borrowed by real es tate funds, end of 2017, in % ofNAV. EU and non-EU AIFs by authorised EU AIFMs marketed, respectively, w/and w/o passport. RE=Real estate. Data for 24 EEA countries.
Sources: AIFMD database, National Competent Authorities, ESMA.
26%36%
45%
0%
98% 100%
0%
25%
50%
75%
100%
1 day 2-7 d 8-30 d 31-90 d 91-180 d 181-365
d> 365 d
Commercial Industr ialOther RE Residential
Note: Liquidity fi nanci ng of real es tate funds managed and/or marketed by EUauthorised AIFMs, end of 2017. Aggregate amount of borrowing and cash financingdivided dependi ng on longes t period for w hich creditors are contr actually committed
to provide such fi nancing, Borrowing and cash financing incl ude dr awn andundraw n, committed and uncommitted lines of credit as well as any term financing.RE=Real estate. Data for 24 EEA countries.Sources: AIFMD database, National Competent Authorities, ESMA.
17%
25%28% 31%
40%
53%
5% 6% 7%
18%
42%
60%
100%
0%
25%
50%
75%
100%
1 day
or less
2-7 d 8-30 d 31-90 d 91-180 d 181-365
d
> 365 d
Investor PortfolioNote: Portfolio and i nvestor liqui dity profiles of funds of commercial real estate fundsmanaged and/or marketed by authorised EU AIFMs, end of 2017. Portfolio profiledetermined by percentage of the funds’ portfoli os capable of being liquidated withi n
each specifi ed period, inves tor liqui dity profil e depend on shortest period withi neach fund coul d be withdrawn or inves tors coul d receive redempti on payments. d=Days. Data for 24 EEA countries.Sources: AIFMD database, National Competent Authorities, ESMA.
0%
2%
4%
6%
8%
Commercial Industrial Multi-strategy RE
Other RE Residential
Unencumbered cash
Note: Unencumbered cash held by real estate funds, end of 2017, in % ofNAV. EU and non-EU AIFs by authorised EU AIFMs marketed, respectively, w/and w/o passport. RE=Real estate. Data for 24 EEA countries.

ESMA Annual Statistical Report on EU Alternative Investment Funds 2019 20
ASR-AIF.33 ASR-AIF.34 Size of RE funds RE fund strategies
Concentration in a few countries Mainly CRE
ASR-AIF.35 ASR-AIF.36 EU passport RE funds investors
High access to passport Pension funds’ largest investors
ASR-AIF.37 ASR-AIF.38 Regional investment focus Gross exposures
Investments mainly in EEA Mainly physical assets
ASR-AIF.39 ASR-AIF.40 Leverage Redemption frequencies
Limited use of leverage Large dispersion
181
7769
62 60
76
0
50
100
150
200
DE UK FR LU NL Rest
Note: Net Asset Value of real estate funds, in EUR bn, end of 2017.Sources:AIFMD database, National Competent Authorities, ESMA
Commercial62%
Industrial4%
Other RE22%
Residential 12%
Note: Inves tment s trategies of real estate funds, end of 2017, i n % of NAV. R ealestate funds managed and/or m arketed by full-scope EU AIFMs and sub-thresholdmanagers registered only i n nati onal jurisdictions. RE= Real estate. Data for 24
EEA countries.Sources: AIFMD database, National Competent Authorities, ESMA.
EU passport82%
EU w /o passport16%
Non-EU w /o passport2%
Non-EU not marketed in EU 0%
Note: NAV of real estate AIFs by manager's access to AIFMD passport, end of 2017,in %. Authorised EU AIFMs with access to AIFMD passport or marketing non-EUAIFs w/o passport, sub-threshold m anagers are registered only in national
juridisdictions w/o passporting rights. Data for 24 EEA countries.Sources: AIFMD database, National Competent Authorities, ESMA.
0% 20% 40% 60% 80% 100%
Residential
Other RE
Multi-strategy RE
Industr ial
Commercial
Banks General government HouseholdInsurances Non-profit NoneOther CIUs Oth. fin. institu tions Pension fundsUnknown
Note: Ownershi p of units in real es tate funds AIFs managed and/or marketed byauthorised EU AIFMs, end of 2017, in % of NAV. RE=Real es tate. D ata for 24 EEAcountries.
Sources: AIFMD database, National Competent Authorities, ESMA.
Asia5%
EEA83%
Other Europe4%
North America7%
Supra National1%
Rest>1%
Note: Regi onal investment focus of real estate funds managed and/or marketed byauthorised EU AIFMs and sub-threshold managers registered only in nationaljurisdictions, end of 2017, in % of N AV. Geo-focus determined according to the
domicile of investments and the supranational category includi ng investmentswithout a predominant geo-focus. Data for 24 EEA countries.Sources: AIFMD database, National Competent Authorities, ESMA.
0%
25%
50%
75%
100%
Commercial Industr ial Multi-
stra tegy RE
Other RE Residential
Securi ties CIUs Physical assets
IRDs FX CDS
Other derivatives
Note: Share of exposures by real estate funds' investment strategies , end of 2017,in % of total. AIFs m anaged and/or marketed by authorised EU AIFMs. RE=Realestate. Data for 24 EEA countries.
Sources: AIFMD database, National Competent Authorities, ESMA.
0%
35%
70%
105%
140%
175%
Commercial Industr ial Multi-
strategy REOther RE Residential
Leverage (AuM/NAV)Note: Leverage of real estate funds managed and/or marketed by authorised EUAIFMs and sub-threshold managers registered only in national jurisdictions, end of2017, in % of NAV. Leverage com puted as AuM/NAV ratio. RE=Real estate. Data
for 24 EEA countries.Sources: AIFMD database, National competent authorities, ESMA.
0%
25%
50%
75%
100%
Commercial Industr ial Multi-
strategy RE
Other RE Residential
Daily Weekly
to monthly
Quarterly Quarterly
to yearly
Other
Note: Investor redemption frequencies allowed by open-end real estate fundsmanaged and/or marketed by authorised EU AIFMs, end of 2017, in % of NAV.EU and non-EU AIFs by authorised EU AIFMs marketed, respectively, w/ and
w/o passport. RE=Real estate. Data for 24 EEA countries.Sources: AIFMD database, National Competent Authorities, ESMA.

ESMA Annual Statistical Report on EU Alternative Investment Funds 2019 21
Hedge Funds The EU Hedge Fund (HF) sector amounted to EUR 264bn at the end of 2017 in NAV, or 5% of all AIFs.
However, when measured by gross exposures, HFs account for 64% of AIFs since they rely heavily on
derivatives. HFs make limited use of the EU passport, and their investor base is more diversified than
other AIFs. Leverage is very high, particularly for some strategies highly reliant on derivatives. HFs are
exposed to little liquidity mismatch, as their assets can be liquidated quickly to meet investor
redemptions. HFs are exposed to financing risk, as one third of their financing is overnight, but they
tend to maintain large cash buffers, which are also used to meet future margin calls relating to
derivatives positions.
Hedge Funds — market size and
structure
HFs are funds that employ complex strategies,
usually through the use of derivatives, and rely on
leverage to generate returns.
Size: As of the end of 2017, the NAV of HFs sold
in the EU by European AIFMs amounted to
EUR 264bn (5% of all AIFs). The size of the EU
HF sector in AIFMD data is higher than reported
from other sources. However, HF AIFs domiciled
in the euro area (EA) are far smaller than
estimates based on ECB data (ASR-AIF.42).
Despite their limited size compared to the rest of
AIFs, as measured by their NAV (see also
AIFR-S.42), HFs are very active users of
derivatives, resulting in a very large amount of
regulatory AuM (around EUR 11tn), accounting
for 64% of all AIFs (ASR-AIF.41).
ASR-AIF.41 Size of HFs
Sharp differences due to derivatives
Most of the HF industry is concentrated in one
country, with the UK AIFMs accounting for 82%
of the NAV of HFs (ASR-AIF.50).
ASR-AIF.42 HFs in the EU
Size of the HF sector in the EU and the EA
AIFMD data can be used to compare the size of the HF sector to other sources. Based on the domicile of the manager, the NAV of AIF HFs amounted to EUR 264bn at the end of 2017 according to AIFMD data (ASR-AIF.43). This compares to a NAV of around EUR 190bn for HF AIFs according to Eurekahedge, a commercial provider. Eurekahedge data also show that AIFs account for only 40% of the size of the EU HF sector, with UCITS being the main type of HF in the EU (‘alternative UCITS’).
Looking at EA data, according to the ECB’s (partially estimated)
figures, HFs had a NAV of around EUR 407bn at the end of 2017,
with EUR 108bn for AIFs and EUR 299bn for UCITS. In AIFMD
data, HFs domiciled in EA countries have a NAV of around
EUR 30bn, far below ECB data. The ECB data also show that
UCITS account for the larger share of the HF sector in the EA (73%
of NAV).
ASR-AIF.43 HF size by types
UCITS HF larger than AIFs HF
The striking differences between the sources can be explained by different classifications. The AIFMD does not define HFs but provides a list of HF strategies on the basis of which AIFMs self-classify their AIFs. The ECB, in contrast, defines HFs as funds ‘which apply relatively unconstrained investment strategies to achieve positive absolute returns, and whose managers, in addition to management fees, are remunerated in relation to the fund’s performance’ (ECB (2017)), which may encompass funds which do not implement HF strategies (such as funds of HFs or AIFs classified under ‘Other AIFs’), and which also capture UCITS-registered funds pursuing the strategies under the definition.
Hedge Fund types: HFs pursue a wide range of
strategies (ASR-AIF.51). Strategies relating to
equities (such as long/short) account for half of
0
3,000
6,000
9,000
12,000
0
1,200
2,400
3,600
4,800
Hedge Funds Non Hedge Funds AIFs
NAV AuM (rhs)
Note: Net Asset Values and AuM by AIF types, in EUR bn, end of 2017.Sources: AIFMD database, National Competent Authorities, ESMA.
EU
263186
33108
266
299
0
100
200
300
400
500
AIFMD Eurekahedge AIFMD ECBclassification
UCITS AIF
Note: Size of the European hedge fund sector in EUR bn. NAV for AIFMD and ECB,AuM for Eurekahedge.Sources: AIFMD database, National Competent Authorities, ESMA, ECB,Eurekahedge.
Euro area

ESMA Annual Statistical Report on EU Alternative Investment Funds 2019 22
the NAV of the sector, followed by macro (12%)
and commodity trading advisors (CTA) (11%).
However, in terms of gross exposures, HF
strategies relying heavily on derivatives are
predominant: macro account for 65%, followed by
relative value (29%), with equity strategies
amounting to less than 2%.
Distribution: Unlike other AIFs, most HFs do not
have access to the EU passport, with only 29%
able to be sold throughout the EU (ASR-AIF.52).
This can be explained by the domicile of HF AIFs,
since most of them are domiciled outside the EU,
mainly in offshore centres such as the Cayman
Islands.16 As a result, non-EU HF AIFs marketed
by EU AIFMs without passporting rights account
for most of the NAV (close to 70%).
Hedge Fund investors: HFs are almost
exclusively owned by professional investors, with
retail investors accounting for less than 5%
(ASR-AIF.45). Among professional investors,
ownership is split across investor types
(ASR-AIF.54). ‘Other collective investment units’
are the main holders of HF shares at 37%,
followed by pension funds (15%) and other
financial institutions (13%). Similarly, with other
AIFs, the ownership of HF shares is highly
concentrated, with the top five holders accounting
for around 75% of the NAV, across strategies.
ASR-AIF.44 HF investors
Almost exclusively professional investors
Investment focus: HFs invest primarily in North
America (46%), followed by the EEA (34%) and
Asia (10%). (ASR-AIF.45).
16 See the section “The structure of the EU and US Hedge Funds industry”, pp. 48-51.
ASR-AIF.45 Regional investment focus
Most exposures towards North America
Leverage and liquidity risks
Gross exposures: Gross exposures of HFs are
diverse and heterogeneous across strategies
(ASR-AIF.54). Macro, CTA, relative value and
credit HFs have high exposures relating to
derivatives, especially interest-rate derivatives.
Other strategies tend to have their main
exposures towards securities. Securities account
for more than 50% of gross exposures for
event-driven and equity HFs (64% and 57%
respectively).
Regarding the clearing of derivatives by HFs,
most derivatives are bilaterally cleared
(ASR-AIF.55). Low levels of central clearing point
to the use of bespoke derivatives rather than
vanilla derivatives subject to the clearing
obligation, which could be explained by the use
of complex strategies by HFs. HFs are therefore
mainly subject to bilateral risk-management
procedures in order to mitigate their counterparty
risk.
HFs have high levels of unencumbered cash
compared to other AIFs (24% for HFs versus 5%
for all AIFs). The highest levels of cash are for
strategies that have the highest exposures to
derivatives, such as relative value, macro, credit
and CTA (ASR-AIF.46). This suggests that part
of the cash buffers is used to cover future margin
calls.
0% 20% 40% 60% 80% 100%
Relative Value
Other HF
Multi-strategy HF
Macro
Event Driven
Equity
CTA
Credit
Retail investors Professional investors
Note: Clients of hedge funds managed and/or marketed by authorised EU AIFMsand sub-threshold managers registered only in nati onal jurisdictions, end of 2017, in% of NAV. HF=Hedge fund. Data for 24 EEA countries.
Sources: AIFMD database, National Competent Authorities, ESMA.
Asia10%
EEA34%
Other Europe
5%
North America
46%
Supra National
1%
Rest4%
Note: Regional investment focus of hedge funds m anaged and/or marketed byauthorised EU AIFMs and sub-threshold managers registered only i n nati onaljurisdictions, end of 2017, in % of NAV. Geo-focus determined according to the
domicile of i nvestments, and the supranational category i ncludi ng inves tmentswithout a predominant geo-focus. Data for 24 EEA countries.Sources: AIFMD database, National Competent Authorities, ESMA.

ESMA Annual Statistical Report on EU Alternative Investment Funds 2019 23
ASR-AIF.46 Unencumbered cash
Large cash buffers
Leverage: HFs are in general strongly leveraged
(ASR-AIF.56). Among HF strategies, relative
value and macro have the highest levels of
leverage (at respectively 4,440% and 1,350% of
NAV), even when IRD exposures are excluded.
To assess the plausibility of these figures, a
comparison with US HFs, as reported by the US
Securities and Exchange Commission (SEC),
points to qualitatively similar results with highest
leverage levels for relative and macro funds,
although levels differ significantly (at respectively
2,190% and 1,840% of the NAV).17 While most of
the leverage is due to synthetic leverage, i.e. the
use of derivatives, financial leverage is also
significant for HFs (ASR-AIF.47), amounting to
around 160% of the NAV (against 6% for all
AIFs). Secured borrowing through repo and
reverse repo accounts for 60% of the NAV and
funding from prime brokers for 12% of the NAV.
ASR-AIF.47 Financial leverage
Reliance on secured borrowing
Liquidity risk: HFs reliant on short-term
borrowings are exposed to financing liquidity
risk (ASR-AIF.48). The risk would crystallise if
HFs were to use most of their available financing,
and then their counterparts were to cut or reduce
their funding. Overall, 30% of the funding is
overnight, with heterogeneity across strategies.
17 See the section ‘The structure of the EU and US Hedge Fund industry’, pp. 48-51.
Some strategies such as credit and event driven
have most of their available borrowing overnight
(79% and 49% respectively), exposing them to
potential rollover risk.
ASR-AIF.48 Liquidity financing
High portion of short-term funding
Regarding liquidity risks, most AIFs are open-
ended funds which offer weekly to monthly
liquidity to investors (ASR-AIF.57). HFs offering
daily liquidity only account for 6% of the NAV. At
the aggregate level, HFs liquidity profiles point
to very little liquidity mismatch: Within a week,
investors can only redeem up to 33% of the NAV,
while 51% of the assets can be liquidated within
this time frame (ASR-AIF.49). This pattern
remains across all HF strategies, despite different
levels of portfolio and investor liquidity. For
example, investors in CTA can redeem up to 85%
of the NAV within a week while portfolio liquidity
is close to 100% at this horizon. For macro funds,
investor redemptions within a week amount to
29% of the NAV against 46% for portfolio liquidity.
ASR-AIF.49 Liquidity profile
Limited liquidity mismatch
0%
15%
30%
45%
60%
Credit CTA Equity Eventdriven
Macro Multi-strategy
HF
OtherHF
Rel.value
Unencumbered cash
Note: Unencumbered cash held by hedge funds, end of 2017, in % of NAV. EUand non-EU AIFs by authorised EU AIFMs marketed, respectively, w/ and w/opassport. HF=Hedge fund. Data for 24 EEA countries.
Sources: AIFMD database, National Competent Authorities, ESMA.
0%
20%
40%
60%
80%
Unsecuredborrowing
Secured viaPB
Reverserepo
Secured viaother
Securitiesborrowed for
shorting
Note: C ash and securities borrowed by hedge funds, end of 2017, in % of NAV. EUand non-EU AIFs by authorised EU AIFMs marketed, respec tively, w/ and w/opassport. F oF=Funds of funds , None=No predominant type. Data for 24 EEA
countries.Sources: AIFMD database, National Competent Authorities, ESMA.
94% 99%
22%
79% 89%
49%
62%
7% 21%
100%
0%
25%
50%
75%
100%
1 day 2-7 d 8-30 d 31-90 d 91-180 d 181-365
d> 365 d
Credit CTA EquityEvent driven Macro Rel. value
Note: Liquidity fi nancing of hedge funds managed and/or marketed by authorisedEU AIFMs, end of 2017. Aggregate amount of borrowing and cash financing divideddepending on longes t period for which creditors are contractually committed to
provide such financing, Borrowing and cash financing include dr awn and undrawn,committed and uncommitted lines of credit as w ell as any term financing. HF=Hedgefund. Data for 24 EEA countries.Sources: AIFMD database, National Competent Authorities, ESMA.
5%
33%43%
69%
90% 96%
100%
29%
51%
83%99% 100% 100%
0%
25%
50%
75%
100%
1 day orless
2-7 d 8-30 d 31-90 d 91-180 d 181-365d
> 365 d
Investor Por tfolioNote: Portfoli o and investor liqui dity profiles of hedge funds managed and/ormarketed by authorised EU AIFMs, end of 2017. Portfolio profile determined bypercentage of the funds’ portfoli os capable of being liqui dated within each specifi ed
period, investor liquidity profile depend on shortest period within each fund could bewithdrawn or investors could r eceive redemption payments. d=Days. Data for 24EEA countries.Sources: AIFMD database, National Competent Authorities, ESMA.

ESMA Annual Statistical Report on EU Alternative Investment Funds 2019 24
ASR-AIF.50 ASR-AIF.51 Size of HFs by country HF strategies
High concentration in the UK Mainly equity strategies
ASR-AIF.52 ASR-AIF.53 EU passport Investor types
Lower use of passport High ownership of FoFs
ASR-AIF.54 ASR-AIF.55
Gross exposures Derivatives clearing
Heterogeneity across HF strategies Mostly bilateral clearing
ASR-AIF.56 ASR-AIF.57
Leverage Redemption profile
Very high leverage Mostly weekly to monthly frequency
217
14 11 6 312
0
60
120
180
240
UK LU SE MT NL Rest
Note: Net Asset Value of Hedge Funds, in EUR bn, end of 2017.Sources:AIFMD database, National Competent Authorities, ESMA
Credit4% CTA
11%
Equity49%
Ev ent Driv en5%
M acro12%
Other HF12%
Relativ e Value
7%
Note: Investment strategies of hedge funds, end of 2017, in % of NAV. Hedgefunds managed and/or marketed by authorised EU AIFMs and sub-thresholdmanagers register ed only in national jurisdictions. HF=Hedge fund. Data for 24
EEA countries.Sources: AIFMD database, National Competent Authorities, ESMA.
EU passport29%
EU w /o passport2%
Non-EU w /o passport40%
Non-EU not marketed in EU 29%
Note: N AV of hedge funds by manager's access to AIFMD passport, end of 2017, i n%. Authorised EU AIFMs with access AIFMD passport or marketing non-EU AIFsw/o passport, subthreshold managers are registered only in nati onal juridisdictions
w/o passporting rights. Data for 24 EEA countries.Sources: AIFMD database, National Competent Authorities, ESMA.
0% 20% 40% 60% 80% 100%
Relative Value
Other HF
Multi-strategy HF
Macro
Event Driven
Equity
CTA
Credit
Banks General government HouseholdInsurances Non-profit NoneOther CIUs Oth. fin. institu tions Pension fundsUnknown
Note: Ow nership of units in hedge funds managed and/or marketed by authorisedEU AIFMs, end of 2017, in % of NAV. HF=Hedge fund. Data for 24 EEA countries.Sources: AIFMD database, National Competent Authorities, ESMA.
0%
25%
50%
75%
100%
Credit CTA Equity Eventdriven
Macro Multi-strategy
HF
OtherHF
Rel.value
Securi ties CIUs Physical assetsIRDs FX CDSOther derivatives
Note: Share of exposures by hedge funds' inves tment strategi es, end of 2017, in %of total. AIFs managed and/or marketed by authorised EU AIFMs. HF=Hedge fund.Data for 24 EEA countries.
Sources: AIFMD database, National Competent Authorities, ESMA.
0% 20% 40% 60% 80% 100%
Relative value
Other HF
Multistrategy HF
Macro
Event driven
Equity
CTA
Credit
CCP Bila teral
Note: Es timated volume of derivatives cleared bilaterally and via CCP by AIFsmanaged and/or marketed by authorised EU AIFMs, in %. HF=Hedge fund. Datafor 24 EEA countries.
Sources: AIFMD database, National Competent Authorities, ESMA.
0%
1400%
2800%
4200%
Credit CTA Equity Eventdriven
Macro Multi-strategy
HF
OtherHF
Rel.value
Adjusted gross leverageNote: Adjusted gross leverage of hedge funds managed and/or marketed byauthorised EU AIFMs, end of 2017, in % of N AV. Adjus ted gross l everage computedas total exposur e less IRDs with respect to NAV. HF=Hedge fund. Data for 24 EEA
countries.Sources: AIFMD database, National competent authorities, ESMA.
0%
25%
50%
75%
100%
Credit CTA Equity Eventdriven
Macro Multi-strategy
HF
OtherHF
Rel.value
Daily Weekly
to monthly
Quarterly Quarterly
to yearly
Other
Note: Inves tor redempti on frequenci es all owed by open-end hedge fundsmanaged and/or marketed by authorised EU AIFMs, end of 2017, in % of NAV.EU and non-EU AIFs by authorised EU AIFMs marketed, r espectively, w/ and
w/o passport. HF=Hedge fund. Data for 24 EEA countries.Sources: AIFMD database, National Competent Authorities, ESMA.

ESMA Annual Statistical Report on EU Alternative Investment Funds 2019 25
Private Equity Funds Private Equity Funds (PE) account for 4% of the NAV of all AIFs, or EUR 204bn. They follow a range
of strategies and are almost exclusively sold to professional investors. PE funds make little use of
synthetic and financial leverage, and invest mainly in illiquid securities (unlisted securities). Overall,
liquidity risk is limited given that PE funds are overwhelmingly closed ended.
Private Equity Funds — market
size and structure
Size: PE funds amounted to EUR 204 bn at the
end of 2017, or 4% of all AIFs. The PE fund
industry is concentrated in a few countries
(ASR-AIF.62), with the top five accounting for
87% of the NAV.
Private Equity Fund types: PE investment
strategies are diversified, with 30% of the NAV
invested in growth capital, followed by venture
capital (14%) and mezzanine capital (4%). Most
of the NAV (52%) is related to other unspecified
strategies (ASR-AIF.63).
Distribution: As for other types of AIFs, the
majority of PE funds have access to the EU
passport, with 71% able to be sold throughout the
EU (ASR-AIF.64).
Private Equity Fund investors: PE funds are
sold mainly to professional investors (92%).
Among PE fund types, venture capital has a
larger share of retail investors, at 20% of the NAV
(ASR-AIF.58). Among professional investors,
investment funds, pension funds and insurance
companies are the main investors, accounting for
26%, 19% and 9% of the NAV (ASR-AIF.65)
respectively.
ASR-AIF.58 AIF investors
Predominantly professional investors
Geographical investment focus: PE funds
invest overwhelmingly in the EEA (77%), with
limited exposures to other regions. The second-
largest exposure, North America, accounts for
only 9% of the NAV (ASR-AIF.67).
Leverage and liquidity risks
Gross exposures: PE gross exposures are
concentrated in securities (around 83% of
exposures, ranging from 64% for multi-strategy
PE funds to 91% for growth capital), in line with
the strategy used (ASR-AIF.67). Unlisted equities
account for around 60% of PE exposures.
Leverage: PE funds make comparatively limited
use of leverage. The AuM-to-NAV ratio is at
113% on aggregate, the lowest among AIF types,
as PE funds have very limited exposures to
derivatives, with low dispersion across PE fund
types (ASR-AIF.68). PE funds make limited use
of financial leverage, with outright borrowing
amounting to 4% of the NAV (ASR-AIF.59). Most
borrowing is around a month, implying limited
financing liquidity risk for most PE funds.
ASR-AIF.59 Financial leverage
Limited secured borrowing
Liquidity risk: Most PE funds are closed-ended
funds (95% of the NAV) and the redemption
frequency for open-ended PE funds is usually
longer than for other types of AIF (ASR-AIF.69).
At the aggregate level, open-ended PE funds’
liquidity profile points to very limited liquidity
mismatch: within 6 months, investors can only
redeem up to 5% of the NAV, while 11% of the
assets can be liquidated within this time frame
(ASR-AIF.60). This pattern holds across all PE
fund types.
0% 20% 40% 60% 80% 100%
Venture Capital
Other PE
Multi-strategy PE
Mezzanine Capital
Growth Capita l
Retail investors Professional investors
Note: Clients of private equity funds managed and/or marketed by authorised EUAIFMs and sub-threshold managers registered only in nati onal jurisdictions, end of2017, in % of NAV. PE = Private equity fund. Data for 24 EEA countries.
Sources: AIFMD database, National Competent Authorities, ESMA.
0%
1%
2%
3%
4%
Unsecured
borrowing
Secured via
PB
Reverse
repo
Secured via
other
Securi ties
borrowed
for shorting
Note: Cash and securities borrowed by private equity funds, end of 2017, in % ofNAV. EU and non-EU AIFs by authorised EU AIFMs marketed, respectively, w/and w/o passport. PEQF=Private Equity Fund. Data for 24 EEA countries.
Sources: AIFMD databse, National Competent Authorities, ESMA.

ESMA Annual Statistical Report on EU Alternative Investment Funds 2019 26
ASR-AIF.60 Liquidity profile
Very limited liquidity mismatch
Given limited financing liquidity risk and very low
liquidity mismatch, PE funds tend to have
relatively high levels of unencumbered cash
compared to other AIFs at 4.9% of the NAV, with
some dispersion across PE fund types
(ASR-AIF.61). These cash reserves amount to
‘dry powder’, money that has not yet been
invested by PE fund managers.
ASR-AIF.61 Unencumbered cash
High levels of ‘dry powder’
3% 4% 4% 5%7%
100%
11%15%
0%
25%
50%
75%
100%
1 day orless
2-7 d 8-30 d 31-90 d 91-180 d 181-365d
> 365 d
Investor Por tfolioNote: Portfolio and i nvestor liqui dity profiles of private equi ty funds managed and/ormarketed by authorised EU AIFMs, end of 2017. Portfolio profile determined bypercentage of the funds’ portfolios capable of being liquidated within each specified
period, investor liquidity profile depend on shortest period within each fund could bewithdrawn or i nvestors could receive redempti on payments . d=Days. Data for 24EEA countries.Sources: AIFMD database, National Competent Authorities, ESMA.
0%
3%
5%
8%
10%
Growth
capitalMezzanine
capitalMulti-
strategy
PE
Other
PEVenture
Capital
Unencumbered cash
Note: U nencumbered cash held by private equity funds, end of 2017, in % ofNAV. EU and non-EU AIFs by authorised EU AIFMs marketed, respectively, w/and w/o passport. PE=Private equity fund. Data for 24 EEA countries.
Sources: AIFMD database, National Competent Authorities, ESMA.

ESMA Annual Statistical Report on EU Alternative Investment Funds 2019 27
ASR-AIF.62 ASR-AIF.63 Size of PE funds PE fund strategies
Concentration in a few countries Diversified strategies
ASR-AIF.64 ASR-AIF.65 EU passport PE fund investors
High access to passport Mainly professional investors
ASR-AIF.66 ASR-AIF.67
Regional investment focus Gross exposures
Mostly EEA Mainly unlisted securities
ASR-AIF.68 ASR-AIF.69
Leverage Redemption rights
Limited use of leverage Mainly closed-ended funds
81
42
34
138
26
0
23
46
69
92
UK LU FR NL DE Rest
Note: Net Asset Value of private equity funds, in EUR bn, end of 2017.Sources:AIFMD database, National Competent Authorities, ESMA
Grow th Capital
30%
M ezzanine Capital
4%
Other priv ate
equity52%
Venture Capital
14%
Note: Investment strategi es of private equity funds , end of 2017, in % of NAV.Private equity funds managed and/or marketed by authorised EU AIFMs and sub-threshold managers registered only in national jurisdictions. Data for 24 EEA
countries.Sources: AIFMD database, National Competent Authorities, ESMA.
EU passport71%
EU w /o passport24%
Non-EU w /o passport3%
Non-EU not
marketed in EU2%
Note: NAV of private equity funds by manager's access to AIFMD passport, end of2017, in %. Authorised EU AIFMs with access to AIFMD passport, subthreshol dmanagers registered only in national juridisdictions w/o passport. D ata for 24 EEA
countriesSources: AIFMD database, National Competent Authorities, ESMA.
0% 20% 40% 60% 80% 100%
Venture Capital
Other PE
Multi-strategy PE
Mezzanine Capital
Growth Capita l
Banks General government HouseholdInsurances Non-profit NoneOther CIUs Oth. fin. institu tions Pension fundsUnknown
Note: Ownershi p of units in private equity funds managed and/or marketed byauthorised EU AIFMs, end of 2017, in % of NAV. PE=Private equi ty fund. Data for24 EEA countries.
Sources: AIFMD database, National Competent Authorities, ESMA.
Asia2%
EEA77%
Other Europe8%
North America9%
Supra National1%
Rest3%
Note: Regi onal investment focus of private equity funds managed and/or marketedby authorised EU AIFMs and sub-threshol d managers registered only in nationaljurisdictions, end of 2017, in % of N AV. Geo-focus determined according to the
domicile of i nvestments, and the supr anational category including investmentswithout a predominant geo-focus. Data for 24 EEA countries.Sources: AIFMD database, National Competent Authorities, ESMA.
0%
25%
50%
75%
100%
Growth
capitalMezzanine
capitalMulti-
strategy
PE
Other
PEVenture
Capital
Securi ties CIUs Physical assetsIRDs FX CDSOther derivatives
Note: Share of exposures by private equi ty funds' investm ent strategies, end of2017, i n % of total. AIFs manged and/or marketed by authorised EU AIFMs.PE=Private equity fund. Data for 24 EEA countries.
Sources: AIFMD database, National Competent Authorities, ESMA.
0%
35%
70%
105%
140%
Growth
capital
Mezzanine
capital
Multi-
strategy
Other PE Venture
capital
Leverage (AuM/NAV)Note: Leverage of private equity funds managed and/or marketed by authorised EUAIFMs and sub-threshold managers registered only in national jurisdicti ons, end of2017, in % of NAV. Leverage computed as AuM/NAV rati o. PE=Private equity
funds. Data for 24 EEA countries.Sources: AIFMD database, National competent authorities, ESMA.
0%
25%
50%
75%
100%
Growth
Capital
Mezzanine
Capital
Multi-
stra tegy
Other PE Venture
Capital
Open-end Closed-endNote: Redemption rights provi ded in the ordi nary course to i nvestors in privateequity funds managed and/or marketed by authorised EU AIFMs, end of 2017, in %of NAV. PE=Private equity fund.Data for 24 EEA countries.
Sources: AIFMD database, National Competent Authorities, ESMA.

ESMA Annual Statistical Report on EU Alternative Investment Funds 2019 28
Other AIFs ‘Other AIFs’ account for 63% of the NAV of EU AIFs, at around EUR 3,103bn. This residual category
of the AIFMD reporting regime covers a range of strategies, with fixed income and equity strategies
accounting for 70% of the NAV and an additional residual category amounting to 27%. A more detailed
analysis of underlying strategies and potential classification issues in the ‘Other AIF’ category will be
provided in future editions of this report. Other AIFs are mainly sold to professional investors, although
there is a larger retail investor presence in the residual category. They make little use of financial or
synthetic leverage. While most types of other AIFs have very limited liquidity risk, the residual category
faces some liquidity mismatch.
‘Other AIFs’: — market size and
structure
Size: The ‘Other AIFs’ category is the largest type
of AIF, with a NAV of around EUR 3,103bn,
concentrated in a few countries (ASR-AIF.74). In
relative terms, ‘Other AIFs’ constitutes the main
AIF type in most EU countries, accounting for
around 80% of the NAV in Germany, the
Netherlands, Poland and Spain, and close to
50% or more in France, Luxembourg and the
United Kingdom.
‘Other AIF’ types: ‘Other AIFs’ can use a wide
range of strategies (ASR-AIF.75). The main
strategies are related to fixed income (41% of the
NAV) — which includes money-market AIFs —
and equity (29%). A significant portion of the NAV
of other AIFs (27%) is difficult to identify, as
managers did not refer to a specified strategy.
Distribution: Like most types of AIF, other AIFs
have access to the EU passport to a large extent,
with 77% able to be sold throughout the EU
(ASR-AIF.76).
‘Other AIF’ investors: Other AIFs are sold
mainly to professional investors (84%), although
retail investor presence is higher for the residual
category (‘other’), accounting for 32% of the NAV
(ASR-AIF.71). Among professional investors,
pension funds and insurance companies are the
main investors, accounting for 30% and 20% of
the NAV respectively. However, there are large
differences by strategies (ASR-AIF.77). Banks
hold more than 10% of the NAV for fixed income
and other categories.
ASR-AIF.70 AIF investors
Predominantly professional investors
Geographical investment focus. Other AIFs
invest primarily in the EEA (59%), followed by
North America (18%) and Asia (8%).
(ASR-AIF.78).
Leverage and liquidity risks
Gross exposures: AIF gross exposures are in
line with the strategy used (ASR-AIF.71). Equity
and fixed-income AIFs are mainly exposed to
securities (listed equities for equity AIFs and
mainly sovereign and investment grade (IG)
corporate bonds for fixed income AIFs).
Infrastructure AIFs have significant exposures to
physical assets, and commodity AIFs to other
derivatives, which include commodity derivatives.
The residual category (‘other’) is more diversified,
reflecting very different strategies pursued by the
managers.
0% 20% 40% 60% 80% 100%
Other
Infrastructure
Fixed income
Equity
Commodity
Retail investors Professional investors
Note: Clients of AIFs classified as Other AIFs managed and/or marketed byauthorised EU AIFMs and sub-thr eshol d managers registered only in nationaljurisdictions, end of 2017, in % of NAV. Data for 24 EEA countries.
Sources: AIFMD databse, National Competent Authorities, ESMA.

ESMA annual statistical report on EU alternative investment funds 2019 29
ASR-AIF.71 Gross exposures
Mostly securities
Leverage. Other AIFs have limited use of
leverage: Regulatory AuM to NAV is 137% on
aggregate, as they have limited exposures to
derivatives and have little use of financial
leverage (less than 2% of the NAV). Among other
AIF strategies, leverage remains limited
(ASR-AIF.79).
ASR-AIF.72 Liquidity profile
Significant mismatch for the ‘other’ category
Liquidity risk. Regarding liquidity risk, most
other AIFs are open-ended funds, with the
exception of infrastructure funds, offering from
daily to weekly and monthly liquidity to investors
(ASR-AIF.80). At the aggregate level, other AIFs’
liquidity profile points to very limited liquidity
mismatch. Within a week, investors can redeem
up to 80% of the NAV, while 77% of the assets
can be liquidated within this time frame (ASR-
AIF.81). However, for the liquidity mismatch to
occur, investors would need to redeem more than
77% of the NAV within a week, which is extreme
based on historical standards. The liquidity
mismatch is mainly related to the ‘other’ category
(ASR-AIF.72), since for the other strategies the
liquidity of the assets is higher than potential
redemption pressures from investors. This
liquidity mismatch represents a potential risk from
an investor-protection perspective, since retail
investors hold a significant share of units issued
by this category of other AIFs.
Some types of other AIFs report high levels of
unencumbered cash (ASR-AIF.73): for
commodity funds cash accounts for 27% of the
NAV. Such a high level of cash is in line with the
reliance on derivatives for this type of AIF.
ASR-AIF.73 Unencumbered cash
Sizeable buffers for the ‘other’ category
0%
25%
50%
75%
100%
Commodity Equity Fixedincome
Infra-structure
Otherfunds
Securi ties CIUs Physical assets
IRDs FX CDS
Other derivativesNote: Share of exposures by investment strategies of AIFs classifi ed as Other, endof 2017, in % of total. AIFs managed and/or marketed by authorised EU AIFMs.Data for 24 EEA countries.
Sources: AIFMD database, National Competent Authorities, ESMA.
47%
82%86%
89%
91% 93%
35%
72%
90% 91% 93%100%
0%
25%
50%
75%
100%
1 day or
less
2-7 d 8-30 d 31-90 d 91-180 d 181-365
d
> 365 d
Investor Por tfolio
Note: Portfolio and i nvestor liqui dity profiles of AIFs cl assified as Other and pursuing"other" s trategies managed and/or marketed by authorised EU AIFMs, end of 2017.Portfolio profile determined by percentage of the funds’ portfolios capabl e of being
liquidated withi n each specified period, inves tor liquidity profile depend on shortes tperiod within each fund could be withdrawn or investors coul d receive redemptionpayments. d= Days. Data for 24 EEA countries.Sources: AIFMD database, National Competent Authorities, ESMA.
0%
7%
14%
21%
28%
Commodity Equity Fixed
income
Infra-
structure
Other
funds
Unencumbered cash
Note: U nencumber ed cash hel d by AIFs cl assified as Other, end of 2017, in % ofNAV. EU and non-EU AIFs by authorised EU AIFMs marketed, respectively, w/and w/o passport. Data for 24 EEA countries.
Sources: AIFMD database, National Competent Authorities, ESMA.

ESMA Annual Statistical Report on EU Alternative Investment Funds 2019 30
ASR-AIF.74 ASR-AIF.75 Size of other AIFs Other AIFs strategies
Main AIF type in most countries Fixed income and equity dominant
ASR-AIF.76 ASR-AIF.77 EU passport Other AIFs investors types
Most other AIFs can be passported Mainly pension funds
ASR-AIF.78 ASR-AIF.79
Regional investment focus Leverage
Mostly EEA Limited use of leverage
ASR-AIF.80 ASR-AIF.81
Redemption frequency Liquidity profile
Mainly daily to monthly frequency Moderate liquidity mismatch
1230
532 489
317255 280
0
350
700
1,050
1,400
DE NL UK FR LU Rest
Note: Net Asset Value of AIFs classified as Other, in EUR bn, end of 2017.Sources:AIFMD database, National Competent Authorities, ESMA
Commodity1%
Equity29%
Fixed income
41%
Infrastructure2%
Other27%
Note: Investment s trategies of AIFs classifi ed as Other, end of 2017, i n % of NAV.AIFs managed and/or marketed by full scope EU AIFMs and sub-thresholdmanagers registered only in national jurisdictions. Data for 24 EEA countries.
Sources: National Competent Authorities, ESMA.
EU passport77%
EU w /o passport19%
Non-EU w /o passport1%
Non-EU not marketed in EU 3%
Note: N AV of AIFs classifi ed as Other by manager's access to AIFMD passport, endof 2017, in %. Authorised EU AIFMs with access to AIFMD passport or marketingnon-EU AIFs w/o passport, sub-threshol d managers registered only in national
juridisdictions w/o passporting rights. Data for 24 EEA countries.Sources: AIFMD database, National Competent Authorities, ESMA.
0% 20% 40% 60% 80% 100%
Other
Infrastructure
Fixed income
Equity
Commodity
Banks General gov. Households
Insurances Non-profit None
Oth. CIUs Oth. fin. institu tions Pension funds
UnknownNote: Ow nershi p of units in AIFs classified as Other AIFs managed and/or marketedby authorised EU AIFMs, end of 2017, in % of NAV. CIUs=Collective investmentundertakings. Data for 24 EEA countries.
Sources: AIFMD database, National Competent Authorities, ESMA.
Asia8%
EEA59%Other Europe
5%
North America18%
Supra National6%
Rest4%
Note: R egional investment focus of EU AIFs cl assified as Other managed and/ormarketed by authorised EU AIFMs and sub-threshold managers registered only innational j urisdictions, end of 2017, in % of NAV. Geo-focus determined according to
the domicile of inves tments and the supranational category incl uding investmentswithout a predominant geo-focus. Data for 24 EEA countries.Sources: AIFMD database, National Competent Authorities, ESMA.
0%
40%
80%
120%
160%
Commodity Equity Fixed
income
Infra-
structure
Other
funds
Leverage (AuM/NAV)Note: Lever age of AIFs classified as Other managed and/or marketed byauthorised EU AIFMs and sub-threshold managers registered only i n nati onaljurisdictions, end of 2017, in % of N AV. Leverage computed as AuM/NAV r atio.
Data for 24 EEA countries.Sources: AIFMD database, National competent authorities, ESMA.
0%
25%
50%
75%
100%
Commodity Equity Fixed
income
Infra-
structure
Other
fundsDaily Weekly
to monthly
Quarterly Quarterly
to yearly
Other
Note: Investor redemption fr equenci es allowed by open-end AIFs classified asOthe rmanaged and/or marketed by authorised EU AIFMs, end of 2017, i n % ofNAV. EU and non-EU AIFs by authorised EU AIFMs marketed, respectively, w/
and w/o passport. Data for 24 EEA countries.Sources: AIFMD database, National Competent Authorities, ESMA.
45%
80%86% 89% 92%
93%
100%
41%
77%
89% 92% 94% 95%
0%
25%
50%
75%
100%
1 day orless
2-7 d 8-30 d 31-90 d 91-180 d 181-365d
> 365 d
Investor Por tfolioNote: Portfolio and investor liquidity profiles of AIFs cl assified as Other managedand/or marketed by authorised EU AIFMs, end of 2017. Port folio profile determinedby percentage of the funds’ portfolios capabl e of bei ng liquidated within each
specified period, inves tor liqui dity profile depend on shortest period withi n each fundcould be withdrawn or i nvestors could receive redempti on paym ents. d=Days . Datafor 24 EEA countries.Sources: AIFMD database, National Competent Authorities, ESMA.

ESMA Annual Statistical Report on EU Alternative Investment Funds 2019 31
References
ECB (2017), Manual on investment fund
statistics.
ESMA (2013), Final report — Guidelines on key
concepts of the AIFMD.
ESMA (2014), Final report — Guidelines on
reporting obligations under Articles 3(3)(d) and
24(1), (2) and (4) of the AIFMD.
ESMA (2016), Report on Trends, Risks and
Vulnerabilities, No.2.
ESMA (2018), ESMA annual statistical report on
performance and costs of retail investment
products in the EU.
Ferrari, M. (2018), “AIFMD — A framework for
risk monitoring”, in ESMA Report on Trends,
Risks and Vulnerabilities, No.2.
FSB (2011), Progress in the implementation of
the G20 recommendations for strengthening
financial stability — Report of the Financial
Stability Board to G20 finance ministers and
central bank governors.
FSB (2015), Assessment methodologies for
identifying non-bank non-insurer global
systemically important financial institutions.
FSB (2017), Policy recommendations to address
structural vulnerabilities from asset management
activities’.
IOSCO (2009), Hedge Funds oversight — Final
report.
IOSCO (2017), Open-ended fund liquidity and
risk management — Good practices and issues
for consideration — Consultation report.
IOSCO (2018), Recommendations for liquidity
risk management for collective investment
schemes
IOSCO (2018), IOSCO report: Leverage,
CR08/2018.
Van der Veer, K., Levels, A., Lambert, C., Vivar,
L., Weistroffer, C., Chaudron, R. and de Sousa
van Stralen, R. (2017), “Developing
macroprudential policy for alternative investment
funds”, ECB Occasional Paper No. 202.

ESMA Annual Statistical Report on EU Alternative Investment Funds 2019 32
Statistical methods

ESMA Annual Statistical Report on EU Alternative Investment Funds 2019 33
Fundamental issues in AIFMD
data handling and statistics The extensive reporting obligations introduced by the AIFMD for AIFs and their managers allow NCAs
to oversee whether AIFMs are properly addressing risks associated with their activities. The AIFMD-
based data collection provides detailed information on the European AIF market — an exhaustive list
of fund managers, their access to the EU marketing passport and the size and characteristics of the
marketed products, such as the use of leverage and the liquidity profiles. The current coverage of
AIFMD data is around 80% of the EU AIF market, in terms of both the number of fund managers and
the NAV of AIFs. This article describes the key features of AIFMD data and the specificities in their
statistical evaluation. We also describe the remaining data-quality issues, with a focus on reported
leverage data. In addition, we provide a first overview of the AIFMD NPPR market.
Introduction
The AIFMD has created a comprehensive
regulatory and supervisory framework for
AIFMs at European level. In addition, the
AIFMD has created a single marketplace in the
EU targeted at professional investors for
alternative funds, that is HFs, PE funds, RE
funds or other structures unable to fit within the
UCITS regime due to liquidity or portfolio-
concentration issues.
One of the major characteristics of the AIFMD
is the introduction of extensive reporting
obligations18, on a regular basis, to allow NCAs
and ESMA to assess trends in the alternative
fund industry and monitor financial stability.19
Prior to the 2007 financial crisis, the most
important implication of AIFs’ opaqueness for
financial stability was the uncertainty that could
translate into concerns about counterparty and
credit risks in highly interconnected financial
markets (Acharya et al., 2009).20
18 This reporting obligation is laid down by Article 3(3)(d)
and Article 24(1), (2) and (4) of the AIFMD.
19 The US Dodd-Frank Act follows a similar approach in
this respect, by mandating registration and reporting for
systemic risk oversight.
20 Researchers have shown that while public disclosure (to markets) can harness market discipline, private disclosure (to regulators) provides authorities with the necessary information to monitor the stability of the financial institution (Daníelsson et al., 2005). Therefore, disclosure requirements are a key aspect of macro-prudential regulation in the context of the AIF industry.
21 In 2013 the US SEC started to periodically collect information from registered advisors who manage
Harmonised data collection
The AIFMD-based data collection in the AIF
industry is unprecedented at the EU level21 and
has a major impact on the quantitative
supervision of AIFMs. The standardisation of
the reporting obligation content implies a
uniform implementation of the rules established
by the AIFMD. In line with the principle of
regulating the manager and not the product, an
AIFM must provide the requested information
on behalf of the AIFs it manages22 to its home
NCA. The AIFMD also requires NCAs to
cooperate and exchange information on the
AIFMs under their supervision.23 To comply with
the reporting requirements set out in the
AIFMD, the level II regulation24 specifies the
frequency of reporting, which may vary
depending on several characteristics of the
AIFM and the complexity of the AIF under
management:
— the status of the manager, i.e. whether it is
an authorised EU AIFM, registered EU
private funds. This is applicable to private funds with at least USD 150mn in regulatory assets under management, which generally include borrowings, short-sales or other modes of leverage.
22 This reporting requirement also apply to non-EU AIFMs
that manage AIFs marketed in the Union.
23 See Article 53 of the AIFMD. ESMA and the ESRB
should also be informed.
24 Commission Delegated Regulation (EU) No 231/2013.

ESMA Annual Statistical Report on EU Alternative Investment Funds 2019 34
AIFM, or whether it is a non-EU AIFM
operating under the NPPR;
— the value of regulatory AuM in portfolios of
AIFs managed by a given AIFM25;
— whether the AIF employs leverage;
— the type of assets in which an AIF invests.
Annex IV to the level II regulation contains
details of the information to be reported.26
Overall, most level II measures focus on the
objectives to address micro-prudential risks and
ensure investor protection. Given that the
reporting frequencies differ for different funds,
full-scale data covering the entire EU AIF
market are available only on a yearly basis, i.e.
at the end of the year. The ESMA guidelines on
reporting obligations complement Annex IV to
the level II regulation by providing technical
definition and filling instructions.27
Under Article 24(1) of the AIFMD, for each
managed EU AIF or AIF marketed in the Union,
managers are required to report on the
breakdown of investment strategies, the
concentration of investors, the main categories
of assets held by the AIF — including principal
exposures and concentration — and the
regional investment focus. In addition, under
Article 24(2) and (4) authorised AIFMs, and
AIFMs employing leverage on a substantial
basis, are subject to a more extensive
disclosure of instruments traded, exposures,
AIFs’ market risks and liquidity profiles, use of
leverage and the results of the stress test.
Using the reported information, NCAs are in the
position to oversee whether AIFMs properly
address micro-prudential risks. While some
reporting items are mandatory for all AIFs, the
regulatory reporting template requests that
specific information be disclosed only if the AIF
is affected (e.g. the possibility for investors to
redeem their shares in the ordinary course). A
detailed inventory of the indicators built and the
relative coverage, defined as the ratio of the
25 The rules for the computation of the asset under
management are set out in Article 2 of the level II
regulation.
26 Annex IV to the implementing regulation provides a
whole pro forma reporting template, which consists of
more than 40 detailed questions and 300 data fields.
27 The purpose of the ESMA guidelines is to ensure the
common, uniform and consistent application of the
reporting obligations to NCAs stemming from
Article 3(3)(d) and Article 24(1), (2) and (4) of the
AIFMD. They provide clarification on the information
that AIFMs must report to NCAs, the timing of the
total number of AIFs reporting it to the number
of AIFs expected to report it, is provided in the
data inventory.
The AIFMD passport
The AIFMD does not address the funds
themselves, but rather the fund managers and
their current business activities, independently
of the specific strategy or business model. Its
scope is wide and applies not only to EU AIFMs
managing one or more AIFs, but also to all non-
EU AIFMs that manage or market one or more
AIF in the Union independently of whether
these are EU or non-EU AIFs.28 The marketing
regime provided by the directive is a complex
set of rules that establish two marketing
methods:
(1) the single marketplace known as the EU
marketing passport;
(2) the NPPR established at Member State
level.
Prior to the AIFMD, such marketing passport
was only available to UCITS. Unlike the UCITS
directive, the AIFMD passport is instead
granted to managers and the possibility to
access it depends strictly on their place of origin
(i.e. jurisdiction of the manager) and the
domicile of the managed AIFs.
Currently, the marketing passport is only and
automatically available to full-scope authorised
EU AIFMs managing EU-domiciled AIFs. The
explicit prohibition for any AIFM to manage or
promote a fund unless authorisation has been
granted by the NCA of the Member State in
which the manager is domiciled lies at the core
of the directive itself. The definition of the
common authorisation framework allows
supervisors to identify managers and conduct
effective oversight relying on the reporting
reports and the procedures to be followed when AIFMs
move from one reporting obligation to another. The
guidelines have been in application since 8 October
2014.
28 Under the AIFMD, the activity of marketing includes any direct or indirect offering or placement at the initiative of the AIFM or on behalf of the AIFM, of units or shares in a fund it manages for or with investors domiciled in the EU. See Article 4.

ESMA Annual Statistical Report on EU Alternative Investment Funds 2019 35
obligations introduced by the directive. Once an
EU AIFM is authorised in one EU Member
State, it is allowed to market its products to
professional investors29 in any other Member
States without the need for any further
authorisation (ASR-AIF.82).
ASR-AIF.82 Scope of the AIFMD
Main differences between the AIFMD and the UCITS directive
The AIFMD provides an EU-level legal framework for the authorisation, supervision and oversight of managers of a range of AIFs which are not subject to the tight requirements under the UCITS directive. Investment funds managed or marketed in the Union, either open or closed ended, which do not ask for authorisation under the UCITS directive to obtain the UCITS regulatory label, must be managed by an entity authorised or registered in a Member State as an AIFM.
The directive regulates only the marketing of AIFs to professional investors as defined in Directive 2004/39/EC on markets in financial instrument (MiFID). The marketing of AIFs to retail investors and the sale of units or shares on the initiative of the investor are not covered by the directive, and it is left to NCAs to decide on the regulation of the marketing of AIFs to retail investors. Typically, a conservative retail-facing fund would come under the AIFMD where the fund does not follow the UCITS asset-allocation rules. A second crucial difference between the two regulatory regimes is that the AIFMD does not regulate the products, i.e. the funds, through portfolio-shaping rules, but instead focuses on the managers by setting minimum operating requirements, mandatory registration or authorisation and conduct of business rules. In so doing, it applies horizontally to all asset managers.
In other words, the AIFMD does not specify eligible assets, limit exposure or issuer concentration, leverage or risks. The UCITS directive on the other hand contains detailed provisions with regard to what UCITS are and are not allowed to do. This covers issues such as diversification requirements, limitations on the types of assets the fund might invest in or the obligation to redeem units upon request at short notice. Such limitations do not apply under the AIFMD, as they are not deemed appropriate for professional investors.
This framework provides some exemptions to
increase the efficiency of the regulation and
respond to the needs of smaller or specialised
funds. Sub-threshold AIFMs, i.e. managers with
less than EUR 100mn in AuM or EUR 500mn if
investors are locked-in for 5 years and in the
absence of leverage, as indicated by
Article 3(2), are partially exempted from
complying with some provisions of the AIFMD30
since their impact on financial stability is limited
(ASR-AIF.2). AIFMs invoking this de minimis
rule must register only in their home Member
State. As an immediate consequence, they are
29 Investors are considered to be professional clients or treated as professional clients within the meaning of Annex II to Directive 2004/39/EC on markets in financial instruments (MiFID).
30 See Article 3(2) of the AIFMD.
31 The ESMA register is maintained by NCAs of the Member States. See:
allowed to place their products only in their
jurisdiction and provide NCAs with simplified
reporting. However, EU sub-threshold AIFMs
can still exercise the right to ‘opt in’, that is they
can request the relevant NCAs to obtain
passporting rights in return for full compliance.
The ESMA public register31 makes it possible to
precisely assess the population of authorised
AIFMs, that is managers under the full scope of
the directive. According to the ESMA register,
2,402 EU AIFMs were fully authorised and
expected to report information to their home
NCA under Article 24 of the AIFMD at the end
of 2017.32 Around 50% of the full-scope
authorised EU AIFMs is domiciled in three
Member States (ASR-AIF.83).
Sub-threshold managers, subject to a lighter
regime, are registered and known only in their
home state before filing to the ESMA central
database.
ASR-AIF.83 Share of entities authorised under the AIFMD by country
50% of full-scope AIFMs based in three Member States
To date, the only marketing method available
for any other possible full-scope manager–
product combination, that is EU/non-EU full-
scope AIFM and EU/non-EU AIF, is the private
placement regime in each EU State where the
AIFM wishes to market its AIFs. The immediate
consequence is that both non-EU managers
wishing to market EU/non-EU AIFs in the Union
and EU managers marketing non-EU AIFs do
not benefit from passporting. National private
placement rules are at the discretion of each
Member State and differ across EU countries,
noting that some jurisdictions do not permit any
https://registers.esma.europa.eu/publication/searchRegister?core=esma_registers_upreg
32 Entities authorised before 1 October 2017.
United Kingdom
25%
France16%
Luxembourg10%
Spain10%
Germany5%
Netherlands4%
Sw eden4%
Others26%
Note: Number of managers authorised under AIFMD by national competent authorities andnotified to ESMA, end of 3Q17, in %.
Sources: ESMA Registers.

ESMA Annual Statistical Report on EU Alternative Investment Funds 2019 36
marketing without a passport and are then de
facto closed to non-EU AIFs (ASR-AIF.84).
The directive has limited applicability as
regards sub-threshold AIFMs, without
differentiating between EU and non-EU
managers and creating the apparent anomaly
that sub-threshold non-EU managers operating
under the NPPR are subject to higher
transparency requirements than domestic
registration-only AIFMs. It is actually up to each
Member State how to apply the NPPR to non-
EU AIFMs and EU AIFMs managing and/or
marketing non-EU AIFs that would qualify as
sub-threshold AIFMs.33
The AIFMD also envisages, in principle, the
possibility to confer the marketing passport to
both non-EU managers, that is managers
established outside the EU, and authorised EU
managers of non-EU funds.34 The provisions
relating to the extension of the passport are not
yet applicable. Once the non-EU passport
becomes available, non-EU managers and EU
AIFMs marketing non-EU funds will be able
provide cross-border services based on a
single authorisation.
To summarise, non-EU AIFs may then be
marketed without benefiting from the AIFMD
passport in three different situations:
— by sub-threshold AIFMs;
— under Article 36, by an EU AIFM;
— under Article 42, by non-EU AIFMs.
AIFMD reporting obligations cover only EU
AIFs or AIFs marketed in the EU. As a
consequence, EU managers are not mandated
by Article 24(2) of the directive to report for their
non-EU AIFs which are not marketed in the EU.
Nevertheless, in order to have a
comprehensive set of information for a proper
assessment of systemic risk, ESMA and NCAs
have required AIFMs to report full information
for these AIFs when they are designated
masters of EU feeder AIFs or the feeders are
marketed in the EU.35
ASR-AIF.84
AIFMD marketing regimes and access to the EU passport
Regime Third-country
regime
AIFM
domicile
AIF
domicile
Passporting
rights
AIFMD provision
EU
Passport
Authorisation
(full compliance
with the AIFMD)
EU EU Marketing
and/or
managing
passport
Articles 7, 31
and 32
Authorisation
(when available,
full compliance
with the AIFMD)
Third-
country
regime (not
in place)
EU Non-EU Marketing
passport
Article 35
Non-EU Non-EU Articles 37
and 40
EU Marketing
and/or
managing
passport
Articles 37
and 39
No
passporting
rights
National
registration (sub-
threshold)
EU/Non-EU EU/Non-EU Marketing
without
passport
Article 3(2),
Article 3(3)
and
Article 3(4)
Authorisation (full
compliance with
the AIFMD)
Third-
country
EU Non-EU Marketing
without
passport
Article 36
33 See European Commission Q&As on the AIFMD: https://ec.europa.eu/info/sites/info/files/aifmd-commission-questions-answers_en.pdf
34 ESMA has issued its advice to the Commission on whether to extend the passporting regime to the management and marketing of AIFs by non-EU AIFMs, and to the marketing of non-EU AIFs by EU AIFMs in
these countries.
35 This information is no longer requested if a non-EU master AIF and the feeder AIFs do not have the same AIFM. See ESMA opinion 2013/1340 on ‘Collection of information for the effective monitoring of systemic risk under Article 24(5), first sub-paragraph, of the AIFMD’.

ESMA Annual Statistical Report on EU Alternative Investment Funds 2019 37
regime (in
place)
Non-EU Master AIFs
not marketed
in EU
Article 34
NPPR (full
compliance with
the AIFMD)
Non-EU EU Marketing
without
passport
Article 42
Non-EU
Note: Marketing regimes and access to the EU passport established by the AIFMD. Both non-EU AIFMs and EU AIFMs marketing non-EU AIFs can currently only market their funds in the EU according to the rules established under the NPPR at the discretion of each Member State. Subject to ESMA’s opinion, non-EU AIFMs (and for EU AIFMs in respect of non-EU AIFs) can either become authorised to use the passport when it becomes available or continue to use the NPPRs. Green shading highlights AIF categories analysed in the report and displayed in the statistical annex; grey shading highlights AIFs marketed by non-EU AIFMs under the NPPR; provisions not yet in place not highlighted. NPPR=National private placement regime. Source: ESMA.
ASR-AIF.85 Use of AIFMD passport by NAV of AIFs
Passporting rights available to majority of AIFs
According to the data reported, at the end of 2017
the majority of AIFs in terms of the NAV (76%) is
from full-scope AIFMs with access to the EU
marketing passport. However, that does not imply
that in practice managers market their products
across EU Member States, since the AIFMD
does not provide data on the domicile of
investors.
Data intake and perimeter of the
analysis
This report presents the EU AIF market at the end
of 2017 using the information set made available
by NCAs of EU Member States in the ESMA
central database. The analysis focuses on data
provided to supervisors by authorised EU and
sub-threshold AIFMs on behalf of AIFs they
manage. The statistics presented here are based
on the reporting requirements specified in the
AIFMD, the level II regulation and the ESMA
guidelines to the AIFMD reporting. The analysis
36 In certain instances, the directive may require more frequent reporting on an AIF than its AIFM and vice versa. Therefore, it is possible to submit these returns at different frequencies.
37 For the end of 2017, only a fraction of AIFs managed and/or marketed by Irish AIMs were transmitted to the
does not cover products marketed by non-EU
AIFMs under Article 42 of the AIFMD in Member
states where an NPPR is established.
For the end of 2017, 24 NCAs transmitted AIFMs
and AIF data to the ESMA central database
(ASR-AIF.86).
Both managers and funds, depending on their
size, activities and characteristics, have to
determine their reporting frequency36, which can
be yearly, semi-annually or quarterly. Thus, a
complete market overview can be achieved only
annually, at the end of each calendar year.
ASR-AIF.86 Coverage of authorised full-scope AIFMs Most NCAs transmit extensive data
Coverage of full-scope AIFMs
Country
Above 80% Austria, Belgium, Cyprus, Czech,
Estonia, Finland, Germany, Italy, Latvia, Luxembourg, Norway, Poland, Slovakia, Slovenia, Spain, Sweden, United Kingdom
Between 50% and 80%
Croatia, France, Malta, Netherlands
Below 50% Ireland37, Hungary, Portugal
No report transmitted38
Bulgaria, Denmark, Greece, Liechtenstein
Note: Full-scope AIFMs reported to the central database, end of 2017. Coverage assessed comparing data intake with ESMA public register. Source: AIFMD database, National Competent Authorities, ESMA.
The lack of full coverage could be explained, at
least partially, by:
— the frequency of reporting as the AIFMs
having an annual reporting frequency and
that are authorised in the last quarter of the
ESMA central database.
38 According the ESMA Register of authorised entities, Lithuania and Iceland, do not have any information at AIFM and/or AIF level to report according the ESMA public register.
EU passport76%
EU w /o passport17%
Non-EU w /o passport3%
Non-EU not marketed in EU 4%
Note: NAV of AIFs by manager's access to AIFMD passport, end of 2017, in %.Authorised EU AIFMs with access to AIFMD passport or marketing non-EU AIFs w/opassport, sub-threshold managers registered only in nati onal juridisdicti ons w/o
passporting rights. Data for 24 EEA countries.Sources: AIFMD database, National Competent Authorities, ESMA.

ESMA Annual Statistical Report on EU Alternative Investment Funds 2019 38
year start to report from the beginning of the
second following year;
— potential mistakes in the AIFM register (e.g.
a situation in which the manager’s
authorisation to manage and/or market an
AIF expire but the manager has not been
cancelled from the ESMA Register).
Data collected and made available in the ESMA
central database cover 1,873 authorised full-
scope EU AIFMs, representing 78% of the known
population, and 2,386 sub-threshold managers.
Among the authorised EU managers, 376 have
acquired the right to use the passport and access
the single market by opting into full AIFMD
compliance.
ASR-AIF.87 AIFMs’ data available to ESMA
Comprehensive overview of the EU market
AIFM type AIFMs filing AIFMs without
information
EU full-scope 1,873 145
Opted-in 376
Sub-threshold 2,411 334
EU 2,106 291
Non-EU 305 43
Total 4,284 479
Note: Full-scope authorised EU AIFMs and sub-threshold managers filing under the AIFMD to NCAs and transmitted to the ESMA central database, end of 2017. Source: AIFMD database, National Competent Authorities, ESMA.
ESMA guidelines specify that AIFMs and AIFs
that have commenced have to start reporting
from the first day of the calendar quarter following
authorisation or registration. Notably, AIFMs and
AIFs that have not started any activity must still
report a nil return to the home competent
authority. On a related point, AIFMs have to
provide a report upon liquidation of the AIFs they
manage.
Each AIF managed within the scope of the
directive must only have one single AIFM,
responsible for compliance with the requirements
of the AIFMD. For this reason, the inclusion in the
analysis of products marketed by non-EU sub-
threshold managers does not introduce any bias
39 At the end of the year 2017 data inflows from the Central Bank of Ireland dropped drastically with respect to the volume of files previously reported.
40 See the EFAMA Quarterly statistical report Q4 2017: https://www.efama.org/statistics/SitePages/European%20Quarterly%20Statistical%20Release.aspx
or create double counting of entities, as their AIFs
cannot be passported.
As of 31 October 2018, NCAs had gathered and
made available to ESMA 30,005 reports for the
end of 2017 of AIFs managed and/or marketed
by authorised EU and sub-threshold AIFMs. Of
the initial data intake, around 1,650 AIFs report a
nil return. The definition of the AIFs’ reference
sample for the analysis requires further data-
cleaning operations and consistency checks.
The volume of files is not unexpectedly high as,
according to ESMA guidelines, AIF-specific
information should be reported at the level of the
compartments or sub-funds when the AIF takes
the form of an umbrella fund. Moreover, the
number of AIFs reported to the central database
is in line39 with other market data sources.40
ASR-AIF.88 Data cleaning
Definition of the AIF reference sample
A series of preliminary operations are performed to define the sample of analysed AIFs and their characteristics. These include the following:
— Exclusion of unworkable reports.
As for AIFMs, AIFs’ reports may indicate that there is no
information to be reported for the specified reporting
period (nil return). Firms also have the possibility to
cancel previously submitted erroneous reports or amend
existing ones. For this reason, multiple amended reports
by the same fund for the same reporting period have to
be detected so that the data can be properly
consolidated.
— Exclusion of files missing critical information.
In a few occurrences, AIF reports may not provide any
indication of the investment strategy. Overall, the number
of cases is negligible. In particular, at the end of 2017
only 14 FoFs and 2 RE funds reporting a NAV equal to 0,
and 1 PE fund with a NAV of EUR 0.2bn did not provide
an indication of their primary investment strategy.
— Identification of feeder and master AIFs.
— Identification of each AIFM jurisdiction and managed
and/or marketed AIF domicile.
The final reference sample is constituted by close
to 26,400 AIFs.41 More than 75% of them are
managed by full-scope AIFMs benefiting from the
EU passport. In terms of NAV, the proportion is
comparable, i.e. 76% of the total NAV is managed
by European authorised AIFMs (ASR-AIF.89).
41 Only a negligible number of filers do not indicate the pursued investment strategy. In particular, 14 FoFs and 2 RE funds reporting a NAV equal to 0 and 1 PE fund with a NAV of EUR 0.2bn did not provide an indication of their primary investment strategy. This is the result of an incorrect data transmission.

ESMA Annual Statistical Report on EU Alternative Investment Funds 2019 39
ASR-AIF.89 AIFMs’ data available to ESMA
Comprehensive overview of the EU market
Marketing regime
AIFs filing
AIFs withdrawn
NAV (EUR bn)
EU AIFs
with passport 20,065 481 3,756.4
without passport 5,307 185 796.6
Non-EU AIFs
without passport 549 23 163.3
not marketed in EU 457 10 203.5
Total 26,378 699 4,919.8
Note: Number and NAV of AIFs by marketing regime, end of 2017. AIFs managed and/or marketed by authorised full-scope EU AIFMs and sub-threshold managers filing under the AIFMD to NCAs and transmitted to the ESMA central database, at the end of 2017. Source: AIFMD database, National Competent Authorities, ESMA.
EU AIFs marketed by sub-threshold managers
without access to the passport amount overall to
around EUR 800bn in terms of NAV.
ASR-AIF.90 Use of AIFMD passport by NAV of AIFs
Passporting rights available to majority of AIFs
With the exception of HFs, the majority of AIFs
marketed in the Union are not domiciled in the EU
Passported EU HFs amount to EUR 77bn, that is
30% of the HF sector’s NAV, as opposed to the
40% of non-EU HFs marketed in the Union under
private placement rules. The remaining 30%
(EUR 75bn) are non-EU master AIFs managed
by full-scope EU AIFMs but not marketed in the
EU.42
Feeder funds are excluded from analysis to avoid
any double counting of assets.43
42 These non-EU master HFs are almost entirely managed by UK firms.
43 The AIFMD defines a feeder AIF as a fund investing at least 85% of its assets in units or shares of one of more AIFs with identical strategies, that is a master AIF, or has
ASR-AIF.91 Feeder AIFs
Prevalence of EU master-feeder AIFs
Feeder AIFs EU Non-EU Total
AIFs filing with EU master 800 392 1192 without EU master 425 181 606
Total 1,225 573 1,798
NAV (EUR bn) with EU master 118.1 119.7 237.8 without EU master 37.3 38 75.3
Total 155.4 157.7 313.1
Note: Number and NAV of feeder AIFs by domicile, end of 2017. Source: AIFMD database, National Competent Authorities, ESMA.
As expected, with an average NAV of
EUR 150mn, AIFs by sub-threshold managers
appear somehow structurally smaller than AIFs
managed by full-scope AIMFs, which have
instead an average NAV of EUR 200mn. The
influence of large funds becomes evident when
considering the median NAV, which equals
EUR 40mn for funds by authorised full-scope EU
AIFMs and EU 10mn for AIFs managed by
managers registered at national level only.
When comparing products marketed by full-
scope EU AIFMs only, the average and median
NAVs are even higher for non-EU AIFs subject
only to the NPPR.
otherwise an exposure of at least 85% of its assets to such a master AIF. See Article 4 of the AIFMD.
0%
25%
50%
75%
100%
FoF Hedge
fund
Private
equity
Real
estate
Other None
EU Non-EUNote: Share of EU and non-EU AIFs managed and/or marketed by authorised EUAIFMs and sub-threshold managers registered only i n nati onal jurisdictions, end of2017, in % on NAV. Non-EU AIFs marketed w/o passport. D ata for 24 EEA
countries.Sources: AIFMD database, National competent Authorities, ESMA.

ESMA Annual Statistical Report on EU Alternative Investment Funds 2019 40
ASR-AIF.92 AIFs by full-scope EU AIFMs
Non-EU AIFs larger on average
AIFs by full-scope EU AIFMs
NAV (EUR bn)
Total Average Median EU passport 3,756.4 0.19 0.03 Non-EU marketed in EU without passport
134.7 0.5 0.1
Non-EU not marketed in EU
203.5 0.4 0.1
Total 4,094.6 0.2 0.4
Note: Size of AIFs managed and/or marketed by full-scope
authorised EU AIFMs, end of 2017. Source: AIFMD database, National Competent Authorities, ESMA.
Leverage measures in the AIFMD
Under the AIFMD leverage is defined as any
method by which the AIFM increases the
exposure of an AIF it manages, whether through
borrowing of cash or securities or leverage
embedded in derivative positions, or by any other
means.44 The AIFM must set a maximum level of
leverage which it may employ on behalf of each
AIF it manages. The level of leverage employed
must then be monitored and periodically
disclosed to investors.45
Notably, the AIFMD does not include formal legal
definitions of the notions ‘leveraged AIFs’ or
‘unleveraged AIFs’.46
The Commission delegated regulation requires
AIFMs to assess leverage created through the
use of derivatives according to two calculation
methods, the so-called gross and commitment
methods, and provide NCAs and ESMA with this
information for monitoring systemic risks and to
gain a complete picture of the use of leverage.47
The combined use of these two methods is
intended to grant an objective view of the risks
associated with the characteristics and
investment strategy of an AIF, as the use of
derivatives to increase market exposures is not
44 See Article 4 of the AIFMD. For PE funds, any exposure that exists at the level of the relevant financial structure should be excluded where the AIF’s exposure is limited to its investment in such a financial structure or such companies. See ESMA Q&As, Section VII.
45 See Article 15(4) of the AIFMD.
46 See ESMA response to EIOPA questions on the AIFMD: https://www.esma.europa.eu/press-news/esma-news/esma-responds-eiopa-questions-aifmd
47 Principles and rules for calculating exposures under the gross and commitment methods are laid down,
fully accounted by balance-sheet-derived
measures. While the gross leverage represents
the market footprint of a fund, the commitment
exposure displays its reliance on netting and
hedging. Leverage rates as calculated under the
gross and commitment methods are requested
by Article 24(2) of the AIFMD.48
The amount of leverage under the gross method
has to be computed and reported by AIFMs on
behalf of the managed funds as follows:
— excluding the value of any cash and cash
equivalents which are highly liquid
investments held in the base currency of the
AIF that are readily convertible to an amount
of cash, subject to an insignificant risk of
change in value, and which provide a return
no greater than the rate of a 3-month high-
quality government bond;
— converting derivatives instruments into the
equivalent position in their underlying
assets49;
— including exposure gained from the
reinvestment of cash borrowings. In this
specific case, it must be considered the
higher between the market value of the
investment realised and the total amount of
the secured or unsecured cash borrowed;
— including positions within repo or reverse
repo transactions and securities lending or
borrowing arrangements. In case of
convertible borrowings, the exposure to
consider corresponds to their market value.
In the same line of reasoning, under the gross
method, cash and cash equivalent borrowings
should also be excluded when these borrowings
remain in cash and the amount of that payable is
known.
The assessment of leverage under the
commitment method requires more elaborate
calculations by also taking into consideration
hedging and netting arrangements between
derivatives in reducing the overall exposure. It is
then obtained by:
respectively, in Articles 7 and 8 of the AIFMD.
48 Gross and commitment leverage rates must be reported, respectively, in items 294 and 295 of the consolidated AIFMD reporting template.
49 The detailed conversion methodologies set out in paragraphs 4 to 9 and 14 of Annex I and in Annex II to the Commission delegated regulation.

ESMA Annual Statistical Report on EU Alternative Investment Funds 2019 41
— converting each derivative instrument
position into an equivalent position in the
underlying asset;
— applying netting and hedging arrangements;
— calculating exposure created through the
reinvestment of borrowings where such
reinvestment increases the exposure of the
AIF;
— including convertible borrowings, repos,
reverse repos, securities lending and
securities borrowings.
The main difference between the two
methodologies is that the commitment approach
nets off derivative instruments, while the gross
method aggregates them.50 However, derivatives
the AIF is investing in should not be subject to
conversion when those instruments are used to
offset market risk borne by other assets in
portfolio as the exposures of the two investments
balance one another. Importantly, the
requirement that netting arrangements refer to
the same underlying asset is not open to
interpretation, so that even different share
classes or bonds issued by the same issuer
cannot be considered as identical for the
purposes of netting.51
Usually a portfolio is leveraged by using direct
borrowings (i.e. financial leverage) and through
derivatives and other instruments for efficient
portfolio-management purposes.
Leverage is likely to arise through the use of
index futures, forward foreign exchange contracts
or contracts for difference, where cash is paid to
the counterparty as a margin against the current
mark-to-market value of the derivative contract.
Notably, for the calculation of the commitment
leverage, financial derivatives instruments must
be considered only when they create an
incremental exposure. An illustrative example of
this general concept is the total exposure
resulting from investing in an index future
contract, and holding a cash position equal to the
total underlying market value of such a contract
is deemed equivalent to the one from a direct
investment in the index shares.52 The use of
leverage therefore creates additional risks and
may significantly increase the market and
50 Temporary borrowing facilities that are backed by capital commitments from investors are excluded from the leverage calculation, but this does not extend to revolving credit facilities.
51 The full set of eligible netting and hedging arrangements and different treatment of certain cash and cash equivalent items is detailed in Annexes I and II to the
counterparty risk of the AIF through non-fully
funded exposure to underlying markets or
securities.
Table ASR-AIF.93 summarises the difference
between the gross and commitment exposures
and their connection with the regulatory AuM. It is
implicit in the different treatment of cash under
the gross and commitment methods that there is
no unique ordering of the resulting leverage
measures. A portfolio for which the set of netting
and hedging arrangements is not applicable
might display a commitment exposure higher
than the one resulting from the gross approach,
as in the latter case cash held in the base
currency of the AIF has to be excluded from the
calculation.
ASR-AIF.93 Definitions of leverage
Differences in methodologies
Gross leverage
Commitment leverage
AuM
Sum of the absolute values of all positions:
Sum of the absolute values of all positions:
Value of all assets in portfolio, including all assets acquired through use of leverage:
derivatives converted into equivalent position in their underlying assets;
exposure resulting from cash borrowings’ reinvestment;
any positions within repos or reverse repos, securities lending or other arrangements;
exclusion of cash in base currency.
derivatives converted into equivalent position in their underlying assets;
netting and hedging arrangements as applicable;
exposure created through the reinvestment of borrowings, only if this increases overall exposure of the fund;
other adjustments as per Annexes I and II to the implementing regulation.
borrowing of cash or securities;
leverage embedded in derivative positions or by any other means.
All cash
included. All cash
included.
The ESMA guidelines on the AIFMD reporting
obligations require the overall gross and
commitment leverage of an AIF to be quoted as
implementing regulation.
52 This example is outlined directly in recital 16 of the implementing regulation.
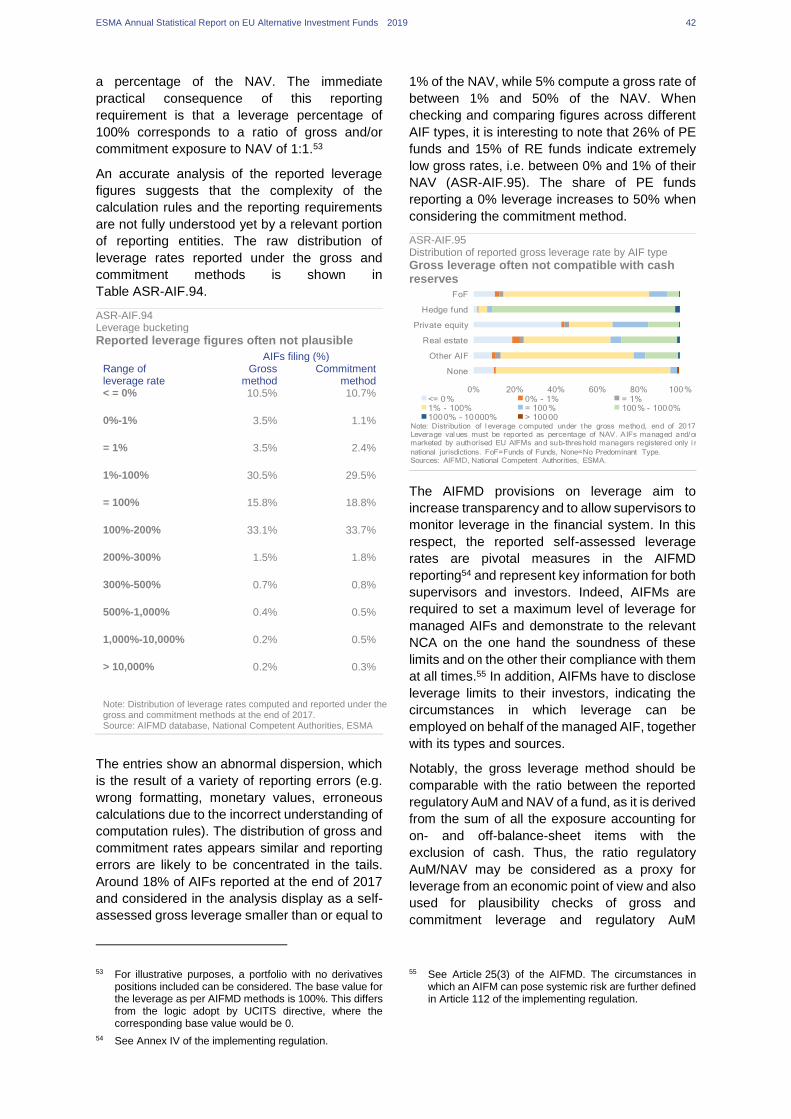
ESMA Annual Statistical Report on EU Alternative Investment Funds 2019 42
a percentage of the NAV. The immediate
practical consequence of this reporting
requirement is that a leverage percentage of
100% corresponds to a ratio of gross and/or
commitment exposure to NAV of 1:1.53
An accurate analysis of the reported leverage
figures suggests that the complexity of the
calculation rules and the reporting requirements
are not fully understood yet by a relevant portion
of reporting entities. The raw distribution of
leverage rates reported under the gross and
commitment methods is shown in
Table ASR-AIF.94.
ASR-AIF.94 Leverage bucketing
Reported leverage figures often not plausible AIFs filing (%) Range of leverage rate
Gross method
Commitment method
< = 0% 10.5% 10.7%
0%-1% 3.5% 1.1%
= 1% 3.5% 2.4%
1%-100% 30.5% 29.5%
= 100% 15.8% 18.8%
100%-200% 33.1% 33.7%
200%-300% 1.5% 1.8%
300%-500% 0.7% 0.8%
500%-1,000% 0.4% 0.5%
1,000%-10,000% 0.2% 0.5%
> 10,000% 0.2% 0.3%
Note: Distribution of leverage rates computed and reported under the gross and commitment methods at the end of 2017. Source: AIFMD database, National Competent Authorities, ESMA
The entries show an abnormal dispersion, which
is the result of a variety of reporting errors (e.g.
wrong formatting, monetary values, erroneous
calculations due to the incorrect understanding of
computation rules). The distribution of gross and
commitment rates appears similar and reporting
errors are likely to be concentrated in the tails.
Around 18% of AIFs reported at the end of 2017
and considered in the analysis display as a self-
assessed gross leverage smaller than or equal to
53 For illustrative purposes, a portfolio with no derivatives positions included can be considered. The base value for the leverage as per AIFMD methods is 100%. This differs from the logic adopt by UCITS directive, where the corresponding base value would be 0.
54 See Annex IV of the implementing regulation.
1% of the NAV, while 5% compute a gross rate of
between 1% and 50% of the NAV. When
checking and comparing figures across different
AIF types, it is interesting to note that 26% of PE
funds and 15% of RE funds indicate extremely
low gross rates, i.e. between 0% and 1% of their
NAV (ASR-AIF.95). The share of PE funds
reporting a 0% leverage increases to 50% when
considering the commitment method.
ASR-AIF.95 Distribution of reported gross leverage rate by AIF type
Gross leverage often not compatible with cash reserves
The AIFMD provisions on leverage aim to
increase transparency and to allow supervisors to
monitor leverage in the financial system. In this
respect, the reported self-assessed leverage
rates are pivotal measures in the AIFMD
reporting54 and represent key information for both
supervisors and investors. Indeed, AIFMs are
required to set a maximum level of leverage for
managed AIFs and demonstrate to the relevant
NCA on the one hand the soundness of these
limits and on the other their compliance with them
at all times.55 In addition, AIFMs have to disclose
leverage limits to their investors, indicating the
circumstances in which leverage can be
employed on behalf of the managed AIF, together
with its types and sources.
Notably, the gross leverage method should be
comparable with the ratio between the reported
regulatory AuM and NAV of a fund, as it is derived
from the sum of all the exposure accounting for
on- and off-balance-sheet items with the
exclusion of cash. Thus, the ratio regulatory
AuM/NAV may be considered as a proxy for
leverage from an economic point of view and also
used for plausibility checks of gross and
commitment leverage and regulatory AuM
55 See Article 25(3) of the AIFMD. The circumstances in which an AIFM can pose systemic risk are further defined in Article 112 of the implementing regulation.
0% 20% 40% 60% 80% 100%
None
Other AIF
Real estate
Private equity
Hedge fund
FoF
<= 0% 0% - 1% = 1%1% - 100% = 100% 100% - 1000%1000% - 10000% > 10000
Note: Distribution of l everage computed under the gross method, end of 2017.Leverage val ues must be reported as percentage of NAV. AIFs managed and/ormarketed by authorised EU AIFMs and sub-threshold managers registered only i n
national jurisdictions. FoF=Funds of Funds, None=No Predominant Type.Sources: AIFMD, National Competent Authorities, ESMA.

ESMA Annual Statistical Report on EU Alternative Investment Funds 2019 43
figures. Such a comparison may be misleading
for HFs, which make extensive use of derivatives,
are highly exposed to IRDs and pursue elaborate
trading strategies with cash reinvestment. Still, a
careful analysis of outliers and a comparison
between the regulatory AuM and the reported
total exposure to different asset classes56 can
provide insightful information on the sources of
leverage and its use.57
In light of the above considerations and data-
quality concerns around reported gross and
commitment rates, the amount of leverage in the
system is assessed by comparing across both
AIF types and strategies the regulatory AuM/NAV
ratio and an adjusted version of the gross
leverage, which is defined as follows:
𝐴𝑑𝑗. 𝑔𝑟𝑜𝑠𝑠 𝑙𝑒𝑣𝑒𝑟𝑎𝑔𝑒 𝑟𝑎𝑡𝑒 (%) =
(𝑇𝑜𝑡. 𝑔𝑟𝑜𝑠𝑠 𝑒𝑥𝑝𝑜𝑠𝑢𝑟𝑒 − 𝐼𝑅𝐷𝑠
𝑁𝐴𝑉) ∗ 100
That is, the system-adjusted gross leverage,
computed at fund level and then aggregated
across AIFs, is derived by leaving aside the
notional value of IRDs from the reported gross
total exposure.
This formulation for the adjusted gross leverage
allows for better comparability of the gearing
through derivatives across AIF types and
strategies. Moreover, this adjustment does not
essentially change the leverage ranking, as HFs
remain the largest users of leverage (ASR-
AIF.97).
ASR-AIF.96 Adjusted gross leverage
HFs as largest user of leverage
The simple gross notional amount of IRDs as
reported under the AIFMD does not permit a
56 Exposures are reported under Article 24(2) of the AIFMD. The corresponding items in the AIFMD reporting template are numbers 121, 122, 123, 124.
57 Reporting requirements do not include detailed portfolio composition.
58 Typically, the notional of the contract would be multiplied by the movement in the interest rate to determine the real pay-out.
precise reading of the exposure that is implied by
derivative positions. The notional per se, which
can even be extremely high in volume, does not
represent a material risk as this would instead
mostly depend on the duration of the contracts
subscribed and the movements of the underlying
rates.58 As discussed above, the so-called implicit
or synthetic leverage associated with IRDs would
instead be partially reflected in the commitment
method through netting and hedging.
Unlike IRDs, foreign exchange (FX) derivatives’
gross value must be reported according to the
investment purpose, that is depending on
whether they are used for hedging or not, which
cannot be verified ex post. For this reason, they
are not removed from the adjusted gross
leverage rate.
Under Article 24(2), AIFMs must also indicate the
value of borrowings embedded in financial
instruments. While this concept, from a purely
economic standpoint, seems to suggest an
immediate appreciation of synthetic leverage,
both the ESMA guidelines and the AIFMD
reporting template define it broadly as the gross
exposure of exchange-traded and over-the-
counter (OTC) derivatives net of margins
posted.59
This definition largely reflects the HFs’ gross
exposure to IRDs (ASR-AIF.98). Their
borrowings embedded in financial instruments
represent more than 90% of the overall exposure.
The type of margin to be deducted is left
unspecified.60
59 The corresponding items in the AIFMD reporting template are numbers 287 and 288.
60 A clearer definition of the margins to subtract from OTC and exchange-traded derivatives would be needed for a full appreciation of AIFs’ borrowing activity.
0%
1200%
2400%
3600%
4800%
0%
200%
400%
600%
800%
FoF Hedge
fund
Private
equity
Real
estate
Other
AIF
None
Adjusted gross leverage AuM/NAV (rhs)
Note: Adj usted gross l everage of AIFs managed and/or marketed by authorised EUAIFMs, end of 2017, in % of NAV. Adjusted gross leverage does not include IRDs.FoF= Fund of funds, None=No predominant type. Data for 24 EEA countries.
Sources: AIFMD database, National competent authorities, ESMA.

ESMA Annual Statistical Report on EU Alternative Investment Funds 2019 44
ASR-AIF.97 Borrowing embedded in financial instruments
HFs heavily exposed to OTC derivatives
Cash and securities borrowed (ASR-AIF.99) are
a direct appreciation of the financial leverage,
that is the gearing obtained by borrowing cash
and/or securities directly from counterparties and
then reinvesting them in other assets. This
financial leverage represents the fund’s balance-
sheet leverage. Under the AIFMD reporting
obligations, this is apparent from the aggregation
of unsecured cash, collateralised cash and
securities, and the borrowing of securities to
cover for short positions.61
ASR-AIF.98 Leverage through borrowing
HFs diversify funding sources
Data reported at the end of 2017 show that the
outright borrowing of cash and securities
amounts to 11% of the total NAV. For HFs, the
level of financial gearing is around 160% of their
NAV, and only a fraction seems to be obtained
through prime brokerage (ASR-AIF.100).
61 The corresponding items in the AIFMD reporting template are numbers 283, 284, 285, 286, 289.
ASR-AIF.99 AIFs’ borrowing sources
Reliance on reverse repo for funding
Both HFs and AIFs classified as ‘Other’ rely
strongly for their funding on repos and reverse
repurchase agreements, which account for
around 40% of the overall borrowings. Unsecured
borrowings play only a minor part, with 4% of the
total outright borrowings. A detailed discussion
on the use of the balance-sheet leverage is
available in the overview of the report.
All the metrics specified above can be contrasted
with the share of unencumbered cash.
The concept of unencumbered cash is also not
defined in the reporting framework. In general
terms, it is usually interpreted by practitioners as
outright cash or cash-like securities, including
G10 government bonds, which usually feature
low credit risk and are highly liquid. These cash
reserves are not used to enter into transactions
(e.g. swaps and other derivatives) or as
collateral, and their size gives an indication of a
fund’s ability to respond to margin calls and
absorb losses on positions, especially in the case
of derivatives-based strategies. Overall, 24% of
HFs’ total NAV is allocated to this purpose
(ASR-AIF.101).
0%
25%
50%
75%
100%
FoF Hedge
fund
Private
equity
Real
estate
Other AIF None
Cash and securities OTC derivatives Exchange-traded derivatives
Note: Borrowing of cash and securities or embedded in derivatives, end of 2017, in% of total exposure. AIFs managed and/or marketed by authorised EU AIFMs. OTCand exchange-traded deriatives net of margi ns. F oF=Fund of funds, None=No
predominant type. Data for 24 EEA countries.Sources: AIFMD database, National Competent Authorities, ESMA.
0%
40%
80%
120%
160%
FoF Hedge
fund
Private
equity
Real
estate
Other AIF None
Short position borrowing sec. Secured via other
Reverse repo Secured via PB
Unsecured borrowingNote: Cash and securities borrowed, end of 2017, in % of NAV. EU and non-EUAIFs by authorised EU AIFMs marketed, respectively, w/ and w/o passport.Sources: AIFMD databse, National Competent Authorities, ESMA.
0%
25%
50%
75%
100%
FoF Hedge
fundPrivate
equityReal
estateOther AIF None
Securi ties borrowed for shor ting Secured via other
Reverse repo Secured via PB
Unsecured borrowingNote: Sahre of cash and securities borrowed, end of 2017, in % of NAV. EU andnon-EU AIFs by authorised EU AIFMs marketed, respectively , w/ and w/o passport.FoF=Funds of funds, None=No predominant type. Data for 24 EEA countries.
Sources: AIFMD database, National Competent Authorities, ESMA.

ESMA Annual Statistical Report on EU Alternative Investment Funds 2019 45
ASR-AIF.100 Unencumbered cash
Large cash reserves in HF portfolios
AIFMD national private placement
regime market
Under Article 42 of the AIFMD, a Member State
can allow non-EU AIFMs to market units or
shares of AIFs they manage without benefiting
from the AIFMD passport. At EUR 1tn NAV, the
NPPR market is equivalent to one fifth of the
overall EU AIF market and therefore warrants
dedicated analysis. Since under the NPPR the
same AIF can be marketed under different
jurisdictions, it is important — in the process of
statistical aggregation —to identify and match
NPPR AIFs across Member States to avoid
double counting. This section lays out our
methodology and results from estimating
measures of this market segment.
Reporting under the NPPR
AIFMs that are not allowed to market AIFs under
the marketing or passporting regimes can, under
the AIFMD’s NPPR, market their funds in specific
Member States. Here, only the authorisation from
the jurisdiction is required. These managers have
reporting obligations under the AIFMD for the
funds that are marketed in the EU and these
obligations can differ depending on the country.
This component of the AIFMD is quite complex,
indeed there is no mapping of the different
country practices regarding the NPPR. These
AIFs are known by ESMA only after reporting to
NCA since they are not reported in the register.
The same AIF can be marketed by a non-EU
AIFM in more than one jurisdiction; this has to be
considered when analysing the market. Adding
up the figures received would lead to
overestimating market shares for funds reporting
62 GLEIF concatenated files — LEI data — GLEIF https://www.gleif.org/en/lei-data/gleif-concatenated-
in different countries. The full assessment of the
EU AIF market in terms of size composition and
risks for financial stability depends strictly on the
possibility to uniquely identify AIFs.
Size of the NPPR market
In this analysis only, the funds reported under the
NPPR — feeder funds excluded — are
considered. We estimate this extent of the AIFMD
market in identifying fund reporting to different
countries, using the legal entity identifier (LEI)
information provided by the Global Legal Entity
Identifier Foundation (GLEIF).62
After processing this input data, we assess a total
regulatory AuM of EUR 5.8tn and a NAV of
EUR 1trillion for the NPPR market. This
regulatory AuM is unequally distributed
depending on the fund type. Indeed, HFs and
funds classified as ‘Other’, i.e. equity and fixed
income, represent 96% of the final sample in
terms of regulatory AuM. There are also a lot of
disparities among AIF types. The median value of
regulatory AuM for HFs and AIF classified as
‘Other’ is, respectively, EUR 1bn and EUR 0.4bn.
Their average is much higher, EUR 22bn and
EUR 5bn; this indicates that the sample of funds
contains outliers, a small number of large entities
that are pushing up the average regulatory AuM
for these AIF types (ASR-AIF.102).
ASR-AIF.101 AuM by type of AIF Uneven distribution of AuM
Predominant type AuM (EUR bn) NAV (EUR bn) FoF 23 20 HF 4,887 196 PE 22 17 RE 112 71 Other AIF 794 721 No predominant type
5 3
First insights: NPPR market structures
similar to conventional AIFs
The identified AIFs marketed under the NPPR
show a NAV repartition similar to the funds
marketed by authorised EU and sub-threshold
managers. The NAV of the HFs is significant and
represents EUR 200bn.
file/download-the-concatenated-file#
0%
7%
13%
20%
26%
Total EU FoF Hedge
fundPrivate
equityReal
estateOther
AIFNone
Unencumbered cash
Note: Unencumbered cash, end of 2017, in % of NAV. EU and non-EU AIFs byauthorised EU AIFMs marketed, respec tively, w/ and w/o passport. FoF=Fund offunds, None=No predominant type. Data for 24 EEA countries.
Sources: AIFMD database, National Competent Authorities, ESMA.

ESMA Annual Statistical Report on EU Alternative Investment Funds 2019 46
ASR-AIF.102 NAV by type of NPPR AIF
NPPRs follow AIF-wide pattern
In terms of concentration, the NPPR market is
dominated by a few big entities. 7% of NPPR
AIFs have a NAV higher than EUR 5bn — these
funds represent 71% of the NPPR NAV. These
funds are only present in a few Member States,
since not all jurisdictions give permission to
managers to market their funds under the NPPR.
The market is almost exclusively composed of
non-EU AIFs, which hold 99.6% of the market.
This distribution is also quite similar among AIF
types.
ASR-AIF.103 NPPR AIFs by size
A few large NPPRs lead the market
Regarding AIF strategies, equity funds under the
‘Other’ type represent the highest share of the
NAV. Most of them are US ETFs.
ASR-AIF.104 NPPR AIF investment strategies
EQ, FI, RE as main investment focus
Finally, HFs under the NPPR regime are highly
leveraged (ASR-AIF.106) — at 2,400%. Thus
they are on average less leveraged than in HFs
under other regimes (4,500%).
ASR-AIF.105 NPPR AIF leverage
HFs with highest leverage
Funds-of-fund2%
Hedge fund13%
Priv ate equity1%
Real estate8%
Other76%
Note: NAV by type of AIFs marketed non-EU AIFMs w/o passporti ng rights ( art. 42of AIFMD), end of 2017, in %. AIFs identi fied via international standard identifiers(LEIs, ISIN, Cusip).
Sources: AIFMD database, National Competent Authorities, ESMA.
0%
25%
50%
75%
100%
<100mn 100-500mn 500mn-1bn 1-5bn >5bn
NAV Number of AIFsNote: Share of AIFs by size, end of 2017, in %. AIFs m anaged and/or m arketed byauthorised EU AIFMs and sub-threshold managers registered only in nationaljurisdictions. EU and non-EU AIFs by authorised EU AIFMs marketed, respectively,
w/ and w/o passport.Sources: AIFMD database, National Competent Authorities, ESMA.
Commercial real estate
5%
Equity fund64%
Event Driven2%
Fixed income11%
HF Equity Long/Short
2%
HF Macro2%
Remaining strategies14%
Note: Investment strategies of AIFs marketed by non-EU AIFMs w/o passportingrights (art. 42 of AIFMD), end of 2017, i n % of NAV. AIFs identified via internati onalstandard identifiers (LEIs, ISIN, Cusip).
Sources: AIFMD database, National Competent Authorities, ESMA.
0%
600%
1200%
1800%
2400%
FoF Hedge fund Private
equity
Real estate Other AIFs
Hu
nd
red
s
Leverage (AuM/NAV)
Note: Leverage of AIFs marketed by non-EU AIFMs w/o passporti ng rights (art.42 of AIFMD), end of 2017, in % of NAV. AIFs identi fied via i nternationalstandard identifiers (LEIs, ISIN, Cusip). Leverage computed as AuM/NAV ratio.
Sources: AIFMD database, National competent authorities, ESMA.
ESMA Annual Statistical Report on EU Alternative Investment Funds 2019 47
References
Acharya, V., Wachtel, P., Walter, I. (2009)
"International Alignment of Financial Sector
Regulation", in Restoring Financial Stability: How
to Repair a Failed System, Wiley & Sons.
Admati, A. R. and Pfleiderer, P. (2000), “Forcing
firms to talk: financial disclosure regulation and
externalities”, The Review of Financial Studies
13(3), 479-519.
Autorité des marchés financiers (2019), “First
results from AIFM reporting”.
De Larosière, J., Balcerowicz, L., Issing, O.,
Masera, R., Mc Carthy, C., Nyberg, L., Pérez, J.
and Ruding, O. (2009), The High‑Level Group on
Financial Supervision in the EU — Report.
Daníelsson, J., Taylor, A. and Zigrand, J. P.
(2005), ‘Highwaymen or heroes: should Hedge
Funds be regulated? A survey’, Journal of
Financial Stability 1(4), 522-543.
ESMA (2013), Final report — Guidelines on key
concepts of the AIFMD.
ESMA (2014), Final report — Guidelines on
reporting obligations under Articles 3(3)(d) and
24(1), (2) and (4) of the AIFMD.
Financial Services Authority (2009), The Turner
review — A regulatory response to the global
banking crisis.
FSB (2011), Progress in the implementation of
the G20 recommendations for strengthening
financial stability’ — Report of the Financial
Stability Board to G20 finance ministers and
central bank governors.
FSB (2015), Assessment methodologies for
identifying non-bank non-insurer global
systemically important financial institutions.
FSB (2017), Policy recommendations to address
structural vulnerabilities from asset management
activities’.
IOSCO (2009), Hedge Funds oversight — Final
report.
IOSCO (2017), Open-ended fund liquidity and
risk management — Good practices and issues
for consideration — Consultation report.
IOSCO (2018), Recommendations for liquidity
risk management for collective investment
schemes
Lehecka, G. and Ubl, E. (2015), Analyzing the
systemic risks of alternative investment funds
based on AIFMD reporting: a primer — OENB
financial stability report.

ESMA Annual Statistical Report on EU Alternative Investment Funds 2019 48
The structure of the EU and
US Hedge Funds industry As — in this edition — we take a first look at the EU AIF data sourced from AIFMD reporting systems,
it makes sense to compare the picture that emerges to other jurisdictions hosting substantial AIF
industries. One noteworthy and relevant comparison is with the US market, where HFs emerged as
early as the 1920s, and today comprise a vital part of the local investment universe. Our analysis shows
that risk indicators derived from EU and US sources provide a similar message. Leverage tends to be
concentrated in specific HF strategies, such as relative value or macro. HFs relying on derivatives have
a larger amount of unencumbered cash than other HFs. At the aggregate level, EU HFs have lower
funding leverage but their funding is more short term than that of US funds. EU and US HFs face limited
liquidity mismatch overall, with higher levels of liquidity for US funds.
Introduction
AIFMD data provide insights into HFs in the EU.
To put the trends into perspective, it is helpful to
look at other sources covering the HF sector.
Regulatory reports to non-EU NCAs, such as the
US SEC and surveys done by IOSCO in
particular, can be used to benchmark the analysis
based on AIFMD data in this report.
US regulatory data on Hedge
Funds — form PF
Since 2012, the SEC has been collecting data on
private funds through form PF. SEC-registered
investment advisers with at least USD 150mn in
regulatory assets under management are
required to report data on a regular basis by filling
in form PF. In particular, advisers with at least
USD 1.5bn in AuM attributable to HFs (‘large HF
advisers’) have to report quarterly. Large HF
advisers also need to provide additional
information for the HFs they manage with at least
USD 500mn in NAV (‘qualifying HFs’).
Most of the quantitative indicators reported for
HFs in form PF can be mapped with AIFMD data,
although in some cases the definitions used may
differ. One key difference relates to the treatment
of derivatives for the reporting of gross
exposures, in particular IRDs. In form PF, IRDs
are adjusted for duration and reported as 10-year
63 A 10-year bond equivalent measures the marginal impact on position value of a small change in interest rates and then expresses this impact in terms of the quantity of a current 10-year bond that would have the same sensitivity
bond equivalents, while in AIMFD the gross
notional value of IRDs is reported.63 Given that
most IRDs have a short duration64, gross
exposures to IRDs will be substantially larger
than in SEC data.
Size of the Hedge Fund sector
The HF sector is small in the EU compared to the
United States. The NAV of AIF HFs amounts to
around EUR 264 billion at the end of 2017,
compared to EUR 3,244bn for the SEC data
(ASR-AIF.106).65 This large difference can be
partly explained by the domicile of the fund
manager. In the SEC data, most of the HFs are
managed by an adviser located in the United
States (88.5% of the NAV for qualifying HFs),
while only 6.7% of the NAV is managed by an
adviser located in the EU (UK).
Using a comparable perimeter, the SEC and
AIFMD data are relatively close based on the
domicile of the manager: the SEC reports a NAV
of EUR 171bn for HFs managed by a UK
manager, against EUR 217bn in AIFMD data.
Data on domiciles of HFs point to similar patterns
in the United States and in the EU: most HFs are
domiciled in the Cayman Islands, and the Virgin
Islands and Bermuda both account for 7% of the
NAV (ASR-AIF.107).
to interest rates moves.
64 Around 80% of IRDs have a maturity below 5 years; see ESMA (2018).
65 See SEC (2018).

ESMA Annual Statistical Report on EU Alternative Investment Funds 2019 49
ASR-AIF.106 Size of HF sector
Small compared to US data
For the US and EU data, around one third of HFs
are domiciled in the domestic jurisdiction: 36% in
the United States for SEC data and 31% in the
EU for AIFMD data.
ASR-AIF.107 HF domiciles
Mainly in offshore centres
In terms of ownership, the main investors into
HFs are broadly the same in the United States
and in the EU. Professional investors such as
pension funds and other funds account for the
larger share of the NAV (ASR-AIF.108): 42% in
the United States and 52% in the EU. In the
United States, households (US and non-US
individuals) account for a larger share than in the
EU (14% against 5%).
ASR-AIF.108 HF investor types
Mainly institutional investors
Regarding HF strategies, the data from the SEC
and the AFIMD cannot be directly compared due
to different reporting of gross exposures to IRDs.
However, the main types of strategies are broadly
the same qualitatively speaking across the two
datasets, when IRD exposures are excluded for
EU AIFs (ASR-AIF.109). Equity strategies
account for a large share of the exposures (34%
for the United States and 33% for the EU), along
with macro strategies (14% in the US and 40% in
the EU). Event-driven and credit strategies are
smaller, with less than 10% of exposures in both
cases. Data for relative value and CTA strategies
paint a different picture: they account for
respectively 15% and 3% in the United States
against 4% and 12% for EU AIFs.
ASR-AIF.109 HF strategies
Dominated by equity strategies
The regional investment focus of HFs is
qualitatively similar in the United States and in the
EU, although data are based on gross exposures
in the United States and NAVs in the EU. North
America is the main regional exposure, followed
by the EEA, with other regions being relatively
marginal.
264
2,551
3,244
0
900
1,800
2,700
3,600
AIFMD US QHF US HF
Note: N et Asset Val ue of hedge funds, i n EUR bn, end of 2017. QF r efers to'qualifying hedge funds', i.e. with NAV>USD 500Mn and m anaged by lar gehedge fund advisers. USD converted into EUR using end-of-year exchange rate.
Sources: AIFMD database, National Competent Authorities, SEC, ESMA
51
36
5 3 2 2 2
58
2 3
137
4
12
0
18
36
54
72
KY US VI IE LU BM Rest
SEC AIFMD
Note: Share of Net Asset Value of hedge funds by domicile, in %, end of 2017.Data for qualifying hedge funds for the US. KY=Cayman Islands, VI=VirginIslands and BM=Bermuda.
Sources:AIFMD database, National Competent Authorities, SEC, ESMA
17%
37%
25%
15%
7%
14% 13% 6%
14… 27%
0% 25% 50% 75% 100%
US
EU
Funds Pension funds Non profit
OFI Banks Households
Gov. Insurance OthersNote: Ownershi p in % of NAV by inves tor types. Qualifying hedge funds data for theUS.Sources: AIFMD database, National Competent Authorities, SEC, ESMA.
0%
12%
24%
36%
48%
Equity Other RV Macro Event Credit CTA
US EU (net of IRDs)
Note: Gross exposures by s trategy, in %, end of 2017. US data for qualifyinghedge funds. F or EU, gross exposur es excluding interest rate derivatives .RV=Relative Value.
Sources:AIFMD database, National Competent Authorities, SEC, ESMA

ESMA Annual Statistical Report on EU Alternative Investment Funds 2019 50
ASR-AIF.110 Regional investment focus
Mainly North America and the EEA
Leverage and liquidity risks
HFs have similar types of exposures according to
SEC and AIFMD data. Excluding IRDs, securities
account for the largest share of exposures at
around 50% of the NAV, while FX derivatives and
CDS account for around 40% of NAV (ASR-
AIF.111). Cash exposures are also similar: 22%
of the NAV in the United States and 24 % in the
EU.
ASR-AIF.111 Gross exposures
Broadly similar
However, data on unencumbered cash by
strategy can be quite different across the two
datasets (AIF-S.112). Yet, in both cases,
strategies with the highest levels of leverage tend
to have a higher amount of unencumbered cash,
possibly to meet future margin calls.
ASR-AIF.112 Unencumbered cash
Heterogeneity
The use of leverage by HFs is qualitatively similar
in the two datasets. To proxy leverage for EU
AIFs, we exclude IRDs for their gross exposures.
Overall, the use of leverage by HF strategies is
comparable: relative value and macro are the
most leveraged funds, followed by CTA and multi
strategy (ASR-AIF.113). However, levels can be
quite different, with EU relative value funds
reporting very high levels of leverage compared
to similar strategies in the United States.
ASR-AIF.113 HF leverage
Qualitatively similar
US and EU HFs have similar levels of leverage:
total borrowing amounts to 80% of the NAV in
both cases, with differences in composition
(ASR-AIF.114). In the United States, most of the
funding comes from prime brokers, while in the
EU repo markets play a larger role.
63%
46%
23%
34%
9%
9%
0% 20% 40% 60% 80% 100%
US
EU
NA EEA Asia Other europe Supranational Others
Note: Regi onal exposures in % of NAV for EU and in % of gr oss exposures for theUS. Data for large fund advisers for the US.Sources: AIFMD database, National Competent Authorities, SEC, ESMA.
46%
51%
26%
15%
17%
24%
6%
7%
0% 20% 40% 60% 80% 100%
US
EU
Securi ties FX Other derivatives CDS Cash
Note: Gross exposures excl uding interest rate derivatives , and excl uding CIU andphysical assets for EU AIFs.Sources: AIFMD Database, National Competent Authorities, SEC, ESMA.
58%
39%
25% 21% 20%
10%
98% 97%
39%
20%
33%
15%
54%
18%
52%
17%
0%
30%
60%
90%
120%
CTA Macro Multi Other RV Equity Credit Event
US EU
Note: Unencumbered cash in % of NAV (EU) and in % of assets (US)..Sources:AIFMD database, National Competent Authorities, SEC, ESMA
0%
1200%
2400%
3600%
4800%
RV Macro Multi CTA Credit Equity
US EU
Note: Leverage defined as gr oss exposures/NAV, in %, end of 2017. U S data forqualifying hedge funds . For EU, gross exposures excludi ng inter est rate derivatives.RV=Relative value, CTA=Commodity trading advisor.
Sources:AIFMD database, National Competent Authorities, SEC, ESMA

ESMA Annual Statistical Report on EU Alternative Investment Funds 2019 51
ASR-AIF.114 HF borrowings
More reliance on repo markets in the EU
In terms of financing, AIF HFs tend to rely more
on short-term borrowing than in the United
States: around 60% of financing is within a week
against 50% for the United States and
respectively 86% and 65% within a month
(ASR-AIF.115).
ASR-AIF.115 Liquidity financing
High portion of short-term funding
At the aggregate level, the HF liquidity profile
points to very little liquidity mismatch in the United
States and the EU. In both jurisdictions, the
portfolio liquidity is higher than the investor
liquidity.66 For the United States, investors can
redeem up to 15% of the NAV within a week,
while 63% of assets can be liquidated within that
time frame, resulting in ‘excess liquidity’ of 48%
(ASR-AIF.116). In the EU, investors can redeem
up to 33% of the NAV within a week and 51% of
assets can be sold.
Most of the information derived from the risk
metrics presented is in line with other sources of
information. The IOSCO 2017 Hedge Fund
survey, mainly based on SEC data, provides
similar findings regarding leverage and liquidity
risk (IOSCO (2017)). Similarly, older Hedge Fund
surveys published by the UK FCA provide similar
assessments (see FCA (2015)).
66 For further details on US HFs see Aragon et al. (2017).
ASR-AIF.116 Liquidity profile
No liquidity mismatch
Conclusion
AIFMD reporting obligations provide a large
dataset that can be compared to other sources,
such as SEC form PF. Our analysis shows that
risk indicators derived from both sources provide
the same message. Leverage tends to be
concentrated in specific HF strategies, such as
relative value or macro. HFs relying on
derivatives have a larger amount of
unencumbered cash than other HFs. At the
aggregate level, EU HFs have lower funding
leverage, but their funding is more short term than
US funds. EU and US HFs face limited liquidity
mismatch overall, with higher levels of liquidity for
US funds.
References
Aragon, G., Ergun, T., Getmansky, M. and
Girardi, G. (2017), Hedge Funds: portfolio,
investor and financing liquidity, SEC White
Paper.
ESMA (2018), ESMA annual statistical report —
EU derivatives markets — 2018.
FCA (2015), Hedge Fund survey — June 2015.
IOSCO (2017), Report on the fourth IOSCO
Hedge Funds survey — Final report.
SEC (2018), Private fund statistics — Fourth
calendar quarter 2017, available at
https://www.sec.gov/divisions/investment/private
-funds-statistics.shtml
45%
13%
22%
62%
12% 3%
0%
25%
50%
75%
100%
US EU
Prime Brokers Reverse repo Other secured Unsecured
Note: Borrowing by type of funding, in NAV. Qualifying hedge funds for the US.Sources: AIFMD database, National Competent Authorities, SEC, ESMA.
34%50%
65%
80%
97%
30%
59%
86%95% 97%
97%
0%
25%
50%
75%
100%
1 day 2-7d 8-30d 31-90d 91-180d 181-365d
US EU
Note: Financing liquidity for AIF hedge funds and US Qualifying hedge funds, in %of available financing.Sources:AIFMD database, National Competent Authorities, SEC, ESMA
30%
48%
32%
26%
16%24%
18%
40%
30%
10%4%
0%
15%
30%
45%
60%
1 day 2-7d 8-30d 31-90d 91-180d 181-365d
US EU
Note: DIfference between portfolio and investor liquidity, in % of NAV..Sources:AIFMD database, National Competent Authorities, SEC, ESMA
ESMA Annual Statistical Report on EU Alternative Investment Funds 2019 52
Statistical annex

ESMA Annual Statistical Report on EU Alternative Investment Funds 2019 53
Market overview
AIF characteristics
ASR-AIF-S.1 ASR-AIF-S.2 AIFMD passport EU and non-EU AIFs
ASR-AIF-S.3 ASR-AIF-S.4 AIF distribution by size AIF types
ASR-AIF-S.5 ASR-AIF-S.6 AIF strategies Investment regions
ASR-AIF-S.7 ASR-AIF-S.8 Base currencies Clients
EU passport76%
EU w /o passport17%
Non-EU w /o passport3%
Non-EU not marketed in EU 4%
Note: NAV of AIFs by manager's access to AIFMD passport, end of 2017, in %.Authorised EU AIFMs with access to AIFMD passport or marketing non-EU AIFs w/opassport, sub-threshold managers registered only in nati onal juridisdicti ons w/o
passporting rights. Data for 24 EEA countries.Sources: AIFMD database, National Competent Authorities, ESMA.
0%
25%
50%
75%
100%
FoF Hedge
fund
Private
equity
Real
estate
Other None
EU Non-EUNote: Share of EU and non-EU AIFs managed and/or marketed by authorised EUAIFMs and sub-threshold managers registered only i n nati onal jurisdictions, end of2017, in % on NAV. Non-EU AIFs marketed w/o passport. D ata for 24 EEA
countries.Sources: AIFMD database, National competent Authorities, ESMA.
0%
25%
50%
75%
100%
<100mn 100-500mn 500mn-1bn 1-5bn >5bn
NAV Number of AIFs
Note: Share of AIFs by size, end of 2017, in %. AIFs managed and/or marketed byauthorised EU AIFMs and sub-threshold managers register ed only in nati onaljurisdictions. Data for 24 EEA countries.
Sources: AIFMD database, National Competent Authorities, ESMA.
FoF16%
Hedge fund5%
Priv ate equity4%
Real estate11%
Other63%
None1%
Note: NAV by type of AIFs managed and/or m arketed by authorised EU AIFMs andsub-threshol d managers registered only i n nati onal jurisdictions, end of 2017, in %.FoF=Fund of Funds, None=No predominant type. Data for 24 EEA countries.
Sources: AIFMD database, National Competent Authorities, ESMA.
Commercial RE 7%
Equity18%
Fixed income 27%
Other FoF13%
Other PE2%
Other RE2%
Other-other17%
All remaining strategies
14%
Note: Investm ent s trategy of AIFs managed and/or marketed by authorised EUAIFMs and sub-threshold managers registered only in national j urisdictions , end of2017, in % of NAV. FoF=Fund of funds, PE=Private equity funds, RE=Real estate.
Data for 24 EEA countries.Sources: AIFMD database, National Competent Authorities, ESMA.
Asia6%
EEA60%
North America
16%
Other Europe
5%
Supra National
9%
Rest4%
Note: Regi onal investment focus of AIFs managed and/or marketed by authorisedEU AIFMs and sub-threshold managers registered only in national jurisdictions ,end of 2017, in % of NAV. Geo-focus determined according to the domicile of
investments, supr a nati onal category includi ng inves tments without pr edominantgeo-focus. Data for 24 EEA countries.Sources: AIFMD database, National Competent Authorities, ESMA.
0% 20% 40% 60% 80% 100%
CHF
NOK
PLN
JPY
SEK
GBP
USD
EUR
Note: Base currency managed and/or marketed by authorised EU AIFMs andsub-threshol d managers registered only in national jurisdictions, end of 2017, in% of NAV. Sources : AIFMD database, National Com petent Authorities, ESMA.
Data for 24 EEA countries.Sources: AIFMD database, National Competent Authorities, ESMA.
0% 20% 40% 60% 80% 100%
FoF
Hedge fund
Private equity
Real estate
Other AIF
Total EU
Retail investors Professional investors
Note: Clients of AIFs managed and/or marketed by authorised EU AIFMs and sub-threshold managers registered only in national jurisdictions, end of 2017, in % ofNAV. FoF=Fund of funds. Data for 24 EEA countries.
Sources: AIFMD database, National Competent Authorities, ESMA.

ESMA Annual Statistical Report on EU Alternative Investment Funds 2019 54
Liquidity and counterparty risk profile
ASR-AIF-S.9 ASR-AIF-S.10 Ownership of AIF Top 5 beneficial owners
ASR-AIF-S.11 ASR-AIF-S.12 FoFs: liquidity profile HFs: liquidity profile
ASR-AIF-S.13 ASR-AIF-S.14 PE funds: liquidity profile RE funds: liquidity profile
ASR-AIF-S.15 ASR-AIF-S.16 Funds classified as ‘Other’: liquidity profile Redemption frequencies
0% 20% 40% 60% 80% 100%
None
Other AIF
Real estate
Private equity
Hedge fund
FoF
Total EU
Banks General gov. HouseholdsInsurances Non-profit NoneOth. CIU Oth. fin. institu tions Pension fundsUnknown
Note: Ownershi p of units in AIFs managed and/or marketed by authorised EUAIFMs, end of 2017, in % of NAV. F oF=Fund of funds; None=No predominant type.Data for 24 EEA countries.
Sources: AIFMD database, National Competent Authorities, ESMA.
0%
25%
50%
75%
100%
FoF Hedge fund Private
equity
Real estate Other
AIF
EU passport EU w/o passport Non-EU w/o passport
Note: Inves tor concentration of AIFs managed and/or marketed by authorised EUAIFMs, end of 2017, in % of NAV. Investor concentrati on computed as share of AIFequity beneficially owned by the 5 largest investors. Data for 24 EEA countries.
Sources: AIFMD database, National Competent Authorities, ESMA.
44%
73%81% 84%
87% 89%100%
35%
66% 77% 82%89%
91%
0%
25%
50%
75%
100%
1 day orless
2-7 d 8-30 d 31-90 d 91-180 d 181-365d
> 365 d
Investor PortfolioNote: Portfolio and i nvestor liquidi ty profil es of funds of funds managed and/ormarketed by authorised EU AIFMs, end of 2017. Portfolio profile determined bypercentage of the funds’ portfoli os capable of being liqui dated within each specifi ed
period, investor liquidity profile depend on shortest period within each fund could bewithdrawn or investors could r eceive redemption payments. d=Days. Data for 24EEA countries.Sources: AIFMD database, National Competent Authorities, ESMA.
5%
33%43%
69%
90% 96%
100%
29%
51%
83%99% 100% 100%
0%
25%
50%
75%
100%
1 day orless
2-7 d 8-30 d 31-90 d 91-180 d 181-365d
> 365 d
Investor Por tfolioNote: Portfoli o and investor liqui dity profiles of hedge funds managed and/ormarketed by authorised EU AIFMs, end of 2017. Portfolio profile determined bypercentage of the funds’ portfoli os capable of being liqui dated within each specifi ed
period, investor liquidity profile depend on shortest period within each fund could bewithdrawn or investors could r eceive redemption payments. d=Days. Data for 24EEA countries.Sources: AIFMD database, National Competent Authorities, ESMA.
3% 4% 4% 5%7%
100%
11%15%
0%
25%
50%
75%
100%
1 day orless
2-7 d 8-30 d 31-90 d 91-180 d 181-365d
> 365 d
Investor Por tfolioNote: Portfolio and i nvestor liqui dity profiles of private equi ty funds managed and/ormarketed by authorised EU AIFMs, end of 2017. Portfolio profile determined bypercentage of the funds’ portfolios capable of being liquidated within each specified
period, investor liquidity profile depend on shortest period within each fund could bewithdrawn or i nvestors could receive redempti on payments . d=Days. Data for 24EEA countries.Sources: AIFMD database, National Competent Authorities, ESMA.
13%20% 24% 28%
36%
48%
100%
7% 8% 9% 17%
36%
51%
0%
25%
50%
75%
100%
1 day orless
2-7 d 8-30 d 31-90 d 91-180 d 181-365d
> 365 d
Investor Por tfolioNote: Portfolio and i nvestor liquidity profiles of real es tate funds m anaged and/ormarketed by authrosed EU AIFMs, end of 2017. Portfolio profile determined bypercentage of the funds’ portfolios capable of being liquidated withi n each specifi ed
period, investor liquidity profile depend on shortest period within each fund coul d bewithdrawn or inves tors coul d receive redemption paym ents. d=Days. Data for 24EEA countries.Sources: AIFMD database, National Competent Authorities, ESMA.
45%
80%86% 89% 92%
93%
100%
41%
77%
89% 92% 94% 95%
0%
25%
50%
75%
100%
1 day orless
2-7 d 8-30 d 31-90 d 91-180 d 181-365d
> 365 d
Investor Por tfolioNote: Portfolio and investor liquidity profiles of AIFs cl assified as Other managedand/or marketed by authorised EU AIFMs, end of 2017. Port folio profile determinedby percentage of the funds’ portfolios capabl e of bei ng liquidated within each
specified period, inves tor liqui dity profile depend on shortest period withi n each fundcould be withdrawn or i nvestors could receive redempti on paym ents. d=Days . Datafor 24 EEA countries.Sources: AIFMD database, National Competent Authorities, ESMA.
0%
25%
50%
75%
100%
Tota l
EUFoF Hedge
fundPrivate
equityReal
estateOther
AIFNone
Daily Weekly
to monthly
Quarterly Quarterly
to yearly
Other
Note: Inves tor redempti on frequenci es all owed by open-end AIFs managedand/or marketed by authorised EU AIFMs, end of 2017, in % of NAV. EU andnon-EU AIFs by authorised EU AIFMs m arketed, r espec tively, w/ and w/o
passport. FoF=Fund of Funds, N one=No Predominant Type. Data for 24 EEAcountries.Sources: AIFMD database, National Competent Authorities, ESMA.

ESMA Annual Statistical Report on EU Alternative Investment Funds 2019 55
ASR-AIF-S.17 ASR-AIF-S.18 Redemption rights to investors Liquidity financing
ASR-AIF-S.19 ASR-AIF-S.20 Securities trading Derivatives trading
ASR-AIF-S.21 ASR-AIF-S.22 Repo trades clearing Derivative transactions clearing
Leverage and exposure
ASR-AIF-S.23 ASR-AIF-S.24 AuM/NAV Adjusted gross leverage
0%
25%
50%
75%
100%
Total EU FoF Hedge
fundPrivate
equityReal
estateOther
AIFNone
Open-end Closed-end
Note: Redempti on rights provi ded in the or dinary course to inves tors in AIFsmanaged and/or marketed by authorised EU AIFMs, end of 2017, i n % of NAV.FoF=Fund of funds, None=No predominant type. Data for 24 EEA countries.
Sources: AIFMD database, National Competent Authorities, ESMA.
2%
38%42%
79%100%
30%
86%100%
9%
57%
76%
100%
48%
100%
4%
100%
0%
25%
50%
75%
100%
1 day 2-7 d 8-30 d 31-90 d 91-180 d 181-365
d
> 365 d
FoF Hedge fund Other AIFNone Real estate
Note: Li quidity financi ng of AIFs managed and/or marketed by authorised EUAIFMs, end of 2017. Aggr egate amount of borrowing and cash financing divideddepending on longest period for which creditors are contractually committed to
provide such financing, Borrowing and cash fi nancing incl ude drawn and undraw n,committed and uncommitted lines of cr edit as well as any term financing. FoF=Fundof funds, None=No Predominant type. Data for 24 EEA countries.Sources: AIFMD database, National Competent Authorities, ESMA.
0% 20% 40% 60% 80% 100%
None
Other AIF
Real estate
Private equity
Hedge fund
FoF
Tot. EU
Regulated market OTCNote: Estimated market val ue of securities traded on OTC and regul ated exchangemarkets by AIFs managed and/or marketed by authorised EU AIFMs, in %.FoF=Fund of funds, None=No predominant type. Data for 24 EEA countries.
Sources: AIFMD database, National Competent Authorities, ESMA.
0% 20% 40% 60% 80% 100%
None
Other AIF
Real estate
Private equity
Hedge fund
FoF
Tot. EU
Regulated market OTC
Note: Estimated vol ume of derivatives traded on OTC and regul ated market byAIFs managed and/or marketed by authorised EU AIFMs, in %. FoF=Fund offunds, None=No predominant type. Data for 24 EEA countries.
Sources: AIFMD database, National Competent Authorities, ESMA.
0% 20% 40% 60% 80% 100%
None
Other AIF
Real estate
Private equity
Hedge fund
FoF
Tot. EU
CCP Tri-par ty BilateralNote: Estimated market value of repo trades cleared by AIFs managed and/ormarketed by authorised EU AIFMs, i n % FoF=Fund of funds, None=No pr edominanttype.Data for 24 EEA countries.
Sources: AIFMD database, National Competent Authorities, ESMA.
0% 20% 40% 60% 80% 100%
None
Other AIF
Real estate
Private equity
Hedge fund
FoF
Tot. EU
CCP BilateralNote: Es timated volume of derivatives cleared bilaterally and via CCP by AIFsmanaged and/or marketed by authorised EU AIFMs, in %. FoF=Fund of funds,None=No predominant type. Data for 24 EEA countries.
Sources: AIFMD database, National Competent Authorities, ESMA.
0%
1500%
3000%
4500%
FoF Hedge
fund
Private
equity
Real
estate
Other AIF None
Leverage (AuM/NAV)
Note: Leverage of AIFs managed and/or marketed by authorised EU AIFMs andsub-threshol d managers registered only in nati onal jurisdictions, end of 2017, in %of NAV. Leverage computed as AuM/NAV ratio. FoF=Fund of funds, None=No
predominant type. Data for 24 EEA countries.Sources: AIFMD database, National competent authorities, ESMA.
0%
1200%
2400%
3600%
4800%
0%
200%
400%
600%
800%
FoF Hedge
fund
Private
equity
Real
estate
Other
AIF
None
Adjusted gross leverage AuM/NAV (rhs)
Note: Adj usted gross l everage of AIFs managed and/or marketed by authorised EUAIFMs, end of 2017, in % of NAV. Adjusted gross leverage does not include IRDs.FoF= Fund of funds, None=No predominant type. Data for 24 EEA countries.
Sources: AIFMD database, National competent authorities, ESMA.

ESMA Annual Statistical Report on EU Alternative Investment Funds 2019 56
ASR-AIF-S.25 ASR-AIF-S.26 Borrowing embedded in financial instruments Unencumbered cash
ASR-AIF-S.27 ASR-AIF-S.28 Financial leverage Decomposition of exposures
ASR-AIF-S.29 ASR-AIF-S.30 Total exposures Corporate bond quality
ASR-AIF-S.31 ASR-AIF-S.32 Cash and cash equivalents Cash and cash equivalents by AIF type
0%
25%
50%
75%
100%
FoF Hedge
fund
Private
equity
Real
estate
Other AIF None
Cash and securities OTC derivatives Exchange-traded derivatives
Note: Borrowing of cash and securities or embedded in derivatives, end of 2017, in% of total exposure. AIFs managed and/or marketed by authorised EU AIFMs. OTCand exchange-traded deriatives net of margi ns. F oF=Fund of funds, None=No
predominant type. Data for 24 EEA countries.Sources: AIFMD database, National Competent Authorities, ESMA.
0%
7%
13%
20%
26%
Tota l EU FoF Hedge
fundPrivate
equityReal
estateOther
AIFNone
Unencumbered cash
Note: Unencumbered cash, end of 2017, in % of NAV. EU and non-EU AIFs byauthorised EU AIFMs marketed, r espec tively, w/ and w/o passport. F oF=Fund offunds, None=No predominant type. Data for 24 EEA countries.
Sources: AIFMD database, National Competent Authorities, ESMA.
0%
1%
2%
4%
5%
Unsecured
borrowing
Secured via
PB
Reverse
repo
Secured via
other
Securi ties
borrowed
for shor ting
Note: Cash and securities borrowed, end of 2017, i n % of NAV. EU and non-EUAIFs by authorised EU AIFMs marketed, respectively, w/ and w/o passport.FoF=Funds of Funds, None=No predominant type. Data for 24 EEA countries.
Sources: AIFMD databse, National Competent Authorities, ESMA.
0%
25%
50%
75%
100%
Tota l EU FoF Hedge
fund
Private
equity
Real
estate
Other
AIF
None
Securi ties CIUs Physical assetsIRDs FX CDSOther derivatives
Note: Share of gross exposures by AIF type, end of 2017, in % of total. AIFsmanaged and/or marketed by authorised EU AIFMs. FoF=Fund of funds, None=Nopredominant type. Data for 24 EEA countries.
Sources: AIFMD database, National Competent Authorities, ESMA.
0
4
8
12
16
3Q17 4Q17 4Q17 (including UK)
FoF Hedge fund Private equity Real estate Other AIF None
Note: Exposures of AIFs managed and/or marketed by authorised EU AIFMs,funds quarterly reported, EUR tn. EU and non-EU AIFs by authorised EU AIFMsmarketed, respectively, w/ and w/o passport. FoF=Fund of funds, None=No
predominant type. Data for 24 EEA countries; UK data available only in 4Q17.Sources: AIFMD database, National Competent Authorities, ESMA.
0%
20%
40%
60%
80%
100%
3Q17 4Q17 4Q17
(including UK)IG by fin. inst. IG by non-fin. inst.Non-IG by fin. inst. Non-IG by non-fin. inst.
Note: C orporate bonds exposure, funds reported quarterly, in % of NAV. AIFsmanaged and/or marketed by authorised EU AIFMs. Data for 24 EEA countries ; UKdata available only in 4Q17.
Sources: AIFMD database, National Competent Authorities, ESMA.
0%
5%
10%
15%
3Q17 4Q17 4Q17
(including UK)
Hu
nd
red
s
Certificates of deposit Commercial papers
Other cash equivalent Other deposits
Note: Cash and cash equival ents exposure, funds reported quarterly, in % of NAV.Government bonds excluded from other cash equivalents. Data for 24 EEAcountries; UK data available only in 4Q17.
Sources: AIFMD databse, National Competent Authorities, ESMA.
0%
30%
60%
90%
120%
3Q17 4Q17 4Q17
(including UK)
Hu
nd
red
s
FoF Hedge fund Private equity Real estate Other AIFs
Note: C ash and cash equivalents exposure by AIF type, funds quarterly reported, in% of NAV. D ata for 24 EEA countries; UK data available only in 4Q17. F oF=Fundsof funds.
Sources: AIFMD database, National Competent Authorities, ESMA.

ESMA Annual Statistical Report on EU Alternative Investment Funds 2019 57
ASR-AIF-S.33 ASR-AIF-S.34 Equities Equities by AIF type
ASR-AIF-S.35 ASR-AIF-S.36 Sovereign bonds Sovereign bonds by AIF type
ASR-AIF-S.37 ASR-AIF-S.38 CIUs CIUs by AIF type
ASR-AIF-S.39 ASR-AIF-S.40 Structured products Structured products by AIF type
0%
5%
10%
15%
20%
25%
3Q17 4Q17 4Q17
(including UK)
Hu
nd
red
s
Listed financial inst. Other listed UnlistedNote: Exposure to equiti es, funds quarterly reported, in % of NAV. AIFs managedand/or marketed by authorised EU AIFMs. Data for 24 EEA countries; UK dataavailable only in 4Q17.
Sources: AIFMD database, National Competent Authorities, ESMA.
0%
20%
40%
60%
80%
3Q17 4Q17 4Q17 (including UK)
Hu
nd
red
s
FoF Hedge fund Private equity Real estate Other AIFsNote: Equiti es exposure by AIF type, funds quarterly reported, i n % of NAV. AIFsmanaged and/or marketed by authorised EU AIFMs. Data for 24 EEA countries; UKdata available only in 4Q17. FoF=Funds of Funds.
Sources: AIFMD database, National Competent Authorities, ESMA.
0%
7%
14%
21%
3Q17 4Q17 4Q17
(includ ing UK)
Hu
nd
red
s
EU Sov >1Y TM EU Sov up 1Y TMG10 Sov >1Y TM G10 Sov up 1Y TMNon-G10 Sov >1Y TM Non-G10 Sov up 1Y TM
Note: Sovereign bonds exposure, funds reported quarterly, i n % of NAV. AIFsmanaged and/or marketed by authorised EU AIFMs. Sov=Sovereign bonds,TM=Time to Maturity. Data for 24 EEA countries; UK data available only in 4Q17.
Sources: AIFMD database, National Competent Authorities, ESMA.
0%
30%
60%
90%
120%
3Q17 4Q17 4Q17
(including UK)
Hu
nd
red
s
FoF Hedge fund Private equity Real estate Other AIFs
Note: Soverei gn bonds exposure by AIF type, funds reported quarterly, in % ofNAV. AIFs m anaged and/or marketed by authorised EU AIFMs. F oF=Funds ofFunds. Data for 24 EEA countries; UK data available only in 4Q17.
Sources: AIFMD database, National Competent Authorities, ESMA.
0%
7%
14%
21%
28%
3Q17 4Q17 4Q17
(including UK)
Hu
nd
red
s
CIUs by the AIFM CIUs by others ETF by the AIFM
ETF by others MMFs by the AIFM MMFs by othersNote: C ollective i nvestm ent undertakings exposure, funds reported quaterly, in % ofNAV. AIFs managed and/or m arketed by authorised EU AIFMs. CIUs=CollectiveInvestment Undertaki ngs. Data for 24 EEA countries ; UK data availabl e only in
4Q17.Sources: AIFMD database, National Competent Authorities, ESMA.
0%
25%
50%
75%
100%
3Q17 4Q17 4Q17
(includ ing UK)
Hu
nd
red
s
FoF Hedge fund Private equity Real estate Other AIFs
Note: C ollective investm ent undertakings exposur e by AIF type, funds reportedquarterly, in % of NAV. AIFs managed and/or marketed by authorised EU AIFMs.FoF=Funds of Funds. Data for 24 EEA countries; UK data available only in 4Q17.
Sources: AIFMD database, National Competent Authorities, ESMA.
0.0%
0.6%
1.2%
1.8%
2.4%
3.0%
3Q17 4Q17 4Q17
(including UK)
Hu
nd
red
s
ABCP ABS Agency MBSCDO/CLO CMBS ETPOther RMBS Structured cer tificate
Note: Structured products exposur e, funds reported quarterly, in % of NAV. AIFsmanaged and/or marketed by authorised EU AIFMs. Data for 24 EEA countries; UKdata available only in 4Q17.
Sources: AIFMD database, National Competent Authorities, ESMA.
0%
4%
8%
12%
3Q17 4Q17 4Q17
(including UK)
Hu
nd
red
s
FoF Hedge fund Private equity Real estate Other AIFs
Note: Structured products exposure by AIF type, funds reported quarterly, in % ofNAV. AIFs managed and/or marketed by authorised EU AIFMs. FoF=Funds offunds. Data for 24 EEA countries; UK data available only in 4Q17.
Sources: AIFMD database, National Competent Authorities, ESMA.

ESMA Annual Statistical Report on EU Alternative Investment Funds 2019 58
Funds of Funds
AIF characteristics
ASR-AIF-S.41 ASR-AIF-S.42 AIFMD passport EU and non-EU AIFs
ASR-AIF-S.43 ASR-AIF-S.44 AIF distribution by size Investment strategies by NAV
ASR-AIF-S.45 ASR-AIF-S.46 Investment regions by NAV Investor type
EU passport76%
EU w /o passport17%
Non-EU w /o passport3%
Non-EU not marketed in EU 4%
Note: NAV of funds of funds by manager's access to AIFMD passport, end of 2017,in %. Authorised EU AIFMs with access to AIFMD passport or m arketing non-EUAIFs w/o passport, sub-threshold managers are registered only i n national
juridisdictions w/o passporting rights. Data for 24 EEA countries.Sources: AIFMD database, National Competent Authorities, ESMA.
0%
25%
50%
75%
100%
Fund of HF Fund of PE Other FoF
EU Non-EUNote: Share of EU and non-EU funds of funds managed and/or marketed byauthorised EU AIFMs and sub-threshold managers registered only in nationaljurisdictions, end of 2017, in % of NAV. Non-EU AIFs marketed w/o passport.
FoF=Fund of funds, PE=Private equi ty fund, HF=Hedge fund. D ata for 24 EEAcountries.Sources: AIFMD database, National competent Authorities, ESMA.
0
25
50
75
100
top 10 top 20 top 50 top 100 top 500 top 1,000
Market concentration
Note: Market concentrati on of the largest 10-to-1,000 funds of funds managedand/or marketed by authorised EU AIFMs and sub-threshold managers register edonly in national jurisdictions, end of 2017, in % of NAV. Data for 24 EEA countries.
Sources: AIFMD databse, National Competent Authorities, ESMA.
Fund of HF9%
Fund of PE8%
Other FoF83%
Note: Investment strategies of funds of funds, end of 2017, in % of NAV. Funds offunds managed and/or marketed by authorised EU AIFMs and sub-thresholdmanagers registered only in national jurisdictions. FoF=Fund of funds, PE=Private
equity fund, HF=Hedge fund. Data for 24 EEA countries.Sources: AIFMD databaseNational Competent Authorities, ESMA.
Asia2%
EEA57%
Other Europe4%
North America
8%
Supra National
27%
Rest2%
Note: R egional investment focus of funds of funds managed and/or marketed byauthorised EU AIFMs and sub-threshold managers registered only i n nationaljurisdictions, end of 2017, in % of NAV. Geo-focus determined according to the
domicile of inves tments and the supranational category including investm entswithout a predominant geo-focus. Data for 24 EEA countries.Sources: AIFMD database, National Competent Authorities, ESMA.
0% 20% 40% 60% 80% 100%
Other FoF
Fund of HF
Fund of
PE
Retail investors Professional investors
Note: Clients of funds of funds managed and/or marketed by authorised EU AIFMsand sub-threshold managers registered only in nati onal jurisdictionsat, end of 2017,in % of NAV. F oF=Fund of funds, PE= Private equity fund, HF=Hedge fund. D ata for
24 EEA countries.Sources: AIFMD database, National Competent Authorities, ESMA.

ESMA Annual Statistical Report on EU Alternative Investment Funds 2019 59
Liquidity and counterparty risk profile
ASR-AIF-S.47 ASR-AIF-S.48 Ownership of AIFs Top five beneficial owners
ASR-AIF-S.49 ASR-AIF-S.50 Funds of HFs: liquidity profile Funds of PE funds: liquidity profile
ASR-AIF-S.51 ASR-AIF-S.52 FoFs: liquidity profile Redemption frequencies
ASR-AIF-S.53 ASR-AIF-S.54 Redemption rights to investors Liquidity financing
0% 20% 40% 60% 80% 100%
Other FoF
Fund of PE
Fund of HF
Banks General government HouseholdInsurances Non-profit NoneOther CIUs Oth. fin. institu tions Pension fundsUnknown
Note: Ownershi p of units in funds of funds managed and/or marketed by authorisedEU AIFMs, end of 2017, in % of N AV. FoF=Fund of funds ; PE=Private equity fund,HF=Hedge fund. Data for 24 EEA countries.
Sources: AIFMD database, National Competent Authorities, ESMA.
0%
25%
50%
75%
100%
Fund of HF Fund of PEQF Other FoF
EU passport EU w/o passport Non-EU w/o passport
Note: Investor concentration of funds of funds managed and/or marketed byauthorised EU AIFMs, end of 2017, i n % of NAV. Inves tor concentrati on computedas share of AIF equity beneficially ow ned by the 5 largest investors. FoF=Fund of
Funds, PEQF=Private Equity Fund, HF=Hedge Fund.Data for 24 EEA countries.Sources: AIFMD database, National Competent Authorities, ESMA.
7%11%
29%
60%
83%
95%
4%
11%
35%
67%
89%
93%
100%
0%
25%
50%
75%
100%
1 day or
less
2-7 d 8-30 d 31-90 d 91-180 d 181-365
d
> 365 d
Investor Por tfolioNote: Portfolio and investor liquidity profiles of funds of hedge funds managedand/or marketed by authorised EU AIFMs, end of 2017. Port folio profil e determinedby percentage of the funds’ portfoli os capable of being liquidated within each
specified period, investor liquidity profile depend on shortest period withi n each fundcould be withdrawn or investors could receive redempti on payments . d= D ays. D atafor 24 EEA countries.Sources: AIFMD database, National Competent Authorities, ESMA.
3% 4%10%4% 5% 6% 8%
25% 26%
100%
0%
25%
50%
75%
100%
1 day or
less
2-7 d 8-30 d 31-90 d 91-180 d 181-365
d
> 365 d
Investor Portfolio
Note: Portfolio and i nvestor liqui dity profiles of funds of private equity fundsmanaged and/or marketed by authorised EU AIFMs, end of 2017. Portfolio profiledetermined by percentage of the funds’ portfolios capable of being liquidated withi n
each specifi ed period, inves tor liqui dity profile depend on shortest period withi neach fund coul d be withdrawn or inves tors coul d receive redempti on payments. d=Days. Data for 24 EEA countries.Sources: AIFMD database, National Competent Authorities, ESMA.
49%
83%
91%92%
93% 95%
41%
77%86% 89%
94% 96% 100%
0%
25%
50%
75%
100%
1 day or
less
2-7 d 8-30 d 31-90 d 91-180 d 181-365
d
> 365 d
Investor Portfolio
Note: Portfolio and investor liquidity profiles of funds of funds pursui ng s trategiesclassified as "other" managed and/or marketed by authorised EU AIFMs, end of2017. Portfolio profile determined by percentage of the funds’ portfolios capabl e of
being liquidated within each specified period, inves tor liquidity profile depend onshortest period withi n each fund could be withdrawn or investors could receiveredemption payments. d= Days. Data for 24 EEA countries.Sources: AIFMD database, National Competent Authorities, ESMA.
0%
25%
50%
75%
100%
Fund of HF Fund of PE Other FoF
Daily Weekly
to monthly
Quarterly Quarterly
to yearly
Other
Note: Inves tor redempti on fr equenci es allow ed by open-end funds of fundsmanaged and/or marketed by authorised EU AIFMs, end of 2017, in % of NAV.EU and non-EU AIFs by authorised EU AIFMs marketed, r espectively, w/ and
w/o passport. FoF=Fund of funds, PE=Private equity fund, HF=Hedge Fund.Data for 24 EEA countries.Sources: AIFMD database, National Competent Authorities, ESMA.
0%
25%
50%
75%
100%
Fund of HF Fund of PE Other FoF
Open-end Closed-end
Note: Redemption rights provided i n the ordi nary course to inves tors i n funds offunds managed and/or marketed by authorised EU AIFMs, end of 2017, in % ofNAV. HF=Hedge fund; PE=Private equity; F oF=Fund of funds , PE=Private equity
fund. Data for 24 EEA countries.Sources: AIFMD database, National Competent Authorities, ESMA.
4% 8%
22%
100%
63%
95% 100%
0%
25%
50%
75%
100%
1 day 2-7 d 8-30 d 31-90 d 91-180 d 181-365
d
> 365 d
Fund of HF Fund of PE Other FoFNote: Liquidity financing of funds of funds managed and/or m arketed by authorisedEU AIFMs, end of 2017. Aggregate amount of borrowing and cash financi ng divideddepending on longest period for which creditors are contractually committed to
provide such fi nancing, Borrowing and cash fi nancing include draw n and undraw n,committed and uncommitted lines of credit as well as any term financing. Data for24 EEA countries. FoF=Fund of funds, PE=Private equity fund, HF=Hedge fund.Sources: AIFMD database, National Competent Authorities, ESMA.

ESMA Annual Statistical Report on EU Alternative Investment Funds 2019 60
ASR-AIF-S.55 ASR-AIF-S.56 Securities trading Derivatives trading
ASR-AIF-S.57 ASR-AIF-S.58 Repo trades clearing Derivatives trades clearing
Leverage and exposure
ASR-AIF-S.59 ASR-AIF-S.60 AuM/NAV Adjusted gross leverage
ASR-AIF-S.61 ASR-AIF-S.62 Borrowing embedded in financial instruments Unencumbered cash
0% 20% 40% 60% 80% 100%
Other FoF
Fund of PEQF
Fund of HF
Regulated market OTC
Note: Estimated market val ue of securities traded on OTC and regul ated exchangemarkets by funds of funds managed and/or marketed by authorised EU AIFMs, in%. FoF=Fund of funds, PE=Private equity fund, HF=Hedge fund. Data for 24 EEA
countries.Sources: AIFMD database, National Competent Authorities, ESMA.
0% 20% 40% 60% 80% 100%
Other FoF
Fund of PE
Fund of HF
Regulated market OTC
Note: Es timated volume of derivatives traded on OTC and regul ated exchangemarkets by funds of funds managed and/or marketed by authorised EU AIFMs, in%. FoF=Fund of funds, PE=Private equity fund, HF=Hedge fund. Data for 24 EEA
countries.Sources: AIFMD database, National Competent Authorities, ESMA.
0% 20% 40% 60% 80% 100%
Other FoF
Fund of PE
Fund of HF
CCP Tri-par ty Bila teral
Note: Estimated market value of repo trades cleared by market by funds of fundsmanaged and/or marketed by authorised EU AIFMs, in %. FoF=Fund of funds,PE=Private equity fund, HF=Hedge fund. Data for 24 EEA countries.
Sources: AIFMD database, National Competent Authorities, ESMA.
0% 20% 40% 60% 80% 100%
Other FoF
Fund of PE
Fund of HF
CCP Bilateral
Note: Es timated volume of derivatives clear ed bilaterally and via CCP by funds offunds managed and/or marketed by authorised EU AIFMs, in %. F oF=Fund offunds, PEQF=Private equity fund, HF=Hedge fund. Data for 24 EEA countries.
Sources: AIFMD database, National Competent Authorities, ESMA.
0%
40%
80%
120%
160%
Fund of HF Fund of PE Other FoF
Leverage (AuM/NAV)
Note: Lever age of funds of funds managed and/or marketed by authorised EUAIFMs and sub-threshold managers registered only i n nati onal jurisdicti ons, end of2017, in % of NAV. Leverage computed as AuM/NAV ratio. FoF=Fund of funds ,
HF=Hedge fund, PE=Private equity fund. Data for 24 EEA countries.Sources: AIFMD database, National competent authorities, ESMA.
0%
40%
80%
120%
160%
Fund of HF Fund of PE Other FoF
Adjusted gross leverage
Note: Adjus ted gross leverage of funds of funds managed and/or marketed byauthorised EU AIFMs, end of 2017, in % of N AV. Adjus ted gross l everage computedas total exposur e less IRDs with respect to NAV. F oF= Funds of funds, PE=Private
equity fund, HF=Hedge fund. Data for 24 EEA countries.Sources: AIFMD database, National competent authorities, ESMA.
0%
6%
12%
18%
24%
Fund of HF Fund of PE Other FoF
Cash and securities OTC Exchange-traded
Note: Borrowing of cash and securities or embedded in derivatives by funds offunds, end of 2017, in % of total exposure. AIFs managed and/or marketed byauthorised EU AIFMs. F oF=Fund of funds. HF=Hedge fund, PE=Private equity
Fund. Data for 24 EEA countries.Sources: AIFMD database, National Competent Authorities, ESMA.
0%
2%
3%
5%
Fund of HF Fund of PE Other FoF
Unencumbered cash
Note: U nencumber ed cash held by funds of funds , end of 2017, i n % of NAV. EUand non-EU AIFs by authorised EU AIFMs marketed, respec tively, w/ and w/opassport. FoF=Funds of funds, HF=Hedge fund, PE=Private equity fund. Data
for 24 EEA countries.Sources: AIFMD database, National Competent Authorities, ESMA.

ESMA Annual Statistical Report on EU Alternative Investment Funds 2019 61
ASR-AIF-S.63 ASR-AIF-S.64 Financial leverage Financial leverage composition
ASR-AIF-S.65 ASR-AIF-S.66 Total exposures Decomposition of exposures
ASR-AIF-S.67 ASR-AIF-S.68 Cash and cash equivalents Cash and cash equivalents in Q4 2017
ASR-AIF-S.69 ASR-AIF-S.70 Equities Equities in 4Q17
0.0%
0.1%
0.2%
Unsecured
borrowingSecured via
PBReverse
repoSecured via
otherSecuri ties
borrowed for
shorting
Note: Cash and securities borrowed by funds of funds, end of 2017, in % of NAV.EU and non-EU AIFs by authorised EU AIFMs marketed, respectively, w/ and w/opassport. FoF=Funds of funds , HF=Hedge fund, PE=Private equity fund. Data for
24 EEA countries.Sources: AIFMD database, National Competent Authorities, ESMA.
0%
25%
50%
75%
100%
Fund of HF Fund of PEQF Other FoF
Unsecured borrowing Secured via PBReverse repo Secured via otherShort position borrowing sec.
Note: Share of cash and securities borrowed by funds-of-funds, end of 2017, in %of NAV. EU and non-EU AIFs by authorised EU AIFMs marketed, respectively, w/and w/o passport. F oF=Funds of Funds , HF=Hedge F und, PEQF=Private Equity
Fund.Sources: AIFMD databse, National Competent Authorities, ESMA.
0
0.2
0.4
0.6
0.8
1
3Q17 4Q17 4Q17 (including UK)
Fund of HF Fund of PE Other FoFNote: Exposures of funds of funds managed and/or marketed by authorised EUAIFMs, funds quarterly reported, EUR tn. EU and non-EU AIFs by authorised EUAIFMs marketed, respectively , w/ and w/o passport. FoF=Fund of Funds,
HF=Hedge fund. PE=Private equity fund. Data for 24 EEA countries; UK dataavailable only in 4Q17.Sources: AIFMD database, National Competent Authorities, ESMA.
0%
25%
50%
75%
100%
Fund of HF Fund of PE Other FoF
Securi ties CIUs Physical assetsIRDs FX CDSOther derivatives
Note: Share of exposures by funds of funds' investment strategies, end of 2017, in% of total. AIFs managed and/or marketed by authorised EU AIFMs. FoF=Fund offunds, PE=Private equity fund, HF=Hedge fund. Data for 24 EEA countries.
Sources: AIFMD database, National Competent Authorities, ESMA.
0%
2%
3%
5%
6%
3Q17 4Q17 4Q17
(including UK)
Hu
nd
red
s
Certificates of deposit Commercial papers
Other cash equiva lent Other depositsNote: Cash and cash equivalents exposure of funds of funds , AIFs reportedquarterly, in % of NAV. Government bonds excl uded from other cash equival ents .Data for 24 EEA countries; UK data available only in 4Q17.
Sources: AIFMD database, National Competent Authorities, ESMA.
Certificates of deposit
10% Commercial papers
1%
Other cash equiv alent
47%
Other deposits
42%
Note: Share of cash and cash equivalents hel d by funds of funds in 4Q17. AIFsmanaged and/or marketed by authorised EU AIFMs. Data for 24 EEA countries.Sources: AIFMD database, National Competent Authorities, ESMA
0%
2%
3%
5%
6%
3Q17 4Q17 4Q17
(including UK)
Hu
nd
red
s
Listed financial inst. Other listed UnlistedNote: F unds of funds' exposur e to equity , AIFs reported quarterly, in % of NAV.AIFs managed and/or marketed by authorised EU AIFMs. Data for 24 EEAcountries; UK data available only in 4Q17.
Sources: AIFMD database, National Competent Authorities, ESMA.
Listed financial inst.
13%
Other listed60%
Unlisted27%
Note: Share of equiti es held by funds of funds in 4Q17. AIFs managed and/ormarketed by authorised EU AIFMs. Data for 24 EEA countries.Sources: AIFMD database, National Competent Authorities, ESMA

ESMA Annual Statistical Report on EU Alternative Investment Funds 2019 62
ASR-AIF-S.71 ASR-AIF-S.72 Sovereign bonds Sovereign bonds in 4Q17
ASR-AIF-S.73 ASR-AIF-S.74 Collective investment undertakings Collective investment undertakings in 4Q17
ASR-AIF-S.75 ASR-AIF-S.76 Structured products Structured products in 4Q17
ASR-AIF-S.77 ASR-AIF-S.78 Corporate bond quality Corporate bonds in 4Q17
0%
1%
2%
3%
3Q17 4Q17 4Q17
(includ ing UK)
Hu
nd
red
s
EU Sov >1Y TM EU Sov up 1Y TM
G10 Sov >1Y TM G10 Sov up 1Y TM
Non-G10 Sov >1Y TM Non-G10 Sov up 1Y TMNote: Sover eign bonds exposure exposure of funds of funds, AIFs reportedquarterly, in % of NAV. AIFs managed and/or marketed by authorised EU AIFMs.Sov=Sovereign bonds, TM=Time to Maturity. Data for 24 EEA countries; UK data
available only in 4Q17.Sources: AIFMD database, National Competent Authorities, ESMA.
EU Sov >1Y TM
66%
EU Sov up 1Y TM
14%
G10 Sov >1Y TM
11%
G10 Sov up 1Y TM
2%
Non-G10 Sov >1Y TM
7%
Note: Share of sovereign bonds held by funds of funds in 4Q17. AIFs managedand/or marketed by authorised EU AIFMs. Data for 24 EEA countries .Sov=Sovereign bonds, TM=Time to Maturity.
Sources: AIFMD database, National Competent Authorities, ESMA
0%
20%
40%
60%
80%
3Q17 4Q17 4Q17
(including UK)
Hu
nd
red
s
CIUs by the AIFM CIUs by others ETF by the AIFM
ETF by others MMFs by the AIFM MMFs by othersNote: Collective investment undertaki ngs exposure exposure of funds-of-funds,AIFs reported quarterly, in % of NAV. AIFs managed and/or marketed by authorisedEU AIFMs. CIUs=Collective Investment Undertakings. Data for 24 EEA countries;
UK data available only in 4Q17.Sources: AIFMD database, National Competent Authorities, ESMA.
CIUs by the AIFM
36%
CIUs by others53%
ETF by the AIFM
2%
ETF by others
5%
M M Fs by the AIFM
2%
M M Fs by others
2%
Note: Share of collective investment undertaki ngs held by funds of funds in 4Q17.AIFs managed and/or marketed by authorised EU AIFMs. CIUs=CollectiveInvestment Undertakings. Data for 24 EEA countries.
Sources: AIFMD database, National Competent Authorities, ESMA
0.0%
0.1%
0.2%
0.3%
0.4%
3Q17 4Q17 4Q17
(including UK)
Hu
nd
red
s
ABCP ABS Agency MBSCDO/CLO CMBS ETPOther RMBS Structured cer tificate
Note: Structured and securitised products exposure of funds of funds, AIFs reportedquarterly, in % of NAV. AIFs managed and/or marketed by authorised EU AIFMs.Data for 24 EEA countries; UK data available only in 4Q17.
Sources: AIFMD database, National Competent Authorities, ESMA.
ABS15%
CDO/CLO1%
ETP11%
Other49%
RM BS7%
Structured certificate
17%
Note: Share of structured and securitised produc ts held by funds of funds i n 4Q17.AIFs manged and/or marketed by authorised EU AIFMs. Data for 24 EEAcountries.
Sources: AIFMD database, National Competent Authorities, ESMA
0%
1%
2%
3%
4%
3Q17 4Q17 4Q17
(including UK)
IG by fin . inst. IG by non-fin. inst.
Non-IG by fin. inst. Non-IG by non- fin . inst.Note: Corpor ate bonds exposure of funds of funds , AIFs reported quarterly, in % ofNAV. AIFs managed and/or marketed by authorised EU AIFMs. Data for 24 EEAcountries; UK data available only in 4Q17.
Sources: AIFMD database, National Competent Authorities, ESMA.
IG by fin. inst.
41%
Non-IG by fin. inst.
3%
IG by non-fin. inst.
38%
Non-IG by non-fin. inst.
18%
Note: Share of corporate bonds held by funds of funds i n 4Q17. AIFs m anagedand/or marketed by authorised EU AIFMs. Data for 24 EEA countries.Sources: AIFMD database, National Competent Authorities, ESMA

ESMA Annual Statistical Report on EU Alternative Investment Funds 2019 63
Real Estate Funds
AIF characteristics
ASR-AIF-S.79 ASR-AIF-S.80 ASRD-S.80 AIFMD passport EU and non-EU AIFs
ASRD-S.81 ASRD-S.82 Market concentration Investment strategies by NAV
ASRD-S.83 ASRD-S.84 Investment regions by NAV Investor type
EU passport82%
EU w /o passport16%
Non-EU w /o passport2%
Non-EU not marketed in EU 0%
Note: NAV of real estate AIFs by manager's access to AIFMD passport, end of 2017,in %. Authorised EU AIFMs with access to AIFMD passport or marketing non-EUAIFs w/o passport, sub-threshold managers are r egistered only i n national
juridisdictions w/o passporting rights. Data for 24 EEA countries.Sources: AIFMD database, National Competent Authorities, ESMA.
0%
25%
50%
75%
100%
Commercial Industrial Multi -strategy
Other RE Residentia l
EU Non-EUNote: Share of EU and non-EU real estate funds managed and/or marketed byauthorised EU AIFMs and sub-threshol d managers registered only in nationaljurisdictions, end of 2017, in % of NAV. Non-EU AIFs marketed w/o passport.
RE=Real estate. Data for 24 EEA countries.Sources: AIFMD database, National competent Authorities, ESMA.
0
25
50
75
100
top 10 top 20 top 50 top 100 top 500 top 1,000
Market concentration
Note: Market concentration of the largest 10-to- 1,000 real estate funds managedand/or marketed by authorised EU AIFMs accessi ng AIFMD passport and sub-threshold managers registered only in nati onal j urisdictions , end of 2017, in % of
NAV. Data for 24 EEA countries.Sources: AIFMD database, National Competent Authorities, ESMA.
Commercial62%
Industrial4%
Other RE22%
Residential 12%
Note: Inves tment s trategies of real estate funds, end of 2017, i n % of NAV. R ealestate funds m anaged and/or marketed by full scope EU AIFMs and sub-thresholdmanagers registered only i n nati onal jurisdictions. RE= Real estate. Data for 24
EEA countries.Sources: AIFMD database, National Competent Authorities, ESMA.
Asia5%
EEA83%
Other Europe4%
North America7%
Supra National1%
Rest>1%
Note: R egional investm ent focus of real es tate funds managed and/or marketed byauthorised EU AIFMs and sub-threshold managers registered only i n nationaljurisdictions, end of 2017, in % of NAV. Geo-focus determined according to the
domicile of investm ents and the supranational category including investmentswithout a predominant geo-focus. Data for 24 EEA countries.Sources: AIFMD database, National Competent Authorities, ESMA.
0% 20% 40% 60% 80% 100%
Residential
Other
Multi-strategy
Industr ial
Commercial
Retail investors Professional investors
Note: Clients of real estate funds managed and/or marketed by authorised EUAIFMs and sub-threshold managers registered only in nati onal jurisdictions, end of2017, in % of NAV. RE = Real estate. Data for 24 EEA countries.
Sources: AIFMD database, National Competent Authorities, ESMA.

ESMA Annual Statistical Report on EU Alternative Investment Funds 2019 64
Liquidity and counterparty risk profile
ASRD-S.85 ASRD-S.86 Ownership of RE funds Top five beneficial owners
ASRD-S.87 ASRD-S.88 Commercial RE: liquidity profile Industrial RE: liquidity profile
ASRD-S.89 ASRD-S.90 Residential RE: liquidity profile Other RE: liquidity profile
ASRD-S.91 ASRD-S.92 Multi-strategy RE: liquidity profile Redemption frequencies
0% 20% 40% 60% 80% 100%
Residential
Other RE
Multi-strategy RE
Industr ial
Commercial
Banks General government HouseholdInsurances Non-profit NoneOther CIUs Oth. fin. institu tions Pension fundsUnknown
Note: Ownershi p of units in real es tate funds AIFs managed and/or marketed byauthorised EU AIFMs, end of 2017, in % of NAV. RE=Real es tate. D ata for 24 EEAcountries.
Sources: AIFMD database, National Competent Authorities, ESMA.
0%
25%
50%
75%
100%
Industr ial Multi-
strategy RE
Other RE Residential
EU passport EU w/o passport Non-EU w/o passport
Note: Investor concentration of real estate managed and/or marketed by authorisedEU AIFMs, end of 2017, in % of NAV. Investor concentr ation computed as share ofAIF equity benefici ally owned by the 5 largest inves tors. RE=Real es tate. Data for
24 EEA countries.Sources: AIFMD database, National Competent Authorities, ESMA.
17%
25%28% 31%
40%
53%
5% 6% 7%
18%
42%
60%
100%
0%
25%
50%
75%
100%
1 day
or less
2-7 d 8-30 d 31-90 d 91-180 d 181-365
d
> 365 d
Investor Por tfolioNote: Portfolio and investor liquidity profiles of funds of commercial real estate fundsmanaged and/or marketed by authorised EU AIFMs, end of 2017. Portfolio profiledetermined by percentage of the funds’ portfolios capable of being liquidated within
each speci fied period, i nvestor liquidity profil e depend on shortest period withi n eachfund could be withdraw n or investors coul d receive redemption paym ents. d= Days.Data for 24 EEA countries.Sources: AIFMD database, National Competent Authorities, ESMA.
2% 2% 2% 2%
24%
45%
2% 2% 2%12%
24%
43%
100%
0%
25%
50%
75%
100%
1 day
or less2-7 d 8-30 d 31-90 d 91-180 d 181-365
d> 365 d
Investor Por tfolioNote: Portfolio and investor liquidity profiles of funds of indus trial real estate fundsmanaged and/or marketed by authorised EU AIFMs, end of 2017. Portfolio profiledetermined by percentage of the funds’ portfolios capable of being liquidated within
each speci fied period, i nvestor liquidity profil e depend on shortest period withi n eachfund could be withdraw n or investors coul d receive redemption paym ents. d= Days.Data for 24 EEA countries.Sources: AIFMD database, National Competent Authorities, ESMA.
11%
27% 30%33% 35% 42%
22%23% 24%
27% 33%42%
100%
0%
25%
50%
75%
100%
1 day
or less
2-7 d 8-30 d 31-90 d 91-180 d 181-365
d
> 365 d
Investor Por tfolioNote: Portfolio and investor liqui dity profiles of funds of residenti al real estate fundsmanaged and/or marketed by authorised EU AIFMs, end of 2017. Portfolio profiledetermined by percentage of the funds’ portfolios capable of being liquidated within
each speci fied period, i nvestor liquidity profil e depend on shortest period withi n eachfund could be withdraw n or investors coul d receive redemption paym ents. d= Days.Data for 24 EEA countries.Sources: AIFMD database, National Competent Authorities, ESMA.
6%
13% 13% 13%17% 21%8%
9% 9% 10%
18% 25%
100%
0%
25%
50%
75%
100%
1 day
or less2-7 d 8-30 d 31-90 d 91-180 d 181-365
d> 365 d
Investor Portfolio
Note: Portfolio and investor liqui dity profiles of real estate funds pursuing strategiesclassified as "other" managed and/or marketed by authorised EU AIFMs, end of2017. Portfolio profile determined by percentage of the funds’ portfolios capabl e of
being liquidated within each specifi ed period, i nvestor liquidity pr ofile depend onshortest period within each fund coul d be withdrawn or inves tors could receiveredemption payments. d= Days. Data for 24 EEA countries.Sources: AIFMD database, National Competent Authorities, ESMA.
4%
28% 43%
100%
6%13%
14%
14%20%
45%
100%
0%
25%
50%
75%
100%
1 day
or less2-7 d 8-30 d 31-90 d 91-180 d 181-365
d> 365 d
Investor PortfolioNote: Portfolio and inves tor liquidity profiles of multi-strategy real estate fundsmanaged and/or marketed by authorised EU AIFMs, end of 2017. Portfolio profiledetermined by percentage of the funds’ portfolios capable of being liquidated within
each speci fied period, i nvestor liquidity profil e depend on shortest period withi n eachfund could be withdraw n or investors coul d receive redemption paym ents. d= Days.Data for 24 EEA countries.Sources: AIFMD database, National Competent Authorities, ESMA.
0%
25%
50%
75%
100%
Commercial Industr ial Multi-
strategy RE
Other RE Residential
Daily Weekly
to monthly
Quarterly Quarterly
to yearly
Other
Note: Investor redemption frequencies allowed by open-end real estate fundsmanaged and/or marketed by authorised EU AIFMs, end of 2017, in % of NAV.EU and non-EU AIFs by authorised EU AIFMs marketed, respectively, w/ and
w/o passport. RE=Real estate. Data for 24 EEA countries.Sources: AIFMD database, National Competent Authorities, ESMA.

ESMA Annual Statistical Report on EU Alternative Investment Funds 2019 65
ASRD-S.93 ASRD-S.94 Redemption rights to investors Liquidity financing
ASRD-S.95 ASRD-S.96 Securities trading Derivatives trading
ASRD-S.97 ASRD-S.98 Repo trades clearing Derivatives clearing
0%
25%
50%
75%
100%
Commercial Industr ial Multi-
strategy REOther RE Residential
Open-end Closed-endNote: Redempti on rights pr ovided in the ordinary course to investors in real es tatefunds managed and/or marketed by authorised EU AIFMs, end of 2017, in % ofNAV. RE=Real estate. Data for 24 EEA countries.
Sources: AIFMD database, National Competent Authorities, ESMA.
26%36%
45%
0%
98% 100%
0%
25%
50%
75%
100%
1 day 2-7 d 8-30 d 31-90 d 91-180 d 181-365
d> 365 d
Commercial Industr ialOther RE Residential
Note: Liquidity fi nanci ng of real es tate funds managed and/or marketed by EUauthorised AIFMs, end of 2017. Aggregate amount of borrowing and cash financingdivided dependi ng on longes t period for w hich creditors are contr actually committed
to provide such fi nancing, Borrowing and cash financing incl ude dr awn andundraw n, committed and uncommitted lines of credit as well as any term financing.RE=Real estate. Data for 24 EEA countries.Sources: AIFMD database, National Competent Authorities, ESMA.
0% 20% 40% 60% 80% 100%
Residential
Other RE
Multistrategy RE
Industr ial
Commercial
Regulated market OTC
Note: Estimated m arket value of securities traded on OTC and r egul ated exchangemarkets by real es tate funds managed and/or marketed by authorised EU AIFMs,in %. RE=Real estate. Data for 24 EEA countries.
Sources: AIFMD database, National Competent Authorities, ESMA.
0% 20% 40% 60% 80% 100%
Residential
Other RE
Multi-strategy RE
Industr ial
Commercial
Regulated market OTC
Note: Es timated volum e of derivatives traded on OTC and regul ated exchangemarkets by real estate funds m anaged and/or marketed by authorised EU AIFMs, in%. RE=Real estate. Data for 24 EEA countries.
Sources: AIFMD database, National Competent Authorities, ESMA.
0% 20% 40% 60% 80% 100%
Residential
Other RE
Multistrategy RE
Commercial
CCP Tri-par ty Bila teral
Note: Estimated market val ue of repo trades cleared by by real es tate fundsmanaged and/or marketed by authorised EU AIFMs, in %. EU and non-EU AIFs byauthorised EU AIFMs marketed, respectively, w/ and w/o passport . RE=Real
estate. Data for 24 EEA countries.Sources: AIFMD database, National Competent Authorities, ESMA.
0% 20% 40% 60% 80% 100%
Residential
Other RE
Multistrategy RE
Industr ial
Commercial
CCP Bila teralNote: Estimated volume of derivatives cleared bilaterally and vi a CCP by realestate funds managed and/or marketed by authorised EU AIFMs, in %. RE=Realestate. Data for 24 EEA countries.
Sources: AIFMD database, National Competent Authorities, ESMA.

ESMA Annual Statistical Report on EU Alternative Investment Funds 2019 66
Leverage and exposure
ASRD-S.99 ASRD-S.100 AuM/NAV Adjusted gross leverage
ASRD-S.101 ASRD-S.102 Borrowings embedded in derivatives Unencumbered cash
ASRD-S.103 ASRD-S.104 Financial leverage Financial leverage composition
ASRD-S.105 ASRD-S.106 Total exposures Decomposition of exposures
0%
35%
70%
105%
140%
175%
Commercial Industr ial Multi-
strategy REOther RE Residential
Leverage (AuM/NAV)Note: Leverage of rel estate funds managed and/or marketed by authorised EUAIFMs and sub-threshold managers registered only in national jurisdictions, end of2017, in % of NAV. Leverage com puted as AuM/NAV ratio. RE=Real estate. Data
for 24 EEA countries.Sources: AIFMD database, National competent authorities, ESMA.
0%
35%
70%
105%
140%
175%
Commercial Industr ial Multi-
strategy RE
Other RE Residential
Adjusted gross leverage
Note: Adj usted gross leverage of real estate funds managed and/or marketed byauthorised EU AIFMs, end of 2017, in % of NAV. Adj usted gr oss lever age computedas total exposure less IRDs with respect to NAV. RE=Real estate. Data for 24 EEA
countries.Sources: AIFMD database, National competent authorities, ESMA.
0%
8%
16%
24%
Commercial Industrial Multi-strategy RE
OtherRE
Residential
Cash and securities OTC Exchange-traded
Note: Borrowing of cash and securities or embedded in derivatives by real es tatefunds, end of 2017, in % of total exposure. AIFs managed and/or marketed byauthorised EU AIFMs marketed. OTC and exchange-traded deriatives net of
margins. RE=Real estate. Data for 24 EEA countries.Sources: AIFMD database, National Competent Authorities, ESMA
0%
2%
4%
6%
8%
Commercial Industr ial Multi-
stra tegy RE
Other RE Residential
Unencumbered cash
Note: U nencumbered cash hel d by real estate funds, end of 2017, in % of N AV.EU and non-EU AIFs by authorised EU AIFMs marketed, respectively, w/ andw/o passport. RE=Real estate. Data for 24 EEA countries.
Sources: AIFMD database, National Competent Authorities, ESMA.
0%
2%
4%
5%
Unsecured
borrowing
Secured via
PB
Reverse
repo
Secured via
other
Securi ties
borrowed
for shor ting
Note: C ash and securities borrowed by real estate funds, end of 2017, in % of NAV.EU and non-EU AIFs by authorised EU AIFMs marketed, respectively, w/ and w/opassport. RE=Real estate. Data for 24 EEA countries.
Sources: AIFMD database, National Competent Authorities, ESMA.
0%
25%
50%
75%
100%
Commercial Industr ial Multi-
strategy RE
Other RE Residential
Securi ties borrowed for shor ting Secured via other
Reverse repo Secured via PB
Unsecured borrowingNote: Share cash and securities borrowed by real estate funds, end of 2017, in %of NAV. EU and non-EU AIFs by authorised EU AIFMs marketed, respec tively, w/and w/o passport. RE=Real estate. Data for 24 EEA countries.
Sources: AIFMD database, National Competent Authorities, ESMA.
0
0.2
0.4
0.6
0.8
3Q17 4Q17 4Q17 (including UK)
Commercial RE Industr ial RE Multi-strategy REOther RE Residential RE
Note: Exposure of real estate funds m anaged and/or marketed by authorised EUAIFMs, funds quarterly reported, EUR tn. EU and non-EU AIFs by authorised EUAIFMs marketed, respectively, w/ and w/o passport. RE=Real estate. D ata for 24
EEA countries; UK data available only in 4Q17.Sources: AIFMD database, National Competent Authorities, ESMA.
0%
25%
50%
75%
100%
Commercial Industr ial Multi-
stra tegy RE
Other RE Residential
Securi ties CIUs Physical assets
IRDs FX CDS
Other derivatives
Note: Share of exposures by real estate funds' investment strategies, end of 2017,in % of total. AIFs managed and/or marketed by authorised EU AIFMs. RE=Realestate. Data for 24 EEA countries.
Sources: AIFMD database, National Competent Authorities, ESMA.

ESMA Annual Statistical Report on EU Alternative Investment Funds 2019 67
ASRD-S.107 ASRD-S.108 Cash and cash equivalents Cash and cash equivalents in 4Q17
ASRD-S.109 ASRD-S.110 Equities Equities in 4Q17
ASRD-S.111 ASRD-S.112 Sovereign bonds Sovereign bonds in 4Q17
ASRD-S.113 ASRD-S.114 Collective investment undertakings Collective investment undertakings in 4Q17
0%
3%
6%
9%
3Q17 4Q17 4Q17
(includ ing UK)
Hu
nd
red
s
Certificates of deposit Commercial papers
Other cash equiva lent Other deposits
Note: Cash and cash equivalents exposur e of real estate funds, AIFs reportedquarterly, in % of NAV. Government bonds excl uded from other cash equivalents.Data for 24 EEA countries; UK data avail able only in 4Q17.Sources: AIFMD
database, National Competent Authorities, ESMA.
Certificates of deposit>1%
Other cash equiv alent
74%
Other deposits
26%
Note: Share of cash and cash equival ents held by real estate funds i n 4Q17. AIFsmanaged and/or marketed by authorised EU AIFMs. Data for 24 EEA countries.Sources: AIFMD database, National Competent Authorities, ESMA
0%
3%
6%
9%
12%
3Q17 4Q17 4Q17
(including UK)
Hu
nd
red
s
Listed financial inst. Other listed Unlisted
Note: Real es tate funds' exposure to equi ty, AIFs reported quarterly, in % of NAV.AIFs managed and/or marketed by authorised EU AIFMs. Data for 24 EEAcountries; UK data available only in 4Q17.
Sources: AIFMD database, National Competent Authorities, ESMA.
Listed financial inst.1%
Other listed76%
Unlisted23%
Note: Share of equiti es hel d by real estate funds in 4Q17. AIFs managed and/ormarketed by authorised EU AIFMs. Data for 24 EEA countries.Sources: AIFMD database, National Competent Authorities, ESMA
0.0%
0.1%
0.2%
0.3%
0.4%
3Q17 4Q17 4Q17
(including UK)
Hu
nd
red
s
EU Sov >1Y TM EU Sov up 1Y TMG10 Sov >1Y TM G10 Sov up 1Y TMNon-G10 Sov >1Y TM Non-G10 Sov up 1Y TM
Note: Sovereign bonds exposure exposur e of real estate funds, AIFs reportedquarterly, in % of NAV. AIFs managed and/or marketed by authorised EU AIFMs.Sov=Sovereign bonds, TM=Time to Maturity. Data for 24 EEA countries; UK data
available only in 4Q17.Sources: AIFMD database, National Competent Authorities, ESMA.
EU Sov >1Y TM
17%
EU Sov up 1Y TM
52%
Non-G10 Sov >1Y TM
31%
Note: Share of sovereign bonds held by real estate funds in 4Q17. AIFs managedand/or marketed by authorised EU AIFMs. Data for 24 EEA countries .Sov=Sovereign bonds, TM=Time to Maturity.
Sources: AIFMD database, National Competent Authorities, ESMA
0%
3%
5%
8%
10%
3Q17 4Q17 4Q17
(includ ing UK)
Hu
nd
red
s
CIUs by the AIFM CIUs by others ETF by the AIFM
ETF by others MMFs by the AIFM MMFs by othersNote: Note: Coll ective inves tment undertakings exposure of real estate funds,AIFs reported quarterly, in % of NAV. AIFs managed and/or marketed byauthorised EU AIFMs. CIUs=Collective Investment Undertakings. Data for 24
EEA countries; UK data available only in 4Q17.Sources: AIFMD database, National Competent Authorities, ESMA.
CIUs by the AIFM
18%
CIUs by others
60%
M M Fs by the AIFM
3%
M M Fs by others
19%
Note: Share of collective investment undertakings held by real estate funds in4Q17. AIFs m anaged and/or marketed by authorised EU AIFMs. CIUs=CollectiveInvestment Undertakings.Data for 24 EEA countries.
Sources: AIFMD database, National Competent Authorities, ESMA

ESMA Annual Statistical Report on EU Alternative Investment Funds 2019 68
ASRD-S.115 ASRD-S.116 Structured products Structured products in 4Q17
ASRD-S.117 ASRD-S.118 Corporate bond quality Corporate bonds in 4Q17
0.00%
0.03%
0.06%
0.09%
0.12%
3Q17 4Q17 4Q17
(including UK)
Hu
nd
red
s
ABCP ABS Agency MBSCDO/CLO CMBS ETPOther RMBS Structured cer tificate
Note: Structured and securitised products exposure of real estate funds, AIFsreported quarterly, i n % of NAV. AIFs m anaged and/or marketed by authorised EUAIFMs. Data for 24 EEA countries; UK data available only in 4Q17.
Sources: AIFMD database, National Competent Authorities, ESMA.
ABS55%
Other38%
Structured certificate
7%
Note: Share of structured and securitised products hel d by real estate funds i n4Q17. AIFs manged and/or marketed by authorised EU AIFMs. Data for 24 EEAcountries.
Sources: AIFMD database, National Competent Authorities, ESMA
0.0%
0.5%
1.0%
1.5%
3Q17 4Q17 4Q17
(including UK)
Hu
nd
red
s
IG by fin . inst. IG by non-fin. inst.Non-IG by fin. inst. Non-IG by non- fin. inst.
Note: C orporate bonds exposure of real es tate funds, AIFs reported quarterly, in %of NAV. AIFs managed and/or marketed by authorised EU AIFMs. D ata for 24 EEAcountries; UK data available only in 4Q17.
Sources: AIFMD database, National Competent Authorities, ESMA.
IG by fin. inst.
55%
Non-IG by fin. inst.
2%
IG by non-fin. inst.
29%
Non-IG by non-fin. inst.
14%
Note: Share of corporate bonds held by real es tate funds i n 4Q17. AIFs m anagedand/or marketed by authorised EU AIFMs. Data for 24 EEA countries.Sources: AIFMD database, National Competent Authorities, ESMA
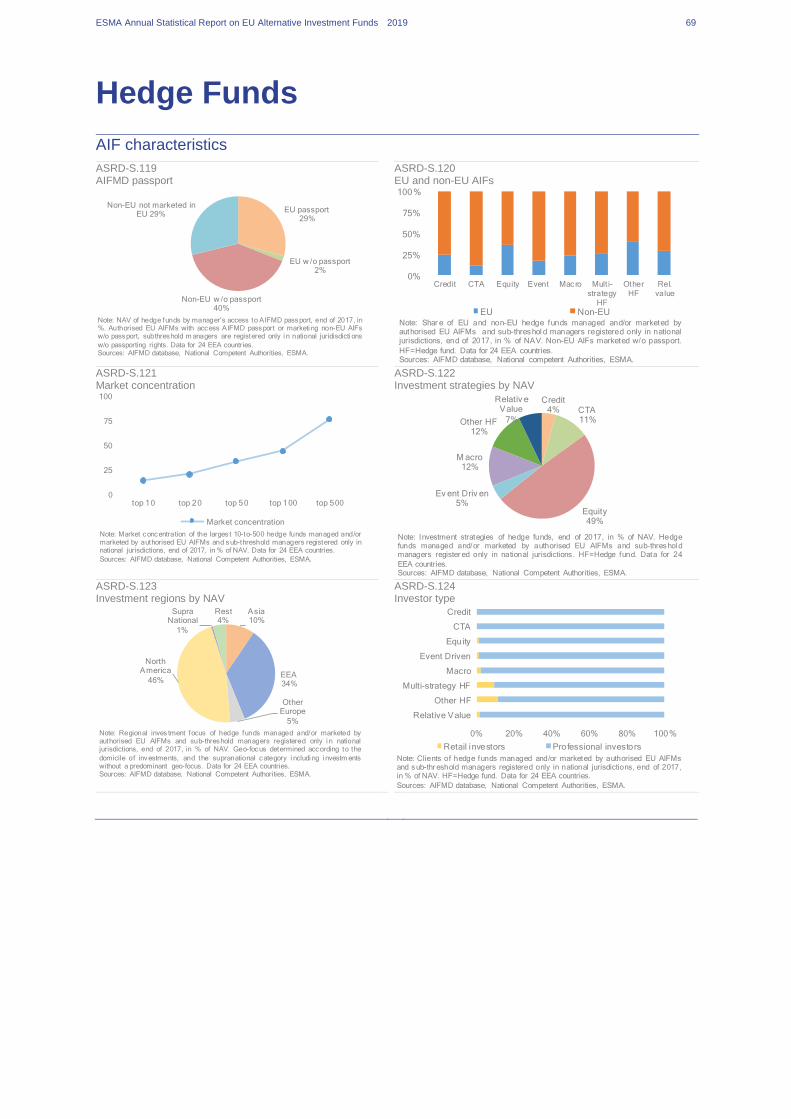
ESMA Annual Statistical Report on EU Alternative Investment Funds 2019 69
Hedge Funds
AIF characteristics
ASRD-S.119 ASRD-S.120 AIFMD passport EU and non-EU AIFs
ASRD-S.121 ASRD-S.122 Market concentration Investment strategies by NAV
ASRD-S.123 ASRD-S.124 Investment regions by NAV Investor type
EU passport29%
EU w /o passport2%
Non-EU w /o passport40%
Non-EU not marketed in EU 29%
Note: NAV of hedge funds by manager's access to AIFMD passport, end of 2017, in%. Authorised EU AIFMs with access AIFMD passport or marketi ng non-EU AIFsw/o passport, subthreshold m anagers are registered only i n national juridisdicti ons
w/o passporting rights. Data for 24 EEA countries.Sources: AIFMD database, National Competent Authorities, ESMA.
0%
25%
50%
75%
100%
Credit CTA Equity Event Macro Mult i-strategy
HF
OtherHF
Rel.value
EU Non-EUNote: Shar e of EU and non-EU hedge funds managed and/or marketed byauthorised EU AIFMs and sub-threshol d managers registered only in nationaljurisdictions, end of 2017, in % of NAV. Non-EU AIFs marketed w/o passport.
HF=Hedge fund. Data for 24 EEA countries.Sources: AIFMD database, National competent Authorities, ESMA.
0
25
50
75
100
top 10 top 20 top 50 top 100 top 500
Market concentration
Note: Market concentration of the larges t 10-to-500 hedge funds managed and/ormarketed by authorised EU AIFMs and sub-threshold managers registered only innational jurisdictions, end of 2017, in % of NAV. Data for 24 EEA countries.
Sources: AIFMD database, National Competent Authorities, ESMA.
Credit4% CTA
11%
Equity49%
Ev ent Driv en5%
M acro12%
Other HF12%
Relativ e Value
7%
Note: Investment strategies of hedge funds, end of 2017, in % of NAV. Hedgefunds managed and/or marketed by authorised EU AIFMs and sub-threshol dmanagers register ed only in national jurisdictions. HF=Hedge fund. Data for 24
EEA countries.Sources: AIFMD database, National Competent Authorities, ESMA.
Asia10%
EEA34%
Other Europe
5%
North America
46%
Supra National
1%
Rest4%
Note: Regional inves tment focus of hedge funds managed and/or marketed byauthorised EU AIFMs and sub-threshold managers registered only i n nationaljurisdictions, end of 2017, in % of NAV. Geo-focus determined according to the
domicile of investments, and the supranational category i ncludi ng i nvestm entswithout a predominant geo-focus. Data for 24 EEA countries.Sources: AIFMD database, National Competent Authorities, ESMA.
0% 20% 40% 60% 80% 100%
Relative Value
Other HF
Multi-strategy HF
Macro
Event Driven
Equity
CTA
Credit
Retail investors Professional investors
Note: Clients of hedge funds managed and/or marketed by authorised EU AIFMsand sub-thr eshold managers registered only in national jurisdictions, end of 2017,in % of NAV. HF=Hedge fund. Data for 24 EEA countries.
Sources: AIFMD database, National Competent Authorities, ESMA.

ESMA Annual Statistical Report on EU Alternative Investment Funds 2019 70
Liquidity and counterparty risk profile
ASRD-S.125 ASRD-S.126 Ownership of AIFs Top five beneficial owners
ASRD-S.127 ASRD-S.128 Credit HF: liquidity profile CTA: liquidity profile
ASRD-S.129 ASRD-S.130 Equity HF: liquidity profile Event driven: liquidity profile
ASRD-S.131 ASRD-S.132 Macro HF: liquidity profile Relative value: liquidity profile
0% 20% 40% 60% 80% 100%
Relative Value
Other HF
Multi-strategy HF
Macro
Event Driven
Equity
CTA
Credit
Banks General government HouseholdInsurances Non-profit NoneOther CIUs Oth. fin. institu tions Pension fundsUnknown
Note: Ow nership of units in hedge funds managed and/or marketed by authorisedEU AIFMs, end of 2017, in % of NAV. HF=Hedge fund. Data for 24 EEA countries.Sources: AIFMD database, National Competent Authorities, ESMA.
0%
25%
50%
75%
100%
Credit CTA Equity Event
drivenMacro Multi-
strategy
HF
Other
HFRel.
value
EU passport EU w/o passport Non-EU w/o passport
Note: Investor concentration of hedge funds managed and/or marketed byauthorised EU AIFMs, end of 2017, i n % of NAV. Inves tor concentrati on computedas share of AIF equity beneficially owned by the 5 l arges t investors. HF=Hedge
Fund. Data for 24 EEA countries.Sources: AIFMD database, National Competent Authorities, ESMA.
0% 1%
22%
73% 80%87%
58%
66% 69%
99% 100%
0%
25%
50%
75%
100%
1 day or
less2-7 d 8-30 d 31-90 d 91-180 d 181-365
d> 365 d
Investor Por tfolio
Note: Portfolio and inves tors liqui dity pr ofiles of funds of credit hedge fundsmanaged and/or marketed by authorised EU AIFMs, end of 2017. Portfoli o profiledetermined by percentage of the funds’ portfolios capable of being liquidated withi n
each specifi ed period, investor liquidity profile depend on shortest period within eachfund could be withdrawn or inves tors could receive r edem ption payments. d= Days .Data for 24 EEA countries.Sources: AIFMD database, National Competent Authorities, ESMA.
6%
85%91%
100% 100% 100%90%
99% 100% 100% 100% 100% 100%
0%
25%
50%
75%
100%
1 day or
less
2-7 d 8-30 d 31-90 d 91-180 d 181-365
d
> 365 d
Investor Por tfolio
Note: Portfolio and investors liquidity profiles of CTA managed and/or marketed byauthorised EU AIFMs, end of 2017. Portfolio profile determined by percentage of thefunds’ portfolios capabl e of being liquidated withi n each specified period, inves tor
liquidity profile depend on shortest period within each fund could be withdrawn orinvestors could receive redemption payments. d= Days. Data for 24 EEA countries.Sources: AIFMD database, National Competent Authorities, ESMA.
3%
22%30%
51%
89%
98%
42%
63%
82%
92% 94%97%
100%
0%
25%
50%
75%
100%
1 day or
less
2-7 d 8-30 d 31-90 d 91-180 d 181-365
d
> 365 d
Investor Por tfolioNote: Portfolio and inves tor liqui dity profiles of funds of equity hedge funds managedand/or marketed by authorised EU AIFMs, end of 2017. Portfolio profile determined bypercentage of the funds’ portfolios capable of bei ng liquidated withi n each specified
period, inves tor liqui dity pr ofile depend on shortes t period within each fund could bewithdrawn or investors could receive redemption payments. d= Days . Data for 24 EEAcountries.Sources: AIFMD database, National Competent Authorities, ESMA.
0% 0%
10%
50%
61%
76%
48%
70%
82%88%
96% 98% 100%
0%
25%
50%
75%
100%
1 day or
less
2-7 d 8-30 d 31-90 d 91-180 d 181-365
d
> 365 d
Investor PortfolioNote: Portfolio and investor liquidity profiles of funds of event driven hedge fundsmanaged and/or marketed by authorised EU AIFMs, end of 2017. Portfolio profil edetermined by percentage of the funds’ portfolios capable of being liquidated withi n
each specifi ed period, investor liquidity profile depend on shortest period within eachfund could be withdr awn or inves tors could receive redempti on payments. d= Days .Data for 24 EEA countries.Sources: AIFMD database, National Competent Authorities, ESMA.
6%
29%
51%
77%94%
98%
24%
46%
81%
99% 100%
0%
25%
50%
75%
100%
1 day or
less
2-7 d 8-30 d 31-90 d 91-180 d 181-365
d
> 365 d
Investor Por tfolioNote: Port folio and investors liquidity profiles of funds of macro hedge funds managedand/or marketed by authorised EU AIFMs, end of 2017. Portfolio profile determined bypercentage of the funds’ portfolios capable of bei ng liquidated withi n each specified
period, inves tor liqui dity pr ofile depend on shortes t period within each fund could bewithdrawn or investors could receive redemption payments. d= Days . Data for 24 EEAcountries.Sources: AIFMD database, National Competent Authorities, ESMA.
4%
29%34%
98%
45%
80%
93%99%
99%100%
0%
25%
50%
75%
100%
1 day or
less2-7 d 8-30 d 31-90 d 91-180 d 181-365
d> 365 d
Investor Por tfolioNote: Portfolio and i nvestor liqui dity profiles of relative val ue hedge funds managedand/or marketed by authorised EU AIFMs, end of 2017. Portfolio profile determined bypercentage of the funds’ portfolios capable of bei ng liquidated withi n each specified
period, inves tor liqui dity pr ofile depend on shortes t period within each fund could bewithdrawn or investors could receive redemption payments d= Days. Data for 24 EEAcountries.Sources: AIFMD database, National Competent Authorities, ESMA.
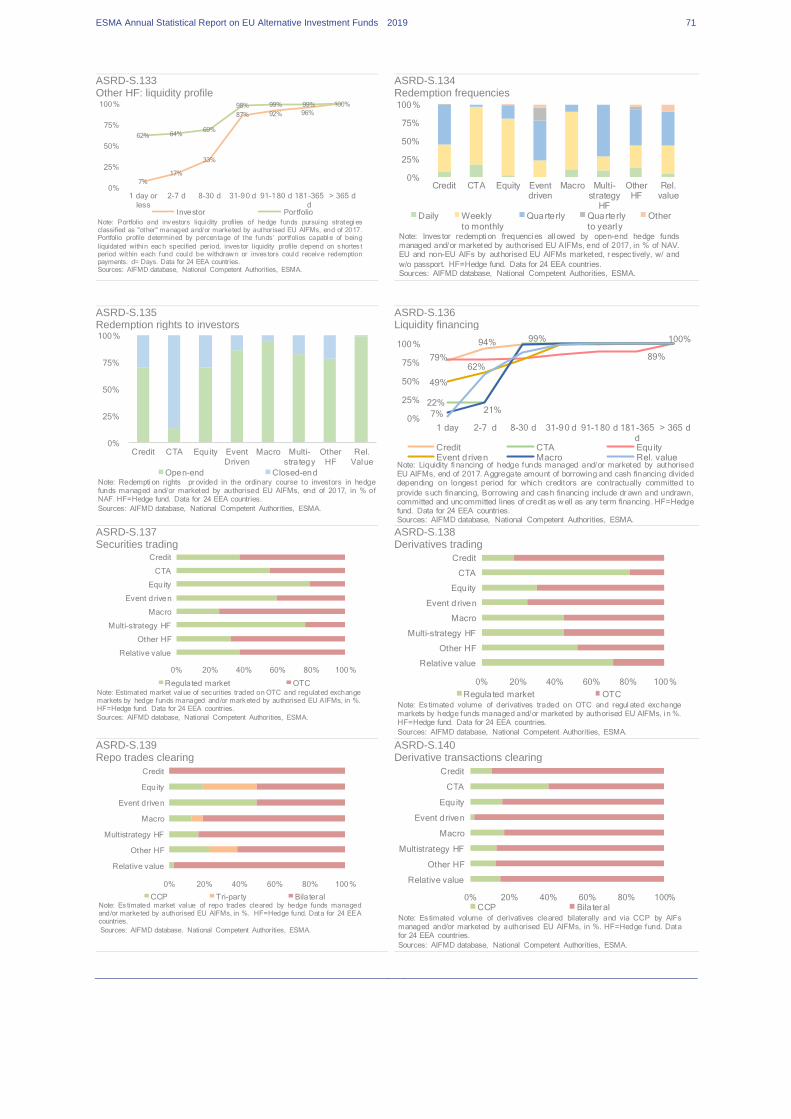
ESMA Annual Statistical Report on EU Alternative Investment Funds 2019 71
ASRD-S.133 ASRD-S.134 Other HF: liquidity profile Redemption frequencies
ASRD-S.135 ASRD-S.136 Redemption rights to investors Liquidity financing
ASRD-S.137 ASRD-S.138 Securities trading Derivatives trading
ASRD-S.139 ASRD-S.140 Repo trades clearing Derivative transactions clearing
7%
17%
33%
87% 92% 96%
62% 64%69%
98% 99% 99% 100%
0%
25%
50%
75%
100%
1 day or
less
2-7 d 8-30 d 31-90 d 91-180 d 181-365
d
> 365 d
Investor Portfolio
Note: Portfolio and investors liqui dity profiles of hedge funds pursui ng strategi esclassified as "other" managed and/or marketed by authorised EU AIFMs, end of 2017.Portfolio profile determined by percentage of the funds’ portfolios capabl e of being
liquidated withi n each specified period, inves tor liquidity profile depend on shortes tperiod within each fund coul d be withdraw n or inves tors coul d receive redemptionpayments. d= Days. Data for 24 EEA countries.Sources: AIFMD database, National Competent Authorities, ESMA.
0%
25%
50%
75%
100%
Credit CTA Equity Eventdriven
Macro Multi-strategy
HF
OtherHF
Rel.value
Daily Weekly
to monthly
Quarterly Quarterly
to yearly
Other
Note: Inves tor redempti on frequenci es all owed by open-end hedge fundsmanaged and/or marketed by authorised EU AIFMs, end of 2017, in % of NAV.EU and non-EU AIFs by authorised EU AIFMs marketed, r espectively, w/ and
w/o passport. HF=Hedge fund. Data for 24 EEA countries.Sources: AIFMD database, National Competent Authorities, ESMA.
0%
25%
50%
75%
100%
Credit CTA Equity Event
Driven
Macro Multi-
strategy
Other
HF
Rel.
Value
Open-end Closed-endNote: Redempti on rights pr ovided in the ordinary course to investors in hedgefunds managed and/or marketed by authorised EU AIFMs, end of 2017, in % ofNAF. HF=Hedge fund. Data for 24 EEA countries.
Sources: AIFMD database, National Competent Authorities, ESMA.
94% 99%
22%
79% 89%
49%
62%
7% 21%
100%
0%
25%
50%
75%
100%
1 day 2-7 d 8-30 d 31-90 d 91-180 d 181-365
d> 365 d
Credit CTA EquityEvent driven Macro Rel. value
Note: Liquidity fi nancing of hedge funds managed and/or marketed by authorisedEU AIFMs, end of 2017. Aggregate amount of borrowing and cash financing divideddepending on longes t period for which creditors are contractually committed to
provide such financing, Borrowing and cash financing include dr awn and undrawn,committed and uncommitted lines of credit as w ell as any term financing. HF=Hedgefund. Data for 24 EEA countries.Sources: AIFMD database, National Competent Authorities, ESMA.
0% 20% 40% 60% 80% 100%
Relative value
Other HF
Multi-strategy HF
Macro
Event driven
Equity
CTA
Credit
Regulated market OTCNote: Estimated market val ue of securities traded on OTC and regulated exchangemarkets by hedge funds managed and/or marketed by authorised EU AIFMs, in %.HF=Hedge fund. Data for 24 EEA countries.
Sources: AIFMD database, National Competent Authorities, ESMA.
0% 20% 40% 60% 80% 100%
Relative value
Other HF
Multi-strategy HF
Macro
Event driven
Equity
CTA
Credit
Regulated market OTC
Note: Es timated volume of derivatives traded on OTC and regul ated exchangemarkets by hedge funds managed and/or marketed by authorised EU AIFMs, i n %.HF=Hedge fund. Data for 24 EEA countries.
Sources: AIFMD database, National Competent Authorities, ESMA.
0% 20% 40% 60% 80% 100%
Relative value
Other HF
Multistrategy HF
Macro
Event driven
Equity
Credit
CCP Tri-par ty Bila teralNote: Es timated market val ue of repo trades cleared by hedge funds managedand/or marketed by authorised EU AIFMs, in %. HF=Hedge fund. Data for 24 EEAcountries.
Sources: AIFMD database, National Competent Authorities, ESMA.
0% 20% 40% 60% 80% 100%
Relative value
Other HF
Multistrategy HF
Macro
Event driven
Equity
CTA
Credit
CCP Bila teral
Note: Es timated volume of derivatives cleared bilaterally and via CCP by AIFsmanaged and/or marketed by authorised EU AIFMs, in %. HF=Hedge fund. Datafor 24 EEA countries.
Sources: AIFMD database, National Competent Authorities, ESMA.

ESMA Annual Statistical Report on EU Alternative Investment Funds 2019 72
Leverage and exposure
ASRD-S.141 ASRD-S.142 AuM/NAV Adjusted gross leverage
ASRD-S.143 ASRD-S.144 Borrowing embedded in financial instruments Unencumbered cash
ASRD-S.145 ASRD-S.146 Financial leverage Financial leverage composition
ASRD-S.147 ASRD-S.148 Total exposures Decomposition of exposures
0%
1400%
2800%
4200%
Credit CTA Equity Eventdriven
Macro Multi-strategy
HF
OtherHF
Rel.value
Leverage (AuM/NAV)Note: Leverage of hedge funds m anaged and/or marketed by authorised EU AIFMsand sub-threshold managers registered only in national jurisdictions, end of 2017,in % of NAV. Leverage computed as AuM/NAV ratio. HF=Hedge funds. Data for 24
EEA countries.Sources: AIFMD database, National competent authorities, ESMA.
0%
1400%
2800%
4200%
Credit CTA Equity Eventdriven
Macro Multi-strategy
HF
OtherHF
Rel.value
Adjusted gross leverageNote: Adjusted gross leverage of hedge funds managed and/or marketed byauthorised EU AIFMs, end of 2017, in % of N AV. Adjus ted gross l everage computedas total exposur e less IRDs with respect to NAV. HF=Hedge fund. Data for 24 EEA
countries.Sources: AIFMD database, National competent authorities, ESMA.
0%
25%
50%
75%
100%
Credit CTA Equity Eventdriven
Macro Multi-strategy
OtherHF
Rel.value
Cash and securities OTC Exchange-tradedNote: Borrowing of cash and securities or embedded in derivatives by hedge funds,end of 2017, in % of total exposure. AIFs m anaged and/or marketed by authorisedEU AIFMs. OTC and exchange-traded deriatives net of margins. HF=Hedge fund.
Data for 24 EEA countries.Sources: AIFMD database, National Competent Authorities, ESMA.
0%
15%
30%
45%
60%
Credit CTA Equity Eventdriven
Macro Multi-strategy
HF
OtherHF
Rel.value
Unencumbered cash
Note: Unencumbered cash held by hedge funds, end of 2017, in % of NAV. EUand non-EU AIFs by authorised EU AIFMs marketed, respectively, w/ and w/opassport. HF=Hedge fund. Data for 24 EEA countries.
Sources: AIFMD database, National Competent Authorities, ESMA.
0%
20%
40%
60%
80%
Unsecuredborrowing
Secured viaPB
Reverserepo
Secured viaother
Securitiesborrowed for
shorting
Note: C ash and securities borrowed by hedge funds, end of 2017, in % of NAV. EUand non-EU AIFs by authorised EU AIFMs marketed, respectively, w/ and w/opassport. F oF=Funds of funds, None=No predominant type. D ata for 24 EEA
countries.Sources: AIFMD database, National Competent Authorities, ESMA.
0%
25%
50%
75%
100%
Credit CTA Equity Eventdriven
Macro Multi-strategy
HF
OtherHF
Rel.Value
Securi ties borrowed for shor ting Secured via other
Reverse repo Secured via PB
Unsecured borrowing
Note: Share of cash and securities borrowed by hedge funds , end of 2017, in % ofNAV. EU and non-EU AIFs by authorised EU AIFMs marketed, r espec tively, w/ andw/o passport. F oF=Funds of funds, None=No predominant type. Data for 24 EEA
countries.Sources: AIFMD database, National Competent Authorities, ESMA.
0
2.5
5
7.5
10
3Q17 4Q17 4Q17 (including UK)
Credit CTA EquityEvent driven Macro Multi-strategy HFOther HF Relative value
Note: Exposures of hedge funds managed and/or marketed by authorised EUAIFMs, funds quarterly reported, EUR tn. EU and non-EU AIFs by authorised EUAIFMs marketed, respec tively, w/ and w/o passport. HF=Hedge fund. D ata for 24
EEA countries; UK data available only in 4Q17.Sources: AIFMD database, National Competent Authorities, ESMA.
0%
25%
50%
75%
100%
Credit CTA Equity Eventdriven
Macro Multi-strategy
HF
OtherHF
Rel.value
Securi ties CIUs Physical assetsIRDs FX CDSOther derivatives
Note: Share of exposures by hedge funds' inves tment strategi es, end of 2017, in %of total. AIFs managed and/or marketed by authorised EU AIFMs. HF=Hedge fund.Data for 24 EEA countries.
Sources: AIFMD database, National Competent Authorities, ESMA.

ESMA Annual Statistical Report on EU Alternative Investment Funds 2019 73
ASRD-S.149 ASRD-S.150 Cash and cash equivalents Cash and cash equivalents in 4Q17
ASRD-S.151 ASRD-S.152 Equities Equities in 4Q17
ASRD-S.153 ASRD-S.154 Sovereign bonds Sovereign bonds in 4Q17
ASRD-S.155 ASRD-S.156 Collective investment undertakings Collective investment undertakings in 4Q17
0%
40%
80%
120%
160%
3Q17 4Q17 4Q17
(including UK)
Hu
nd
red
s
Certificates of deposit Commercial papers
Other cash equiva lent Other deposits
Note: Cash and cash equivalents exposure of hedge funds, AIFs reported quarterly,in % of NAV. Government bonds excl uded from the other cash equival ents. D atafor 24 EEA countries; UK data available only in 4Q17.
Sources: AIFMD database, National Competent Authorities, ESMA.
Certificates of deposit>1%
Commercial papers
>1%
Other cash equiv alent
87%
Other deposits
13%
Note: Share of cash and cash equivalents held by hedge funds in 4Q17. AIFsmanaged and/or marketed by authorised EU AIFMs. Data for 24 EEA countries.Sources: AIFMD database, National Competent Authorities, ESMA
0%
18%
36%
54%
72%
90%
3Q17 4Q17 4Q17
(including UK)
Hu
nd
red
s
Listed financial inst. Other listed Unlisted
Note: Hedge funds' exposure to equity , AIFs reported quarterly, i n % of NAV. AIFsmanaged and/or marketed by authorised EU AIFMs. Data for 24 EEA countries ; UKdata available only in 4Q17.
Sources: AIFMD database, National Competent Authorities, ESMA.
Listed financial
inst.15%
Other listed84%
Unlisted1%
Note: Share of equiti es held by hedge funds i n 4Q17. AIFs m anaged and/ormarketed by authorised EU AIFMs. Data for 24 EEA countries.Sources: AIFMD database, National Competent Authorities, ESMA
0%
40%
80%
120%
160%
3Q17 4Q17 4Q17
(including UK)
Hu
nd
red
s
EU Sov >1Y TM EU Sov up 1Y TM
G10 Sov >1Y TM G10 Sov up 1Y TM
Non-G10 Sov >1Y TM Non-G10 Sov up 1Y TMNote: Soverei gn bonds exposure exposure of hedge funds, AIFs reportedquarterly, in % of NAV. AIFs managed and/or marketed by authorised EU AIFMs.Sov=Sovereign bonds, TM=Time to Maturity. Data for 24 EEA countries ; UK data
available only in 4Q17.Sources: AIFMD database, National Competent Authorities, ESMA.
EU Sov >1Y TM
42%
EU Sov up 1Y TM
9%
G10 Sov >1Y TM
39%
G10 Sov up 1Y TM
7%
Non-G10 Sov >1Y TM
3%
Non-G10 Sov up 1Y TM>1%
Note: Share of sovereign bonds held by hedge funds i n 4Q17. AIFs managedand/or marketed by authorised EU AIFMs. Data for 24 EEA countries.Sov=Sovereign bonds, TM=Time to Maturity.
Sources: AIFMD database, National Competent Authorities, ESMA
0%
5%
10%
15%
20%
3Q17 4Q17 4Q17
(including UK)
Hu
nd
red
s
CIUs by the AIFM CIUs by others ETF by the AIFM
ETF by others MMFs by the AIFM MMFs by othersNote: Collec tive investment undertakings exposure of hedge funds , AIFs reportedquarterly, in % of NAV. AIFs managed and/or marketed by authorised EU AIFMs.CIUs=Collective Investment Undertakings. D ata for 24 EEA countries; UK data
available only in 4Q17.Sources: AIFMD database, National Competent Authorities, ESMA.
CIUs by the AIFM21%
CIUs by others
23%
ETF by others10%
M M Fs by the AIFM
5%
M M Fs by others
41%
Note: Share of collective investment undertakings held by hedge funds in 4Q17.AIFs managed and/or marketed by authorised EU AIFMs. CIUs=CollectiveInvestment Undertakings. Data for 24 EEA countries.
Sources: AIFMD database, National Competent Authorities, ESMA

ESMA Annual Statistical Report on EU Alternative Investment Funds 2019 74
ASRD-S.157 ASRD-S.158 Structured products Structured products in 4Q17
ASRD-S.159 ASRD-S.160
Corporate bond quality Corporate bonds in 4Q17
0%
4%
8%
12%
3Q17 4Q17 4Q17
(includ ing UK)
Hu
nd
red
s
ABCP ABS Agency MBSCDO/CLO CMBS ETPOther RMBS Structured cer tificate
Note: Str uctured and securitised products exposure of hedge funds, AIFs reportedquarterly, in % of NAV. AIFs managed and/or markted by authorised EU AIFMs.Data for 24 EEA countries; UK data available only in 4Q17.
Sources: AIFMD database, National Competent Authorities, ESMA.
ABS10%
Agency M BS
59%
CDO/CLO5%
CM BS1%
ETP1%
Other21%
RM BS3%
Structured certificate
>1%
Note: Share of structur ed and securitised pr oduc ts hel d by hedge funds in 4Q17.EU and non-EU AIFs by authorised EU AIFMs marketed, respectively , w/ and w/opassport.
Sources: AIFMD database, National Competent Authorities, ESMA
0%
10%
20%
30%
3Q17 4Q17 4Q17
(including UK)
Hu
nd
red
s
IG by fin . inst. IG by non-fin. inst.Non-IG by fin. inst. Non-IG by non-fin . inst.
Note: Corporate bonds exposure of hedge funds, AIFs reported quarterly, in % ofNAV. AIFs managed and/or marketed by authorised EU AIFMs. Data for 24 EEAcountries; UK data available only in 4Q17.
Sources: AIFMD database, National Competent Authorities, ESMA.
IG by fin. inst.
29%
Non-IG by fin. inst.
17%
IG by non-fin. inst.
28%
Non-IG by non-fin. inst.
26%
Note: Shar e of corporate bonds hel d by hedge funds i n 4Q17. AIFs m anagedand/or marketed by authorised EU AIFMs. Data for 24 EEA countries.Sources: AIFMD database, National Competent Authorities, ESMA

ESMA Annual Statistical Report on EU Alternative Investment Funds 2019 75
Private Equity Funds
AIF characteristics
ASRD-S.161 ASRD-S.162 AIFMD passport EU and non-EU AIFs
ASRD-S.163 ASRD-S.164 Market concentration Investment strategies by NAV
ASRD-S.165 ASRD-S.166 Investment regions by NAV Investor type
EU passport71%
EU w /o passport24%
Non-EU w /o passport3%
Non-EU not
marketed in EU 2%
Note: NAV of private equity funds by manager's access to AIFMD passport, end of2017, in %. Authorised EU AIFMs with access to AIFMD passport, subthresholdmanagers registered only i n national juridisdicti ons w/o passport. Data for 24 EEA
countriesSources: AIFMD database, National Competent Authorities, ESMA.
0%
25%
50%
75%
100%
Growth
Capital
Mezzanine
Capital
Multi-
strategy
Other PE Venture
Capital
EU Non-EUNote: Share of EU and non-EU private equity funds managed and/or marketedby authorised EU AIFMs and sub-threshold managers register ed only innational jurisdictions, end of 2017, in % of NAV. Non-EU AIFs marketed w/o
passport. PE=Private equity fund. Data for 24 EEA countries.Sources: AIFMD database, National competent Authorities, ESMA.
0
25
50
75
100
top 10 top 20 top 50 top 100 top 500 top 1,000
Market concentrationNote: Market concentration of the largest 10-to-1,000 private equity fundsmanaged and/or marketed by authorised EU AIFMs accessi ng AIFMD passportand sub-threshol d managers registered only in national jurisdictions , end of 2017,
in % of NAV. Data for 24 EEA countries.Sources: AIFMD database, National Competent Authorities, ESMA.
Grow th Capital
30%
M ezzanine Capital
4%
Other priv ate
equity52%
Venture Capital
14%
Note: Investment strategi es of private equity funds , end of 2017, in % of NAV.Private equity funds managed and/or marketed by authorised EU AIFMs and sub-threshold managers registered only i n nati onal jurisdicti ons. Data for 24 EEA
countries.Sources: AIFMD database, National Competent Authorities, ESMA.
Asia2%
EEA77%
Other Europe8%
North America9%
Supra National1%
Rest3%
Note: Regi onal inves tment focus of private equity funds managed and/or marketedby authorised EU AIFMs and sub-threshold managers registered only in nationaljurisdictions, end of 2017, in % of NAV. Geo-focus determined according to the
domicile of investments, and the supranational category i ncludi ng i nvestmentswithout a predominant geo-focus. Data for 24 EEA countries.Sources: AIFMD database, National Competent Authorities, ESMA.
0% 20% 40% 60% 80% 100%
Venture Capital
Other PE
Multi-strategy PE
Mezzanine Capital
Growth Capita l
Retail investors Professional investors
Note: Clients of private equity funds managed and/or marketed by authorised EUAIFMs and sub-threshold managers registered only in national jurisdicti ons, end of2017, in % of NAV. PE = Private equity fund. Data for 24 EEA countries.
Sources: AIFMD database, National Competent Authorities, ESMA.

ESMA Annual Statistical Report on EU Alternative Investment Funds 2019 76
Liquidity and counterparty risk profile
ASRD-S.167 ASRD-S.168 Ownership of PE funds Top five beneficial owners
ASRD-S.169 ASRD-S.170 Growth capital: liquidity profile Mezzanine capital: liquidity profile
ASRD-S.171 ASRD-S.172 Other PE funds: liquidity profile Venture capital: liquidity profile
ASRD-S.173 ASRD-S.174 Multi-strategy PE funds: liquidity profile Redemption frequency
0% 20% 40% 60% 80% 100%
Venture Capital
Other PE
Multi-strategy PE
Mezzanine Capital
Growth Capita l
Banks General government HouseholdInsurances Non-profit NoneOther CIUs Oth. fin. institu tions Pension fundsUnknown
Note: Ownershi p of units in private equity funds managed and/or marketed byauthorised EU AIFMs, end of 2017, in % of NAV. PE=Private equi ty fund. Data for24 EEA countries.
Sources: AIFMD database, National Competent Authorities, ESMA.
0%
25%
50%
75%
100%
Growth
capitalMezzanine
capitalMulti-
strategy
PEQF
Other
PEQFVenture
capital
EU passport EU w/o passport Non-EU w/o passport
Note: Inves tor concentration of private equity funds managed and/or marketed byauthorised EU AIFMs, end of 2017, i n % of NAV. Inves tor concentrati on computedas share of AIF equi ty beneficially owned by the 5 l argest inves tors. PE=Private
equity fund. Data for 24 EEA countries.Sources: AIFMD database, National Competent Authorities, ESMA.
0% 0% 1% 1% 1%6%
100%
0%
25%
50%
75%
100%
2-7 d 8-30 d 31-90 d 91-180 d 181-365
d
> 365 d > 365
days
Investor Por tfolioNote: Portfolio and i nvestor liquidity profil es of funds of growth capital fundsmanaged and/or marketed by authorised EU AIFMs, end of 2017. Portfolio profiledetermined by percentage of the funds’ portfolios capable of being liquidated within
each speci fied period, i nvestor liquidity profil e depend on shortest period withi n eachfund could be withdraw n or investors coul d receive redemption paym ents. d= Days.Data for 24 EEA countries.Sources: AIFMD database, National Competent Authorities, ESMA.
1% 1% 1% 2% 2% 6%5%
5% 5% 5% 10%11%
100%
0%
25%
50%
75%
100%
2-7 d 8-30 d 31-90 d 91-180 d 181-365
d
> 365 d > 365
daysInvestor Por tfolio
Note: Portfolio and i nvestor liqui dity profiles of mezzanine capital funds managedand/or marketed by authorised EU AIFMs, end of 2017. Portfolio profile determinedby percentage of the funds’ portfolios capable of being liquidated within each
specified period, investor li quidity profil e depend on shortest period within each fundcould be withdrawn or i nvestors could r eceive redemption payments. d= D ays. D atafor 24 EEA countries.Sources: AIFMD database, National Competent Authorities, ESMA.
5% 6% 7% 8%
8% 9%3% 5% 5% 6%
13%19%
100%
0%
25%
50%
75%
100%
2-7 d 8-30 d 31-90 d 91-180 d 181-365
d> 365 d > 365
days
Investor Por tfolioNote: Portfolio and investor liquidi ty pr ofiles of private equity funds pursuingstrategi es classified as "other" managed and/or marketed by authorised EU AIFMs,end of 2017. Portfoli o profile determined by percentage of the funds’ portfolios
capable of being liquidated within each specifi ed period, inves tor liquidity profiledepend on shortest period within each fund coul d be withdraw n or investors couldreceive redemption payments. d= Days. Data for 24 EEA countries.Sources: AIFMD database, National Competent Authorities, ESMA.
1% 1% 1% 1% 1%9%5% 7% 7% 8% 8%
100%
0%
25%
50%
75%
100%
2-7 d 8-30 d 31-90 d 91-180 d 181-365
d
> 365 d > 365
days
Investor Portfolio
Note: Portfolio and investor liqui dity profiles of ventur e capital funds managed and/ormarketed by authorised EU AIFMs, end of 2017. Portfolio profile determined bypercentage of the funds’ portfolios capable of being liquidated within each specifi ed
period, investor liquidity profile depend on shortest period within each fund could bewithdrawn or investors coul d receive redemption payments . d= D ays. D ata for 24EEA countries.Sources: AIFMD database, National Competent Authorities, ESMA.
6% 6%15%
100%
14% 15%19%
55%
100%
0%
25%
50%
75%
100%
2-7 d 8-30 d 31-90 d 91-180 d 181-365
d> 365 d > 365
days
Investor PortfolioNote: Portfolio and investor liquidity profiles of multi-strategy private equity fundsfunds managed and/or marketed by authorised EU AIFMs, end of 2017. Portfolioprofile determined by percentage of the funds’ portfolios capable of being liqui dated
within each specifi ed period, investor liquidity profile depend on shortest periodwithin each fund could be withdrawn or investors could receive redempti onpayments. d= Days. Data for 24 EEA countries.Sources: AIFMD database, National Competent Authorities, ESMA.
0%
25%
50%
75%
100%
Growth
capitalMezzanine
capitalMulti-
strategyOther PE Venture
capital
Daily Weekly
to monthly
Quarterly Quarterly
to yearly
Other
Note: Investor redempti on frequencies allowed by open-end private equityfunds managed and/or marketed by authorised EU AIFMs, end of 2017, i n % ofNAV. EU and non-EU AIFs by authorised EU AIFMs marketed, respectively, w/
and w/o passport. PEQF=Private Equity Fund. Data for 24 EEA countries.Sources: AIFMD database, National Competent Authorities, ESMA.

ESMA Annual Statistical Report on EU Alternative Investment Funds 2019 77
ASRD-S.175 ASRD-S.176 Redemption rights to investors Liquidity financing
ASRD-S.177 ASRD-S.178 Securities trading Derivatives trading
ASRD-S.179 ASRD-S.180 Repo trades clearing Derivatives transactions clearing
0%
25%
50%
75%
100%
Growth
Capital
Mezzanine
Capital
Multi-
stra tegy
Other PE Venture
Capital
Open-end Closed-endNote: Redemption rights provi ded in the ordi nary course to i nvestors in privateequity funds managed and/or marketed by authorised EU AIFMs, end of 2017, in %of NAV. PE=Private equity fund.Data for 24 EEA countries.
Sources: AIFMD database, National Competent Authorities, ESMA.
0
96% 1
5%
65%66%
100%
0%
25%
50%
75%
100%
1 day 2-7 d 8-30 d 31-90 d 91-180 d 181-365
d
> 365 d
Growth Capita l Mezzanine CapitalVenture Capital
Note: Li quidity financi ng of private equity funds managed and/or marketed byauthorised EU AIFMs, end of 2017. Aggregate amount of borrowing and cashfinanci ng divided depending on longest period for which creditors are contrac tually
committed to provide such financi ng, Borrowing and cash financing incl ude drawnand undrawn, committed and uncommitted lines of credit as well as any termfinancing. Data for 24 EEA countries.Sources: AIFMD database, National Competent Authorities, ESMA.
0% 20% 40% 60% 80% 100%
Venture Capital
Other PEQF
Multi-strategy
PEQF
Mezzanine Capital
Growth Capita l
Regulated market OTCNote: Estimated market value of securities traded on OTC and regulated exchangemarkets by private equity funds managed and/or marketed by authorised EUAIFMs, in %. PE=Private equity fund. Data for 24 EEA countries.
Sources: AIFMD database, National Competent Authorities, ESMA.
0% 20% 40% 60% 80% 100%
Venture Capital
Other PE
Multi-strategy PE
Mezzanine Capital
Growth Capita l
Regulated market OTC
Note: Estimated vol ume of derivatives traded on OTC and regulated exchangemarkets by private equity funds managed and/or marketed by authorised EUAIFMs, in %. PE=Private equity fund. Data for 24 EEA countries.
Sources: AIFMD database, National Competent Authorities, ESMA.
0% 20% 40% 60% 80% 100%
Venture capital
Other PEQF
Multistrategy
Mezzanine capita l
CCP Tri-par ty Bila teral
Note: Estimated market value of repo trades cleared by private equity fundsmanaged and/or marketed by authorised EU AIFMs, in %. PE=Private equity fund.Data for 24 EEA countries.
Sources: AIFMD database, National Competent Authorities, ESMA.
0% 20% 40% 60% 80% 100%
Venture capital
Other PE
Multistrategy
Mezzanine capita l
Growth capita l
CCP BilateralNote: Estimated volume of derivatives cleared bilaterally and via CCP by privateequity funds managed and/or m arketed by authorised EU AIFMs, in %.PEQF=Private equity fund. Data for 24 EEA countries.
Sources: AIFMD database, National Competent Authorities, ESMA.

ESMA Annual Statistical Report on EU Alternative Investment Funds 2019 78
Leverage and exposure
ASRD-S.181 ASRD-S.182 AuM/NAV Adjusted gross leverage
ASRD-S.183 ASRD-S.184 Borrowing embedded in financial instruments Unencumbered cash
ASRD-S.185 ASRD-S.186 Financial leverage Financial leverage composition
ASRD-S.187 ASRD-S.188 Total exposures Decomposition of exposures
0%
35%
70%
105%
140%
Growth
capital
Mezzanine
capital
Multi-
strategy
Other PE Venture
capital
Leverage (AuM/NAV)Note: Leverage of private equity funds managed and/or marketed by authorised EUAIFMs and sub-threshold managers registered only in national jurisdicti ons, end of2017, in % of NAV. Leverage computed as AuM/NAV rati o. PE=Private equity
funds. Data for 24 EEA countries.Sources: AIFMD database, National competent authorities, ESMA.
0%
35%
70%
105%
140%
Growth
capitalMezzanine
capitalMulti-
strategyOther PE Venture
capital
Adjusted gross leverage
Note: Adj usted gross l everage of private equity funds m anaged and/or marketed byauthorised EU AIFMs, end of 2017, in % of NAV. Adj usted gr oss lever age computedas total exposure less IRDs with respect to NAV. PE=Private equity fund. Data for
24 EEA countries.Sources: AIFMD database, National competent authorities, ESMA.
0%
8%
16%
24%
Growth Capita l Mezzanine Capital Other PE
Cash and securities OTC Exchange-traded
Note: Borrowing of cash and securities or embedded in derivatives by privateequity funds, end of 2017, in % of total exposure. AIFs managed and/or marketedby authorised EU AIFMs marketed. OTC and exchange-traded deriatives net of
margins. PE=Private equity fund. Data for 24 EEA countries.Sources: AIFMD database, National Competent Authorities, ESMA.
0%
3%
5%
8%
10%
Growth
capitalMezzanine
capitalMulti-
strategy
PE
Other
PEVenture
Capital
Unencumbered cash
Note: U nencumbered cash held by private equity funds, end of 2017, in % ofNAV. EU and non-EU AIFs by authorised EU AIFMs marketed, respectively, w/and w/o passport. PE=Private equity fund. Data for 24 EEA countries.
Sources: AIFMD database, National Competent Authorities, ESMA.
0%
20%
40%
60%
80%
Unsecuredborrowing
Secured viaPB
Reverserepo
Secured viaother
Securitiesborrowed for
shorting
Note: C ash and securities borrowed by hedge funds, end of 2017, in % of NAV. EUand non-EU AIFs by authorised EU AIFMs marketed, respectively, w/ and w/opassport. F oF=Funds of funds, None=No predominant type. D ata for 24 EEA
countries.Sources: AIFMD database, National Competent Authorities, ESMA.
0%
25%
50%
75%
100%
Growth
capitalMezzanine
capitalMulti-
strategy PEOther PE Venture
Capital
Securi ties borrowed for shorting Secured via other
Reverse repo Secured via PB
Unsecured borrowingNote: Share cash and securities borrowed by private equity funds, end of 2017, in% of NAV. EU and non-EU AIFs by authorised EU AIFMs marketed, respectively,w/ and w/o passport. PE=Private equity fund. Data for 24 EEA countries.
Sources: AIFMD database, National Competent Authorities, ESMA.
0
20
40
60
3Q17 4Q17 4Q17 (including UK)
Other PE Mezzanine Capital Venture Capital
Multi-strategy Growth Capita lNote: Exposure of private equity funds managed and/or marketed by authorised EUAIFMs, funds quarterly reported, EUR tn. EU and non-EU AIFs by authorised EUAIFMs marketed, respectively, w/ and w/o passport. PE=Private equity fund. Data
for 24 EEA countries; UK data available only in 4Q17.Sources: AIFMD database, National Competent Authorities, ESMA.
0%
25%
50%
75%
100%
Growth
capitalMezzanine
capitalMulti-
strategy
PE
Other
PEVenture
Capital
Securi ties CIUs Physical assetsIRDs FX CDSOther derivatives
Note: Share of exposures by private equity funds' investment strategies , end of2017, i n % of total. AIFs manged and/or marketed by authorised EU AIFMs.PE=Private equity fund. Data for 24 EEA countries.
Sources: AIFMD database, National Competent Authorities, ESMA.

ESMA Annual Statistical Report on EU Alternative Investment Funds 2019 79
ASRD-S.189 ASRD-S.190 Cash and cash equivalents Cash and cash equivalents in 4Q17
ASRD-S.191 ASRD-S.192 Equities Equities in 4Q17
ASRD-S.193 ASRD-S.194 Sovereign bonds Sovereign bonds in 4Q17
ASRD-S.195 ASRD-S.196 Collective investment undertakings Collective investment undertakings in 4Q17
0%
2%
4%
6%
8%
3Q17 4Q17 4Q17
(including UK)
Hu
nd
red
s
Certificates of deposit Commercial papers
Other cash equiva lent Other deposits
Note: Cash and cash equivalents exposure of private equity funds, AIFs reportedquarterly, in % of NAV. Government bonds excl uded from other cash equivalents.Data for 24 EEA countries; UK data available only in 4Q17.
Sources: AIFMD database, National Competent Authorities, ESMA.
Other cash equiv alent89%
Other deposits
11%
Note: Shar e of cash and cash equival ents hel d by private equity funds in 4Q17.AIFs managed and/or marketed by authorised EU AIFMs. Data for 24 EEAcountries.
Sources: AIFMD database, National Competent Authorities, ESMA
0%
20%
40%
60%
80%
3Q17 4Q17 4Q17
(including UK)
Hu
nd
red
s
Listed financial inst. Other listed Unlisted
Note: Private equity funds' exposur e to equity, AIFs reported quarterly, in % ofNAV. AIFs managed and/or marketed by authorised EU AIFMs. Data for 24 EEAcountries; UK data available only in 4Q17.
Sources: AIFMD database, National Competent Authorities, ESMA.
Other listed9%
Unlisted91%
Note: Shar e of equities hel d by private equity funds in 4Q17. AIFs managed and/ormarketed by authorised EU AIFMs. Data for 24 EEA countries.Sources: AIFMD database, National Competent Authorities, ESMA
0.0%
0.1%
0.2%
3Q17 4Q17 4Q17
(including UK)
EU Sov >1Y TM EU Sov up 1Y TMG10 Sov >1Y TM G10 Sov up 1Y TM
Non-G10 Sov >1Y TM Non-G10 Sov up 1Y TMNote: Sover eign bonds exposure exposure of private equity funds , AIFs reportedquarterly, in % of NAV. AIFs managed and/or marketed by authorised EU AIFMs.Sov=Sovereign bonds, TM=Time to Maturity. Data for 24 EEA countries ; UK data
available only in 4Q17.Sources: AIFMD database, National Competent Authorities, ESMA.
EU Sov >1Y TM
11%
EU Sov up 1Y TM
25%
G10 Sov >1Y TM
64%
Note: Share of sovereign bonds held by private equity funds i n 4Q17. AIFsmanaged and/or marketed by authorised EU AIFMs. Data for 24 EEA countries.Sov=Sovereign bonds, TM=Time to Maturity.
Sources: AIFMD database, National Competent Authorities, ESMA
0%
3%
5%
8%
10%
3Q17 4Q17 4Q17
(includ ing UK)
Hu
nd
red
s
CIUs by the AIFM CIUs by others ETF by the AIFM
ETF by others MMFs by the AIFM MMFs by othersNote: Collec tive investment undertakings exposure of private equity funds, AIFsreported quarterly, in % of NAV. AIFs managed and/or marketed by authorised EUAIFMs. CIUs=Collective Inves tment Undertakings. Data for 24 EEA countries; UK
data available only in 4Q17.Sources: AIFMD database, National Competent Authorities, ESMA.
CIUs by the AIFM
13%
CIUs by others
70%
ETF by the AIFM
7%
M M Fs by others
10%
Note: Share of collective investment undertakings held by private equi ty funds in4Q17. AIFs managed and/or marketed by authorised EU AIFMs. CIUs=CollectiveInvestment Undertakings.Data for 24 EEA countries.
Sources: AIFMD database, National Competent Authorities, ESMA

ESMA Annual Statistical Report on EU Alternative Investment Funds 2019 80
ASRD-S.197 ASRD-S.198 Structured products in 4Q17 Structured products in 4Q17
ASRD-S.199 ASRD-S.200
Corporate bond quality Corporate bonds in 4Q17
0.0%
0.2%
0.3%
0.5%
0.6%
3Q17 4Q17 4Q17
(including UK)
Hu
nd
red
s
ABCP ABS Agency MBSCDO/CLO CMBS ETPOther RMBS Structured cer tificate
Note: Structured and securitised products exposure of private equity funds, AIFsreported quarterly, i n % of NAV. AIFs m anaged and/or marketed by authorised EUAIFMs. Data for 24 EEA countries; UK data available only in 4Q17.
Sources: AIFMD database, National Competent Authorities, ESMA.
Other4%
RM BS96%
Note: Share of struc tured and securitised products hel d by private equity funds in4Q17. AIFs managed and/or m arketed by authorised EU AIFMs. Data for 24 EEAcountries.
Sources: AIFMD database, National Competent Authorities, ESMA
0.0%
0.3%
0.6%
0.9%
1.2%
3Q17 4Q17 4Q17
(including UK)
Hu
nd
red
s
IG by fin . inst. IG by non-fin. inst.
Non-IG by fin. inst. Non-IG by non- fin . inst.
Note: Corporate bonds exposur e of private equity funds, AIFs r eported quarterly, i n% of NAV. AIFs managed and/or marketed by authorised EU AIFMs. Data for 24EEA countries; UK data available only in 4Q17.
Sources: AIFMD database, National Competent Authorities, ESMA.
IG by fin. inst.
4%Non-IG by
fin. inst.
3%
Non-IG by non-fin. inst.
93%
Note: Shar e of corporate bonds held by private equity funds in 4Q17. AIFsmanaged and/or marketed by authorised EU AIFMs marketed, r espectively, w/ andw/o passport. Data for 24 EEA countries.
Sources: AIFMD database, National Competent Authorities, ESMA

ESMA Annual Statistical Report on EU Alternative Investment Funds 2019 81
Other AIFs
AIF characteristics
ASRD-S.201 ASRD-S.202 AIFMD passport EU and non-EU AIFs
ASRD-S.203 ASRD-S.204 Market concentration Investment strategy by NAV
ASRD-S.205 ASRD-S.206 Investment regions by NAV Investor type
EU passport77%
EU w /o passport19%
Non-EU w /o passport1%
Non-EU not marketed in EU 3%
Note: N AV of AIFs classifi ed as Other by manager's access to AIFMD passport, endof 2017, in %. Authorised EU AIFMs with access to AIFMD passport or marketi ngnon-EU AIFs w/o passport, sub-threshold m anagers registered only in national
juridisdictions w/o passporting rights. Data for 24 EEA countries.Sources: AIFMD database, National Competent Authorities, ESMA.
0%
25%
50%
75%
100%
Commodity Equity Fixedincome
Infrastructure Other
EU Non-EUNote: Share of EU and non-EU AIFs classified as Other managed and/ormarketed by authorised EU AIFMs and sub-threshold managers registered onlyin national jurisdictions, end of 2017, in % of NAV. Non-EU AIFs marketed w/o
passport. Data for 24 EEA countries.Sources: AIFMD database, National competent Authorities, ESMA.
0
25
50
75
100
top 10 top 20 top 50 top 100 top 500 top 1,000
Market concentrationNote: Market concentration of the largest 10-to-1,000 private equity fundsmanaged and/or marketed by authorised EU AIFMs accessi ng AIFMD passportand sub-threshol d managers registered only in national jurisdictions , end of 2017,
in % of NAV. Data for 24 EEA countries.Sources: AIFMD database, National Competent Authorities, ESMA.
Commodity1%
Equity29%
Fixed income
41%
Infrastructure2%
Other27%
Note: Investment s trategies of AIFs classifi ed as Other, end of 2017, in % of NAV.AIFs managed and/or marketed by full scope EU AIFMs and sub-threshol dmanagers registered only in national jurisdictions. Data for 24 EEA countries.
Sources: National Competent Authorities, ESMA.
Asia8%
EEA59%Other Europe
5%
North America18%
Supra National6%
Rest4%
Note: Regional investment focus of EU AIFs cl assified as Other managed and/ormarketed by authorised EU AIFMs and sub-threshold managers registered only innational jurisdictions, end of 2017, in % of NAV. Geo-focus determined accordi ng
to the domicile of inves tments and the supranational category includi nginvestments without a predominant geo-focus. Data for 24 EEA countries.Sources: AIFMD database, National Competent Authorities, ESMA.
0% 20% 40% 60% 80% 100%
Other
Infrastructure
Fixed income
Equity
Commodity
Retail investors Professional investors
Note: Clients of AIFs classifi ed as Other AIFs managed and/or marketed byauthorised EU AIFMs and sub-threshold managers registered only in nationaljurisdictions, end of 2017, in % of NAV. Data for 24 EEA countries.
Sources: AIFMD databse, National Competent Authorities, ESMA.

ESMA Annual Statistical Report on EU Alternative Investment Funds 2019 82
Liquidity and counterparty risk profile
ASRD-S.207 ASRD-S.208 Ownership of Other AIFs Top five beneficial owners
ASRD-S.209 ASRD-S.210 Commodity: liquidity profile Equity: liquidity profile
ASRD-S.211 ASRD-S.212 Fixed income: liquidity profile Infrastructure: liquidity profile
ASRD-S.213 ASRD-S.214 Other: liquidity profile Redemption frequencies
0% 20% 40% 60% 80% 100%
Other
Infrastructure
Fixed income
Equity
Commodity
Banks General gov. Households
Insurances Non-profit None
Oth. CIUs Oth. fin. institu tions Pension funds
UnknownNote: Ow nershi p of units in AIFs classified as Other AIFs managed and/or marketedby authorised EU AIFMs, end of 2017, in % of NAV. CIUs=Collective investmentundertakings. Data for 24 EEA countries.
Sources: AIFMD database, National Competent Authorities, ESMA.
0%
25%
50%
75%
100%
Commodity Equity Fixed
incomeInfra-
structureOther fund
EU passport EU w/o passport Non-EU w/o passport
Note: Investor concentration of AIFs classified as Other managed and/or m arketedby authorised EU AIFMs, end of 2017, in % of NAV. Investor concentrationcomputed as share of AIF equity beneficially owned by the 5 largest i nvestors. Data
for 24 EEA countries..Sources: AIFMD database, National Competent Authorities, ESMA.
37%
99%
72%
86%92% 95% 95% 95%
100%
0%
25%
50%
75%
100%
1 day or
less
2-7 d 8-30 d 31-90 d 91-180 d 181-365
d
> 365 d
Investor Por tfolio
Note: Portfolio and investor liquidity profil es of funds of commodity funds managedand/or marketed by authorised EU AIFMs, end of 2017. Portfolio profile determinedby percentage of the funds’ portfolios capable of being liquidated withi n each
specified period, inves tor liquidity profile depend on shortest period within each fundcould be withdr awn or inves tors could receive redemption payments. d= Days. Datafor 24 EEA countries.Sources: AIFMD database, National Competent Authorities, ESMA.
43%
84%90% 93% 94% 95%
56%
86% 94% 96% 97% 97% 100%
0%
25%
50%
75%
100%
1 day or
less
2-7 d 8-30 d 31-90 d 91-180 d 181-365
d
> 365 d
Investor Por tfolio
Note: Portfolio and i nvestor liquidity profiles of equity funds managed and/ormarketed by authorised EU AIFMs, end of 2017. Portfolio profile determined bypercentage of the funds’ portfolios capable of being liquidated withi n each specified
period, investor liquidity profile depend on shortes t period within each fund could bewithdrawn or inves tors could r eceive r edem ption payments . d= D ays. Data for 24EEA countries.Sources: AIFMD database, National Competent Authorities, ESMA..
44%
80%86% 91%
95%96%
41%
79%
90% 94% 96% 96% 100%
0%
25%
50%
75%
100%
1 day or
less
2-7 d 8-30 d 31-90 d 91-180 d 181-365
d
> 365 d
Investor Por tfolio
Note: Portfolio and investor liqui dity profiles of fixed income funds managed and/ormarketed by authorised EU AIFMs, end of 2017. Portfolio profile determined bypercentage of the funds’ portfolios capable of being liquidated withi n each specified
period, investor liquidity profile depend on shortes t period within each fund could bewithdrawn or inves tors could r eceive r edem ption payments . d= D ays. Data for 24EEA countries.Sources: AIFMD database, National Competent Authorities, ESMA.
9% 9% 9%9% 11% 13%
7% 8% 8%9%
15% 28%
100%
0%
25%
50%
75%
100%
1 day or
less
2-7 d 8-30 d 31-90 d 91-180 d 181-365
d
> 365 d
Investor Portfolio
Note: Portfolio and inves tor liquidity profil es of funds of infras tractur e fundsmanaged and/or marketed by authorised EU AIFMs, end of 2017. Portfolio profiledetermined by percentage of the funds’ portfoli os capable of being liquidated withi n
each specifi ed period, inves tor liqui dity profil e depend on shortest period withi neach fund coul d be withdrawn or inves tors coul d receive redempti on payments. d=Days. Data for 24 EEA countries.Sources: AIFMD database, National Competent Authorities, ESMA.
47%
82%86%
89%
91% 93%
35%
72%
90% 91% 93%100%
0%
25%
50%
75%
100%
1 day or
less
2-7 d 8-30 d 31-90 d 91-180 d 181-365
d
> 365 d
Investor Por tfolio
Note: Portfolio and i nvestor liqui dity profiles of AIFs cl assified as Other and pursuing"other" s trategies managed and/or marketed by authorised EU AIFMs, end of 2017.Portfolio profile determined by percentage of the funds’ portfolios capabl e of being
liquidated withi n each specified period, inves tor liquidity profile depend on shortes tperiod within each fund could be withdrawn or investors coul d receive redemptionpayments. d= Days. Data for 24 EEA countries.Sources: AIFMD database, National Competent Authorities, ESMA.
0%
25%
50%
75%
100%
Commodity Equity Fixed
income
Infra-
structure
Other
fundsDaily Weekly
to monthly
Quarterly Quarterly
to yearly
Other
Note: Investor redemption fr equenci es allowed by open-end AIFs classified asOthe rmanaged and/or marketed by authorised EU AIFMs, end of 2017, i n % ofNAV. EU and non-EU AIFs by authorised EU AIFMs marketed, respectively, w/
and w/o passport. Data for 24 EEA countries.Sources: AIFMD database, National Competent Authorities, ESMA.

ESMA Annual Statistical Report on EU Alternative Investment Funds 2019 83
ASRD-S.215 ASRD-S.216 Redemption rights to investors Liquidity financing
ASRD-S.217 ASRD-S.218 Securities trading Derivatives trading
ASRD-S.219 ASRD-S.220 Repo trades clearing Derivative transactions clearing
Leverage and exposure
ASRD-S.221 ASRD-S.222 AuM/NAV Adjusted gross leverage
0%
25%
50%
75%
100%
Commodity Equity Fixed
income
Infrastructure Other
fundsOpen-end Closed-end
Note: Redempti on rights provi ded in the or dinary course to inves tors in AIFsclassified as Other managed and/or marketed by authorised EU AIFMs, end of2017, in % of NAV. Data for 24 EEA countries.
Sources: AIFMD database, National Competent Authorities, ESMA.
100%
27%
100%
2%
51%55%
100%
11%
100%
0%
25%
50%
75%
100%
1 day 2-7 d 8-30 d 31-90 d 91-180 d 181-365
d> 365 d
Commodity Equity Fixed income
Infrastructure Other
Note: Liqui dity financing of AIFs classified as Other managed and/or marketed byauthorised EU AIFMs, end of 2017. Aggregate amount of borrowing and cashfinanci ng divided depending on longest period for which creditors are contractually
committed to provide such financing, Borrowing and cash financing include draw nand undrawn, committed and uncommitted lines of credit as well as any termfinancing. Data for 24 EEA countries.Sources: AIFMD database, National Competent Authorities, ESMA.
0% 20% 40% 60% 80% 100%
Other
Infrastructure
Fixed income
Equity
Commodity
Regulated market OTC
Note: Estimated market value of securities traded on OTC and regulated exchangemarkets by AIFs classified as Other managed and/or marketed by authorised EUAIFMs, in %. Data for 24 EEA countries.
Sources: AIFMD database, National Competent Authorities, ESMA.
0% 20% 40% 60% 80% 100%
Other
Infrastructure
Fixed income
Equity
Commodity
Regulated market OTCNote: Estimated volume of derivatives traded on OTC and regulated exchangemarkets by AIFs classifi ed as Other managed and/or marketed by authorised EUAIFMs, in %. Data for 24 EEA countries.
Sources: AIFMD database, National Competent Authorities, ESMA.
0% 20% 40% 60% 80% 100%
Other funds
Fixed income
Equity
Commodity
CCP Tri-par ty Bila teralNote: Estimated market value of repo trades cl eared by AIFs classifi ed as Othermanaged and/or marketed by authorised EU AIFMs, in %. Data for 24 EEAcountries.
Sources: AIFMD database, National Competent Authorities, ESMA.
0% 20% 40% 60% 80% 100%
Other funds
Infrastructure
Fixed income
Equity
Commodity
CCP BilateralNote: Es timated volume of derivatives cleared bilaterally and via CCP by AIFsclassified as Other managed and/or marketed by authorised EU AIFMs, in %. Datafor 24 EEA countries.
Sources: AIFMD database, National Competent Authorities, ESMA.
0%
40%
80%
120%
160%
Commodity Equity Fixed
income
Infra-
structure
Other
funds
Leverage (AuM/NAV)Note: Lever age of AIFs classified as Other managed and/or marketed byauthorised EU AIFMs and sub-threshold managers registered only i n nati onaljurisdictions, end of 2017, in % of N AV. Leverage computed as AuM/NAV r atio.
Data for 24 EEA countries.Sources: AIFMD database, National competent authorities, ESMA.
0%
50%
100%
150%
200%
Commodity Equity Fixed
incomeInfra-
structureOther funds
Adjusted gross leverage
Note: Adjus ted gross leverage of funds classifi ed as Other managed and/ormarketed by authorised EU AIFMs, end of 2017, i n % of NAV. Adjusted gr ossleverage computed as total exposure less IRDs with respect to NAV. Data for 24
EEA countries.Sources: AIFMD database, National competent authorities, ESMA.

ESMA Annual Statistical Report on EU Alternative Investment Funds 2019 84
ASRD-S.223 ASRD-S.224 Borrowing embedded in financial instruments Unencumbered cash
ASRD-S.225 ASRD-S.226 Financial leverage Financial leverage composition
ASRD-S.227 ASRD-S.228 Total exposures Decomposition of exposures
ASRD-S.229 ASRD-S.230 Cash and cash equivalents Cash and cash equivalents in 4Q17
0%
8%
16%
24%
Commodity Equity Fixed
income
Infra-
structure
Other
Cash and securities OTC Exchange-traded
Note: Borrowing of cash and securities or embedded in derivatives by AIFsclassified as Other, end of 2017, in % of total exposure. AIFs managed and/ormarketed by authorised EU AIFMs. OTC and exchange-traded deriatives net of
margins. Data for 24 EEA countries.Sources: AIFMD database, National Competent Authorities, ESMA
0%
7%
14%
21%
28%
Commodity Equity Fixed
income
Infra-
structure
Other
funds
Unencumbered cash
Note: U nencumber ed cash hel d by AIFs cl assified as Other, end of 2017, in % ofNAV. EU and non-EU AIFs by authorised EU AIFMs marketed, respectively, w/and w/o passport. Data for 24 EEA countries.
Sources: AIFMD database, National Competent Authorities, ESMA.
0.0%
0.5%
1.0%
1.5%
2.0%
Unsecured
borrowingSecured via
PBReverse
repoSecured via
otherSecuri ties
borrowed for
shorting
Note: Cash and securities borrowed by AIFs classified as Other, end of 2017, i n %of NAV. EU and non-EU AIFs by authorised EU AIFMs marketed, respectively, w/and w/o passport. Data for 24 EEA countries.
Sources: AIFMD database, National Competent Authorities, ESMA.
0%
25%
50%
75%
100%
Commodity Equity Fixed
incomeInfra-
structureOther
Securi ties borrowed for shor ting Secured via other
Reverse repo Secured via PB
Unsecured borrowingNote: Share cash and securities borrowed by AIFs cl assified as Other, end of 2017,in % of NAV. EU and non-EU AIFs by authorised EU AIFMs marketed, respectively,w/ and w/o passport. Data for 24 EEA countries.
Sources: AIFMD database, National Competent Authorities, ESMA.
0
1
2
3
4
5
3Q17 4Q17 4Q17 (including UK)
Equity Fixed income Infrastructure Other funds Commodity
Note: Exposures of AIFs classified as Other managed and/or marketed byauthorised EU AIFMs, funds quarterly reported, EUR tn. EU and non-EU AIFs byauthorised EU AIFMs marketed, respectively, w/ and w/o passport. Data for 24 EEA
countries; UK data available only in 4Q17.Sources: AIFMD database, National Competent Authorities, ESMA.
0%
25%
50%
75%
100%
Commodity Equity Fixedincome
Infra-structure
Otherfunds
Securi ties CIUs Physical assets
IRDs FX CDS
Other derivativesNote: Share of exposures by inves tment strategi es of AIFs classified as Other, endof 2017, in % of total. AIFs managed and/or marketed by authorised EU AIFMs.Data for 24 EEA countries.
Sources: AIFMD database, National Competent Authorities, ESMA.
0%
3%
6%
9%
3Q17 4Q17 4Q17
(including UK)
Hu
nd
red
s
Certificates of deposit Commercial papers
Other cash equivalent Other depositsNote: C ash and cash equivalents exposur e funds classified as Other, AIFs reportedquarterly, in % of NAV. Governm ent bonds excluded from other cash equivalents.Data for 24 EEA countries; UK data available only in 4Q17.
Sources: AIFMD database, National Competent Authorities, ESMA.
Certificates of deposit
6%Commercial
papers
8%
Other cash equiv alent
62%
Other deposits
24%
Note: Share of cash and cash equival ents held by funds classifi ed as Other i n4Q17. AIFs m anaged and/or marketed by authorised EU AIFMs. Data for 24 EEAcountries.
Sources: AIFMD database, National Competent Authorities, ESMA

ESMA Annual Statistical Report on EU Alternative Investment Funds 2019 85
ASRD-S.231 ASRD-S.232 Equities Equities in 4Q17
ASRD-S.233 ASRD-S.234 Sovereign bonds Sovereign bonds in 4Q17
ASRD-S.235 ASRD-S.236 Collective investment undertakings Collective investment undertakings in 4Q17
ASRD-S.237 ASRD-S.238 Structured products Structured products in 4Q17
0%
7%
14%
21%
28%
35%
3Q17 4Q17 4Q17
(including UK)
Hu
nd
red
s
Listed financial inst. Other listed Unlisted
Note: Exposure to equity of funds cl assified as Other, AIFs reported quarterly, in %of NAV. AIFs managed and/or m arketed by authorised EU AIFMs. Data for 24 EEAcountries; UK data available only in 4Q17.
Sources: AIFMD database, National Competent Authorities, ESMA.
Listed financial
inst.17%
Other listed79%
Unlisted4%
Note: Share of equiti es hel d by funds classified as Other in 4Q17. AIFs managedand/or marketed by authorised EU AIFMs. Data for 24 EEA countries.Sources: AIFMD database, National Competent Authorities, ESMA
0%
6%
12%
18%
24%
30%
3Q17 4Q17 4Q17
(including UK)
EU Sov >1Y TM EU Sov up 1Y TMG10 Sov >1Y TM G10 Sov up 1Y TMNon-G10 Sov >1Y TM Non-G10 Sov up 1Y TM
Note: Sovereign bonds exposure exposure of cl assified as Other, AIFs r eportedquarterly, in % of NAV. AIFs managed and/or marketed by authorised EU AIFMs.Sov=Sovereign bonds, TM=Time to Maturity. Data for 24 EEA countries; UK data
available only in 4Q17.Sources: AIFMD database, National Competent Authorities, ESMA.
EU Sov >1Y TM
73%EU Sov up
1Y TM
5%
G10 Sov >1Y TM
7%
G10 Sov up 1Y TM
1%
Non-G10 Sov >1Y TM
13%
Non-G10 Sov up 1Y TM1%
Note: Share of sovereign bonds held by funds classified as Other in 4Q17. AIFsmanaged and/or marketed by authorised EU AIFMs. D ata for 24 EEA countries.Sov=Sovereign bonds, TM=Time to Maturity.
Sources: AIFMD database, National Competent Authorities, ESMA
0%
5%
10%
15%
20%
3Q17 4Q17 4Q17
(including UK)
Hu
nd
red
s
CIUs by the AIFM CIUs by others ETF by the AIFM
ETF by others MMFs by the AIFM MMFs by othersNote: Collective investm ent undertakings exposure of funds classified as Other,AIFs reported quarterly, in % of NAV. AIFs managed and/or marketed by authorisedEU AIFMs. CIUs=Collective Investment Undertakings. Data for 24 EEA countries;
UK data available only in 4Q17.Sources: AIFMD database, National Competent Authorities, ESMA.
CIUs by the AIFM
33%
CIUs by others48%
ETF by the AIFM
1%
ETF by others
8%
M M Fs by the AIFM
6%
M M Fs by others4%
Note: Share of collective investment undertakings held by funds classified as Otherin 4Q17. AIFs managed and/or m arketed by authorised EU AIFMs.CIUs=Collective Investment Undertakings.Data for 24 EEA countries.
Sources: AIFMD database, National Competent Authorities, ESMA
0.00
0.01
0.02
0.03
3Q17 4Q17 4Q17
(including UK)
Hu
nd
red
s
ABCP ABS Agency MBSCDO/CLO CMBS ETPOther RMBS Structured cer tificate
Note: Struc tured and securitised products exposure of funds classifi ed as Other,AIFs reported quarterly, in % of NAV. AIFs managed and/or marketed by authorisedEU AIFMs. Data for 24 EEA countries; UK data available only in 4Q17.
Sources: AIFMD database, National Competent Authorities, ESMA.
ABS13%
Agency M BS
27%
CDO/CLO17%
CM BS2%
ETP3%
Other23%
RM BS12%
Structured certificate3%
Note: Share of structured and securitised products held by funds classified asOther i n 4Q17. AIFs managed and/or marketed by authorised EU AIFMs. Data for24 EEA countries.
Sources: AIFMD database, National Competent Authorities, ESMA

ESMA Annual Statistical Report on EU Alternative Investment Funds 2019 86
ASRD-S.239 ASRD-S.240 Corporate bond quality: Corporate bonds in 4Q17
0%
7%
14%
21%
28%
3Q17 4Q17 4Q17
(including UK)
Hu
nd
red
s
IG by fin . inst. IG by non-fin. inst.
Non-IG by fin. inst. Non-IG by non- fin . inst.
Note: Corporate bonds exposure of funds classifi ed as Other, AIFs reportedquarterly, in % of NAV. AIFs managed and/or marketed by authorised EU AIFMs.Data for 24 EEA countries; UK data available only in 4Q17.
Sources: AIFMD database, National Competent Authorities, ESMA.
IG by fin. inst.
35%
Non-IG by fin. inst.
4%
IG by non-fin. inst.
50%
Non-IG by non-fin. inst.
11%
Note: Share of corporate bonds held by funds classified as Other in 4Q17. AIFsmanaged and/or marketed by authorised EU AIFMs. Data for 24 EEA countries.Sources: AIFMD database, National Competent Authorities, ESMA

ESMA Annual Statistical Report on EU Alternative Investment Funds 2019 87
Glossary Alternative investment fund (AIF): An AIF is a collective investment undertaking, including investment
compartments of such an undertaking, which raises capital to invest it in accordance with a defined
investment policy for the benefit of investors. An AIF does not include an undertaking that requires
authorisation under the UCITS directive.
Alternative investment fund manager (AIFM): An AIFM is an entity that provides portfolio-
management and risk-management services to one or more AIFs as its regular business, irrespective
of where the AIFs are located or what legal form the AIFM takes.
AIFMD passport: The AIFMD passport allows AIFMs to manage or market AIFs across the EU, on the
basis of a single authorisation in one EU Member State. Currently, only EU-authorised AIFMs managing
or marketing EU-domiciled AIFs have access to the passport.
Assets under management (AuM): Under the AIFMD, assets under management are defined as the
value of all assets in portfolio, including all assets acquired through the use of leverage (borrowing of
cash or securities and leverage embedded in derivative positions). This concept of AuM is different from
the industry approach to AuM, which typically relates to the assets of the balance sheet of the AIF.
Authorised alternative investment fund manager: Authorised AIFMs are subject to more stringent
requirements than registered AIFMs and can manage or market their AIFs across the EU.
Commitment leverage: Ratio of exposures to the NAV, where exposures are computed using the
commitment approach, which takes into account netting and hedging, and adjusts IRDs by duration.
Financial leverage: The ratio of total assets to equity (NAV for funds), also called balance-sheet
leverage. Financial leverage involves outright borrowing and is defined as the ratio of total assets to
equity (or NAV for funds), in percentage. It can be measured by aggregating unsecured cash borrowing,
the value of securities borrowed for short positions, collateralised/secured cash borrowing via prime
broker, reverse repo or by other means.
Gross exposure: The absolute sum of all portfolio’s positions, long and short. It includes gross notional
value for derivatives. This measure provides a complete appreciation of all the leverage that is
employed by a fund to gain market exposure.
Gross leverage: Leverage computed under the gross method, as indicated in Commission Delegated
Regulation No 231/2013. It is expressed as the proportion of total gross exposure to NAV, in
percentage. Under the gross method, exposures are calculated as the absolute value of all positions in
the portfolio by including all assets and liabilities, relevant borrowings, derivatives (converted into their
equivalent underlying positions) and all other positions, even those held purely for risk-reduction
purposes. Cash held in the base currency of the AIF is excluded.
Interest rate derivatives (IRDs): Under the AIFMD reporting requirements, IRDs exposures are
reported as the total gross notional value of the AIF’s outstanding IRD contracts, including the total
notional value of futures and delta-adjusted notional value of options. For the purpose of computing the
commitment leverage, IRDs are adjusted for duration.
Leverage: Ratio of fund market exposures to NAV. Market exposures can be defined according to a
variety of approaches, including the gross approach and the commitment approach.
Net asset value (NAV): The net value of the assets of the AIF (as opposed to the NAV per unit or share
of the AIF).
Registered alternative investment fund manager: Registered AIFMs are subject to lighter
requirements than authorised AIFMs but cannot have access to the AIFMD passport.

ESMA Annual Statistical Report on EU Alternative Investment Funds 2019 88
Data inventory
Indicator Description and reporting guidelines Reporting content
Reporting items
Technical guidance
Data availability
Investment regions
Geographical breakdown of the investments held by the AIF by percentage of the total NAV of the AIF. See: ESMA guidelines, point 83; Q&As Section III, 4 and 73.
3(3)(d)- and 24(1)
78-85 Mandatory (all AIFs)
Total 100%
FoF 100%
HF 100%
PE 100%
RE 100%
OTH 100%
Top 5 beneficial owners
NAV held by the five beneficial owners that have the largest equity interests in the AIF. See: ESMA guidelines, point 100. Note: 11% of AIFs, mostly sold to retail investors, report 0.
3(3)(d) and 24(1)
118 Mandatory (all AIFs)
Total 100%
FoF 100%
HF 100%
PE 100%
RE 100%
OTH 100%
Clients Investor concentration for retail and professional investors. See: ESMA guidelines, point 101; Q&As Section III, 80.
3(3)(d) and 24(1)
119-120 Mandatory (all AIFs)
Total 97%
FoF 98%
HF 98%
PE 99%
RE 99%
OTH 95%
Ownership Ownership of units in the AIF beneficially owned by investor type. See: ESMA guidelines, point 123 and Annex II.
24(2) 208-209 Mandatory (all AIFs)
Total 98%
FoF 99%
HF 98%
PE 93%
RE 99%
OTH 99%
Redemption rights
AIF investors provided with withdrawal / redemption rights in the ordinary course
24(2) 193 Optional (AIFs must report if true)
Total 84%
FoF 82%
HF 90%
PE 76%
RE 73%
OTH 87%
Redemption frequencies
Frequency of investor redemptions. In case of multiple classes of shares or units, the largest share class by NAV shall be considered. See: ESMA guidelines, point 121 and Annex II.
24(2) 194 Optional (AIFs must report if information is available)
Total 95%
FoF 96%
HF 98%
PE 96%
RE 97%
OTH 95%
Liquidity profile Portfolio and investor liquidity profiles. See: ESMA guidelines, points 118-120; Q&As Section III, 10, 11, 42 and 78.
24(2) 178-184, 186-192
Mandatory (all AIFs reporting under Article 24(2))
Total 90%
FoF 93%
HF 91%
PE 72%
RE 88%
OTH 92%
Liquidity financing
Total financing amount by the longest period for which the creditor is contractually committed to providing such financing. See: Q&As Section III, 2, 67
24(2) 211-217 Optional (AIFs must report if information is available)
Total 23%
FoF 22%
HF 33%
PE 35%
RE 38% OTH 27%
Unencumbered cash
Value of unencumbered cash. 24(2) 185 Optional (AIFs must report if information is available)
Total 90%
FoF 93%
HF 93%
PE 71% RE 88%
OTH 92%
Securities trading
Estimated % in terms of market value of securities traded on regulated exchange and OTC markets. See: Q&As Section III, 8 and 27.
24(2) 148-149 Optional (AIFs must report if information is available)
Total EU 60%
FoF 39%
HF 67% PE 38%
RE 17%
OTH 63%

ESMA Annual Statistical Report on EU Alternative Investment Funds 2019 89
Derivatives trading
Estimated % in terms of trade volumes of derivatives that are traded on regulated exchange and OTC markets. See: Q&As Section III, 9.
24(2) 150-151 Optional (AIFs must report if information is available)
Total EU 63%
FoF 76%
HF 44%
PE 88%
RE 88% OTH 53%
Derivatives clearing
Estimated % in terms of trade volumes of derivatives transactions that are cleared by a CCP and bilaterally. See: ESMA guidelines, point 112; Q&As Section III, 22.
24(2) 152-153 Optional (AIFs must report if information is available)
Total EU 73%
FoF 81%
HF 54%
PE 93% RE 92%
OTH 67%
Repo clearing Estimated % in terms of market value of repo trades that are cleared by a CCP, bilaterally and via tri-party repo. See: ESMA guidelines point 113; Q&As Section III, 23.
24(2) 154-156 Optional (AIFs must report if information is available)
Total EU 94%
FoF 97%
HF 91% PE 99%
RE 98%
OTH 90%
Financial leverage
Leverage created by direct borrowing of money or securities from counterparties. See: ESMA guidelines, point 124; Q&As Section III, 34, 44 and 69.
24(2) and 24(4)
283-286, 289
Optional (AIFs must report if information is available)
Total EU 56%
FoF 53% HF 45%
PE 81%
RE 65%
OTH 53%
Note: Main indicators and reporting template items analysed in the report. Relative coverage defined as the ratio of the total number of AIFs reporting it to the number of AIFs expected to report it. Optional items filled only when information is applicable.

ESMA Annual Statistical Report on EU Alternative Investment Funds 2019 90
aa