ESKĐŞEHĐR TECHNICAL UNIVERSITY FACULTY OF ENGINEERING DEPARTMENT...
6
ESKĐŞEHĐR TECHNICAL UNIVERSITY FACULTY OF ENGINEERING DEPARTMENT OF ELECTRICAL AND ELECTRONICS ENGINEERĐNG EEM 206 ELECTRICAL CIRCUITS LABORATORY EXPERIMENT #8 ELECTROCARDIOGRAPHY(ECG) CIRCUIT DESIGN ELECTROCARDIOGRAPHY(ECG) CIRCUIT DESIGN ELECTROCARDIOGRAPHY(ECG) CIRCUIT DESIGN ELECTROCARDIOGRAPHY(ECG) CIRCUIT DESIGN
Transcript of ESKĐŞEHĐR TECHNICAL UNIVERSITY FACULTY OF ENGINEERING DEPARTMENT...
ESKĐŞEHĐR TECHNICAL UNIVERSITY
FACULTY OF ENGINEERING
DEPARTMENT OF ELECTRICAL AND ELECTRONICS ENGINEERĐNG
EEM 206 ELECTRICAL CIRCUITS LABORATORY
EXPERIMENT #8
ELECTROCARDIOGRAPHY(ECG) CIRCUIT DESIGNELECTROCARDIOGRAPHY(ECG) CIRCUIT DESIGNELECTROCARDIOGRAPHY(ECG) CIRCUIT DESIGNELECTROCARDIOGRAPHY(ECG) CIRCUIT DESIGN
INTRODUCTION
The body relies on the heart to circulate blood throughout the body. The heart is
responsible for pumping oxygenated blood from the lungs out to the body and also circulating
deoxygenated blood back to the lungs from the body. The heart is divided into four chambers and
each chamber is responsible for a different part of the circulatory process mentioned above. The
contraction of these chambers is done in a very coordinated fashion and is controlled by
specialized regions of the heart responsible for electrical stimulation of cardiac muscle.
Electrocardiography (ECG) is the electrical response of a human’s heart over a specific period of
time. Different electrical potentials between the human cells in the human hearth beatings,
constitute the electrocardiographical signals. These signals illustrate the electrical depolarization
and repolarization of the heart during a contraction. The generated electrical impulses can be
measured on the surface of the skin with electrodes. For correct evaluation of a hearth health, a
precise device takes a big importance. In this experiment, an ECG amplifier by using an
instrumental amplifier is going to be designed.
Instrumentational Amplifiers
Amplifiers are generally used to boost the strength of the input signal and give an
amplified version of the signal to the output. The gain should be enough to make the signal
observable, however not be large enough to saturate the amplifiers and lead to false peaks. The
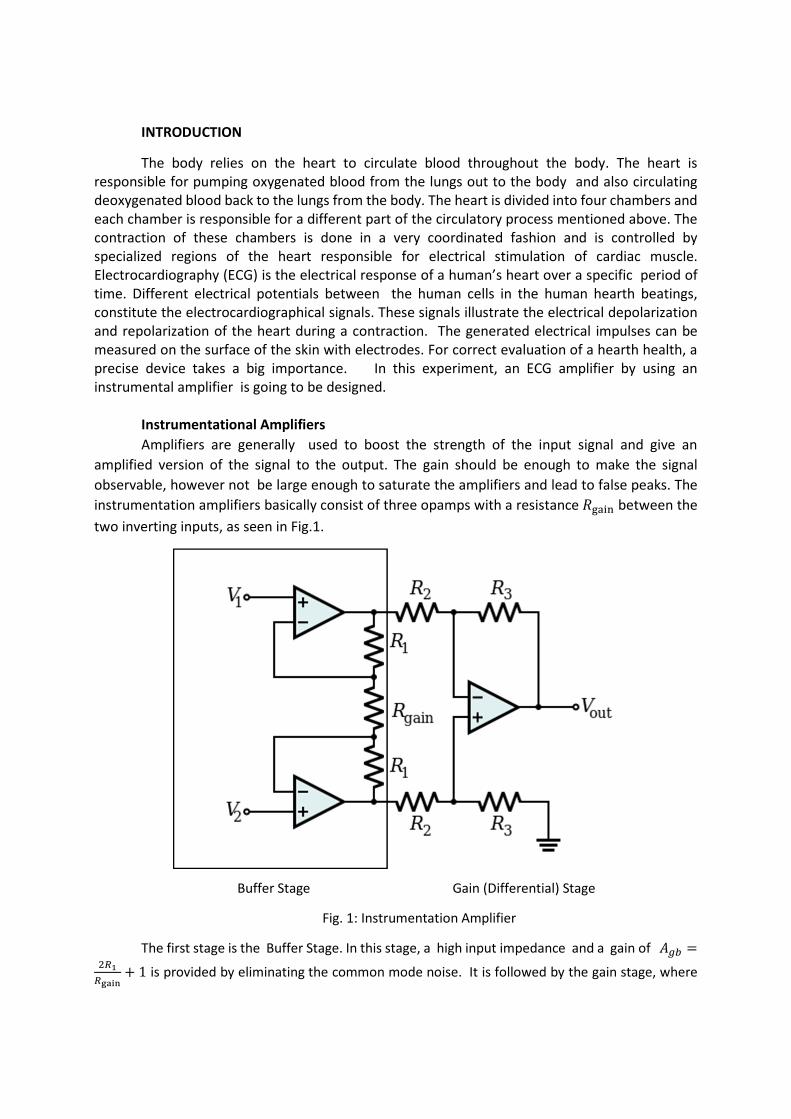
instrumentation amplifiers basically consist of three opamps with a resistance ����� between the
two inverting inputs, as seen in Fig.1.
Buffer Stage Gain (Differential) Stage
Fig. 1: Instrumentation Amplifier
The first stage is the Buffer Stage. In this stage, a high input impedance and a gain of ��� ��
� ���� 1 is provided by eliminating the common mode noise. It is followed by the gain stage, where

the amplifier amplifies only the differential component with a gain of �� �����
�� and provides a
high common mode rejection ratio, which makes it ideal for medical applications.
An average hearth beat rate of a human is around 1.1�� and has a very small magnitude
of 1 � 5 ��. It is necessary to amplify the desired ECG signals which are monitored ussually
around 0.05 � 150��. Since ECG signals are generally subjected to many different kinds of
internal and external noise inputs, the instrumental amplifiers that strengthen the these signals
must be used with high-pass and low-pass filters together. Typically, a low-pass filter will suffice
to eliminate the high frequency noise and modulate the ECG signal between 0 � 108.27�� by
suppressing all the signals above 108.27��.
In this experimen the ECG circuit will be realized on the IC card with the suitable
availability of the resistors and capacitors. For the operational amplifier TL 072 is used in all stages.
Implement the circuit by using the procedure below;
PROCEDURE
1. Design the circuit shown in Figure 1 with Proteus software. Follow the instructions
given in the lab session for IC card design.
2. Build your IC card on a Pertinax board. Use the pin connections of the TL 072
operational amplifier model.
3. Implement the circuit in Figure 1 and solder it on the copper board as in Figs. 2(a)-(b)
Fig. 2(a): ECG front view Fig. 2(b): ECG back view
4. Apply DC supply voltages as ��!! �9 volts and ��!! �9 D volts to all amplifiers
and verify that only a few milliamperes flow to the circuit.
5. Measure the ECG waveform from your partner.
There is a standard placement of electrodes when performing ECG recordings called a
standard bipolar limb lead. A lead refers to the potential difference between two
electrodes. For this lab, lead placement involves three leads, which are placed on the
Right Arm (RA), Left Arm (LA), and Right Leg (RL). The electrodes can be attached to
the wrists and inner ankle of the right leg. The surface of the skin should be prepared
and cleaned prior to electrode placement.
Attach one electrode on Figure 3 on the palmar side of the right wrist, one on the
palmar side of the left wrist, and one on the right leg ankle.

Fig. 3: The most commonly used electrode for ECG signals
6. Observe the output as you vary the potentiometer. The output should settle around
“0” volt. Find the best value you can obtain.
7. Observe the output signal on the ossiloscope sceen and record the amplitude levels
at various stages of the signal. Note where the peak frequency of the signal occurs and
draw it in your paper. You may need to adjust the scaling.
8. What is the period of your output?Check the pulse of your partner. Verify it with your
scope measurements.
The heart rate can be determined directly from the ECG. The heart rate is the inverse
of the time between similar segments in the ECG recording in term of “beats/second”.
In order to obtain the heart rate per minute, you would simply multiply by
60$%&'()$/�+(,-%. Calculate your beats per minute. Is it in the normal range?
9. Request your partner to sit up in a chair, and place his/her arm on a table or armrest.
Make sure that he/she is relaxed and quiet. Record your ECG data. Then, instruct your
partner to wave their left or riggt hand around in space and record your ECG data.
Next instruct your partner to hold his/her breath. ecord your data.
Note that;
• Bad solderig causes bad connections.
• Uncessary long carrier cables that measures the signals like ./0,�V33, �V33 causes
antenna effect.
! Show your results to your lab assistant in your OWN lab session (December 24-27, 2018).
! Submit your final detailed report till January 03, 2018 with Questions part included.
QUESTIONS
1. Was this filter enough to reduce the noise and produce a “clean” ECG signal? Would you
change your low-pass cut-off frequency?
2. Make a low-pass filterwith a cut-off frequency 10 times lower than your original cut-off
frequency, and then a cut-off frequency 10 times higher than your original cut-off
frequency. What does your signal look like for each of these cut-off frequencies? How do
they compare to the signal you saw with your original cut-off frequency?
3. What about if you flex your muscles while measuring your ECG? What about if you hold
your breath ?Experiment with your circuit

4. What are some potential sources of noise in an ECG recording? What type of filtering can
you use to improve the quality of an ECG signal? What are the typical cut off ranges of the
filter that you should use?
5. What components would you change if you have redesigned the circuit for monitoring ECG
(not clinical)?

22R
HP
Text Box
Figure 1