ESIS ESCWA Statistical Information System ESCWA for regional integration Information and...
27
ESIS ESCWA Statistical Information System ESCWA for regional integration Information and Communication Technology Division Capacity-Building Workshop on Information Society Measurements: Core Indicators, Statistics, and Data Collection Beirut, 7-10 June 2005
-
Upload
buddy-barber -
Category
Documents
-
view
222 -
download
4
Transcript of ESIS ESCWA Statistical Information System ESCWA for regional integration Information and...
ESIS
ESCWA Statistical Information System
ESCWAfor regional integration
Information and Communication Technology Division
Capacity-Building Workshop on Information Society Measurements:Core Indicators, Statistics, and Data CollectionBeirut, 7-10 June 2005

Content
• What is ESIS
• Main features
• Why ESIS
• Main dimensions
• Samples
• Live demonstration
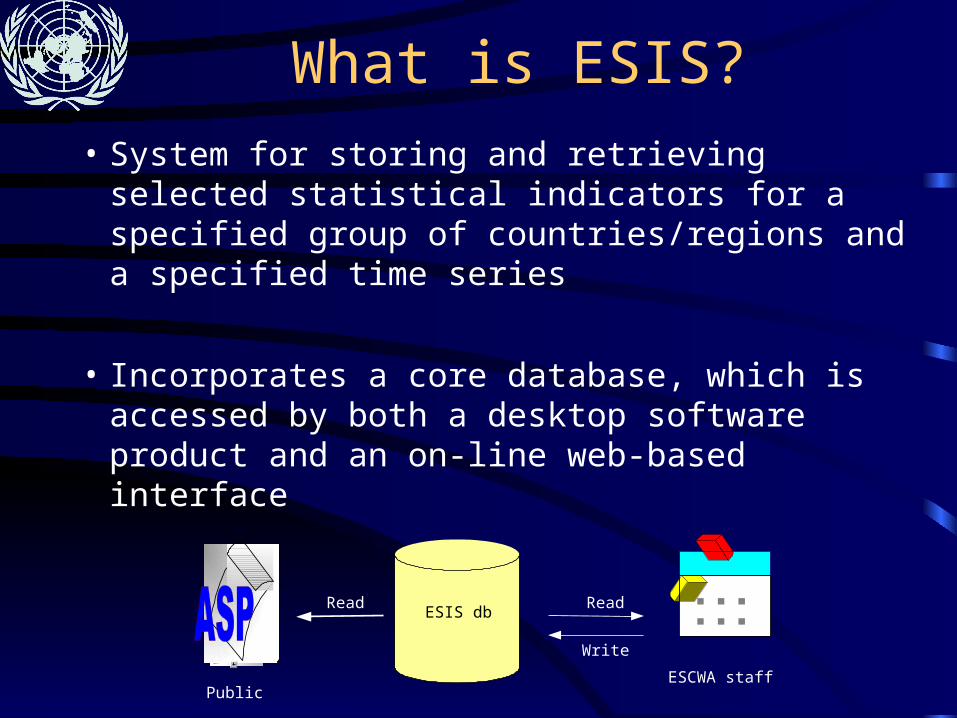
What is ESIS?
• System for storing and retrieving selected statistical indicators for a specified group of countries/regions and a specified time series
• Incorporates a core database, which is accessed by both a desktop software product and an on-line web-based interface
ESIS db
ESCWA staffPublic
Read Read
Write

Main features
•Bilingual (English and Arabic)
•Common tools for data entry, reporting and analysis
•Common interface leading to a consistent look and feel
•Available to ESCWA staff and member states
•Web based with secure access control
•Single repository of customized and comparable data for all substantive divisions
•Flexible, definable, and modifiable data structure

Software development platform
• MS SQL Server
• VB programming language
• MS Excel
• ASP.net
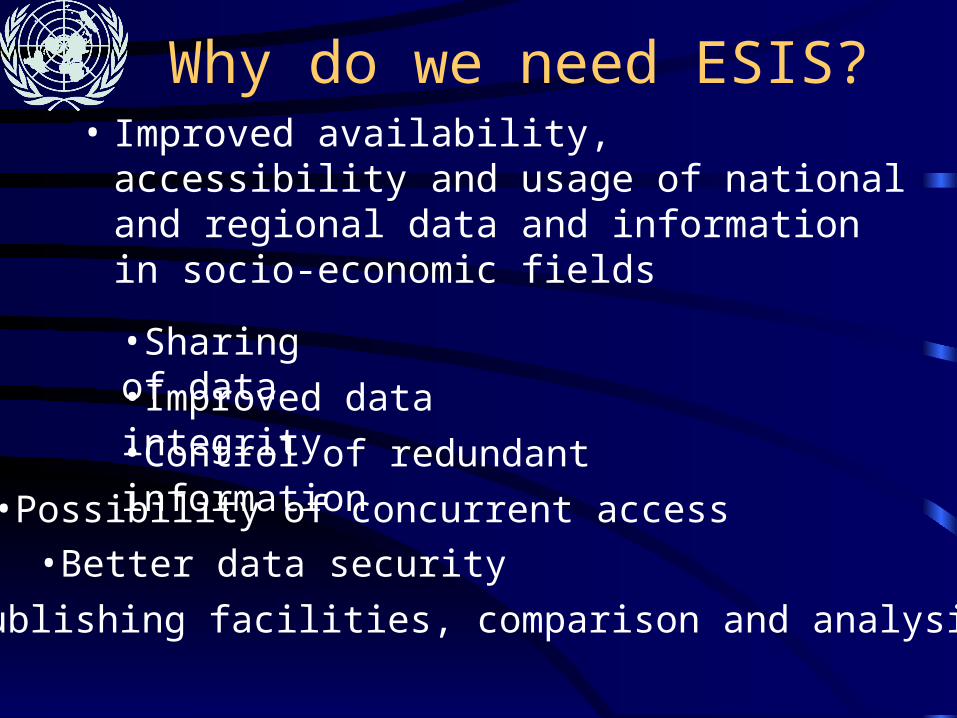
Why do we need ESIS?• Improved availability, accessibility and usage
of national and regional data and information in socio-economic fields
•Sharing of data
•Control of redundant information
•Better data security
•Improved data integrity
•Possibility of concurrent access
•Publishing facilities, comparison and analysis

System main dimensions
• Indicators (organized into Modules, Categories and Sub-categories)
• Countries/Regions
• Years
Time
Country /region
Indicator
T1
T3
T2
C1C2C3
I1
I2
I3
D1(I1,C2,T2)

Modules as modeled in the ESIS
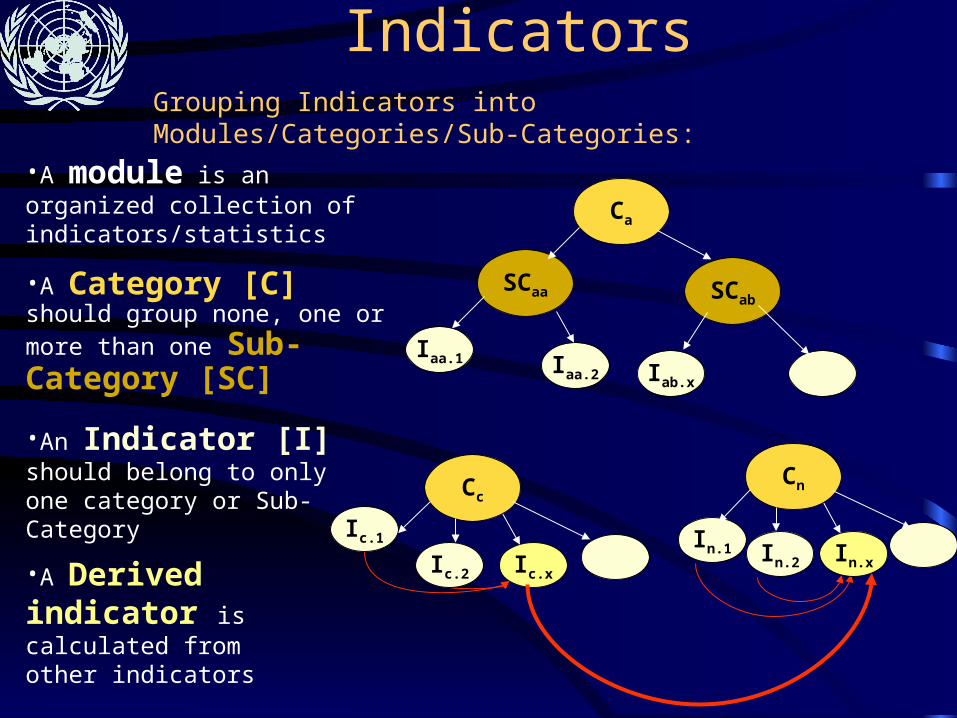
IndicatorsGrouping Indicators into Modules/Categories/Sub-Categories:
In.xIc.x
Cn
Ca
Cc
SCaa SCab
In.1 In.2
Ic.1
Ic.2
Iaa.1 Iaa.2 Iab.x
•A module is an organized collection of indicators/statistics
•A Category [C] should group
none, one or more than one Sub-Category [SC]
•An Indicator [I] should belong to only one category or Sub-Category
•A Derived indicator is calculated from other indicators

Indicators properties
• Definition
• Type (Number or Text)
• Unit (Number, Percentage, Currency…)
• Regional (Total or Average)
• Default scale factor
• Deriving new indicators (construct a function)

Sample of an organized set of indicators
ICT module
Telecom Infrastructurecategory
UNDP - Technology achievement index
ITU – Digital Access Index (DAI)Cellular mobile subscribers per 100
Main telephone lines operation per 100
Related indicescategory
Cable subscribers
UNCTAD - ICT diffusion index
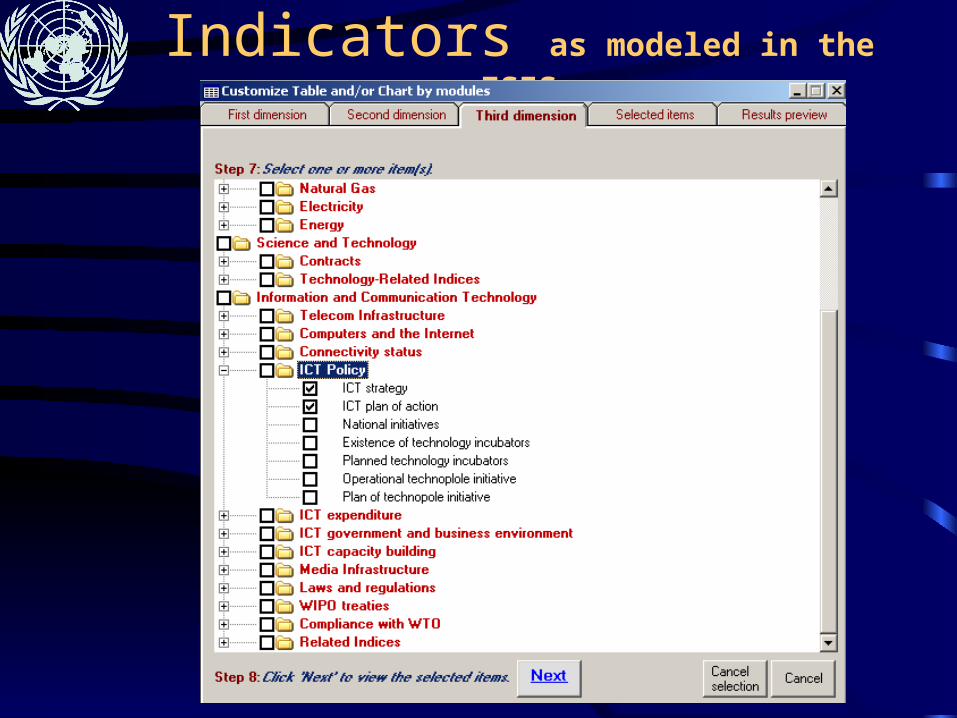
Indicators as modeled in the ESIS

Countries/Regions
C2
Rb
Rn
C1
Ra
CxCn
C4
Rc
Grouping Countries into Regions
•A Region [R] could exist as a group of countries or as a standalone entity
•A Country [C] could belong to one or more region/s or exist as a standalone entity
C3

Countries/Regions in the ESIS(22 countries, 13 group)
ESCWA member states
• Bahrain
• Egypt
• Iraq
• Jordan
• Kuwait
• Lebanon
• Oman
• Palestine
• Qatar
• Saudi Arabia
• Syria
• United Arab Emirates
• Yemen
Other Arab states•Algeria•Comoros•Djibouti•Libya•Mauritania•Morocco•Somalia•Sudan•Tunisia
Regions/Groups•Arab States [AS]•ESCWA•GCC•MENA•Middle East•Non GCC ESCWA countries•Non-OAPEC Arab Countries•OAPEC•World•World High Income countries•World Low Income countries•World Lower Middle Incomecountries•World Upper Middle Incomecountries
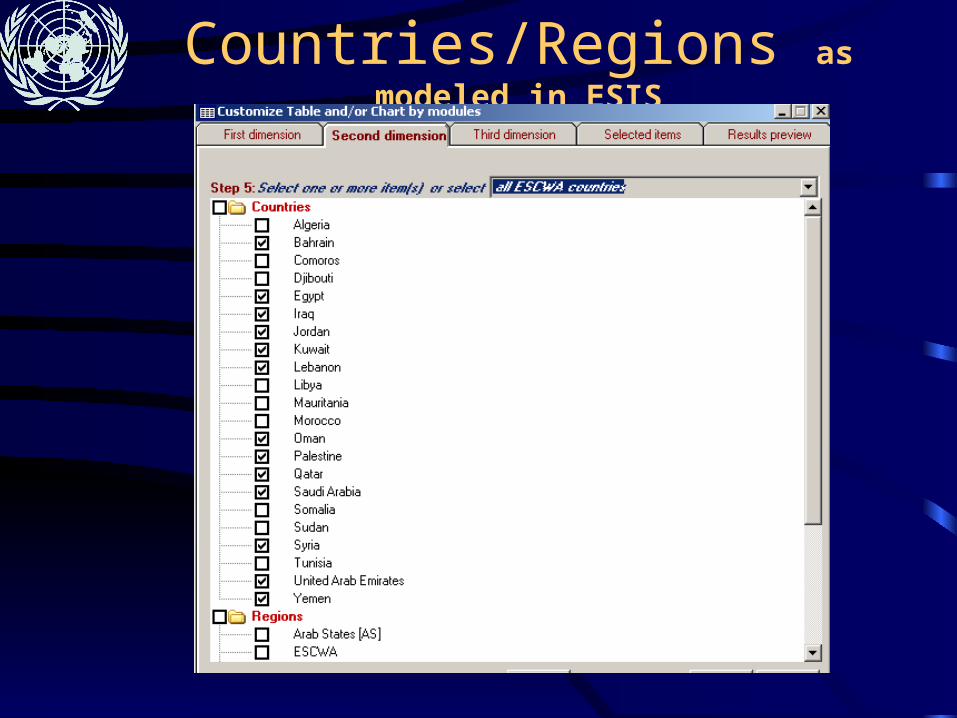
Countries/Regions as modeled in ESIS
Time
T1
Tf4T2
Tn
T3 Tf5
T4
T5
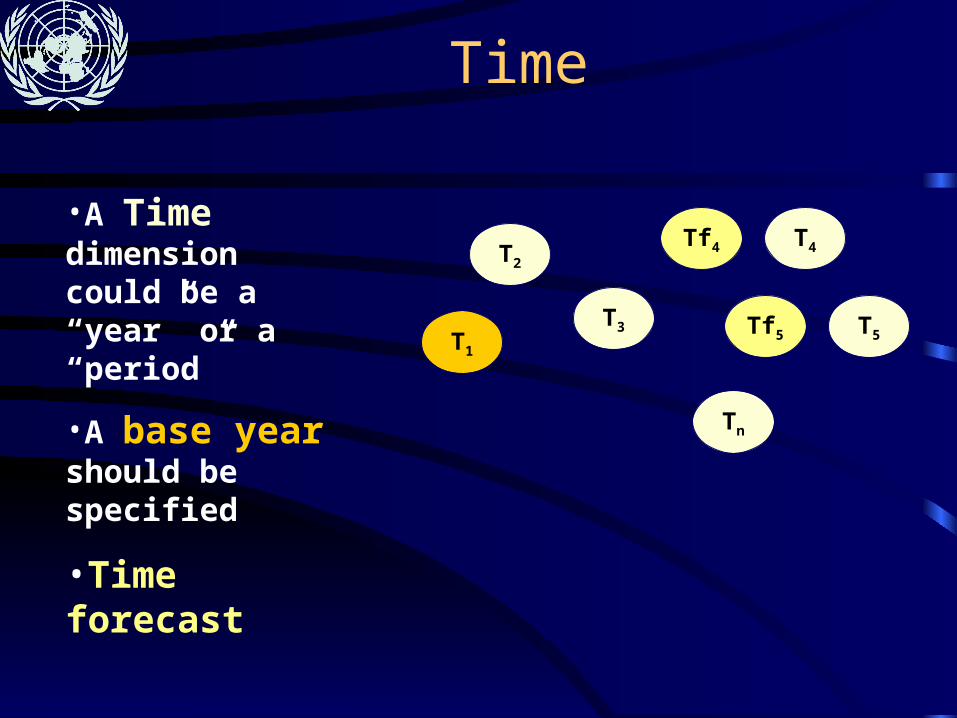
•A Time dimension could be a “year” or a “period”
•A base year should be specified
•Time forecast
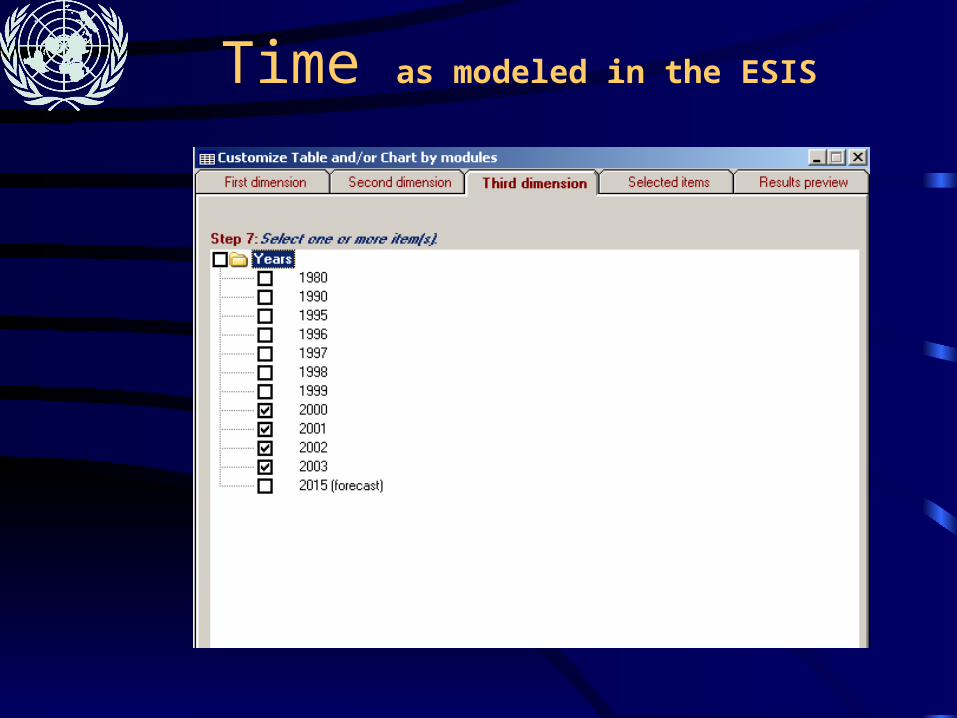
Time as modeled in the ESIS

Result preview

Result in EXCEL

Chart (1)

Chart (2)
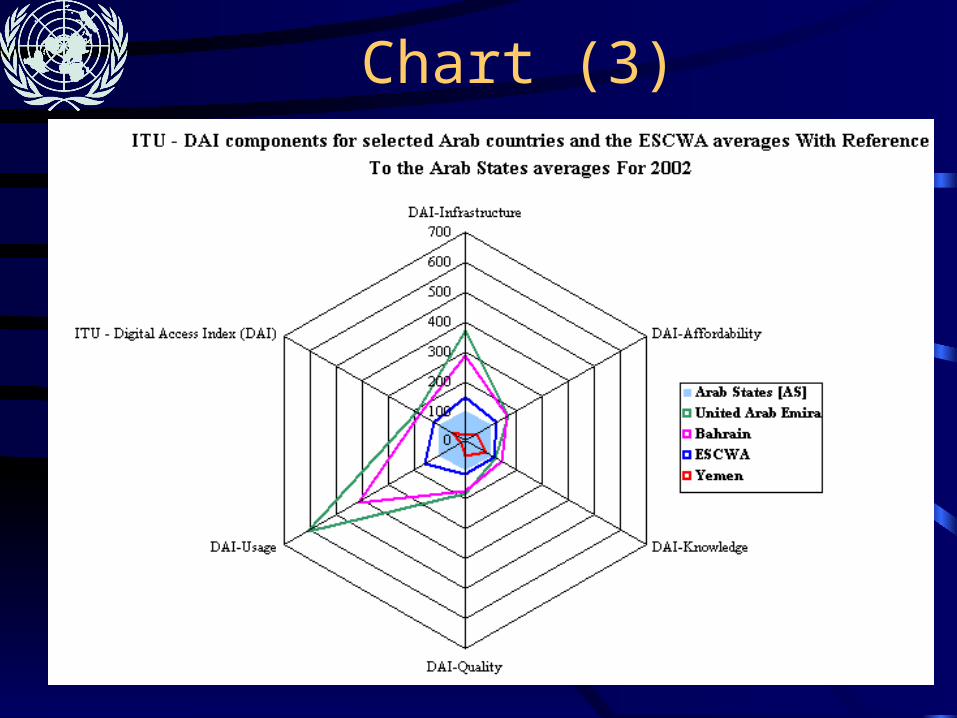
Chart (3)

Live Demonstration
ESIS Reporting Engine

Data management
• Inserting individual new values (one by one)
• Process automatic export from EXCEL
• Process automatic regions’ aggregation (individual or mass)
• Process automatic indicators’ derivation (individual or mass)
• Forecasting values

Meta data management
• Specify Notes on the data point level
• Specify Sources on the data point level

Users distributionUsers roles and permissions
Gu
ests
(ma
ny in
all t
he
wo
rld
)
Da
ta m
an
ag
ers
(ma
ny in
ea
ch
div
isio
n)
Syste
m
Ad
min
istr
ato
r
(un
iqu
e in
ea
ch
div
isio
n)
Da
tab
ase
ow
ne
r (u
niq
ue
in E
SC
WA
)
Add countries/regions
Add Modules/categories/indicators
Add years
Update the three dimensions
Databaseadministration
Add new users and assignroles and permissions
Data entry
Manual
Meta datamaintenance
Query the database and produce reports
Computed NotesSources
EDP
Administrators from substantive divisions
Data managers from substantive divisions
Public

Thank you