ESG IMPACT REPORT - Harrison Street
26
1 | 26 1 | 26 2020 ESG IMPACT REPORT 2020 ESG IMPACT REPORT 2020 ESG IMPACT REPORT
Transcript of ESG IMPACT REPORT - Harrison Street
1 | 261 | 26 2020 ESG IMPACT REPORT2020 ESG IMPACT REPORT
2020ESG IMPACT REPORT

2 | 262 | 26 2020 ESG IMPACT REPORT2020 ESG IMPACT REPORT
Word from our CEO
Firm Overview
Impact Vision
Impact Framework
ESG Goals
Management & Policy
Diversity, Equity, & Inclusion
Team Wellness
Operating Partner Services
Community Impact
Climate Resiliency & Emissions
Efficienct Operations
Health & Wellness
Core Fund
Social Infrastructure Fund
Europe Opportunistic
Disclosure Index
ESG Data Tables
COVER PHOTO: Woodlawn Commons at the University of Chicago | Social Infrastructure

3 | 263 | 26 2020 ESG IMPACT REPORT2020 ESG IMPACT REPORT
A WORD FROM OUR CEO
When we founded Harrison Street in 2005, our strategy wasn’t simply to establish and deliver a successful business model, but also to ensure we made a meaningful impact on the communities we serve.Over the past 15 years I’m pleased to report that by executing on our demographic-driven investment thesis we have made a difference. As 2020 closed we had served nearly 425,000 students and 50,000 seniors by providing high quality housing and care. Over 16,000 new jobs had been created due to our long-standing investment in developments. In addition, we had invested over $700 M in public-private partnerships and $140 M in renewable energy assets.
Well before COVID-19 we had established ourselves as an industry leader in health and wellness, partnering with healthy building global standard bodies to both create certification scorecards applicable to our asset classes and to engage in research on how building design and operations impact human wellbeing. Our DEI initiative, which began several years back, continued to make significant inroads, for example the number of women and people of color on our senior leadership team has grown from 6% to 28% in the last 4 years. We see great opportunities to do more to continually improve the impact both our company and our investments have on the environment and the communities they serve. More details on our ESG program and progress are captured in our Chief Impact Officer’s letter, found later in this year’s report.
In fact, the Chief Impact Officer role was a newly created position in early 2020. Whereas we have had a formal sustainability program since 2013, the responsibility for the strategy and execution originally resided in the hands of an internal team composed of representatives from every department. Now we have a fully dedicated role and corresponding department that is responsible for the measurement, management, reporting and enhancement of the Firm’s environmental and social initiatives. The Impact team, supports, educates, and holds accountable the rest of the organization and our partners in the adoption and execution of ESG principles.
Having a solid ESG initiative aided our business in continuing to thrive during 2020. We raised new capital, closed transactions across strategies, hired new team members, and launched new funds. We both unveiled and demonstrated our tagline, “Making an Impact”. In addition to our involvement with GRESB, we also became a signatory to both TCFD and UN PRI, as we are committed to publicly reporting our ESG progress and performance.
The Firm will continually enhance its focus on how we create measurable, meaningful impact for both the environment and the stakeholders we serve. We will continue to raise the bar on our expectations as a Firm and strive to be an industry leader in ESG performance and accountability. All these efforts combined will help us to deliver our promise of making an impact.
.
BEST IN BUILDING HEALTHINDUSTRY LEADERSHIP AWARDPRESENTED BY THE CENTER FOR ACTIVE DESIGN
GREEN STARACHIEVED IN GRESBFOR ALL SUBMITTED REAL ESTATE FUNDS
1,500 WELLNESS CALLSMADE TO AT RISK INDIVIDUALS DURING COVIDTHROUGH PARTNERSHIP WITH MY BLOCK, MY HOOD, MY CITY
UN PRI & TCFDSIGNATORYFORMALIZED ASSOCIATION IN 2020
CHRISTOPHER MERRILL CO-FOUNDER, CHAIRMAN, & CEO
INTRODUCTION
4 | 264 | 26 2020 ESG IMPACT REPORT2020 ESG IMPACT REPORT
INTRODUCTION
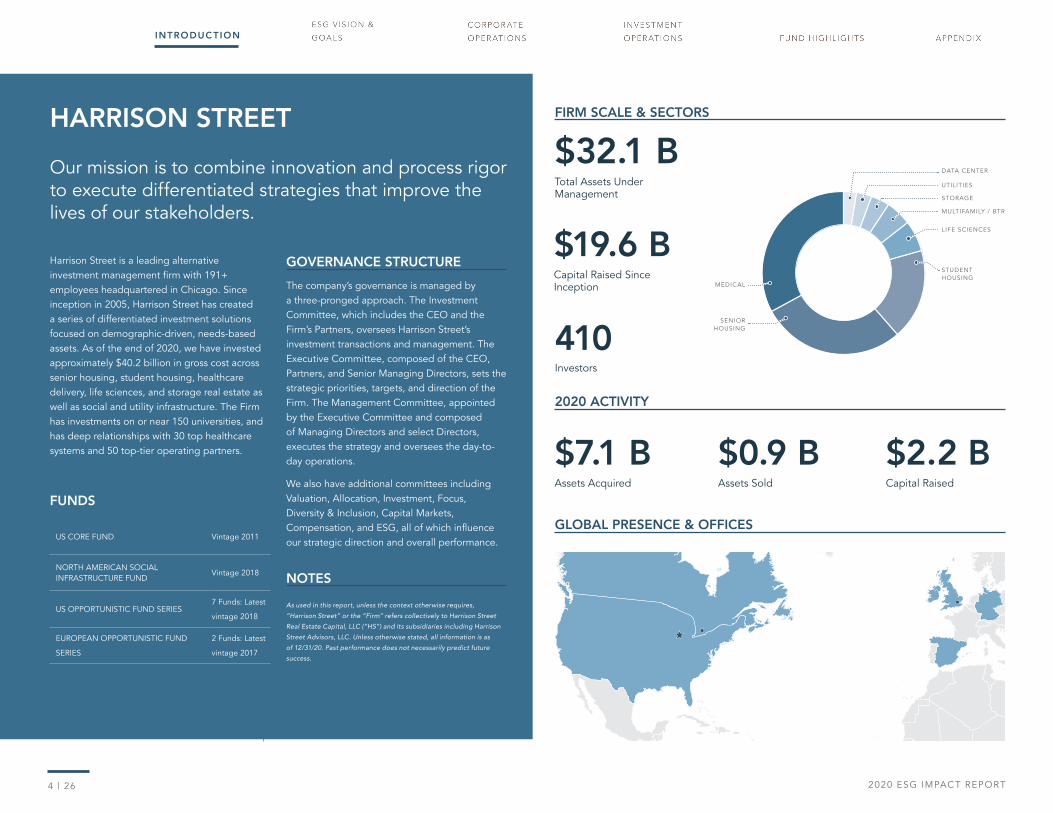
HARRISON STREET
Our mission is to combine innovation and process rigor to execute differentiated strategies that improve the lives of our stakeholders.
Harrison Street is a leading alternative investment management firm with 191+ employees headquartered in Chicago. Since inception in 2005, Harrison Street has created a series of differentiated investment solutions focused on demographic-driven, needs-based assets. As of the end of 2020, we have invested approximately $40.2 billion in gross cost across senior housing, student housing, healthcare delivery, life sciences, and storage real estate as well as social and utility infrastructure. The Firm has investments on or near 150 universities, and has deep relationships with 30 top healthcare systems and 50 top-tier operating partners.
FUNDS
US CORE FUND Vintage 2011
NORTH AMERICAN SOCIAL INFRASTRUCTURE FUND
Vintage 2018
US OPPORTUNISTIC FUND SERIES7 Funds: Latest
vintage 2018
EUROPEAN OPPORTUNISTIC FUND
SERIES
2 Funds: Latest
vintage 2017
GOVERNANCE STRUCTURE
The company’s governance is managed by a three-pronged approach. The Investment Committee, which includes the CEO and the Firm’s Partners, oversees Harrison Street’s investment transactions and management. The Executive Committee, composed of the CEO, Partners, and Senior Managing Directors, sets the strategic priorities, targets, and direction of the Firm. The Management Committee, appointed by the Executive Committee and composed of Managing Directors and select Directors, executes the strategy and oversees the day-to-day operations.
We also have additional committees including Valuation, Allocation, Investment, Focus, Diversity & Inclusion, Capital Markets, Compensation, and ESG, all of which influence our strategic direction and overall performance.
NOTES
As used in this report, unless the context otherwise requires,
“Harrison Street” or the “Firm” refers collectively to Harrison Street
Real Estate Capital, LLC (“HS”) and its subsidiaries including Harrison
Street Advisors, LLC. Unless otherwise stated, all information is as
of 12/31/20. Past performance does not necessarily predict future
success.
2020 ACTIVITY
$32.1 BTotal Assets Under Management
$7.1 BAssets Acquired
$0.9 BAssets Sold
$2.2 BCapital Raised
FIRM SCALE & SECTORS
410Investors
STUDENT HOUSING
SENIORHOUSING
MEDICAL
LIFE SCIENCES
MULTIFAMILY / BTR
STORAGE
UTILITIES
DATA CENTER
GLOBAL PRESENCE & OFFICES
$19.6 BCapital Raised Since Inception
5 | 265 | 26 2020 ESG IMPACT REPORT2020 ESG IMPACT REPORT
MAKING AN IMPACT
REFLECTIING ON 15 YEARS OF MAKING AN IMPACT
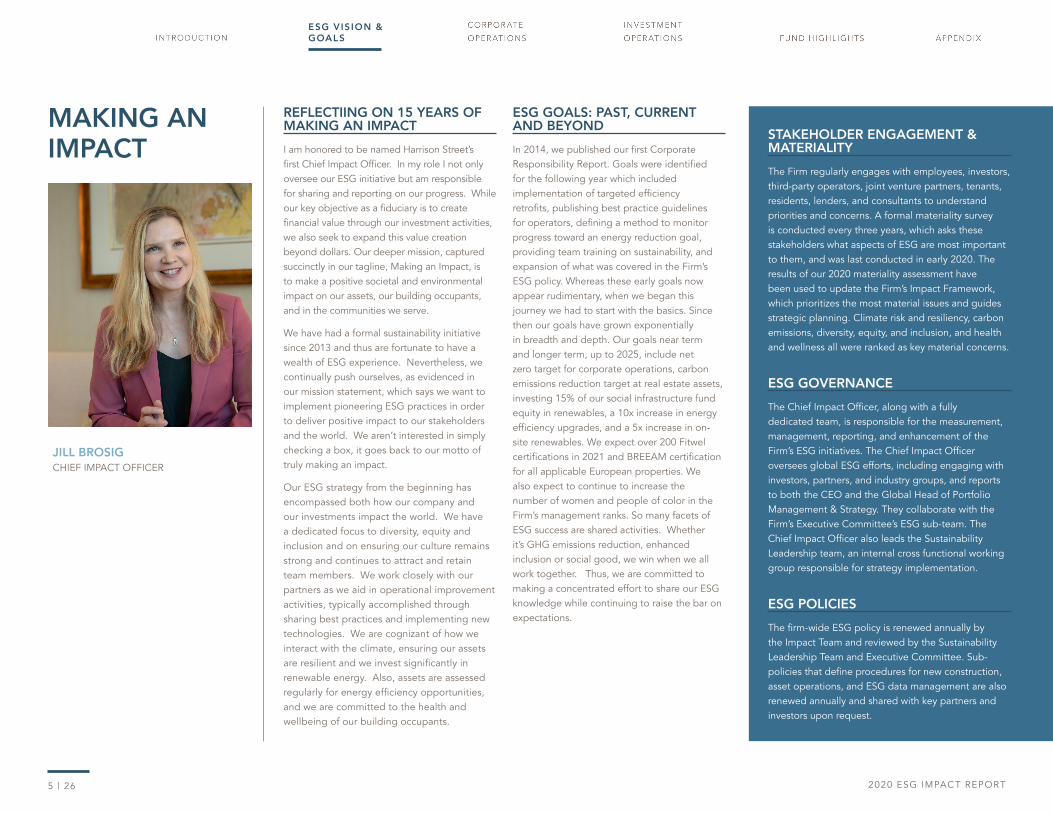
I am honored to be named Harrison Street’s first Chief Impact Officer. In my role I not only oversee our ESG initiative but am responsible for sharing and reporting on our progress. While our key objective as a fiduciary is to create financial value through our investment activities, we also seek to expand this value creation beyond dollars. Our deeper mission, captured succinctly in our tagline, Making an Impact, is to make a positive societal and environmental impact on our assets, our building occupants, and in the communities we serve.
We have had a formal sustainability initiative since 2013 and thus are fortunate to have a wealth of ESG experience. Nevertheless, we continually push ourselves, as evidenced in our mission statement, which says we want to implement pioneering ESG practices in order to deliver positive impact to our stakeholders and the world. We aren’t interested in simply checking a box, it goes back to our motto of truly making an impact.
Our ESG strategy from the beginning has encompassed both how our company and our investments impact the world. We have a dedicated focus to diversity, equity and inclusion and on ensuring our culture remains strong and continues to attract and retain team members. We work closely with our partners as we aid in operational improvement activities, typically accomplished through sharing best practices and implementing new technologies. We are cognizant of how we interact with the climate, ensuring our assets are resilient and we invest significantly in renewable energy. Also, assets are assessed regularly for energy efficiency opportunities, and we are committed to the health and wellbeing of our building occupants.
ESG GOALS: PAST, CURRENT AND BEYOND
In 2014, we published our first Corporate Responsibility Report. Goals were identified for the following year which included implementation of targeted efficiency retrofits, publishing best practice guidelines for operators, defining a method to monitor progress toward an energy reduction goal, providing team training on sustainability, and expansion of what was covered in the Firm’s ESG policy. Whereas these early goals now appear rudimentary, when we began this journey we had to start with the basics. Since then our goals have grown exponentially in breadth and depth. Our goals near term and longer term, up to 2025, include net zero target for corporate operations, carbon emissions reduction target at real estate assets, investing 15% of our social infrastructure fund equity in renewables, a 10x increase in energy efficiency upgrades, and a 5x increase in on-site renewables. We expect over 200 Fitwel certifications in 2021 and BREEAM certification for all applicable European properties. We also expect to continue to increase the number of women and people of color in the Firm’s management ranks. So many facets of ESG success are shared activities. Whether it’s GHG emissions reduction, enhanced inclusion or social good, we win when we all work together. Thus, we are committed to making a concentrated effort to share our ESG knowledge while continuing to raise the bar on expectations.
ESG VIS ION & GOALS
STAKEHOLDER ENGAGEMENT & MATERIALITY
The Firm regularly engages with employees, investors, third-party operators, joint venture partners, tenants, residents, lenders, and consultants to understand priorities and concerns. A formal materiality survey is conducted every three years, which asks these stakeholders what aspects of ESG are most important to them, and was last conducted in early 2020. The results of our 2020 materiality assessment have been used to update the Firm’s Impact Framework, which prioritizes the most material issues and guides strategic planning. Climate risk and resiliency, carbon emissions, diversity, equity, and inclusion, and health and wellness all were ranked as key material concerns.
ESG GOVERNANCE
The Chief Impact Officer, along with a fully dedicated team, is responsible for the measurement, management, reporting, and enhancement of the Firm’s ESG initiatives. The Chief Impact Officer oversees global ESG efforts, including engaging with investors, partners, and industry groups, and reports to both the CEO and the Global Head of Portfolio Management & Strategy. They collaborate with the Firm’s Executive Committee’s ESG sub-team. The Chief Impact Officer also leads the Sustainability Leadership team, an internal cross functional working group responsible for strategy implementation.
ESG POLICIES
The firm-wide ESG policy is renewed annually by the Impact Team and reviewed by the Sustainability Leadership Team and Executive Committee. Sub-policies that define procedures for new construction, asset operations, and ESG data management are also renewed annually and shared with key partners and investors upon request.
JILL BROSIGCHIEF IMPACT OFFICER
6 | 266 | 26 2020 ESG IMPACT REPORT2020 ESG IMPACT REPORT
CORPORATE OPERATIONS INVESTMENT OPERATIONS
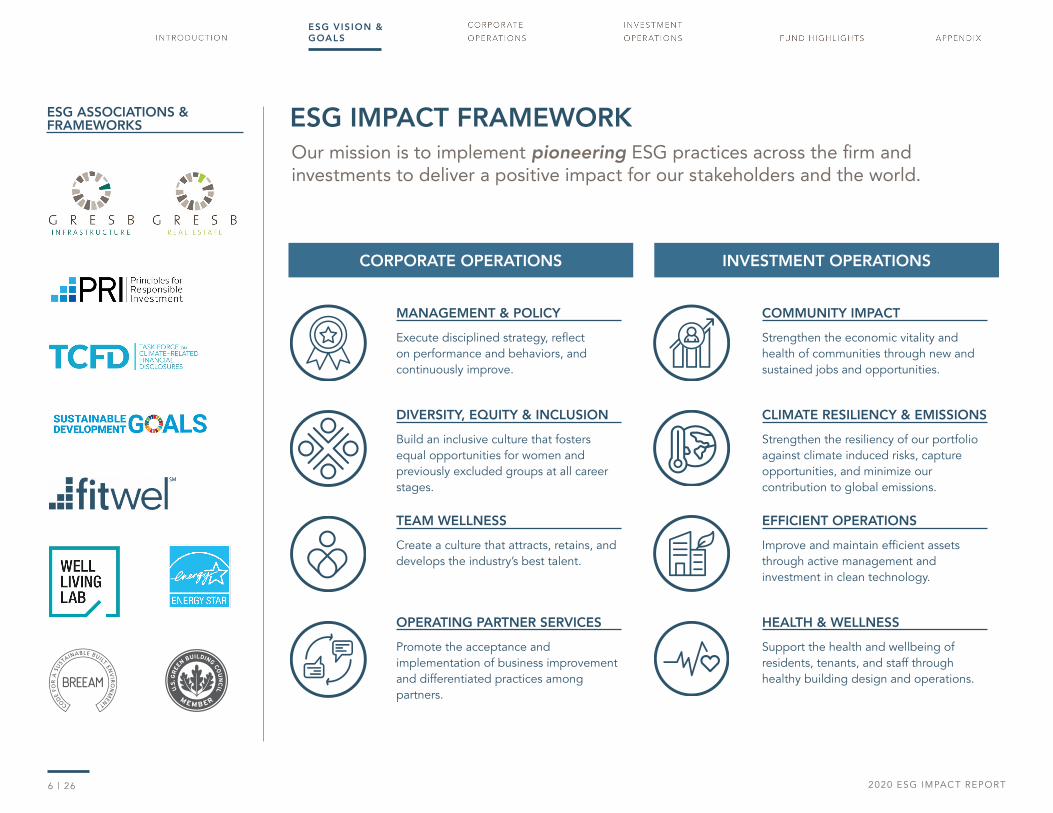
MANAGEMENT & POLICY
Execute disciplined strategy, reflect on performance and behaviors, and continuously improve.
COMMUNITY IMPACT
Strengthen the economic vitality and health of communities through new and sustained jobs and opportunities.
DIVERSITY, EQUITY & INCLUSION
Build an inclusive culture that fosters equal opportunities for women and previously excluded groups at all career stages.
CLIMATE RESILIENCY & EMISSIONS
Strengthen the resiliency of our portfolio against climate induced risks, capture opportunities, and minimize our contribution to global emissions.
TEAM WELLNESS
Create a culture that attracts, retains, and develops the industry’s best talent.
EFFICIENT OPERATIONS
Improve and maintain efficient assets through active management and investment in clean technology.
OPERATING PARTNER SERVICES
Promote the acceptance and implementation of business improvement and differentiated practices among partners.
HEALTH & WELLNESS
Support the health and wellbeing of residents, tenants, and staff through healthy building design and operations.
ESG IMPACT FRAMEWORKESG ASSOCIATIONS & FRAMEWORKS
Our mission is to implement pioneering ESG practices across the firm and investments to deliver a positive impact for our stakeholders and the world.
ESG VIS ION & GOALS
7 | 267 | 26 2020 ESG IMPACT REPORT2020 ESG IMPACT REPORT
ESG VIS ION & GOALS
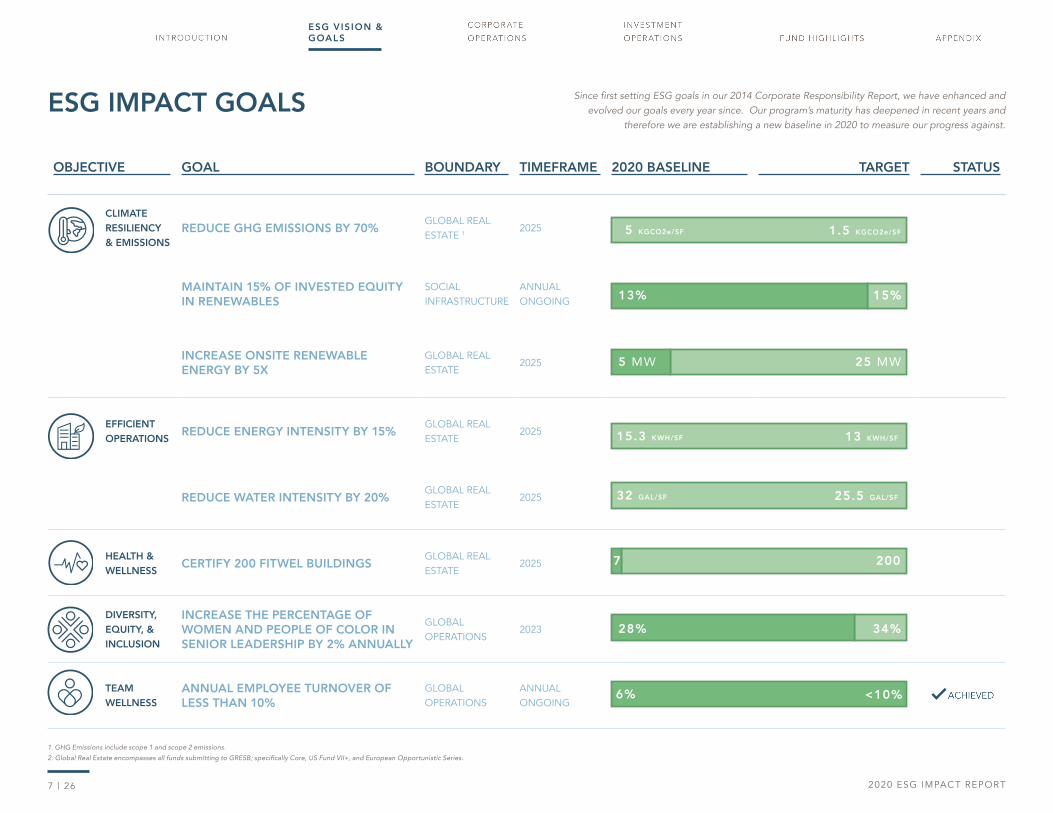
ESG IMPACT GOALS
OBJECTIVE GOAL BOUNDARY TIMEFRAME 2020 BASELINE TARGET STATUS
CLIMATE RESILIENCY & EMISSIONS
REDUCE GHG EMISSIONS BY 70% GLOBAL REAL ESTATE 1
2025
MAINTAIN 15% OF INVESTED EQUITY IN RENEWABLES
SOCIAL INFRASTRUCTURE
ANNUAL ONGOING
INCREASE ONSITE RENEWABLE ENERGY BY 5X
GLOBAL REAL ESTATE
2025
EFFICIENT OPERATIONS
REDUCE ENERGY INTENSITY BY 15%GLOBAL REAL ESTATE
2025
REDUCE WATER INTENSITY BY 20%GLOBAL REAL ESTATE
2025
HEALTH & WELLNESS
CERTIFY 200 FITWEL BUILDINGSGLOBAL REAL ESTATE
2025
DIVERSITY, EQUITY, & INCLUSION
INCREASE THE PERCENTAGE OF WOMEN AND PEOPLE OF COLOR IN SENIOR LEADERSHIP BY 2% ANNUALLY
GLOBAL OPERATIONS
2023
TEAM WELLNESS
ANNUAL EMPLOYEE TURNOVER OF LESS THAN 10%
GLOBAL OPERATIONS
ANNUAL ONGOING
5 MW 25 MW
2007
28% 34%
15%13%
<10%6%
Since first setting ESG goals in our 2014 Corporate Responsibility Report, we have enhanced and evolved our goals every year since. Our program’s maturity has deepened in recent years and
therefore we are establishing a new baseline in 2020 to measure our progress against.
1. GHG Emissions include scope 1 and scope 2 emissions.
2. Global Real Estate encompasses all funds submitting to GRESB; specifically Core, US Fund VII+, and European Opportunistic Series.
15.3 KWH/SF 13 KWH/SF
32 GAL/SF 25.5 GAL/SF
5 KGCO2e/SF 1.5 KGCO2e/SF
8 | 268 | 26 2020 ESG IMPACT REPORT2020 ESG IMPACT REPORT
CORPORATE OPERATIONS The companies that will be successful are those that embed solid ESG principles into their policies and procedures, company culture, and engagement with all stakeholders. Broad based buy-in leads to action which then creates the real impact on which we are so
keenly focused.
JOEY LANSINGPARTNER, GLOBAL HEAD OF PORTFOLIO MANAGEMENT & STRATEGY
PHOTO: 2434 N. Halsted, Chicago IL | Life Sciences
9 | 269 | 26 2020 ESG IMPACT REPORT2020 ESG IMPACT REPORT
We execute a disciplined strategy, reflect on internal performance, and continuously improve our internal procedures to maintain our history of success.
ANTI-CORRUPTION & ETHICS
Partners, investors, and employees are engaged in and educated about our ethics policies. Employees must attest quarterly to the Code of Ethics and are encouraged to share any ethical concerns with HR or the Chief Compliance Officer (CCO). Training on ethics, anti-corruption, and specialized topics like cybersecurity and foreign corrupt practices, are provided annually and when new regulations or situations arise.
Investment policies and procedures promote compliance with the SEC’s Investment Advisor requirements and assist us in preventing, detecting, and correcting violations. Policies against bribery and corruption are maintained, and are consistent with the U.S. Foreign Corrupt Practices Act and similar laws in other countries. We use a sophisticated web-based compliance tracking system to report and monitor employee Code of Ethics items such as political contributions, personal trading, conflicts of interest, and gifts.
ESG INVESTMENT STRATEGY
The Impact department captures, analyzes, and defines the material ESG objectives, initiatives, data tracking, and reporting strategy for each applicable investment vehicle. Funds invest in the areas of Education, Healthcare, Life Sciences, and Storage in accordance with the investment restrictions as outlined in each fund’s respective Limited Partnership Agreements. Each investment vehicle, and its respective portfolio manager, follows the impact framework to define ESG objectives that align with the investment strategy, control, asset class, and investment time horizon.
INVESTMENT DUE DILIGENCE
ESG assessment is integrated into due diligence processes. ESG evaluation criteria include alignment with our governance and ethics standards, presence of certifications and ratings, and an evaluation of the opportunity for efficiency investment.
Internal due diligence policies, procedures, and checklists are defined for specific asset class and investment vehicles. ESG risks and opportunities are captured, discussed and acted upon in the initial investment underwriting process, the Investment Committee presentation, and during the due diligence period.
RISK ASSESSMENT
Formal, Firm-wide risk assessments are led by our CCO every three years. Key risks are managed through enhancements to existing procedures across the organization. We actively prepare for unforeseen interruption to normal business practices and have established the following policies and procedures: Disaster Recovery, Business Continuity, and “Black Swan” events.
ESG risk assessment is performed on each new acquisition through established diligence procedures and on standing assets during annual business planning by the asset management team.
ESG REGULATORY COMPLIANCE
Increasing regulations around ESG data and carbon emissions disclosure are monitored closely to confirm our reporting and marketing materials are in compliance. Specifically, our investment funds are in compliance with the EU Sustainable Finance Disclosure Regulation (SFDR), which came into effect March 10, 2021. Similar evolving regulations in the US, Canada, and the Streamlined Energy and Carbon Reporting (SECR) guidance in the UK are closely monitored. In cases where the Firm is not required to comply, we often seek to voluntarily report. The Firm’s fund-level investor reporting and this public report are third-party reviewed to confirm alignment with the latest regulatory requirements.
MA
NA
GE
ME
NT
&
PO
LIC
Y
CORPOR ATE OPER ATIONS
The importance of ESG due diligence in the investment process has rapidly expanded from simply checking for a LEED certification to thorough third-party ESG assessments. Understanding the risks and opportunities up front leads to stronger underwriting and identification of accretive opportunities.
MARK BURKEMPERSENIOR MANAGING DIRECTOR, HEAD OF NORTH AMERICAN TRANSACTIONS GROUP
10 | 2610 | 26 2020 ESG IMPACT REPORT2020 ESG IMPACT REPORT
DIV
ER
SITY
, EQ
UIT
Y,
& IN
CLU
SIO
NWe have put in place deliberate and intentional actions to grow a diverse workforce and create a safe, inclusive, and growth-oriented environment for all employees.
LEADERSHIP & STRATEGY
Our DEI Committee is tasked with annual reporting, defining strategic objectives, and implementing new initiatives. The DEI Committee is sponsored by the CEO and co-chaired by three members of our Executive Committee. The committee’s strategic areas of focus are “Workplace” and “Team”. The objective of “Workplace” is to support and sustain an inclusive culture, measured by employee engagement, fair and equitable people processes, and inclusive leadership. The objective of “Team” is to retain and develop a diverse workforce at all levels, measured by employee demographics and retention. The DEI committee reviews progress quarterly, coordinates initiatives, and ensures DEI alignment to business strategies. Managers are held accountable for DEI training, performance, and behavior in annual performance assessments.
ANNUAL REPORTING
Employee and management statistics are reported quarterly, showing trending gender and ethnicity data to evaluate the effectiveness of hiring practices and employee retention. Annual statistics and trends are presented annually to the Executive Committee. In addition to gender, age distribution, race, and background, the 2020 DEI report also included a gender pay equity assessment which compared male and female annualized salary and bonus across each department and by career stage. The report was presented to the compensation committee for review and discussion. No incidents of discrimination were reported in 2020.
INCLUSION
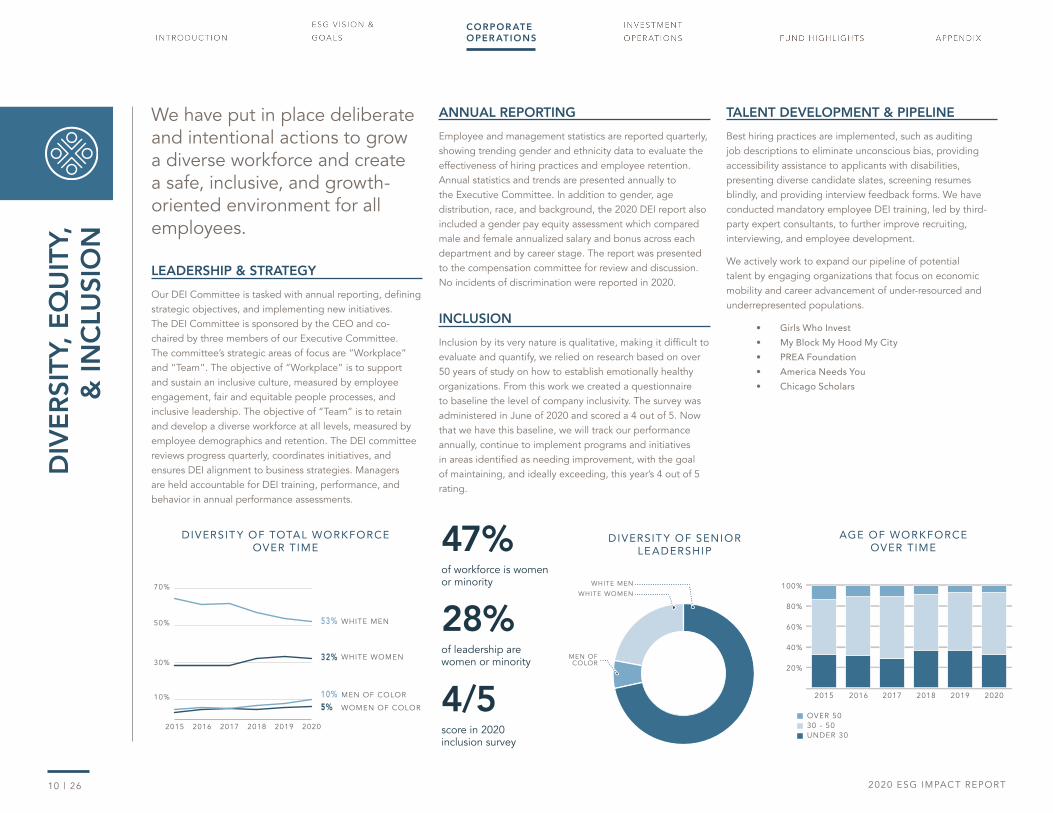
Inclusion by its very nature is qualitative, making it difficult to evaluate and quantify, we relied on research based on over 50 years of study on how to establish emotionally healthy organizations. From this work we created a questionnaire to baseline the level of company inclusivity. The survey was administered in June of 2020 and scored a 4 out of 5. Now that we have this baseline, we will track our performance annually, continue to implement programs and initiatives in areas identified as needing improvement, with the goal of maintaining, and ideally exceeding, this year’s 4 out of 5 rating.
TALENT DEVELOPMENT & PIPELINE
Best hiring practices are implemented, such as auditing job descriptions to eliminate unconscious bias, providing accessibility assistance to applicants with disabilities, presenting diverse candidate slates, screening resumes blindly, and providing interview feedback forms. We have conducted mandatory employee DEI training, led by third-party expert consultants, to further improve recruiting, interviewing, and employee development.
We actively work to expand our pipeline of potential talent by engaging organizations that focus on economic mobility and career advancement of under-resourced and underrepresented populations.
• Girls Who Invest
• My Block My Hood My City
• PREA Foundation
• America Needs You
• Chicago Scholars
10%
30%
50%
70%
2015 2017 20192016 2018 2020
53%
10%
5%
32%
MEN OF COLOR
WOMEN OF COLOR
WHITE WOMEN
WHITE MEN
47%of workforce is women or minority
4/5score in 2020 inclusion survey
28% of leadership are women or minority
DIVERSIT Y OF TOTAL WORKFORCE OVER TIME
MEN OFCOLOR
WHITE MEN
WHITE WOMEN
20%
40%
60%
80%
100%
20192018201720162015 2020
OVER 5030 - 50UNDER 30
DIVERSIT Y OF SENIOR LE ADERSHIP
AGE OF WORKFORCE OVER TIME
CORPOR ATE OPER ATIONS
11 | 2611 | 26 2020 ESG IMPACT REPORT2020 ESG IMPACT REPORT
TEA
M W
ELL
NE
SS
We offer comprehensive employee development and wellness programs, ensuring all team members have the tools they need to make their personal well-being a priority.
TEAM DEVELOPMENT
Employee development is facilitated through the Harrison Street University (HSU) training platform, which is an employee learning series focusing on mental and physical wellness, financial fitness, business acumen, and community engagement. Annual sustainability training is also provided to all employees, and targeted sustainability trainings are provided to specific departments. Full-time employees can be reimbursed for professional development courses with managerial approval. All employees receive annual reviews with their manager, including a formal annual review and mid-year appraisals in order to reflect on progress and set goals.
Team building is supported through programs such as Café Connections, where individuals who may not normally work together meet for lunch to connect both personally and professionally. Through our new-hire buddy program, new employees are paired with existing team members at a similar level in different departments, who serve as a peer mentor.
BENEFITS & COMPENSATION
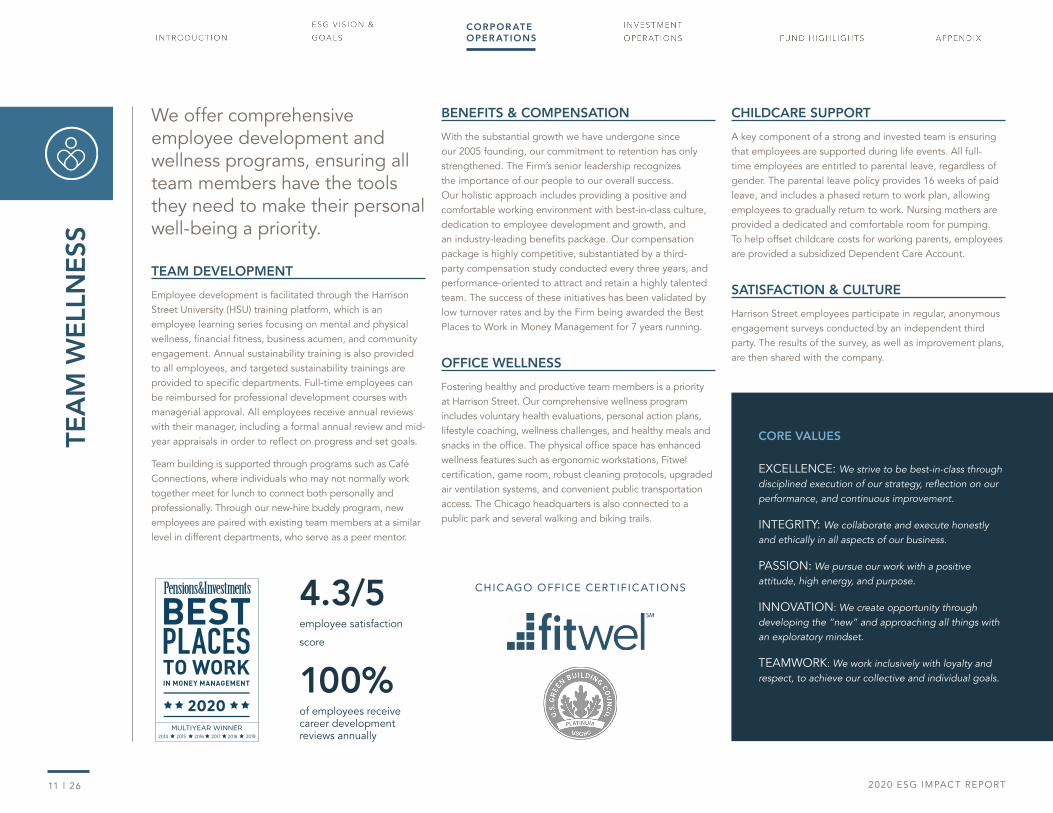
With the substantial growth we have undergone since our 2005 founding, our commitment to retention has only strengthened. The Firm’s senior leadership recognizes the importance of our people to our overall success. Our holistic approach includes providing a positive and comfortable working environment with best-in-class culture, dedication to employee development and growth, and an industry-leading benefits package. Our compensation package is highly competitive, substantiated by a third-party compensation study conducted every three years, and performance-oriented to attract and retain a highly talented team. The success of these initiatives has been validated by low turnover rates and by the Firm being awarded the Best Places to Work in Money Management for 7 years running.
OFFICE WELLNESS
Fostering healthy and productive team members is a priority at Harrison Street. Our comprehensive wellness program includes voluntary health evaluations, personal action plans, lifestyle coaching, wellness challenges, and healthy meals and snacks in the office. The physical office space has enhanced wellness features such as ergonomic workstations, Fitwel certification, game room, robust cleaning protocols, upgraded air ventilation systems, and convenient public transportation access. The Chicago headquarters is also connected to a public park and several walking and biking trails.
CHILDCARE SUPPORT
A key component of a strong and invested team is ensuring that employees are supported during life events. All full-time employees are entitled to parental leave, regardless of gender. The parental leave policy provides 16 weeks of paid leave, and includes a phased return to work plan, allowing employees to gradually return to work. Nursing mothers are provided a dedicated and comfortable room for pumping. To help offset childcare costs for working parents, employees are provided a subsidized Dependent Care Account.
SATISFACTION & CULTURE
Harrison Street employees participate in regular, anonymous engagement surveys conducted by an independent third party. The results of the survey, as well as improvement plans, are then shared with the company.
100% of employees receive career development reviews annually
4.3/5employee satisfaction
score
CHICAGO OFFICE CERTIFICATIONS
CORE VALUES
EXCELLENCE: We strive to be best-in-class through disciplined execution of our strategy, reflection on our performance, and continuous improvement.
INTEGRITY: We collaborate and execute honestly and ethically in all aspects of our business.
PASSION: We pursue our work with a positive attitude, high energy, and purpose.
INNOVATION: We create opportunity through developing the “new” and approaching all things with an exploratory mindset.
TEAMWORK: We work inclusively with loyalty and respect, to achieve our collective and individual goals.
CORPOR ATE OPER ATIONS

12 | 2612 | 26 2020 ESG IMPACT REPORT2020 ESG IMPACT REPORT
OP
ER
ATI
NG
PA
RTN
ER
SE
RV
ICE
SWe work closely with our operators and development partners to create market differentiation, enhance business operations, and accomplish our shared ESG impact goals.
PARTNER SELECTION & ESG VALUE ALIGNMENT
We strive to partner with those that share similar ESG and DEI values and consider these topics during investment diligence. New partners are vetted for a variety of elements, including company culture, management and pipeline talent, process rigor, marketing plans, financial acumen, and innovation. These findings are then analyzed and given a rating. Throughout the lifecycle of our relationship, partners are thoroughly reviewed for ethics, compliance, and conflicts of interest. Background checks are conducted on each new partner and repeated every three years for existing partners. Partner ESG policies, procedures, and previous project experience are reviewed.
OPERATIONAL IMPROVEMENTS
Our Operating Partner Services function is a differentiator for Harrison Street by providing operating partners with groundbreaking, business enhancement services and opportunities. The mission is to serve as an advocate for each of the firm’s JV operators and third-party providers, ensuring they have access to best practices, research, and key industry benchmarking data. Relevant technologies and ancillary products and services are also evaluated to identify opportunities that can enhance asset operations and solve common issues experienced in our asset classes.
Evaluating and comparing the performance of operators within the same asset class reveals best practices that can be applied to underperforming assets. Data on operators is used to rate and rank across the portfolios and peers to pinpoint strengths, weaknesses, and highlight opportunities for improvement.
NETWORK ENGAGEMENT & RESEARCH
We hold annual asset specific operating partner conferences to share best practices amongst operators and discuss current issues and future trends. External industry experts who are conducting research that is applicable to the asset class are featured as keynotes.
We also partner with world renowned research centers focused on key areas of interest including healthy aging, health, and wellness for the built environment, and ESG standard bodies. These relationships further define strategies for improving asset design and operation. In addition, these partnerships also provide educational workshops for operators on leading-edge research and best practices.
CORPOR ATE OPER ATIONS
COVID-19 SURFACE TESTING AT SENIOR
LIVING FACILITIES
During this year’s virtual senior housing operator conference, several operators shared success stories of how they were innovating viral response practices and keeping residents safe during the pandemic. Rapid surface testing was shown to be a highly effective strategy. Operators shared that high-touch surfaces in the community were tested regularly, allowing them to know almost immediately if the virus had entered the facility. This strategy enabled operators to identify asymptomatic individuals and quickly remove them from the facility up to five days prior to displaying symptoms. Whereas this approach was rolled out initially for COVID-19, the technology has now evolved to detect other infectious diseases including influenza and norovirus.
2020 OPERATOR ENGAGEMENTS
• HOSTED VIRTUAL OPERATING PARTNER CONFERENCE WITH RECORD PARTICIPATION
• HOSTED OPERATING PARTNER WEBINARS WITH INDUSTRY EXPERTS
• ISSUED A SERIES OF REPORTS HIGHLIGHTING HOW OPERATORS WERE COMBATING THE PANDEMIC
• FACILITATED COLLABORATIVE MEETINGS AMONG PARTNERS TO DISCUSS BEST PRACTICES FOR ADMINISTERING VACCINES
• PRODUCED QUARTERLY BEST PRACTICE NEWSLETTER DISTRIBUTED TO ALL OPERATING PARTNERS ACROSS SECTORS

13 | 2613 | 26 2020 ESG IMPACT REPORT2020 ESG IMPACT REPORT
INVESTMENT OPERATIONS Strong attention to ESG throughout the investment lifecycle provides our team the ability to identify areas to add value and create market differentiation, driving better outcomes for both our clients and the people our assets serve.
STEPHANIE BARRVICE PRESIDENT OF SUSTAINABILITY
PHOTO: Olympia Place, Amherst MA | Student Housing
14 | 2614 | 26 2020 ESG IMPACT REPORT2020 ESG IMPACT REPORT
CO
MM
UN
ITY
IMPA
CT
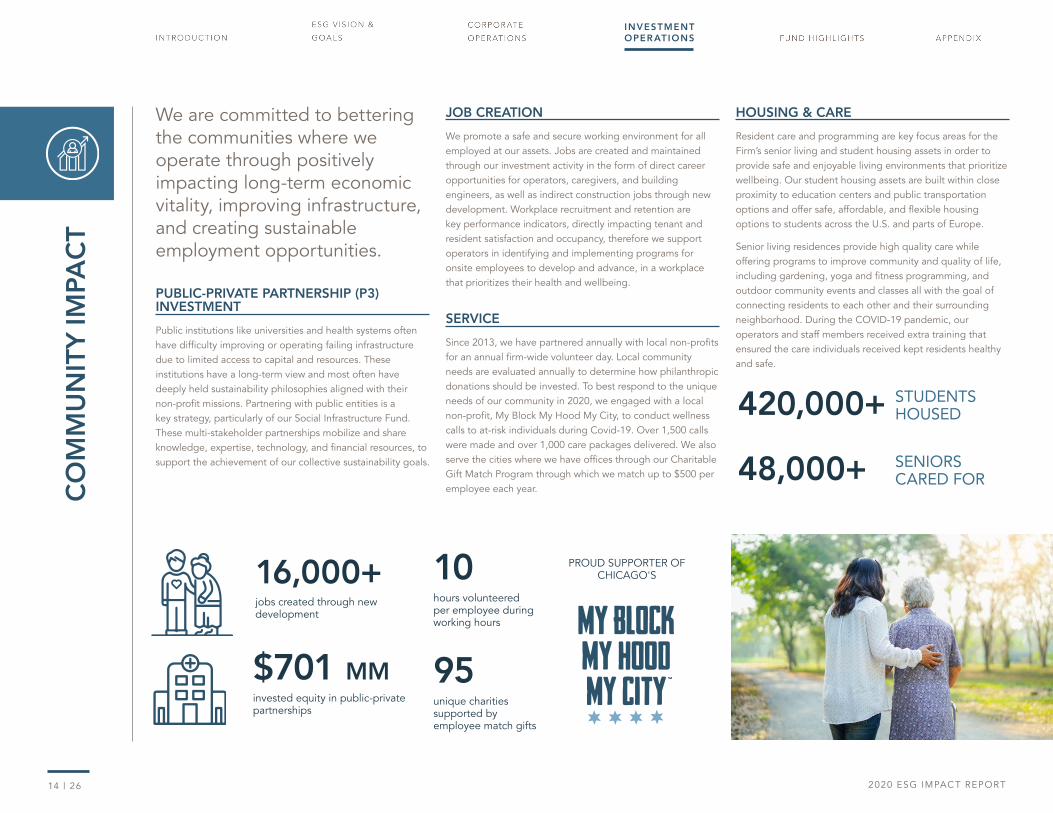
We are committed to bettering the communities where we operate through positively impacting long-term economic vitality, improving infrastructure, and creating sustainable employment opportunities.
PUBLIC-PRIVATE PARTNERSHIP (P3) INVESTMENT
Public institutions like universities and health systems often have difficulty improving or operating failing infrastructure due to limited access to capital and resources. These institutions have a long-term view and most often have deeply held sustainability philosophies aligned with their non-profit missions. Partnering with public entities is a key strategy, particularly of our Social Infrastructure Fund. These multi-stakeholder partnerships mobilize and share knowledge, expertise, technology, and financial resources, to support the achievement of our collective sustainability goals.
JOB CREATION
We promote a safe and secure working environment for all employed at our assets. Jobs are created and maintained through our investment activity in the form of direct career opportunities for operators, caregivers, and building engineers, as well as indirect construction jobs through new development. Workplace recruitment and retention are key performance indicators, directly impacting tenant and resident satisfaction and occupancy, therefore we support operators in identifying and implementing programs for onsite employees to develop and advance, in a workplace that prioritizes their health and wellbeing.
SERVICE
Since 2013, we have partnered annually with local non-profits for an annual firm-wide volunteer day. Local community needs are evaluated annually to determine how philanthropic donations should be invested. To best respond to the unique needs of our community in 2020, we engaged with a local non-profit, My Block My Hood My City, to conduct wellness calls to at-risk individuals during Covid-19. Over 1,500 calls were made and over 1,000 care packages delivered. We also serve the cities where we have offices through our Charitable Gift Match Program through which we match up to $500 per employee each year.
HOUSING & CARE
Resident care and programming are key focus areas for the Firm’s senior living and student housing assets in order to provide safe and enjoyable living environments that prioritize wellbeing. Our student housing assets are built within close proximity to education centers and public transportation options and offer safe, affordable, and flexible housing options to students across the U.S. and parts of Europe.
Senior living residences provide high quality care while offering programs to improve community and quality of life, including gardening, yoga and fitness programming, and outdoor community events and classes all with the goal of connecting residents to each other and their surrounding neighborhood. During the COVID-19 pandemic, our operators and staff members received extra training that ensured the care individuals received kept residents healthy and safe.
INVESTMENT OPER ATIONS
420,000+ STUDENTS HOUSED
48,000+ SENIORS CARED FOR
16,000+jobs created through new development
$701 MMinvested equity in public-private partnerships
10hours volunteered per employee during working hours
95unique charities supported by employee match gifts
PROUD SUPPORTER OF CHICAGO'S
15 | 2615 | 26 2020 ESG IMPACT REPORT2020 ESG IMPACT REPORT
CLI
MA
TE R
ESI
LIE
NC
Y
& E
MIS
SIO
NS
We are responding to climate change with enhanced procedures to mitigate our risk exposure and minimize our contribution to global emissions.
CLIMATE GOVERNANCE
The Chief Impact Officer is responsible for overseeing the strategy and internal procedures for climate risk assessment and mitigation. Climate risks and opportunities are reported to the CEO, executive committee, and management committee annually and related material information is shared regularly throughout the year.
CLIMATE RISK STRATEGY
Changing climate conditions will impact the operation, performance, and value of real assets. Increasingly common natural disasters pose high financial risk in key geographic areas, and other societal and regulatory risks influence the operational performance of assets. As a fiduciary, we seek to understand and manage these risks within our investment decision-making and management processes. These practices are continuously evaluated and enhanced as data
availability and evaluation tools evolve. Climate scenario data is used in a variety of ways, depending on the risk metric, the availability of data, and the investment horizon of the asset. Our strategy is captured in the table below.
CLIMATE RISK ASSESSMENT
Our risk assessment and management strategy has been developed in collaboration with our insurance consultant, Lockton Companies. The goal with this collaboration is to enhance the long-standing use of catastrophe modeling to layer in climate risk models, and deepen discussions on insurance expense, operational risks, and asset valuation. Climate risk is assessed in the following ways:
INVESTMENT UNDERWRITING & DUE DILIGENCE Environmental risk is evaluated using a third-party environmental assessment and a property condition assessment that includes efficiency evaluation and sustainability systems inventory. Key physical risks are identified during underwriting and further assessed during diligence. Diligence also includes a third-party assessment of efficiency and a capital improvement plan is required prior to closing.
STANDING PORTFOLIO ASSESSMENTHistorical catastrophe models are layered with forward looking climate data on physical and transition risks, considering both geography, surrounding community,
and building type. Material climate risk indicators across investment entities and assets are assessed, including but not limited to wildfires, inland flooding and severe storms, hurricanes and storm surge, sea level rises, terrorism, and the respective financial loss risk.
Based on fund exposure analysis, “Hotspots” are further analysed, seeking to understand key sectors, regions, and risk exposure for the fund. Hotspot analysis looks into site-level building design, tenant operations, and investment strategy to further evaluate the risk impact. Confirming that appropriate insurance coverage is present and if a deeper analysis of risk mitigation/adaptation should be conducted.
Finally, a “Deep-Dive Analysis” is conducted on any high risk assets that need further review by an engineering consultant to evaluate building improvements to mitigate risk, collaborating with insurance consultants to understand the impact on long-term expenses.
FIRM-WIDE RISK ASSESSMENTEvery three years a formal, firm-wide risk assessment is conducted, including a heat map of key risks and their impact on the business. ESG and climate risk are now included topics in this assessment and respective risk management procedures.
ASSESS MINIMIZE MITIGATE ADAPT
OBJECTIVE Conduct risk assessments during investment diligence and across standing portfolios.
Minimize carbon emissions through improved efficiency and renewable energy.
Mitigate climate risk by improving physical resiliency attributes of assets.
Build a resilient portfolio with reduced risk exposure and positioned to leverage opportunities.
OPPORTUNITY Understand current and future projected risks, insurance expense, operational disruptions, and long-term value opportunities.
Identify strategies for expense reduction, increased building lifespan, operational efficiency, and legislative compliance.
Evaluate impact of risks on long-term operations and investment strategy, positioning assets to be more resilient and valuable.
Acquire, develop, and operate Paris Accord-proof portfolios.
Given the risks that global climate change holds, it’s critical the real estate sector is prepared. By harnessing the power of data, we support clients with invaluable awareness of long-term climate risks, both physical and transition, allowing them to make better informed decisions and plan a strategy for the future.
ANDREW HAAKESENIOR VICE PRESIDENT, LOCKTON INSURANCE BROKER AND EXTERNAL RISK MANAGEMENT CONSULTANT
INVESTMENT OPER ATIONS

16 | 2616 | 26 2020 ESG IMPACT REPORT2020 ESG IMPACT REPORT
EMISSIONS STRATEGY
The Paris Accord has defined carbon reduction thresholds for each country in the world. These reduction thresholds will soon filter down to industries, including commercial real estate, which will result in sector-based emissions targets and carbon taxes for those unable to comply. Though these regulations are greatly driven by the priorities of any given administration, we expect most of the countries and states we operate within will have emission thresholds within the next few years. In fact, New York City has already passed aggressive emissions reduction legislation. To avoid future “brown penalties”, we are taking a proactive approach to reduce emissions through renewable energy procurement, on-site renewables development, efficient operations, and tenant engagement. Our strategy is data driven, focusing on the most inefficient assets in regions with the dirtiest grids, and assets in states or cities with increasingly stringent regulatory requirements.
RENEWABLE PROCUREMENT
Working with consistent procurement vendors across our real estate holdings supports both the procurement of renewable electric and tracking of supplier-specific emissions factors for reporting purposes. These procurement partners have been
established for Europe and are anticipated to be established for North America by the end of 2021. Procurement vendors are also providing smart metering, bill validation, data tracking and benchmarking, and data assurance services.
ON-SITE RENEWABLES & CLEAN ENERGY DEVELOPMENT
Though we have been active in building and acquiring on-site solar at our real estate assets for many years, we are expanding our focus and partnerships to greatly increase the solar capacity within our real estate funds over the next five years. In 2020, a majority of our real estate assets were reviewed for solar viability, with more than $10MM of immediate opportunities identified. This year will be focused on finalizing diligence and executing on these opportunities.
Through the company’s social infrastructure strategy, we have grown our investment in renewable energy assets and natural gas utilities that significantly reduce emissions of coal dominated grids. Our objectives include supporting utilities in meeting grid decarbonization goals, providing capital to accelerate renewable energy development, and transitioning power production away from coal.
EMISSIONS TRACKING METHODOLOGY
Our ESG Data Management software uses EPA’s EGRID emissions factors for North America and the IGES Emissions Factors for Europe, both of which are the industry standard for calculating market-based emissions, which constitutes the average emissions factor for various regions of the United States. Through new procurement vendors, we are working to begin tracking supplier-specific emissions factors for electricity.
METRICS & REPORTING
We have developed plans to track the following metrics at assets under operational control in funds submitting to GRESB. An annual summary of risks will be prepared and shared with internal staff and with investors upon request. Training for key internal teams will also be provided to ensure risk management procedures are integrated into business.
RISKS METRICS
HURRICANES & SEVERE STORMS % EXPOSURE OF RISK WITHIN FUND
FLOOD & SEA LEVEL RISE $MM FINANCIAL VALUE AT RISK
WILDFIRE CO2e SCOPE 1 & 2 GREENHOUSE GAS EMISSIONS
HEAT STRESS % / SF AREA OF EFFICIENCY ASSESSMENT
WATER STRESS % / SF AREA OF EFFICIENCY IMPROVEMENTS
CARBON TAX REGULATION $ INVESTMENT IN EFFICIENCY IMPROVEMENTS
MUNICIPAL REPORTING ORDINANCES
CLI
MA
TE R
ESI
LIE
NC
Y
& E
MIS
SIO
NS
INVESTMENT OPER ATIONS

17 | 2617 | 26 2020 ESG IMPACT REPORT2020 ESG IMPACT REPORT
INVESTMENT OPER ATIONS
$138 MM invested in renewable energy assets
-4%energy reduction in 2020 in Core Fund
58%building area with efficiency improvements in the Core Fund
We are committed to reducing our global emissions through increasing our investment in resource efficiency and adoption of clean energy technology.
NEW DEVELOPMENT
Development partners are engaged in enhancing their sustainable practices in design and construction. Prior to investment, we order a third-party engineering report to evaluate building strategies and ensure the highest-level of efficiency and tenant health. If needed, improvements are recommended to further optimize utility use and expense.
MONITORING
We import and monitor energy, water, carbon, certifications, and efficiency improvement projects into an ESG data platform for directly-managed operational assets in funds submitting to GRESB. Through this platform, assets are benchmarked, and the financial return of efficiency investments is monitored. Consumption monitoring helps the internal team target operational efficiencies, address spikes, and prioritize retrofits. Energy and water use intensities are evaluated and normalized for weather and square footage. The data platform also assists properties in reporting energy use to municipal benchmarking programs.
EFFICIENCY INVESTMENT
Following a Pareto analysis, properties with the highest consumption and cost are the first targeted for retrofits. Opportunities are identified by external vendors who produce audit reports that detail the investment opportunity and potential savings. Each fund establishes retrofit return thresholds that align with the investment strategy. Retrofitted properties are then monitored to validate that projected savings have been met.
BEHAVIOR & OPERATIONAL EFFICIENCY
Building operators are engaged in our data management platform and are tasked with actively monitoring consumption and cost. Building management systems, schedules, and controls are regularly reviewed to optimize building performance.
Sustainability language is integrated into tenant form leases; including energy and water conservation behavior, data sharing, and interior fit out requirements. In cases where tenants directly benefit from efficiency improvements, tenants are presented with a cost benefit analysis and financing or amortization proposal.
RATINGS & CERTIFICATIONS
Third-party evaluation of company assets and certification or labeling is employed where it is strategically advantageous. We prioritize LEED, Fitwel, and Energy Star in the U.S. and BREEAM, Fitwel, and Energy Performance Certificates in Europe. Municipal benchmarking requirements are increasing in cities where Harrison Street owns assets, thus we actively monitor, and where applicable, participate in these programs.
EFF
ICIE
NT
OP
ER
ATI
ON
S
STUDENT HOUSING EFFICIENT PROCUREMENT PLATFORM
Energy and water consumption in student housing is greatly driven by the fixtures installed in units. These fixtures are largely homogenous across our portfolio of assets and operators. Therefore, we vetted and engaged a supplier to set up a procurement platform for the ongoing purchase of efficient lighting and water fixture replacements. This strategy saves our operators 30% off of the list price of these materials.
In addition to the group purchasing opportunity for ongoing replacements and attic stock, we also assessed the status of current fixtures. Over the 2020 winter break we conducted site manager-led installs of LED bulbs and water efficient showerheads and aerators. In total, 29 student housing properties were retrofitted with interior LED lighting and low-flow water fixtures at a cost of $360K with an estimated annual savings of $460K.
Our next steps are to extend this platform to other sectors and pursue deeper retrofits at these same student housing properties, including toilet retrofits, HVAC optimization, equipment replacements, and smart thermostats.
18 | 2618 | 26 2020 ESG IMPACT REPORT2020 ESG IMPACT REPORT
HE
ALT
H &
WE
LLN
ESS
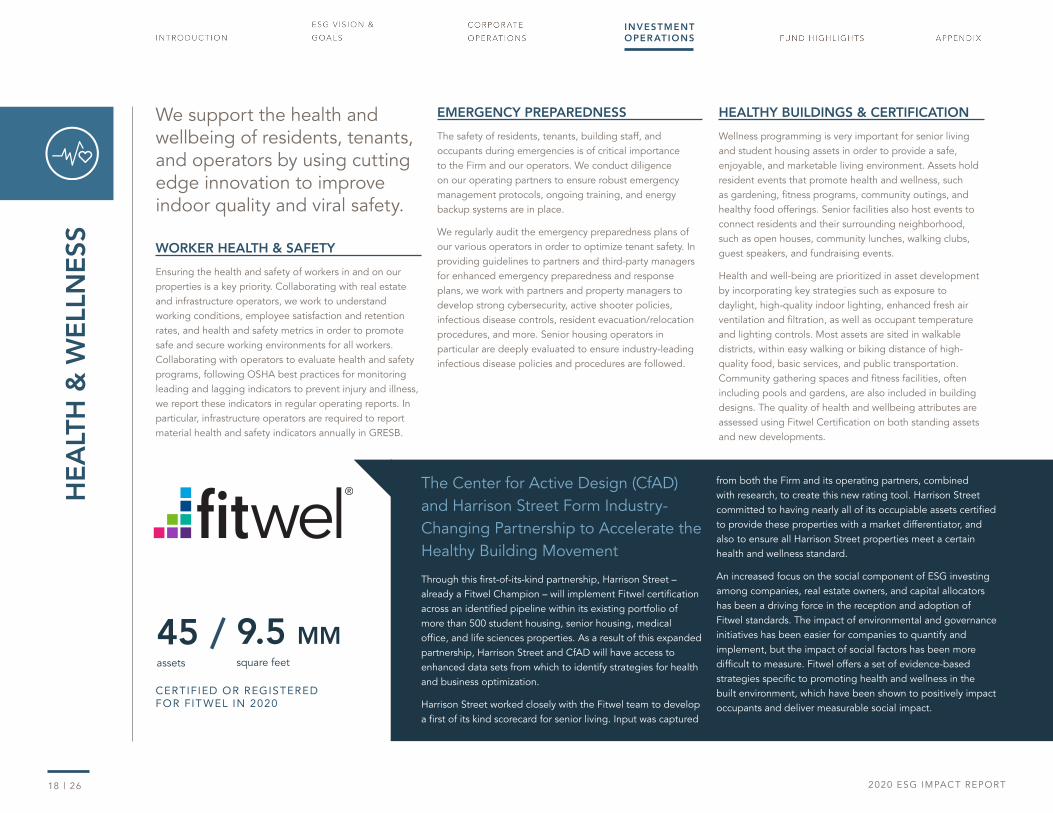
We support the health and wellbeing of residents, tenants, and operators by using cutting edge innovation to improve indoor quality and viral safety.
WORKER HEALTH & SAFETY
Ensuring the health and safety of workers in and on our properties is a key priority. Collaborating with real estate and infrastructure operators, we work to understand working conditions, employee satisfaction and retention rates, and health and safety metrics in order to promote safe and secure working environments for all workers. Collaborating with operators to evaluate health and safety programs, following OSHA best practices for monitoring leading and lagging indicators to prevent injury and illness, we report these indicators in regular operating reports. In particular, infrastructure operators are required to report material health and safety indicators annually in GRESB.
EMERGENCY PREPAREDNESS
The safety of residents, tenants, building staff, and occupants during emergencies is of critical importance to the Firm and our operators. We conduct diligence on our operating partners to ensure robust emergency management protocols, ongoing training, and energy backup systems are in place.
We regularly audit the emergency preparedness plans of our various operators in order to optimize tenant safety. In providing guidelines to partners and third-party managers for enhanced emergency preparedness and response plans, we work with partners and property managers to develop strong cybersecurity, active shooter policies, infectious disease controls, resident evacuation/relocation procedures, and more. Senior housing operators in particular are deeply evaluated to ensure industry-leading infectious disease policies and procedures are followed.
HEALTHY BUILDINGS & CERTIFICATION
Wellness programming is very important for senior living and student housing assets in order to provide a safe, enjoyable, and marketable living environment. Assets hold resident events that promote health and wellness, such as gardening, fitness programs, community outings, and healthy food offerings. Senior facilities also host events to connect residents and their surrounding neighborhood, such as open houses, community lunches, walking clubs, guest speakers, and fundraising events.
Health and well-being are prioritized in asset development by incorporating key strategies such as exposure to daylight, high-quality indoor lighting, enhanced fresh air ventilation and filtration, as well as occupant temperature and lighting controls. Most assets are sited in walkable districts, within easy walking or biking distance of high-quality food, basic services, and public transportation. Community gathering spaces and fitness facilities, often including pools and gardens, are also included in building designs. The quality of health and wellbeing attributes are assessed using Fitwel Certification on both standing assets and new developments.
INVESTMENT OPER ATIONS
45assets
9.5 MMsquare feet
/CERTIFIED OR REGISTERED FOR FIT WEL IN 2020
The Center for Active Design (CfAD) and Harrison Street Form Industry-Changing Partnership to Accelerate the Healthy Building Movement
Through this first-of-its-kind partnership, Harrison Street – already a Fitwel Champion – will implement Fitwel certification across an identified pipeline within its existing portfolio of more than 500 student housing, senior housing, medical office, and life sciences properties. As a result of this expanded partnership, Harrison Street and CfAD will have access to enhanced data sets from which to identify strategies for health and business optimization.
Harrison Street worked closely with the Fitwel team to develop a first of its kind scorecard for senior living. Input was captured
from both the Firm and its operating partners, combined with research, to create this new rating tool. Harrison Street committed to having nearly all of its occupiable assets certified to provide these properties with a market differentiator, and also to ensure all Harrison Street properties meet a certain health and wellness standard.
An increased focus on the social component of ESG investing among companies, real estate owners, and capital allocators has been a driving force in the reception and adoption of Fitwel standards. The impact of environmental and governance initiatives has been easier for companies to quantify and implement, but the impact of social factors has been more difficult to measure. Fitwel offers a set of evidence-based strategies specific to promoting health and wellness in the built environment, which have been shown to positively impact occupants and deliver measurable social impact.
19 | 2619 | 26 2020 ESG IMPACT REPORT2020 ESG IMPACT REPORT
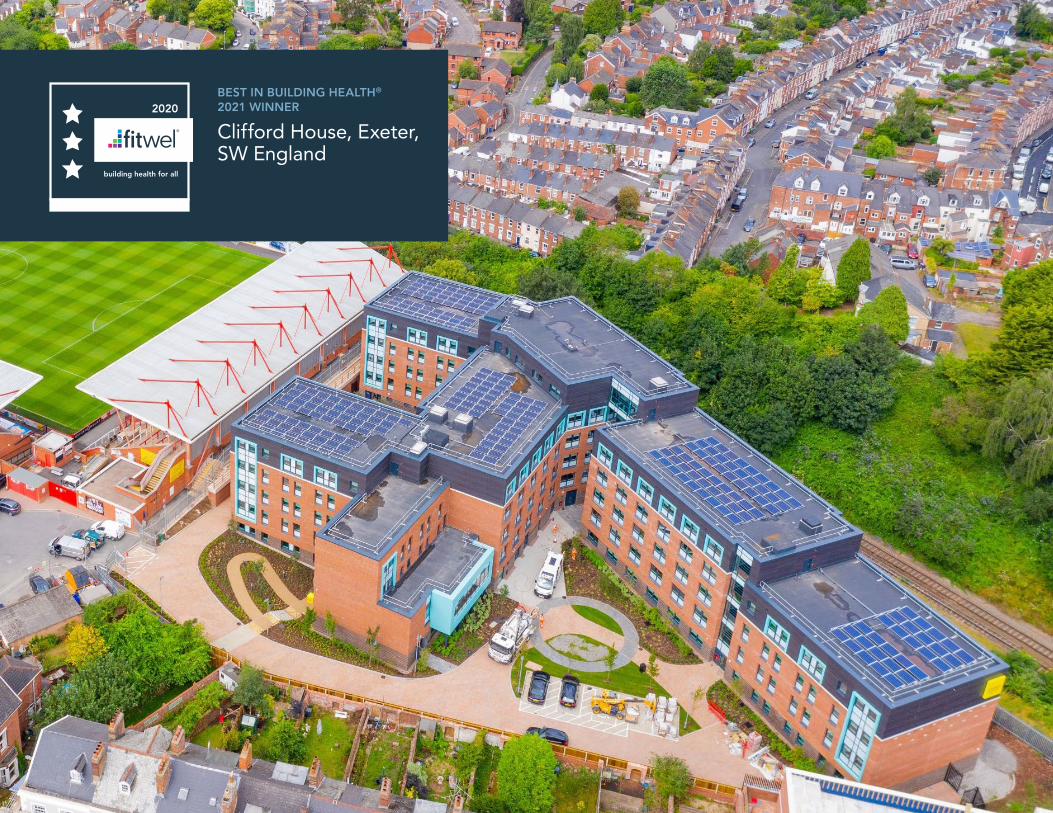
BEST IN BUILDING HEALTH®
2021 WINNER
Clifford House, Exeter, SW England
2020
building health for all
20 | 2620 | 26 2020 ESG IMPACT REPORT2020 ESG IMPACT REPORT
US CORE FUND
FUND HIGHLIGHTS
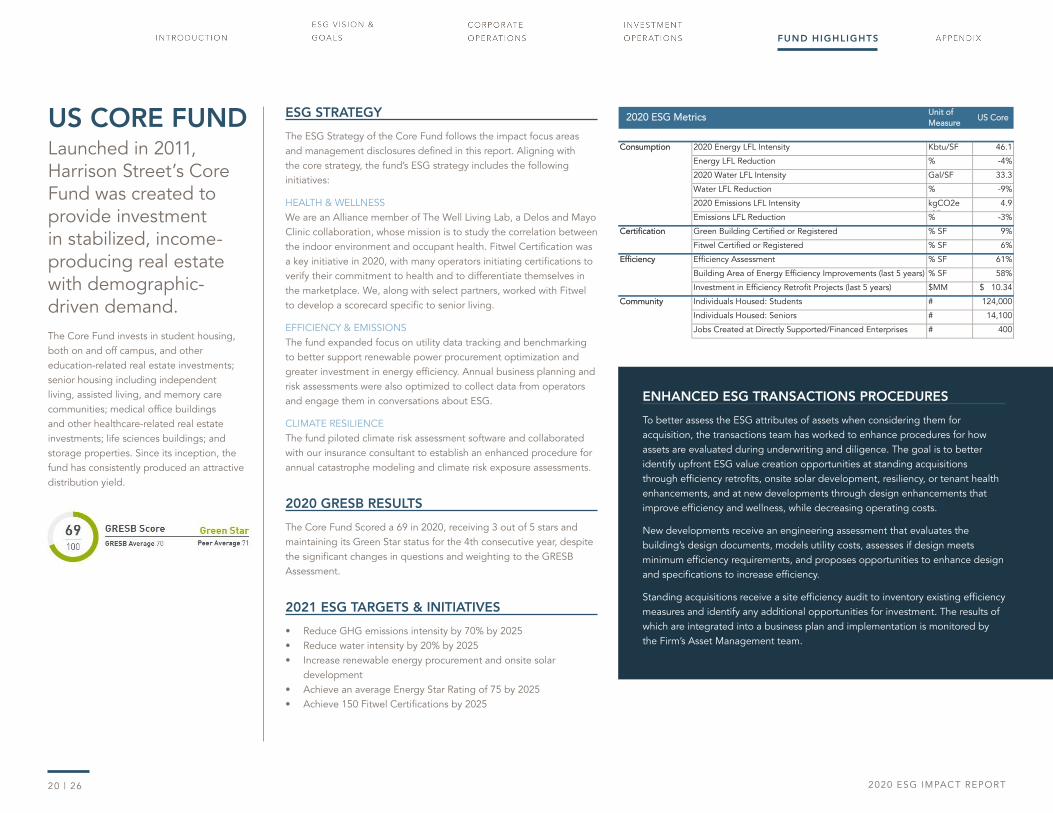
Launched in 2011, Harrison Street’s Core Fund was created to provide investment in stabilized, income-producing real estate with demographic-driven demand.The Core Fund invests in student housing, both on and off campus, and other education-related real estate investments; senior housing including independent living, assisted living, and memory care communities; medical office buildings and other healthcare-related real estate investments; life sciences buildings; and storage properties. Since its inception, the fund has consistently produced an attractive distribution yield.
UUnniitt ooff MMeeaassuurree
UUSS CCoorree
CCoonnssuummppttiioonn 2020 Energy LFL Intensity Kbtu/SF 46.1
Energy LFL Reduction % -4%
2020 Water LFL Intensity Gal/SF 33.3
Water LFL Reduction % -9%
2020 Emissions LFL Intensity kgCO2e /SF
4.9
Emissions LFL Reduction % -3%
CCeerrttiiffiiccaattiioonn Green Building Certified or Registered % SF 9%
Fitwel Certified or Registered % SF 6%
EEffffiicciieennccyy Efficiency Assessment % SF 61%
Building Area of Energy Efficiency Improvements (last 5 years) % SF 58%
Investment in Efficiency Retrofit Projects (last 5 years) $MM $ 10.34
CCoommmmuunniittyy II
Individuals Housed: Students # 124,000
Individuals Housed: Seniors # 14,100
Jobs Created at Directly Supported/Financed Enterprises # 400
22002200 EESSGG MMeettrriiccss UUnniitt ooff MMeeaassuurree
EEuurrooppee FFuunndd II
EEuurrooppee FFuunndd IIII
EEuurrooppee FFuunndd IIIIII
CCoonnssuummppttiioonn
2020 Energy LFL Intensity Kbtu/SF 32.4 33.6 138.6
2020 Water LFL Intensity Gal/SF 49.4 33.1 13.2
2020 Emissions LFL Intensity kgCO2e /SF
2.2 2.7 9.1
CCeerrttiiffiiccaattiioonn
Green Building Certified or Registered % SF 16% 20% 36%
Fitwel Certified or Registered % SF 16% 50% 86%
CCoommmmuunniittyy IImmppaacctt
Individuals Housed: Students # 12,700 15,700 -
Jobs Created at Directly Supported/Financed Enterprises # 80 180 -
22002200 EESSGG MMeettrriiccss UUnniitt ooff MMeeaassuurree
SSIIFF
Energy Generated for Sale: Renewable2 GWh 86
Energy Generated for Sale: Non-Renewable2 GWh 225
Greenhouse Gas Emissions: Direct MTCO2e 1,124
Greenhouse Gas Emissions: Indirect MTCO2e 2,109
GHG Emissions of Energy Generated for Sale (at Ownership 2
MTCO2e 25,532
GHG Emissions Avoided 3 MTCO2e (64,221)
Greenhouse Gas Emissions: Total MTCO2e 28,765
Total Capacity of Renewable Energy Assets MW 311
Equivalent Number of Homes (at 100% Share)4 # 46,200
CCoommmmuunniittyy II
Individuals Housed: Students6 # 9,200
Individuals Housed: Seniors6 # -
22002200 EESSGG MMeettrriiccss
CCoonnssuummppttiioonn && PPrroodduuccttiioonn
ESG STRATEGY
The ESG Strategy of the Core Fund follows the impact focus areas and management disclosures defined in this report. Aligning with the core strategy, the fund’s ESG strategy includes the following initiatives:
HEALTH & WELLNESSWe are an Alliance member of The Well Living Lab, a Delos and Mayo Clinic collaboration, whose mission is to study the correlation between the indoor environment and occupant health. Fitwel Certification was a key initiative in 2020, with many operators initiating certifications to verify their commitment to health and to differentiate themselves in the marketplace. We, along with select partners, worked with Fitwel to develop a scorecard specific to senior living.
EFFICIENCY & EMISSIONSThe fund expanded focus on utility data tracking and benchmarking to better support renewable power procurement optimization and greater investment in energy efficiency. Annual business planning and risk assessments were also optimized to collect data from operators and engage them in conversations about ESG.
CLIMATE RESILIENCEThe fund piloted climate risk assessment software and collaborated with our insurance consultant to establish an enhanced procedure for annual catastrophe modeling and climate risk exposure assessments.
2020 GRESB RESULTS
The Core Fund Scored a 69 in 2020, receiving 3 out of 5 stars and maintaining its Green Star status for the 4th consecutive year, despite the significant changes in questions and weighting to the GRESB Assessment.
2021 ESG TARGETS & INITIATIVES
• Reduce GHG emissions intensity by 70% by 2025• Reduce water intensity by 20% by 2025• Increase renewable energy procurement and onsite solar
development• Achieve an average Energy Star Rating of 75 by 2025• Achieve 150 Fitwel Certifications by 2025
ENHANCED ESG TRANSACTIONS PROCEDURES
To better assess the ESG attributes of assets when considering them for acquisition, the transactions team has worked to enhance procedures for how assets are evaluated during underwriting and diligence. The goal is to better identify upfront ESG value creation opportunities at standing acquisitions through efficiency retrofits, onsite solar development, resiliency, or tenant health enhancements, and at new developments through design enhancements that improve efficiency and wellness, while decreasing operating costs.
New developments receive an engineering assessment that evaluates the building’s design documents, models utility costs, assesses if design meets minimum efficiency requirements, and proposes opportunities to enhance design and specifications to increase efficiency.
Standing acquisitions receive a site efficiency audit to inventory existing efficiency measures and identify any additional opportunities for investment. The results of which are integrated into a business plan and implementation is monitored by the Firm’s Asset Management team.

21 | 2621 | 26 2020 ESG IMPACT REPORT2020 ESG IMPACT REPORT
FUND HIGHLIGHTS
NORTH AMERICAN SOCIAL INFRASTRUCTURE FUND
UUnniitt ooff MMeeaassuurree
UUSS CCoorree
CCoonnssuummppttiioonn 2020 Energy LFL Intensity Kbtu/SF 46.1
Energy LFL Reduction % -4%
2020 Water LFL Intensity Gal/SF 33.3
Water LFL Reduction % -9%
2020 Emissions LFL Intensity kgCO2e /SF
4.9
Emissions LFL Reduction % -3%
CCeerrttiiffiiccaattiioonn Green Building Certified or Registered % SF 9%
Fitwel Certified or Registered % SF 6%
EEffffiicciieennccyy Efficiency Assessment % SF 61%
Building Area of Energy Efficiency Improvements (last 5 years) % SF 58%
Investment in Efficiency Retrofit Projects (last 5 years) $MM $ 10.34
CCoommmmuunniittyy II
Individuals Housed: Students # 124,000
Individuals Housed: Seniors # 14,100
Jobs Created at Directly Supported/Financed Enterprises # 400
22002200 EESSGG MMeettrriiccss UUnniitt ooff MMeeaassuurree
EEuurrooppee FFuunndd II
EEuurrooppee FFuunndd IIII
EEuurrooppee FFuunndd IIIIII
CCoonnssuummppttiioonn
2020 Energy LFL Intensity Kbtu/SF 32.4 33.6 138.6
2020 Water LFL Intensity Gal/SF 49.4 33.1 13.2
2020 Emissions LFL Intensity kgCO2e /SF
2.2 2.7 9.1
CCeerrttiiffiiccaattiioonn
Green Building Certified or Registered % SF 16% 20% 36%
Fitwel Certified or Registered % SF 16% 50% 86%
CCoommmmuunniittyy IImmppaacctt
Individuals Housed: Students # 12,700 15,700 -
Jobs Created at Directly Supported/Financed Enterprises # 80 180 -
22002200 EESSGG MMeettrriiccss UUnniitt ooff MMeeaassuurree
SSIIFF
Energy Generated for Sale: Renewable2 GWh 86
Energy Generated for Sale: Non-Renewable2 GWh 225
Greenhouse Gas Emissions: Direct MTCO2e 1,124
Greenhouse Gas Emissions: Indirect MTCO2e 2,109
GHG Emissions of Energy Generated for Sale (at Ownership 2
MTCO2e 25,532
GHG Emissions Avoided 3 MTCO2e (64,221)
Greenhouse Gas Emissions: Total MTCO2e 28,765
Total Capacity of Renewable Energy Assets MW 311
Equivalent Number of Homes (at 100% Share)4 # 46,200
CCoommmmuunniittyy II
Individuals Housed: Students6 # 9,200
Individuals Housed: Seniors6 # -
22002200 EESSGG MMeettrriiccss
CCoonnssuummppttiioonn && PPrroodduuccttiioonn
Launched in 2018, Harrison Street’s Social Infrastructure Fund was developed to service universities, health systems, and government users. Deferred maintenance, decarbonization, and resiliency trends have driven demand for capital solutions in the space. The fund focuses on highly structured assets within these segments, supported by long-term contractual arrangements that produce consistent financial performance across economic cycles.
ESG STRATEGY
The ESG strategy of the Social Infrastructure Fund follows the impact focus areas and management disclosures defined in this report. Aligning with the long-term strategy of the fund, the ESG strategy includes the following initiatives:
HEALTH & WELLNESSThe fund invested in infrastructure that serves educational facilities and healthcare systems, greatly expanding on-campus student beds and the development of patient beds at medical facilities. By utilizing the fund’s investments in such projects, these institutions can free up their own capital to better invest in the health and well-being of students, faculty, and staff.
EFFICIENCY & EMISSIONS The fund expanded investment in solar, wind, and efficient power production that contribute to grid decarbonization. Upon acquiring an asset, the fund validates asset performance in several ways including tracking actual vs. forecasted production (for an energy asset), and always seeking to improve operational efficiency of the assets.
CLIMATE RESILIENCEDistributed, localized energy generation and storage infrastructure are increasingly important as power grid operators seek resilience amid natural disasters and more frequent climate change induced storms.
2020 GRESB RESULTS
2020 was the first year the fund submitted both the Management and Asset components, receiving a GRESB fund score of 60 and 2/5 stars, consistent with the fund’s peer average.
2021 ESG TARGETS & INITIATIVES
• Implement ESG data management software and establish asset-level targets
• Ongoing enhancement of ESG and Climate Risk assessments on standing assets and acquisitions
• LEED certification achieved or in progress for 9-asset University of Kentucky portfolio
GEVO WIND PROJECT
Gevo Inc., Juhl Energy, and Harrison Street completed the construction of two wind turbines that will supply 5 MW of renewable electricity annually to Gevo subsidiary Agri-Energy’s production plant located in Luverne, Minnesota. The Gevo Wind Project utilizes tier I wind turbine generator (“WTG”) technology that is estimated to generate 20,000 MWh annually. The turbines were officially placed into service on May 1, 2020.
The wind farm is fully contracted for 20 years with the local electricity cooperative, Missouri River Energy Services (“MRES”) (Moodys: Aa3). Juhl Energy successfully coordinated the arrangement between MRES and Agri-Energy to wire the electricity generated from the wind farm directly to Agri-Energy. This allows Agri-Energy to decarbonize its production of bio-based products, such as ethanol or isobutanol, and reduce its overall cost of energy. The emissions-free energy will also enable Gevo to obtain a lower carbon intensity score under the Low Carbon Fuel Standard (“LCFS”) in California.
Laying the groundwork for renewable jet fuel
“The wind energy produced from these towers will help to take us off the fossil grid. It’s a great first step, setting up our infrastructure for jet fuel and renewable gasoline,” said Patrick Gruber, CEO of Gevo.
Gevo is a next generation “low-carbon” fuel company focused on the development and commercialization of renewable alternatives to petroleum-based products. They focus on producing clean, high-quality fuels for jets, vehicles, and other uses. Supplying Gevo and its subsidiaries with clean electricity enables them to maintain a low carbon footprint throughout the fuel production process.
Harrison Street’s partner, Juhl Energy, will be the operator of the wind project. Juhl Energy is an established leader in the renewable energy industry with a focus on competitive, clean energy projects ranging in size from 5 to 50 MW. Juhl has over 25 fully-built projects to date, representing over 350 MWs and $750 million in value.

22 | 2622 | 26 2020 ESG IMPACT REPORT2020 ESG IMPACT REPORT
FUND HIGHLIGHTS
EUROPEAN OPPORTUNISTIC FUND SERIES
UUnniitt ooff MMeeaassuurree
UUSS CCoorree
CCoonnssuummppttiioonn 2020 Energy LFL Intensity Kbtu/SF 46.1
Energy LFL Reduction % -4%
2020 Water LFL Intensity Gal/SF 33.3
Water LFL Reduction % -9%
2020 Emissions LFL Intensity kgCO2e /SF
4.9
Emissions LFL Reduction % -3%
CCeerrttiiffiiccaattiioonn Green Building Certified or Registered % SF 9%
Fitwel Certified or Registered % SF 6%
EEffffiicciieennccyy Efficiency Assessment % SF 61%
Building Area of Energy Efficiency Improvements (last 5 years) % SF 58%
Investment in Efficiency Retrofit Projects (last 5 years) $MM $ 10.34
CCoommmmuunniittyy II
Individuals Housed: Students # 124,000
Individuals Housed: Seniors # 14,100
Jobs Created at Directly Supported/Financed Enterprises # 400
22002200 EESSGG MMeettrriiccss UUnniitt ooff MMeeaassuurree
EEuurrooppee FFuunndd II
EEuurrooppee FFuunndd IIII
EEuurrooppee FFuunndd IIIIII
CCoonnssuummppttiioonn
2020 Energy LFL Intensity Kbtu/SF 32.4 33.6 138.6
2020 Water LFL Intensity Gal/SF 49.4 33.1 13.2
2020 Emissions LFL Intensity kgCO2e /SF
2.2 2.7 9.1
CCeerrttiiffiiccaattiioonn
Green Building Certified or Registered % SF 16% 20% 36%
Fitwel Certified or Registered % SF 16% 50% 86%
CCoommmmuunniittyy IImmppaacctt
Individuals Housed: Students # 12,700 15,700 -
Jobs Created at Directly Supported/Financed Enterprises # 80 180 -
22002200 EESSGG MMeettrriiccss UUnniitt ooff MMeeaassuurree
SSIIFF
Energy Generated for Sale: Renewable2 GWh 86
Energy Generated for Sale: Non-Renewable2 GWh 225
Greenhouse Gas Emissions: Direct MTCO2e 1,124
Greenhouse Gas Emissions: Indirect MTCO2e 2,109
GHG Emissions of Energy Generated for Sale (at Ownership 2
MTCO2e 25,532
GHG Emissions Avoided 3 MTCO2e (64,221)
Greenhouse Gas Emissions: Total MTCO2e 28,765
Total Capacity of Renewable Energy Assets MW 311
Equivalent Number of Homes (at 100% Share)4 # 46,200
CCoommmmuunniittyy II
Individuals Housed: Students6 # 9,200
Individuals Housed: Seniors6 # -
22002200 EESSGG MMeettrriiccss
CCoonnssuummppttiioonn && PPrroodduuccttiioonn
Launched in 2015, the European opportunistic fund series investment focus is to create a diversified portfolio in the Life Sciences & Technology, Specialty Residential and Education sectors across Europe.The fund series has invested over €3 billion in approximately 16,000 student housing beds, over 2,600 specialty residential units, and 1.6 million square feet of life sciences throughout Europe.
ESG STRATEGY
The ESG Strategy of the European Opportunistic Series follows the impact focus areas and management disclosures defined in this report. Aligning with the opportunistic-strategy with significant focus on development and redevelopment, the fund’s ESG strategy includes the following initiatives:
HEALTH & WELLNESSStudent housing and build-to-rent are key sectors for the funds. To care for the well-being of residents, operators pay special attention to the design of amenity spaces and programs in order to ensure assets provide the best living environment for residents. Fitwel Certification was a key initiative in 2020, with many operators initiating certifications to verify their commitment to health and to differentiate themselves in the marketplace.
EFFICIENCY & EMISSIONSThe fund expanded focus on utility data tracking and benchmarking, and engaged with procurement vendors to transition energy contracts to green power. Vendors were also engaged to conduct efficiency assessments at assets and prioritize improvements in capital planning.
CLIMATE RESILIENCEIt is essential to the performance, operational stability, and, foremost, the safety of residents to ensure that emergency preparedness plans and energy backup systems are in place at each individual asset. Physical climate risk and energy transition adaptation are also present in the fund, and these risks and opportunities are evaluated during due diligence.
2020 GRESB RESULTS
Europe Fund I received 3/5 stars and a score of 70 for their standing fund score. Europe Fund II received 4/5 stars and a score of 82 for their development fund score. Europe Fund III will submit for the first time in 2021. The leadership shown in GRESB score by the European series demonstrates the funds’ priority on sustainable and efficient design and construction practices.
2021 ESG TARGETS & INITIATIVES
• Reduce GHG emissions intensity by 70% by 2025• Reduce water intensity by 20% by 2025• Increase renewable energy procurement and onsite solar development• Achieve an average EPC Rating of B by 2025• Certify all eligible buildings through BREEAM and/or Fitwel
PROGRAMMATIC UTILITIES PROCUREMENT & MANAGEMENT STRATEGY
With the goal of decreasing the emissions of our operating European assets, we took the initiative to standardize procurement and utility management practices across the fund and across operators. To accomplish this standardization, we vetted several reputable vendors who will be regionally and sector-focused across the EU and UK. We kicked off engagements between preferred vendors and operators this past fall, and began to transition assets onto the new platforms, starting by setting consumption baselines and inventorying standing procurement contracts.
In February of 2021, each asset received a carbon baseline assessment. These assessments indicate the asset’s path to net zero through efficiency, on-site renewable, renewable electric, and offset purchases. Once a plan is in place for the asset, vendors are responsible for validating consumption and loading data into a central tracking portal that is then shared with operators monthly.
This critical effort sets the stage for the funds to comply with UK and EU carbon regulation, to provide insight into value creation and expense reduction strategies, and to set a baseline for carbon reduction targets, which collectively bring the funds closer to their goal of reducing emissions.
EUROPE OPP FUND I [STANDING]
EUROPE OPP FUND II [DEVELOPMENT]

23 | 2623 | 26 2020 ESG IMPACT REPORT2020 ESG IMPACT REPORT
ESG
DA
TA
APPENDIX
APPENDIX
22002200 HHaarrrriissoonn SSttrreeeett EESSGG DDaattaa
IIRRIISS CCooddee UUnniitt ooff MMeeaassuurreeUUSS CCoorree
FFuunndd
SSoocciiaall IInnffrraassttrruuccttuurree
FFuunndd
EEuurrooppeeFFuunndd II
EEuurrooppeeFFuunndd IIII
EEuurrooppee FFuunndd IIIIII UUSS FFuunndd VVIIII
EEnneerrggyy Absolute Energy Data Coverage1 % SF 95% 96% 100% 100% 100%
Energy Purchased: Non-Renewable Electric OI1496 GWh 325 4 6 13 85
Energy Purchased: Non-Renewable Gas OI1496 GWh 146 6 1 5 43
Energy Purchased: Non-Renewable District OI1496 GWh 13 - - - 15
Energy Generated for Sale: Renewable (Ownership Share %)2 PI5842 GWh 86
Energy Generated for Sale: Non-Renewable (at Ownership Share %)2 PI2210 GWh 225
Energy Generated for Use: Renewable OI2496 GWh 6 - - - -
LFL Energy Tracking Coverage5 % SF 67% 90% 80% 100%
2019 Energy LFL Intensity Kbtu/SF 48.2
2020 Energy LFL Intensity Kbtu/SF 46.1 32.4 33.6 138.6
Energy LFL Reduction % -4%
WWaatteerr Absolute Water Data Coverage1 % SF 90% 73% 100% 100%
Water Consumed: Total OI1697 MGal 974 24 60 27
LFL Water Tracking Coverage5 % SF 67% 73% 80% 100%
2019 Water LFL Intensity Gal/SF 36.6
2020 Water LFL Intensity Gal/SF 33.3 49.4 33.1 13.2
Water LFL Reduction % -9%
EEmmiissssiioonnss Absolute Emissions Data Coverage1 % SF 95% 96% 100% 100% 100%
Greenhouse Gas Emissions: Direct OI4112 MTCO2e 26,510 1,124 256 837 7,818
Greenhouse Gas Emissions: Indirect OI9604 MTCO2e 131,547 2,109 1,154 2,522 11,040
GHG Emissions of Energy Generated for Sale (at Ownership Share %)2 PI7015 MTCO2e 25,532
GHG Emissions Avoided (Ownership Share %)3 PI2764 MTCO2e (64,221)
Greenhouse Gas Emissions: Total OI1479 MTCO2e 158,057 28,765 1,410 3,359 18,858
LFL Emissions Tracking Coverage5 % SF 67% 96% 90% 80% 100%
2019 Emissions LFL Intensity kgCO2e /SF 5.0
2020 Emissions LFL Intensity kgCO2e /SF 4.9 2.2 2.7 9.1
Emissions LFL Reduction % -3%
CCeerrttiiffiiccaattiioonnss Green Building Certified or Registered OI1120 % SF 9% 0% 16% 20% 36% 8%
Fitwel Certified or Registered OI1120 % SF 6% 0% 16% 50% 86% 4%
Efficiency Assessment % SF 61% 90% 30% 81% 16%
Building Area of Energy Efficiency Improvements (last 5 years) PI1586 % SF 58%
Investment in Efficiency Retrofit Projects (last 5 years) $MM $ 10.34
RReenneewwaabbllee EEnneerrggyy IInnvveessttmmeenntt
Value of Renewable Energy Equity Investments Closed (to date) PI4142 $MM $ 138.19
Total Capacity of Renewable Energy Assets MW 5 311 - - - -
Equivalent Number of Homes (at 100% Share)4 # 516 46,200 - - - -
CCoommmmuunniittyy IImmppaacctt
Value of P3 Equity Investments Closed (to date) PI4142 $MM $ 503.41
Individuals Housed: Students6 PI2640 # 124,000 9,200 12,700 15,700 - 660
Individuals Housed: Seniors6 PI2640 # 14,100 - - - - -
Jobs Created at Directly Supported/Financed Enterprises6 PI3687 # 400 400 80 180 - 2,400
Indirect Jobs Created from New Development6 # 2,700
NOTES 1. Coverage: Percent of gross floor area represented in data. For Infrastructure, covereage is calculated as a percent of equity. 5. Like-for-Like coverage only includes assets owned and in operation for at least 24 months
2. Based on equity share across renewable assets 6. Since Inception
3. Calculated using location-based EPA e-GRID emissions factors for net production of renewable energy sold Grey cells indicate metric is not applicable or not tracked by the entity.
4. Based on EIA data: 10,972 kWh of electricity is consumed by a US home on average
IIRRIISS MMeettrriicc CCooddee
UUnniitt ooff MMeeaassuurree
FFiirrmm
Total Employees OI8147 # 195
New Hires OI5479 # 45
Employees Covered by Collective Bargaining % 0%
Employee Satisfaction Survey Score (2019) # / 5 4.3
Total Employees Trained OI4229 % 100%
Training Hours / Employee # 10
Turnover Rate % 6%
Employees Dedicated to ESG Performance # 4
GGeennddeerr DDiivveerrssiittyy Female New Hires % 33%
Total Female Employees % 37%
Total Workforce Female or Minority % 47%
Management Positions Held by Women % 22%
Management Positions Held by Women or Minority % 28%
Percentage of Promotions Female PI9467 % 46%
EEtthhnniicc DDiivveerrssiittyy Total Employees Identifying as White % 85%
Total Employees Identifying as Minority/Previously Excluded OI8147 % 15%
AAggee DDiivveerrssiittyy Women Under 30 % 11%
Women 30-50 % 24%
Women Over 50 % 3%
Men Under 30 % 21%
Men 30-50 % 37%
Men Over 50 % 5%
CCoommmmuunniittyy IImmppaacctt
Community Organizations Supported # 95
Community Service Hours OI8429 # 1,950
Service Hours Per Employee # 10
Dollars Donated through Employee Match # $ 277,600
Individuals Housed: Students PI2640 # 420,000
Individuals Housed: Seniors PI2640 # 48,000
Jobs Created at Directly Supported/Financed Enterprises PI3687 # 16,000
IInnvveessttmmeenntt OOppeerraattiioonnss
EEffffiicciieennccyy IInnvveessttmmeenntt
CCoorrppoorraattee OOppeerraattiioonnss
EEmmppllooyymmeenntt MMeettrriiccss

24 | 2624 | 26 2020 ESG IMPACT REPORT2020 ESG IMPACT REPORT
ESG
DA
TA
APPENDIX
APPENDIX
22002200 HHaarrrriissoonn SSttrreeeett EESSGG DDaattaa
IIRRIISS CCooddeeUUnniitt ooff
MMeeaassuurreeUUSS CCoorree SSIIFF EEuurrooppee FFII EEuurrooppee FFIIII
EEuurrooppee FFuunndd IIIIII
UUSS FFuunndd VVIIII
EEnneerrggyy Absolute Energy Data Coverage1 % SF 95% 96% 100% 100% 100%
Energy Purchased: Non-Renewable Electric OI1496 GWh 325 4 6 13 85
Energy Purchased: Non-Renewable Gas OI1496 GWh 146 6 1 5 43
Energy Purchased: Non-Renewable District OI1496 GWh 13 - - - 15
Energy Generated for Sale: Renewable (Ownership Share %)2 PI5842 GWh 86
Energy Generated for Sale: Non-Renewable (at Ownership Share %)2 PI2210 GWh 225
Energy Generated for Use: Renewable OI2496 GWh 6 - - - -
LFL Energy Tracking Coverage5 % SF 67% 90% 80% 100%
2019 Energy LFL Intensity Kbtu/SF 48.2
2020 Energy LFL Intensity Kbtu/SF 46.1 32.4 33.6 138.6
Energy LFL Reduction % -4%
WWaatteerr Absolute Water Data Coverage1 % SF 90% 73% 100% 100%
Water Consumed: Total OI1697 MGal 974 24 60 27
LFL Water Tracking Coverage5 % SF 67% 73% 80% 100%
2019 Water LFL Intensity Gal/SF 36.6
2020 Water LFL Intensity Gal/SF 33.3 49.4 33.1 13.2
Water LFL Reduction % -9%
EEmmiissssiioonnss Absolute Emissions Data Coverage1 % SF 95% 96% 100% 100% 100%
Greenhouse Gas Emissions: Direct OI4112 MTCO2e 26,510 1,124 256 837 7,818
Greenhouse Gas Emissions: Indirect OI9604 MTCO2e 131,547 2,109 1,154 2,522 11,040
GHG Emissions of Energy Generated for Sale (at Ownership Share %)2 PI7015 MTCO2e 25,532
GHG Emissions Avoided (Ownership Share %)3 PI2764 MTCO2e (64,221)
Greenhouse Gas Emissions: Total OI1479 MTCO2e 158,057 28,765 1,410 3,359 18,858
LFL Emissions Tracking Coverage5 % SF 67% 96% 90% 80% 100%
2019 Emissions LFL Intensity kgCO2e /SF 5.0
2020 Emissions LFL Intensity kgCO2e /SF 4.9 2.2 2.7 9.1
Emissions LFL Reduction % -3%
CCeerrttiiffiiccaattiioonnss Green Building Certified or Registered OI1120 % SF 9% 0% 16% 20% 36% 8%
Fitwel Certified or Registered OI1120 % SF 6% 0% 16% 50% 86% 4%
Efficiency Assessment % SF 61% 90% 30% 81% 16%
Building Area of Energy Efficiency Improvements (last 5 years) PI1586 % SF 58%
Investment in Efficiency Retrofit Projects (last 5 years) $MM $ 10.34
RReenneewwaabbllee EEnneerrggyy Value of Renewable Energy Equity Investments Closed (to date) PI4142 $MM $ 138.19
Total Capacity of Renewable Energy Assets MW 5 311 - - - -
Equivalent Number of Homes (at 100% Share)4 # 516 46,200 - - - -
CCoommmmuunniittyy Value of P3 Equity Investments Closed (to date) PI4142 $MM $ 503.41
Individuals Housed: Students6 PI2640 # 124,000 9,200 12,700 15,700 - 660
Individuals Housed: Seniors6 PI2640 # 14,100 - - - - -
Jobs Created at Directly Supported/Financed Enterprises6 PI3687 # 400 400 80 180 - 2,400
Indirect Jobs Created from New Development6 # 2,700
NOTES 1. Coverage: Percent of gross floor area represented in data. For Infrastructure, covereage is calculated as a percent of equity. 5. Like-for-Like coverage only includes assets owned and in operation for at least 24 months
2. Based on equity share across renewable assets 6. Since Inception
3. Calculated using location-based EPA e-GRID emissions factors for net production of renewable energy sold Grey cells indicate metric is not applicable or not tracked by the entity.
4. Based on EIA data: 10,972 kWh of electricity is consumed by a US home on average
IIRRIISS MMeettrriicc CCooddee
UUnniitt ooff MMeeaassuurree
FFiirrmm
Total Employees OI8147 # 195
New Hires OI5479 # 45
Employees Covered by Collective Bargaining % 0%
Employee Satisfaction Survey Score (2019) # / 5 4.3
Total Employees Trained OI4229 % 100%
Training Hours / Employee # 10
Turnover Rate % 6%
Employees Dedicated to ESG Performance # 4
GGeennddeerr DDiivveerrssiittyy Female New Hires % 33%
Total Female Employees % 37%
Total Workforce Female or Minority % 47%
Management Positions Held by Women % 22%
Management Positions Held by Women or Minority % 28%
Percentage of Promotions Female PI9467 % 46%
EEtthhnniicc DDiivveerrssiittyy Total Employees Identifying as White % 85%
Total Employees Identifying as Minority/Previously Excluded OI8147 % 15%
AAggee DDiivveerrssiittyy Women Under 30 % 11%
Women 30-50 % 24%
Women Over 50 % 3%
Men Under 30 % 21%
Men 30-50 % 37%
Men Over 50 % 5%
CCoommmmuunniittyy Community Organizations Supported # 95
Community Service Hours OI8429 # 1,950
Service Hours Per Employee # 10
Dollars Donated through Employee Match # $ 277,600
Individuals Housed: Students PI2640 # 420,000
Individuals Housed: Seniors PI2640 # 48,000
Jobs Created at Directly Supported/Financed Enterprises PI3687 # 16,000
IInnvveessttmmeenntt OOppeerraattiioonnss
EEffffiicciieennccyy IInnvveessttmmeenntt
CCoorrppoorraattee OOppeerraattiioonnss
EEmmppllooyymmeenntt MMeettrriiccss
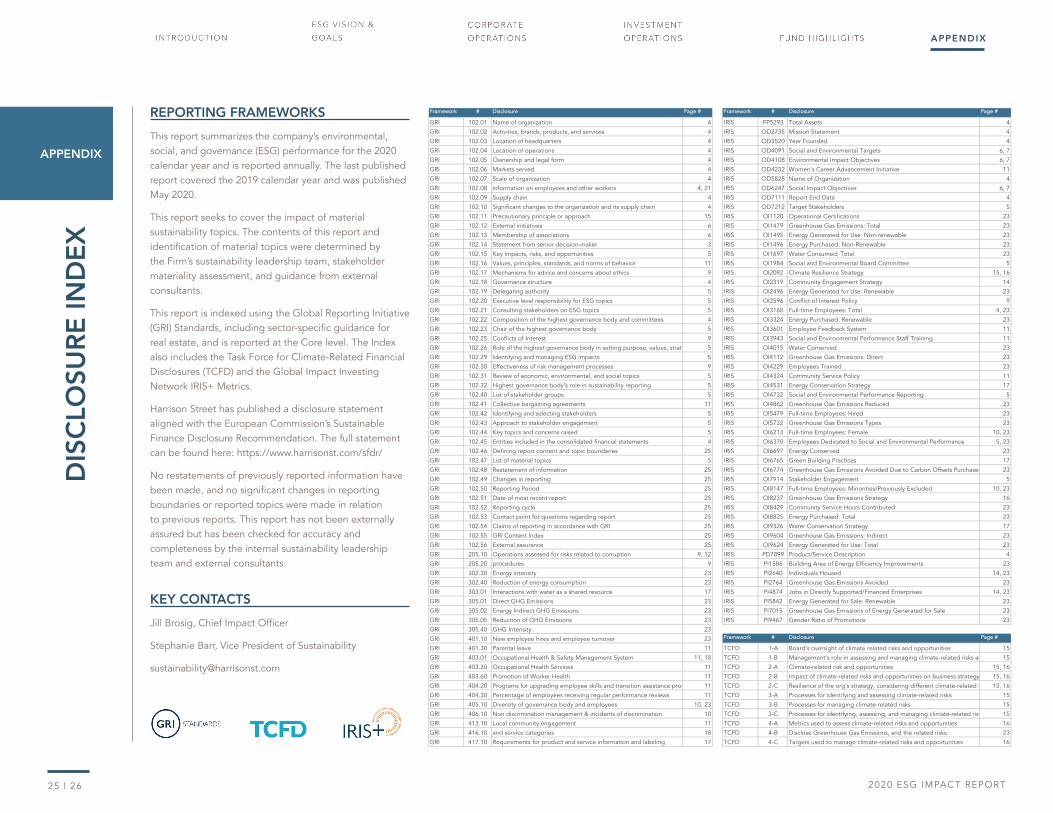
25 | 2625 | 26 2020 ESG IMPACT REPORT2020 ESG IMPACT REPORT
FFrraammeewwoorrkk ## DDiisscclloossuurree PPaaggee ## FFrraammeewwoorrkk ## DDiisscclloossuurree PPaaggee ##
GRI 102.01 Name of organization 4 IRIS FP5293 Total Assets 4
GRI 102.02 Activities, brands, products, and services 4 IRIS OD2735 Mission Statement 4
GRI 102.03 Location of headquarters 4 IRIS OD3520 Year Founded 4
GRI 102.04 Location of operations 4 IRIS OD4091 Social and Environmental Targets 6, 7
GRI 102.05 Ownership and legal form 4 IRIS OD4108 Environmental Impact Objectives 6, 7
GRI 102.06 Markets served 4 IRIS OD4232 Women's Career Advancement Initiative 11
GRI 102.07 Scale of organization 4 IRIS OD5828 Name of Organization 4
GRI 102.08 Information on employees and other workers 4, 21 IRIS OD6247 Social Impact Objectives 6, 7
GRI 102.09 Supply chain 4 IRIS OD7111 Report End Date 4
GRI 102.10 Significant changes to the organization and its supply chain 4 IRIS OD7212 Target Stakeholders 5
GRI 102.11 Precautionary principle or approach 15 IRIS OI1120 Operational Certifications 23
GRI 102.12 External initiatives 6 IRIS OI1479 Greenhouse Gas Emissions: Total 23
GRI 102.13 Membership of associations 6 IRIS OI1495 Energy Generated for Use: Non-renewable 23
GRI 102.14 Statement from senior decision-maker 3 IRIS OI1496 Energy Purchased: Non-Renewable 23
GRI 102.15 Key impacts, risks, and opportunities 5 IRIS OI1697 Water Consumed: Total 23
GRI 102.16 Values, principles, standards, and norms of behavior 11 IRIS OI1984 Social and Environmental Board Committee 5
GRI 102.17 Mechanisms for advice and concerns about ethics 9 IRIS OI2092 Climate Resilience Strategy 15, 16
GRI 102.18 Governance structure 4 IRIS OI2319 Community Engagement Strategy 14
GRI 102.19 Delegating authority 5 IRIS OI2496 Energy Generated for Use: Renewable 23
GRI 102.20 Executive level responsibility for ESG topics 5 IRIS OI2596 Conflict of Interest Policy 9
GRI 102.21 Consulting stakeholders on ESG topics 5 IRIS OI3160 Full-time Employees: Total 4, 23
GRI 102.22 Composition of the highest governance body and committees 4 IRIS OI3324 Energy Purchased: Renewable 23
GRI 102.23 Chair of the highest governance body 5 IRIS OI3601 Employee Feedback System 11
GRI 102.25 Conflicts of Interest 9 IRIS OI3943 Social and Environmental Performance Staff Training 11
GRI 102.26 Role of the highest governance body in setting purpose, values, strate 5 IRIS OI4015 Water Conserved 23
GRI 102.29 Identifying and managing ESG impacts 5 IRIS OI4112 Greenhouse Gas Emissions: Direct 23
GRI 102.30 Effectiveness of risk management processes 9 IRIS OI4229 Employees Trained 23
GRI 102.31 Review of economic, environmental, and social topics 5 IRIS OI4324 Community Service Policy 11
GRI 102.32 Highest governance body’s role in sustainability reporting 5 IRIS OI4531 Energy Conservation Strategy 17
GRI 102.40 List of stakeholder groups 5 IRIS OI4732 Social and Environmental Performance Reporting 5
GRI 102.41 Collective bargaining agreements 11 IRIS OI4862 Greenhouse Gas Emissions Reduced 23
GRI 102.42 Identifying and selecting stakeholders 5 IRIS OI5479 Full-time Employees: Hired 23
GRI 102.43 Approach to stakeholder engagement 5 IRIS OI5732 Greenhouse Gas Emissions Types 23
GRI 102.44 Key topics and concerns raised 5 IRIS OI6213 Full-time Employees: Female 10, 23
GRI 102.45 Entities included in the consolidated financial statements 4 IRIS OI6370 Employees Dedicated to Social and Environmental Performance 5, 23
GRI 102.46 Defining report content and topic boundaries 25 IRIS OI6697 Energy Conserved 23
GRI 102.47 List of material topics 5 IRIS OI6765 Green Building Practices 17
GRI 102.48 Restatement of information 25 IRIS OI6774 Greenhouse Gas Emissions Avoided Due to Carbon Offsets Purchased 23
GRI 102.49 Changes in reporting 25 IRIS OI7914 Stakeholder Engagement 5
GRI 102.50 Reporting Period 25 IRIS OI8147 Full-time Employees: Minorities/Previously Excluded 10, 23
GRI 102.51 Date of most recent report 25 IRIS OI8237 Greenhouse Gas Emissions Strategy 16
GRI 102.52 Reporting cycle 25 IRIS OI8429 Community Service Hours Contributed 23
GRI 102.53 Contact point for questions regarding report 25 IRIS OI8825 Energy Purchased: Total 23
GRI 102.54 Claims of reporting in accordance with GRI 25 IRIS OI9326 Water Conservation Strategy 17
GRI 102.55 GRI Content Index 25 IRIS OI9604 Greenhouse Gas Emissions: Indirect 23
GRI 102.56 External assurance 25 IRIS OI9624 Energy Generated for Use: Total 23
GRI 205.10 Operations assessed for risks related to corruption 9, 12 IRIS PD7899 Product/Service Description 4
GRI 205.20g p p
procedures 9 IRIS PI1586 Building Area of Energy Efficiency Improvements 23
GRI 302.30 Energy intensity 23 IRIS PI2640 Individuals Housed 14, 23
GRI 302.40 Reduction of energy consumption 23 IRIS PI2764 Greenhouse Gas Emissions Avoided 23
GRI 303.01 Interactions with water as a shared resource 17 IRIS PI4874 Jobs in Directly Supported/Financed Enterprises 14, 23
GRI 305.01 Direct GHG Emissions 23 IRIS PI5842 Energy Generated for Sale: Renewable 23
GRI 305.02 Energy Indirect GHG Emissions 23 IRIS PI7015 Greenhouse Gas Emissions of Energy Generated for Sale 23
GRI 305.05 Reduction of GHG Emissions 23 IRIS PI9467 Gender Ratio of Promotions 23
GRI 305.40 GHG Intensity 23
GRI 401.10 New employee hires and employee turnover 23 FFrraammeewwoorrkk ## DDiisscclloossuurree PPaaggee ##
GRI 401.30 Parental leave 11 TCFD 1-A Board’s oversight of climate related risks and opportunities 15
GRI 403.01 Occupational Health & Safety Management System 11, 18 TCFD 1-B Management's role in assessing and managing climate-related risks an 15
GRI 403.30 Occupational Health Services 11 TCFD 2-A Climate-related risk and opportunities 15, 16
GRI 403.60 Promotion of Worker Health 11 TCFD 2-B Impact of climate-related risks and opportunities on business strategy 15, 16
GRI 404.20 Programs for upgrading employee skills and transition assistance prog 11 TCFD 2-C Resilience of the org's strategy, considering different climate-related s 15, 16
GRI 404.30 Percentage of employees receiving regular performance reviews 11 TCFD 3-A Processes for identifying and assessing climate-related risks 15
GRI 405.10 Diversity of governance body and employees 10, 23 TCFD 3-B Processes for managing climate-related risks 15
GRI 406.10 Non discrimination management & incidents of discrimination 10 TCFD 3-C Processes for identifying, assessing, and managing climate-related risk 15
GRI 413.10 Local community engagement 11 TCFD 4-A Metrics used to assess climate-related risks and opportunities 16
GRI 416.10y p p
and service categories 18 TCFD 4-B Disclose Greenhouse Gas Emissions, and the related risks. 23
GRI 417.10 Requirements for product and service information and labeling 17 TCFD 4-C Targets used to manage climate-related risks and opportunities 16
DIS
CLO
SUR
E IN
DE
XREPORTING FRAMEWORKS
This report summarizes the company’s environmental, social, and governance (ESG) performance for the 2020 calendar year and is reported annually. The last published report covered the 2019 calendar year and was published May 2020.
This report seeks to cover the impact of material sustainability topics. The contents of this report and identification of material topics were determined by the Firm’s sustainability leadership team, stakeholder materiality assessment, and guidance from external consultants.
This report is indexed using the Global Reporting Initiative (GRI) Standards, including sector-specific guidance for real estate, and is reported at the Core level. The Index also includes the Task Force for Climate-Related Financial Disclosures (TCFD) and the Global Impact Investing Network IRIS+ Metrics.
Harrison Street has published a disclosure statement aligned with the European Commission’s Sustainable Finance Disclosure Recommendation. The full statement can be found here: https://www.harrisonst.com/sfdr/
No restatements of previously reported information have been made, and no significant changes in reporting boundaries or reported topics were made in relation to previous reports. This report has not been externally assured but has been checked for accuracy and completeness by the internal sustainability leadership team and external consultants.
KEY CONTACTS
Jill Brosig, Chief Impact Officer
Stephanie Barr, Vice President of Sustainability
APPENDIX
APPENDIX
Please consider the environment before printing.