ESEA Waiver - Annual Progress Targets · 2015-02-25 · 13-0250-020 Belleville High School...
197
13-0250-020 Belleville High School BELLEVILLE PUBLIC SCHOOLS CDS CODE : DISTRICT : SCHOOL : ESEA Waiver - Annual Progress Targets The tables represent the annual proficiency targets, established for this School under ESEA Waiver Schools and Subgroups could meet expectations either by meeting the statewide proficiency rate of 90 percent, or reaching their individually determined progress targets. The statewide proficiency rate will be increased to 95 percent in 2015. Performance Targets - Language Arts Literacy Subgroup # of Valid Test Scores Baseline % Proficient Yearly Increment 2012-2013 Target (%P) 2011-2012 Target (%P) 2013-2014 Target (%P) 2014-2015 Target (%P) 2015-2016 Target (%P) 2016-2017 Target (%P) Baseline year 84.4 1.3 87 88.3 89.6 90 90 Schoolwide 296 85.7 1011 83.3 1.4 86.1 87.5 88.9 90 90 White 72 84.7 1011 91.6 - 90 90 90 90 Black 36 1213 83 1.4 85.8 87.2 88.6 90 90 Hispanic 170 84.4 1011 - - - - - - - American Indian - - 1011 97.2 - 90 90 90 90 90 Asian 36 90 1011 - - - - - - - Two or More Races - - 1011 25 6.3 37.6 43.9 50.2 56.5 62.8 Students with Disabilities 52 31.3 1011 - - - - - - - Limited English Proficiency - - 1011 80.3 1.7 83.7 85.4 87.1 88.8 90 Economically Disadvantaged 76 82 1011 Performance Targets - Mathematics Subgroup # of Valid Test Scores Baseline % Proficient Yearly Increment 2012-2013 Target (%P) 2011-2012 Target (%P) 2013-2014 Target (%P) 2014-2015 Target (%P) 2015-2016 Target (%P) 2016-2017 Target (%P) Baseline year 74 2.2 78.4 80.6 82.8 85 87.2 Schoolwide 296 76.2 1011 72.2 2.3 76.8 79.1 81.4 83.7 86 White 72 74.5 1011 66.6 2.8 69.4 72.2 75 77.8 Black 36 1213 72.4 2.3 77 79.3 81.6 83.9 86.2 Hispanic 170 74.7 1011 - - - - - - - American Indian - - 1011 88.8 .9 90 90 90 90 90 Asian 36 89.7 1011 - - - - - - - Two or More Races - - 1011 15.4 7.1 29.6 36.7 43.8 50.9 58 Students with Disabilities 52 22.5 1011 - - - - - - - Limited English Proficiency - - 1011 72.4 2.3 77 79.3 81.6 83.9 86.2 Economically Disadvantaged 76 74.7 1011 11/5/2014 Only Includes full year students (Time In School < Year students are removed) '-' Indicates too few students to determine (N<30) Title I Accountability System
Transcript of ESEA Waiver - Annual Progress Targets · 2015-02-25 · 13-0250-020 Belleville High School...
13-0250-020
Belleville High School
BELLEVILLE PUBLIC SCHOOLS
CDS CODE :
DISTRICT :
SCHOOL :
ESEA Waiver - Annual Progress Targets
The tables represent the annual proficiency targets, established for this School under ESEA Waiver
Schools and Subgroups could meet expectations either by meeting the statewide proficiency rate of 90 percent, or reaching their individually
determined progress targets. The statewide proficiency rate will be increased to 95 percent in 2015.
Performance Targets - Language Arts Literacy
Subgroup# of Valid
Test Scores
Baseline
% Proficient
Yearly
Increment
2012-2013
Target (%P)
2011-2012
Target (%P)
2013-2014
Target (%P)
2014-2015
Target (%P)
2015-2016
Target (%P)
2016-2017
Target (%P)
Baseline
year
84.4 1.3 87 88.3 89.6 90 90Schoolwide 296 85.71011
83.3 1.4 86.1 87.5 88.9 90 90White 72 84.71011
91.6 - 90 90 90 90Black 36 1213
83 1.4 85.8 87.2 88.6 90 90Hispanic 170 84.41011
- - - - - - -American Indian - -1011
97.2 - 90 90 90 90 90Asian 36 901011
- - - - - - -Two or More Races - -1011
25 6.3 37.6 43.9 50.2 56.5 62.8Students with Disabilities 52 31.31011
- - - - - - -Limited English Proficiency - -1011
80.3 1.7 83.7 85.4 87.1 88.8 90Economically Disadvantaged 76 821011
Performance Targets - Mathematics
Subgroup# of Valid
Test Scores
Baseline
% Proficient
Yearly
Increment
2012-2013
Target (%P)
2011-2012
Target (%P)
2013-2014
Target (%P)
2014-2015
Target (%P)
2015-2016
Target (%P)
2016-2017
Target (%P)
Baseline
year
74 2.2 78.4 80.6 82.8 85 87.2Schoolwide 296 76.21011
72.2 2.3 76.8 79.1 81.4 83.7 86White 72 74.51011
66.6 2.8 69.4 72.2 75 77.8Black 36 1213
72.4 2.3 77 79.3 81.6 83.9 86.2Hispanic 170 74.71011
- - - - - - -American Indian - -1011
88.8 .9 90 90 90 90 90Asian 36 89.71011
- - - - - - -Two or More Races - -1011
15.4 7.1 29.6 36.7 43.8 50.9 58Students with Disabilities 52 22.51011
- - - - - - -Limited English Proficiency - -1011
72.4 2.3 77 79.3 81.6 83.9 86.2Economically Disadvantaged 76 74.71011
11/5/2014
Only Includes full year students (Time In School < Year students are removed)
'-' Indicates too few students to determine (N<30)
Title I Accountability System
13-0250-025
Belleville Middle School
BELLEVILLE PUBLIC SCHOOLS
CDS CODE :
DISTRICT :
SCHOOL :
ESEA Waiver - Annual Progress Targets
The tables represent the annual proficiency targets, established for this School under ESEA Waiver
Schools and Subgroups could meet expectations either by meeting the statewide proficiency rate of 90 percent, or reaching their individually
determined progress targets. The statewide proficiency rate will be increased to 95 percent in 2015.
Performance Targets - Language Arts Literacy
Subgroup# of Valid
Test Scores
Baseline
% Proficient
Yearly
Increment
2012-2013
Target (%P)
2011-2012
Target (%P)
2013-2014
Target (%P)
2014-2015
Target (%P)
2015-2016
Target (%P)
2016-2017
Target (%P)
Baseline
year
70 2.5 75 77.5 80 82.5 85Schoolwide 673 72.51011
76.6 2 80.6 82.6 84.6 86.6 88.6White 141 78.61011
56.3 3.7 63.7 67.4 71.1 74.8 78.5Black 71 601011
67.7 2.7 73.1 75.8 78.5 81.2 83.9Hispanic 372 70.41011
- - - - - - -American Indian - -1011
80.6 1.6 83.8 85.4 87 88.6 90Asian 88 82.21011
- - - - - - -Two or More Races - -1011
27.8 6 39.8 45.8 51.8 57.8 63.8Students with Disabilities 97 33.81011
- - - - - - -Limited English Proficiency - -1011
62.9 3.1 69.1 72.2 75.3 78.4 81.5Economically Disadvantaged 299 661011
Performance Targets - Mathematics
Subgroup# of Valid
Test Scores
Baseline
% Proficient
Yearly
Increment
2012-2013
Target (%P)
2011-2012
Target (%P)
2013-2014
Target (%P)
2014-2015
Target (%P)
2015-2016
Target (%P)
2016-2017
Target (%P)
Baseline
year
61 3.3 67.6 70.9 74.2 77.5 80.8Schoolwide 672 64.31011
62.4 3.1 68.6 71.7 74.8 77.9 81White 141 65.51011
36.7 5.3 47.3 52.6 57.9 63.2 68.5Black 71 421011
58.8 3.4 65.6 69 72.4 75.8 79.2Hispanic 371 62.21011
- - - - - - -American Indian - -1011
88.6 1 90 90 90 90 90Asian 88 89.61011
- - - - - - -Two or More Races - -1011
18.5 6.8 32.1 38.9 45.7 52.5 59.3Students with Disabilities 97 25.31011
- - - - - - -Limited English Proficiency - -1011
52.7 4 60.7 64.7 68.7 72.7 76.7Economically Disadvantaged 298 56.71011
11/5/2014
Only Includes full year students (Time In School < Year students are removed)
'-' Indicates too few students to determine (N<30)
Title I Accountability System
13-0250-050
Belleville PS3
BELLEVILLE PUBLIC SCHOOLS
CDS CODE :
DISTRICT :
SCHOOL :
ESEA Waiver - Annual Progress Targets
The tables represent the annual proficiency targets, established for this School under ESEA Waiver
Schools and Subgroups could meet expectations either by meeting the statewide proficiency rate of 90 percent, or reaching their individually
determined progress targets. The statewide proficiency rate will be increased to 95 percent in 2015.
Performance Targets - Language Arts Literacy
Subgroup# of Valid
Test Scores
Baseline
% Proficient
Yearly
Increment
2012-2013
Target (%P)
2011-2012
Target (%P)
2013-2014
Target (%P)
2014-2015
Target (%P)
2015-2016
Target (%P)
2016-2017
Target (%P)
Baseline
year
54.7 3.8 62.3 66.1 69.9 73.7 77.5Schoolwide 192 58.51011
52.9 3.9 60.7 64.6 68.5 72.4 76.3White 34 56.81011
- - - - - - -Black - -1011
53.7 3.9 61.5 65.4 69.3 73.2 77.1Hispanic 108 57.61011
- - - - - - -American Indian - -1011
70 2.5 75 77.5 80 82.5 85Asian 30 72.51011
- - - - - - -Two or More Races - -1011
14.6 7.1 28.8 35.9 43 50.1 57.2Students with Disabilities 41 21.71011
- - - - - - -Limited English Proficiency - -1011
50 4.2 58.4 62.6 66.8 71 75.2Economically Disadvantaged 88 54.21011
Performance Targets - Mathematics
Subgroup# of Valid
Test Scores
Baseline
% Proficient
Yearly
Increment
2012-2013
Target (%P)
2011-2012
Target (%P)
2013-2014
Target (%P)
2014-2015
Target (%P)
2015-2016
Target (%P)
2016-2017
Target (%P)
Baseline
year
78.1 1.8 81.7 83.5 85.3 87.1 88.9Schoolwide 192 79.91011
82.4 1.5 85.4 86.9 88.4 89.9 90White 34 83.91011
- - - - - - -Black - -1011
75 2.1 79.2 81.3 83.4 85.5 87.6Hispanic 108 77.11011
- - - - - - -American Indian - -1011
93.4 - 90 90 90 90 90Asian 30 901011
- - - - - - -Two or More Races - -1011
31.7 5.7 43.1 48.8 54.5 60.2 65.9Students with Disabilities 41 37.41011
- - - - - - -Limited English Proficiency - -1011
71.6 2.4 76.4 78.8 81.2 83.6 86Economically Disadvantaged 88 741011
11/5/2014
Only Includes full year students (Time In School < Year students are removed)
'-' Indicates too few students to determine (N<30)
Title I Accountability System
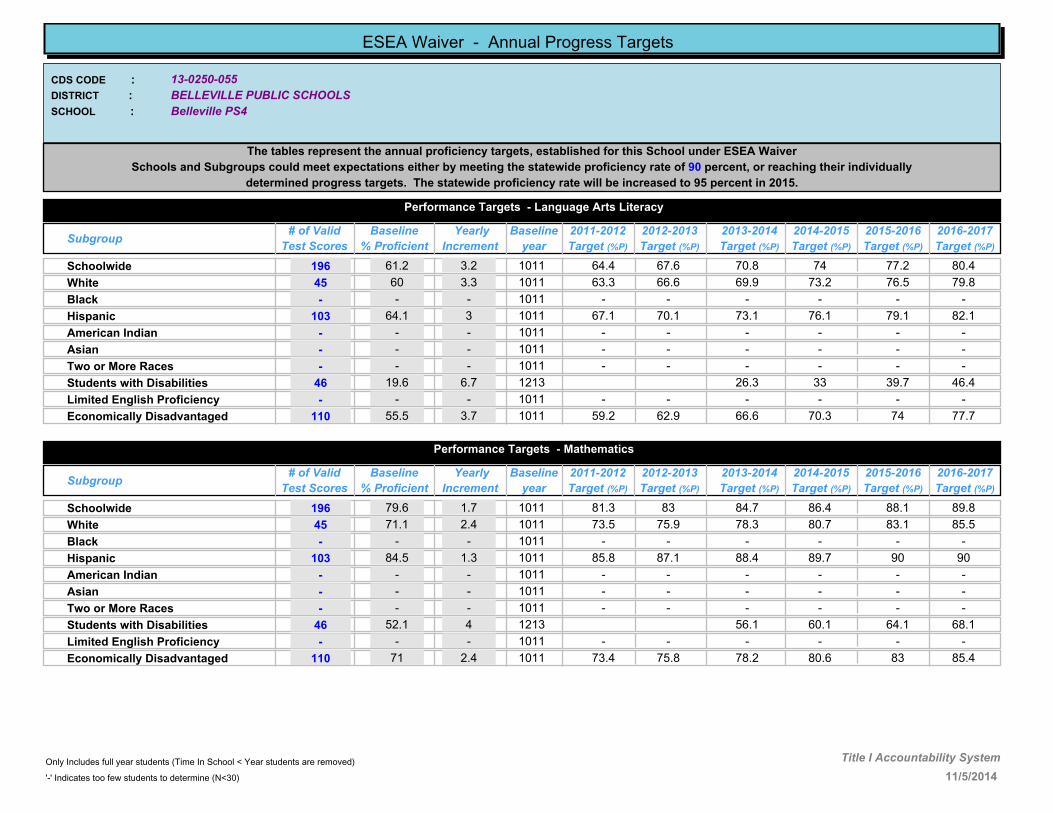
13-0250-055
Belleville PS4
BELLEVILLE PUBLIC SCHOOLS
CDS CODE :
DISTRICT :
SCHOOL :
ESEA Waiver - Annual Progress Targets
The tables represent the annual proficiency targets, established for this School under ESEA Waiver
Schools and Subgroups could meet expectations either by meeting the statewide proficiency rate of 90 percent, or reaching their individually
determined progress targets. The statewide proficiency rate will be increased to 95 percent in 2015.
Performance Targets - Language Arts Literacy
Subgroup# of Valid
Test Scores
Baseline
% Proficient
Yearly
Increment
2012-2013
Target (%P)
2011-2012
Target (%P)
2013-2014
Target (%P)
2014-2015
Target (%P)
2015-2016
Target (%P)
2016-2017
Target (%P)
Baseline
year
61.2 3.2 67.6 70.8 74 77.2 80.4Schoolwide 196 64.41011
60 3.3 66.6 69.9 73.2 76.5 79.8White 45 63.31011
- - - - - - -Black - -1011
64.1 3 70.1 73.1 76.1 79.1 82.1Hispanic 103 67.11011
- - - - - - -American Indian - -1011
- - - - - - -Asian - -1011
- - - - - - -Two or More Races - -1011
19.6 6.7 26.3 33 39.7 46.4Students with Disabilities 46 1213
- - - - - - -Limited English Proficiency - -1011
55.5 3.7 62.9 66.6 70.3 74 77.7Economically Disadvantaged 110 59.21011
Performance Targets - Mathematics
Subgroup# of Valid
Test Scores
Baseline
% Proficient
Yearly
Increment
2012-2013
Target (%P)
2011-2012
Target (%P)
2013-2014
Target (%P)
2014-2015
Target (%P)
2015-2016
Target (%P)
2016-2017
Target (%P)
Baseline
year
79.6 1.7 83 84.7 86.4 88.1 89.8Schoolwide 196 81.31011
71.1 2.4 75.9 78.3 80.7 83.1 85.5White 45 73.51011
- - - - - - -Black - -1011
84.5 1.3 87.1 88.4 89.7 90 90Hispanic 103 85.81011
- - - - - - -American Indian - -1011
- - - - - - -Asian - -1011
- - - - - - -Two or More Races - -1011
52.1 4 56.1 60.1 64.1 68.1Students with Disabilities 46 1213
- - - - - - -Limited English Proficiency - -1011
71 2.4 75.8 78.2 80.6 83 85.4Economically Disadvantaged 110 73.41011
11/5/2014
Only Includes full year students (Time In School < Year students are removed)
'-' Indicates too few students to determine (N<30)
Title I Accountability System
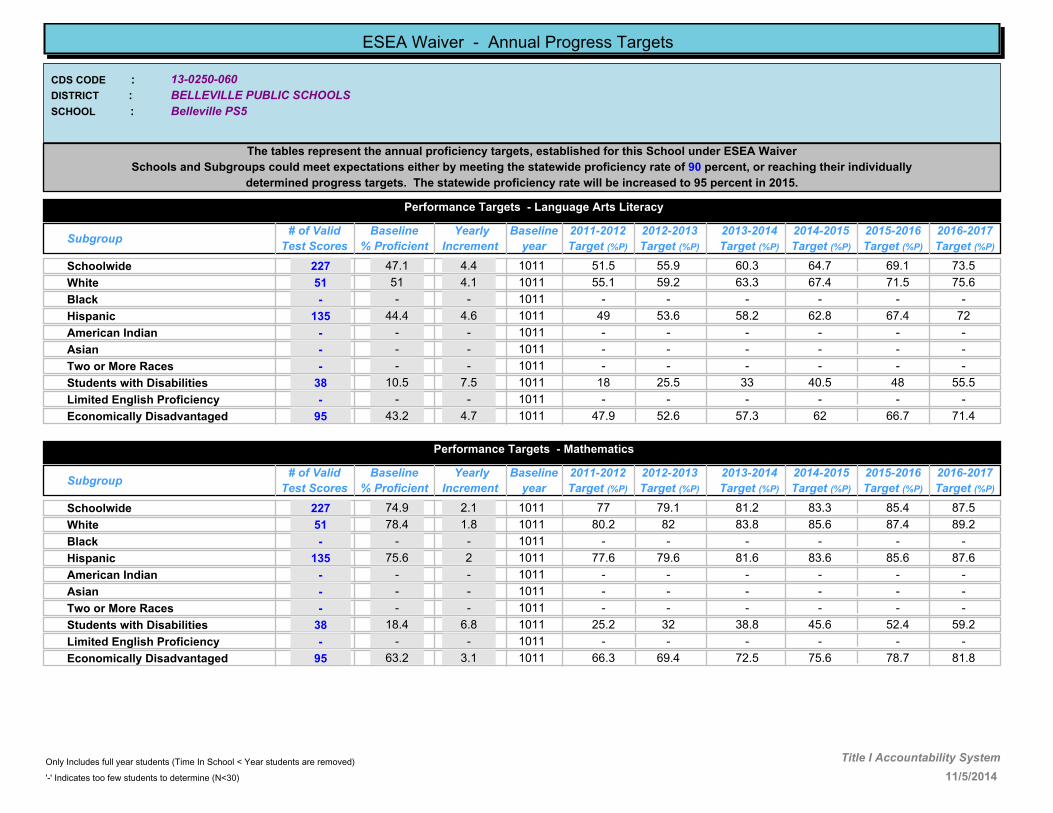
13-0250-060
Belleville PS5
BELLEVILLE PUBLIC SCHOOLS
CDS CODE :
DISTRICT :
SCHOOL :
ESEA Waiver - Annual Progress Targets
The tables represent the annual proficiency targets, established for this School under ESEA Waiver
Schools and Subgroups could meet expectations either by meeting the statewide proficiency rate of 90 percent, or reaching their individually
determined progress targets. The statewide proficiency rate will be increased to 95 percent in 2015.
Performance Targets - Language Arts Literacy
Subgroup# of Valid
Test Scores
Baseline
% Proficient
Yearly
Increment
2012-2013
Target (%P)
2011-2012
Target (%P)
2013-2014
Target (%P)
2014-2015
Target (%P)
2015-2016
Target (%P)
2016-2017
Target (%P)
Baseline
year
47.1 4.4 55.9 60.3 64.7 69.1 73.5Schoolwide 227 51.51011
51 4.1 59.2 63.3 67.4 71.5 75.6White 51 55.11011
- - - - - - -Black - -1011
44.4 4.6 53.6 58.2 62.8 67.4 72Hispanic 135 491011
- - - - - - -American Indian - -1011
- - - - - - -Asian - -1011
- - - - - - -Two or More Races - -1011
10.5 7.5 25.5 33 40.5 48 55.5Students with Disabilities 38 181011
- - - - - - -Limited English Proficiency - -1011
43.2 4.7 52.6 57.3 62 66.7 71.4Economically Disadvantaged 95 47.91011
Performance Targets - Mathematics
Subgroup# of Valid
Test Scores
Baseline
% Proficient
Yearly
Increment
2012-2013
Target (%P)
2011-2012
Target (%P)
2013-2014
Target (%P)
2014-2015
Target (%P)
2015-2016
Target (%P)
2016-2017
Target (%P)
Baseline
year
74.9 2.1 79.1 81.2 83.3 85.4 87.5Schoolwide 227 771011
78.4 1.8 82 83.8 85.6 87.4 89.2White 51 80.21011
- - - - - - -Black - -1011
75.6 2 79.6 81.6 83.6 85.6 87.6Hispanic 135 77.61011
- - - - - - -American Indian - -1011
- - - - - - -Asian - -1011
- - - - - - -Two or More Races - -1011
18.4 6.8 32 38.8 45.6 52.4 59.2Students with Disabilities 38 25.21011
- - - - - - -Limited English Proficiency - -1011
63.2 3.1 69.4 72.5 75.6 78.7 81.8Economically Disadvantaged 95 66.31011
11/5/2014
Only Includes full year students (Time In School < Year students are removed)
'-' Indicates too few students to determine (N<30)
Title I Accountability System
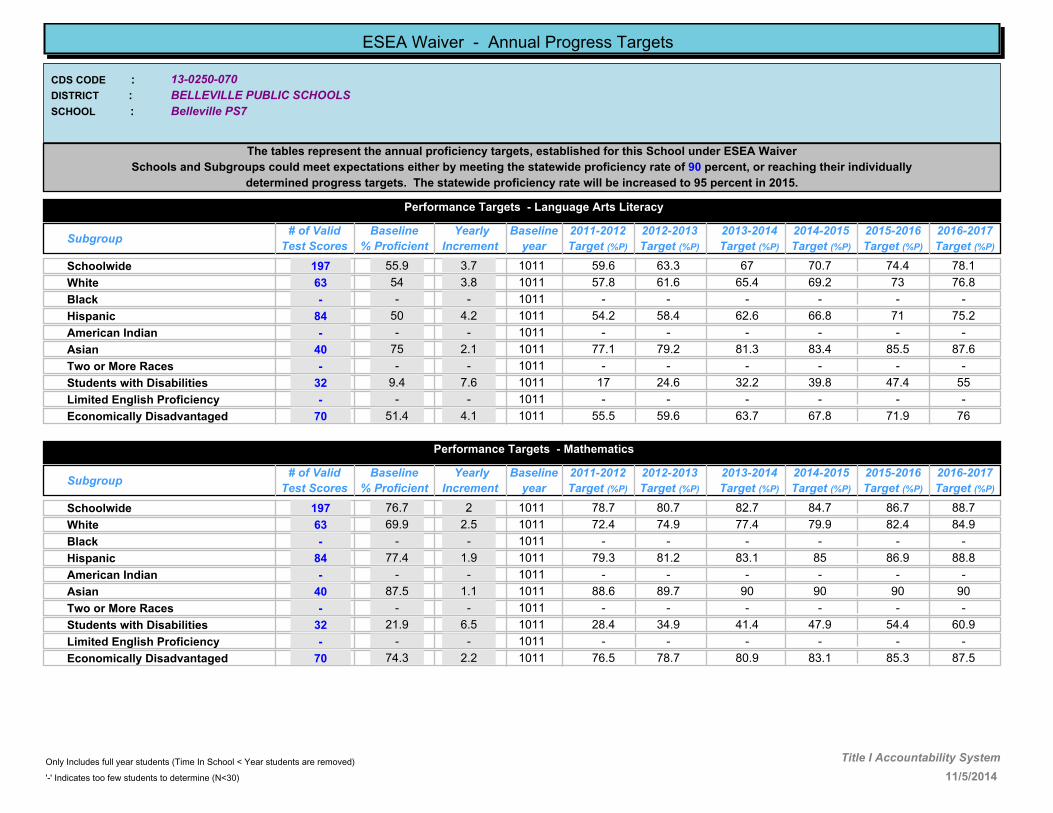
13-0250-070
Belleville PS7
BELLEVILLE PUBLIC SCHOOLS
CDS CODE :
DISTRICT :
SCHOOL :
ESEA Waiver - Annual Progress Targets
The tables represent the annual proficiency targets, established for this School under ESEA Waiver
Schools and Subgroups could meet expectations either by meeting the statewide proficiency rate of 90 percent, or reaching their individually
determined progress targets. The statewide proficiency rate will be increased to 95 percent in 2015.
Performance Targets - Language Arts Literacy
Subgroup# of Valid
Test Scores
Baseline
% Proficient
Yearly
Increment
2012-2013
Target (%P)
2011-2012
Target (%P)
2013-2014
Target (%P)
2014-2015
Target (%P)
2015-2016
Target (%P)
2016-2017
Target (%P)
Baseline
year
55.9 3.7 63.3 67 70.7 74.4 78.1Schoolwide 197 59.61011
54 3.8 61.6 65.4 69.2 73 76.8White 63 57.81011
- - - - - - -Black - -1011
50 4.2 58.4 62.6 66.8 71 75.2Hispanic 84 54.21011
- - - - - - -American Indian - -1011
75 2.1 79.2 81.3 83.4 85.5 87.6Asian 40 77.11011
- - - - - - -Two or More Races - -1011
9.4 7.6 24.6 32.2 39.8 47.4 55Students with Disabilities 32 171011
- - - - - - -Limited English Proficiency - -1011
51.4 4.1 59.6 63.7 67.8 71.9 76Economically Disadvantaged 70 55.51011
Performance Targets - Mathematics
Subgroup# of Valid
Test Scores
Baseline
% Proficient
Yearly
Increment
2012-2013
Target (%P)
2011-2012
Target (%P)
2013-2014
Target (%P)
2014-2015
Target (%P)
2015-2016
Target (%P)
2016-2017
Target (%P)
Baseline
year
76.7 2 80.7 82.7 84.7 86.7 88.7Schoolwide 197 78.71011
69.9 2.5 74.9 77.4 79.9 82.4 84.9White 63 72.41011
- - - - - - -Black - -1011
77.4 1.9 81.2 83.1 85 86.9 88.8Hispanic 84 79.31011
- - - - - - -American Indian - -1011
87.5 1.1 89.7 90 90 90 90Asian 40 88.61011
- - - - - - -Two or More Races - -1011
21.9 6.5 34.9 41.4 47.9 54.4 60.9Students with Disabilities 32 28.41011
- - - - - - -Limited English Proficiency - -1011
74.3 2.2 78.7 80.9 83.1 85.3 87.5Economically Disadvantaged 70 76.51011
11/5/2014
Only Includes full year students (Time In School < Year students are removed)
'-' Indicates too few students to determine (N<30)
Title I Accountability System
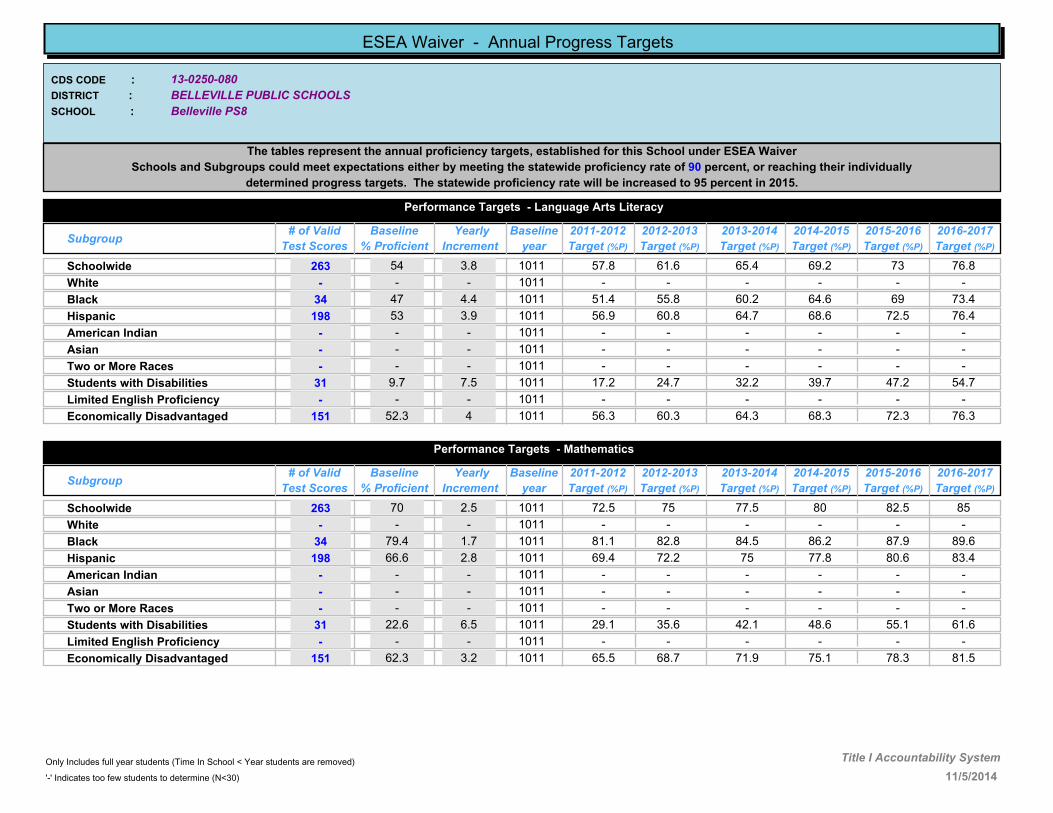
13-0250-080
Belleville PS8
BELLEVILLE PUBLIC SCHOOLS
CDS CODE :
DISTRICT :
SCHOOL :
ESEA Waiver - Annual Progress Targets
The tables represent the annual proficiency targets, established for this School under ESEA Waiver
Schools and Subgroups could meet expectations either by meeting the statewide proficiency rate of 90 percent, or reaching their individually
determined progress targets. The statewide proficiency rate will be increased to 95 percent in 2015.
Performance Targets - Language Arts Literacy
Subgroup# of Valid
Test Scores
Baseline
% Proficient
Yearly
Increment
2012-2013
Target (%P)
2011-2012
Target (%P)
2013-2014
Target (%P)
2014-2015
Target (%P)
2015-2016
Target (%P)
2016-2017
Target (%P)
Baseline
year
54 3.8 61.6 65.4 69.2 73 76.8Schoolwide 263 57.81011
- - - - - - -White - -1011
47 4.4 55.8 60.2 64.6 69 73.4Black 34 51.41011
53 3.9 60.8 64.7 68.6 72.5 76.4Hispanic 198 56.91011
- - - - - - -American Indian - -1011
- - - - - - -Asian - -1011
- - - - - - -Two or More Races - -1011
9.7 7.5 24.7 32.2 39.7 47.2 54.7Students with Disabilities 31 17.21011
- - - - - - -Limited English Proficiency - -1011
52.3 4 60.3 64.3 68.3 72.3 76.3Economically Disadvantaged 151 56.31011
Performance Targets - Mathematics
Subgroup# of Valid
Test Scores
Baseline
% Proficient
Yearly
Increment
2012-2013
Target (%P)
2011-2012
Target (%P)
2013-2014
Target (%P)
2014-2015
Target (%P)
2015-2016
Target (%P)
2016-2017
Target (%P)
Baseline
year
70 2.5 75 77.5 80 82.5 85Schoolwide 263 72.51011
- - - - - - -White - -1011
79.4 1.7 82.8 84.5 86.2 87.9 89.6Black 34 81.11011
66.6 2.8 72.2 75 77.8 80.6 83.4Hispanic 198 69.41011
- - - - - - -American Indian - -1011
- - - - - - -Asian - -1011
- - - - - - -Two or More Races - -1011
22.6 6.5 35.6 42.1 48.6 55.1 61.6Students with Disabilities 31 29.11011
- - - - - - -Limited English Proficiency - -1011
62.3 3.2 68.7 71.9 75.1 78.3 81.5Economically Disadvantaged 151 65.51011
11/5/2014
Only Includes full year students (Time In School < Year students are removed)
'-' Indicates too few students to determine (N<30)
Title I Accountability System

13-0250-090
Belleville PS9
BELLEVILLE PUBLIC SCHOOLS
CDS CODE :
DISTRICT :
SCHOOL :
ESEA Waiver - Annual Progress Targets
The tables represent the annual proficiency targets, established for this School under ESEA Waiver
Schools and Subgroups could meet expectations either by meeting the statewide proficiency rate of 90 percent, or reaching their individually
determined progress targets. The statewide proficiency rate will be increased to 95 percent in 2015.
Performance Targets - Language Arts Literacy
Subgroup# of Valid
Test Scores
Baseline
% Proficient
Yearly
Increment
2012-2013
Target (%P)
2011-2012
Target (%P)
2013-2014
Target (%P)
2014-2015
Target (%P)
2015-2016
Target (%P)
2016-2017
Target (%P)
Baseline
year
57.6 3.6 64.8 68.4 72 75.6 79.2Schoolwide 80 61.21011
- - - - - - -White - -1011
- - - - - - -Black - -1011
49 4.3 57.6 61.9 66.2 70.5 74.8Hispanic 49 53.31011
- - - - - - -American Indian - -1011
- - - - - - -Asian - -1011
- - - - - - -Two or More Races - -1011
- - - - - - -Students with Disabilities - -1011
- - - - - - -Limited English Proficiency - -1011
52.5 4 60.5 64.5 68.5 72.5 76.5Economically Disadvantaged 61 56.51011
Performance Targets - Mathematics
Subgroup# of Valid
Test Scores
Baseline
% Proficient
Yearly
Increment
2012-2013
Target (%P)
2011-2012
Target (%P)
2013-2014
Target (%P)
2014-2015
Target (%P)
2015-2016
Target (%P)
2016-2017
Target (%P)
Baseline
year
67.5 2.7 72.9 75.6 78.3 81 83.7Schoolwide 80 70.21011
- - - - - - -White - -1011
- - - - - - -Black - -1011
61.2 3.2 67.6 70.8 74 77.2 80.4Hispanic 49 64.41011
- - - - - - -American Indian - -1011
- - - - - - -Asian - -1011
- - - - - - -Two or More Races - -1011
- - - - - - -Students with Disabilities - -1011
- - - - - - -Limited English Proficiency - -1011
64 3 70 73 76 79 82Economically Disadvantaged 61 671011
11/5/2014
Only Includes full year students (Time In School < Year students are removed)
'-' Indicates too few students to determine (N<30)
Title I Accountability System
13-0250-100
Belleville PS10
BELLEVILLE PUBLIC SCHOOLS
CDS CODE :
DISTRICT :
SCHOOL :
ESEA Waiver - Annual Progress Targets
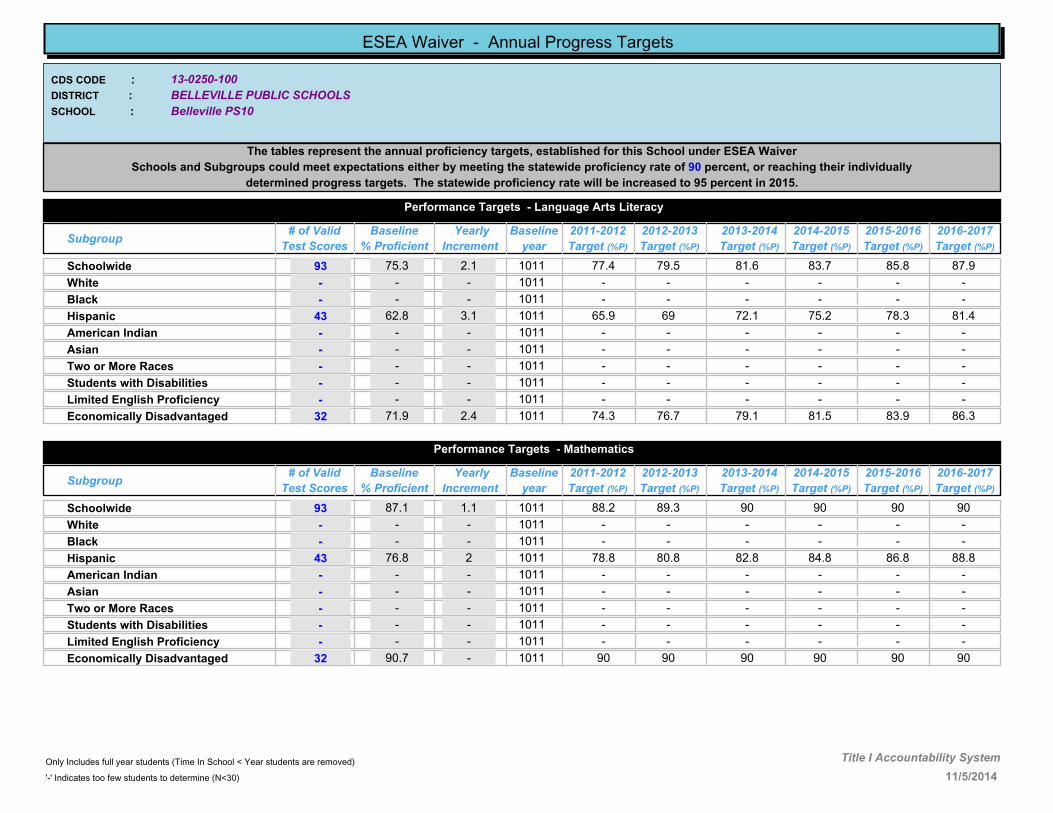
The tables represent the annual proficiency targets, established for this School under ESEA Waiver
Schools and Subgroups could meet expectations either by meeting the statewide proficiency rate of 90 percent, or reaching their individually
determined progress targets. The statewide proficiency rate will be increased to 95 percent in 2015.
Performance Targets - Language Arts Literacy
Subgroup# of Valid
Test Scores
Baseline
% Proficient
Yearly
Increment
2012-2013
Target (%P)
2011-2012
Target (%P)
2013-2014
Target (%P)
2014-2015
Target (%P)
2015-2016
Target (%P)
2016-2017
Target (%P)
Baseline
year
75.3 2.1 79.5 81.6 83.7 85.8 87.9Schoolwide 93 77.41011
- - - - - - -White - -1011
- - - - - - -Black - -1011
62.8 3.1 69 72.1 75.2 78.3 81.4Hispanic 43 65.91011
- - - - - - -American Indian - -1011
- - - - - - -Asian - -1011
- - - - - - -Two or More Races - -1011
- - - - - - -Students with Disabilities - -1011
- - - - - - -Limited English Proficiency - -1011
71.9 2.4 76.7 79.1 81.5 83.9 86.3Economically Disadvantaged 32 74.31011
Performance Targets - Mathematics
Subgroup# of Valid
Test Scores
Baseline
% Proficient
Yearly
Increment
2012-2013
Target (%P)
2011-2012
Target (%P)
2013-2014
Target (%P)
2014-2015
Target (%P)
2015-2016
Target (%P)
2016-2017
Target (%P)
Baseline
year
87.1 1.1 89.3 90 90 90 90Schoolwide 93 88.21011
- - - - - - -White - -1011
- - - - - - -Black - -1011
76.8 2 80.8 82.8 84.8 86.8 88.8Hispanic 43 78.81011
- - - - - - -American Indian - -1011
- - - - - - -Asian - -1011
- - - - - - -Two or More Races - -1011
- - - - - - -Students with Disabilities - -1011
- - - - - - -Limited English Proficiency - -1011
90.7 - 90 90 90 90 90Economically Disadvantaged 32 901011
11/5/2014
Only Includes full year students (Time In School < Year students are removed)
'-' Indicates too few students to determine (N<30)
Title I Accountability System

13-0410-020
BLOOMFIELD HIGH SCHOOL
BLOOMFIELD BOARD OF EDUCATION
CDS CODE :
DISTRICT :
SCHOOL :
ESEA Waiver - Annual Progress Targets
The tables represent the annual proficiency targets, established for this School under ESEA Waiver
Schools and Subgroups could meet expectations either by meeting the statewide proficiency rate of 90 percent, or reaching their individually
determined progress targets. The statewide proficiency rate will be increased to 95 percent in 2015.
Performance Targets - Language Arts Literacy
Subgroup# of Valid
Test Scores
Baseline
% Proficient
Yearly
Increment
2012-2013
Target (%P)
2011-2012
Target (%P)
2013-2014
Target (%P)
2014-2015
Target (%P)
2015-2016
Target (%P)
2016-2017
Target (%P)
Baseline
year
92.6 - 90 90 90 90 90Schoolwide 361 901011
92.6 - 90 90 90 90 90White 121 901011
89.2 .9 90 90 90 90 90Black 101 901011
93.5 - 90 90 90 90 90Hispanic 92 901011
- - - - - - -American Indian - -1011
97.8 - 90 90 90 90 90Asian 46 901011
- - - - - - -Two or More Races - -1011
44.4 4.6 53.6 58.2 62.8 67.4 72Students with Disabilities 36 491011
- - - - - - -Limited English Proficiency - -1011
90.1 - 90 90 90 90 90Economically Disadvantaged 142 901011
Performance Targets - Mathematics
Subgroup# of Valid
Test Scores
Baseline
% Proficient
Yearly
Increment
2012-2013
Target (%P)
2011-2012
Target (%P)
2013-2014
Target (%P)
2014-2015
Target (%P)
2015-2016
Target (%P)
2016-2017
Target (%P)
Baseline
year
82.2 1.5 85.2 86.7 88.2 89.7 90Schoolwide 360 83.71011
85.9 1.2 88.3 89.5 90 90 90White 120 87.11011
75.3 2.1 79.5 81.6 83.7 85.8 87.9Black 101 77.41011
80.5 1.6 83.7 85.3 86.9 88.5 90Hispanic 92 82.11011
- - - - - - -American Indian - -1011
91.3 - 90 90 90 90 90Asian 46 901011
- - - - - - -Two or More Races - -1011
22.9 6.4 35.7 42.1 48.5 54.9 61.3Students with Disabilities 35 29.31011
- - - - - - -Limited English Proficiency - -1011
76.6 2 80.6 82.6 84.6 86.6 88.6Economically Disadvantaged 141 78.61011
11/5/2014
Only Includes full year students (Time In School < Year students are removed)
'-' Indicates too few students to determine (N<30)
Title I Accountability System
13-0410-030
BLOOMFIELD MIDDLE SCHOOL
BLOOMFIELD BOARD OF EDUCATION
CDS CODE :
DISTRICT :
SCHOOL :
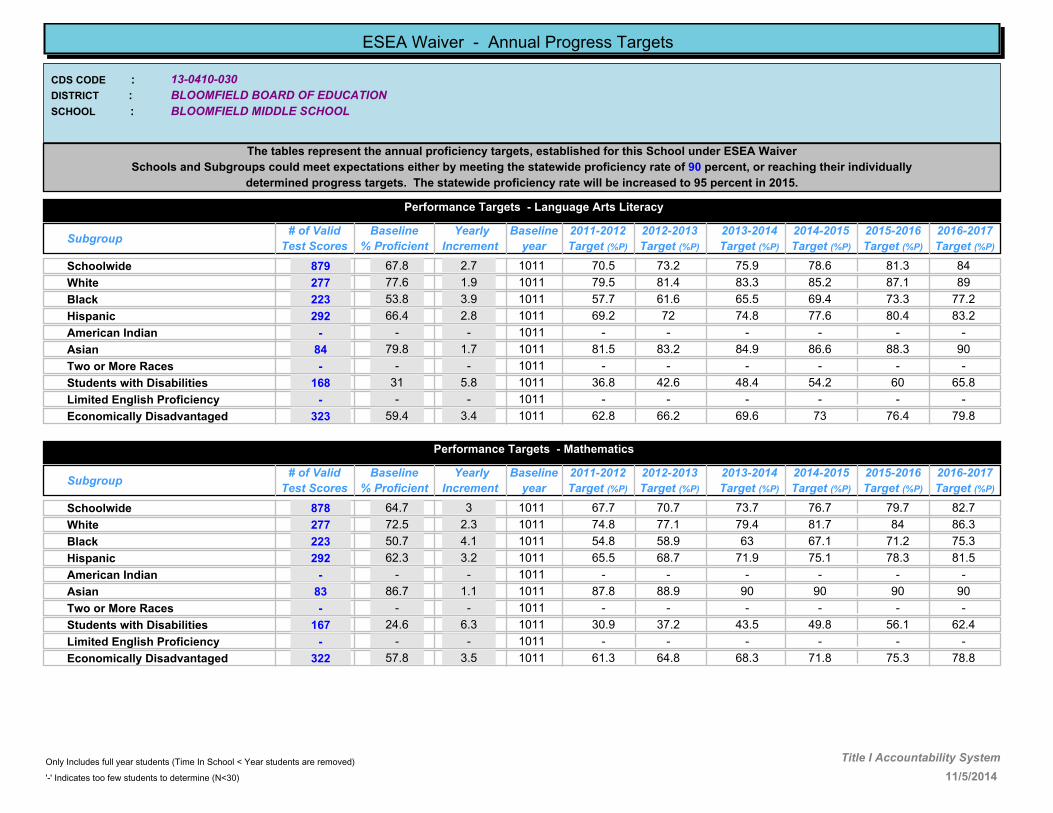
ESEA Waiver - Annual Progress Targets
The tables represent the annual proficiency targets, established for this School under ESEA Waiver
Schools and Subgroups could meet expectations either by meeting the statewide proficiency rate of 90 percent, or reaching their individually
determined progress targets. The statewide proficiency rate will be increased to 95 percent in 2015.
Performance Targets - Language Arts Literacy
Subgroup# of Valid
Test Scores
Baseline
% Proficient
Yearly
Increment
2012-2013
Target (%P)
2011-2012
Target (%P)
2013-2014
Target (%P)
2014-2015
Target (%P)
2015-2016
Target (%P)
2016-2017
Target (%P)
Baseline
year
67.8 2.7 73.2 75.9 78.6 81.3 84Schoolwide 879 70.51011
77.6 1.9 81.4 83.3 85.2 87.1 89White 277 79.51011
53.8 3.9 61.6 65.5 69.4 73.3 77.2Black 223 57.71011
66.4 2.8 72 74.8 77.6 80.4 83.2Hispanic 292 69.21011
- - - - - - -American Indian - -1011
79.8 1.7 83.2 84.9 86.6 88.3 90Asian 84 81.51011
- - - - - - -Two or More Races - -1011
31 5.8 42.6 48.4 54.2 60 65.8Students with Disabilities 168 36.81011
- - - - - - -Limited English Proficiency - -1011
59.4 3.4 66.2 69.6 73 76.4 79.8Economically Disadvantaged 323 62.81011
Performance Targets - Mathematics
Subgroup# of Valid
Test Scores
Baseline
% Proficient
Yearly
Increment
2012-2013
Target (%P)
2011-2012
Target (%P)
2013-2014
Target (%P)
2014-2015
Target (%P)
2015-2016
Target (%P)
2016-2017
Target (%P)
Baseline
year
64.7 3 70.7 73.7 76.7 79.7 82.7Schoolwide 878 67.71011
72.5 2.3 77.1 79.4 81.7 84 86.3White 277 74.81011
50.7 4.1 58.9 63 67.1 71.2 75.3Black 223 54.81011
62.3 3.2 68.7 71.9 75.1 78.3 81.5Hispanic 292 65.51011
- - - - - - -American Indian - -1011
86.7 1.1 88.9 90 90 90 90Asian 83 87.81011
- - - - - - -Two or More Races - -1011
24.6 6.3 37.2 43.5 49.8 56.1 62.4Students with Disabilities 167 30.91011
- - - - - - -Limited English Proficiency - -1011
57.8 3.5 64.8 68.3 71.8 75.3 78.8Economically Disadvantaged 322 61.31011
11/5/2014
Only Includes full year students (Time In School < Year students are removed)
'-' Indicates too few students to determine (N<30)
Title I Accountability System

13-0410-050
BERKELEY ELEMENTARY
BLOOMFIELD BOARD OF EDUCATION
CDS CODE :
DISTRICT :
SCHOOL :
ESEA Waiver - Annual Progress Targets
The tables represent the annual proficiency targets, established for this School under ESEA Waiver
Schools and Subgroups could meet expectations either by meeting the statewide proficiency rate of 90 percent, or reaching their individually
determined progress targets. The statewide proficiency rate will be increased to 95 percent in 2015.
Performance Targets - Language Arts Literacy
Subgroup# of Valid
Test Scores
Baseline
% Proficient
Yearly
Increment
2012-2013
Target (%P)
2011-2012
Target (%P)
2013-2014
Target (%P)
2014-2015
Target (%P)
2015-2016
Target (%P)
2016-2017
Target (%P)
Baseline
year
53.7 3.9 61.5 65.4 69.3 73.2 77.1Schoolwide 201 57.61011
- - - - - - -White - -1011
49.3 4.2 57.7 61.9 66.1 70.3 74.5Black 67 53.51011
53.8 3.9 61.6 65.5 69.4 73.3 77.2Hispanic 93 57.71011
- - - - - - -American Indian - -1011
- - - - - - -Asian - -1011
- - - - - - -Two or More Races - -1011
40.8 5 50.8 55.8 60.8 65.8 70.8Students with Disabilities 54 45.81011
- - - - - - -Limited English Proficiency - -1011
48.1 4.3 56.7 61 65.3 69.6 73.9Economically Disadvantaged 127 52.41011
Performance Targets - Mathematics
Subgroup# of Valid
Test Scores
Baseline
% Proficient
Yearly
Increment
2012-2013
Target (%P)
2011-2012
Target (%P)
2013-2014
Target (%P)
2014-2015
Target (%P)
2015-2016
Target (%P)
2016-2017
Target (%P)
Baseline
year
81.1 1.6 84.3 85.9 87.5 89.1 90Schoolwide 201 82.71011
- - - - - - -White - -1011
74.6 2.1 78.8 80.9 83 85.1 87.2Black 67 76.71011
82.8 1.4 85.6 87 88.4 89.8 90Hispanic 93 84.21011
- - - - - - -American Indian - -1011
- - - - - - -Asian - -1011
- - - - - - -Two or More Races - -1011
72.3 2.3 76.9 79.2 81.5 83.8 86.1Students with Disabilities 54 74.61011
- - - - - - -Limited English Proficiency - -1011
77.1 1.9 80.9 82.8 84.7 86.6 88.5Economically Disadvantaged 127 791011
11/5/2014
Only Includes full year students (Time In School < Year students are removed)
'-' Indicates too few students to determine (N<30)
Title I Accountability System
13-0410-060
BROOKDALE ELEMENTARY
BLOOMFIELD BOARD OF EDUCATION
CDS CODE :
DISTRICT :
SCHOOL :
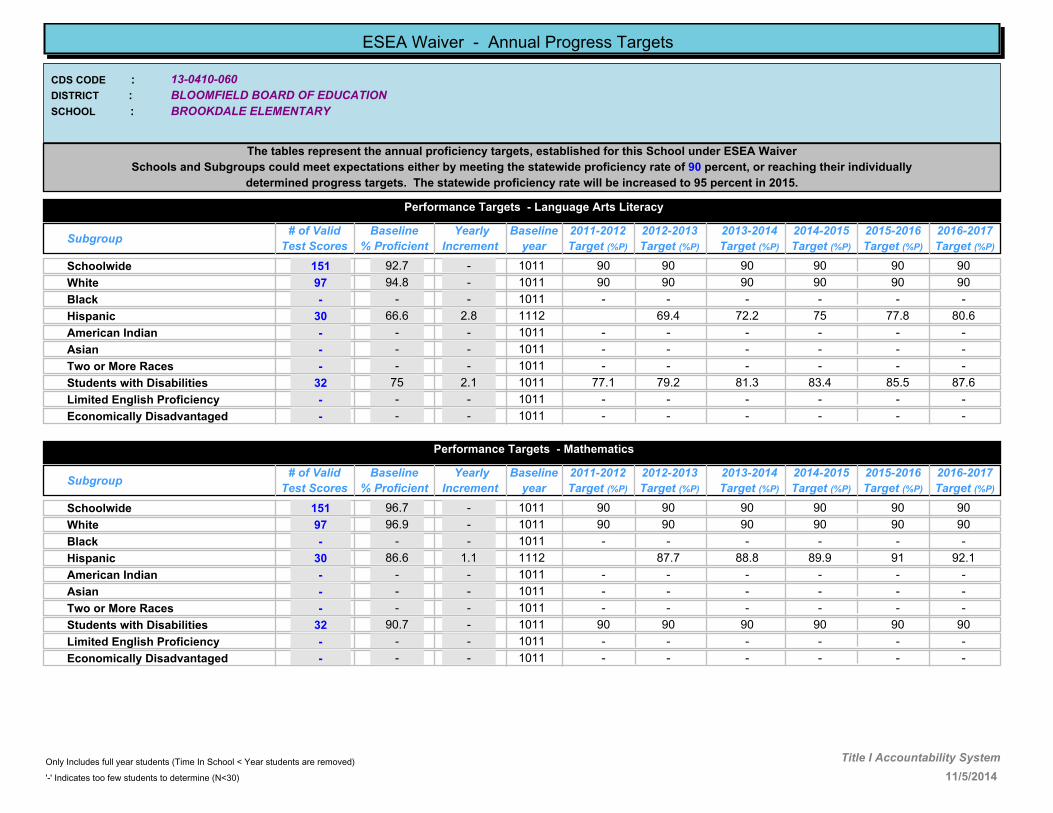
ESEA Waiver - Annual Progress Targets
The tables represent the annual proficiency targets, established for this School under ESEA Waiver
Schools and Subgroups could meet expectations either by meeting the statewide proficiency rate of 90 percent, or reaching their individually
determined progress targets. The statewide proficiency rate will be increased to 95 percent in 2015.
Performance Targets - Language Arts Literacy
Subgroup# of Valid
Test Scores
Baseline
% Proficient
Yearly
Increment
2012-2013
Target (%P)
2011-2012
Target (%P)
2013-2014
Target (%P)
2014-2015
Target (%P)
2015-2016
Target (%P)
2016-2017
Target (%P)
Baseline
year
92.7 - 90 90 90 90 90Schoolwide 151 901011
94.8 - 90 90 90 90 90White 97 901011
- - - - - - -Black - -1011
66.6 2.8 69.4 72.2 75 77.8 80.6Hispanic 30 1112
- - - - - - -American Indian - -1011
- - - - - - -Asian - -1011
- - - - - - -Two or More Races - -1011
75 2.1 79.2 81.3 83.4 85.5 87.6Students with Disabilities 32 77.11011
- - - - - - -Limited English Proficiency - -1011
- - - - - - -Economically Disadvantaged - -1011
Performance Targets - Mathematics
Subgroup# of Valid
Test Scores
Baseline
% Proficient
Yearly
Increment
2012-2013
Target (%P)
2011-2012
Target (%P)
2013-2014
Target (%P)
2014-2015
Target (%P)
2015-2016
Target (%P)
2016-2017
Target (%P)
Baseline
year
96.7 - 90 90 90 90 90Schoolwide 151 901011
96.9 - 90 90 90 90 90White 97 901011
- - - - - - -Black - -1011
86.6 1.1 87.7 88.8 89.9 91 92.1Hispanic 30 1112
- - - - - - -American Indian - -1011
- - - - - - -Asian - -1011
- - - - - - -Two or More Races - -1011
90.7 - 90 90 90 90 90Students with Disabilities 32 901011
- - - - - - -Limited English Proficiency - -1011
- - - - - - -Economically Disadvantaged - -1011
11/5/2014
Only Includes full year students (Time In School < Year students are removed)
'-' Indicates too few students to determine (N<30)
Title I Accountability System

13-0410-080
CARTERET ELEMENTARY
BLOOMFIELD BOARD OF EDUCATION
CDS CODE :
DISTRICT :
SCHOOL :
ESEA Waiver - Annual Progress Targets
The tables represent the annual proficiency targets, established for this School under ESEA Waiver
Schools and Subgroups could meet expectations either by meeting the statewide proficiency rate of 90 percent, or reaching their individually
determined progress targets. The statewide proficiency rate will be increased to 95 percent in 2015.
Performance Targets - Language Arts Literacy
Subgroup# of Valid
Test Scores
Baseline
% Proficient
Yearly
Increment
2012-2013
Target (%P)
2011-2012
Target (%P)
2013-2014
Target (%P)
2014-2015
Target (%P)
2015-2016
Target (%P)
2016-2017
Target (%P)
Baseline
year
70.1 2.5 75.1 77.6 80.1 82.6 85.1Schoolwide 207 72.61011
- - - - - - -White - -1011
71.7 2.4 76.5 78.9 81.3 83.7 86.1Black 53 74.11011
70.5 2.5 75.5 78 80.5 83 85.5Hispanic 119 731011
- - - - - - -American Indian - -1011
- - - - - - -Asian - -1011
- - - - - - -Two or More Races - -1011
36.1 5.3 46.7 52 57.3 62.6 67.9Students with Disabilities 61 41.41011
- - - - - - -Limited English Proficiency - -1011
69.2 2.6 74.4 77 79.6 82.2 84.8Economically Disadvantaged 146 71.81011
Performance Targets - Mathematics
Subgroup# of Valid
Test Scores
Baseline
% Proficient
Yearly
Increment
2012-2013
Target (%P)
2011-2012
Target (%P)
2013-2014
Target (%P)
2014-2015
Target (%P)
2015-2016
Target (%P)
2016-2017
Target (%P)
Baseline
year
88.9 .9 90 90 90 90 90Schoolwide 208 89.81011
- - - - - - -White - -1011
84.9 1.3 87.5 88.8 90 90 90Black 53 86.21011
89.1 .9 90 90 90 90 90Hispanic 120 901011
- - - - - - -American Indian - -1011
- - - - - - -Asian - -1011
- - - - - - -Two or More Races - -1011
72.6 2.3 77.2 79.5 81.8 84.1 86.4Students with Disabilities 62 74.91011
- - - - - - -Limited English Proficiency - -1011
89 .9 90 90 90 90 90Economically Disadvantaged 146 89.91011
11/5/2014
Only Includes full year students (Time In School < Year students are removed)
'-' Indicates too few students to determine (N<30)
Title I Accountability System

13-0410-100
DEMAREST ELEMENTARY
BLOOMFIELD BOARD OF EDUCATION
CDS CODE :
DISTRICT :
SCHOOL :
ESEA Waiver - Annual Progress Targets
The tables represent the annual proficiency targets, established for this School under ESEA Waiver
Schools and Subgroups could meet expectations either by meeting the statewide proficiency rate of 90 percent, or reaching their individually
determined progress targets. The statewide proficiency rate will be increased to 95 percent in 2015.
Performance Targets - Language Arts Literacy
Subgroup# of Valid
Test Scores
Baseline
% Proficient
Yearly
Increment
2012-2013
Target (%P)
2011-2012
Target (%P)
2013-2014
Target (%P)
2014-2015
Target (%P)
2015-2016
Target (%P)
2016-2017
Target (%P)
Baseline
year
74.4 2.1 78.6 80.7 82.8 84.9 87Schoolwide 273 76.51011
73.2 2.2 77.6 79.8 82 84.2 86.4White 127 75.41011
75.5 2.1 79.7 81.8 83.9 86 88.1Black 57 77.61011
68.9 2.6 74.1 76.7 79.3 81.9 84.5Hispanic 61 71.51011
- - - - - - -American Indian - -1011
- - - - - - -Asian - -1011
- - - - - - -Two or More Races - -1011
38.6 5.1 48.8 53.9 59 64.1 69.2Students with Disabilities 44 43.71011
- - - - - - -Limited English Proficiency - -1011
69.3 2.6 74.5 77.1 79.7 82.3 84.9Economically Disadvantaged 52 71.91011
Performance Targets - Mathematics
Subgroup# of Valid
Test Scores
Baseline
% Proficient
Yearly
Increment
2012-2013
Target (%P)
2011-2012
Target (%P)
2013-2014
Target (%P)
2014-2015
Target (%P)
2015-2016
Target (%P)
2016-2017
Target (%P)
Baseline
year
85 1.3 87.6 88.9 90 90 90Schoolwide 273 86.31011
85.1 1.3 87.7 89 90 90 90White 127 86.41011
78.9 1.8 82.5 84.3 86.1 87.9 89.7Black 57 80.71011
85.3 1.2 87.7 88.9 90 90 90Hispanic 61 86.51011
- - - - - - -American Indian - -1011
- - - - - - -Asian - -1011
- - - - - - -Two or More Races - -1011
56.8 3.6 64 67.6 71.2 74.8 78.4Students with Disabilities 44 60.41011
- - - - - - -Limited English Proficiency - -1011
86.6 1.1 88.8 89.9 90 90 90Economically Disadvantaged 52 87.71011
11/5/2014
Only Includes full year students (Time In School < Year students are removed)
'-' Indicates too few students to determine (N<30)
Title I Accountability System

13-0410-110
FAIRVIEW ELEMENTARY
BLOOMFIELD BOARD OF EDUCATION
CDS CODE :
DISTRICT :
SCHOOL :
ESEA Waiver - Annual Progress Targets
The tables represent the annual proficiency targets, established for this School under ESEA Waiver
Schools and Subgroups could meet expectations either by meeting the statewide proficiency rate of 90 percent, or reaching their individually
determined progress targets. The statewide proficiency rate will be increased to 95 percent in 2015.
Performance Targets - Language Arts Literacy
Subgroup# of Valid
Test Scores
Baseline
% Proficient
Yearly
Increment
2012-2013
Target (%P)
2011-2012
Target (%P)
2013-2014
Target (%P)
2014-2015
Target (%P)
2015-2016
Target (%P)
2016-2017
Target (%P)
Baseline
year
58.5 3.5 65.5 69 72.5 76 79.5Schoolwide 231 621011
67.2 2.7 72.6 75.3 78 80.7 83.4White 64 69.91011
44.7 4.6 53.9 58.5 63.1 67.7 72.3Black 76 49.31011
58.2 3.5 65.2 68.7 72.2 75.7 79.2Hispanic 67 61.71011
- - - - - - -American Indian - -1011
- - - - - - -Asian - -1011
- - - - - - -Two or More Races - -1011
22.6 6.5 29.1 35.6 42.1 48.6 55.1Students with Disabilities 31 1112
- - - - - - -Limited English Proficiency - -1011
43.6 4.7 53 57.7 62.4 67.1 71.8Economically Disadvantaged 110 48.31011
Performance Targets - Mathematics
Subgroup# of Valid
Test Scores
Baseline
% Proficient
Yearly
Increment
2012-2013
Target (%P)
2011-2012
Target (%P)
2013-2014
Target (%P)
2014-2015
Target (%P)
2015-2016
Target (%P)
2016-2017
Target (%P)
Baseline
year
74.4 2.2 78.8 81 83.2 85.4 87.6Schoolwide 230 76.61011
82.6 1.5 85.6 87.1 88.6 90 90White 63 84.11011
61.8 3.2 68.2 71.4 74.6 77.8 81Black 76 651011
74.6 2.1 78.8 80.9 83 85.1 87.2Hispanic 67 76.71011
- - - - - - -American Indian - -1011
- - - - - - -Asian - -1011
- - - - - - -Two or More Races - -1011
51.6 4 55.6 59.6 63.6 67.6 71.6Students with Disabilities 31 1112
- - - - - - -Limited English Proficiency - -1011
67.9 2.7 73.3 76 78.7 81.4 84.1Economically Disadvantaged 109 70.61011
11/5/2014
Only Includes full year students (Time In School < Year students are removed)
'-' Indicates too few students to determine (N<30)
Title I Accountability System

13-0410-130
FRANKLIN ELEMENTARY
BLOOMFIELD BOARD OF EDUCATION
CDS CODE :
DISTRICT :
SCHOOL :
ESEA Waiver - Annual Progress Targets
The tables represent the annual proficiency targets, established for this School under ESEA Waiver
Schools and Subgroups could meet expectations either by meeting the statewide proficiency rate of 90 percent, or reaching their individually
determined progress targets. The statewide proficiency rate will be increased to 95 percent in 2015.
Performance Targets - Language Arts Literacy
Subgroup# of Valid
Test Scores
Baseline
% Proficient
Yearly
Increment
2012-2013
Target (%P)
2011-2012
Target (%P)
2013-2014
Target (%P)
2014-2015
Target (%P)
2015-2016
Target (%P)
2016-2017
Target (%P)
Baseline
year
64.1 3 70.1 73.1 76.1 79.1 82.1Schoolwide 195 67.11011
62.6 3.1 68.8 71.9 75 78.1 81.2White 83 65.71011
65.8 2.9 71.6 74.5 77.4 80.3 83.2Black 38 68.71011
64.6 3 70.6 73.6 76.6 79.6 82.6Hispanic 65 67.61011
- - - - - - -American Indian - -1011
- - - - - - -Asian - -1011
- - - - - - -Two or More Races - -1011
39.1 5.1 49.3 54.4 59.5 64.6 69.7Students with Disabilities 46 44.21011
- - - - - - -Limited English Proficiency - -1011
62.3 3.2 68.7 71.9 75.1 78.3 81.5Economically Disadvantaged 77 65.51011
Performance Targets - Mathematics
Subgroup# of Valid
Test Scores
Baseline
% Proficient
Yearly
Increment
2012-2013
Target (%P)
2011-2012
Target (%P)
2013-2014
Target (%P)
2014-2015
Target (%P)
2015-2016
Target (%P)
2016-2017
Target (%P)
Baseline
year
77 1.9 80.8 82.7 84.6 86.5 88.4Schoolwide 196 78.91011
83.1 1.4 85.9 87.3 88.7 90 90White 83 84.51011
73.7 2.2 78.1 80.3 82.5 84.7 86.9Black 38 75.91011
71.3 2.4 76.1 78.5 80.9 83.3 85.7Hispanic 66 73.71011
- - - - - - -American Indian - -1011
- - - - - - -Asian - -1011
- - - - - - -Two or More Races - -1011
53.2 3.9 61 64.9 68.8 72.7 76.6Students with Disabilities 47 57.11011
- - - - - - -Limited English Proficiency - -1011
74.1 2.2 78.5 80.7 82.9 85.1 87.3Economically Disadvantaged 77 76.31011
11/5/2014
Only Includes full year students (Time In School < Year students are removed)
'-' Indicates too few students to determine (N<30)
Title I Accountability System
13-0410-140
OAK VIEW ELEMENTARY
BLOOMFIELD BOARD OF EDUCATION
CDS CODE :
DISTRICT :
SCHOOL :
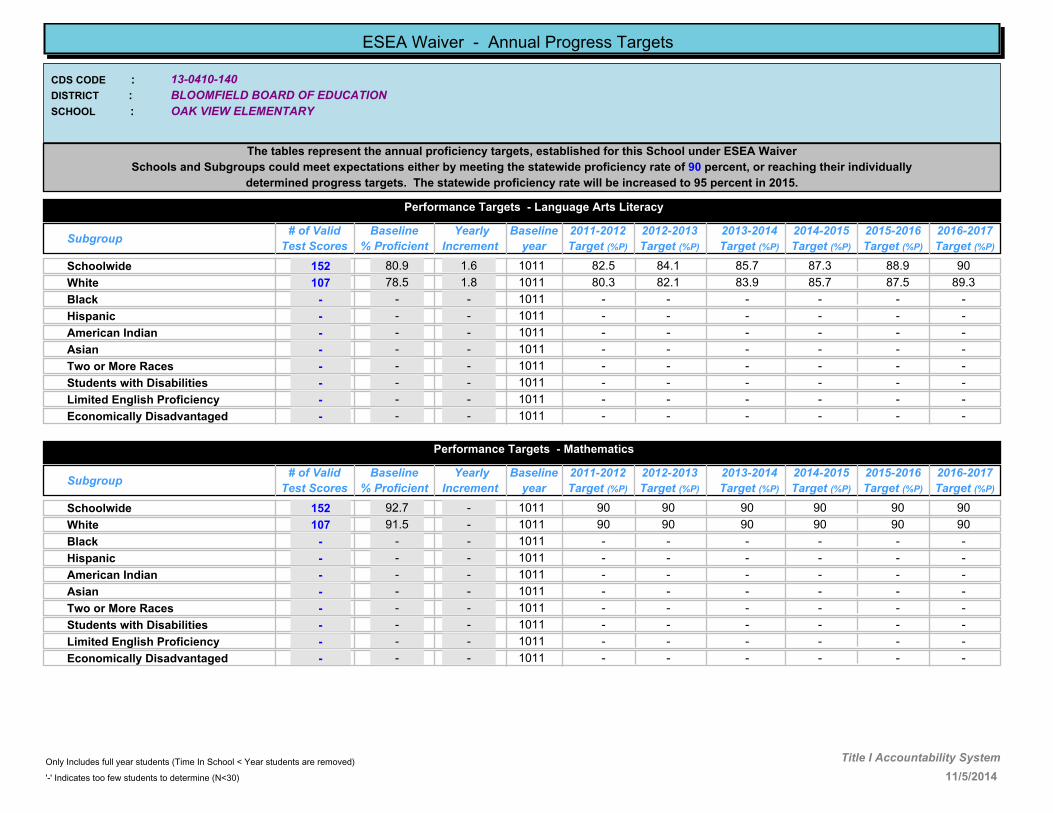
ESEA Waiver - Annual Progress Targets
The tables represent the annual proficiency targets, established for this School under ESEA Waiver
Schools and Subgroups could meet expectations either by meeting the statewide proficiency rate of 90 percent, or reaching their individually
determined progress targets. The statewide proficiency rate will be increased to 95 percent in 2015.
Performance Targets - Language Arts Literacy
Subgroup# of Valid
Test Scores
Baseline
% Proficient
Yearly
Increment
2012-2013
Target (%P)
2011-2012
Target (%P)
2013-2014
Target (%P)
2014-2015
Target (%P)
2015-2016
Target (%P)
2016-2017
Target (%P)
Baseline
year
80.9 1.6 84.1 85.7 87.3 88.9 90Schoolwide 152 82.51011
78.5 1.8 82.1 83.9 85.7 87.5 89.3White 107 80.31011
- - - - - - -Black - -1011
- - - - - - -Hispanic - -1011
- - - - - - -American Indian - -1011
- - - - - - -Asian - -1011
- - - - - - -Two or More Races - -1011
- - - - - - -Students with Disabilities - -1011
- - - - - - -Limited English Proficiency - -1011
- - - - - - -Economically Disadvantaged - -1011
Performance Targets - Mathematics
Subgroup# of Valid
Test Scores
Baseline
% Proficient
Yearly
Increment
2012-2013
Target (%P)
2011-2012
Target (%P)
2013-2014
Target (%P)
2014-2015
Target (%P)
2015-2016
Target (%P)
2016-2017
Target (%P)
Baseline
year
92.7 - 90 90 90 90 90Schoolwide 152 901011
91.5 - 90 90 90 90 90White 107 901011
- - - - - - -Black - -1011
- - - - - - -Hispanic - -1011
- - - - - - -American Indian - -1011
- - - - - - -Asian - -1011
- - - - - - -Two or More Races - -1011
- - - - - - -Students with Disabilities - -1011
- - - - - - -Limited English Proficiency - -1011
- - - - - - -Economically Disadvantaged - -1011
11/5/2014
Only Includes full year students (Time In School < Year students are removed)
'-' Indicates too few students to determine (N<30)
Title I Accountability System
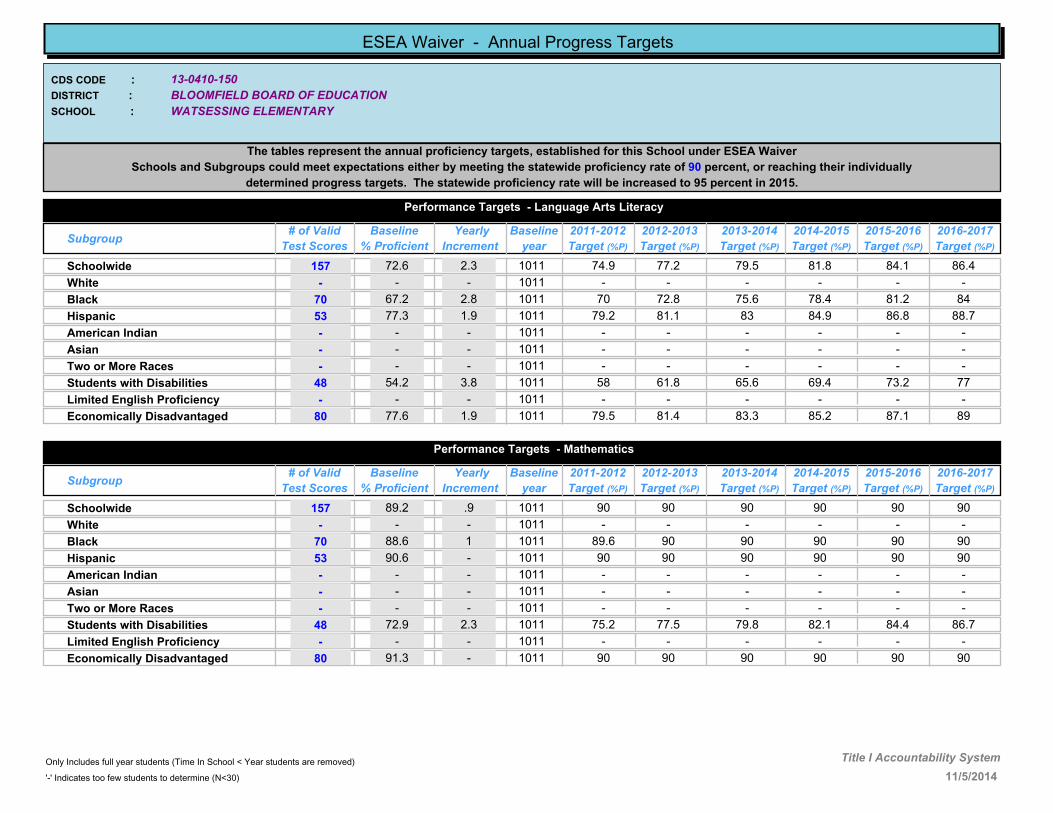
13-0410-150
WATSESSING ELEMENTARY
BLOOMFIELD BOARD OF EDUCATION
CDS CODE :
DISTRICT :
SCHOOL :
ESEA Waiver - Annual Progress Targets
The tables represent the annual proficiency targets, established for this School under ESEA Waiver
Schools and Subgroups could meet expectations either by meeting the statewide proficiency rate of 90 percent, or reaching their individually
determined progress targets. The statewide proficiency rate will be increased to 95 percent in 2015.
Performance Targets - Language Arts Literacy
Subgroup# of Valid
Test Scores
Baseline
% Proficient
Yearly
Increment
2012-2013
Target (%P)
2011-2012
Target (%P)
2013-2014
Target (%P)
2014-2015
Target (%P)
2015-2016
Target (%P)
2016-2017
Target (%P)
Baseline
year
72.6 2.3 77.2 79.5 81.8 84.1 86.4Schoolwide 157 74.91011
- - - - - - -White - -1011
67.2 2.8 72.8 75.6 78.4 81.2 84Black 70 701011
77.3 1.9 81.1 83 84.9 86.8 88.7Hispanic 53 79.21011
- - - - - - -American Indian - -1011
- - - - - - -Asian - -1011
- - - - - - -Two or More Races - -1011
54.2 3.8 61.8 65.6 69.4 73.2 77Students with Disabilities 48 581011
- - - - - - -Limited English Proficiency - -1011
77.6 1.9 81.4 83.3 85.2 87.1 89Economically Disadvantaged 80 79.51011
Performance Targets - Mathematics
Subgroup# of Valid
Test Scores
Baseline
% Proficient
Yearly
Increment
2012-2013
Target (%P)
2011-2012
Target (%P)
2013-2014
Target (%P)
2014-2015
Target (%P)
2015-2016
Target (%P)
2016-2017
Target (%P)
Baseline
year
89.2 .9 90 90 90 90 90Schoolwide 157 901011
- - - - - - -White - -1011
88.6 1 90 90 90 90 90Black 70 89.61011
90.6 - 90 90 90 90 90Hispanic 53 901011
- - - - - - -American Indian - -1011
- - - - - - -Asian - -1011
- - - - - - -Two or More Races - -1011
72.9 2.3 77.5 79.8 82.1 84.4 86.7Students with Disabilities 48 75.21011
- - - - - - -Limited English Proficiency - -1011
91.3 - 90 90 90 90 90Economically Disadvantaged 80 901011
11/5/2014
Only Includes full year students (Time In School < Year students are removed)
'-' Indicates too few students to determine (N<30)
Title I Accountability System

13-0660-050
JAMES CALDWELL HIGH SCHOOL
CALDWELL-WEST CALDWELL PUBLIC SCHOOLS
CDS CODE :
DISTRICT :
SCHOOL :
ESEA Waiver - Annual Progress Targets
The tables represent the annual proficiency targets, established for this School under ESEA Waiver
Schools and Subgroups could meet expectations either by meeting the statewide proficiency rate of 90 percent, or reaching their individually
determined progress targets. The statewide proficiency rate will be increased to 95 percent in 2015.
Performance Targets - Language Arts Literacy
Subgroup# of Valid
Test Scores
Baseline
% Proficient
Yearly
Increment
2012-2013
Target (%P)
2011-2012
Target (%P)
2013-2014
Target (%P)
2014-2015
Target (%P)
2015-2016
Target (%P)
2016-2017
Target (%P)
Baseline
year
93.9 - 90 90 90 90 90Schoolwide 215 901011
95.5 - 90 90 90 90 90White 177 901011
- - - - - - -Black - -1011
- - - - - - -Hispanic - -1011
- - - - - - -American Indian - -1011
- - - - - - -Asian - -1011
- - - - - - -Two or More Races - -1011
70.6 2.5 75.6 78.1 80.6 83.1 85.6Students with Disabilities 34 73.11011
- - - - - - -Limited English Proficiency - -1011
- - - - - - -Economically Disadvantaged - -1011
Performance Targets - Mathematics
Subgroup# of Valid
Test Scores
Baseline
% Proficient
Yearly
Increment
2012-2013
Target (%P)
2011-2012
Target (%P)
2013-2014
Target (%P)
2014-2015
Target (%P)
2015-2016
Target (%P)
2016-2017
Target (%P)
Baseline
year
88.9 .9 90 90 90 90 90Schoolwide 215 89.81011
89.8 .9 90 90 90 90 90White 177 901011
- - - - - - -Black - -1011
- - - - - - -Hispanic - -1011
- - - - - - -American Indian - -1011
- - - - - - -Asian - -1011
- - - - - - -Two or More Races - -1011
44.1 4.7 53.5 58.2 62.9 67.6 72.3Students with Disabilities 34 48.81011
- - - - - - -Limited English Proficiency - -1011
- - - - - - -Economically Disadvantaged - -1011
11/5/2014
Only Includes full year students (Time In School < Year students are removed)
'-' Indicates too few students to determine (N<30)
Title I Accountability System
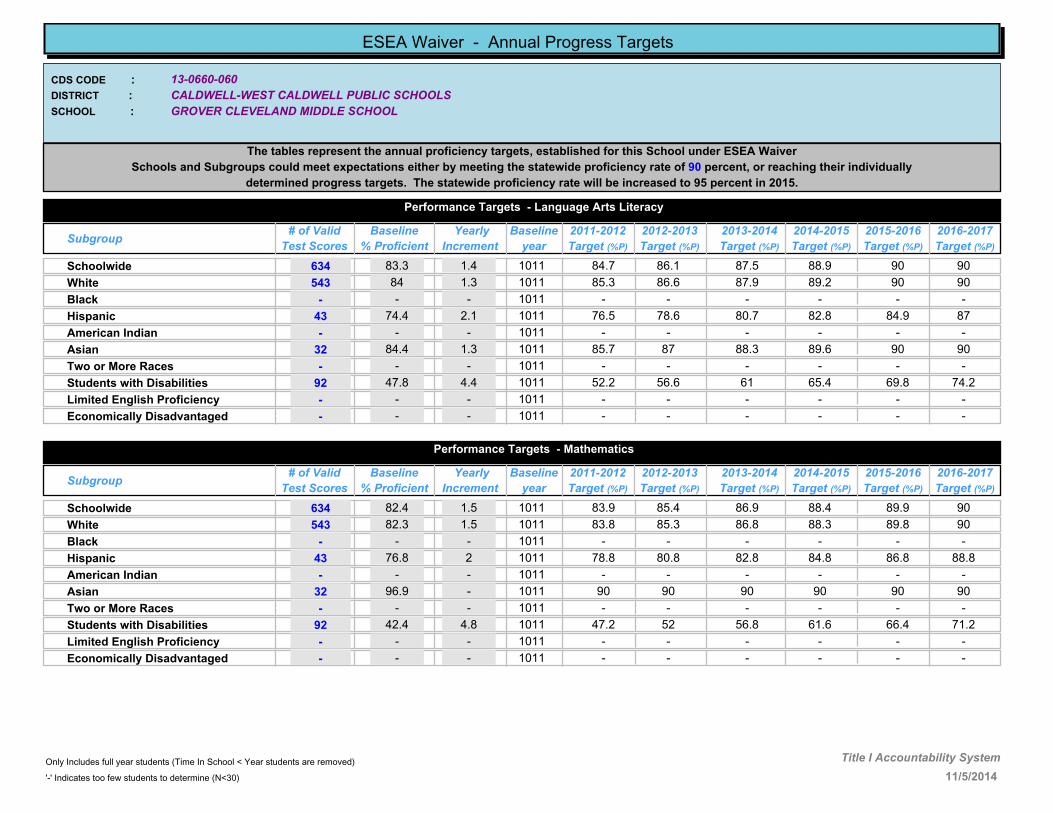
13-0660-060
GROVER CLEVELAND MIDDLE SCHOOL
CALDWELL-WEST CALDWELL PUBLIC SCHOOLS
CDS CODE :
DISTRICT :
SCHOOL :
ESEA Waiver - Annual Progress Targets
The tables represent the annual proficiency targets, established for this School under ESEA Waiver
Schools and Subgroups could meet expectations either by meeting the statewide proficiency rate of 90 percent, or reaching their individually
determined progress targets. The statewide proficiency rate will be increased to 95 percent in 2015.
Performance Targets - Language Arts Literacy
Subgroup# of Valid
Test Scores
Baseline
% Proficient
Yearly
Increment
2012-2013
Target (%P)
2011-2012
Target (%P)
2013-2014
Target (%P)
2014-2015
Target (%P)
2015-2016
Target (%P)
2016-2017
Target (%P)
Baseline
year
83.3 1.4 86.1 87.5 88.9 90 90Schoolwide 634 84.71011
84 1.3 86.6 87.9 89.2 90 90White 543 85.31011
- - - - - - -Black - -1011
74.4 2.1 78.6 80.7 82.8 84.9 87Hispanic 43 76.51011
- - - - - - -American Indian - -1011
84.4 1.3 87 88.3 89.6 90 90Asian 32 85.71011
- - - - - - -Two or More Races - -1011
47.8 4.4 56.6 61 65.4 69.8 74.2Students with Disabilities 92 52.21011
- - - - - - -Limited English Proficiency - -1011
- - - - - - -Economically Disadvantaged - -1011
Performance Targets - Mathematics
Subgroup# of Valid
Test Scores
Baseline
% Proficient
Yearly
Increment
2012-2013
Target (%P)
2011-2012
Target (%P)
2013-2014
Target (%P)
2014-2015
Target (%P)
2015-2016
Target (%P)
2016-2017
Target (%P)
Baseline
year
82.4 1.5 85.4 86.9 88.4 89.9 90Schoolwide 634 83.91011
82.3 1.5 85.3 86.8 88.3 89.8 90White 543 83.81011
- - - - - - -Black - -1011
76.8 2 80.8 82.8 84.8 86.8 88.8Hispanic 43 78.81011
- - - - - - -American Indian - -1011
96.9 - 90 90 90 90 90Asian 32 901011
- - - - - - -Two or More Races - -1011
42.4 4.8 52 56.8 61.6 66.4 71.2Students with Disabilities 92 47.21011
- - - - - - -Limited English Proficiency - -1011
- - - - - - -Economically Disadvantaged - -1011
11/5/2014
Only Includes full year students (Time In School < Year students are removed)
'-' Indicates too few students to determine (N<30)
Title I Accountability System

13-0660-070
JEFFERSON ELEMENTARY SCHOOL
CALDWELL-WEST CALDWELL PUBLIC SCHOOLS
CDS CODE :
DISTRICT :
SCHOOL :
ESEA Waiver - Annual Progress Targets
The tables represent the annual proficiency targets, established for this School under ESEA Waiver
Schools and Subgroups could meet expectations either by meeting the statewide proficiency rate of 90 percent, or reaching their individually
determined progress targets. The statewide proficiency rate will be increased to 95 percent in 2015.
Performance Targets - Language Arts Literacy
Subgroup# of Valid
Test Scores
Baseline
% Proficient
Yearly
Increment
2012-2013
Target (%P)
2011-2012
Target (%P)
2013-2014
Target (%P)
2014-2015
Target (%P)
2015-2016
Target (%P)
2016-2017
Target (%P)
Baseline
year
80 1.7 83.4 85.1 86.8 88.5 90Schoolwide 145 81.71011
82.9 1.4 85.7 87.1 88.5 89.9 90White 128 84.31011
- - - - - - -Black - -1011
- - - - - - -Hispanic - -1011
- - - - - - -American Indian - -1011
- - - - - - -Asian - -1011
- - - - - - -Two or More Races - -1011
- - - - - - -Students with Disabilities - -1011
- - - - - - -Limited English Proficiency - -1011
- - - - - - -Economically Disadvantaged - -1011
Performance Targets - Mathematics
Subgroup# of Valid
Test Scores
Baseline
% Proficient
Yearly
Increment
2012-2013
Target (%P)
2011-2012
Target (%P)
2013-2014
Target (%P)
2014-2015
Target (%P)
2015-2016
Target (%P)
2016-2017
Target (%P)
Baseline
year
86.2 1.2 88.6 89.8 90 90 90Schoolwide 145 87.41011
89.1 .9 90 90 90 90 90White 128 901011
- - - - - - -Black - -1011
- - - - - - -Hispanic - -1011
- - - - - - -American Indian - -1011
- - - - - - -Asian - -1011
- - - - - - -Two or More Races - -1011
- - - - - - -Students with Disabilities - -1011
- - - - - - -Limited English Proficiency - -1011
- - - - - - -Economically Disadvantaged - -1011
11/5/2014
Only Includes full year students (Time In School < Year students are removed)
'-' Indicates too few students to determine (N<30)
Title I Accountability System

13-0660-080
LINCOLN ELEMENTARY SCHOOL
CALDWELL-WEST CALDWELL PUBLIC SCHOOLS
CDS CODE :
DISTRICT :
SCHOOL :
ESEA Waiver - Annual Progress Targets
The tables represent the annual proficiency targets, established for this School under ESEA Waiver
Schools and Subgroups could meet expectations either by meeting the statewide proficiency rate of 90 percent, or reaching their individually
determined progress targets. The statewide proficiency rate will be increased to 95 percent in 2015.
Performance Targets - Language Arts Literacy
Subgroup# of Valid
Test Scores
Baseline
% Proficient
Yearly
Increment
2012-2013
Target (%P)
2011-2012
Target (%P)
2013-2014
Target (%P)
2014-2015
Target (%P)
2015-2016
Target (%P)
2016-2017
Target (%P)
Baseline
year
80.5 1.6 83.7 85.3 86.9 88.5 90Schoolwide 118 82.11011
82.6 1.5 85.6 87.1 88.6 90 90White 104 84.11011
- - - - - - -Black - -1011
- - - - - - -Hispanic - -1011
- - - - - - -American Indian - -1011
- - - - - - -Asian - -1011
- - - - - - -Two or More Races - -1011
- - - - - - -Students with Disabilities - -1011
- - - - - - -Limited English Proficiency - -1011
- - - - - - -Economically Disadvantaged - -1011
Performance Targets - Mathematics
Subgroup# of Valid
Test Scores
Baseline
% Proficient
Yearly
Increment
2012-2013
Target (%P)
2011-2012
Target (%P)
2013-2014
Target (%P)
2014-2015
Target (%P)
2015-2016
Target (%P)
2016-2017
Target (%P)
Baseline
year
89 .9 90 90 90 90 90Schoolwide 118 89.91011
91.3 - 90 90 90 90 90White 104 901011
- - - - - - -Black - -1011
- - - - - - -Hispanic - -1011
- - - - - - -American Indian - -1011
- - - - - - -Asian - -1011
- - - - - - -Two or More Races - -1011
- - - - - - -Students with Disabilities - -1011
- - - - - - -Limited English Proficiency - -1011
- - - - - - -Economically Disadvantaged - -1011
11/5/2014
Only Includes full year students (Time In School < Year students are removed)
'-' Indicates too few students to determine (N<30)
Title I Accountability System

13-0660-110
WASHINGTON ELEMENTARY SCHOOL
CALDWELL-WEST CALDWELL PUBLIC SCHOOLS
CDS CODE :
DISTRICT :
SCHOOL :
ESEA Waiver - Annual Progress Targets
The tables represent the annual proficiency targets, established for this School under ESEA Waiver
Schools and Subgroups could meet expectations either by meeting the statewide proficiency rate of 90 percent, or reaching their individually
determined progress targets. The statewide proficiency rate will be increased to 95 percent in 2015.
Performance Targets - Language Arts Literacy
Subgroup# of Valid
Test Scores
Baseline
% Proficient
Yearly
Increment
2012-2013
Target (%P)
2011-2012
Target (%P)
2013-2014
Target (%P)
2014-2015
Target (%P)
2015-2016
Target (%P)
2016-2017
Target (%P)
Baseline
year
80.3 1.7 83.7 85.4 87.1 88.8 90Schoolwide 198 821011
81.5 1.6 84.7 86.3 87.9 89.5 90White 178 83.11011
- - - - - - -Black - -1011
- - - - - - -Hispanic - -1011
- - - - - - -American Indian - -1011
- - - - - - -Asian - -1011
- - - - - - -Two or More Races - -1011
- - - - - - -Students with Disabilities - -1011
- - - - - - -Limited English Proficiency - -1011
- - - - - - -Economically Disadvantaged - -1011
Performance Targets - Mathematics
Subgroup# of Valid
Test Scores
Baseline
% Proficient
Yearly
Increment
2012-2013
Target (%P)
2011-2012
Target (%P)
2013-2014
Target (%P)
2014-2015
Target (%P)
2015-2016
Target (%P)
2016-2017
Target (%P)
Baseline
year
88.4 1 90 90 90 90 90Schoolwide 198 89.41011
89.3 .9 90 90 90 90 90White 178 901011
- - - - - - -Black - -1011
- - - - - - -Hispanic - -1011
- - - - - - -American Indian - -1011
- - - - - - -Asian - -1011
- - - - - - -Two or More Races - -1011
- - - - - - -Students with Disabilities - -1011
- - - - - - -Limited English Proficiency - -1011
- - - - - - -Economically Disadvantaged - -1011
11/5/2014
Only Includes full year students (Time In School < Year students are removed)
'-' Indicates too few students to determine (N<30)
Title I Accountability System

13-0660-120
WILSON ELEMENTARY SCHOOL
CALDWELL-WEST CALDWELL PUBLIC SCHOOLS
CDS CODE :
DISTRICT :
SCHOOL :
ESEA Waiver - Annual Progress Targets
The tables represent the annual proficiency targets, established for this School under ESEA Waiver
Schools and Subgroups could meet expectations either by meeting the statewide proficiency rate of 90 percent, or reaching their individually
determined progress targets. The statewide proficiency rate will be increased to 95 percent in 2015.
Performance Targets - Language Arts Literacy
Subgroup# of Valid
Test Scores
Baseline
% Proficient
Yearly
Increment
2012-2013
Target (%P)
2011-2012
Target (%P)
2013-2014
Target (%P)
2014-2015
Target (%P)
2015-2016
Target (%P)
2016-2017
Target (%P)
Baseline
year
88 1 90 90 90 90 90Schoolwide 116 891011
86.9 1.1 89.1 90 90 90 90White 99 881011
- - - - - - -Black - -1011
- - - - - - -Hispanic - -1011
- - - - - - -American Indian - -1011
- - - - - - -Asian - -1011
- - - - - - -Two or More Races - -1011
- - - - - - -Students with Disabilities - -1011
- - - - - - -Limited English Proficiency - -1011
- - - - - - -Economically Disadvantaged - -1011
Performance Targets - Mathematics
Subgroup# of Valid
Test Scores
Baseline
% Proficient
Yearly
Increment
2012-2013
Target (%P)
2011-2012
Target (%P)
2013-2014
Target (%P)
2014-2015
Target (%P)
2015-2016
Target (%P)
2016-2017
Target (%P)
Baseline
year
98.2 - 90 90 90 90 90Schoolwide 116 901011
98 - 90 90 90 90 90White 99 901011
- - - - - - -Black - -1011
- - - - - - -Hispanic - -1011
- - - - - - -American Indian - -1011
- - - - - - -Asian - -1011
- - - - - - -Two or More Races - -1011
- - - - - - -Students with Disabilities - -1011
- - - - - - -Limited English Proficiency - -1011
- - - - - - -Economically Disadvantaged - -1011
11/5/2014
Only Includes full year students (Time In School < Year students are removed)
'-' Indicates too few students to determine (N<30)
Title I Accountability System

13-0760-050
CEDAR GROVE HIGH SCHOOL
CEDAR GROVE TOWNSHIP SCHOOL DISTRICT
CDS CODE :
DISTRICT :
SCHOOL :
ESEA Waiver - Annual Progress Targets
The tables represent the annual proficiency targets, established for this School under ESEA Waiver
Schools and Subgroups could meet expectations either by meeting the statewide proficiency rate of 90 percent, or reaching their individually
determined progress targets. The statewide proficiency rate will be increased to 95 percent in 2015.
Performance Targets - Language Arts Literacy
Subgroup# of Valid
Test Scores
Baseline
% Proficient
Yearly
Increment
2012-2013
Target (%P)
2011-2012
Target (%P)
2013-2014
Target (%P)
2014-2015
Target (%P)
2015-2016
Target (%P)
2016-2017
Target (%P)
Baseline
year
94.9 - 90 90 90 90 90Schoolwide 97 901011
95.2 - 90 90 90 90 90White 83 901011
- - - - - - -Black - -1011
- - - - - - -Hispanic - -1011
- - - - - - -American Indian - -1011
- - - - - - -Asian - -1011
- - - - - - -Two or More Races - -1011
- - - - - - -Students with Disabilities - -1011
- - - - - - -Limited English Proficiency - -1011
- - - - - - -Economically Disadvantaged - -1011
Performance Targets - Mathematics
Subgroup# of Valid
Test Scores
Baseline
% Proficient
Yearly
Increment
2012-2013
Target (%P)
2011-2012
Target (%P)
2013-2014
Target (%P)
2014-2015
Target (%P)
2015-2016
Target (%P)
2016-2017
Target (%P)
Baseline
year
90.7 - 90 90 90 90 90Schoolwide 97 901011
91.6 - 90 90 90 90 90White 83 901011
- - - - - - -Black - -1011
- - - - - - -Hispanic - -1011
- - - - - - -American Indian - -1011
- - - - - - -Asian - -1011
- - - - - - -Two or More Races - -1011
- - - - - - -Students with Disabilities - -1011
- - - - - - -Limited English Proficiency - -1011
- - - - - - -Economically Disadvantaged - -1011
11/5/2014
Only Includes full year students (Time In School < Year students are removed)
'-' Indicates too few students to determine (N<30)
Title I Accountability System

13-0760-058
MEMORIAL MIDDLE SCHOOL
CEDAR GROVE TOWNSHIP SCHOOL DISTRICT
CDS CODE :
DISTRICT :
SCHOOL :
ESEA Waiver - Annual Progress Targets
The tables represent the annual proficiency targets, established for this School under ESEA Waiver
Schools and Subgroups could meet expectations either by meeting the statewide proficiency rate of 90 percent, or reaching their individually
determined progress targets. The statewide proficiency rate will be increased to 95 percent in 2015.
Performance Targets - Language Arts Literacy
Subgroup# of Valid
Test Scores
Baseline
% Proficient
Yearly
Increment
2012-2013
Target (%P)
2011-2012
Target (%P)
2013-2014
Target (%P)
2014-2015
Target (%P)
2015-2016
Target (%P)
2016-2017
Target (%P)
Baseline
year
81.9 1.5 84.9 86.4 87.9 89.4 90Schoolwide 492 83.41011
81.8 1.5 84.8 86.3 87.8 89.3 90White 445 83.31011
- - - - - - -Black - -1011
- - - - - - -Hispanic - -1011
- - - - - - -American Indian - -1011
- - - - - - -Asian - -1011
- - - - - - -Two or More Races - -1011
39.4 5.1 49.6 54.7 59.8 64.9 70Students with Disabilities 66 44.51011
- - - - - - -Limited English Proficiency - -1011
- - - - - - -Economically Disadvantaged - -1011
Performance Targets - Mathematics
Subgroup# of Valid
Test Scores
Baseline
% Proficient
Yearly
Increment
2012-2013
Target (%P)
2011-2012
Target (%P)
2013-2014
Target (%P)
2014-2015
Target (%P)
2015-2016
Target (%P)
2016-2017
Target (%P)
Baseline
year
82.8 1.5 85.8 87.3 88.8 90 90Schoolwide 492 84.31011
82 1.5 85 86.5 88 89.5 90White 445 83.51011
- - - - - - -Black - -1011
- - - - - - -Hispanic - -1011
- - - - - - -American Indian - -1011
- - - - - - -Asian - -1011
- - - - - - -Two or More Races - -1011
33.4 5.6 44.6 50.2 55.8 61.4 67Students with Disabilities 66 391011
- - - - - - -Limited English Proficiency - -1011
- - - - - - -Economically Disadvantaged - -1011
11/5/2014
Only Includes full year students (Time In School < Year students are removed)
'-' Indicates too few students to determine (N<30)
Title I Accountability System

13-0760-060
NORTH END ELEMENTARY
CEDAR GROVE TOWNSHIP SCHOOL DISTRICT
CDS CODE :
DISTRICT :
SCHOOL :
ESEA Waiver - Annual Progress Targets
The tables represent the annual proficiency targets, established for this School under ESEA Waiver
Schools and Subgroups could meet expectations either by meeting the statewide proficiency rate of 90 percent, or reaching their individually
determined progress targets. The statewide proficiency rate will be increased to 95 percent in 2015.
Performance Targets - Language Arts Literacy
Subgroup# of Valid
Test Scores
Baseline
% Proficient
Yearly
Increment
2012-2013
Target (%P)
2011-2012
Target (%P)
2013-2014
Target (%P)
2014-2015
Target (%P)
2015-2016
Target (%P)
2016-2017
Target (%P)
Baseline
year
82 1.5 85 86.5 88 89.5 90Schoolwide 128 83.51011
81.6 1.5 84.6 86.1 87.6 89.1 90White 114 83.11011
- - - - - - -Black - -1011
- - - - - - -Hispanic - -1011
- - - - - - -American Indian - -1011
- - - - - - -Asian - -1011
- - - - - - -Two or More Races - -1011
- - - - - - -Students with Disabilities - -1011
- - - - - - -Limited English Proficiency - -1011
- - - - - - -Economically Disadvantaged - -1011
Performance Targets - Mathematics
Subgroup# of Valid
Test Scores
Baseline
% Proficient
Yearly
Increment
2012-2013
Target (%P)
2011-2012
Target (%P)
2013-2014
Target (%P)
2014-2015
Target (%P)
2015-2016
Target (%P)
2016-2017
Target (%P)
Baseline
year
88.3 1 90 90 90 90 90Schoolwide 128 89.31011
88.6 1 90 90 90 90 90White 114 89.61011
- - - - - - -Black - -1011
- - - - - - -Hispanic - -1011
- - - - - - -American Indian - -1011
- - - - - - -Asian - -1011
- - - - - - -Two or More Races - -1011
- - - - - - -Students with Disabilities - -1011
- - - - - - -Limited English Proficiency - -1011
- - - - - - -Economically Disadvantaged - -1011
11/5/2014
Only Includes full year students (Time In School < Year students are removed)
'-' Indicates too few students to determine (N<30)
Title I Accountability System

13-0760-090
SOUTH END ELEMENTARY SCHOOL
CEDAR GROVE TOWNSHIP SCHOOL DISTRICT
CDS CODE :
DISTRICT :
SCHOOL :
ESEA Waiver - Annual Progress Targets
The tables represent the annual proficiency targets, established for this School under ESEA Waiver
Schools and Subgroups could meet expectations either by meeting the statewide proficiency rate of 90 percent, or reaching their individually
determined progress targets. The statewide proficiency rate will be increased to 95 percent in 2015.
Performance Targets - Language Arts Literacy
Subgroup# of Valid
Test Scores
Baseline
% Proficient
Yearly
Increment
2012-2013
Target (%P)
2011-2012
Target (%P)
2013-2014
Target (%P)
2014-2015
Target (%P)
2015-2016
Target (%P)
2016-2017
Target (%P)
Baseline
year
70.3 2.5 75.3 77.8 80.3 82.8 85.3Schoolwide 128 72.81011
69.3 2.6 74.5 77.1 79.7 82.3 84.9White 114 71.91011
- - - - - - -Black - -1011
- - - - - - -Hispanic - -1011
- - - - - - -American Indian - -1011
- - - - - - -Asian - -1011
- - - - - - -Two or More Races - -1011
- - - - - - -Students with Disabilities - -1011
- - - - - - -Limited English Proficiency - -1011
- - - - - - -Economically Disadvantaged - -1011
Performance Targets - Mathematics
Subgroup# of Valid
Test Scores
Baseline
% Proficient
Yearly
Increment
2012-2013
Target (%P)
2011-2012
Target (%P)
2013-2014
Target (%P)
2014-2015
Target (%P)
2015-2016
Target (%P)
2016-2017
Target (%P)
Baseline
year
85.2 1.2 87.6 88.8 90 90 90Schoolwide 128 86.41011
85.1 1.3 87.7 89 90 90 90White 114 86.41011
- - - - - - -Black - -1011
- - - - - - -Hispanic - -1011
- - - - - - -American Indian - -1011
- - - - - - -Asian - -1011
- - - - - - -Two or More Races - -1011
- - - - - - -Students with Disabilities - -1011
- - - - - - -Limited English Proficiency - -1011
- - - - - - -Economically Disadvantaged - -1011
11/5/2014
Only Includes full year students (Time In School < Year students are removed)
'-' Indicates too few students to determine (N<30)
Title I Accountability System

13-1210-035
East Orange Campus High School
East Orange School District
CDS CODE :
DISTRICT :
SCHOOL :
ESEA Waiver - Annual Progress Targets
The tables represent the annual proficiency targets, established for this School under ESEA Waiver
Schools and Subgroups could meet expectations either by meeting the statewide proficiency rate of 90 percent, or reaching their individually
determined progress targets. The statewide proficiency rate will be increased to 95 percent in 2015.
Performance Targets - Language Arts Literacy
Subgroup# of Valid
Test Scores
Baseline
% Proficient
Yearly
Increment
2012-2013
Target (%P)
2011-2012
Target (%P)
2013-2014
Target (%P)
2014-2015
Target (%P)
2015-2016
Target (%P)
2016-2017
Target (%P)
Baseline
year
67.7 2.7 73.1 75.8 78.5 81.2 83.9Schoolwide 427 70.41011
- - - - - - -White - -1011
68.1 2.7 73.5 76.2 78.9 81.6 84.3Black 408 70.81011
63.3 3.1 66.4 69.5 72.6 75.7 78.8Hispanic 30 1112
- - - - - - -American Indian - -1011
- - - - - - -Asian - -1011
- - - - - - -Two or More Races - -1011
8.9 7.6 24.1 31.7 39.3 46.9 54.5Students with Disabilities 89 16.51011
- - - - - - -Limited English Proficiency - -1011
69.5 2.6 74.7 77.3 79.9 82.5 85.1Economically Disadvantaged 285 72.11011
Performance Targets - Mathematics
Subgroup# of Valid
Test Scores
Baseline
% Proficient
Yearly
Increment
2012-2013
Target (%P)
2011-2012
Target (%P)
2013-2014
Target (%P)
2014-2015
Target (%P)
2015-2016
Target (%P)
2016-2017
Target (%P)
Baseline
year
51.6 4 59.6 63.6 67.6 71.6 75.6Schoolwide 428 55.61011
- - - - - - -White - -1011
51.1 4.1 59.3 63.4 67.5 71.6 75.7Black 409 55.21011
36.6 5.3 41.9 47.2 52.5 57.8 63.1Hispanic 30 1112
- - - - - - -American Indian - -1011
- - - - - - -Asian - -1011
- - - - - - -Two or More Races - -1011
5.6 7.9 21.4 29.3 37.2 45.1 53Students with Disabilities 89 13.51011
- - - - - - -Limited English Proficiency - -1011
56.1 3.7 63.5 67.2 70.9 74.6 78.3Economically Disadvantaged 285 59.81011
11/5/2014
Only Includes full year students (Time In School < Year students are removed)
'-' Indicates too few students to determine (N<30)
Title I Accountability System

13-1210-050
Edward T. Bowser Sr. School of Excellence
East Orange School District
CDS CODE :
DISTRICT :
SCHOOL :
ESEA Waiver - Annual Progress Targets
The tables represent the annual proficiency targets, established for this School under ESEA Waiver
Schools and Subgroups could meet expectations either by meeting the statewide proficiency rate of 90 percent, or reaching their individually
determined progress targets. The statewide proficiency rate will be increased to 95 percent in 2015.
Performance Targets - Language Arts Literacy
Subgroup# of Valid
Test Scores
Baseline
% Proficient
Yearly
Increment
2012-2013
Target (%P)
2011-2012
Target (%P)
2013-2014
Target (%P)
2014-2015
Target (%P)
2015-2016
Target (%P)
2016-2017
Target (%P)
Baseline
year
51.8 4 59.8 63.8 67.8 71.8 75.8Schoolwide 276 55.81011
- - - - - - -White - -1011
48 4.3 56.6 60.9 65.2 69.5 73.8Black 221 52.31011
68.5 2.6 73.7 76.3 78.9 81.5 84.1Hispanic 54 71.11011
- - - - - - -American Indian - -1011
- - - - - - -Asian - -1011
- - - - - - -Two or More Races - -1011
24 6.3 36.6 42.9 49.2 55.5 61.8Students with Disabilities 50 30.31011
- - - - - - -Limited English Proficiency - -1011
53.5 3.9 61.3 65.2 69.1 73 76.9Economically Disadvantaged 241 57.41011
Performance Targets - Mathematics
Subgroup# of Valid
Test Scores
Baseline
% Proficient
Yearly
Increment
2012-2013
Target (%P)
2011-2012
Target (%P)
2013-2014
Target (%P)
2014-2015
Target (%P)
2015-2016
Target (%P)
2016-2017
Target (%P)
Baseline
year
82.3 1.5 85.3 86.8 88.3 89.8 90Schoolwide 276 83.81011
- - - - - - -White - -1011
80.1 1.7 83.5 85.2 86.9 88.6 90Black 221 81.81011
90.7 - 90 90 90 90 90Hispanic 54 901011
- - - - - - -American Indian - -1011
- - - - - - -Asian - -1011
- - - - - - -Two or More Races - -1011
48 4.3 56.6 60.9 65.2 69.5 73.8Students with Disabilities 50 52.31011
- - - - - - -Limited English Proficiency - -1011
84.3 1.3 86.9 88.2 89.5 90 90Economically Disadvantaged 241 85.61011
11/5/2014
Only Includes full year students (Time In School < Year students are removed)
'-' Indicates too few students to determine (N<30)
Title I Accountability System

13-1210-060
George Washington Carver Institute
East Orange School District
CDS CODE :
DISTRICT :
SCHOOL :
ESEA Waiver - Annual Progress Targets
The tables represent the annual proficiency targets, established for this School under ESEA Waiver
Schools and Subgroups could meet expectations either by meeting the statewide proficiency rate of 90 percent, or reaching their individually
determined progress targets. The statewide proficiency rate will be increased to 95 percent in 2015.
Performance Targets - Language Arts Literacy
Subgroup# of Valid
Test Scores
Baseline
% Proficient
Yearly
Increment
2012-2013
Target (%P)
2011-2012
Target (%P)
2013-2014
Target (%P)
2014-2015
Target (%P)
2015-2016
Target (%P)
2016-2017
Target (%P)
Baseline
year
46.5 4.5 55.5 60 64.5 69 73.5Schoolwide 142 511011
- - - - - - -White - -1011
47.1 4.4 55.9 60.3 64.7 69.1 73.5Black 138 51.51011
- - - - - - -Hispanic - -1011
- - - - - - -American Indian - -1011
- - - - - - -Asian - -1011
- - - - - - -Two or More Races - -1011
- - - - - - -Students with Disabilities - -1011
- - - - - - -Limited English Proficiency - -1011
45.1 4.6 54.3 58.9 63.5 68.1 72.7Economically Disadvantaged 122 49.71011
Performance Targets - Mathematics
Subgroup# of Valid
Test Scores
Baseline
% Proficient
Yearly
Increment
2012-2013
Target (%P)
2011-2012
Target (%P)
2013-2014
Target (%P)
2014-2015
Target (%P)
2015-2016
Target (%P)
2016-2017
Target (%P)
Baseline
year
78.9 1.8 82.5 84.3 86.1 87.9 89.7Schoolwide 142 80.71011
- - - - - - -White - -1011
78.3 1.8 81.9 83.7 85.5 87.3 89.1Black 138 80.11011
- - - - - - -Hispanic - -1011
- - - - - - -American Indian - -1011
- - - - - - -Asian - -1011
- - - - - - -Two or More Races - -1011
- - - - - - -Students with Disabilities - -1011
- - - - - - -Limited English Proficiency - -1011
77.9 1.9 81.7 83.6 85.5 87.4 89.3Economically Disadvantaged 122 79.81011
11/5/2014
Only Includes full year students (Time In School < Year students are removed)
'-' Indicates too few students to determine (N<30)
Title I Accountability System

13-1210-070
John L. Costley Middle School
East Orange School District
CDS CODE :
DISTRICT :
SCHOOL :
ESEA Waiver - Annual Progress Targets
The tables represent the annual proficiency targets, established for this School under ESEA Waiver
Schools and Subgroups could meet expectations either by meeting the statewide proficiency rate of 90 percent, or reaching their individually
determined progress targets. The statewide proficiency rate will be increased to 95 percent in 2015.
Performance Targets - Language Arts Literacy
Subgroup# of Valid
Test Scores
Baseline
% Proficient
Yearly
Increment
2012-2013
Target (%P)
2011-2012
Target (%P)
2013-2014
Target (%P)
2014-2015
Target (%P)
2015-2016
Target (%P)
2016-2017
Target (%P)
Baseline
year
26.2 6.2 38.6 44.8 51 57.2 63.4Schoolwide 386 32.41011
- - - - - - -White - -1011
25.5 6.2 37.9 44.1 50.3 56.5 62.7Black 368 31.71011
- - - - - - -Hispanic - -1011
- - - - - - -American Indian - -1011
- - - - - - -Asian - -1011
- - - - - - -Two or More Races - -1011
12.7 7.3 27.3 34.6 41.9 49.2 56.5Students with Disabilities 79 201011
- - - - - - -Limited English Proficiency - -1011
26.5 6.1 38.7 44.8 50.9 57 63.1Economically Disadvantaged 298 32.61011
Performance Targets - Mathematics
Subgroup# of Valid
Test Scores
Baseline
% Proficient
Yearly
Increment
2012-2013
Target (%P)
2011-2012
Target (%P)
2013-2014
Target (%P)
2014-2015
Target (%P)
2015-2016
Target (%P)
2016-2017
Target (%P)
Baseline
year
37.3 5.2 47.7 52.9 58.1 63.3 68.5Schoolwide 388 42.51011
- - - - - - -White - -1011
36.2 5.3 46.8 52.1 57.4 62.7 68Black 370 41.51011
- - - - - - -Hispanic - -1011
- - - - - - -American Indian - -1011
- - - - - - -Asian - -1011
- - - - - - -Two or More Races - -1011
30.4 5.8 42 47.8 53.6 59.4 65.2Students with Disabilities 79 36.21011
- - - - - - -Limited English Proficiency - -1011
40 5 50 55 60 65 70Economically Disadvantaged 298 451011
11/5/2014
Only Includes full year students (Time In School < Year students are removed)
'-' Indicates too few students to determine (N<30)
Title I Accountability System

13-1210-080
Langston Hughes Elementary School
East Orange School District
CDS CODE :
DISTRICT :
SCHOOL :
ESEA Waiver - Annual Progress Targets
The tables represent the annual proficiency targets, established for this School under ESEA Waiver
Schools and Subgroups could meet expectations either by meeting the statewide proficiency rate of 90 percent, or reaching their individually
determined progress targets. The statewide proficiency rate will be increased to 95 percent in 2015.
Performance Targets - Language Arts Literacy
Subgroup# of Valid
Test Scores
Baseline
% Proficient
Yearly
Increment
2012-2013
Target (%P)
2011-2012
Target (%P)
2013-2014
Target (%P)
2014-2015
Target (%P)
2015-2016
Target (%P)
2016-2017
Target (%P)
Baseline
year
48.8 4.3 57.4 61.7 66 70.3 74.6Schoolwide 170 53.11011
- - - - - - -White - -1011
48.8 4.3 57.4 61.7 66 70.3 74.6Black 168 53.11011
- - - - - - -Hispanic - -1011
- - - - - - -American Indian - -1011
- - - - - - -Asian - -1011
- - - - - - -Two or More Races - -1011
- - - - - - -Students with Disabilities - -1011
- - - - - - -Limited English Proficiency - -1011
46.6 4.5 55.6 60.1 64.6 69.1 73.6Economically Disadvantaged 146 51.11011
Performance Targets - Mathematics
Subgroup# of Valid
Test Scores
Baseline
% Proficient
Yearly
Increment
2012-2013
Target (%P)
2011-2012
Target (%P)
2013-2014
Target (%P)
2014-2015
Target (%P)
2015-2016
Target (%P)
2016-2017
Target (%P)
Baseline
year
74.7 2.1 78.9 81 83.1 85.2 87.3Schoolwide 170 76.81011
- - - - - - -White - -1011
75 2.1 79.2 81.3 83.4 85.5 87.6Black 168 77.11011
- - - - - - -Hispanic - -1011
- - - - - - -American Indian - -1011
- - - - - - -Asian - -1011
- - - - - - -Two or More Races - -1011
- - - - - - -Students with Disabilities - -1011
- - - - - - -Limited English Proficiency - -1011
71.9 2.4 76.7 79.1 81.5 83.9 86.3Economically Disadvantaged 146 74.31011
11/5/2014
Only Includes full year students (Time In School < Year students are removed)
'-' Indicates too few students to determine (N<30)
Title I Accountability System
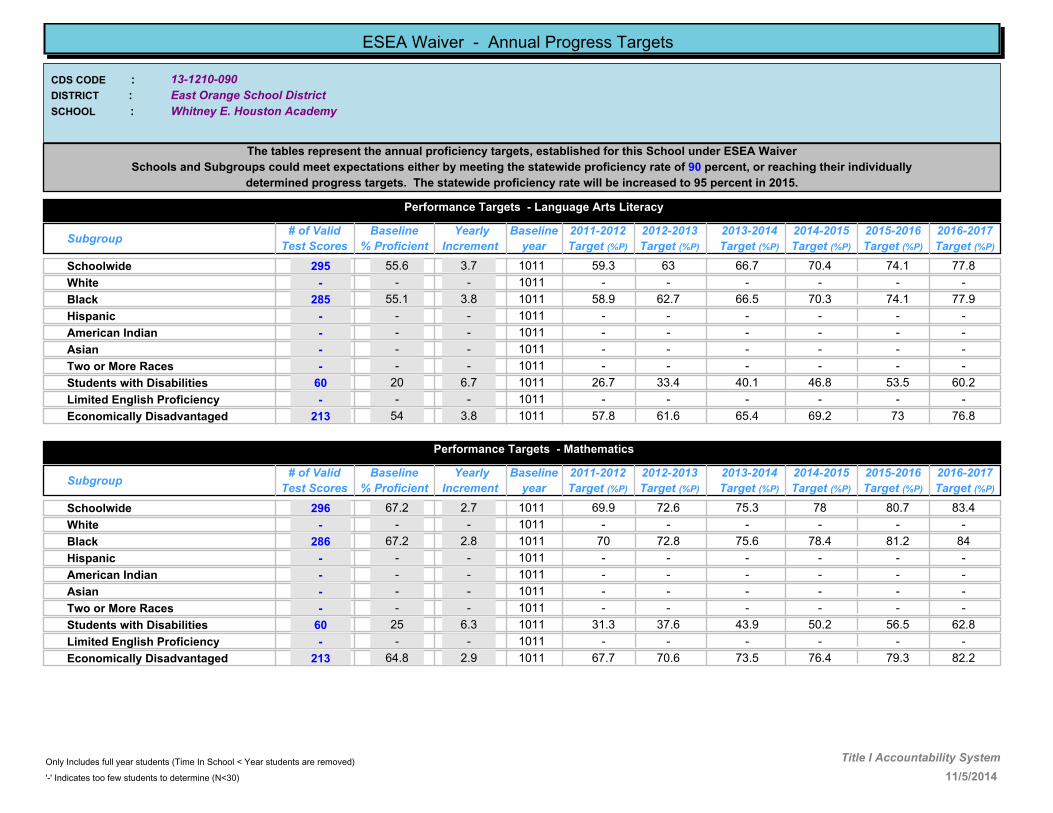
13-1210-090
Whitney E. Houston Academy
East Orange School District
CDS CODE :
DISTRICT :
SCHOOL :
ESEA Waiver - Annual Progress Targets
The tables represent the annual proficiency targets, established for this School under ESEA Waiver
Schools and Subgroups could meet expectations either by meeting the statewide proficiency rate of 90 percent, or reaching their individually
determined progress targets. The statewide proficiency rate will be increased to 95 percent in 2015.
Performance Targets - Language Arts Literacy
Subgroup# of Valid
Test Scores
Baseline
% Proficient
Yearly
Increment
2012-2013
Target (%P)
2011-2012
Target (%P)
2013-2014
Target (%P)
2014-2015
Target (%P)
2015-2016
Target (%P)
2016-2017
Target (%P)
Baseline
year
55.6 3.7 63 66.7 70.4 74.1 77.8Schoolwide 295 59.31011
- - - - - - -White - -1011
55.1 3.8 62.7 66.5 70.3 74.1 77.9Black 285 58.91011
- - - - - - -Hispanic - -1011
- - - - - - -American Indian - -1011
- - - - - - -Asian - -1011
- - - - - - -Two or More Races - -1011
20 6.7 33.4 40.1 46.8 53.5 60.2Students with Disabilities 60 26.71011
- - - - - - -Limited English Proficiency - -1011
54 3.8 61.6 65.4 69.2 73 76.8Economically Disadvantaged 213 57.81011
Performance Targets - Mathematics
Subgroup# of Valid
Test Scores
Baseline
% Proficient
Yearly
Increment
2012-2013
Target (%P)
2011-2012
Target (%P)
2013-2014
Target (%P)
2014-2015
Target (%P)
2015-2016
Target (%P)
2016-2017
Target (%P)
Baseline
year
67.2 2.7 72.6 75.3 78 80.7 83.4Schoolwide 296 69.91011
- - - - - - -White - -1011
67.2 2.8 72.8 75.6 78.4 81.2 84Black 286 701011
- - - - - - -Hispanic - -1011
- - - - - - -American Indian - -1011
- - - - - - -Asian - -1011
- - - - - - -Two or More Races - -1011
25 6.3 37.6 43.9 50.2 56.5 62.8Students with Disabilities 60 31.31011
- - - - - - -Limited English Proficiency - -1011
64.8 2.9 70.6 73.5 76.4 79.3 82.2Economically Disadvantaged 213 67.71011
11/5/2014
Only Includes full year students (Time In School < Year students are removed)
'-' Indicates too few students to determine (N<30)
Title I Accountability System
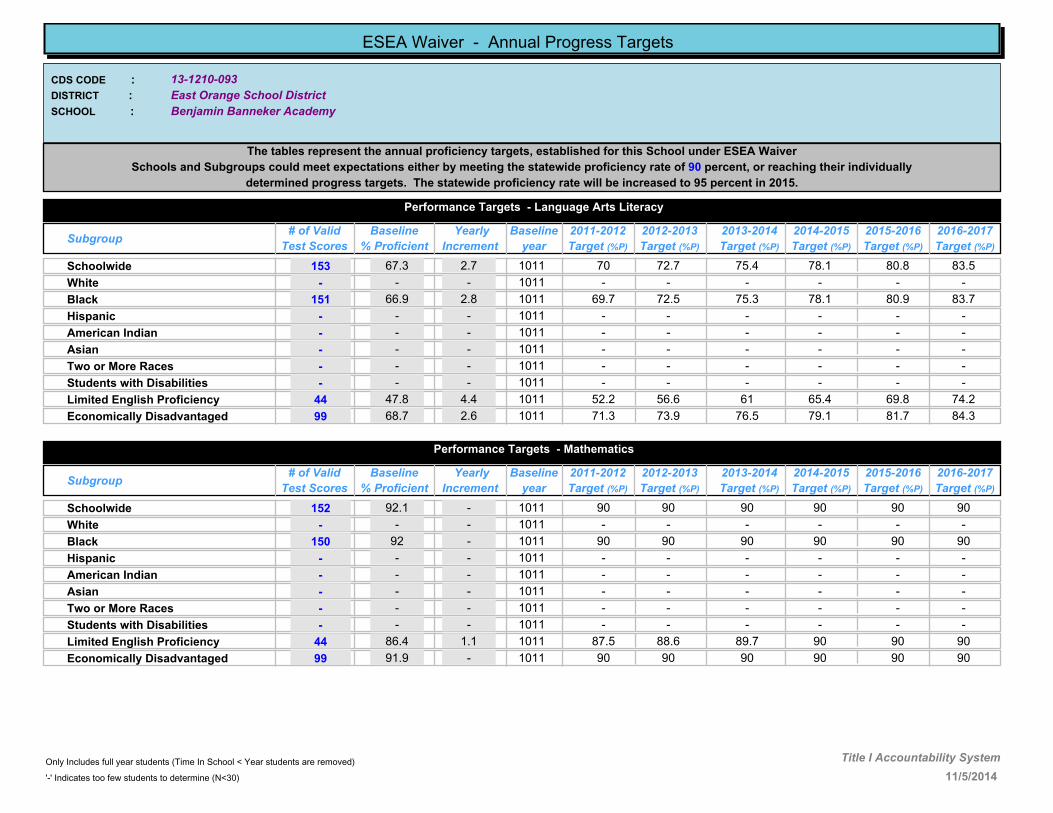
13-1210-093
Benjamin Banneker Academy
East Orange School District
CDS CODE :
DISTRICT :
SCHOOL :
ESEA Waiver - Annual Progress Targets
The tables represent the annual proficiency targets, established for this School under ESEA Waiver
Schools and Subgroups could meet expectations either by meeting the statewide proficiency rate of 90 percent, or reaching their individually
determined progress targets. The statewide proficiency rate will be increased to 95 percent in 2015.
Performance Targets - Language Arts Literacy
Subgroup# of Valid
Test Scores
Baseline
% Proficient
Yearly
Increment
2012-2013
Target (%P)
2011-2012
Target (%P)
2013-2014
Target (%P)
2014-2015
Target (%P)
2015-2016
Target (%P)
2016-2017
Target (%P)
Baseline
year
67.3 2.7 72.7 75.4 78.1 80.8 83.5Schoolwide 153 701011
- - - - - - -White - -1011
66.9 2.8 72.5 75.3 78.1 80.9 83.7Black 151 69.71011
- - - - - - -Hispanic - -1011
- - - - - - -American Indian - -1011
- - - - - - -Asian - -1011
- - - - - - -Two or More Races - -1011
- - - - - - -Students with Disabilities - -1011
47.8 4.4 56.6 61 65.4 69.8 74.2Limited English Proficiency 44 52.21011
68.7 2.6 73.9 76.5 79.1 81.7 84.3Economically Disadvantaged 99 71.31011
Performance Targets - Mathematics
Subgroup# of Valid
Test Scores
Baseline
% Proficient
Yearly
Increment
2012-2013
Target (%P)
2011-2012
Target (%P)
2013-2014
Target (%P)
2014-2015
Target (%P)
2015-2016
Target (%P)
2016-2017
Target (%P)
Baseline
year
92.1 - 90 90 90 90 90Schoolwide 152 901011
- - - - - - -White - -1011
92 - 90 90 90 90 90Black 150 901011
- - - - - - -Hispanic - -1011
- - - - - - -American Indian - -1011
- - - - - - -Asian - -1011
- - - - - - -Two or More Races - -1011
- - - - - - -Students with Disabilities - -1011
86.4 1.1 88.6 89.7 90 90 90Limited English Proficiency 44 87.51011
91.9 - 90 90 90 90 90Economically Disadvantaged 99 901011
11/5/2014
Only Includes full year students (Time In School < Year students are removed)
'-' Indicates too few students to determine (N<30)
Title I Accountability System

13-1210-095
Patrick F. Healy Middle School
East Orange School District
CDS CODE :
DISTRICT :
SCHOOL :
ESEA Waiver - Annual Progress Targets
The tables represent the annual proficiency targets, established for this School under ESEA Waiver
Schools and Subgroups could meet expectations either by meeting the statewide proficiency rate of 90 percent, or reaching their individually
determined progress targets. The statewide proficiency rate will be increased to 95 percent in 2015.
Performance Targets - Language Arts Literacy
Subgroup# of Valid
Test Scores
Baseline
% Proficient
Yearly
Increment
2012-2013
Target (%P)
2011-2012
Target (%P)
2013-2014
Target (%P)
2014-2015
Target (%P)
2015-2016
Target (%P)
2016-2017
Target (%P)
Baseline
year
26.3 6.1 38.5 44.6 50.7 56.8 62.9Schoolwide 383 32.41011
- - - - - - -White - -1011
26 6.2 38.4 44.6 50.8 57 63.2Black 364 32.21011
- - - - - - -Hispanic - -1011
- - - - - - -American Indian - -1011
- - - - - - -Asian - -1011
- - - - - - -Two or More Races - -1011
2.9 8.1 19.1 27.2 35.3 43.4 51.5Students with Disabilities 70 111011
- - - - - - -Limited English Proficiency - -1011
26.9 6.1 39.1 45.2 51.3 57.4 63.5Economically Disadvantaged 316 331011
Performance Targets - Mathematics
Subgroup# of Valid
Test Scores
Baseline
% Proficient
Yearly
Increment
2012-2013
Target (%P)
2011-2012
Target (%P)
2013-2014
Target (%P)
2014-2015
Target (%P)
2015-2016
Target (%P)
2016-2017
Target (%P)
Baseline
year
40.6 5 50.6 55.6 60.6 65.6 70.6Schoolwide 386 45.61011
- - - - - - -White - -1011
40.9 4.9 50.7 55.6 60.5 65.4 70.3Black 367 45.81011
- - - - - - -Hispanic - -1011
- - - - - - -American Indian - -1011
- - - - - - -Asian - -1011
- - - - - - -Two or More Races - -1011
11.4 7.4 26.2 33.6 41 48.4 55.8Students with Disabilities 70 18.81011
- - - - - - -Limited English Proficiency - -1011
42.3 4.8 51.9 56.7 61.5 66.3 71.1Economically Disadvantaged 317 47.11011
11/5/2014
Only Includes full year students (Time In School < Year students are removed)
'-' Indicates too few students to determine (N<30)
Title I Accountability System

13-1210-100
Mildred Barry Garvin Elementary
East Orange School District
CDS CODE :
DISTRICT :
SCHOOL :
ESEA Waiver - Annual Progress Targets
The tables represent the annual proficiency targets, established for this School under ESEA Waiver
Schools and Subgroups could meet expectations either by meeting the statewide proficiency rate of 90 percent, or reaching their individually
determined progress targets. The statewide proficiency rate will be increased to 95 percent in 2015.
Performance Targets - Language Arts Literacy
Subgroup# of Valid
Test Scores
Baseline
% Proficient
Yearly
Increment
2012-2013
Target (%P)
2011-2012
Target (%P)
2013-2014
Target (%P)
2014-2015
Target (%P)
2015-2016
Target (%P)
2016-2017
Target (%P)
Baseline
year
41.5 4.9 51.3 56.2 61.1 66 70.9Schoolwide 106 46.41011
- - - - - - -White - -1011
41.4 4.9 51.2 56.1 61 65.9 70.8Black 99 46.31011
- - - - - - -Hispanic - -1011
- - - - - - -American Indian - -1011
- - - - - - -Asian - -1011
- - - - - - -Two or More Races - -1011
- - - - - - -Students with Disabilities - -1011
- - - - - - -Limited English Proficiency - -1011
40.7 5 50.7 55.7 60.7 65.7 70.7Economically Disadvantaged 91 45.71011
Performance Targets - Mathematics
Subgroup# of Valid
Test Scores
Baseline
% Proficient
Yearly
Increment
2012-2013
Target (%P)
2011-2012
Target (%P)
2013-2014
Target (%P)
2014-2015
Target (%P)
2015-2016
Target (%P)
2016-2017
Target (%P)
Baseline
year
84 1.3 86.6 87.9 89.2 90 90Schoolwide 106 85.31011
- - - - - - -White - -1011
83.8 1.4 86.6 88 89.4 90 90Black 99 85.21011
- - - - - - -Hispanic - -1011
- - - - - - -American Indian - -1011
- - - - - - -Asian - -1011
- - - - - - -Two or More Races - -1011
- - - - - - -Students with Disabilities - -1011
- - - - - - -Limited English Proficiency - -1011
83.5 1.4 86.3 87.7 89.1 90 90Economically Disadvantaged 91 84.91011
11/5/2014
Only Includes full year students (Time In School < Year students are removed)
'-' Indicates too few students to determine (N<30)
Title I Accountability System
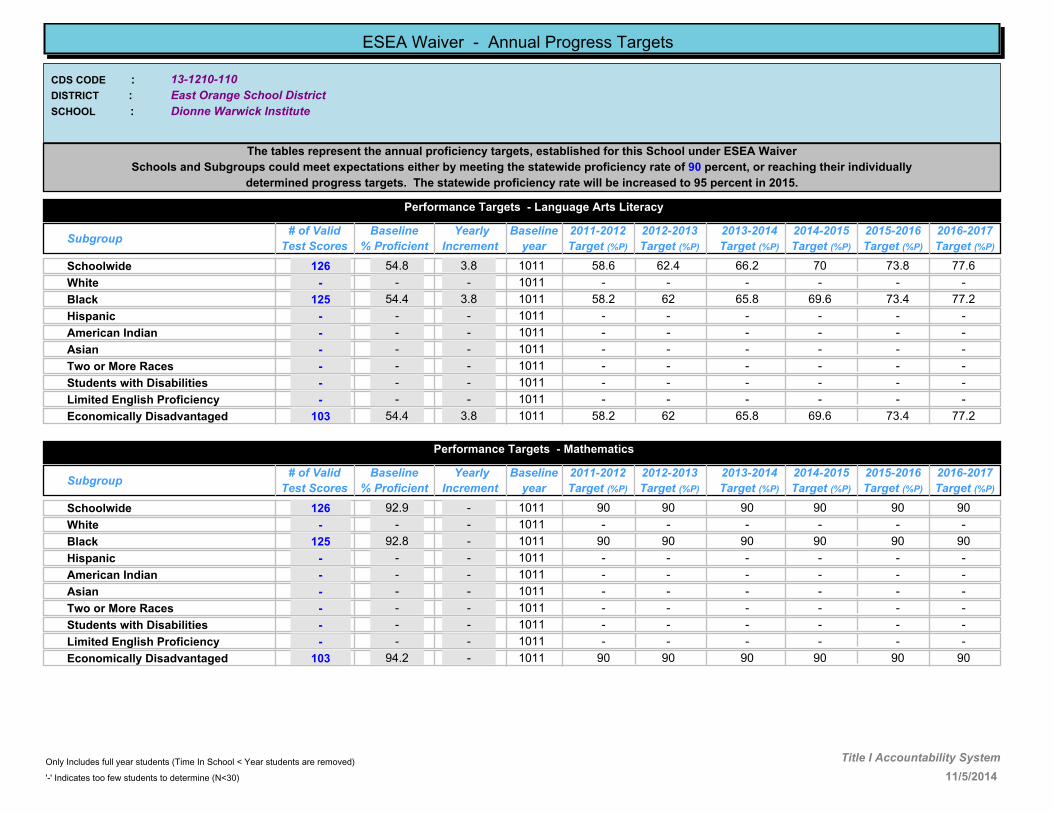
13-1210-110
Dionne Warwick Institute
East Orange School District
CDS CODE :
DISTRICT :
SCHOOL :
ESEA Waiver - Annual Progress Targets
The tables represent the annual proficiency targets, established for this School under ESEA Waiver
Schools and Subgroups could meet expectations either by meeting the statewide proficiency rate of 90 percent, or reaching their individually
determined progress targets. The statewide proficiency rate will be increased to 95 percent in 2015.
Performance Targets - Language Arts Literacy
Subgroup# of Valid
Test Scores
Baseline
% Proficient
Yearly
Increment
2012-2013
Target (%P)
2011-2012
Target (%P)
2013-2014
Target (%P)
2014-2015
Target (%P)
2015-2016
Target (%P)
2016-2017
Target (%P)
Baseline
year
54.8 3.8 62.4 66.2 70 73.8 77.6Schoolwide 126 58.61011
- - - - - - -White - -1011
54.4 3.8 62 65.8 69.6 73.4 77.2Black 125 58.21011
- - - - - - -Hispanic - -1011
- - - - - - -American Indian - -1011
- - - - - - -Asian - -1011
- - - - - - -Two or More Races - -1011
- - - - - - -Students with Disabilities - -1011
- - - - - - -Limited English Proficiency - -1011
54.4 3.8 62 65.8 69.6 73.4 77.2Economically Disadvantaged 103 58.21011
Performance Targets - Mathematics
Subgroup# of Valid
Test Scores
Baseline
% Proficient
Yearly
Increment
2012-2013
Target (%P)
2011-2012
Target (%P)
2013-2014
Target (%P)
2014-2015
Target (%P)
2015-2016
Target (%P)
2016-2017
Target (%P)
Baseline
year
92.9 - 90 90 90 90 90Schoolwide 126 901011
- - - - - - -White - -1011
92.8 - 90 90 90 90 90Black 125 901011
- - - - - - -Hispanic - -1011
- - - - - - -American Indian - -1011
- - - - - - -Asian - -1011
- - - - - - -Two or More Races - -1011
- - - - - - -Students with Disabilities - -1011
- - - - - - -Limited English Proficiency - -1011
94.2 - 90 90 90 90 90Economically Disadvantaged 103 901011
11/5/2014
Only Includes full year students (Time In School < Year students are removed)
'-' Indicates too few students to determine (N<30)
Title I Accountability System
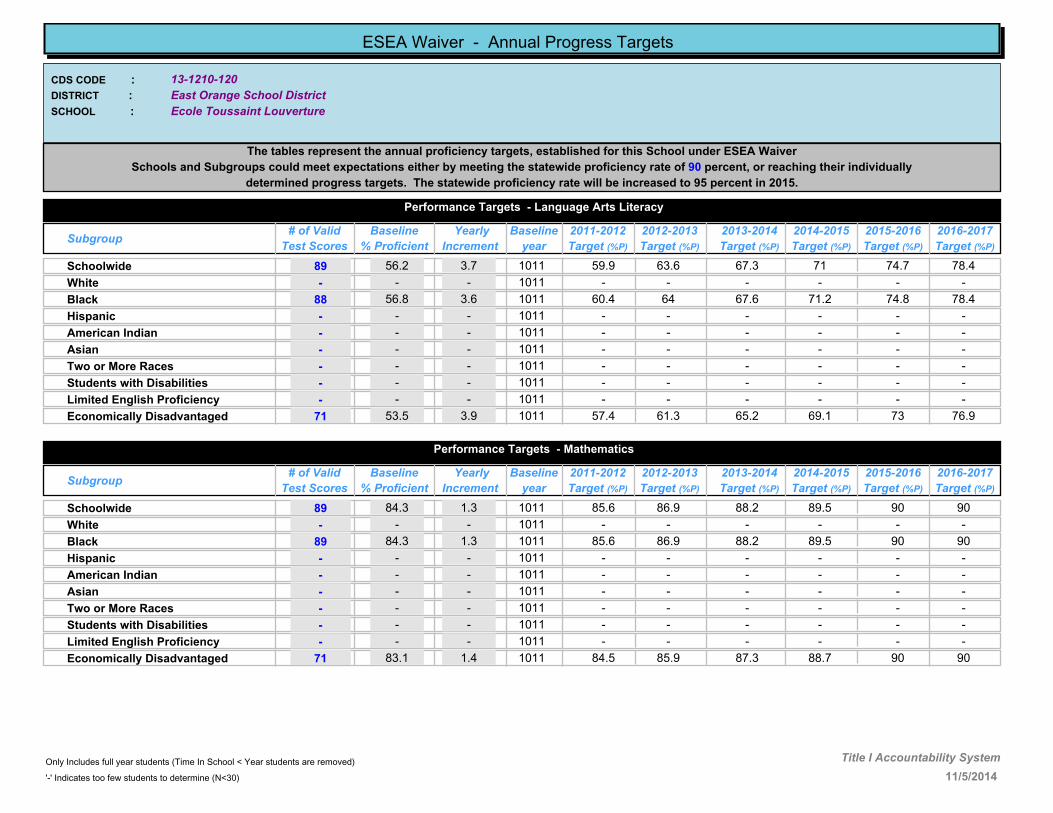
13-1210-120
Ecole Toussaint Louverture
East Orange School District
CDS CODE :
DISTRICT :
SCHOOL :
ESEA Waiver - Annual Progress Targets
The tables represent the annual proficiency targets, established for this School under ESEA Waiver
Schools and Subgroups could meet expectations either by meeting the statewide proficiency rate of 90 percent, or reaching their individually
determined progress targets. The statewide proficiency rate will be increased to 95 percent in 2015.
Performance Targets - Language Arts Literacy
Subgroup# of Valid
Test Scores
Baseline
% Proficient
Yearly
Increment
2012-2013
Target (%P)
2011-2012
Target (%P)
2013-2014
Target (%P)
2014-2015
Target (%P)
2015-2016
Target (%P)
2016-2017
Target (%P)
Baseline
year
56.2 3.7 63.6 67.3 71 74.7 78.4Schoolwide 89 59.91011
- - - - - - -White - -1011
56.8 3.6 64 67.6 71.2 74.8 78.4Black 88 60.41011
- - - - - - -Hispanic - -1011
- - - - - - -American Indian - -1011
- - - - - - -Asian - -1011
- - - - - - -Two or More Races - -1011
- - - - - - -Students with Disabilities - -1011
- - - - - - -Limited English Proficiency - -1011
53.5 3.9 61.3 65.2 69.1 73 76.9Economically Disadvantaged 71 57.41011
Performance Targets - Mathematics
Subgroup# of Valid
Test Scores
Baseline
% Proficient
Yearly
Increment
2012-2013
Target (%P)
2011-2012
Target (%P)
2013-2014
Target (%P)
2014-2015
Target (%P)
2015-2016
Target (%P)
2016-2017
Target (%P)
Baseline
year
84.3 1.3 86.9 88.2 89.5 90 90Schoolwide 89 85.61011
- - - - - - -White - -1011
84.3 1.3 86.9 88.2 89.5 90 90Black 89 85.61011
- - - - - - -Hispanic - -1011
- - - - - - -American Indian - -1011
- - - - - - -Asian - -1011
- - - - - - -Two or More Races - -1011
- - - - - - -Students with Disabilities - -1011
- - - - - - -Limited English Proficiency - -1011
83.1 1.4 85.9 87.3 88.7 90 90Economically Disadvantaged 71 84.51011
11/5/2014
Only Includes full year students (Time In School < Year students are removed)
'-' Indicates too few students to determine (N<30)
Title I Accountability System

13-1210-130
Gordon Parks Academy
East Orange School District
CDS CODE :
DISTRICT :
SCHOOL :
ESEA Waiver - Annual Progress Targets
The tables represent the annual proficiency targets, established for this School under ESEA Waiver
Schools and Subgroups could meet expectations either by meeting the statewide proficiency rate of 90 percent, or reaching their individually
determined progress targets. The statewide proficiency rate will be increased to 95 percent in 2015.
Performance Targets - Language Arts Literacy
Subgroup# of Valid
Test Scores
Baseline
% Proficient
Yearly
Increment
2012-2013
Target (%P)
2011-2012
Target (%P)
2013-2014
Target (%P)
2014-2015
Target (%P)
2015-2016
Target (%P)
2016-2017
Target (%P)
Baseline
year
25 6.3 37.6 43.9 50.2 56.5 62.8Schoolwide 112 31.31011
- - - - - - -White - -1011
25.2 6.2 37.6 43.8 50 56.2 62.4Black 111 31.41011
- - - - - - -Hispanic - -1011
- - - - - - -American Indian - -1011
- - - - - - -Asian - -1011
- - - - - - -Two or More Races - -1011
- - - - - - -Students with Disabilities - -1011
- - - - - - -Limited English Proficiency - -1011
22 6.5 35 41.5 48 54.5 61Economically Disadvantaged 91 28.51011
Performance Targets - Mathematics
Subgroup# of Valid
Test Scores
Baseline
% Proficient
Yearly
Increment
2012-2013
Target (%P)
2011-2012
Target (%P)
2013-2014
Target (%P)
2014-2015
Target (%P)
2015-2016
Target (%P)
2016-2017
Target (%P)
Baseline
year
52.7 4 60.7 64.7 68.7 72.7 76.7Schoolwide 112 56.71011
- - - - - - -White - -1011
52.2 4 60.2 64.2 68.2 72.2 76.2Black 111 56.21011
- - - - - - -Hispanic - -1011
- - - - - - -American Indian - -1011
- - - - - - -Asian - -1011
- - - - - - -Two or More Races - -1011
- - - - - - -Students with Disabilities - -1011
- - - - - - -Limited English Proficiency - -1011
51.7 4 59.7 63.7 67.7 71.7 75.7Economically Disadvantaged 91 55.71011
11/5/2014
Only Includes full year students (Time In School < Year students are removed)
'-' Indicates too few students to determine (N<30)
Title I Accountability System

13-1210-135
Sojourner Truth Middle School
East Orange School District
CDS CODE :
DISTRICT :
SCHOOL :
ESEA Waiver - Annual Progress Targets
The tables represent the annual proficiency targets, established for this School under ESEA Waiver
Schools and Subgroups could meet expectations either by meeting the statewide proficiency rate of 90 percent, or reaching their individually
determined progress targets. The statewide proficiency rate will be increased to 95 percent in 2015.
Performance Targets - Language Arts Literacy
Subgroup# of Valid
Test Scores
Baseline
% Proficient
Yearly
Increment
2012-2013
Target (%P)
2011-2012
Target (%P)
2013-2014
Target (%P)
2014-2015
Target (%P)
2015-2016
Target (%P)
2016-2017
Target (%P)
Baseline
year
50.1 4.2 58.5 62.7 66.9 71.1 75.3Schoolwide 435 54.31011
- - - - - - -White - -1011
50.4 4.1 58.6 62.7 66.8 70.9 75Black 413 54.51011
- - - - - - -Hispanic - -1011
- - - - - - -American Indian - -1011
- - - - - - -Asian - -1011
- - - - - - -Two or More Races - -1011
23 6.4 35.8 42.2 48.6 55 61.4Students with Disabilities 74 29.41011
- - - - - - -Limited English Proficiency - -1011
50 4.2 58.4 62.6 66.8 71 75.2Economically Disadvantaged 328 54.21011
Performance Targets - Mathematics
Subgroup# of Valid
Test Scores
Baseline
% Proficient
Yearly
Increment
2012-2013
Target (%P)
2011-2012
Target (%P)
2013-2014
Target (%P)
2014-2015
Target (%P)
2015-2016
Target (%P)
2016-2017
Target (%P)
Baseline
year
34.1 5.5 45.1 50.6 56.1 61.6 67.1Schoolwide 434 39.61011
- - - - - - -White - -1011
33.2 5.6 44.4 50 55.6 61.2 66.8Black 412 38.81011
- - - - - - -Hispanic - -1011
- - - - - - -American Indian - -1011
- - - - - - -Asian - -1011
- - - - - - -Two or More Races - -1011
2.7 8.1 18.9 27 35.1 43.2 51.3Students with Disabilities 74 10.81011
- - - - - - -Limited English Proficiency - -1011
36.3 5.3 46.9 52.2 57.5 62.8 68.1Economically Disadvantaged 328 41.61011
11/5/2014
Only Includes full year students (Time In School < Year students are removed)
'-' Indicates too few students to determine (N<30)
Title I Accountability System
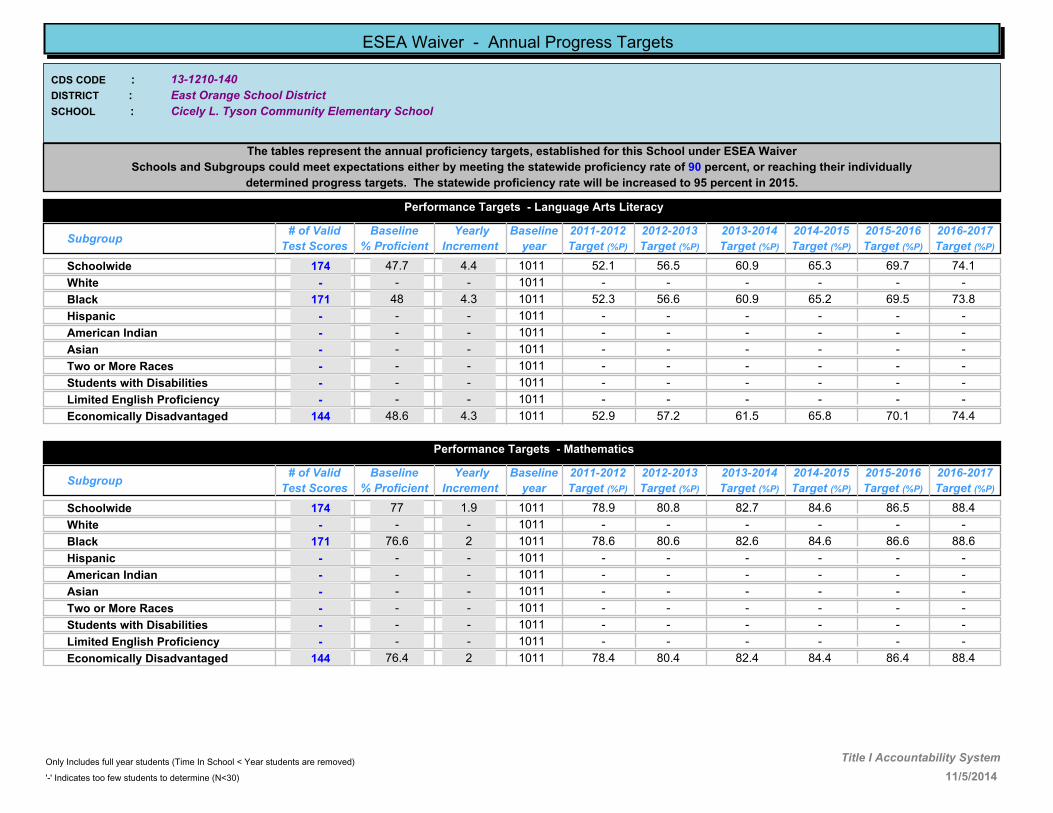
13-1210-140
Cicely L. Tyson Community Elementary School
East Orange School District
CDS CODE :
DISTRICT :
SCHOOL :
ESEA Waiver - Annual Progress Targets
The tables represent the annual proficiency targets, established for this School under ESEA Waiver
Schools and Subgroups could meet expectations either by meeting the statewide proficiency rate of 90 percent, or reaching their individually
determined progress targets. The statewide proficiency rate will be increased to 95 percent in 2015.
Performance Targets - Language Arts Literacy
Subgroup# of Valid
Test Scores
Baseline
% Proficient
Yearly
Increment
2012-2013
Target (%P)
2011-2012
Target (%P)
2013-2014
Target (%P)
2014-2015
Target (%P)
2015-2016
Target (%P)
2016-2017
Target (%P)
Baseline
year
47.7 4.4 56.5 60.9 65.3 69.7 74.1Schoolwide 174 52.11011
- - - - - - -White - -1011
48 4.3 56.6 60.9 65.2 69.5 73.8Black 171 52.31011
- - - - - - -Hispanic - -1011
- - - - - - -American Indian - -1011
- - - - - - -Asian - -1011
- - - - - - -Two or More Races - -1011
- - - - - - -Students with Disabilities - -1011
- - - - - - -Limited English Proficiency - -1011
48.6 4.3 57.2 61.5 65.8 70.1 74.4Economically Disadvantaged 144 52.91011
Performance Targets - Mathematics
Subgroup# of Valid
Test Scores
Baseline
% Proficient
Yearly
Increment
2012-2013
Target (%P)
2011-2012
Target (%P)
2013-2014
Target (%P)
2014-2015
Target (%P)
2015-2016
Target (%P)
2016-2017
Target (%P)
Baseline
year
77 1.9 80.8 82.7 84.6 86.5 88.4Schoolwide 174 78.91011
- - - - - - -White - -1011
76.6 2 80.6 82.6 84.6 86.6 88.6Black 171 78.61011
- - - - - - -Hispanic - -1011
- - - - - - -American Indian - -1011
- - - - - - -Asian - -1011
- - - - - - -Two or More Races - -1011
- - - - - - -Students with Disabilities - -1011
- - - - - - -Limited English Proficiency - -1011
76.4 2 80.4 82.4 84.4 86.4 88.4Economically Disadvantaged 144 78.41011
11/5/2014
Only Includes full year students (Time In School < Year students are removed)
'-' Indicates too few students to determine (N<30)
Title I Accountability System

13-1210-150
Cicely L. Tyson Community Middle/High School
East Orange School District
CDS CODE :
DISTRICT :
SCHOOL :
ESEA Waiver - Annual Progress Targets
The tables represent the annual proficiency targets, established for this School under ESEA Waiver
Schools and Subgroups could meet expectations either by meeting the statewide proficiency rate of 90 percent, or reaching their individually
determined progress targets. The statewide proficiency rate will be increased to 95 percent in 2015.
Performance Targets - Language Arts Literacy
Subgroup# of Valid
Test Scores
Baseline
% Proficient
Yearly
Increment
2012-2013
Target (%P)
2011-2012
Target (%P)
2013-2014
Target (%P)
2014-2015
Target (%P)
2015-2016
Target (%P)
2016-2017
Target (%P)
Baseline
year
60.8 3.3 67.4 70.7 74 77.3 80.6Schoolwide 342 64.11011
- - - - - - -White - -1011
60.8 3.3 67.4 70.7 74 77.3 80.6Black 332 64.11011
- - - - - - -Hispanic - -1011
- - - - - - -American Indian - -1011
- - - - - - -Asian - -1011
- - - - - - -Two or More Races - -1011
26.6 6.1 38.8 44.9 51 57.1 63.2Students with Disabilities 45 32.71011
- - - - - - -Limited English Proficiency - -1011
56.2 3.7 63.6 67.3 71 74.7 78.4Economically Disadvantaged 217 59.91011
Performance Targets - Mathematics
Subgroup# of Valid
Test Scores
Baseline
% Proficient
Yearly
Increment
2012-2013
Target (%P)
2011-2012
Target (%P)
2013-2014
Target (%P)
2014-2015
Target (%P)
2015-2016
Target (%P)
2016-2017
Target (%P)
Baseline
year
46.8 4.4 55.6 60 64.4 68.8 73.2Schoolwide 340 51.21011
- - - - - - -White - -1011
46.6 4.5 55.6 60.1 64.6 69.1 73.6Black 330 51.11011
- - - - - - -Hispanic - -1011
- - - - - - -American Indian - -1011
- - - - - - -Asian - -1011
- - - - - - -Two or More Races - -1011
20.4 6.6 33.6 40.2 46.8 53.4 60Students with Disabilities 44 271011
- - - - - - -Limited English Proficiency - -1011
43.5 4.7 52.9 57.6 62.3 67 71.7Economically Disadvantaged 216 48.21011
11/5/2014
Only Includes full year students (Time In School < Year students are removed)
'-' Indicates too few students to determine (N<30)
Title I Accountability System
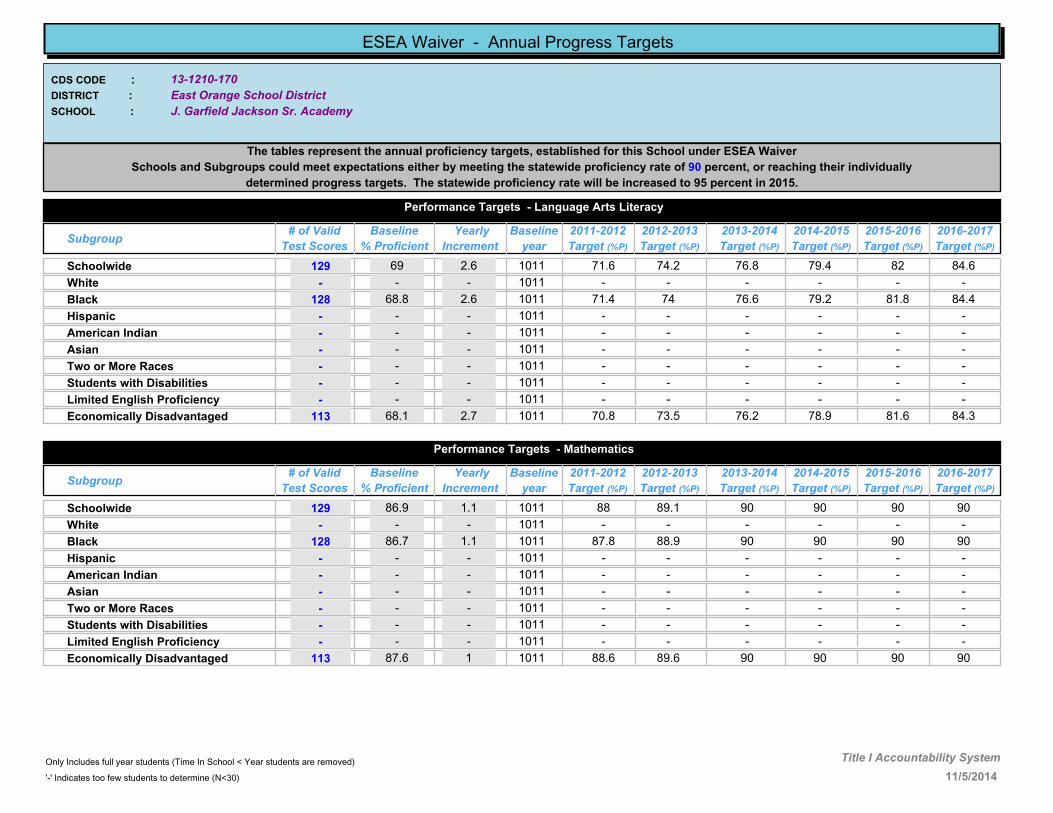
13-1210-170
J. Garfield Jackson Sr. Academy
East Orange School District
CDS CODE :
DISTRICT :
SCHOOL :
ESEA Waiver - Annual Progress Targets
The tables represent the annual proficiency targets, established for this School under ESEA Waiver
Schools and Subgroups could meet expectations either by meeting the statewide proficiency rate of 90 percent, or reaching their individually
determined progress targets. The statewide proficiency rate will be increased to 95 percent in 2015.
Performance Targets - Language Arts Literacy
Subgroup# of Valid
Test Scores
Baseline
% Proficient
Yearly
Increment
2012-2013
Target (%P)
2011-2012
Target (%P)
2013-2014
Target (%P)
2014-2015
Target (%P)
2015-2016
Target (%P)
2016-2017
Target (%P)
Baseline
year
69 2.6 74.2 76.8 79.4 82 84.6Schoolwide 129 71.61011
- - - - - - -White - -1011
68.8 2.6 74 76.6 79.2 81.8 84.4Black 128 71.41011
- - - - - - -Hispanic - -1011
- - - - - - -American Indian - -1011
- - - - - - -Asian - -1011
- - - - - - -Two or More Races - -1011
- - - - - - -Students with Disabilities - -1011
- - - - - - -Limited English Proficiency - -1011
68.1 2.7 73.5 76.2 78.9 81.6 84.3Economically Disadvantaged 113 70.81011
Performance Targets - Mathematics
Subgroup# of Valid
Test Scores
Baseline
% Proficient
Yearly
Increment
2012-2013
Target (%P)
2011-2012
Target (%P)
2013-2014
Target (%P)
2014-2015
Target (%P)
2015-2016
Target (%P)
2016-2017
Target (%P)
Baseline
year
86.9 1.1 89.1 90 90 90 90Schoolwide 129 881011
- - - - - - -White - -1011
86.7 1.1 88.9 90 90 90 90Black 128 87.81011
- - - - - - -Hispanic - -1011
- - - - - - -American Indian - -1011
- - - - - - -Asian - -1011
- - - - - - -Two or More Races - -1011
- - - - - - -Students with Disabilities - -1011
- - - - - - -Limited English Proficiency - -1011
87.6 1 89.6 90 90 90 90Economically Disadvantaged 113 88.61011
11/5/2014
Only Includes full year students (Time In School < Year students are removed)
'-' Indicates too few students to determine (N<30)
Title I Accountability System
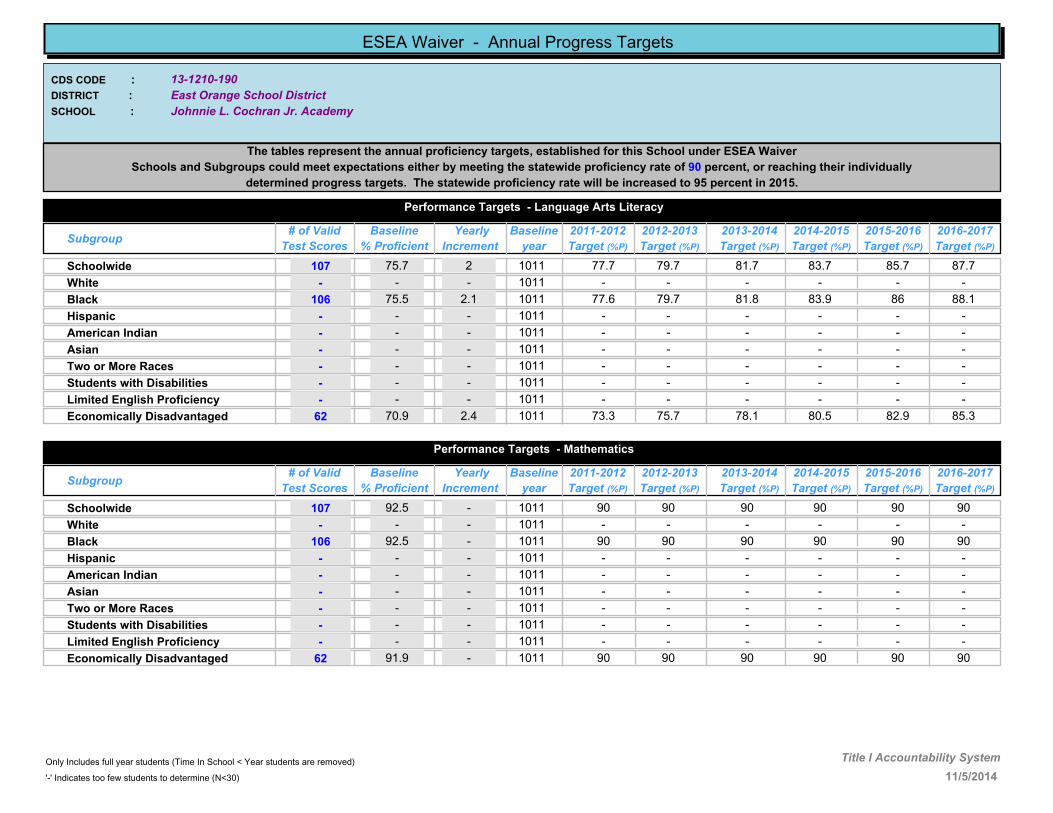
13-1210-190
Johnnie L. Cochran Jr. Academy
East Orange School District
CDS CODE :
DISTRICT :
SCHOOL :
ESEA Waiver - Annual Progress Targets
The tables represent the annual proficiency targets, established for this School under ESEA Waiver
Schools and Subgroups could meet expectations either by meeting the statewide proficiency rate of 90 percent, or reaching their individually
determined progress targets. The statewide proficiency rate will be increased to 95 percent in 2015.
Performance Targets - Language Arts Literacy
Subgroup# of Valid
Test Scores
Baseline
% Proficient
Yearly
Increment
2012-2013
Target (%P)
2011-2012
Target (%P)
2013-2014
Target (%P)
2014-2015
Target (%P)
2015-2016
Target (%P)
2016-2017
Target (%P)
Baseline
year
75.7 2 79.7 81.7 83.7 85.7 87.7Schoolwide 107 77.71011
- - - - - - -White - -1011
75.5 2.1 79.7 81.8 83.9 86 88.1Black 106 77.61011
- - - - - - -Hispanic - -1011
- - - - - - -American Indian - -1011
- - - - - - -Asian - -1011
- - - - - - -Two or More Races - -1011
- - - - - - -Students with Disabilities - -1011
- - - - - - -Limited English Proficiency - -1011
70.9 2.4 75.7 78.1 80.5 82.9 85.3Economically Disadvantaged 62 73.31011
Performance Targets - Mathematics
Subgroup# of Valid
Test Scores
Baseline
% Proficient
Yearly
Increment
2012-2013
Target (%P)
2011-2012
Target (%P)
2013-2014
Target (%P)
2014-2015
Target (%P)
2015-2016
Target (%P)
2016-2017
Target (%P)
Baseline
year
92.5 - 90 90 90 90 90Schoolwide 107 901011
- - - - - - -White - -1011
92.5 - 90 90 90 90 90Black 106 901011
- - - - - - -Hispanic - -1011
- - - - - - -American Indian - -1011
- - - - - - -Asian - -1011
- - - - - - -Two or More Races - -1011
- - - - - - -Students with Disabilities - -1011
- - - - - - -Limited English Proficiency - -1011
91.9 - 90 90 90 90 90Economically Disadvantaged 62 901011
11/5/2014
Only Includes full year students (Time In School < Year students are removed)
'-' Indicates too few students to determine (N<30)
Title I Accountability System

13-1390-020
Bloomfield Tech
Essex County Vocational Technical Schools
CDS CODE :
DISTRICT :
SCHOOL :
ESEA Waiver - Annual Progress Targets
The tables represent the annual proficiency targets, established for this School under ESEA Waiver
Schools and Subgroups could meet expectations either by meeting the statewide proficiency rate of 90 percent, or reaching their individually
determined progress targets. The statewide proficiency rate will be increased to 95 percent in 2015.
Performance Targets - Language Arts Literacy
Subgroup# of Valid
Test Scores
Baseline
% Proficient
Yearly
Increment
2012-2013
Target (%P)
2011-2012
Target (%P)
2013-2014
Target (%P)
2014-2015
Target (%P)
2015-2016
Target (%P)
2016-2017
Target (%P)
Baseline
year
100 - 90 90 90 90 90Schoolwide 103 901011
- - - - - - -White - -1011
100 - 90 90 90 90 90Black 41 901011
100 - 90 90 90 90 90Hispanic 57 901011
- - - - - - -American Indian - -1011
- - - - - - -Asian - -1011
- - - - - - -Two or More Races - -1011
- - - - - - -Students with Disabilities - -1011
- - - - - - -Limited English Proficiency - -1011
100 - 90 90 90 90 90Economically Disadvantaged 93 901011
Performance Targets - Mathematics
Subgroup# of Valid
Test Scores
Baseline
% Proficient
Yearly
Increment
2012-2013
Target (%P)
2011-2012
Target (%P)
2013-2014
Target (%P)
2014-2015
Target (%P)
2015-2016
Target (%P)
2016-2017
Target (%P)
Baseline
year
94.2 - 90 90 90 90 90Schoolwide 103 901011
- - - - - - -White - -1011
92.6 - 90 90 90 90 90Black 41 901011
94.7 - 90 90 90 90 90Hispanic 57 901011
- - - - - - -American Indian - -1011
- - - - - - -Asian - -1011
- - - - - - -Two or More Races - -1011
- - - - - - -Students with Disabilities - -1011
- - - - - - -Limited English Proficiency - -1011
93.6 - 90 90 90 90 90Economically Disadvantaged 93 901011
11/5/2014
Only Includes full year students (Time In School < Year students are removed)
'-' Indicates too few students to determine (N<30)
Title I Accountability System

13-1390-050
North 13th St Tech
Essex County Vocational Technical Schools
CDS CODE :
DISTRICT :
SCHOOL :
ESEA Waiver - Annual Progress Targets
The tables represent the annual proficiency targets, established for this School under ESEA Waiver
Schools and Subgroups could meet expectations either by meeting the statewide proficiency rate of 90 percent, or reaching their individually
determined progress targets. The statewide proficiency rate will be increased to 95 percent in 2015.
Performance Targets - Language Arts Literacy
Subgroup# of Valid
Test Scores
Baseline
% Proficient
Yearly
Increment
2012-2013
Target (%P)
2011-2012
Target (%P)
2013-2014
Target (%P)
2014-2015
Target (%P)
2015-2016
Target (%P)
2016-2017
Target (%P)
Baseline
year
96.4 - 90 90 90 90 90Schoolwide 138 901011
- - - - - - -White - -1011
95.7 - 90 90 90 90 90Black 70 901011
97.1 - 90 90 90 90 90Hispanic 68 901011
- - - - - - -American Indian - -1011
- - - - - - -Asian - -1011
- - - - - - -Two or More Races - -1011
90 - 90 90 90 90 90Students with Disabilities 30 901011
- - - - - - -Limited English Proficiency - -1011
96.7 - 90 90 90 90 90Economically Disadvantaged 121 901011
Performance Targets - Mathematics
Subgroup# of Valid
Test Scores
Baseline
% Proficient
Yearly
Increment
2012-2013
Target (%P)
2011-2012
Target (%P)
2013-2014
Target (%P)
2014-2015
Target (%P)
2015-2016
Target (%P)
2016-2017
Target (%P)
Baseline
year
79.7 1.7 83.1 84.8 86.5 88.2 89.9Schoolwide 138 81.41011
- - - - - - -White - -1011
77.2 1.9 81 82.9 84.8 86.7 88.6Black 70 79.11011
82.4 1.5 85.4 86.9 88.4 89.9 90Hispanic 68 83.91011
- - - - - - -American Indian - -1011
- - - - - - -Asian - -1011
- - - - - - -Two or More Races - -1011
53.3 3.9 61.1 65 68.9 72.8 76.7Students with Disabilities 30 57.21011
- - - - - - -Limited English Proficiency - -1011
79.4 1.7 82.8 84.5 86.2 87.9 89.6Economically Disadvantaged 121 81.11011
11/5/2014
Only Includes full year students (Time In School < Year students are removed)
'-' Indicates too few students to determine (N<30)
Title I Accountability System

13-1390-070
Newark Tech
Essex County Vocational Technical Schools
CDS CODE :
DISTRICT :
SCHOOL :
ESEA Waiver - Annual Progress Targets
The tables represent the annual proficiency targets, established for this School under ESEA Waiver
Schools and Subgroups could meet expectations either by meeting the statewide proficiency rate of 90 percent, or reaching their individually
determined progress targets. The statewide proficiency rate will be increased to 95 percent in 2015.
Performance Targets - Language Arts Literacy
Subgroup# of Valid
Test Scores
Baseline
% Proficient
Yearly
Increment
2012-2013
Target (%P)
2011-2012
Target (%P)
2013-2014
Target (%P)
2014-2015
Target (%P)
2015-2016
Target (%P)
2016-2017
Target (%P)
Baseline
year
99.4 - 90 90 90 90 90Schoolwide 169 901011
- - - - - - -White - -1011
99.1 - 90 90 90 90 90Black 113 901011
100 - 90 90 90 90 90Hispanic 54 901011
- - - - - - -American Indian - -1011
- - - - - - -Asian - -1011
- - - - - - -Two or More Races - -1011
- - - - - - -Students with Disabilities - -1011
94.7 - 90 90 90 90 90Limited English Proficiency 38 1112
100 - 90 90 90 90 90Economically Disadvantaged 144 901011
Performance Targets - Mathematics
Subgroup# of Valid
Test Scores
Baseline
% Proficient
Yearly
Increment
2012-2013
Target (%P)
2011-2012
Target (%P)
2013-2014
Target (%P)
2014-2015
Target (%P)
2015-2016
Target (%P)
2016-2017
Target (%P)
Baseline
year
97 - 90 90 90 90 90Schoolwide 169 901011
- - - - - - -White - -1011
96.4 - 90 90 90 90 90Black 113 901011
98.1 - 90 90 90 90 90Hispanic 54 901011
- - - - - - -American Indian - -1011
- - - - - - -Asian - -1011
- - - - - - -Two or More Races - -1011
- - - - - - -Students with Disabilities - -1011
86.9 1.1 88 89.1 90.2 91.3 92.4Limited English Proficiency 38 1112
97.3 - 90 90 90 90 90Economically Disadvantaged 144 901011
11/5/2014
Only Includes full year students (Time In School < Year students are removed)
'-' Indicates too few students to determine (N<30)
Title I Accountability System

13-1390-080
West Caldwell Tech
Essex County Vocational Technical Schools
CDS CODE :
DISTRICT :
SCHOOL :
ESEA Waiver - Annual Progress Targets
The tables represent the annual proficiency targets, established for this School under ESEA Waiver
Schools and Subgroups could meet expectations either by meeting the statewide proficiency rate of 90 percent, or reaching their individually
determined progress targets. The statewide proficiency rate will be increased to 95 percent in 2015.
Performance Targets - Language Arts Literacy
Subgroup# of Valid
Test Scores
Baseline
% Proficient
Yearly
Increment
2012-2013
Target (%P)
2011-2012
Target (%P)
2013-2014
Target (%P)
2014-2015
Target (%P)
2015-2016
Target (%P)
2016-2017
Target (%P)
Baseline
year
78.7 1.8 82.3 84.1 85.9 87.7 89.5Schoolwide 47 80.51011
- - - - - - -White - -1011
- - - - - - -Black - -1011
- - - - - - -Hispanic - -1011
- - - - - - -American Indian - -1011
- - - - - - -Asian - -1011
- - - - - - -Two or More Races - -1011
68.7 2.6 73.9 76.5 79.1 81.7 84.3Students with Disabilities 32 71.31011
- - - - - - -Limited English Proficiency - -1011
73 2.3 77.6 79.9 82.2 84.5 86.8Economically Disadvantaged 37 75.31011
Performance Targets - Mathematics
Subgroup# of Valid
Test Scores
Baseline
% Proficient
Yearly
Increment
2012-2013
Target (%P)
2011-2012
Target (%P)
2013-2014
Target (%P)
2014-2015
Target (%P)
2015-2016
Target (%P)
2016-2017
Target (%P)
Baseline
year
68 2.7 73.4 76.1 78.8 81.5 84.2Schoolwide 47 70.71011
- - - - - - -White - -1011
- - - - - - -Black - -1011
- - - - - - -Hispanic - -1011
- - - - - - -American Indian - -1011
- - - - - - -Asian - -1011
- - - - - - -Two or More Races - -1011
56.3 3.7 63.7 67.4 71.1 74.8 78.5Students with Disabilities 32 601011
- - - - - - -Limited English Proficiency - -1011
59.4 3.4 66.2 69.6 73 76.4 79.8Economically Disadvantaged 37 62.81011
11/5/2014
Only Includes full year students (Time In School < Year students are removed)
'-' Indicates too few students to determine (N<30)
Title I Accountability System

13-1400-050
Essex Fells Elementary School
ESSEX FELLS SCHOOL DISTRICT
CDS CODE :
DISTRICT :
SCHOOL :
ESEA Waiver - Annual Progress Targets
The tables represent the annual proficiency targets, established for this School under ESEA Waiver
Schools and Subgroups could meet expectations either by meeting the statewide proficiency rate of 90 percent, or reaching their individually
determined progress targets. The statewide proficiency rate will be increased to 95 percent in 2015.
Performance Targets - Language Arts Literacy
Subgroup# of Valid
Test Scores
Baseline
% Proficient
Yearly
Increment
2012-2013
Target (%P)
2011-2012
Target (%P)
2013-2014
Target (%P)
2014-2015
Target (%P)
2015-2016
Target (%P)
2016-2017
Target (%P)
Baseline
year
87.4 1.1 89.6 90 90 90 90Schoolwide 127 88.51011
87.1 1.1 89.3 90 90 90 90White 124 88.21011
- - - - - - -Black - -1011
- - - - - - -Hispanic - -1011
- - - - - - -American Indian - -1011
- - - - - - -Asian - -1011
- - - - - - -Two or More Races - -1011
- - - - - - -Students with Disabilities - -1011
- - - - - - -Limited English Proficiency - -1011
- - - - - - -Economically Disadvantaged - -1011
Performance Targets - Mathematics
Subgroup# of Valid
Test Scores
Baseline
% Proficient
Yearly
Increment
2012-2013
Target (%P)
2011-2012
Target (%P)
2013-2014
Target (%P)
2014-2015
Target (%P)
2015-2016
Target (%P)
2016-2017
Target (%P)
Baseline
year
93.7 - 90 90 90 90 90Schoolwide 127 901011
93.5 - 90 90 90 90 90White 124 901011
- - - - - - -Black - -1011
- - - - - - -Hispanic - -1011
- - - - - - -American Indian - -1011
- - - - - - -Asian - -1011
- - - - - - -Two or More Races - -1011
- - - - - - -Students with Disabilities - -1011
- - - - - - -Limited English Proficiency - -1011
- - - - - - -Economically Disadvantaged - -1011
11/5/2014
Only Includes full year students (Time In School < Year students are removed)
'-' Indicates too few students to determine (N<30)
Title I Accountability System
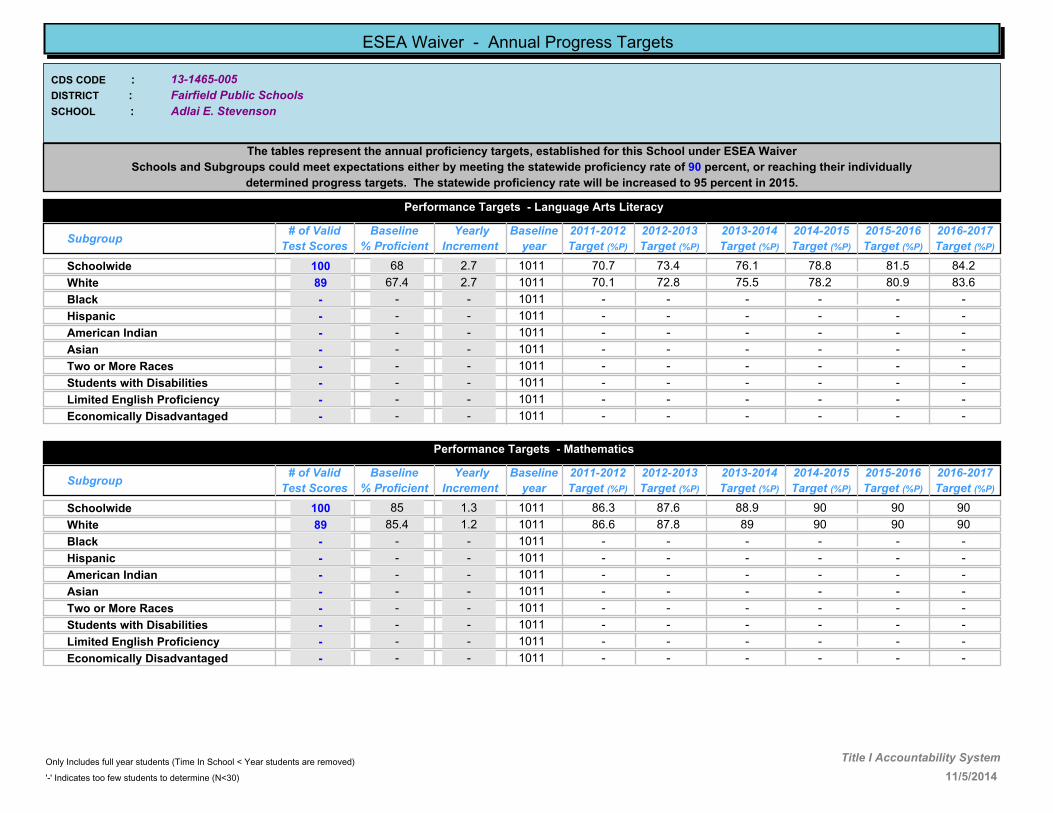
13-1465-005
Adlai E. Stevenson
Fairfield Public Schools
CDS CODE :
DISTRICT :
SCHOOL :
ESEA Waiver - Annual Progress Targets
The tables represent the annual proficiency targets, established for this School under ESEA Waiver
Schools and Subgroups could meet expectations either by meeting the statewide proficiency rate of 90 percent, or reaching their individually
determined progress targets. The statewide proficiency rate will be increased to 95 percent in 2015.
Performance Targets - Language Arts Literacy
Subgroup# of Valid
Test Scores
Baseline
% Proficient
Yearly
Increment
2012-2013
Target (%P)
2011-2012
Target (%P)
2013-2014
Target (%P)
2014-2015
Target (%P)
2015-2016
Target (%P)
2016-2017
Target (%P)
Baseline
year
68 2.7 73.4 76.1 78.8 81.5 84.2Schoolwide 100 70.71011
67.4 2.7 72.8 75.5 78.2 80.9 83.6White 89 70.11011
- - - - - - -Black - -1011
- - - - - - -Hispanic - -1011
- - - - - - -American Indian - -1011
- - - - - - -Asian - -1011
- - - - - - -Two or More Races - -1011
- - - - - - -Students with Disabilities - -1011
- - - - - - -Limited English Proficiency - -1011
- - - - - - -Economically Disadvantaged - -1011
Performance Targets - Mathematics
Subgroup# of Valid
Test Scores
Baseline
% Proficient
Yearly
Increment
2012-2013
Target (%P)
2011-2012
Target (%P)
2013-2014
Target (%P)
2014-2015
Target (%P)
2015-2016
Target (%P)
2016-2017
Target (%P)
Baseline
year
85 1.3 87.6 88.9 90 90 90Schoolwide 100 86.31011
85.4 1.2 87.8 89 90 90 90White 89 86.61011
- - - - - - -Black - -1011
- - - - - - -Hispanic - -1011
- - - - - - -American Indian - -1011
- - - - - - -Asian - -1011
- - - - - - -Two or More Races - -1011
- - - - - - -Students with Disabilities - -1011
- - - - - - -Limited English Proficiency - -1011
- - - - - - -Economically Disadvantaged - -1011
11/5/2014
Only Includes full year students (Time In School < Year students are removed)
'-' Indicates too few students to determine (N<30)
Title I Accountability System
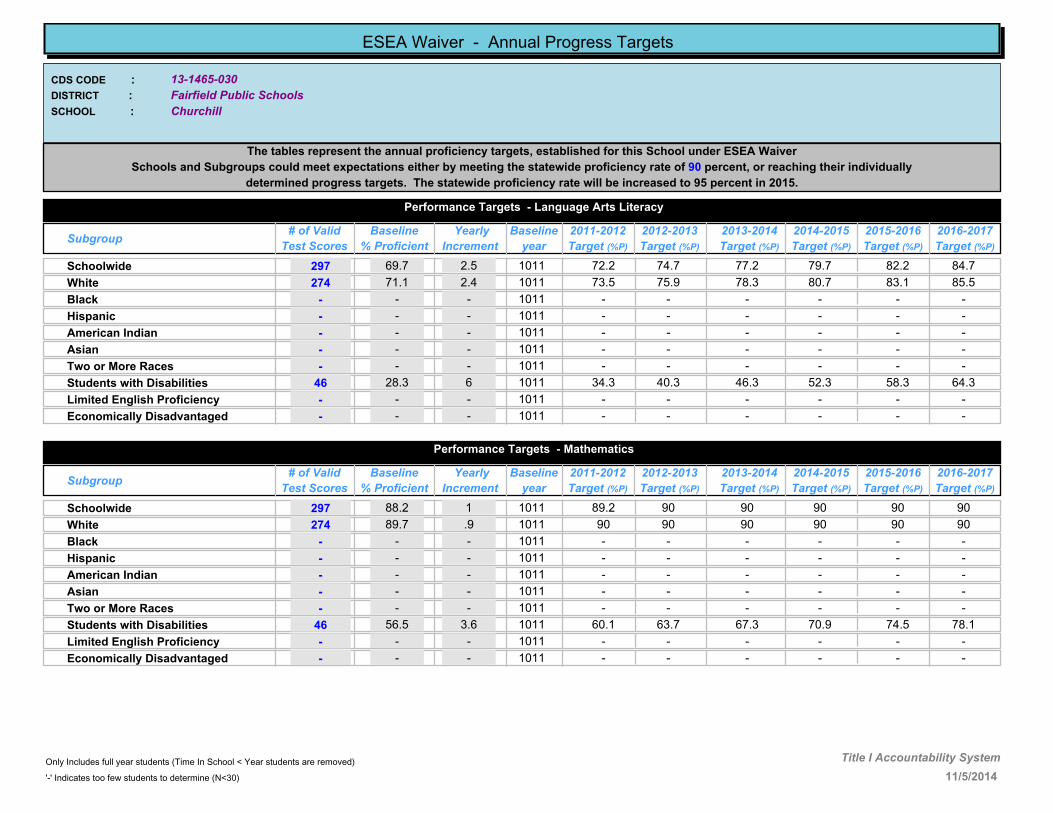
13-1465-030
Churchill
Fairfield Public Schools
CDS CODE :
DISTRICT :
SCHOOL :
ESEA Waiver - Annual Progress Targets
The tables represent the annual proficiency targets, established for this School under ESEA Waiver
Schools and Subgroups could meet expectations either by meeting the statewide proficiency rate of 90 percent, or reaching their individually
determined progress targets. The statewide proficiency rate will be increased to 95 percent in 2015.
Performance Targets - Language Arts Literacy
Subgroup# of Valid
Test Scores
Baseline
% Proficient
Yearly
Increment
2012-2013
Target (%P)
2011-2012
Target (%P)
2013-2014
Target (%P)
2014-2015
Target (%P)
2015-2016
Target (%P)
2016-2017
Target (%P)
Baseline
year
69.7 2.5 74.7 77.2 79.7 82.2 84.7Schoolwide 297 72.21011
71.1 2.4 75.9 78.3 80.7 83.1 85.5White 274 73.51011
- - - - - - -Black - -1011
- - - - - - -Hispanic - -1011
- - - - - - -American Indian - -1011
- - - - - - -Asian - -1011
- - - - - - -Two or More Races - -1011
28.3 6 40.3 46.3 52.3 58.3 64.3Students with Disabilities 46 34.31011
- - - - - - -Limited English Proficiency - -1011
- - - - - - -Economically Disadvantaged - -1011
Performance Targets - Mathematics
Subgroup# of Valid
Test Scores
Baseline
% Proficient
Yearly
Increment
2012-2013
Target (%P)
2011-2012
Target (%P)
2013-2014
Target (%P)
2014-2015
Target (%P)
2015-2016
Target (%P)
2016-2017
Target (%P)
Baseline
year
88.2 1 90 90 90 90 90Schoolwide 297 89.21011
89.7 .9 90 90 90 90 90White 274 901011
- - - - - - -Black - -1011
- - - - - - -Hispanic - -1011
- - - - - - -American Indian - -1011
- - - - - - -Asian - -1011
- - - - - - -Two or More Races - -1011
56.5 3.6 63.7 67.3 70.9 74.5 78.1Students with Disabilities 46 60.11011
- - - - - - -Limited English Proficiency - -1011
- - - - - - -Economically Disadvantaged - -1011
11/5/2014
Only Includes full year students (Time In School < Year students are removed)
'-' Indicates too few students to determine (N<30)
Title I Accountability System

13-1750-050
Glen Ridge High School
Glen Ridge Public Schools
CDS CODE :
DISTRICT :
SCHOOL :
ESEA Waiver - Annual Progress Targets
The tables represent the annual proficiency targets, established for this School under ESEA Waiver
Schools and Subgroups could meet expectations either by meeting the statewide proficiency rate of 90 percent, or reaching their individually
determined progress targets. The statewide proficiency rate will be increased to 95 percent in 2015.
Performance Targets - Language Arts Literacy
Subgroup# of Valid
Test Scores
Baseline
% Proficient
Yearly
Increment
2012-2013
Target (%P)
2011-2012
Target (%P)
2013-2014
Target (%P)
2014-2015
Target (%P)
2015-2016
Target (%P)
2016-2017
Target (%P)
Baseline
year
91.4 - 90 90 90 90 90Schoolwide 395 901011
92 - 90 90 90 90 90White 340 901011
- - - - - - -Black - -1011
- - - - - - -Hispanic - -1011
- - - - - - -American Indian - -1011
- - - - - - -Asian - -1011
- - - - - - -Two or More Races - -1011
53 3.9 60.8 64.7 68.6 72.5 76.4Students with Disabilities 49 56.91011
- - - - - - -Limited English Proficiency - -1011
- - - - - - -Economically Disadvantaged - -1011
Performance Targets - Mathematics
Subgroup# of Valid
Test Scores
Baseline
% Proficient
Yearly
Increment
2012-2013
Target (%P)
2011-2012
Target (%P)
2013-2014
Target (%P)
2014-2015
Target (%P)
2015-2016
Target (%P)
2016-2017
Target (%P)
Baseline
year
90.4 - 90 90 90 90 90Schoolwide 394 901011
91.4 - 90 90 90 90 90White 339 901011
- - - - - - -Black - -1011
- - - - - - -Hispanic - -1011
- - - - - - -American Indian - -1011
- - - - - - -Asian - -1011
- - - - - - -Two or More Races - -1011
50.1 4.2 58.5 62.7 66.9 71.1 75.3Students with Disabilities 48 54.31011
- - - - - - -Limited English Proficiency - -1011
- - - - - - -Economically Disadvantaged - -1011
11/5/2014
Only Includes full year students (Time In School < Year students are removed)
'-' Indicates too few students to determine (N<30)
Title I Accountability System
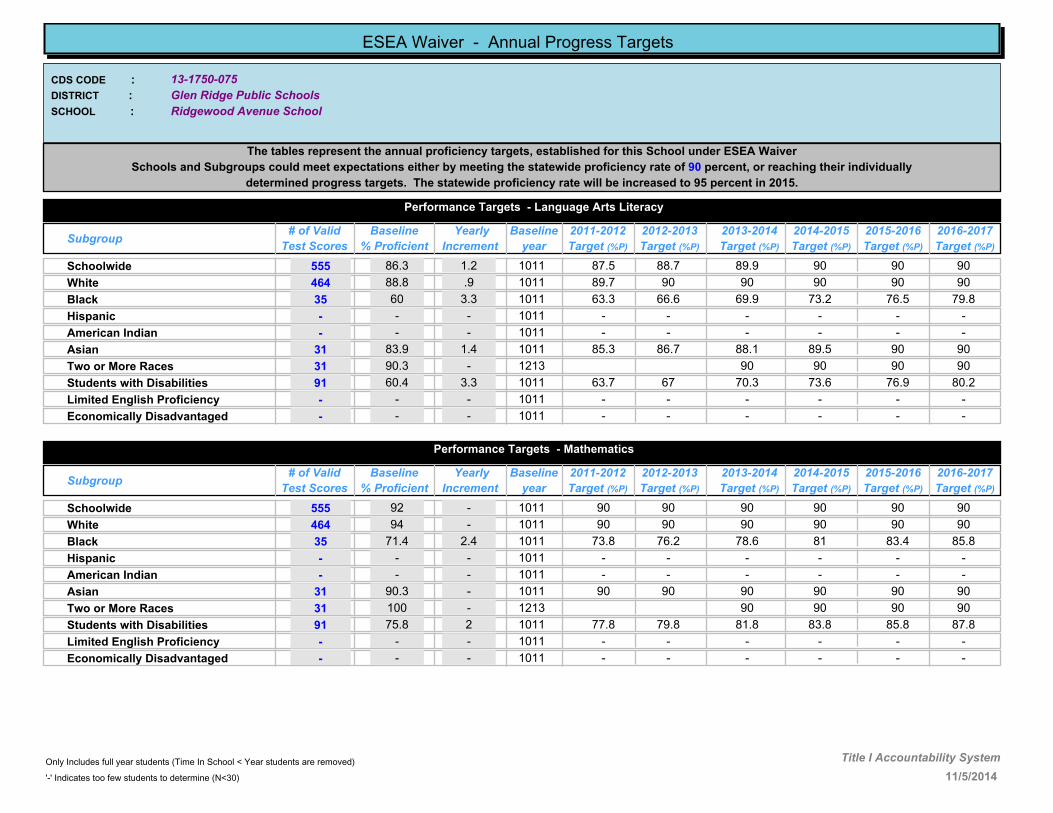
13-1750-075
Ridgewood Avenue School
Glen Ridge Public Schools
CDS CODE :
DISTRICT :
SCHOOL :
ESEA Waiver - Annual Progress Targets
The tables represent the annual proficiency targets, established for this School under ESEA Waiver
Schools and Subgroups could meet expectations either by meeting the statewide proficiency rate of 90 percent, or reaching their individually
determined progress targets. The statewide proficiency rate will be increased to 95 percent in 2015.
Performance Targets - Language Arts Literacy
Subgroup# of Valid
Test Scores
Baseline
% Proficient
Yearly
Increment
2012-2013
Target (%P)
2011-2012
Target (%P)
2013-2014
Target (%P)
2014-2015
Target (%P)
2015-2016
Target (%P)
2016-2017
Target (%P)
Baseline
year
86.3 1.2 88.7 89.9 90 90 90Schoolwide 555 87.51011
88.8 .9 90 90 90 90 90White 464 89.71011
60 3.3 66.6 69.9 73.2 76.5 79.8Black 35 63.31011
- - - - - - -Hispanic - -1011
- - - - - - -American Indian - -1011
83.9 1.4 86.7 88.1 89.5 90 90Asian 31 85.31011
90.3 - 90 90 90 90Two or More Races 31 1213
60.4 3.3 67 70.3 73.6 76.9 80.2Students with Disabilities 91 63.71011
- - - - - - -Limited English Proficiency - -1011
- - - - - - -Economically Disadvantaged - -1011
Performance Targets - Mathematics
Subgroup# of Valid
Test Scores
Baseline
% Proficient
Yearly
Increment
2012-2013
Target (%P)
2011-2012
Target (%P)
2013-2014
Target (%P)
2014-2015
Target (%P)
2015-2016
Target (%P)
2016-2017
Target (%P)
Baseline
year
92 - 90 90 90 90 90Schoolwide 555 901011
94 - 90 90 90 90 90White 464 901011
71.4 2.4 76.2 78.6 81 83.4 85.8Black 35 73.81011
- - - - - - -Hispanic - -1011
- - - - - - -American Indian - -1011
90.3 - 90 90 90 90 90Asian 31 901011
100 - 90 90 90 90Two or More Races 31 1213
75.8 2 79.8 81.8 83.8 85.8 87.8Students with Disabilities 91 77.81011
- - - - - - -Limited English Proficiency - -1011
- - - - - - -Economically Disadvantaged - -1011
11/5/2014
Only Includes full year students (Time In School < Year students are removed)
'-' Indicates too few students to determine (N<30)
Title I Accountability System
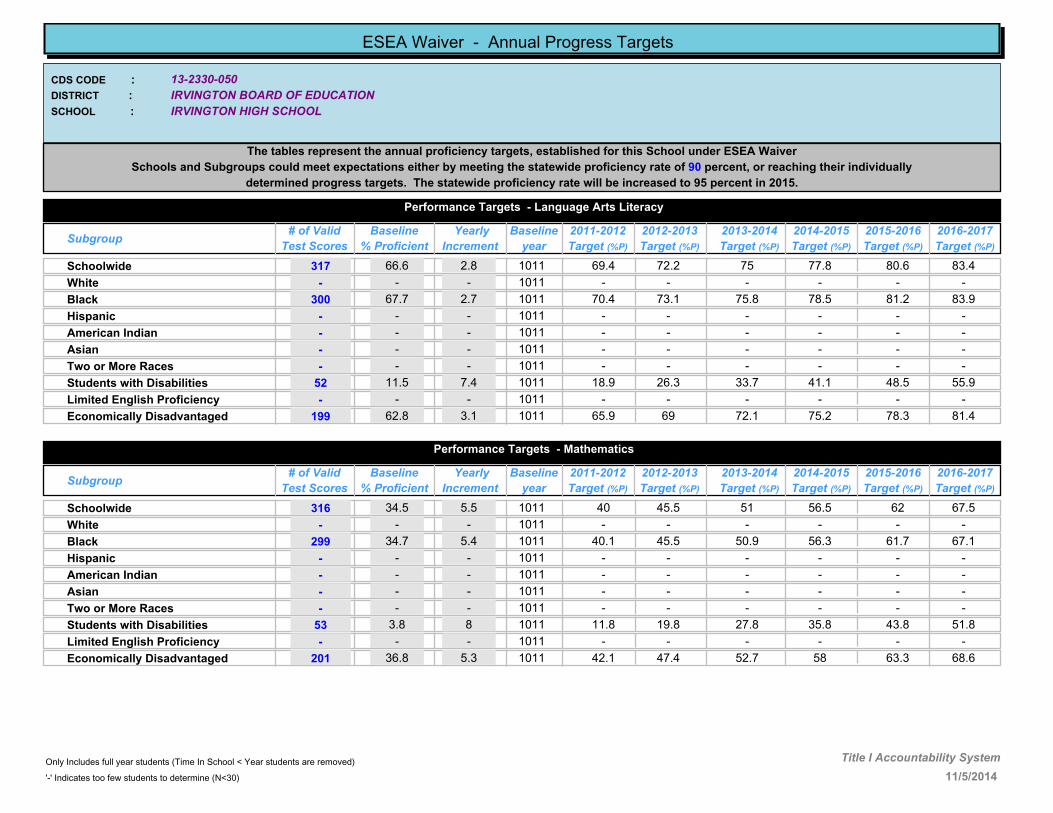
13-2330-050
IRVINGTON HIGH SCHOOL
IRVINGTON BOARD OF EDUCATION
CDS CODE :
DISTRICT :
SCHOOL :
ESEA Waiver - Annual Progress Targets
The tables represent the annual proficiency targets, established for this School under ESEA Waiver
Schools and Subgroups could meet expectations either by meeting the statewide proficiency rate of 90 percent, or reaching their individually
determined progress targets. The statewide proficiency rate will be increased to 95 percent in 2015.
Performance Targets - Language Arts Literacy
Subgroup# of Valid
Test Scores
Baseline
% Proficient
Yearly
Increment
2012-2013
Target (%P)
2011-2012
Target (%P)
2013-2014
Target (%P)
2014-2015
Target (%P)
2015-2016
Target (%P)
2016-2017
Target (%P)
Baseline
year
66.6 2.8 72.2 75 77.8 80.6 83.4Schoolwide 317 69.41011
- - - - - - -White - -1011
67.7 2.7 73.1 75.8 78.5 81.2 83.9Black 300 70.41011
- - - - - - -Hispanic - -1011
- - - - - - -American Indian - -1011
- - - - - - -Asian - -1011
- - - - - - -Two or More Races - -1011
11.5 7.4 26.3 33.7 41.1 48.5 55.9Students with Disabilities 52 18.91011
- - - - - - -Limited English Proficiency - -1011
62.8 3.1 69 72.1 75.2 78.3 81.4Economically Disadvantaged 199 65.91011
Performance Targets - Mathematics
Subgroup# of Valid
Test Scores
Baseline
% Proficient
Yearly
Increment
2012-2013
Target (%P)
2011-2012
Target (%P)
2013-2014
Target (%P)
2014-2015
Target (%P)
2015-2016
Target (%P)
2016-2017
Target (%P)
Baseline
year
34.5 5.5 45.5 51 56.5 62 67.5Schoolwide 316 401011
- - - - - - -White - -1011
34.7 5.4 45.5 50.9 56.3 61.7 67.1Black 299 40.11011
- - - - - - -Hispanic - -1011
- - - - - - -American Indian - -1011
- - - - - - -Asian - -1011
- - - - - - -Two or More Races - -1011
3.8 8 19.8 27.8 35.8 43.8 51.8Students with Disabilities 53 11.81011
- - - - - - -Limited English Proficiency - -1011
36.8 5.3 47.4 52.7 58 63.3 68.6Economically Disadvantaged 201 42.11011
11/5/2014
Only Includes full year students (Time In School < Year students are removed)
'-' Indicates too few students to determine (N<30)
Title I Accountability System

13-2330-080
BERKELEY TERRACE
IRVINGTON BOARD OF EDUCATION
CDS CODE :
DISTRICT :
SCHOOL :
ESEA Waiver - Annual Progress Targets
The tables represent the annual proficiency targets, established for this School under ESEA Waiver
Schools and Subgroups could meet expectations either by meeting the statewide proficiency rate of 90 percent, or reaching their individually
determined progress targets. The statewide proficiency rate will be increased to 95 percent in 2015.
Performance Targets - Language Arts Literacy
Subgroup# of Valid
Test Scores
Baseline
% Proficient
Yearly
Increment
2012-2013
Target (%P)
2011-2012
Target (%P)
2013-2014
Target (%P)
2014-2015
Target (%P)
2015-2016
Target (%P)
2016-2017
Target (%P)
Baseline
year
32.7 5.6 43.9 49.5 55.1 60.7 66.3Schoolwide 144 38.31011
- - - - - - -White - -1011
31.5 5.7 42.9 48.6 54.3 60 65.7Black 130 37.21011
- - - - - - -Hispanic - -1011
- - - - - - -American Indian - -1011
- - - - - - -Asian - -1011
- - - - - - -Two or More Races - -1011
8.6 7.6 16.2 23.8 31.4 39 46.6Students with Disabilities 35 1112
- - - - - - -Limited English Proficiency - -1011
32.5 5.6 43.7 49.3 54.9 60.5 66.1Economically Disadvantaged 126 38.11011
Performance Targets - Mathematics
Subgroup# of Valid
Test Scores
Baseline
% Proficient
Yearly
Increment
2012-2013
Target (%P)
2011-2012
Target (%P)
2013-2014
Target (%P)
2014-2015
Target (%P)
2015-2016
Target (%P)
2016-2017
Target (%P)
Baseline
year
44.5 4.6 53.7 58.3 62.9 67.5 72.1Schoolwide 144 49.11011
- - - - - - -White - -1011
44.6 4.6 53.8 58.4 63 67.6 72.2Black 130 49.21011
- - - - - - -Hispanic - -1011
- - - - - - -American Indian - -1011
- - - - - - -Asian - -1011
- - - - - - -Two or More Races - -1011
14.3 7.2 21.5 28.7 35.9 43.1 50.3Students with Disabilities 35 1112
- - - - - - -Limited English Proficiency - -1011
42.1 4.8 51.7 56.5 61.3 66.1 70.9Economically Disadvantaged 126 46.91011
11/5/2014
Only Includes full year students (Time In School < Year students are removed)
'-' Indicates too few students to determine (N<30)
Title I Accountability System
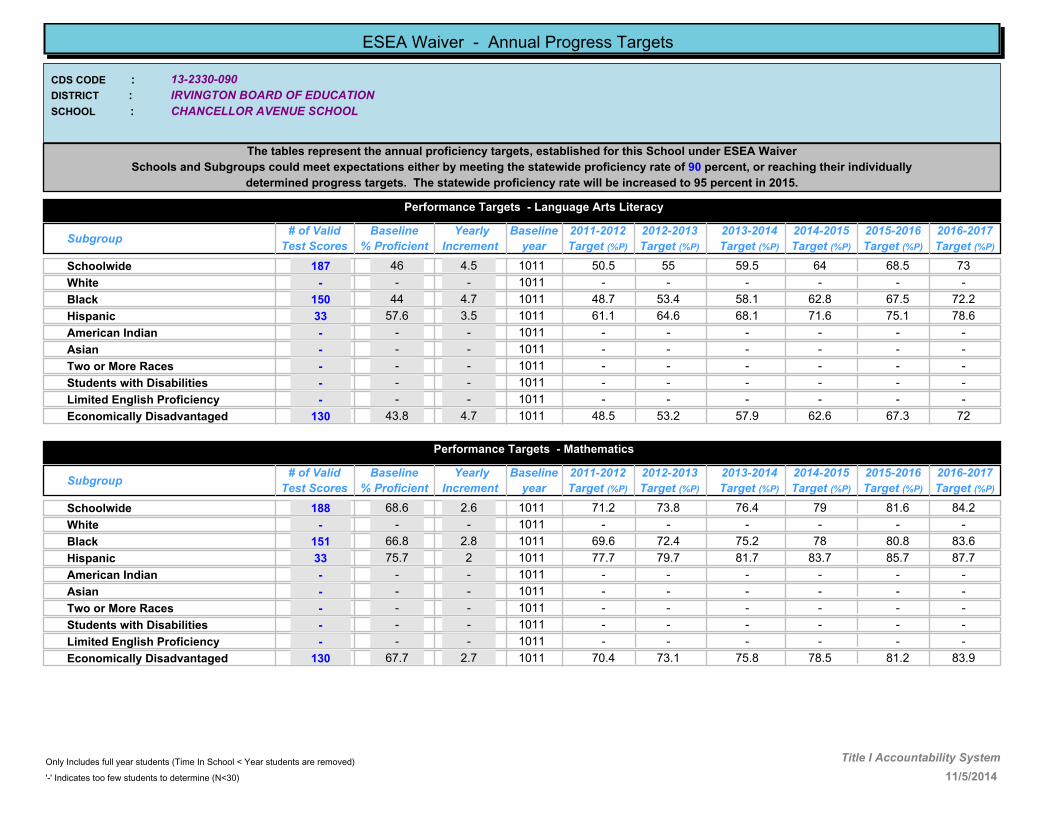
13-2330-090
CHANCELLOR AVENUE SCHOOL
IRVINGTON BOARD OF EDUCATION
CDS CODE :
DISTRICT :
SCHOOL :
ESEA Waiver - Annual Progress Targets
The tables represent the annual proficiency targets, established for this School under ESEA Waiver
Schools and Subgroups could meet expectations either by meeting the statewide proficiency rate of 90 percent, or reaching their individually
determined progress targets. The statewide proficiency rate will be increased to 95 percent in 2015.
Performance Targets - Language Arts Literacy
Subgroup# of Valid
Test Scores
Baseline
% Proficient
Yearly
Increment
2012-2013
Target (%P)
2011-2012
Target (%P)
2013-2014
Target (%P)
2014-2015
Target (%P)
2015-2016
Target (%P)
2016-2017
Target (%P)
Baseline
year
46 4.5 55 59.5 64 68.5 73Schoolwide 187 50.51011
- - - - - - -White - -1011
44 4.7 53.4 58.1 62.8 67.5 72.2Black 150 48.71011
57.6 3.5 64.6 68.1 71.6 75.1 78.6Hispanic 33 61.11011
- - - - - - -American Indian - -1011
- - - - - - -Asian - -1011
- - - - - - -Two or More Races - -1011
- - - - - - -Students with Disabilities - -1011
- - - - - - -Limited English Proficiency - -1011
43.8 4.7 53.2 57.9 62.6 67.3 72Economically Disadvantaged 130 48.51011
Performance Targets - Mathematics
Subgroup# of Valid
Test Scores
Baseline
% Proficient
Yearly
Increment
2012-2013
Target (%P)
2011-2012
Target (%P)
2013-2014
Target (%P)
2014-2015
Target (%P)
2015-2016
Target (%P)
2016-2017
Target (%P)
Baseline
year
68.6 2.6 73.8 76.4 79 81.6 84.2Schoolwide 188 71.21011
- - - - - - -White - -1011
66.8 2.8 72.4 75.2 78 80.8 83.6Black 151 69.61011
75.7 2 79.7 81.7 83.7 85.7 87.7Hispanic 33 77.71011
- - - - - - -American Indian - -1011
- - - - - - -Asian - -1011
- - - - - - -Two or More Races - -1011
- - - - - - -Students with Disabilities - -1011
- - - - - - -Limited English Proficiency - -1011
67.7 2.7 73.1 75.8 78.5 81.2 83.9Economically Disadvantaged 130 70.41011
11/5/2014
Only Includes full year students (Time In School < Year students are removed)
'-' Indicates too few students to determine (N<30)
Title I Accountability System

13-2330-100
FLORENCE AVENUE SCHOOL
IRVINGTON BOARD OF EDUCATION
CDS CODE :
DISTRICT :
SCHOOL :
ESEA Waiver - Annual Progress Targets
The tables represent the annual proficiency targets, established for this School under ESEA Waiver
Schools and Subgroups could meet expectations either by meeting the statewide proficiency rate of 90 percent, or reaching their individually
determined progress targets. The statewide proficiency rate will be increased to 95 percent in 2015.
Performance Targets - Language Arts Literacy
Subgroup# of Valid
Test Scores
Baseline
% Proficient
Yearly
Increment
2012-2013
Target (%P)
2011-2012
Target (%P)
2013-2014
Target (%P)
2014-2015
Target (%P)
2015-2016
Target (%P)
2016-2017
Target (%P)
Baseline
year
31.7 5.7 43.1 48.8 54.5 60.2 65.9Schoolwide 227 37.41011
- - - - - - -White - -1011
33.7 5.5 44.7 50.2 55.7 61.2 66.7Black 193 39.21011
19.4 6.7 32.8 39.5 46.2 52.9 59.6Hispanic 31 26.11011
- - - - - - -American Indian - -1011
- - - - - - -Asian - -1011
- - - - - - -Two or More Races - -1011
- - - - - - -Students with Disabilities - -1011
- - - - - - -Limited English Proficiency - -1011
32.6 5.6 43.8 49.4 55 60.6 66.2Economically Disadvantaged 172 38.21011
Performance Targets - Mathematics
Subgroup# of Valid
Test Scores
Baseline
% Proficient
Yearly
Increment
2012-2013
Target (%P)
2011-2012
Target (%P)
2013-2014
Target (%P)
2014-2015
Target (%P)
2015-2016
Target (%P)
2016-2017
Target (%P)
Baseline
year
59.2 3.4 66 69.4 72.8 76.2 79.6Schoolwide 228 62.61011
- - - - - - -White - -1011
58.6 3.5 65.6 69.1 72.6 76.1 79.6Black 193 62.11011
64.5 3 70.5 73.5 76.5 79.5 82.5Hispanic 31 67.51011
- - - - - - -American Indian - -1011
- - - - - - -Asian - -1011
- - - - - - -Two or More Races - -1011
- - - - - - -Students with Disabilities - -1011
- - - - - - -Limited English Proficiency - -1011
61.6 3.2 68 71.2 74.4 77.6 80.8Economically Disadvantaged 172 64.81011
11/5/2014
Only Includes full year students (Time In School < Year students are removed)
'-' Indicates too few students to determine (N<30)
Title I Accountability System

13-2330-110
GROVE STREET SCHOOL
IRVINGTON BOARD OF EDUCATION
CDS CODE :
DISTRICT :
SCHOOL :
ESEA Waiver - Annual Progress Targets
The tables represent the annual proficiency targets, established for this School under ESEA Waiver
Schools and Subgroups could meet expectations either by meeting the statewide proficiency rate of 90 percent, or reaching their individually
determined progress targets. The statewide proficiency rate will be increased to 95 percent in 2015.
Performance Targets - Language Arts Literacy
Subgroup# of Valid
Test Scores
Baseline
% Proficient
Yearly
Increment
2012-2013
Target (%P)
2011-2012
Target (%P)
2013-2014
Target (%P)
2014-2015
Target (%P)
2015-2016
Target (%P)
2016-2017
Target (%P)
Baseline
year
32.4 5.6 43.6 49.2 54.8 60.4 66Schoolwide 108 381011
- - - - - - -White - -1011
32 5.7 43.4 49.1 54.8 60.5 66.2Black 97 37.71011
- - - - - - -Hispanic - -1011
- - - - - - -American Indian - -1011
- - - - - - -Asian - -1011
- - - - - - -Two or More Races - -1011
28.2 6 40.2 46.2 52.2 58.2 64.2Students with Disabilities 39 34.21011
- - - - - - -Limited English Proficiency - -1011
32.1 5.7 43.5 49.2 54.9 60.6 66.3Economically Disadvantaged 81 37.81011
Performance Targets - Mathematics
Subgroup# of Valid
Test Scores
Baseline
% Proficient
Yearly
Increment
2012-2013
Target (%P)
2011-2012
Target (%P)
2013-2014
Target (%P)
2014-2015
Target (%P)
2015-2016
Target (%P)
2016-2017
Target (%P)
Baseline
year
55.1 3.8 62.7 66.5 70.3 74.1 77.9Schoolwide 107 58.91011
- - - - - - -White - -1011
54.2 3.8 61.8 65.6 69.4 73.2 77Black 96 581011
- - - - - - -Hispanic - -1011
- - - - - - -American Indian - -1011
- - - - - - -Asian - -1011
- - - - - - -Two or More Races - -1011
48.8 4.3 57.4 61.7 66 70.3 74.6Students with Disabilities 39 53.11011
- - - - - - -Limited English Proficiency - -1011
57.6 3.6 64.8 68.4 72 75.6 79.2Economically Disadvantaged 80 61.21011
11/5/2014
Only Includes full year students (Time In School < Year students are removed)
'-' Indicates too few students to determine (N<30)
Title I Accountability System
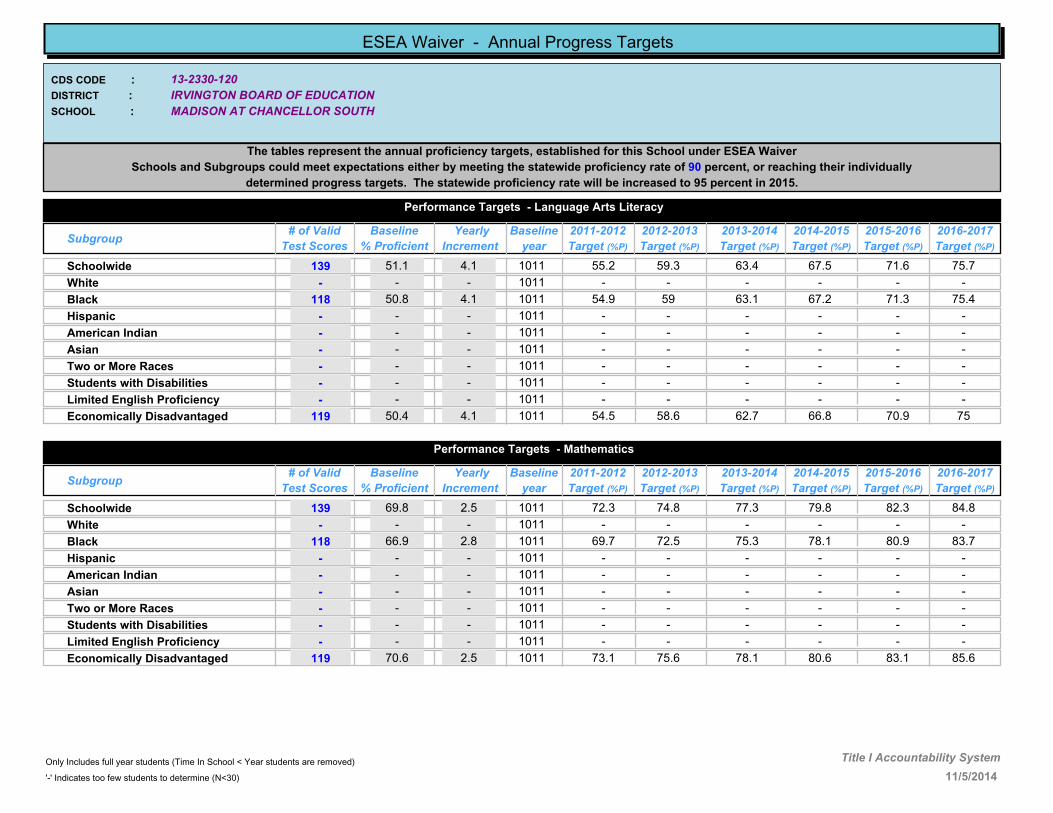
13-2330-120
MADISON AT CHANCELLOR SOUTH
IRVINGTON BOARD OF EDUCATION
CDS CODE :
DISTRICT :
SCHOOL :
ESEA Waiver - Annual Progress Targets
The tables represent the annual proficiency targets, established for this School under ESEA Waiver
Schools and Subgroups could meet expectations either by meeting the statewide proficiency rate of 90 percent, or reaching their individually
determined progress targets. The statewide proficiency rate will be increased to 95 percent in 2015.
Performance Targets - Language Arts Literacy
Subgroup# of Valid
Test Scores
Baseline
% Proficient
Yearly
Increment
2012-2013
Target (%P)
2011-2012
Target (%P)
2013-2014
Target (%P)
2014-2015
Target (%P)
2015-2016
Target (%P)
2016-2017
Target (%P)
Baseline
year
51.1 4.1 59.3 63.4 67.5 71.6 75.7Schoolwide 139 55.21011
- - - - - - -White - -1011
50.8 4.1 59 63.1 67.2 71.3 75.4Black 118 54.91011
- - - - - - -Hispanic - -1011
- - - - - - -American Indian - -1011
- - - - - - -Asian - -1011
- - - - - - -Two or More Races - -1011
- - - - - - -Students with Disabilities - -1011
- - - - - - -Limited English Proficiency - -1011
50.4 4.1 58.6 62.7 66.8 70.9 75Economically Disadvantaged 119 54.51011
Performance Targets - Mathematics
Subgroup# of Valid
Test Scores
Baseline
% Proficient
Yearly
Increment
2012-2013
Target (%P)
2011-2012
Target (%P)
2013-2014
Target (%P)
2014-2015
Target (%P)
2015-2016
Target (%P)
2016-2017
Target (%P)
Baseline
year
69.8 2.5 74.8 77.3 79.8 82.3 84.8Schoolwide 139 72.31011
- - - - - - -White - -1011
66.9 2.8 72.5 75.3 78.1 80.9 83.7Black 118 69.71011
- - - - - - -Hispanic - -1011
- - - - - - -American Indian - -1011
- - - - - - -Asian - -1011
- - - - - - -Two or More Races - -1011
- - - - - - -Students with Disabilities - -1011
- - - - - - -Limited English Proficiency - -1011
70.6 2.5 75.6 78.1 80.6 83.1 85.6Economically Disadvantaged 119 73.11011
11/5/2014
Only Includes full year students (Time In School < Year students are removed)
'-' Indicates too few students to determine (N<30)
Title I Accountability System

13-2330-125
THURGOOD MARSHALL SCHOOL
IRVINGTON BOARD OF EDUCATION
CDS CODE :
DISTRICT :
SCHOOL :
ESEA Waiver - Annual Progress Targets
The tables represent the annual proficiency targets, established for this School under ESEA Waiver
Schools and Subgroups could meet expectations either by meeting the statewide proficiency rate of 90 percent, or reaching their individually
determined progress targets. The statewide proficiency rate will be increased to 95 percent in 2015.
Performance Targets - Language Arts Literacy
Subgroup# of Valid
Test Scores
Baseline
% Proficient
Yearly
Increment
2012-2013
Target (%P)
2011-2012
Target (%P)
2013-2014
Target (%P)
2014-2015
Target (%P)
2015-2016
Target (%P)
2016-2017
Target (%P)
Baseline
year
20.7 6.6 33.9 40.5 47.1 53.7 60.3Schoolwide 92 27.31011
- - - - - - -White - -1011
20.2 6.7 33.6 40.3 47 53.7 60.4Black 84 26.91011
- - - - - - -Hispanic - -1011
- - - - - - -American Indian - -1011
- - - - - - -Asian - -1011
- - - - - - -Two or More Races - -1011
- - - - - - -Students with Disabilities - -1011
- - - - - - -Limited English Proficiency - -1011
18.3 6.8 31.9 38.7 45.5 52.3 59.1Economically Disadvantaged 82 25.11011
Performance Targets - Mathematics
Subgroup# of Valid
Test Scores
Baseline
% Proficient
Yearly
Increment
2012-2013
Target (%P)
2011-2012
Target (%P)
2013-2014
Target (%P)
2014-2015
Target (%P)
2015-2016
Target (%P)
2016-2017
Target (%P)
Baseline
year
52.2 4 60.2 64.2 68.2 72.2 76.2Schoolwide 92 56.21011
- - - - - - -White - -1011
53.6 3.9 61.4 65.3 69.2 73.1 77Black 84 57.51011
- - - - - - -Hispanic - -1011
- - - - - - -American Indian - -1011
- - - - - - -Asian - -1011
- - - - - - -Two or More Races - -1011
- - - - - - -Students with Disabilities - -1011
- - - - - - -Limited English Proficiency - -1011
50 4.2 58.4 62.6 66.8 71 75.2Economically Disadvantaged 82 54.21011
11/5/2014
Only Includes full year students (Time In School < Year students are removed)
'-' Indicates too few students to determine (N<30)
Title I Accountability System

13-2330-131
MT. VERNON AVENUE SCHOOL
IRVINGTON BOARD OF EDUCATION
CDS CODE :
DISTRICT :
SCHOOL :
ESEA Waiver - Annual Progress Targets
The tables represent the annual proficiency targets, established for this School under ESEA Waiver
Schools and Subgroups could meet expectations either by meeting the statewide proficiency rate of 90 percent, or reaching their individually
determined progress targets. The statewide proficiency rate will be increased to 95 percent in 2015.
Performance Targets - Language Arts Literacy
Subgroup# of Valid
Test Scores
Baseline
% Proficient
Yearly
Increment
2012-2013
Target (%P)
2011-2012
Target (%P)
2013-2014
Target (%P)
2014-2015
Target (%P)
2015-2016
Target (%P)
2016-2017
Target (%P)
Baseline
year
37.7 5.2 48.1 53.3 58.5 63.7 68.9Schoolwide 255 42.91011
- - - - - - -White - -1011
36.1 5.3 46.7 52 57.3 62.6 67.9Black 227 41.41011
- - - - - - -Hispanic - -1011
- - - - - - -American Indian - -1011
- - - - - - -Asian - -1011
34.6 5.5 40.1 45.6 51.1 56.6 62.1Two or More Races 185 1112
- - - - - - -Students with Disabilities - -1011
- - - - - - -Limited English Proficiency - -1011
36.1 5.3 46.7 52 57.3 62.6 67.9Economically Disadvantaged 169 41.41011
Performance Targets - Mathematics
Subgroup# of Valid
Test Scores
Baseline
% Proficient
Yearly
Increment
2012-2013
Target (%P)
2011-2012
Target (%P)
2013-2014
Target (%P)
2014-2015
Target (%P)
2015-2016
Target (%P)
2016-2017
Target (%P)
Baseline
year
52.3 4 60.3 64.3 68.3 72.3 76.3Schoolwide 258 56.31011
- - - - - - -White - -1011
50.9 4.1 59.1 63.2 67.3 71.4 75.5Black 230 551011
- - - - - - -Hispanic - -1011
- - - - - - -American Indian - -1011
- - - - - - -Asian - -1011
56.2 3.7 59.9 63.6 67.3 71 74.7Two or More Races 185 1112
- - - - - - -Students with Disabilities - -1011
- - - - - - -Limited English Proficiency - -1011
52.9 3.9 60.7 64.6 68.5 72.4 76.3Economically Disadvantaged 172 56.81011
11/5/2014
Only Includes full year students (Time In School < Year students are removed)
'-' Indicates too few students to determine (N<30)
Title I Accountability System

13-2330-135
UNIVERSIY MIDDLE SCHOOL
IRVINGTON BOARD OF EDUCATION
CDS CODE :
DISTRICT :
SCHOOL :
ESEA Waiver - Annual Progress Targets
The tables represent the annual proficiency targets, established for this School under ESEA Waiver
Schools and Subgroups could meet expectations either by meeting the statewide proficiency rate of 90 percent, or reaching their individually
determined progress targets. The statewide proficiency rate will be increased to 95 percent in 2015.
Performance Targets - Language Arts Literacy
Subgroup# of Valid
Test Scores
Baseline
% Proficient
Yearly
Increment
2012-2013
Target (%P)
2011-2012
Target (%P)
2013-2014
Target (%P)
2014-2015
Target (%P)
2015-2016
Target (%P)
2016-2017
Target (%P)
Baseline
year
29.3 5.9 41.1 47 52.9 58.8 64.7Schoolwide 592 35.21011
- - - - - - -White - -1011
29.5 5.9 41.3 47.2 53.1 59 64.9Black 552 35.41011
27 6.1 39.2 45.3 51.4 57.5 63.6Hispanic 37 33.11011
- - - - - - -American Indian - -1011
- - - - - - -Asian - -1011
- - - - - - -Two or More Races - -1011
10.7 7.5 25.7 33.2 40.7 48.2 55.7Students with Disabilities 112 18.21011
14.8 7.1 21.9 29 36.1 43.2 50.3Limited English Proficiency 54 1112
31.4 5.7 42.8 48.5 54.2 59.9 65.6Economically Disadvantaged 421 37.11011
Performance Targets - Mathematics
Subgroup# of Valid
Test Scores
Baseline
% Proficient
Yearly
Increment
2012-2013
Target (%P)
2011-2012
Target (%P)
2013-2014
Target (%P)
2014-2015
Target (%P)
2015-2016
Target (%P)
2016-2017
Target (%P)
Baseline
year
32.3 5.7 43.7 49.4 55.1 60.8 66.5Schoolwide 583 381011
- - - - - - -White - -1011
32.2 5.7 43.6 49.3 55 60.7 66.4Black 543 37.91011
29.7 5.9 41.5 47.4 53.3 59.2 65.1Hispanic 37 35.61011
- - - - - - -American Indian - -1011
- - - - - - -Asian - -1011
- - - - - - -Two or More Races - -1011
12.7 7.3 27.3 34.6 41.9 49.2 56.5Students with Disabilities 110 201011
30 5.8 41.6 47.4 53.2 59 64.8Limited English Proficiency 30 35.81011
32.4 5.6 43.6 49.2 54.8 60.4 66Economically Disadvantaged 416 381011
11/5/2014
Only Includes full year students (Time In School < Year students are removed)
'-' Indicates too few students to determine (N<30)
Title I Accountability System
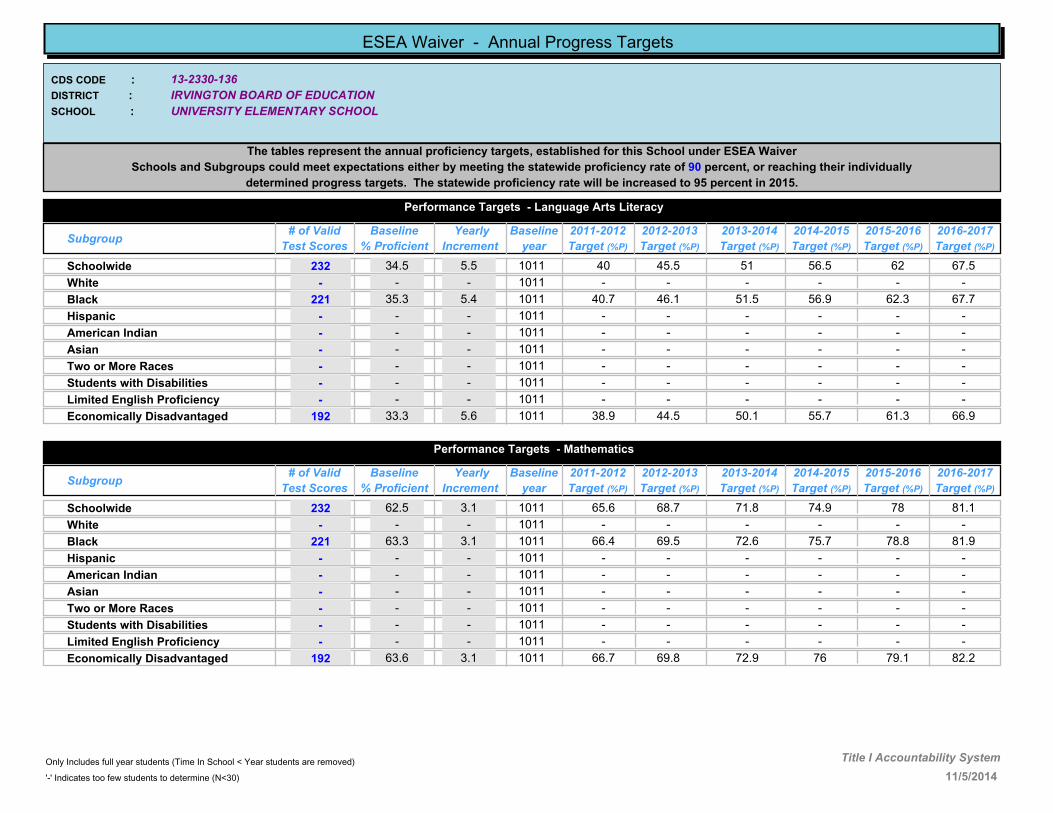
13-2330-136
UNIVERSITY ELEMENTARY SCHOOL
IRVINGTON BOARD OF EDUCATION
CDS CODE :
DISTRICT :
SCHOOL :
ESEA Waiver - Annual Progress Targets
The tables represent the annual proficiency targets, established for this School under ESEA Waiver
Schools and Subgroups could meet expectations either by meeting the statewide proficiency rate of 90 percent, or reaching their individually
determined progress targets. The statewide proficiency rate will be increased to 95 percent in 2015.
Performance Targets - Language Arts Literacy
Subgroup# of Valid
Test Scores
Baseline
% Proficient
Yearly
Increment
2012-2013
Target (%P)
2011-2012
Target (%P)
2013-2014
Target (%P)
2014-2015
Target (%P)
2015-2016
Target (%P)
2016-2017
Target (%P)
Baseline
year
34.5 5.5 45.5 51 56.5 62 67.5Schoolwide 232 401011
- - - - - - -White - -1011
35.3 5.4 46.1 51.5 56.9 62.3 67.7Black 221 40.71011
- - - - - - -Hispanic - -1011
- - - - - - -American Indian - -1011
- - - - - - -Asian - -1011
- - - - - - -Two or More Races - -1011
- - - - - - -Students with Disabilities - -1011
- - - - - - -Limited English Proficiency - -1011
33.3 5.6 44.5 50.1 55.7 61.3 66.9Economically Disadvantaged 192 38.91011
Performance Targets - Mathematics
Subgroup# of Valid
Test Scores
Baseline
% Proficient
Yearly
Increment
2012-2013
Target (%P)
2011-2012
Target (%P)
2013-2014
Target (%P)
2014-2015
Target (%P)
2015-2016
Target (%P)
2016-2017
Target (%P)
Baseline
year
62.5 3.1 68.7 71.8 74.9 78 81.1Schoolwide 232 65.61011
- - - - - - -White - -1011
63.3 3.1 69.5 72.6 75.7 78.8 81.9Black 221 66.41011
- - - - - - -Hispanic - -1011
- - - - - - -American Indian - -1011
- - - - - - -Asian - -1011
- - - - - - -Two or More Races - -1011
- - - - - - -Students with Disabilities - -1011
- - - - - - -Limited English Proficiency - -1011
63.6 3.1 69.8 72.9 76 79.1 82.2Economically Disadvantaged 192 66.71011
11/5/2014
Only Includes full year students (Time In School < Year students are removed)
'-' Indicates too few students to determine (N<30)
Title I Accountability System

13-2330-140
UNION AVENUE MIDDLE SCHOOL
IRVINGTON BOARD OF EDUCATION
CDS CODE :
DISTRICT :
SCHOOL :
ESEA Waiver - Annual Progress Targets
The tables represent the annual proficiency targets, established for this School under ESEA Waiver
Schools and Subgroups could meet expectations either by meeting the statewide proficiency rate of 90 percent, or reaching their individually
determined progress targets. The statewide proficiency rate will be increased to 95 percent in 2015.
Performance Targets - Language Arts Literacy
Subgroup# of Valid
Test Scores
Baseline
% Proficient
Yearly
Increment
2012-2013
Target (%P)
2011-2012
Target (%P)
2013-2014
Target (%P)
2014-2015
Target (%P)
2015-2016
Target (%P)
2016-2017
Target (%P)
Baseline
year
46.4 4.5 55.4 59.9 64.4 68.9 73.4Schoolwide 714 50.91011
- - - - - - -White - -1011
47.2 4.4 56 60.4 64.8 69.2 73.6Black 661 51.61011
36.5 5.3 47.1 52.4 57.7 63 68.3Hispanic 41 41.81011
- - - - - - -American Indian - -1011
- - - - - - -Asian - -1011
41.1 4.9 46 50.9 55.8 60.7Two or More Races 34 1213
11.1 7.4 25.9 33.3 40.7 48.1 55.5Students with Disabilities 90 18.51011
9.3 7.6 24.5 32.1 39.7 47.3 54.9Limited English Proficiency 43 16.91011
45.5 4.5 54.5 59 63.5 68 72.5Economically Disadvantaged 472 501011
Performance Targets - Mathematics
Subgroup# of Valid
Test Scores
Baseline
% Proficient
Yearly
Increment
2012-2013
Target (%P)
2011-2012
Target (%P)
2013-2014
Target (%P)
2014-2015
Target (%P)
2015-2016
Target (%P)
2016-2017
Target (%P)
Baseline
year
44.5 4.6 53.7 58.3 62.9 67.5 72.1Schoolwide 719 49.11011
- - - - - - -White - -1011
45.1 4.6 54.3 58.9 63.5 68.1 72.7Black 666 49.71011
34.1 5.5 45.1 50.6 56.1 61.6 67.1Hispanic 41 39.61011
- - - - - - -American Indian - -1011
- - - - - - -Asian - -1011
22.9 6.4 29.3 35.7 42.1 48.5Two or More Races 35 1213
13.1 7.3 27.7 35 42.3 49.6 56.9Students with Disabilities 92 20.41011
6.8 7.8 22.4 30.2 38 45.8 53.6Limited English Proficiency 44 14.61011
45 4.6 54.2 58.8 63.4 68 72.6Economically Disadvantaged 476 49.61011
11/5/2014
Only Includes full year students (Time In School < Year students are removed)
'-' Indicates too few students to determine (N<30)
Title I Accountability System

13-2730-050
Livingston High School
Livingston Public Schools
CDS CODE :
DISTRICT :
SCHOOL :
ESEA Waiver - Annual Progress Targets
The tables represent the annual proficiency targets, established for this School under ESEA Waiver
Schools and Subgroups could meet expectations either by meeting the statewide proficiency rate of 90 percent, or reaching their individually
determined progress targets. The statewide proficiency rate will be increased to 95 percent in 2015.
Performance Targets - Language Arts Literacy
Subgroup# of Valid
Test Scores
Baseline
% Proficient
Yearly
Increment
2012-2013
Target (%P)
2011-2012
Target (%P)
2013-2014
Target (%P)
2014-2015
Target (%P)
2015-2016
Target (%P)
2016-2017
Target (%P)
Baseline
year
99.8 - 90 90 90 90 90Schoolwide 448 901011
100 - 90 90 90 90 90White 307 901011
- - - - - - -Black - -1011
- - - - - - -Hispanic - -1011
- - - - - - -American Indian - -1011
99 - 90 90 90 90 90Asian 110 901011
- - - - - - -Two or More Races - -1011
98.2 - 90 90 90 90 90Students with Disabilities 54 901011
- - - - - - -Limited English Proficiency - -1011
- - - - - - -Economically Disadvantaged - -1011
Performance Targets - Mathematics
Subgroup# of Valid
Test Scores
Baseline
% Proficient
Yearly
Increment
2012-2013
Target (%P)
2011-2012
Target (%P)
2013-2014
Target (%P)
2014-2015
Target (%P)
2015-2016
Target (%P)
2016-2017
Target (%P)
Baseline
year
98.4 - 90 90 90 90 90Schoolwide 448 901011
98 - 90 90 90 90 90White 307 901011
- - - - - - -Black - -1011
- - - - - - -Hispanic - -1011
- - - - - - -American Indian - -1011
100 - 90 90 90 90 90Asian 110 901011
- - - - - - -Two or More Races - -1011
87.1 1.1 89.3 90 90 90 90Students with Disabilities 54 88.21011
- - - - - - -Limited English Proficiency - -1011
- - - - - - -Economically Disadvantaged - -1011
11/5/2014
Only Includes full year students (Time In School < Year students are removed)
'-' Indicates too few students to determine (N<30)
Title I Accountability System
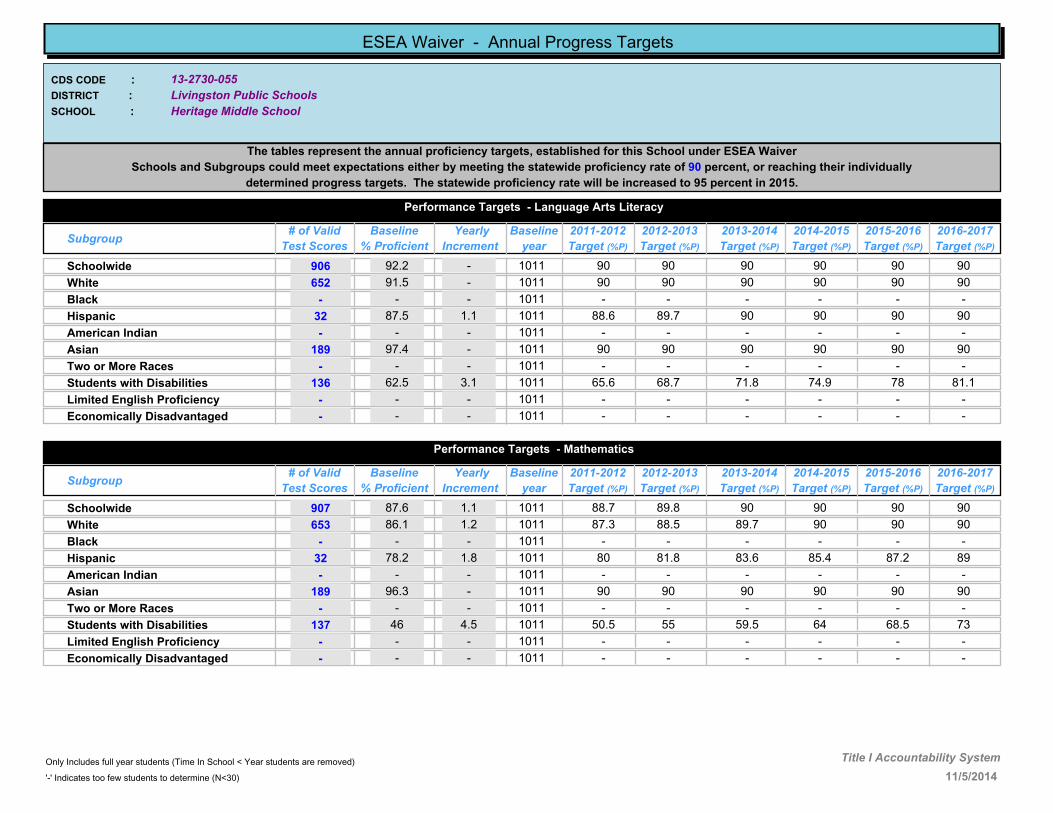
13-2730-055
Heritage Middle School
Livingston Public Schools
CDS CODE :
DISTRICT :
SCHOOL :
ESEA Waiver - Annual Progress Targets
The tables represent the annual proficiency targets, established for this School under ESEA Waiver
Schools and Subgroups could meet expectations either by meeting the statewide proficiency rate of 90 percent, or reaching their individually
determined progress targets. The statewide proficiency rate will be increased to 95 percent in 2015.
Performance Targets - Language Arts Literacy
Subgroup# of Valid
Test Scores
Baseline
% Proficient
Yearly
Increment
2012-2013
Target (%P)
2011-2012
Target (%P)
2013-2014
Target (%P)
2014-2015
Target (%P)
2015-2016
Target (%P)
2016-2017
Target (%P)
Baseline
year
92.2 - 90 90 90 90 90Schoolwide 906 901011
91.5 - 90 90 90 90 90White 652 901011
- - - - - - -Black - -1011
87.5 1.1 89.7 90 90 90 90Hispanic 32 88.61011
- - - - - - -American Indian - -1011
97.4 - 90 90 90 90 90Asian 189 901011
- - - - - - -Two or More Races - -1011
62.5 3.1 68.7 71.8 74.9 78 81.1Students with Disabilities 136 65.61011
- - - - - - -Limited English Proficiency - -1011
- - - - - - -Economically Disadvantaged - -1011
Performance Targets - Mathematics
Subgroup# of Valid
Test Scores
Baseline
% Proficient
Yearly
Increment
2012-2013
Target (%P)
2011-2012
Target (%P)
2013-2014
Target (%P)
2014-2015
Target (%P)
2015-2016
Target (%P)
2016-2017
Target (%P)
Baseline
year
87.6 1.1 89.8 90 90 90 90Schoolwide 907 88.71011
86.1 1.2 88.5 89.7 90 90 90White 653 87.31011
- - - - - - -Black - -1011
78.2 1.8 81.8 83.6 85.4 87.2 89Hispanic 32 801011
- - - - - - -American Indian - -1011
96.3 - 90 90 90 90 90Asian 189 901011
- - - - - - -Two or More Races - -1011
46 4.5 55 59.5 64 68.5 73Students with Disabilities 137 50.51011
- - - - - - -Limited English Proficiency - -1011
- - - - - - -Economically Disadvantaged - -1011
11/5/2014
Only Includes full year students (Time In School < Year students are removed)
'-' Indicates too few students to determine (N<30)
Title I Accountability System

13-2730-060
Mount Pleasant Middle School
Livingston Public Schools
CDS CODE :
DISTRICT :
SCHOOL :
ESEA Waiver - Annual Progress Targets
The tables represent the annual proficiency targets, established for this School under ESEA Waiver
Schools and Subgroups could meet expectations either by meeting the statewide proficiency rate of 90 percent, or reaching their individually
determined progress targets. The statewide proficiency rate will be increased to 95 percent in 2015.
Performance Targets - Language Arts Literacy
Subgroup# of Valid
Test Scores
Baseline
% Proficient
Yearly
Increment
2012-2013
Target (%P)
2011-2012
Target (%P)
2013-2014
Target (%P)
2014-2015
Target (%P)
2015-2016
Target (%P)
2016-2017
Target (%P)
Baseline
year
83 1.4 85.8 87.2 88.6 90 90Schoolwide 423 84.41011
81.2 1.6 84.4 86 87.6 89.2 90White 299 82.81011
- - - - - - -Black - -1011
- - - - - - -Hispanic - -1011
- - - - - - -American Indian - -1011
91.2 - 90 90 90 90 90Asian 91 901011
- - - - - - -Two or More Races - -1011
41.8 4.9 51.6 56.5 61.4 66.3 71.2Students with Disabilities 79 46.71011
- - - - - - -Limited English Proficiency - -1011
- - - - - - -Economically Disadvantaged - -1011
Performance Targets - Mathematics
Subgroup# of Valid
Test Scores
Baseline
% Proficient
Yearly
Increment
2012-2013
Target (%P)
2011-2012
Target (%P)
2013-2014
Target (%P)
2014-2015
Target (%P)
2015-2016
Target (%P)
2016-2017
Target (%P)
Baseline
year
91.7 - 90 90 90 90 90Schoolwide 422 901011
89.3 .9 90 90 90 90 90White 299 901011
- - - - - - -Black - -1011
- - - - - - -Hispanic - -1011
- - - - - - -American Indian - -1011
98.9 - 90 90 90 90 90Asian 91 901011
- - - - - - -Two or More Races - -1011
59.5 3.4 66.3 69.7 73.1 76.5 79.9Students with Disabilities 79 62.91011
- - - - - - -Limited English Proficiency - -1011
- - - - - - -Economically Disadvantaged - -1011
11/5/2014
Only Includes full year students (Time In School < Year students are removed)
'-' Indicates too few students to determine (N<30)
Title I Accountability System
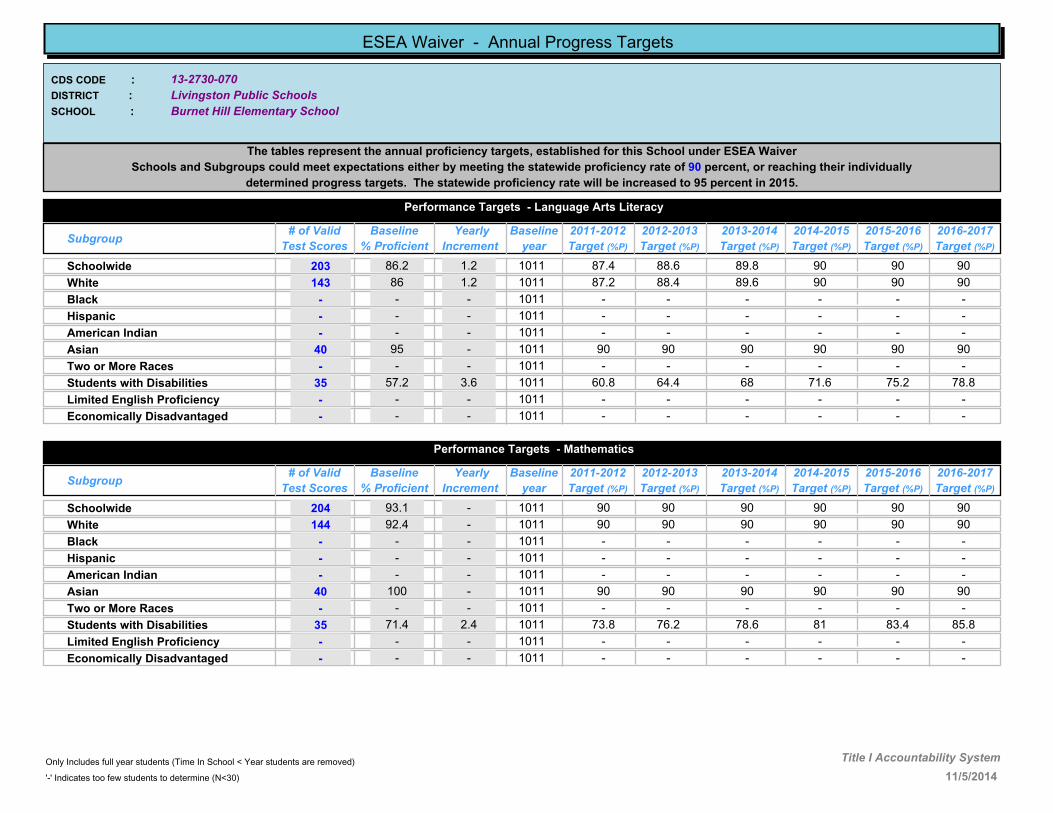
13-2730-070
Burnet Hill Elementary School
Livingston Public Schools
CDS CODE :
DISTRICT :
SCHOOL :
ESEA Waiver - Annual Progress Targets
The tables represent the annual proficiency targets, established for this School under ESEA Waiver
Schools and Subgroups could meet expectations either by meeting the statewide proficiency rate of 90 percent, or reaching their individually
determined progress targets. The statewide proficiency rate will be increased to 95 percent in 2015.
Performance Targets - Language Arts Literacy
Subgroup# of Valid
Test Scores
Baseline
% Proficient
Yearly
Increment
2012-2013
Target (%P)
2011-2012
Target (%P)
2013-2014
Target (%P)
2014-2015
Target (%P)
2015-2016
Target (%P)
2016-2017
Target (%P)
Baseline
year
86.2 1.2 88.6 89.8 90 90 90Schoolwide 203 87.41011
86 1.2 88.4 89.6 90 90 90White 143 87.21011
- - - - - - -Black - -1011
- - - - - - -Hispanic - -1011
- - - - - - -American Indian - -1011
95 - 90 90 90 90 90Asian 40 901011
- - - - - - -Two or More Races - -1011
57.2 3.6 64.4 68 71.6 75.2 78.8Students with Disabilities 35 60.81011
- - - - - - -Limited English Proficiency - -1011
- - - - - - -Economically Disadvantaged - -1011
Performance Targets - Mathematics
Subgroup# of Valid
Test Scores
Baseline
% Proficient
Yearly
Increment
2012-2013
Target (%P)
2011-2012
Target (%P)
2013-2014
Target (%P)
2014-2015
Target (%P)
2015-2016
Target (%P)
2016-2017
Target (%P)
Baseline
year
93.1 - 90 90 90 90 90Schoolwide 204 901011
92.4 - 90 90 90 90 90White 144 901011
- - - - - - -Black - -1011
- - - - - - -Hispanic - -1011
- - - - - - -American Indian - -1011
100 - 90 90 90 90 90Asian 40 901011
- - - - - - -Two or More Races - -1011
71.4 2.4 76.2 78.6 81 83.4 85.8Students with Disabilities 35 73.81011
- - - - - - -Limited English Proficiency - -1011
- - - - - - -Economically Disadvantaged - -1011
11/5/2014
Only Includes full year students (Time In School < Year students are removed)
'-' Indicates too few students to determine (N<30)
Title I Accountability System
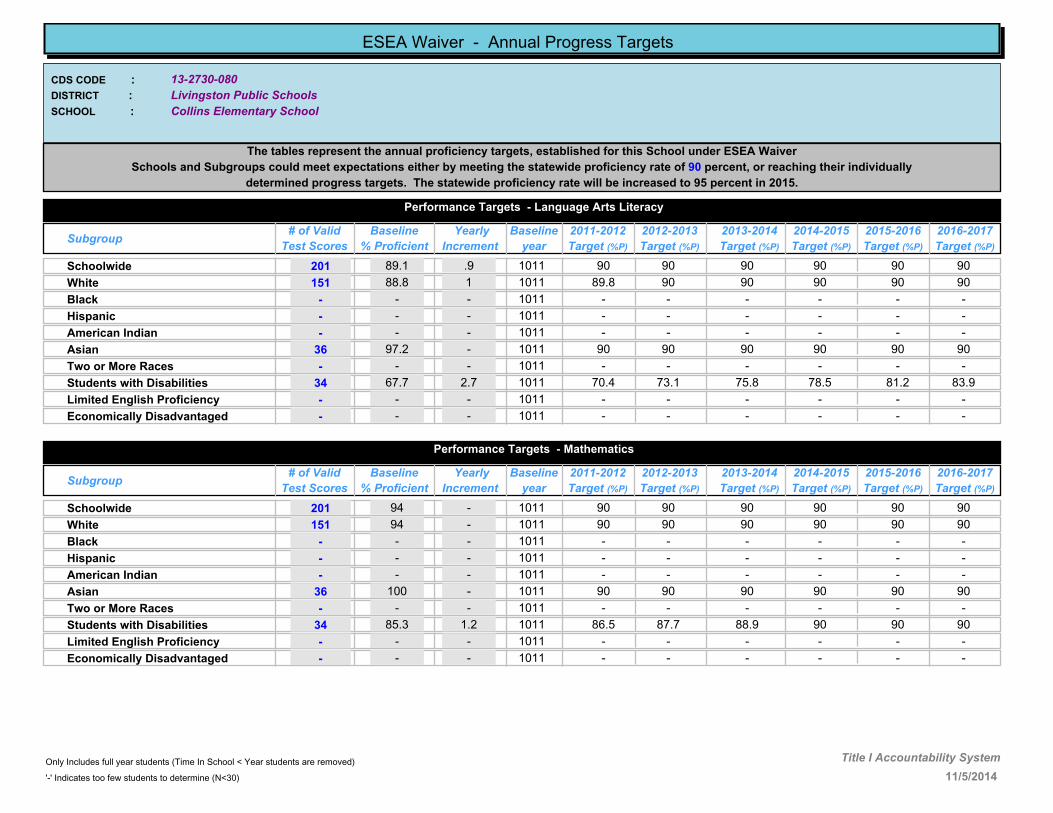
13-2730-080
Collins Elementary School
Livingston Public Schools
CDS CODE :
DISTRICT :
SCHOOL :
ESEA Waiver - Annual Progress Targets
The tables represent the annual proficiency targets, established for this School under ESEA Waiver
Schools and Subgroups could meet expectations either by meeting the statewide proficiency rate of 90 percent, or reaching their individually
determined progress targets. The statewide proficiency rate will be increased to 95 percent in 2015.
Performance Targets - Language Arts Literacy
Subgroup# of Valid
Test Scores
Baseline
% Proficient
Yearly
Increment
2012-2013
Target (%P)
2011-2012
Target (%P)
2013-2014
Target (%P)
2014-2015
Target (%P)
2015-2016
Target (%P)
2016-2017
Target (%P)
Baseline
year
89.1 .9 90 90 90 90 90Schoolwide 201 901011
88.8 1 90 90 90 90 90White 151 89.81011
- - - - - - -Black - -1011
- - - - - - -Hispanic - -1011
- - - - - - -American Indian - -1011
97.2 - 90 90 90 90 90Asian 36 901011
- - - - - - -Two or More Races - -1011
67.7 2.7 73.1 75.8 78.5 81.2 83.9Students with Disabilities 34 70.41011
- - - - - - -Limited English Proficiency - -1011
- - - - - - -Economically Disadvantaged - -1011
Performance Targets - Mathematics
Subgroup# of Valid
Test Scores
Baseline
% Proficient
Yearly
Increment
2012-2013
Target (%P)
2011-2012
Target (%P)
2013-2014
Target (%P)
2014-2015
Target (%P)
2015-2016
Target (%P)
2016-2017
Target (%P)
Baseline
year
94 - 90 90 90 90 90Schoolwide 201 901011
94 - 90 90 90 90 90White 151 901011
- - - - - - -Black - -1011
- - - - - - -Hispanic - -1011
- - - - - - -American Indian - -1011
100 - 90 90 90 90 90Asian 36 901011
- - - - - - -Two or More Races - -1011
85.3 1.2 87.7 88.9 90 90 90Students with Disabilities 34 86.51011
- - - - - - -Limited English Proficiency - -1011
- - - - - - -Economically Disadvantaged - -1011
11/5/2014
Only Includes full year students (Time In School < Year students are removed)
'-' Indicates too few students to determine (N<30)
Title I Accountability System

13-2730-090
Harrison Elementary School
Livingston Public Schools
CDS CODE :
DISTRICT :
SCHOOL :
ESEA Waiver - Annual Progress Targets
The tables represent the annual proficiency targets, established for this School under ESEA Waiver
Schools and Subgroups could meet expectations either by meeting the statewide proficiency rate of 90 percent, or reaching their individually
determined progress targets. The statewide proficiency rate will be increased to 95 percent in 2015.
Performance Targets - Language Arts Literacy
Subgroup# of Valid
Test Scores
Baseline
% Proficient
Yearly
Increment
2012-2013
Target (%P)
2011-2012
Target (%P)
2013-2014
Target (%P)
2014-2015
Target (%P)
2015-2016
Target (%P)
2016-2017
Target (%P)
Baseline
year
83 1.4 85.8 87.2 88.6 90 90Schoolwide 271 84.41011
82.2 1.5 85.2 86.7 88.2 89.7 90White 179 83.71011
- - - - - - -Black - -1011
- - - - - - -Hispanic - -1011
- - - - - - -American Indian - -1011
90.6 - 90 90 90 90 90Asian 64 901011
- - - - - - -Two or More Races - -1011
69.1 2.6 74.3 76.9 79.5 82.1 84.7Students with Disabilities 42 71.71011
- - - - - - -Limited English Proficiency - -1011
- - - - - - -Economically Disadvantaged - -1011
Performance Targets - Mathematics
Subgroup# of Valid
Test Scores
Baseline
% Proficient
Yearly
Increment
2012-2013
Target (%P)
2011-2012
Target (%P)
2013-2014
Target (%P)
2014-2015
Target (%P)
2015-2016
Target (%P)
2016-2017
Target (%P)
Baseline
year
93.4 - 90 90 90 90 90Schoolwide 269 901011
92.6 - 90 90 90 90 90White 178 901011
- - - - - - -Black - -1011
- - - - - - -Hispanic - -1011
- - - - - - -American Indian - -1011
98.5 - 90 90 90 90 90Asian 64 901011
- - - - - - -Two or More Races - -1011
83.3 1.4 86.1 87.5 88.9 90 90Students with Disabilities 42 84.71011
- - - - - - -Limited English Proficiency - -1011
- - - - - - -Economically Disadvantaged - -1011
11/5/2014
Only Includes full year students (Time In School < Year students are removed)
'-' Indicates too few students to determine (N<30)
Title I Accountability System
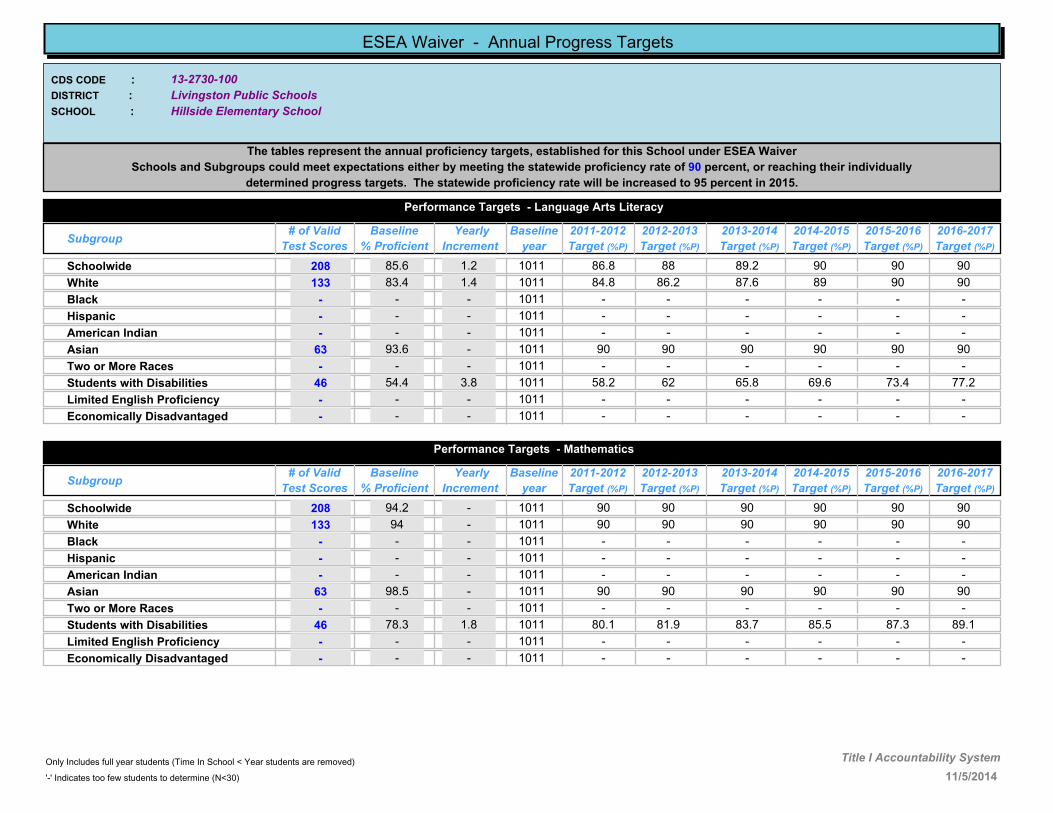
13-2730-100
Hillside Elementary School
Livingston Public Schools
CDS CODE :
DISTRICT :
SCHOOL :
ESEA Waiver - Annual Progress Targets
The tables represent the annual proficiency targets, established for this School under ESEA Waiver
Schools and Subgroups could meet expectations either by meeting the statewide proficiency rate of 90 percent, or reaching their individually
determined progress targets. The statewide proficiency rate will be increased to 95 percent in 2015.
Performance Targets - Language Arts Literacy
Subgroup# of Valid
Test Scores
Baseline
% Proficient
Yearly
Increment
2012-2013
Target (%P)
2011-2012
Target (%P)
2013-2014
Target (%P)
2014-2015
Target (%P)
2015-2016
Target (%P)
2016-2017
Target (%P)
Baseline
year
85.6 1.2 88 89.2 90 90 90Schoolwide 208 86.81011
83.4 1.4 86.2 87.6 89 90 90White 133 84.81011
- - - - - - -Black - -1011
- - - - - - -Hispanic - -1011
- - - - - - -American Indian - -1011
93.6 - 90 90 90 90 90Asian 63 901011
- - - - - - -Two or More Races - -1011
54.4 3.8 62 65.8 69.6 73.4 77.2Students with Disabilities 46 58.21011
- - - - - - -Limited English Proficiency - -1011
- - - - - - -Economically Disadvantaged - -1011
Performance Targets - Mathematics
Subgroup# of Valid
Test Scores
Baseline
% Proficient
Yearly
Increment
2012-2013
Target (%P)
2011-2012
Target (%P)
2013-2014
Target (%P)
2014-2015
Target (%P)
2015-2016
Target (%P)
2016-2017
Target (%P)
Baseline
year
94.2 - 90 90 90 90 90Schoolwide 208 901011
94 - 90 90 90 90 90White 133 901011
- - - - - - -Black - -1011
- - - - - - -Hispanic - -1011
- - - - - - -American Indian - -1011
98.5 - 90 90 90 90 90Asian 63 901011
- - - - - - -Two or More Races - -1011
78.3 1.8 81.9 83.7 85.5 87.3 89.1Students with Disabilities 46 80.11011
- - - - - - -Limited English Proficiency - -1011
- - - - - - -Economically Disadvantaged - -1011
11/5/2014
Only Includes full year students (Time In School < Year students are removed)
'-' Indicates too few students to determine (N<30)
Title I Accountability System

13-2730-110
Mount Pleasant Elementary School
Livingston Public Schools
CDS CODE :
DISTRICT :
SCHOOL :
ESEA Waiver - Annual Progress Targets
The tables represent the annual proficiency targets, established for this School under ESEA Waiver
Schools and Subgroups could meet expectations either by meeting the statewide proficiency rate of 90 percent, or reaching their individually
determined progress targets. The statewide proficiency rate will be increased to 95 percent in 2015.
Performance Targets - Language Arts Literacy
Subgroup# of Valid
Test Scores
Baseline
% Proficient
Yearly
Increment
2012-2013
Target (%P)
2011-2012
Target (%P)
2013-2014
Target (%P)
2014-2015
Target (%P)
2015-2016
Target (%P)
2016-2017
Target (%P)
Baseline
year
77.5 1.9 81.3 83.2 85.1 87 88.9Schoolwide 222 79.41011
72.9 2.3 77.5 79.8 82.1 84.4 86.7White 155 75.21011
- - - - - - -Black - -1011
- - - - - - -Hispanic - -1011
- - - - - - -American Indian - -1011
91.4 - 90 90 90 90 90Asian 58 901011
- - - - - - -Two or More Races - -1011
40.5 5 50.5 55.5 60.5 65.5 70.5Students with Disabilities 42 45.51011
- - - - - - -Limited English Proficiency - -1011
- - - - - - -Economically Disadvantaged - -1011
Performance Targets - Mathematics
Subgroup# of Valid
Test Scores
Baseline
% Proficient
Yearly
Increment
2012-2013
Target (%P)
2011-2012
Target (%P)
2013-2014
Target (%P)
2014-2015
Target (%P)
2015-2016
Target (%P)
2016-2017
Target (%P)
Baseline
year
94.2 - 90 90 90 90 90Schoolwide 222 901011
93.5 - 90 90 90 90 90White 155 901011
- - - - - - -Black - -1011
- - - - - - -Hispanic - -1011
- - - - - - -American Indian - -1011
98.2 - 90 90 90 90 90Asian 58 901011
- - - - - - -Two or More Races - -1011
73.8 2.2 78.2 80.4 82.6 84.8 87Students with Disabilities 42 761011
- - - - - - -Limited English Proficiency - -1011
- - - - - - -Economically Disadvantaged - -1011
11/5/2014
Only Includes full year students (Time In School < Year students are removed)
'-' Indicates too few students to determine (N<30)
Title I Accountability System
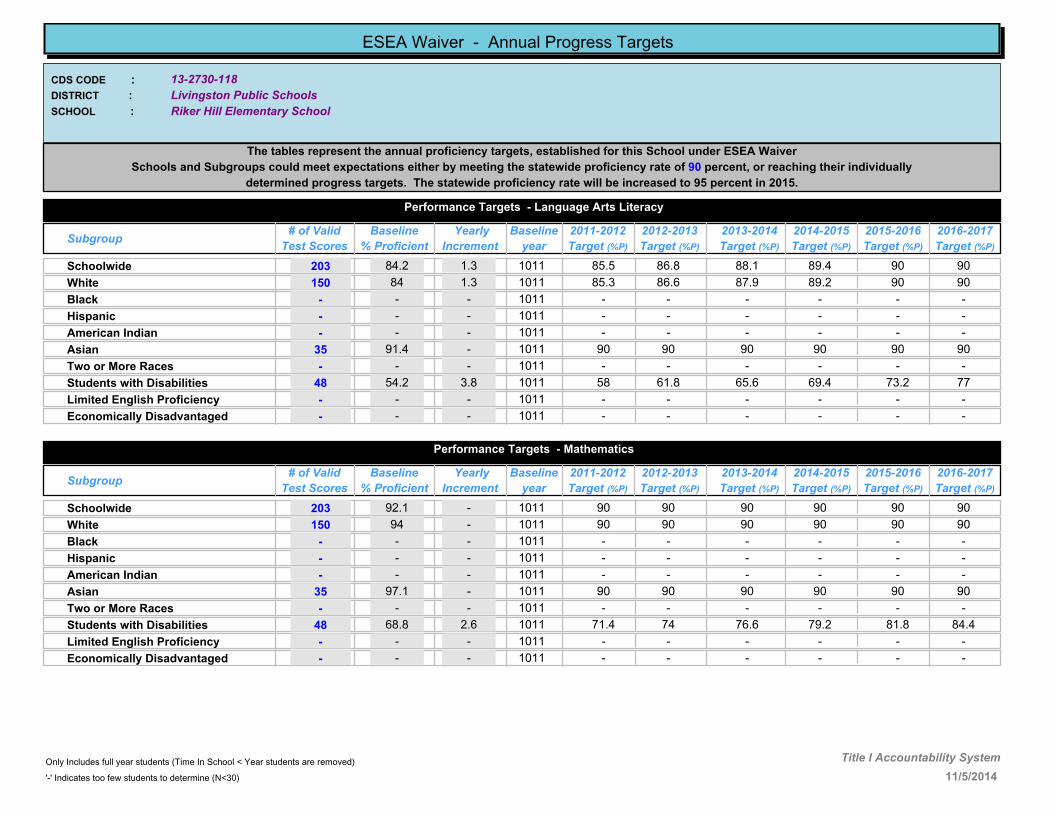
13-2730-118
Riker Hill Elementary School
Livingston Public Schools
CDS CODE :
DISTRICT :
SCHOOL :
ESEA Waiver - Annual Progress Targets
The tables represent the annual proficiency targets, established for this School under ESEA Waiver
Schools and Subgroups could meet expectations either by meeting the statewide proficiency rate of 90 percent, or reaching their individually
determined progress targets. The statewide proficiency rate will be increased to 95 percent in 2015.
Performance Targets - Language Arts Literacy
Subgroup# of Valid
Test Scores
Baseline
% Proficient
Yearly
Increment
2012-2013
Target (%P)
2011-2012
Target (%P)
2013-2014
Target (%P)
2014-2015
Target (%P)
2015-2016
Target (%P)
2016-2017
Target (%P)
Baseline
year
84.2 1.3 86.8 88.1 89.4 90 90Schoolwide 203 85.51011
84 1.3 86.6 87.9 89.2 90 90White 150 85.31011
- - - - - - -Black - -1011
- - - - - - -Hispanic - -1011
- - - - - - -American Indian - -1011
91.4 - 90 90 90 90 90Asian 35 901011
- - - - - - -Two or More Races - -1011
54.2 3.8 61.8 65.6 69.4 73.2 77Students with Disabilities 48 581011
- - - - - - -Limited English Proficiency - -1011
- - - - - - -Economically Disadvantaged - -1011
Performance Targets - Mathematics
Subgroup# of Valid
Test Scores
Baseline
% Proficient
Yearly
Increment
2012-2013
Target (%P)
2011-2012
Target (%P)
2013-2014
Target (%P)
2014-2015
Target (%P)
2015-2016
Target (%P)
2016-2017
Target (%P)
Baseline
year
92.1 - 90 90 90 90 90Schoolwide 203 901011
94 - 90 90 90 90 90White 150 901011
- - - - - - -Black - -1011
- - - - - - -Hispanic - -1011
- - - - - - -American Indian - -1011
97.1 - 90 90 90 90 90Asian 35 901011
- - - - - - -Two or More Races - -1011
68.8 2.6 74 76.6 79.2 81.8 84.4Students with Disabilities 48 71.41011
- - - - - - -Limited English Proficiency - -1011
- - - - - - -Economically Disadvantaged - -1011
11/5/2014
Only Includes full year students (Time In School < Year students are removed)
'-' Indicates too few students to determine (N<30)
Title I Accountability System

13-3190-050
Millburn High School
Millburn Township Schools
CDS CODE :
DISTRICT :
SCHOOL :
ESEA Waiver - Annual Progress Targets
The tables represent the annual proficiency targets, established for this School under ESEA Waiver
Schools and Subgroups could meet expectations either by meeting the statewide proficiency rate of 90 percent, or reaching their individually
determined progress targets. The statewide proficiency rate will be increased to 95 percent in 2015.
Performance Targets - Language Arts Literacy
Subgroup# of Valid
Test Scores
Baseline
% Proficient
Yearly
Increment
2012-2013
Target (%P)
2011-2012
Target (%P)
2013-2014
Target (%P)
2014-2015
Target (%P)
2015-2016
Target (%P)
2016-2017
Target (%P)
Baseline
year
98.1 - 90 90 90 90 90Schoolwide 379 901011
98 - 90 90 90 90 90White 304 901011
- - - - - - -Black - -1011
- - - - - - -Hispanic - -1011
- - - - - - -American Indian - -1011
98.2 - 90 90 90 90 90Asian 57 901011
- - - - - - -Two or More Races - -1011
88.6 1 90 90 90 90 90Students with Disabilities 53 89.61011
- - - - - - -Limited English Proficiency - -1011
- - - - - - -Economically Disadvantaged - -1011
Performance Targets - Mathematics
Subgroup# of Valid
Test Scores
Baseline
% Proficient
Yearly
Increment
2012-2013
Target (%P)
2011-2012
Target (%P)
2013-2014
Target (%P)
2014-2015
Target (%P)
2015-2016
Target (%P)
2016-2017
Target (%P)
Baseline
year
97.1 - 90 90 90 90 90Schoolwide 379 901011
97 - 90 90 90 90 90White 304 901011
- - - - - - -Black - -1011
- - - - - - -Hispanic - -1011
- - - - - - -American Indian - -1011
98.2 - 90 90 90 90 90Asian 57 901011
- - - - - - -Two or More Races - -1011
83 1.4 85.8 87.2 88.6 90 90Students with Disabilities 53 84.41011
- - - - - - -Limited English Proficiency - -1011
- - - - - - -Economically Disadvantaged - -1011
11/5/2014
Only Includes full year students (Time In School < Year students are removed)
'-' Indicates too few students to determine (N<30)
Title I Accountability System

13-3190-060
Millburn Middle School
Millburn Township Schools
CDS CODE :
DISTRICT :
SCHOOL :
ESEA Waiver - Annual Progress Targets
The tables represent the annual proficiency targets, established for this School under ESEA Waiver
Schools and Subgroups could meet expectations either by meeting the statewide proficiency rate of 90 percent, or reaching their individually
determined progress targets. The statewide proficiency rate will be increased to 95 percent in 2015.
Performance Targets - Language Arts Literacy
Subgroup# of Valid
Test Scores
Baseline
% Proficient
Yearly
Increment
2012-2013
Target (%P)
2011-2012
Target (%P)
2013-2014
Target (%P)
2014-2015
Target (%P)
2015-2016
Target (%P)
2016-2017
Target (%P)
Baseline
year
90.4 - 90 90 90 90 90Schoolwide 1108 901011
90.6 - 90 90 90 90 90White 864 901011
- - - - - - -Black - -1011
- - - - - - -Hispanic - -1011
- - - - - - -American Indian - -1011
92.8 - 90 90 90 90 90Asian 194 901011
- - - - - - -Two or More Races - -1011
58.6 3.5 65.6 69.1 72.6 76.1 79.6Students with Disabilities 150 62.11011
- - - - - - -Limited English Proficiency - -1011
- - - - - - -Economically Disadvantaged - -1011
Performance Targets - Mathematics
Subgroup# of Valid
Test Scores
Baseline
% Proficient
Yearly
Increment
2012-2013
Target (%P)
2011-2012
Target (%P)
2013-2014
Target (%P)
2014-2015
Target (%P)
2015-2016
Target (%P)
2016-2017
Target (%P)
Baseline
year
92.2 - 90 90 90 90 90Schoolwide 1107 901011
92.3 - 90 90 90 90 90White 863 901011
- - - - - - -Black - -1011
- - - - - - -Hispanic - -1011
- - - - - - -American Indian - -1011
97.4 - 90 90 90 90 90Asian 194 901011
- - - - - - -Two or More Races - -1011
65.1 2.9 70.9 73.8 76.7 79.6 82.5Students with Disabilities 149 681011
- - - - - - -Limited English Proficiency - -1011
- - - - - - -Economically Disadvantaged - -1011
11/5/2014
Only Includes full year students (Time In School < Year students are removed)
'-' Indicates too few students to determine (N<30)
Title I Accountability System
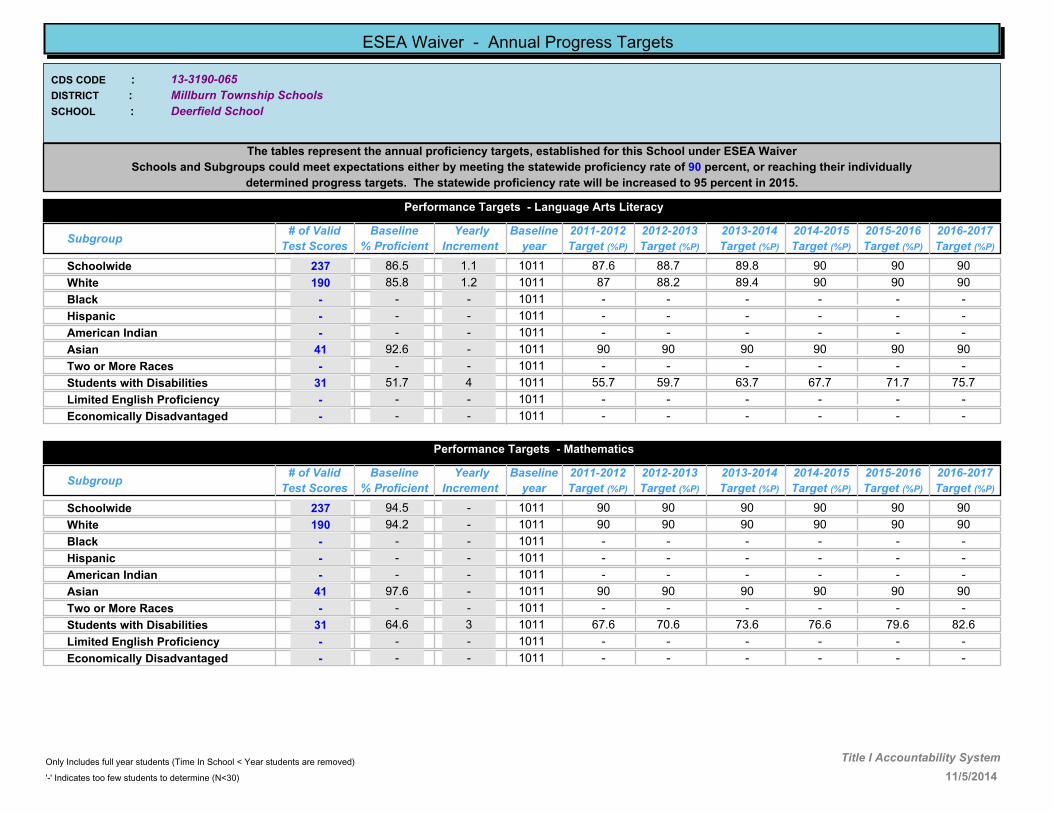
13-3190-065
Deerfield School
Millburn Township Schools
CDS CODE :
DISTRICT :
SCHOOL :
ESEA Waiver - Annual Progress Targets
The tables represent the annual proficiency targets, established for this School under ESEA Waiver
Schools and Subgroups could meet expectations either by meeting the statewide proficiency rate of 90 percent, or reaching their individually
determined progress targets. The statewide proficiency rate will be increased to 95 percent in 2015.
Performance Targets - Language Arts Literacy
Subgroup# of Valid
Test Scores
Baseline
% Proficient
Yearly
Increment
2012-2013
Target (%P)
2011-2012
Target (%P)
2013-2014
Target (%P)
2014-2015
Target (%P)
2015-2016
Target (%P)
2016-2017
Target (%P)
Baseline
year
86.5 1.1 88.7 89.8 90 90 90Schoolwide 237 87.61011
85.8 1.2 88.2 89.4 90 90 90White 190 871011
- - - - - - -Black - -1011
- - - - - - -Hispanic - -1011
- - - - - - -American Indian - -1011
92.6 - 90 90 90 90 90Asian 41 901011
- - - - - - -Two or More Races - -1011
51.7 4 59.7 63.7 67.7 71.7 75.7Students with Disabilities 31 55.71011
- - - - - - -Limited English Proficiency - -1011
- - - - - - -Economically Disadvantaged - -1011
Performance Targets - Mathematics
Subgroup# of Valid
Test Scores
Baseline
% Proficient
Yearly
Increment
2012-2013
Target (%P)
2011-2012
Target (%P)
2013-2014
Target (%P)
2014-2015
Target (%P)
2015-2016
Target (%P)
2016-2017
Target (%P)
Baseline
year
94.5 - 90 90 90 90 90Schoolwide 237 901011
94.2 - 90 90 90 90 90White 190 901011
- - - - - - -Black - -1011
- - - - - - -Hispanic - -1011
- - - - - - -American Indian - -1011
97.6 - 90 90 90 90 90Asian 41 901011
- - - - - - -Two or More Races - -1011
64.6 3 70.6 73.6 76.6 79.6 82.6Students with Disabilities 31 67.61011
- - - - - - -Limited English Proficiency - -1011
- - - - - - -Economically Disadvantaged - -1011
11/5/2014
Only Includes full year students (Time In School < Year students are removed)
'-' Indicates too few students to determine (N<30)
Title I Accountability System
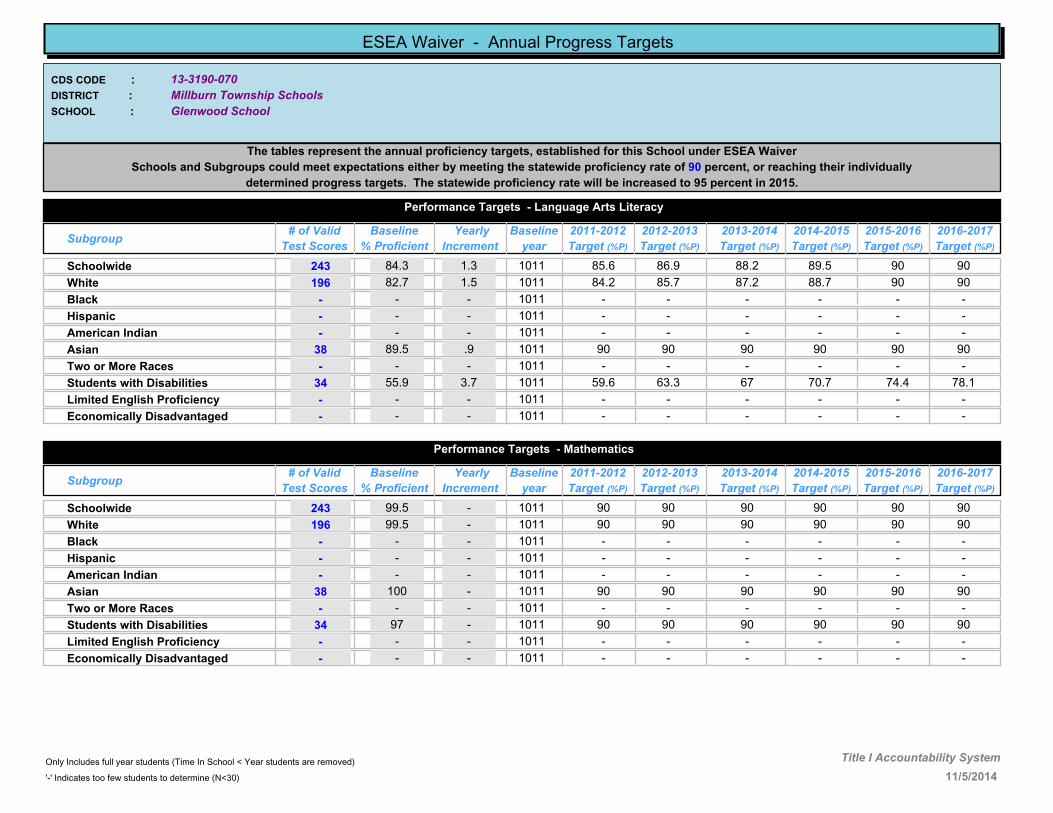
13-3190-070
Glenwood School
Millburn Township Schools
CDS CODE :
DISTRICT :
SCHOOL :
ESEA Waiver - Annual Progress Targets
The tables represent the annual proficiency targets, established for this School under ESEA Waiver
Schools and Subgroups could meet expectations either by meeting the statewide proficiency rate of 90 percent, or reaching their individually
determined progress targets. The statewide proficiency rate will be increased to 95 percent in 2015.
Performance Targets - Language Arts Literacy
Subgroup# of Valid
Test Scores
Baseline
% Proficient
Yearly
Increment
2012-2013
Target (%P)
2011-2012
Target (%P)
2013-2014
Target (%P)
2014-2015
Target (%P)
2015-2016
Target (%P)
2016-2017
Target (%P)
Baseline
year
84.3 1.3 86.9 88.2 89.5 90 90Schoolwide 243 85.61011
82.7 1.5 85.7 87.2 88.7 90 90White 196 84.21011
- - - - - - -Black - -1011
- - - - - - -Hispanic - -1011
- - - - - - -American Indian - -1011
89.5 .9 90 90 90 90 90Asian 38 901011
- - - - - - -Two or More Races - -1011
55.9 3.7 63.3 67 70.7 74.4 78.1Students with Disabilities 34 59.61011
- - - - - - -Limited English Proficiency - -1011
- - - - - - -Economically Disadvantaged - -1011
Performance Targets - Mathematics
Subgroup# of Valid
Test Scores
Baseline
% Proficient
Yearly
Increment
2012-2013
Target (%P)
2011-2012
Target (%P)
2013-2014
Target (%P)
2014-2015
Target (%P)
2015-2016
Target (%P)
2016-2017
Target (%P)
Baseline
year
99.5 - 90 90 90 90 90Schoolwide 243 901011
99.5 - 90 90 90 90 90White 196 901011
- - - - - - -Black - -1011
- - - - - - -Hispanic - -1011
- - - - - - -American Indian - -1011
100 - 90 90 90 90 90Asian 38 901011
- - - - - - -Two or More Races - -1011
97 - 90 90 90 90 90Students with Disabilities 34 901011
- - - - - - -Limited English Proficiency - -1011
- - - - - - -Economically Disadvantaged - -1011
11/5/2014
Only Includes full year students (Time In School < Year students are removed)
'-' Indicates too few students to determine (N<30)
Title I Accountability System
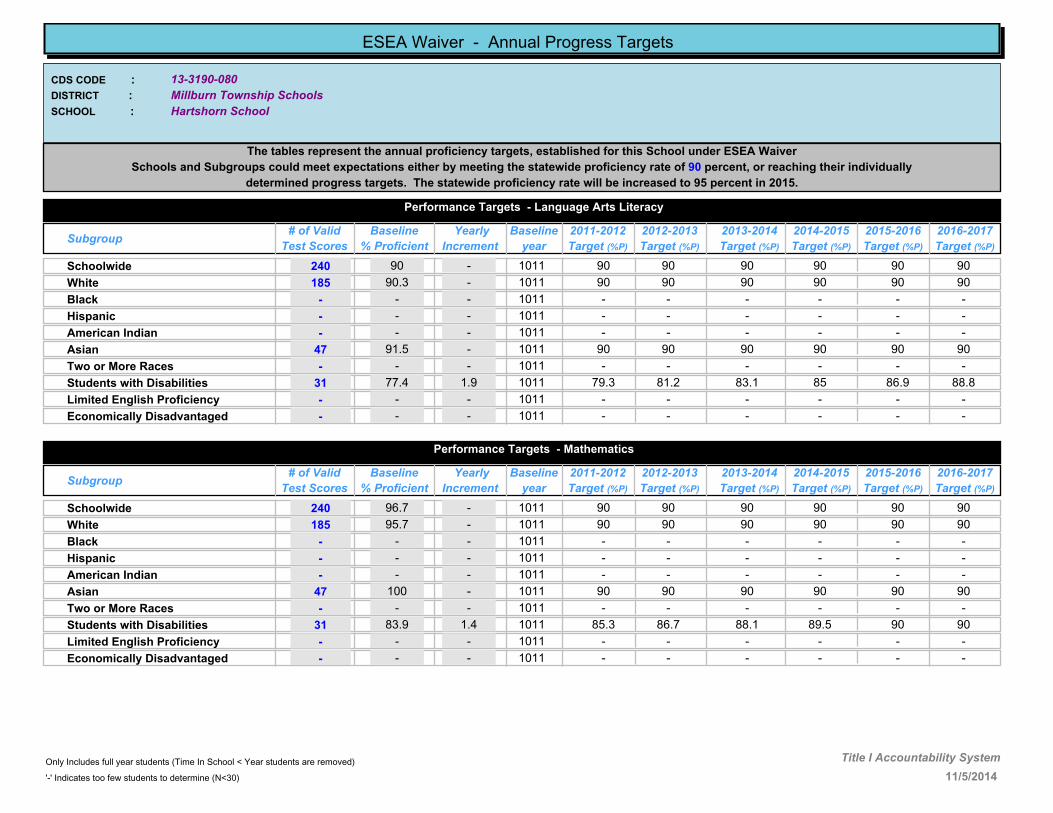
13-3190-080
Hartshorn School
Millburn Township Schools
CDS CODE :
DISTRICT :
SCHOOL :
ESEA Waiver - Annual Progress Targets
The tables represent the annual proficiency targets, established for this School under ESEA Waiver
Schools and Subgroups could meet expectations either by meeting the statewide proficiency rate of 90 percent, or reaching their individually
determined progress targets. The statewide proficiency rate will be increased to 95 percent in 2015.
Performance Targets - Language Arts Literacy
Subgroup# of Valid
Test Scores
Baseline
% Proficient
Yearly
Increment
2012-2013
Target (%P)
2011-2012
Target (%P)
2013-2014
Target (%P)
2014-2015
Target (%P)
2015-2016
Target (%P)
2016-2017
Target (%P)
Baseline
year
90 - 90 90 90 90 90Schoolwide 240 901011
90.3 - 90 90 90 90 90White 185 901011
- - - - - - -Black - -1011
- - - - - - -Hispanic - -1011
- - - - - - -American Indian - -1011
91.5 - 90 90 90 90 90Asian 47 901011
- - - - - - -Two or More Races - -1011
77.4 1.9 81.2 83.1 85 86.9 88.8Students with Disabilities 31 79.31011
- - - - - - -Limited English Proficiency - -1011
- - - - - - -Economically Disadvantaged - -1011
Performance Targets - Mathematics
Subgroup# of Valid
Test Scores
Baseline
% Proficient
Yearly
Increment
2012-2013
Target (%P)
2011-2012
Target (%P)
2013-2014
Target (%P)
2014-2015
Target (%P)
2015-2016
Target (%P)
2016-2017
Target (%P)
Baseline
year
96.7 - 90 90 90 90 90Schoolwide 240 901011
95.7 - 90 90 90 90 90White 185 901011
- - - - - - -Black - -1011
- - - - - - -Hispanic - -1011
- - - - - - -American Indian - -1011
100 - 90 90 90 90 90Asian 47 901011
- - - - - - -Two or More Races - -1011
83.9 1.4 86.7 88.1 89.5 90 90Students with Disabilities 31 85.31011
- - - - - - -Limited English Proficiency - -1011
- - - - - - -Economically Disadvantaged - -1011
11/5/2014
Only Includes full year students (Time In School < Year students are removed)
'-' Indicates too few students to determine (N<30)
Title I Accountability System
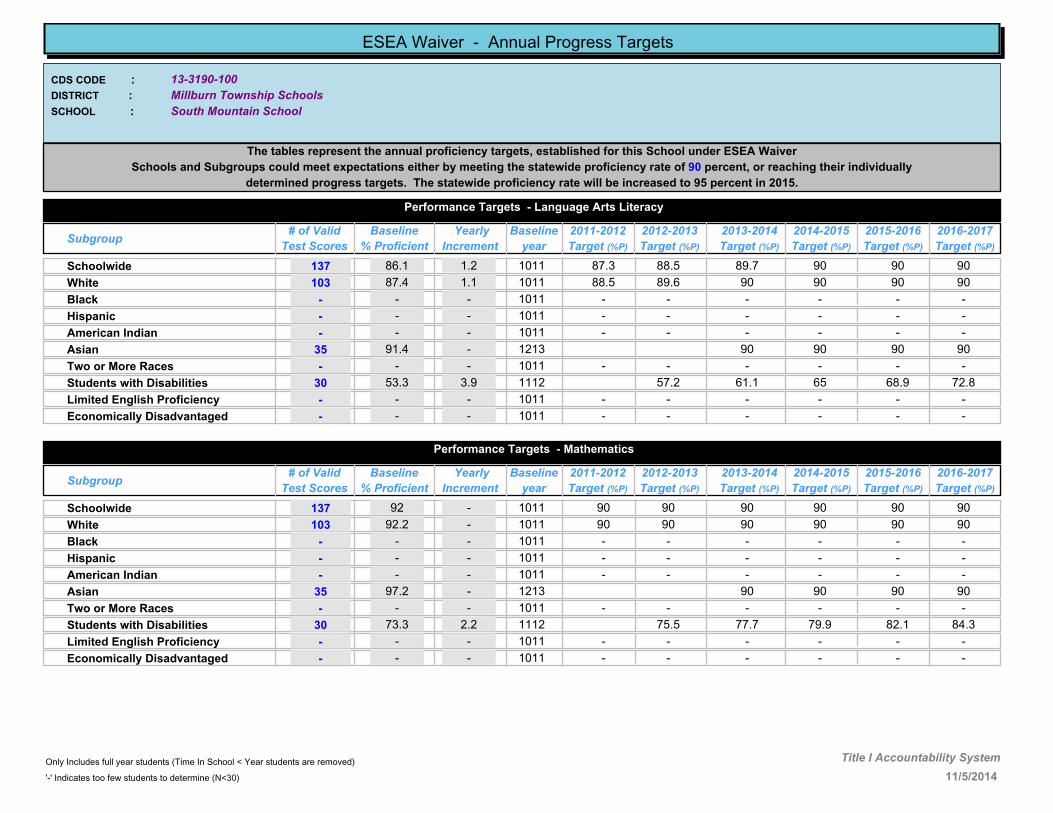
13-3190-100
South Mountain School
Millburn Township Schools
CDS CODE :
DISTRICT :
SCHOOL :
ESEA Waiver - Annual Progress Targets
The tables represent the annual proficiency targets, established for this School under ESEA Waiver
Schools and Subgroups could meet expectations either by meeting the statewide proficiency rate of 90 percent, or reaching their individually
determined progress targets. The statewide proficiency rate will be increased to 95 percent in 2015.
Performance Targets - Language Arts Literacy
Subgroup# of Valid
Test Scores
Baseline
% Proficient
Yearly
Increment
2012-2013
Target (%P)
2011-2012
Target (%P)
2013-2014
Target (%P)
2014-2015
Target (%P)
2015-2016
Target (%P)
2016-2017
Target (%P)
Baseline
year
86.1 1.2 88.5 89.7 90 90 90Schoolwide 137 87.31011
87.4 1.1 89.6 90 90 90 90White 103 88.51011
- - - - - - -Black - -1011
- - - - - - -Hispanic - -1011
- - - - - - -American Indian - -1011
91.4 - 90 90 90 90Asian 35 1213
- - - - - - -Two or More Races - -1011
53.3 3.9 57.2 61.1 65 68.9 72.8Students with Disabilities 30 1112
- - - - - - -Limited English Proficiency - -1011
- - - - - - -Economically Disadvantaged - -1011
Performance Targets - Mathematics
Subgroup# of Valid
Test Scores
Baseline
% Proficient
Yearly
Increment
2012-2013
Target (%P)
2011-2012
Target (%P)
2013-2014
Target (%P)
2014-2015
Target (%P)
2015-2016
Target (%P)
2016-2017
Target (%P)
Baseline
year
92 - 90 90 90 90 90Schoolwide 137 901011
92.2 - 90 90 90 90 90White 103 901011
- - - - - - -Black - -1011
- - - - - - -Hispanic - -1011
- - - - - - -American Indian - -1011
97.2 - 90 90 90 90Asian 35 1213
- - - - - - -Two or More Races - -1011
73.3 2.2 75.5 77.7 79.9 82.1 84.3Students with Disabilities 30 1112
- - - - - - -Limited English Proficiency - -1011
- - - - - - -Economically Disadvantaged - -1011
11/5/2014
Only Includes full year students (Time In School < Year students are removed)
'-' Indicates too few students to determine (N<30)
Title I Accountability System
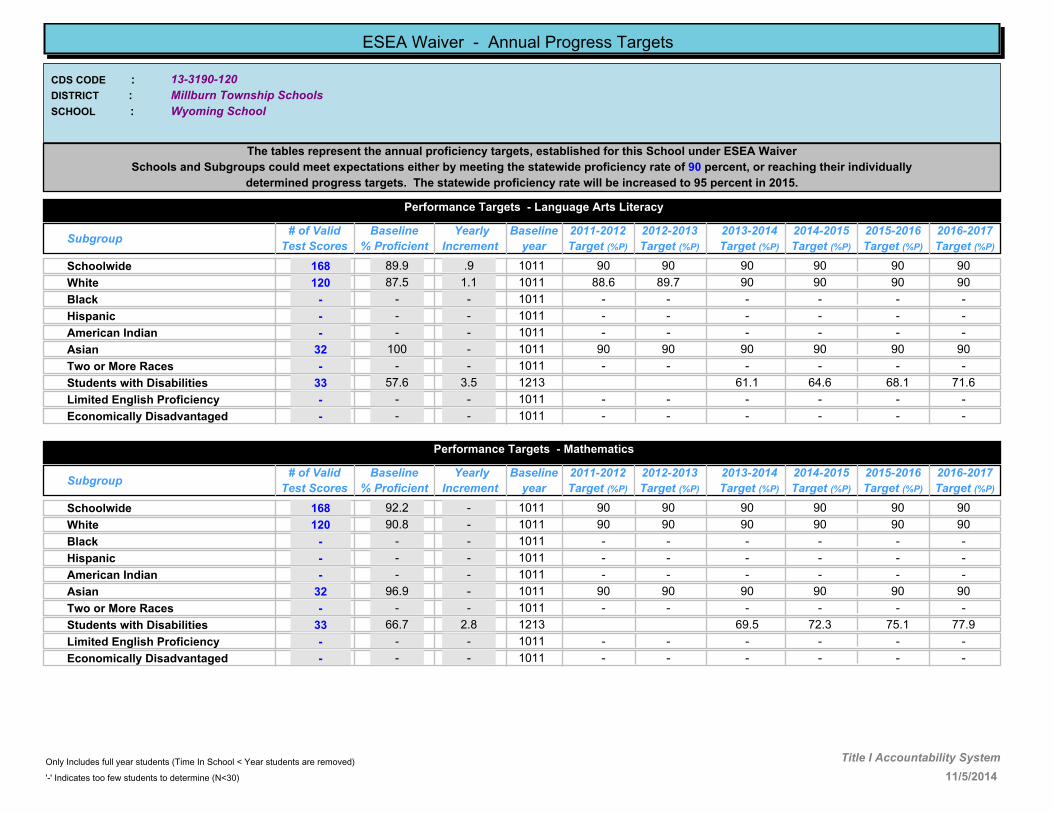
13-3190-120
Wyoming School
Millburn Township Schools
CDS CODE :
DISTRICT :
SCHOOL :
ESEA Waiver - Annual Progress Targets
The tables represent the annual proficiency targets, established for this School under ESEA Waiver
Schools and Subgroups could meet expectations either by meeting the statewide proficiency rate of 90 percent, or reaching their individually
determined progress targets. The statewide proficiency rate will be increased to 95 percent in 2015.
Performance Targets - Language Arts Literacy
Subgroup# of Valid
Test Scores
Baseline
% Proficient
Yearly
Increment
2012-2013
Target (%P)
2011-2012
Target (%P)
2013-2014
Target (%P)
2014-2015
Target (%P)
2015-2016
Target (%P)
2016-2017
Target (%P)
Baseline
year
89.9 .9 90 90 90 90 90Schoolwide 168 901011
87.5 1.1 89.7 90 90 90 90White 120 88.61011
- - - - - - -Black - -1011
- - - - - - -Hispanic - -1011
- - - - - - -American Indian - -1011
100 - 90 90 90 90 90Asian 32 901011
- - - - - - -Two or More Races - -1011
57.6 3.5 61.1 64.6 68.1 71.6Students with Disabilities 33 1213
- - - - - - -Limited English Proficiency - -1011
- - - - - - -Economically Disadvantaged - -1011
Performance Targets - Mathematics
Subgroup# of Valid
Test Scores
Baseline
% Proficient
Yearly
Increment
2012-2013
Target (%P)
2011-2012
Target (%P)
2013-2014
Target (%P)
2014-2015
Target (%P)
2015-2016
Target (%P)
2016-2017
Target (%P)
Baseline
year
92.2 - 90 90 90 90 90Schoolwide 168 901011
90.8 - 90 90 90 90 90White 120 901011
- - - - - - -Black - -1011
- - - - - - -Hispanic - -1011
- - - - - - -American Indian - -1011
96.9 - 90 90 90 90 90Asian 32 901011
- - - - - - -Two or More Races - -1011
66.7 2.8 69.5 72.3 75.1 77.9Students with Disabilities 33 1213
- - - - - - -Limited English Proficiency - -1011
- - - - - - -Economically Disadvantaged - -1011
11/5/2014
Only Includes full year students (Time In School < Year students are removed)
'-' Indicates too few students to determine (N<30)
Title I Accountability System
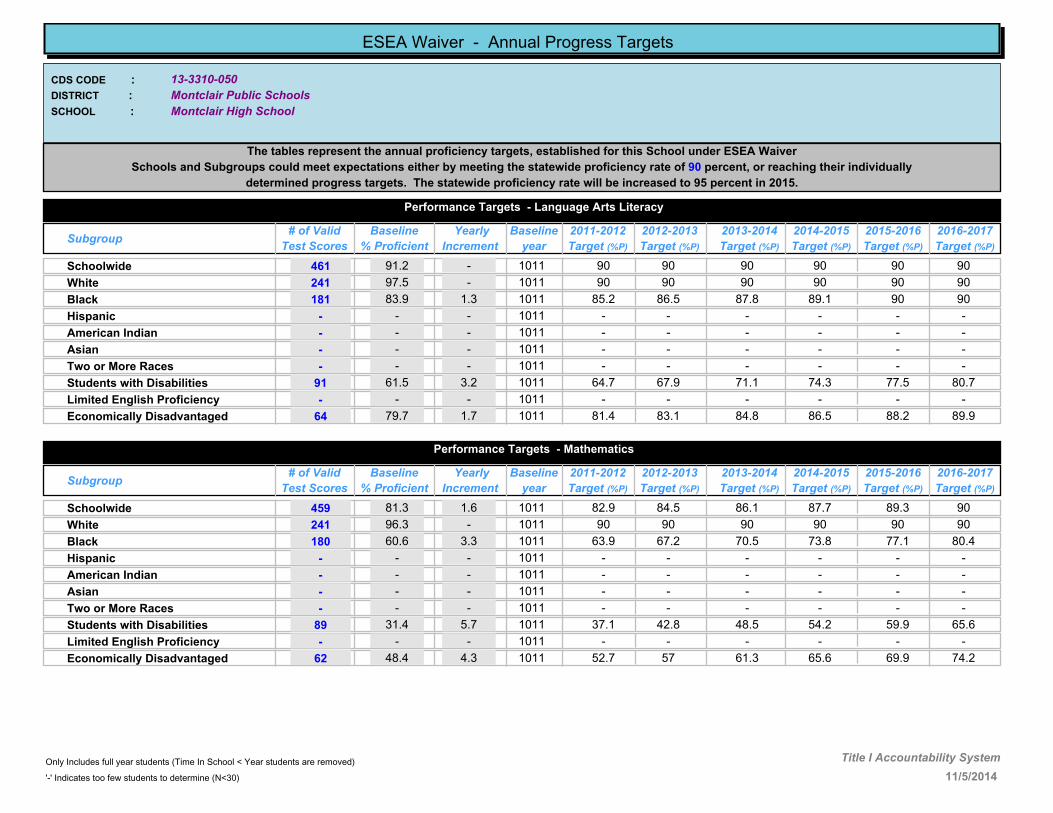
13-3310-050
Montclair High School
Montclair Public Schools
CDS CODE :
DISTRICT :
SCHOOL :
ESEA Waiver - Annual Progress Targets
The tables represent the annual proficiency targets, established for this School under ESEA Waiver
Schools and Subgroups could meet expectations either by meeting the statewide proficiency rate of 90 percent, or reaching their individually
determined progress targets. The statewide proficiency rate will be increased to 95 percent in 2015.
Performance Targets - Language Arts Literacy
Subgroup# of Valid
Test Scores
Baseline
% Proficient
Yearly
Increment
2012-2013
Target (%P)
2011-2012
Target (%P)
2013-2014
Target (%P)
2014-2015
Target (%P)
2015-2016
Target (%P)
2016-2017
Target (%P)
Baseline
year
91.2 - 90 90 90 90 90Schoolwide 461 901011
97.5 - 90 90 90 90 90White 241 901011
83.9 1.3 86.5 87.8 89.1 90 90Black 181 85.21011
- - - - - - -Hispanic - -1011
- - - - - - -American Indian - -1011
- - - - - - -Asian - -1011
- - - - - - -Two or More Races - -1011
61.5 3.2 67.9 71.1 74.3 77.5 80.7Students with Disabilities 91 64.71011
- - - - - - -Limited English Proficiency - -1011
79.7 1.7 83.1 84.8 86.5 88.2 89.9Economically Disadvantaged 64 81.41011
Performance Targets - Mathematics
Subgroup# of Valid
Test Scores
Baseline
% Proficient
Yearly
Increment
2012-2013
Target (%P)
2011-2012
Target (%P)
2013-2014
Target (%P)
2014-2015
Target (%P)
2015-2016
Target (%P)
2016-2017
Target (%P)
Baseline
year
81.3 1.6 84.5 86.1 87.7 89.3 90Schoolwide 459 82.91011
96.3 - 90 90 90 90 90White 241 901011
60.6 3.3 67.2 70.5 73.8 77.1 80.4Black 180 63.91011
- - - - - - -Hispanic - -1011
- - - - - - -American Indian - -1011
- - - - - - -Asian - -1011
- - - - - - -Two or More Races - -1011
31.4 5.7 42.8 48.5 54.2 59.9 65.6Students with Disabilities 89 37.11011
- - - - - - -Limited English Proficiency - -1011
48.4 4.3 57 61.3 65.6 69.9 74.2Economically Disadvantaged 62 52.71011
11/5/2014
Only Includes full year students (Time In School < Year students are removed)
'-' Indicates too few students to determine (N<30)
Title I Accountability System

13-3310-060
Charles H. Bullock School
Montclair Public Schools
CDS CODE :
DISTRICT :
SCHOOL :
ESEA Waiver - Annual Progress Targets
The tables represent the annual proficiency targets, established for this School under ESEA Waiver
Schools and Subgroups could meet expectations either by meeting the statewide proficiency rate of 90 percent, or reaching their individually
determined progress targets. The statewide proficiency rate will be increased to 95 percent in 2015.
Performance Targets - Language Arts Literacy
Subgroup# of Valid
Test Scores
Baseline
% Proficient
Yearly
Increment
2012-2013
Target (%P)
2011-2012
Target (%P)
2013-2014
Target (%P)
2014-2015
Target (%P)
2015-2016
Target (%P)
2016-2017
Target (%P)
Baseline
year
65.6 2.9 71.4 74.3 77.2 80.1 83Schoolwide 137 68.51011
87.9 1 89.9 90 90 90 90White 58 88.91011
36.9 5.3 47.5 52.8 58.1 63.4 68.7Black 57 42.21011
- - - - - - -Hispanic - -1011
- - - - - - -American Indian - -1011
- - - - - - -Asian - -1011
- - - - - - -Two or More Races - -1011
39.5 5.1 49.7 54.8 59.9 65 70.1Students with Disabilities 38 44.61011
- - - - - - -Limited English Proficiency - -1011
29.7 5.9 41.5 47.4 53.3 59.2 65.1Economically Disadvantaged 37 35.61011
Performance Targets - Mathematics
Subgroup# of Valid
Test Scores
Baseline
% Proficient
Yearly
Increment
2012-2013
Target (%P)
2011-2012
Target (%P)
2013-2014
Target (%P)
2014-2015
Target (%P)
2015-2016
Target (%P)
2016-2017
Target (%P)
Baseline
year
82.5 1.5 85.5 87 88.5 90 90Schoolwide 137 841011
98.3 - 90 90 90 90 90White 58 901011
61.4 3.2 67.8 71 74.2 77.4 80.6Black 57 64.61011
- - - - - - -Hispanic - -1011
- - - - - - -American Indian - -1011
- - - - - - -Asian - -1011
- - - - - - -Two or More Races - -1011
76.3 2 80.3 82.3 84.3 86.3 88.3Students with Disabilities 38 78.31011
- - - - - - -Limited English Proficiency - -1011
56.7 3.6 63.9 67.5 71.1 74.7 78.3Economically Disadvantaged 37 60.31011
11/5/2014
Only Includes full year students (Time In School < Year students are removed)
'-' Indicates too few students to determine (N<30)
Title I Accountability System
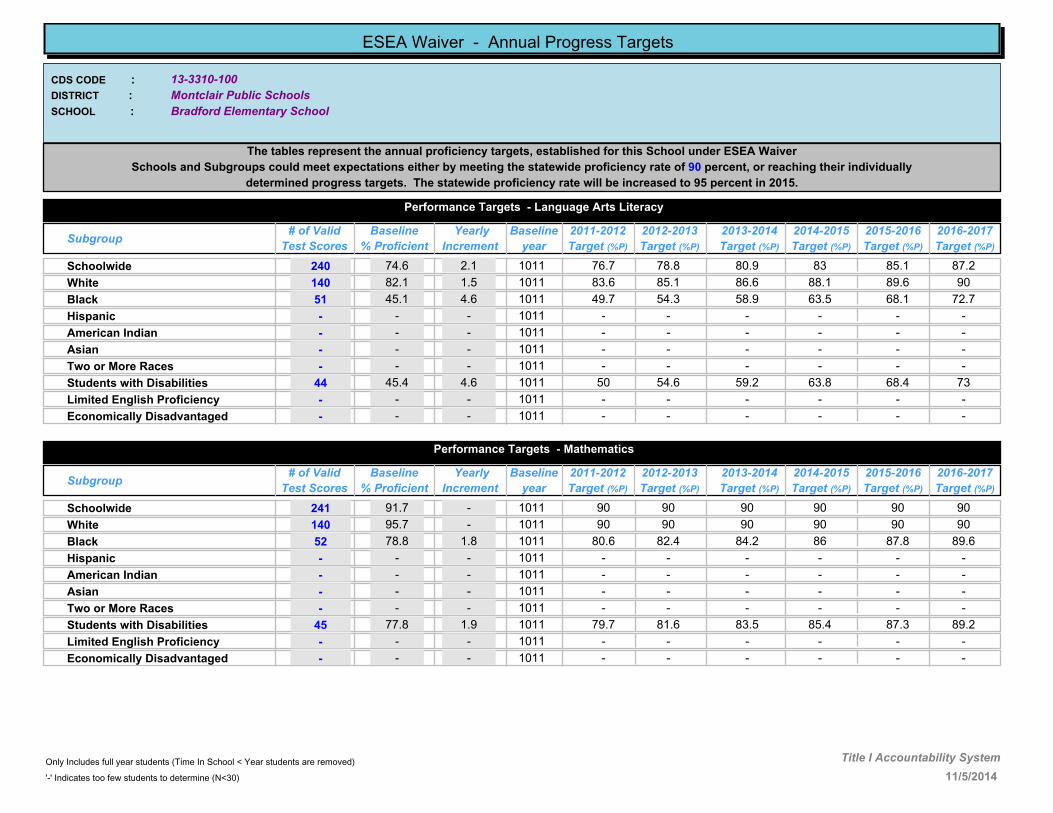
13-3310-100
Bradford Elementary School
Montclair Public Schools
CDS CODE :
DISTRICT :
SCHOOL :
ESEA Waiver - Annual Progress Targets
The tables represent the annual proficiency targets, established for this School under ESEA Waiver
Schools and Subgroups could meet expectations either by meeting the statewide proficiency rate of 90 percent, or reaching their individually
determined progress targets. The statewide proficiency rate will be increased to 95 percent in 2015.
Performance Targets - Language Arts Literacy
Subgroup# of Valid
Test Scores
Baseline
% Proficient
Yearly
Increment
2012-2013
Target (%P)
2011-2012
Target (%P)
2013-2014
Target (%P)
2014-2015
Target (%P)
2015-2016
Target (%P)
2016-2017
Target (%P)
Baseline
year
74.6 2.1 78.8 80.9 83 85.1 87.2Schoolwide 240 76.71011
82.1 1.5 85.1 86.6 88.1 89.6 90White 140 83.61011
45.1 4.6 54.3 58.9 63.5 68.1 72.7Black 51 49.71011
- - - - - - -Hispanic - -1011
- - - - - - -American Indian - -1011
- - - - - - -Asian - -1011
- - - - - - -Two or More Races - -1011
45.4 4.6 54.6 59.2 63.8 68.4 73Students with Disabilities 44 501011
- - - - - - -Limited English Proficiency - -1011
- - - - - - -Economically Disadvantaged - -1011
Performance Targets - Mathematics
Subgroup# of Valid
Test Scores
Baseline
% Proficient
Yearly
Increment
2012-2013
Target (%P)
2011-2012
Target (%P)
2013-2014
Target (%P)
2014-2015
Target (%P)
2015-2016
Target (%P)
2016-2017
Target (%P)
Baseline
year
91.7 - 90 90 90 90 90Schoolwide 241 901011
95.7 - 90 90 90 90 90White 140 901011
78.8 1.8 82.4 84.2 86 87.8 89.6Black 52 80.61011
- - - - - - -Hispanic - -1011
- - - - - - -American Indian - -1011
- - - - - - -Asian - -1011
- - - - - - -Two or More Races - -1011
77.8 1.9 81.6 83.5 85.4 87.3 89.2Students with Disabilities 45 79.71011
- - - - - - -Limited English Proficiency - -1011
- - - - - - -Economically Disadvantaged - -1011
11/5/2014
Only Includes full year students (Time In School < Year students are removed)
'-' Indicates too few students to determine (N<30)
Title I Accountability System

13-3310-110
Edgemont Elementary School
Montclair Public Schools
CDS CODE :
DISTRICT :
SCHOOL :
ESEA Waiver - Annual Progress Targets
The tables represent the annual proficiency targets, established for this School under ESEA Waiver
Schools and Subgroups could meet expectations either by meeting the statewide proficiency rate of 90 percent, or reaching their individually
determined progress targets. The statewide proficiency rate will be increased to 95 percent in 2015.
Performance Targets - Language Arts Literacy
Subgroup# of Valid
Test Scores
Baseline
% Proficient
Yearly
Increment
2012-2013
Target (%P)
2011-2012
Target (%P)
2013-2014
Target (%P)
2014-2015
Target (%P)
2015-2016
Target (%P)
2016-2017
Target (%P)
Baseline
year
79 1.8 82.6 84.4 86.2 88 89.8Schoolwide 129 80.81011
86.4 1.1 88.6 89.7 90 90 90White 59 87.51011
71.4 2.4 76.2 78.6 81 83.4 85.8Black 42 73.81011
- - - - - - -Hispanic - -1011
- - - - - - -American Indian - -1011
- - - - - - -Asian - -1011
- - - - - - -Two or More Races - -1011
- - - - - - -Students with Disabilities - -1011
- - - - - - -Limited English Proficiency - -1011
28.1 6 34.1 40.1 46.1 52.1Economically Disadvantaged 32 1213
Performance Targets - Mathematics
Subgroup# of Valid
Test Scores
Baseline
% Proficient
Yearly
Increment
2012-2013
Target (%P)
2011-2012
Target (%P)
2013-2014
Target (%P)
2014-2015
Target (%P)
2015-2016
Target (%P)
2016-2017
Target (%P)
Baseline
year
90.7 - 90 90 90 90 90Schoolwide 129 901011
93.2 - 90 90 90 90 90White 59 901011
85.7 1.2 88.1 89.3 90 90 90Black 42 86.91011
- - - - - - -Hispanic - -1011
- - - - - - -American Indian - -1011
- - - - - - -Asian - -1011
- - - - - - -Two or More Races - -1011
- - - - - - -Students with Disabilities - -1011
- - - - - - -Limited English Proficiency - -1011
56.3 3.7 60 63.7 67.4 71.1Economically Disadvantaged 32 1213
11/5/2014
Only Includes full year students (Time In School < Year students are removed)
'-' Indicates too few students to determine (N<30)
Title I Accountability System

13-3310-116
Glenfield Middle School
Montclair Public Schools
CDS CODE :
DISTRICT :
SCHOOL :
ESEA Waiver - Annual Progress Targets
The tables represent the annual proficiency targets, established for this School under ESEA Waiver
Schools and Subgroups could meet expectations either by meeting the statewide proficiency rate of 90 percent, or reaching their individually
determined progress targets. The statewide proficiency rate will be increased to 95 percent in 2015.
Performance Targets - Language Arts Literacy
Subgroup# of Valid
Test Scores
Baseline
% Proficient
Yearly
Increment
2012-2013
Target (%P)
2011-2012
Target (%P)
2013-2014
Target (%P)
2014-2015
Target (%P)
2015-2016
Target (%P)
2016-2017
Target (%P)
Baseline
year
84.1 1.3 86.7 88 89.3 90 90Schoolwide 692 85.41011
92.9 - 90 90 90 90 90White 399 901011
66.1 2.8 71.7 74.5 77.3 80.1 82.9Black 215 68.91011
87.6 1.1 89.8 90 90 90 90Hispanic 48 88.71011
- - - - - - -American Indian - -1011
88.6 1 89.6 90.6 91.6 92.6 93.6Asian 35 1112
- - - - - - -Two or More Races - -1011
46.4 4.5 55.4 59.9 64.4 68.9 73.4Students with Disabilities 97 50.91011
- - - - - - -Limited English Proficiency - -1011
61.1 3.3 67.7 71 74.3 77.6 80.9Economically Disadvantaged 108 64.41011
Performance Targets - Mathematics
Subgroup# of Valid
Test Scores
Baseline
% Proficient
Yearly
Increment
2012-2013
Target (%P)
2011-2012
Target (%P)
2013-2014
Target (%P)
2014-2015
Target (%P)
2015-2016
Target (%P)
2016-2017
Target (%P)
Baseline
year
79.9 1.7 83.3 85 86.7 88.4 90Schoolwide 692 81.61011
91 - 90 90 90 90 90White 399 901011
60 3.3 66.6 69.9 73.2 76.5 79.8Black 215 63.31011
70.8 2.4 75.6 78 80.4 82.8 85.2Hispanic 48 73.21011
- - - - - - -American Indian - -1011
91.5 - 90 90 90 90 90Asian 35 1112
- - - - - - -Two or More Races - -1011
34 5.5 45 50.5 56 61.5 67Students with Disabilities 97 39.51011
- - - - - - -Limited English Proficiency - -1011
54.6 3.8 62.2 66 69.8 73.6 77.4Economically Disadvantaged 108 58.41011
11/5/2014
Only Includes full year students (Time In School < Year students are removed)
'-' Indicates too few students to determine (N<30)
Title I Accountability System
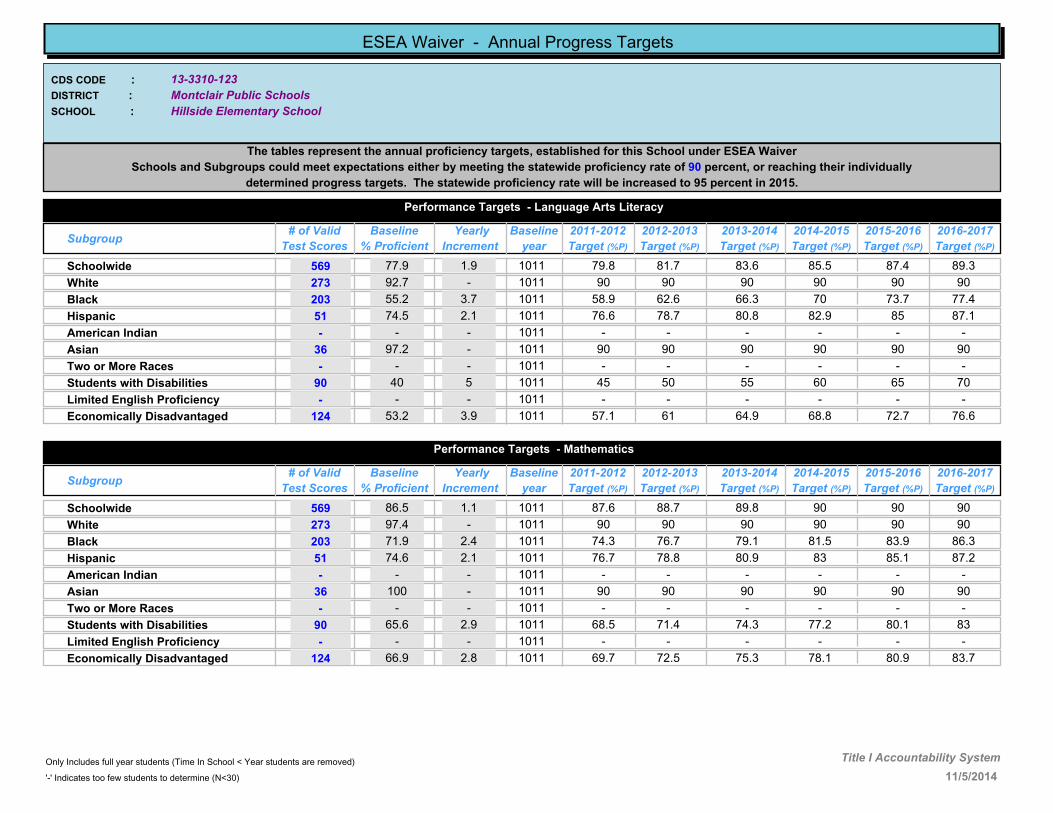
13-3310-123
Hillside Elementary School
Montclair Public Schools
CDS CODE :
DISTRICT :
SCHOOL :
ESEA Waiver - Annual Progress Targets
The tables represent the annual proficiency targets, established for this School under ESEA Waiver
Schools and Subgroups could meet expectations either by meeting the statewide proficiency rate of 90 percent, or reaching their individually
determined progress targets. The statewide proficiency rate will be increased to 95 percent in 2015.
Performance Targets - Language Arts Literacy
Subgroup# of Valid
Test Scores
Baseline
% Proficient
Yearly
Increment
2012-2013
Target (%P)
2011-2012
Target (%P)
2013-2014
Target (%P)
2014-2015
Target (%P)
2015-2016
Target (%P)
2016-2017
Target (%P)
Baseline
year
77.9 1.9 81.7 83.6 85.5 87.4 89.3Schoolwide 569 79.81011
92.7 - 90 90 90 90 90White 273 901011
55.2 3.7 62.6 66.3 70 73.7 77.4Black 203 58.91011
74.5 2.1 78.7 80.8 82.9 85 87.1Hispanic 51 76.61011
- - - - - - -American Indian - -1011
97.2 - 90 90 90 90 90Asian 36 901011
- - - - - - -Two or More Races - -1011
40 5 50 55 60 65 70Students with Disabilities 90 451011
- - - - - - -Limited English Proficiency - -1011
53.2 3.9 61 64.9 68.8 72.7 76.6Economically Disadvantaged 124 57.11011
Performance Targets - Mathematics
Subgroup# of Valid
Test Scores
Baseline
% Proficient
Yearly
Increment
2012-2013
Target (%P)
2011-2012
Target (%P)
2013-2014
Target (%P)
2014-2015
Target (%P)
2015-2016
Target (%P)
2016-2017
Target (%P)
Baseline
year
86.5 1.1 88.7 89.8 90 90 90Schoolwide 569 87.61011
97.4 - 90 90 90 90 90White 273 901011
71.9 2.4 76.7 79.1 81.5 83.9 86.3Black 203 74.31011
74.6 2.1 78.8 80.9 83 85.1 87.2Hispanic 51 76.71011
- - - - - - -American Indian - -1011
100 - 90 90 90 90 90Asian 36 901011
- - - - - - -Two or More Races - -1011
65.6 2.9 71.4 74.3 77.2 80.1 83Students with Disabilities 90 68.51011
- - - - - - -Limited English Proficiency - -1011
66.9 2.8 72.5 75.3 78.1 80.9 83.7Economically Disadvantaged 124 69.71011
11/5/2014
Only Includes full year students (Time In School < Year students are removed)
'-' Indicates too few students to determine (N<30)
Title I Accountability System
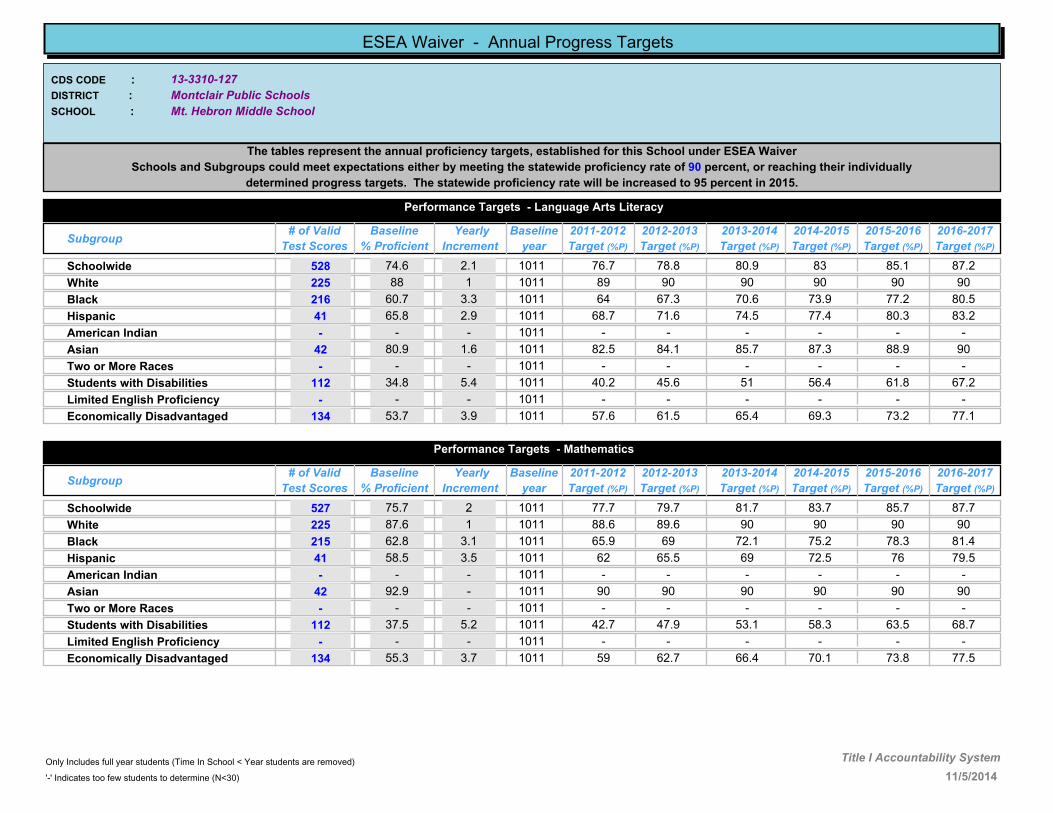
13-3310-127
Mt. Hebron Middle School
Montclair Public Schools
CDS CODE :
DISTRICT :
SCHOOL :
ESEA Waiver - Annual Progress Targets
The tables represent the annual proficiency targets, established for this School under ESEA Waiver
Schools and Subgroups could meet expectations either by meeting the statewide proficiency rate of 90 percent, or reaching their individually
determined progress targets. The statewide proficiency rate will be increased to 95 percent in 2015.
Performance Targets - Language Arts Literacy
Subgroup# of Valid
Test Scores
Baseline
% Proficient
Yearly
Increment
2012-2013
Target (%P)
2011-2012
Target (%P)
2013-2014
Target (%P)
2014-2015
Target (%P)
2015-2016
Target (%P)
2016-2017
Target (%P)
Baseline
year
74.6 2.1 78.8 80.9 83 85.1 87.2Schoolwide 528 76.71011
88 1 90 90 90 90 90White 225 891011
60.7 3.3 67.3 70.6 73.9 77.2 80.5Black 216 641011
65.8 2.9 71.6 74.5 77.4 80.3 83.2Hispanic 41 68.71011
- - - - - - -American Indian - -1011
80.9 1.6 84.1 85.7 87.3 88.9 90Asian 42 82.51011
- - - - - - -Two or More Races - -1011
34.8 5.4 45.6 51 56.4 61.8 67.2Students with Disabilities 112 40.21011
- - - - - - -Limited English Proficiency - -1011
53.7 3.9 61.5 65.4 69.3 73.2 77.1Economically Disadvantaged 134 57.61011
Performance Targets - Mathematics
Subgroup# of Valid
Test Scores
Baseline
% Proficient
Yearly
Increment
2012-2013
Target (%P)
2011-2012
Target (%P)
2013-2014
Target (%P)
2014-2015
Target (%P)
2015-2016
Target (%P)
2016-2017
Target (%P)
Baseline
year
75.7 2 79.7 81.7 83.7 85.7 87.7Schoolwide 527 77.71011
87.6 1 89.6 90 90 90 90White 225 88.61011
62.8 3.1 69 72.1 75.2 78.3 81.4Black 215 65.91011
58.5 3.5 65.5 69 72.5 76 79.5Hispanic 41 621011
- - - - - - -American Indian - -1011
92.9 - 90 90 90 90 90Asian 42 901011
- - - - - - -Two or More Races - -1011
37.5 5.2 47.9 53.1 58.3 63.5 68.7Students with Disabilities 112 42.71011
- - - - - - -Limited English Proficiency - -1011
55.3 3.7 62.7 66.4 70.1 73.8 77.5Economically Disadvantaged 134 591011
11/5/2014
Only Includes full year students (Time In School < Year students are removed)
'-' Indicates too few students to determine (N<30)
Title I Accountability System

13-3310-140
Northeast Elementary School
Montclair Public Schools
CDS CODE :
DISTRICT :
SCHOOL :
ESEA Waiver - Annual Progress Targets
The tables represent the annual proficiency targets, established for this School under ESEA Waiver
Schools and Subgroups could meet expectations either by meeting the statewide proficiency rate of 90 percent, or reaching their individually
determined progress targets. The statewide proficiency rate will be increased to 95 percent in 2015.
Performance Targets - Language Arts Literacy
Subgroup# of Valid
Test Scores
Baseline
% Proficient
Yearly
Increment
2012-2013
Target (%P)
2011-2012
Target (%P)
2013-2014
Target (%P)
2014-2015
Target (%P)
2015-2016
Target (%P)
2016-2017
Target (%P)
Baseline
year
74.5 2.1 78.7 80.8 82.9 85 87.1Schoolwide 208 76.61011
86.1 1.2 88.5 89.7 90 90 90White 108 87.31011
46.5 4.5 55.5 60 64.5 69 73.5Black 56 511011
- - - - - - -Hispanic - -1011
- - - - - - -American Indian - -1011
- - - - - - -Asian - -1011
- - - - - - -Two or More Races - -1011
56.6 3.6 63.8 67.4 71 74.6 78.2Students with Disabilities 30 60.21011
- - - - - - -Limited English Proficiency - -1011
38.9 5.1 49.1 54.2 59.3 64.4 69.5Economically Disadvantaged 36 441011
Performance Targets - Mathematics
Subgroup# of Valid
Test Scores
Baseline
% Proficient
Yearly
Increment
2012-2013
Target (%P)
2011-2012
Target (%P)
2013-2014
Target (%P)
2014-2015
Target (%P)
2015-2016
Target (%P)
2016-2017
Target (%P)
Baseline
year
89 .9 90 90 90 90 90Schoolwide 208 89.91011
92.6 - 90 90 90 90 90White 108 901011
80.4 1.6 83.6 85.2 86.8 88.4 90Black 56 821011
- - - - - - -Hispanic - -1011
- - - - - - -American Indian - -1011
- - - - - - -Asian - -1011
- - - - - - -Two or More Races - -1011
80 1.7 83.4 85.1 86.8 88.5 90Students with Disabilities 30 81.71011
- - - - - - -Limited English Proficiency - -1011
72.3 2.3 76.9 79.2 81.5 83.8 86.1Economically Disadvantaged 36 74.61011
11/5/2014
Only Includes full year students (Time In School < Year students are removed)
'-' Indicates too few students to determine (N<30)
Title I Accountability System
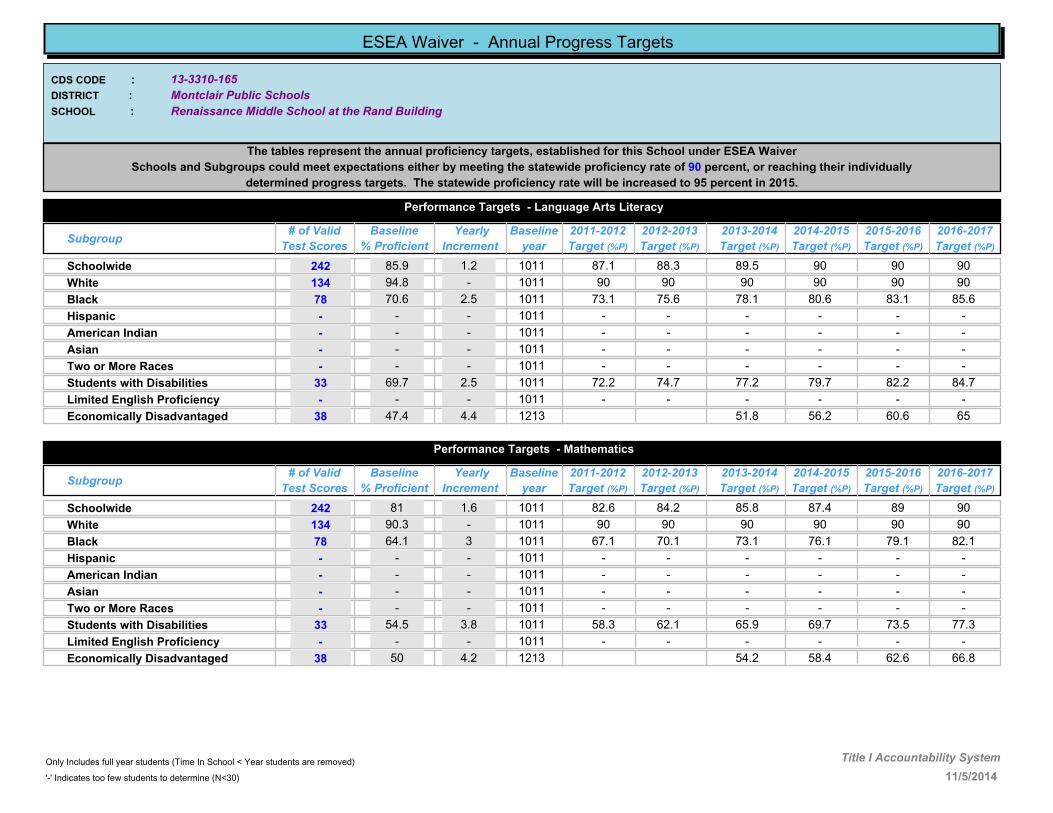
13-3310-165
Renaissance Middle School at the Rand Building
Montclair Public Schools
CDS CODE :
DISTRICT :
SCHOOL :
ESEA Waiver - Annual Progress Targets
The tables represent the annual proficiency targets, established for this School under ESEA Waiver
Schools and Subgroups could meet expectations either by meeting the statewide proficiency rate of 90 percent, or reaching their individually
determined progress targets. The statewide proficiency rate will be increased to 95 percent in 2015.
Performance Targets - Language Arts Literacy
Subgroup# of Valid
Test Scores
Baseline
% Proficient
Yearly
Increment
2012-2013
Target (%P)
2011-2012
Target (%P)
2013-2014
Target (%P)
2014-2015
Target (%P)
2015-2016
Target (%P)
2016-2017
Target (%P)
Baseline
year
85.9 1.2 88.3 89.5 90 90 90Schoolwide 242 87.11011
94.8 - 90 90 90 90 90White 134 901011
70.6 2.5 75.6 78.1 80.6 83.1 85.6Black 78 73.11011
- - - - - - -Hispanic - -1011
- - - - - - -American Indian - -1011
- - - - - - -Asian - -1011
- - - - - - -Two or More Races - -1011
69.7 2.5 74.7 77.2 79.7 82.2 84.7Students with Disabilities 33 72.21011
- - - - - - -Limited English Proficiency - -1011
47.4 4.4 51.8 56.2 60.6 65Economically Disadvantaged 38 1213
Performance Targets - Mathematics
Subgroup# of Valid
Test Scores
Baseline
% Proficient
Yearly
Increment
2012-2013
Target (%P)
2011-2012
Target (%P)
2013-2014
Target (%P)
2014-2015
Target (%P)
2015-2016
Target (%P)
2016-2017
Target (%P)
Baseline
year
81 1.6 84.2 85.8 87.4 89 90Schoolwide 242 82.61011
90.3 - 90 90 90 90 90White 134 901011
64.1 3 70.1 73.1 76.1 79.1 82.1Black 78 67.11011
- - - - - - -Hispanic - -1011
- - - - - - -American Indian - -1011
- - - - - - -Asian - -1011
- - - - - - -Two or More Races - -1011
54.5 3.8 62.1 65.9 69.7 73.5 77.3Students with Disabilities 33 58.31011
- - - - - - -Limited English Proficiency - -1011
50 4.2 54.2 58.4 62.6 66.8Economically Disadvantaged 38 1213
11/5/2014
Only Includes full year students (Time In School < Year students are removed)
'-' Indicates too few students to determine (N<30)
Title I Accountability System

13-3310-170
Watchung Elementary School
Montclair Public Schools
CDS CODE :
DISTRICT :
SCHOOL :
ESEA Waiver - Annual Progress Targets
The tables represent the annual proficiency targets, established for this School under ESEA Waiver
Schools and Subgroups could meet expectations either by meeting the statewide proficiency rate of 90 percent, or reaching their individually
determined progress targets. The statewide proficiency rate will be increased to 95 percent in 2015.
Performance Targets - Language Arts Literacy
Subgroup# of Valid
Test Scores
Baseline
% Proficient
Yearly
Increment
2012-2013
Target (%P)
2011-2012
Target (%P)
2013-2014
Target (%P)
2014-2015
Target (%P)
2015-2016
Target (%P)
2016-2017
Target (%P)
Baseline
year
91.4 - 90 90 90 90 90Schoolwide 209 901011
92.3 - 90 90 90 90 90White 130 901011
87.5 1.1 89.7 90 90 90 90Black 40 88.61011
- - - - - - -Hispanic - -1011
- - - - - - -American Indian - -1011
- - - - - - -Asian - -1011
- - - - - - -Two or More Races - -1011
72.5 2.3 77.1 79.4 81.7 84 86.3Students with Disabilities 40 74.81011
- - - - - - -Limited English Proficiency - -1011
- - - - - - -Economically Disadvantaged - -1011
Performance Targets - Mathematics
Subgroup# of Valid
Test Scores
Baseline
% Proficient
Yearly
Increment
2012-2013
Target (%P)
2011-2012
Target (%P)
2013-2014
Target (%P)
2014-2015
Target (%P)
2015-2016
Target (%P)
2016-2017
Target (%P)
Baseline
year
98.6 - 90 90 90 90 90Schoolwide 209 901011
100 - 90 90 90 90 90White 130 901011
97.5 - 90 90 90 90 90Black 40 901011
- - - - - - -Hispanic - -1011
- - - - - - -American Indian - -1011
- - - - - - -Asian - -1011
- - - - - - -Two or More Races - -1011
97.5 - 90 90 90 90 90Students with Disabilities 40 901011
- - - - - - -Limited English Proficiency - -1011
- - - - - - -Economically Disadvantaged - -1011
11/5/2014
Only Includes full year students (Time In School < Year students are removed)
'-' Indicates too few students to determine (N<30)
Title I Accountability System

13-3570-002
FAST TRACK SUCCESS ACADEMY
THE NEWARK PUBLIC SCHOOLS
CDS CODE :
DISTRICT :
SCHOOL :
ESEA Waiver - Annual Progress Targets
The tables represent the annual proficiency targets, established for this School under ESEA Waiver
Schools and Subgroups could meet expectations either by meeting the statewide proficiency rate of 90 percent, or reaching their individually
determined progress targets. The statewide proficiency rate will be increased to 95 percent in 2015.
Performance Targets - Language Arts Literacy
Subgroup# of Valid
Test Scores
Baseline
% Proficient
Yearly
Increment
2012-2013
Target (%P)
2011-2012
Target (%P)
2013-2014
Target (%P)
2014-2015
Target (%P)
2015-2016
Target (%P)
2016-2017
Target (%P)
Baseline
year
17.6 6.9 24.5 31.4 38.3 45.2 52.1Schoolwide 34 1112
- - - - - - -White - -1011
- - - - - - -Black - -1011
- - - - - - -Hispanic - -1011
- - - - - - -American Indian - -1011
- - - - - - -Asian - -1011
- - - - - - -Two or More Races - -1011
- - - - - - -Students with Disabilities - -1011
- - - - - - -Limited English Proficiency - -1011
- - - - - - -Economically Disadvantaged - -1011
Performance Targets - Mathematics
Subgroup# of Valid
Test Scores
Baseline
% Proficient
Yearly
Increment
2012-2013
Target (%P)
2011-2012
Target (%P)
2013-2014
Target (%P)
2014-2015
Target (%P)
2015-2016
Target (%P)
2016-2017
Target (%P)
Baseline
year
0 8.3 8.3 16.6 24.9 33.2 41.5Schoolwide 35 1112
- - - - - - -White - -1011
- - - - - - -Black - -1011
- - - - - - -Hispanic - -1011
- - - - - - -American Indian - -1011
- - - - - - -Asian - -1011
- - - - - - -Two or More Races - -1011
- - - - - - -Students with Disabilities - -1011
- - - - - - -Limited English Proficiency - -1011
- - - - - - -Economically Disadvantaged - -1011
11/5/2014
Only Includes full year students (Time In School < Year students are removed)
'-' Indicates too few students to determine (N<30)
Title I Accountability System

13-3570-010
ARTS HIGH SCHOOL
THE NEWARK PUBLIC SCHOOLS
CDS CODE :
DISTRICT :
SCHOOL :
ESEA Waiver - Annual Progress Targets
The tables represent the annual proficiency targets, established for this School under ESEA Waiver
Schools and Subgroups could meet expectations either by meeting the statewide proficiency rate of 90 percent, or reaching their individually
determined progress targets. The statewide proficiency rate will be increased to 95 percent in 2015.
Performance Targets - Language Arts Literacy
Subgroup# of Valid
Test Scores
Baseline
% Proficient
Yearly
Increment
2012-2013
Target (%P)
2011-2012
Target (%P)
2013-2014
Target (%P)
2014-2015
Target (%P)
2015-2016
Target (%P)
2016-2017
Target (%P)
Baseline
year
74.4 2.2 78.8 81 83.2 85.4 87.6Schoolwide 152 76.61011
- - - - - - -White - -1011
69.3 2.6 74.5 77.1 79.7 82.3 84.9Black 101 71.91011
84.4 1.3 87 88.3 89.6 90 90Hispanic 45 85.71011
- - - - - - -American Indian - -1011
- - - - - - -Asian - -1011
- - - - - - -Two or More Races - -1011
- - - - - - -Students with Disabilities - -1011
- - - - - - -Limited English Proficiency - -1011
73.1 2.3 77.7 80 82.3 84.6 86.9Economically Disadvantaged 108 75.41011
Performance Targets - Mathematics
Subgroup# of Valid
Test Scores
Baseline
% Proficient
Yearly
Increment
2012-2013
Target (%P)
2011-2012
Target (%P)
2013-2014
Target (%P)
2014-2015
Target (%P)
2015-2016
Target (%P)
2016-2017
Target (%P)
Baseline
year
64.7 3 70.7 73.7 76.7 79.7 82.7Schoolwide 153 67.71011
- - - - - - -White - -1011
58.8 3.4 65.6 69 72.4 75.8 79.2Black 102 62.21011
73.3 2.2 77.7 79.9 82.1 84.3 86.5Hispanic 45 75.51011
- - - - - - -American Indian - -1011
- - - - - - -Asian - -1011
- - - - - - -Two or More Races - -1011
- - - - - - -Students with Disabilities - -1011
- - - - - - -Limited English Proficiency - -1011
66.1 2.8 71.7 74.5 77.3 80.1 82.9Economically Disadvantaged 109 68.91011
11/5/2014
Only Includes full year students (Time In School < Year students are removed)
'-' Indicates too few students to determine (N<30)
Title I Accountability System

13-3570-020
BARRINGER HIGH SCHOOL
THE NEWARK PUBLIC SCHOOLS
CDS CODE :
DISTRICT :
SCHOOL :
ESEA Waiver - Annual Progress Targets
The tables represent the annual proficiency targets, established for this School under ESEA Waiver
Schools and Subgroups could meet expectations either by meeting the statewide proficiency rate of 90 percent, or reaching their individually
determined progress targets. The statewide proficiency rate will be increased to 95 percent in 2015.
Performance Targets - Language Arts Literacy
Subgroup# of Valid
Test Scores
Baseline
% Proficient
Yearly
Increment
2012-2013
Target (%P)
2011-2012
Target (%P)
2013-2014
Target (%P)
2014-2015
Target (%P)
2015-2016
Target (%P)
2016-2017
Target (%P)
Baseline
year
49.5 4.2 57.9 62.1 66.3 70.5 74.7Schoolwide 198 53.71011
- - - - - - -White - -1011
57.3 3.6 64.5 68.1 71.7 75.3 78.9Black 75 60.91011
44.2 4.7 53.6 58.3 63 67.7 72.4Hispanic 120 48.91011
- - - - - - -American Indian - -1011
- - - - - - -Asian - -1011
- - - - - - -Two or More Races - -1011
25.5 6.2 37.9 44.1 50.3 56.5 62.7Students with Disabilities 55 31.71011
22.2 6.5 28.7 35.2 41.7 48.2 54.7Limited English Proficiency 36 1112
50 4.2 58.4 62.6 66.8 71 75.2Economically Disadvantaged 136 54.21011
Performance Targets - Mathematics
Subgroup# of Valid
Test Scores
Baseline
% Proficient
Yearly
Increment
2012-2013
Target (%P)
2011-2012
Target (%P)
2013-2014
Target (%P)
2014-2015
Target (%P)
2015-2016
Target (%P)
2016-2017
Target (%P)
Baseline
year
29.9 5.9 41.7 47.6 53.5 59.4 65.3Schoolwide 197 35.81011
- - - - - - -White - -1011
27.1 6.1 39.3 45.4 51.5 57.6 63.7Black 74 33.21011
31.6 5.7 43 48.7 54.4 60.1 65.8Hispanic 120 37.31011
- - - - - - -American Indian - -1011
- - - - - - -Asian - -1011
- - - - - - -Two or More Races - -1011
12.7 7.3 27.3 34.6 41.9 49.2 56.5Students with Disabilities 55 201011
37.2 5.2 42.4 47.6 52.8 58 63.2Limited English Proficiency 35 1112
29.6 5.9 41.4 47.3 53.2 59.1 65Economically Disadvantaged 135 35.51011
11/5/2014
Only Includes full year students (Time In School < Year students are removed)
'-' Indicates too few students to determine (N<30)
Title I Accountability System

13-3570-030
CENTRAL HIGH SCHOOL
THE NEWARK PUBLIC SCHOOLS
CDS CODE :
DISTRICT :
SCHOOL :
ESEA Waiver - Annual Progress Targets
The tables represent the annual proficiency targets, established for this School under ESEA Waiver
Schools and Subgroups could meet expectations either by meeting the statewide proficiency rate of 90 percent, or reaching their individually
determined progress targets. The statewide proficiency rate will be increased to 95 percent in 2015.
Performance Targets - Language Arts Literacy
Subgroup# of Valid
Test Scores
Baseline
% Proficient
Yearly
Increment
2012-2013
Target (%P)
2011-2012
Target (%P)
2013-2014
Target (%P)
2014-2015
Target (%P)
2015-2016
Target (%P)
2016-2017
Target (%P)
Baseline
year
53.2 3.9 61 64.9 68.8 72.7 76.6Schoolwide 156 57.11011
- - - - - - -White - -1011
52.4 4 60.4 64.4 68.4 72.4 76.4Black 147 56.41011
- - - - - - -Hispanic - -1011
- - - - - - -American Indian - -1011
- - - - - - -Asian - -1011
- - - - - - -Two or More Races - -1011
12.5 7.3 27.1 34.4 41.7 49 56.3Students with Disabilities 48 19.81011
- - - - - - -Limited English Proficiency - -1011
51.6 4 59.6 63.6 67.6 71.6 75.6Economically Disadvantaged 126 55.61011
Performance Targets - Mathematics
Subgroup# of Valid
Test Scores
Baseline
% Proficient
Yearly
Increment
2012-2013
Target (%P)
2011-2012
Target (%P)
2013-2014
Target (%P)
2014-2015
Target (%P)
2015-2016
Target (%P)
2016-2017
Target (%P)
Baseline
year
39.8 5 49.8 54.8 59.8 64.8 69.8Schoolwide 156 44.81011
- - - - - - -White - -1011
38.8 5.1 49 54.1 59.2 64.3 69.4Black 147 43.91011
- - - - - - -Hispanic - -1011
- - - - - - -American Indian - -1011
- - - - - - -Asian - -1011
- - - - - - -Two or More Races - -1011
6.3 7.8 21.9 29.7 37.5 45.3 53.1Students with Disabilities 48 14.11011
- - - - - - -Limited English Proficiency - -1011
41.3 4.9 51.1 56 60.9 65.8 70.7Economically Disadvantaged 126 46.21011
11/5/2014
Only Includes full year students (Time In School < Year students are removed)
'-' Indicates too few students to determine (N<30)
Title I Accountability System

13-3570-040
EAST SIDE HIGH SCHOOL
THE NEWARK PUBLIC SCHOOLS
CDS CODE :
DISTRICT :
SCHOOL :
ESEA Waiver - Annual Progress Targets
The tables represent the annual proficiency targets, established for this School under ESEA Waiver
Schools and Subgroups could meet expectations either by meeting the statewide proficiency rate of 90 percent, or reaching their individually
determined progress targets. The statewide proficiency rate will be increased to 95 percent in 2015.
Performance Targets - Language Arts Literacy
Subgroup# of Valid
Test Scores
Baseline
% Proficient
Yearly
Increment
2012-2013
Target (%P)
2011-2012
Target (%P)
2013-2014
Target (%P)
2014-2015
Target (%P)
2015-2016
Target (%P)
2016-2017
Target (%P)
Baseline
year
66.9 2.8 72.5 75.3 78.1 80.9 83.7Schoolwide 251 69.71011
77.9 1.9 81.7 83.6 85.5 87.4 89.3White 68 79.81011
65.8 2.9 71.6 74.5 77.4 80.3 83.2Black 38 68.71011
62 3.2 68.4 71.6 74.8 78 81.2Hispanic 142 65.21011
- - - - - - -American Indian - -1011
- - - - - - -Asian - -1011
- - - - - - -Two or More Races - -1011
14.9 7.1 29.1 36.2 43.3 50.4 57.5Students with Disabilities 47 221011
52.3 4 60.3 64.3 68.3 72.3 76.3Limited English Proficiency 65 56.31011
67.4 2.7 72.8 75.5 78.2 80.9 83.6Economically Disadvantaged 163 70.11011
Performance Targets - Mathematics
Subgroup# of Valid
Test Scores
Baseline
% Proficient
Yearly
Increment
2012-2013
Target (%P)
2011-2012
Target (%P)
2013-2014
Target (%P)
2014-2015
Target (%P)
2015-2016
Target (%P)
2016-2017
Target (%P)
Baseline
year
63.1 3.1 69.3 72.4 75.5 78.6 81.7Schoolwide 255 66.21011
78.3 1.8 81.9 83.7 85.5 87.3 89.1White 69 80.11011
50 4.2 58.4 62.6 66.8 71 75.2Black 40 54.21011
59.4 3.4 66.2 69.6 73 76.4 79.8Hispanic 143 62.81011
- - - - - - -American Indian - -1011
- - - - - - -Asian - -1011
- - - - - - -Two or More Races - -1011
18 6.8 31.6 38.4 45.2 52 58.8Students with Disabilities 50 24.81011
53 3.9 60.8 64.7 68.6 72.5 76.4Limited English Proficiency 66 56.91011
66.2 2.8 71.8 74.6 77.4 80.2 83Economically Disadvantaged 163 691011
11/5/2014
Only Includes full year students (Time In School < Year students are removed)
'-' Indicates too few students to determine (N<30)
Title I Accountability System

13-3570-045
NEWARK VOCATIONAL HIGH SCHOOL
THE NEWARK PUBLIC SCHOOLS
CDS CODE :
DISTRICT :
SCHOOL :
ESEA Waiver - Annual Progress Targets
The tables represent the annual proficiency targets, established for this School under ESEA Waiver
Schools and Subgroups could meet expectations either by meeting the statewide proficiency rate of 90 percent, or reaching their individually
determined progress targets. The statewide proficiency rate will be increased to 95 percent in 2015.
Performance Targets - Language Arts Literacy
Subgroup# of Valid
Test Scores
Baseline
% Proficient
Yearly
Increment
2012-2013
Target (%P)
2011-2012
Target (%P)
2013-2014
Target (%P)
2014-2015
Target (%P)
2015-2016
Target (%P)
2016-2017
Target (%P)
Baseline
year
72.3 2.3 76.9 79.2 81.5 83.8 86.1Schoolwide 47 74.61011
- - - - - - -White - -1011
76.9 1.9 80.7 82.6 84.5 86.4 88.3Black 39 78.81011
- - - - - - -Hispanic - -1011
- - - - - - -American Indian - -1011
- - - - - - -Asian - -1011
- - - - - - -Two or More Races - -1011
- - - - - - -Students with Disabilities - -1011
- - - - - - -Limited English Proficiency - -1011
75.7 2 79.7 81.7 83.7 85.7 87.7Economically Disadvantaged 37 77.71011
Performance Targets - Mathematics
Subgroup# of Valid
Test Scores
Baseline
% Proficient
Yearly
Increment
2012-2013
Target (%P)
2011-2012
Target (%P)
2013-2014
Target (%P)
2014-2015
Target (%P)
2015-2016
Target (%P)
2016-2017
Target (%P)
Baseline
year
51.1 4.1 59.3 63.4 67.5 71.6 75.7Schoolwide 47 55.21011
- - - - - - -White - -1011
56.4 3.6 63.6 67.2 70.8 74.4 78Black 39 601011
- - - - - - -Hispanic - -1011
- - - - - - -American Indian - -1011
- - - - - - -Asian - -1011
- - - - - - -Two or More Races - -1011
- - - - - - -Students with Disabilities - -1011
- - - - - - -Limited English Proficiency - -1011
54.1 3.8 61.7 65.5 69.3 73.1 76.9Economically Disadvantaged 37 57.91011
11/5/2014
Only Includes full year students (Time In School < Year students are removed)
'-' Indicates too few students to determine (N<30)
Title I Accountability System

13-3570-050
MALCOLM X SHABAZZ HIGH SCHOOL
THE NEWARK PUBLIC SCHOOLS
CDS CODE :
DISTRICT :
SCHOOL :
ESEA Waiver - Annual Progress Targets
The tables represent the annual proficiency targets, established for this School under ESEA Waiver
Schools and Subgroups could meet expectations either by meeting the statewide proficiency rate of 90 percent, or reaching their individually
determined progress targets. The statewide proficiency rate will be increased to 95 percent in 2015.
Performance Targets - Language Arts Literacy
Subgroup# of Valid
Test Scores
Baseline
% Proficient
Yearly
Increment
2012-2013
Target (%P)
2011-2012
Target (%P)
2013-2014
Target (%P)
2014-2015
Target (%P)
2015-2016
Target (%P)
2016-2017
Target (%P)
Baseline
year
60.9 3.3 67.5 70.8 74.1 77.4 80.7Schoolwide 212 64.21011
- - - - - - -White - -1011
61.4 3.2 67.8 71 74.2 77.4 80.6Black 192 64.61011
- - - - - - -Hispanic - -1011
- - - - - - -American Indian - -1011
- - - - - - -Asian - -1011
- - - - - - -Two or More Races - -1011
12.7 7.3 27.3 34.6 41.9 49.2 56.5Students with Disabilities 55 201011
- - - - - - -Limited English Proficiency - -1011
61.4 3.2 67.8 71 74.2 77.4 80.6Economically Disadvantaged 101 64.61011
Performance Targets - Mathematics
Subgroup# of Valid
Test Scores
Baseline
% Proficient
Yearly
Increment
2012-2013
Target (%P)
2011-2012
Target (%P)
2013-2014
Target (%P)
2014-2015
Target (%P)
2015-2016
Target (%P)
2016-2017
Target (%P)
Baseline
year
36.3 5.3 46.9 52.2 57.5 62.8 68.1Schoolwide 212 41.61011
- - - - - - -White - -1011
37.5 5.2 47.9 53.1 58.3 63.5 68.7Black 192 42.71011
- - - - - - -Hispanic - -1011
- - - - - - -American Indian - -1011
- - - - - - -Asian - -1011
- - - - - - -Two or More Races - -1011
16.1 7 30.1 37.1 44.1 51.1 58.1Students with Disabilities 56 23.11011
- - - - - - -Limited English Proficiency - -1011
38 5.2 48.4 53.6 58.8 64 69.2Economically Disadvantaged 100 43.21011
11/5/2014
Only Includes full year students (Time In School < Year students are removed)
'-' Indicates too few students to determine (N<30)
Title I Accountability System

13-3570-055
SCIENCE PARK HIGH SCHOOL
THE NEWARK PUBLIC SCHOOLS
CDS CODE :
DISTRICT :
SCHOOL :
ESEA Waiver - Annual Progress Targets
The tables represent the annual proficiency targets, established for this School under ESEA Waiver
Schools and Subgroups could meet expectations either by meeting the statewide proficiency rate of 90 percent, or reaching their individually
determined progress targets. The statewide proficiency rate will be increased to 95 percent in 2015.
Performance Targets - Language Arts Literacy
Subgroup# of Valid
Test Scores
Baseline
% Proficient
Yearly
Increment
2012-2013
Target (%P)
2011-2012
Target (%P)
2013-2014
Target (%P)
2014-2015
Target (%P)
2015-2016
Target (%P)
2016-2017
Target (%P)
Baseline
year
98.4 - 90 90 90 90 90Schoolwide 257 901011
98 - 90 90 90 90 90White 52 901011
98 - 90 90 90 90 90Black 99 901011
100 - 90 90 90 90 90Hispanic 88 901011
- - - - - - -American Indian - -1011
- - - - - - -Asian - -1011
- - - - - - -Two or More Races - -1011
- - - - - - -Students with Disabilities - -1011
- - - - - - -Limited English Proficiency - -1011
99.4 - 90 90 90 90 90Economically Disadvantaged 159 901011
Performance Targets - Mathematics
Subgroup# of Valid
Test Scores
Baseline
% Proficient
Yearly
Increment
2012-2013
Target (%P)
2011-2012
Target (%P)
2013-2014
Target (%P)
2014-2015
Target (%P)
2015-2016
Target (%P)
2016-2017
Target (%P)
Baseline
year
98 - 90 90 90 90 90Schoolwide 257 901011
98.1 - 90 90 90 90 90White 52 901011
97 - 90 90 90 90 90Black 99 901011
100 - 90 90 90 90 90Hispanic 88 901011
- - - - - - -American Indian - -1011
- - - - - - -Asian - -1011
- - - - - - -Two or More Races - -1011
- - - - - - -Students with Disabilities - -1011
- - - - - - -Limited English Proficiency - -1011
98.7 - 90 90 90 90 90Economically Disadvantaged 159 901011
11/5/2014
Only Includes full year students (Time In School < Year students are removed)
'-' Indicates too few students to determine (N<30)
Title I Accountability System
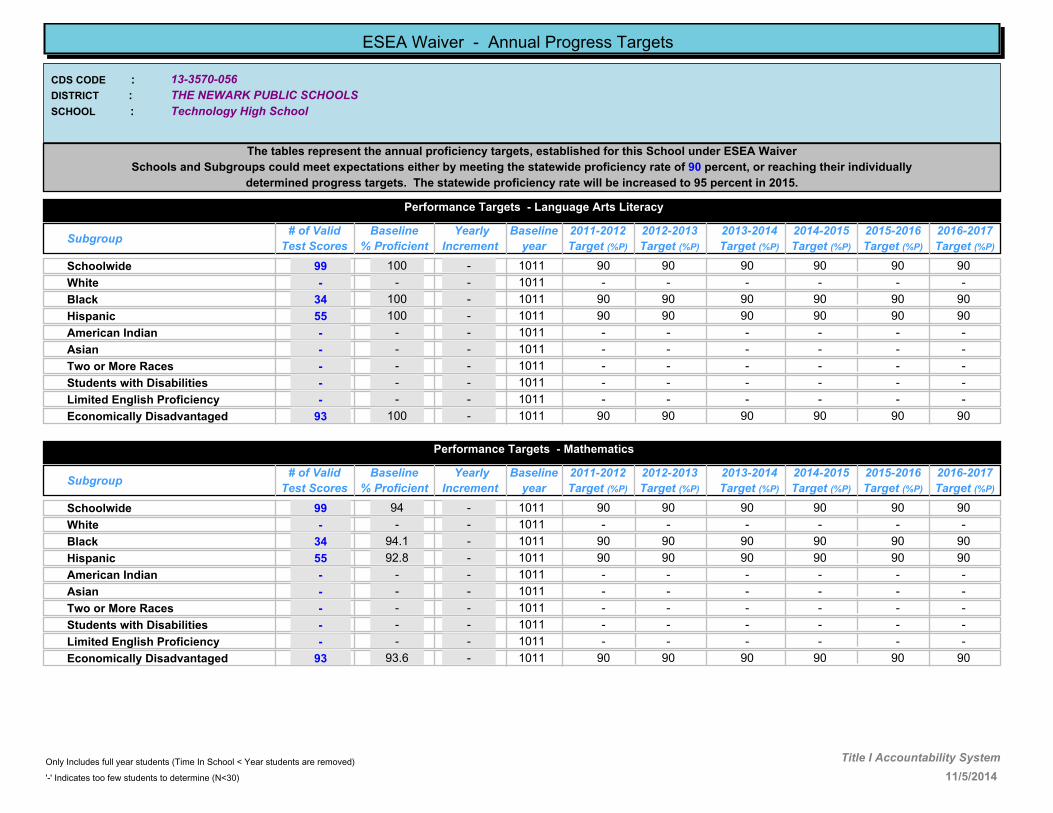
13-3570-056
Technology High School
THE NEWARK PUBLIC SCHOOLS
CDS CODE :
DISTRICT :
SCHOOL :
ESEA Waiver - Annual Progress Targets
The tables represent the annual proficiency targets, established for this School under ESEA Waiver
Schools and Subgroups could meet expectations either by meeting the statewide proficiency rate of 90 percent, or reaching their individually
determined progress targets. The statewide proficiency rate will be increased to 95 percent in 2015.
Performance Targets - Language Arts Literacy
Subgroup# of Valid
Test Scores
Baseline
% Proficient
Yearly
Increment
2012-2013
Target (%P)
2011-2012
Target (%P)
2013-2014
Target (%P)
2014-2015
Target (%P)
2015-2016
Target (%P)
2016-2017
Target (%P)
Baseline
year
100 - 90 90 90 90 90Schoolwide 99 901011
- - - - - - -White - -1011
100 - 90 90 90 90 90Black 34 901011
100 - 90 90 90 90 90Hispanic 55 901011
- - - - - - -American Indian - -1011
- - - - - - -Asian - -1011
- - - - - - -Two or More Races - -1011
- - - - - - -Students with Disabilities - -1011
- - - - - - -Limited English Proficiency - -1011
100 - 90 90 90 90 90Economically Disadvantaged 93 901011
Performance Targets - Mathematics
Subgroup# of Valid
Test Scores
Baseline
% Proficient
Yearly
Increment
2012-2013
Target (%P)
2011-2012
Target (%P)
2013-2014
Target (%P)
2014-2015
Target (%P)
2015-2016
Target (%P)
2016-2017
Target (%P)
Baseline
year
94 - 90 90 90 90 90Schoolwide 99 901011
- - - - - - -White - -1011
94.1 - 90 90 90 90 90Black 34 901011
92.8 - 90 90 90 90 90Hispanic 55 901011
- - - - - - -American Indian - -1011
- - - - - - -Asian - -1011
- - - - - - -Two or More Races - -1011
- - - - - - -Students with Disabilities - -1011
- - - - - - -Limited English Proficiency - -1011
93.6 - 90 90 90 90 90Economically Disadvantaged 93 901011
11/5/2014
Only Includes full year students (Time In School < Year students are removed)
'-' Indicates too few students to determine (N<30)
Title I Accountability System

13-3570-057
UNIVERSITY HIGH SCHOOL
THE NEWARK PUBLIC SCHOOLS
CDS CODE :
DISTRICT :
SCHOOL :
ESEA Waiver - Annual Progress Targets
The tables represent the annual proficiency targets, established for this School under ESEA Waiver
Schools and Subgroups could meet expectations either by meeting the statewide proficiency rate of 90 percent, or reaching their individually
determined progress targets. The statewide proficiency rate will be increased to 95 percent in 2015.
Performance Targets - Language Arts Literacy
Subgroup# of Valid
Test Scores
Baseline
% Proficient
Yearly
Increment
2012-2013
Target (%P)
2011-2012
Target (%P)
2013-2014
Target (%P)
2014-2015
Target (%P)
2015-2016
Target (%P)
2016-2017
Target (%P)
Baseline
year
96.2 - 90 90 90 90 90Schoolwide 132 901011
- - - - - - -White - -1011
96.2 - 90 90 90 90 90Black 105 901011
- - - - - - -Hispanic - -1011
- - - - - - -American Indian - -1011
- - - - - - -Asian - -1011
- - - - - - -Two or More Races - -1011
- - - - - - -Students with Disabilities - -1011
- - - - - - -Limited English Proficiency - -1011
94.6 - 90 90 90 90 90Economically Disadvantaged 92 901011
Performance Targets - Mathematics
Subgroup# of Valid
Test Scores
Baseline
% Proficient
Yearly
Increment
2012-2013
Target (%P)
2011-2012
Target (%P)
2013-2014
Target (%P)
2014-2015
Target (%P)
2015-2016
Target (%P)
2016-2017
Target (%P)
Baseline
year
94.8 - 90 90 90 90 90Schoolwide 133 901011
- - - - - - -White - -1011
93.4 - 90 90 90 90 90Black 106 901011
- - - - - - -Hispanic - -1011
- - - - - - -American Indian - -1011
- - - - - - -Asian - -1011
- - - - - - -Two or More Races - -1011
- - - - - - -Students with Disabilities - -1011
- - - - - - -Limited English Proficiency - -1011
93.5 - 90 90 90 90 90Economically Disadvantaged 92 901011
11/5/2014
Only Includes full year students (Time In School < Year students are removed)
'-' Indicates too few students to determine (N<30)
Title I Accountability System

13-3570-070
WEEQUAHIC HIGH SCHOOL
THE NEWARK PUBLIC SCHOOLS
CDS CODE :
DISTRICT :
SCHOOL :
ESEA Waiver - Annual Progress Targets
The tables represent the annual proficiency targets, established for this School under ESEA Waiver
Schools and Subgroups could meet expectations either by meeting the statewide proficiency rate of 90 percent, or reaching their individually
determined progress targets. The statewide proficiency rate will be increased to 95 percent in 2015.
Performance Targets - Language Arts Literacy
Subgroup# of Valid
Test Scores
Baseline
% Proficient
Yearly
Increment
2012-2013
Target (%P)
2011-2012
Target (%P)
2013-2014
Target (%P)
2014-2015
Target (%P)
2015-2016
Target (%P)
2016-2017
Target (%P)
Baseline
year
64.5 3 70.5 73.5 76.5 79.5 82.5Schoolwide 135 67.51011
- - - - - - -White - -1011
64.9 2.9 70.7 73.6 76.5 79.4 82.3Black 134 67.81011
- - - - - - -Hispanic - -1011
- - - - - - -American Indian - -1011
- - - - - - -Asian - -1011
- - - - - - -Two or More Races - -1011
11.1 7.4 25.9 33.3 40.7 48.1 55.5Students with Disabilities 36 18.51011
- - - - - - -Limited English Proficiency - -1011
65.7 2.9 71.5 74.4 77.3 80.2 83.1Economically Disadvantaged 108 68.61011
Performance Targets - Mathematics
Subgroup# of Valid
Test Scores
Baseline
% Proficient
Yearly
Increment
2012-2013
Target (%P)
2011-2012
Target (%P)
2013-2014
Target (%P)
2014-2015
Target (%P)
2015-2016
Target (%P)
2016-2017
Target (%P)
Baseline
year
45.2 4.6 54.4 59 63.6 68.2 72.8Schoolwide 135 49.81011
- - - - - - -White - -1011
45.5 4.6 54.7 59.3 63.9 68.5 73.1Black 134 50.11011
- - - - - - -Hispanic - -1011
- - - - - - -American Indian - -1011
- - - - - - -Asian - -1011
- - - - - - -Two or More Races - -1011
11.1 7.4 25.9 33.3 40.7 48.1 55.5Students with Disabilities 36 18.51011
- - - - - - -Limited English Proficiency - -1011
46.3 4.5 55.3 59.8 64.3 68.8 73.3Economically Disadvantaged 108 50.81011
11/5/2014
Only Includes full year students (Time In School < Year students are removed)
'-' Indicates too few students to determine (N<30)
Title I Accountability System
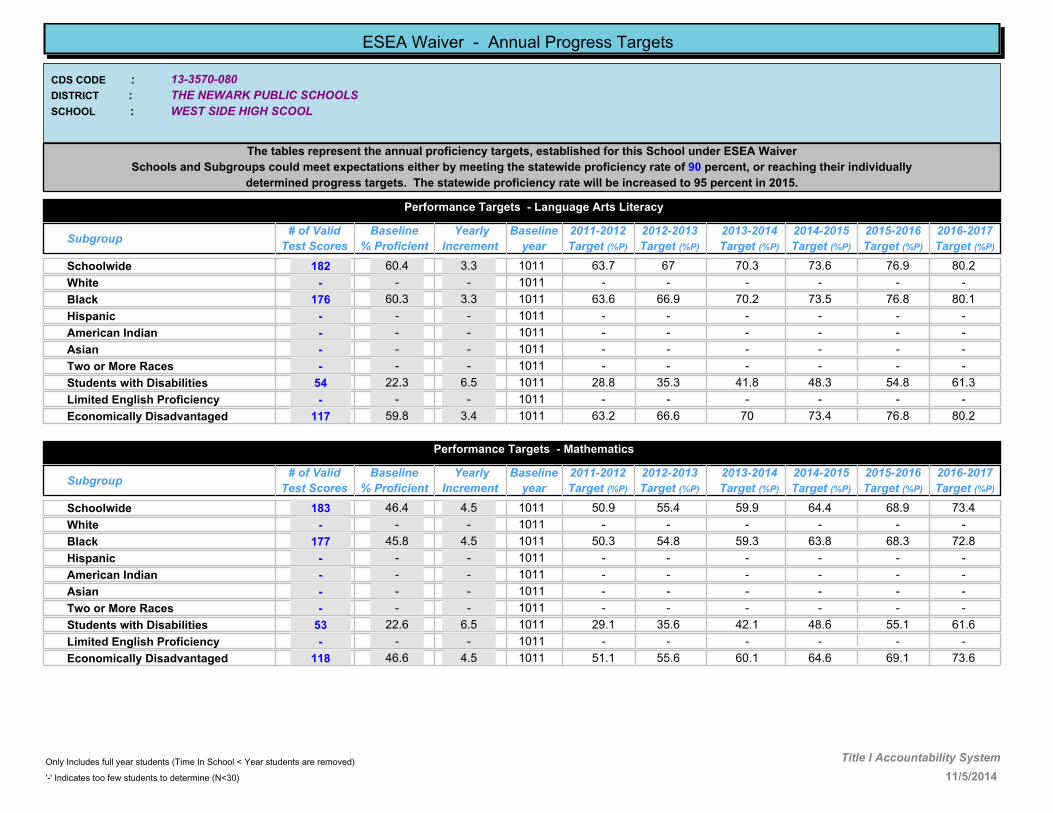
13-3570-080
WEST SIDE HIGH SCOOL
THE NEWARK PUBLIC SCHOOLS
CDS CODE :
DISTRICT :
SCHOOL :
ESEA Waiver - Annual Progress Targets
The tables represent the annual proficiency targets, established for this School under ESEA Waiver
Schools and Subgroups could meet expectations either by meeting the statewide proficiency rate of 90 percent, or reaching their individually
determined progress targets. The statewide proficiency rate will be increased to 95 percent in 2015.
Performance Targets - Language Arts Literacy
Subgroup# of Valid
Test Scores
Baseline
% Proficient
Yearly
Increment
2012-2013
Target (%P)
2011-2012
Target (%P)
2013-2014
Target (%P)
2014-2015
Target (%P)
2015-2016
Target (%P)
2016-2017
Target (%P)
Baseline
year
60.4 3.3 67 70.3 73.6 76.9 80.2Schoolwide 182 63.71011
- - - - - - -White - -1011
60.3 3.3 66.9 70.2 73.5 76.8 80.1Black 176 63.61011
- - - - - - -Hispanic - -1011
- - - - - - -American Indian - -1011
- - - - - - -Asian - -1011
- - - - - - -Two or More Races - -1011
22.3 6.5 35.3 41.8 48.3 54.8 61.3Students with Disabilities 54 28.81011
- - - - - - -Limited English Proficiency - -1011
59.8 3.4 66.6 70 73.4 76.8 80.2Economically Disadvantaged 117 63.21011
Performance Targets - Mathematics
Subgroup# of Valid
Test Scores
Baseline
% Proficient
Yearly
Increment
2012-2013
Target (%P)
2011-2012
Target (%P)
2013-2014
Target (%P)
2014-2015
Target (%P)
2015-2016
Target (%P)
2016-2017
Target (%P)
Baseline
year
46.4 4.5 55.4 59.9 64.4 68.9 73.4Schoolwide 183 50.91011
- - - - - - -White - -1011
45.8 4.5 54.8 59.3 63.8 68.3 72.8Black 177 50.31011
- - - - - - -Hispanic - -1011
- - - - - - -American Indian - -1011
- - - - - - -Asian - -1011
- - - - - - -Two or More Races - -1011
22.6 6.5 35.6 42.1 48.6 55.1 61.6Students with Disabilities 53 29.11011
- - - - - - -Limited English Proficiency - -1011
46.6 4.5 55.6 60.1 64.6 69.1 73.6Economically Disadvantaged 118 51.11011
11/5/2014
Only Includes full year students (Time In School < Year students are removed)
'-' Indicates too few students to determine (N<30)
Title I Accountability System

13-3570-087
American History High School
THE NEWARK PUBLIC SCHOOLS
CDS CODE :
DISTRICT :
SCHOOL :
ESEA Waiver - Annual Progress Targets
The tables represent the annual proficiency targets, established for this School under ESEA Waiver
Schools and Subgroups could meet expectations either by meeting the statewide proficiency rate of 90 percent, or reaching their individually
determined progress targets. The statewide proficiency rate will be increased to 95 percent in 2015.
Performance Targets - Language Arts Literacy
Subgroup# of Valid
Test Scores
Baseline
% Proficient
Yearly
Increment
2012-2013
Target (%P)
2011-2012
Target (%P)
2013-2014
Target (%P)
2014-2015
Target (%P)
2015-2016
Target (%P)
2016-2017
Target (%P)
Baseline
year
94.2 - 90 90 90 90 90Schoolwide 52 901011
- - - - - - -White - -1011
94.6 - 90 90 90 90 90Black 37 901011
- - - - - - -Hispanic - -1011
- - - - - - -American Indian - -1011
- - - - - - -Asian - -1011
- - - - - - -Two or More Races - -1011
- - - - - - -Students with Disabilities - -1011
- - - - - - -Limited English Proficiency - -1011
97.9 - 90 90 90 90 90Economically Disadvantaged 48 1112
Performance Targets - Mathematics
Subgroup# of Valid
Test Scores
Baseline
% Proficient
Yearly
Increment
2012-2013
Target (%P)
2011-2012
Target (%P)
2013-2014
Target (%P)
2014-2015
Target (%P)
2015-2016
Target (%P)
2016-2017
Target (%P)
Baseline
year
77 1.9 80.8 82.7 84.6 86.5 88.4Schoolwide 52 78.91011
- - - - - - -White - -1011
75.7 2 79.7 81.7 83.7 85.7 87.7Black 37 77.71011
- - - - - - -Hispanic - -1011
- - - - - - -American Indian - -1011
- - - - - - -Asian - -1011
- - - - - - -Two or More Races - -1011
- - - - - - -Students with Disabilities - -1011
- - - - - - -Limited English Proficiency - -1011
97.9 - 90 90 90 90 90Economically Disadvantaged 48 1112
11/5/2014
Only Includes full year students (Time In School < Year students are removed)
'-' Indicates too few students to determine (N<30)
Title I Accountability System

13-3570-170
ABINGTON AVENUE SCHOOL
THE NEWARK PUBLIC SCHOOLS
CDS CODE :
DISTRICT :
SCHOOL :
ESEA Waiver - Annual Progress Targets
The tables represent the annual proficiency targets, established for this School under ESEA Waiver
Schools and Subgroups could meet expectations either by meeting the statewide proficiency rate of 90 percent, or reaching their individually
determined progress targets. The statewide proficiency rate will be increased to 95 percent in 2015.
Performance Targets - Language Arts Literacy
Subgroup# of Valid
Test Scores
Baseline
% Proficient
Yearly
Increment
2012-2013
Target (%P)
2011-2012
Target (%P)
2013-2014
Target (%P)
2014-2015
Target (%P)
2015-2016
Target (%P)
2016-2017
Target (%P)
Baseline
year
52.9 3.9 60.7 64.6 68.5 72.4 76.3Schoolwide 344 56.81011
- - - - - - -White - -1011
35.5 5.4 46.3 51.7 57.1 62.5 67.9Black 31 40.91011
52.4 4 60.4 64.4 68.4 72.4 76.4Hispanic 277 56.41011
- - - - - - -American Indian - -1011
- - - - - - -Asian - -1011
- - - - - - -Two or More Races - -1011
23.4 6.4 36.2 42.6 49 55.4 61.8Students with Disabilities 47 29.81011
12.9 7.3 20.2 27.5 34.8 42.1 49.4Limited English Proficiency 31 1112
51.7 4 59.7 63.7 67.7 71.7 75.7Economically Disadvantaged 315 55.71011
Performance Targets - Mathematics
Subgroup# of Valid
Test Scores
Baseline
% Proficient
Yearly
Increment
2012-2013
Target (%P)
2011-2012
Target (%P)
2013-2014
Target (%P)
2014-2015
Target (%P)
2015-2016
Target (%P)
2016-2017
Target (%P)
Baseline
year
66.8 2.8 72.4 75.2 78 80.8 83.6Schoolwide 344 69.61011
- - - - - - -White - -1011
48.4 4.3 57 61.3 65.6 69.9 74.2Black 31 52.71011
67.9 2.7 73.3 76 78.7 81.4 84.1Hispanic 277 70.61011
- - - - - - -American Indian - -1011
- - - - - - -Asian - -1011
- - - - - - -Two or More Races - -1011
51.1 4.1 59.3 63.4 67.5 71.6 75.7Students with Disabilities 47 55.21011
41.9 4.9 46.8 51.7 56.6 61.5 66.4Limited English Proficiency 31 1112
66.4 2.8 72 74.8 77.6 80.4 83.2Economically Disadvantaged 315 69.21011
11/5/2014
Only Includes full year students (Time In School < Year students are removed)
'-' Indicates too few students to determine (N<30)
Title I Accountability System

13-3570-180
ALEXANDER STREET SCHOOL
THE NEWARK PUBLIC SCHOOLS
CDS CODE :
DISTRICT :
SCHOOL :
ESEA Waiver - Annual Progress Targets
The tables represent the annual proficiency targets, established for this School under ESEA Waiver
Schools and Subgroups could meet expectations either by meeting the statewide proficiency rate of 90 percent, or reaching their individually
determined progress targets. The statewide proficiency rate will be increased to 95 percent in 2015.
Performance Targets - Language Arts Literacy
Subgroup# of Valid
Test Scores
Baseline
% Proficient
Yearly
Increment
2012-2013
Target (%P)
2011-2012
Target (%P)
2013-2014
Target (%P)
2014-2015
Target (%P)
2015-2016
Target (%P)
2016-2017
Target (%P)
Baseline
year
44.5 4.6 53.7 58.3 62.9 67.5 72.1Schoolwide 322 49.11011
- - - - - - -White - -1011
43.9 4.7 53.3 58 62.7 67.4 72.1Black 310 48.61011
- - - - - - -Hispanic - -1011
- - - - - - -American Indian - -1011
- - - - - - -Asian - -1011
- - - - - - -Two or More Races - -1011
10.9 7.4 25.7 33.1 40.5 47.9 55.3Students with Disabilities 55 18.31011
- - - - - - -Limited English Proficiency - -1011
45.6 4.6 54.8 59.4 64 68.6 73.2Economically Disadvantaged 303 50.21011
Performance Targets - Mathematics
Subgroup# of Valid
Test Scores
Baseline
% Proficient
Yearly
Increment
2012-2013
Target (%P)
2011-2012
Target (%P)
2013-2014
Target (%P)
2014-2015
Target (%P)
2015-2016
Target (%P)
2016-2017
Target (%P)
Baseline
year
60 3.4 66.8 70.2 73.6 77 80.4Schoolwide 322 63.41011
- - - - - - -White - -1011
59.7 3.4 66.5 69.9 73.3 76.7 80.1Black 310 63.11011
- - - - - - -Hispanic - -1011
- - - - - - -American Indian - -1011
- - - - - - -Asian - -1011
- - - - - - -Two or More Races - -1011
25.4 6.2 37.8 44 50.2 56.4 62.6Students with Disabilities 55 31.61011
- - - - - - -Limited English Proficiency - -1011
60.4 3.3 67 70.3 73.6 76.9 80.2Economically Disadvantaged 303 63.71011
11/5/2014
Only Includes full year students (Time In School < Year students are removed)
'-' Indicates too few students to determine (N<30)
Title I Accountability System
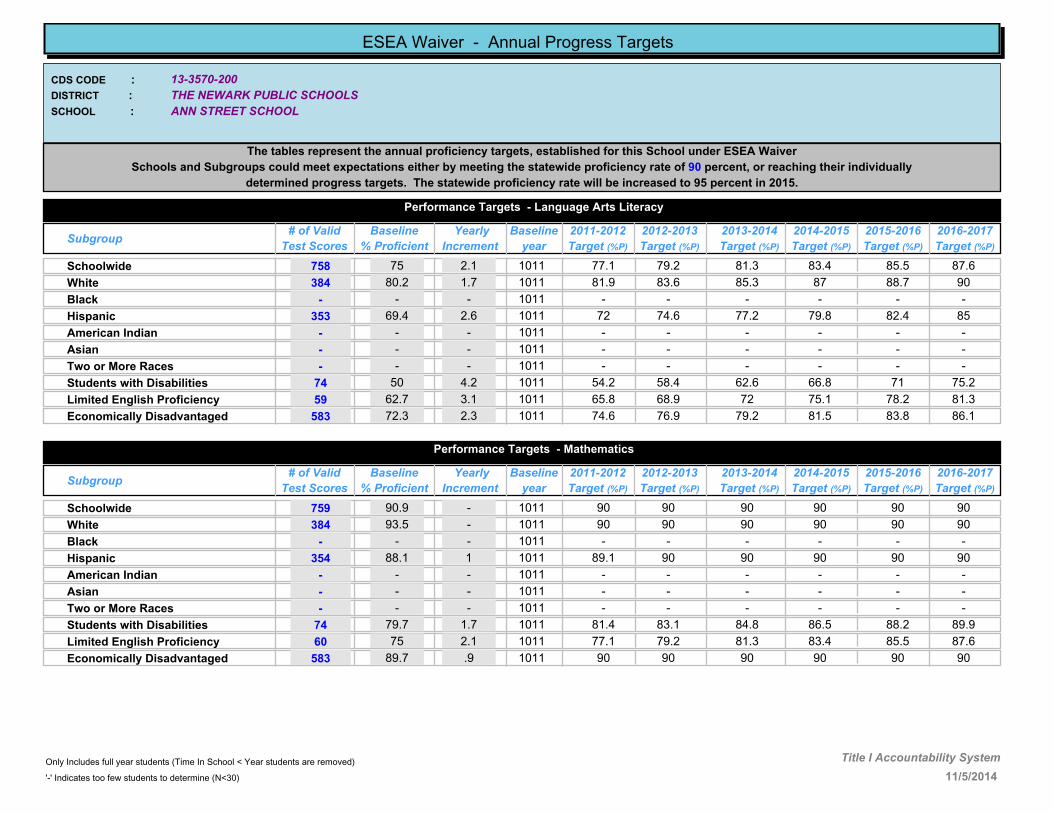
13-3570-200
ANN STREET SCHOOL
THE NEWARK PUBLIC SCHOOLS
CDS CODE :
DISTRICT :
SCHOOL :
ESEA Waiver - Annual Progress Targets
The tables represent the annual proficiency targets, established for this School under ESEA Waiver
Schools and Subgroups could meet expectations either by meeting the statewide proficiency rate of 90 percent, or reaching their individually
determined progress targets. The statewide proficiency rate will be increased to 95 percent in 2015.
Performance Targets - Language Arts Literacy
Subgroup# of Valid
Test Scores
Baseline
% Proficient
Yearly
Increment
2012-2013
Target (%P)
2011-2012
Target (%P)
2013-2014
Target (%P)
2014-2015
Target (%P)
2015-2016
Target (%P)
2016-2017
Target (%P)
Baseline
year
75 2.1 79.2 81.3 83.4 85.5 87.6Schoolwide 758 77.11011
80.2 1.7 83.6 85.3 87 88.7 90White 384 81.91011
- - - - - - -Black - -1011
69.4 2.6 74.6 77.2 79.8 82.4 85Hispanic 353 721011
- - - - - - -American Indian - -1011
- - - - - - -Asian - -1011
- - - - - - -Two or More Races - -1011
50 4.2 58.4 62.6 66.8 71 75.2Students with Disabilities 74 54.21011
62.7 3.1 68.9 72 75.1 78.2 81.3Limited English Proficiency 59 65.81011
72.3 2.3 76.9 79.2 81.5 83.8 86.1Economically Disadvantaged 583 74.61011
Performance Targets - Mathematics
Subgroup# of Valid
Test Scores
Baseline
% Proficient
Yearly
Increment
2012-2013
Target (%P)
2011-2012
Target (%P)
2013-2014
Target (%P)
2014-2015
Target (%P)
2015-2016
Target (%P)
2016-2017
Target (%P)
Baseline
year
90.9 - 90 90 90 90 90Schoolwide 759 901011
93.5 - 90 90 90 90 90White 384 901011
- - - - - - -Black - -1011
88.1 1 90 90 90 90 90Hispanic 354 89.11011
- - - - - - -American Indian - -1011
- - - - - - -Asian - -1011
- - - - - - -Two or More Races - -1011
79.7 1.7 83.1 84.8 86.5 88.2 89.9Students with Disabilities 74 81.41011
75 2.1 79.2 81.3 83.4 85.5 87.6Limited English Proficiency 60 77.11011
89.7 .9 90 90 90 90 90Economically Disadvantaged 583 901011
11/5/2014
Only Includes full year students (Time In School < Year students are removed)
'-' Indicates too few students to determine (N<30)
Title I Accountability System

13-3570-220
AVON AVENUE SCHOOL
THE NEWARK PUBLIC SCHOOLS
CDS CODE :
DISTRICT :
SCHOOL :
ESEA Waiver - Annual Progress Targets
The tables represent the annual proficiency targets, established for this School under ESEA Waiver
Schools and Subgroups could meet expectations either by meeting the statewide proficiency rate of 90 percent, or reaching their individually
determined progress targets. The statewide proficiency rate will be increased to 95 percent in 2015.
Performance Targets - Language Arts Literacy
Subgroup# of Valid
Test Scores
Baseline
% Proficient
Yearly
Increment
2012-2013
Target (%P)
2011-2012
Target (%P)
2013-2014
Target (%P)
2014-2015
Target (%P)
2015-2016
Target (%P)
2016-2017
Target (%P)
Baseline
year
19.7 6.7 33.1 39.8 46.5 53.2 59.9Schoolwide 360 26.41011
- - - - - - -White - -1011
18.6 6.8 32.2 39 45.8 52.6 59.4Black 340 25.41011
- - - - - - -Hispanic - -1011
- - - - - - -American Indian - -1011
- - - - - - -Asian - -1011
- - - - - - -Two or More Races - -1011
7.2 7.7 22.6 30.3 38 45.7 53.4Students with Disabilities 83 14.91011
- - - - - - -Limited English Proficiency - -1011
20.2 6.7 33.6 40.3 47 53.7 60.4Economically Disadvantaged 331 26.91011
Performance Targets - Mathematics
Subgroup# of Valid
Test Scores
Baseline
% Proficient
Yearly
Increment
2012-2013
Target (%P)
2011-2012
Target (%P)
2013-2014
Target (%P)
2014-2015
Target (%P)
2015-2016
Target (%P)
2016-2017
Target (%P)
Baseline
year
26.1 6.2 38.5 44.7 50.9 57.1 63.3Schoolwide 359 32.31011
- - - - - - -White - -1011
25.1 6.3 37.7 44 50.3 56.6 62.9Black 339 31.41011
- - - - - - -Hispanic - -1011
- - - - - - -American Indian - -1011
- - - - - - -Asian - -1011
- - - - - - -Two or More Races - -1011
16.9 6.9 30.7 37.6 44.5 51.4 58.3Students with Disabilities 83 23.81011
- - - - - - -Limited English Proficiency - -1011
27 6.1 39.2 45.3 51.4 57.5 63.6Economically Disadvantaged 330 33.11011
11/5/2014
Only Includes full year students (Time In School < Year students are removed)
'-' Indicates too few students to determine (N<30)
Title I Accountability System
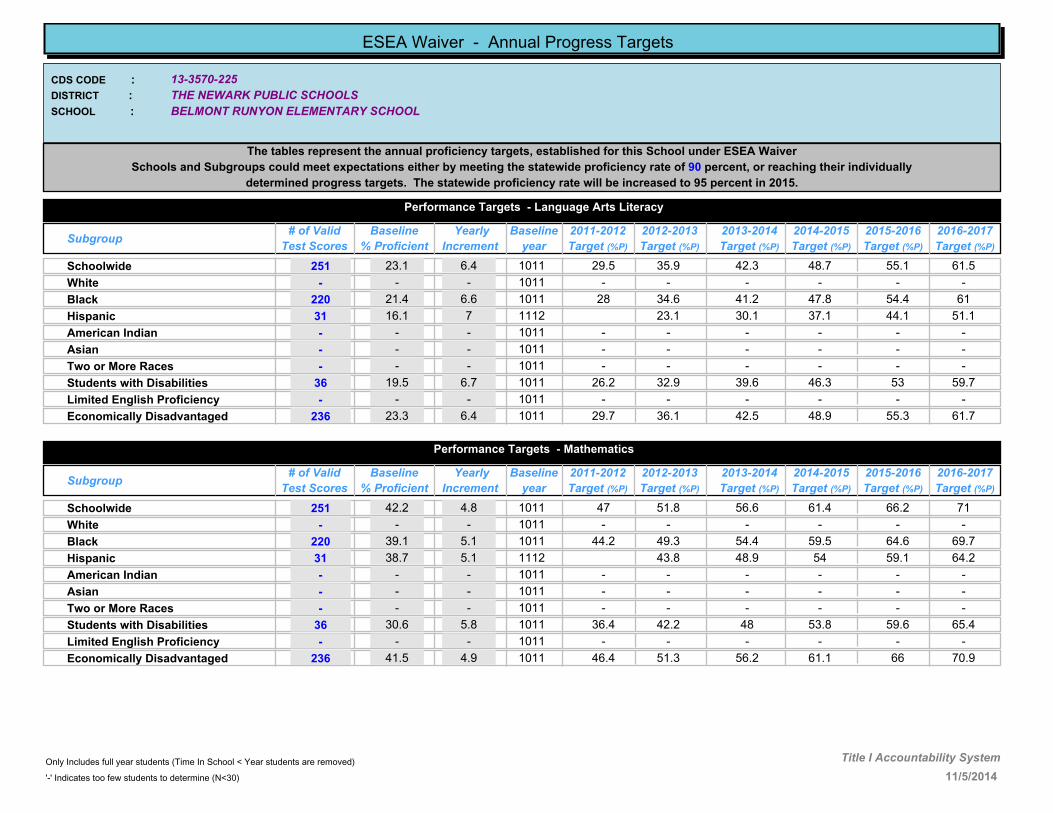
13-3570-225
BELMONT RUNYON ELEMENTARY SCHOOL
THE NEWARK PUBLIC SCHOOLS
CDS CODE :
DISTRICT :
SCHOOL :
ESEA Waiver - Annual Progress Targets
The tables represent the annual proficiency targets, established for this School under ESEA Waiver
Schools and Subgroups could meet expectations either by meeting the statewide proficiency rate of 90 percent, or reaching their individually
determined progress targets. The statewide proficiency rate will be increased to 95 percent in 2015.
Performance Targets - Language Arts Literacy
Subgroup# of Valid
Test Scores
Baseline
% Proficient
Yearly
Increment
2012-2013
Target (%P)
2011-2012
Target (%P)
2013-2014
Target (%P)
2014-2015
Target (%P)
2015-2016
Target (%P)
2016-2017
Target (%P)
Baseline
year
23.1 6.4 35.9 42.3 48.7 55.1 61.5Schoolwide 251 29.51011
- - - - - - -White - -1011
21.4 6.6 34.6 41.2 47.8 54.4 61Black 220 281011
16.1 7 23.1 30.1 37.1 44.1 51.1Hispanic 31 1112
- - - - - - -American Indian - -1011
- - - - - - -Asian - -1011
- - - - - - -Two or More Races - -1011
19.5 6.7 32.9 39.6 46.3 53 59.7Students with Disabilities 36 26.21011
- - - - - - -Limited English Proficiency - -1011
23.3 6.4 36.1 42.5 48.9 55.3 61.7Economically Disadvantaged 236 29.71011
Performance Targets - Mathematics
Subgroup# of Valid
Test Scores
Baseline
% Proficient
Yearly
Increment
2012-2013
Target (%P)
2011-2012
Target (%P)
2013-2014
Target (%P)
2014-2015
Target (%P)
2015-2016
Target (%P)
2016-2017
Target (%P)
Baseline
year
42.2 4.8 51.8 56.6 61.4 66.2 71Schoolwide 251 471011
- - - - - - -White - -1011
39.1 5.1 49.3 54.4 59.5 64.6 69.7Black 220 44.21011
38.7 5.1 43.8 48.9 54 59.1 64.2Hispanic 31 1112
- - - - - - -American Indian - -1011
- - - - - - -Asian - -1011
- - - - - - -Two or More Races - -1011
30.6 5.8 42.2 48 53.8 59.6 65.4Students with Disabilities 36 36.41011
- - - - - - -Limited English Proficiency - -1011
41.5 4.9 51.3 56.2 61.1 66 70.9Economically Disadvantaged 236 46.41011
11/5/2014
Only Includes full year students (Time In School < Year students are removed)
'-' Indicates too few students to determine (N<30)
Title I Accountability System

13-3570-250
BRAGAW AVENUE SCHOOL
THE NEWARK PUBLIC SCHOOLS
CDS CODE :
DISTRICT :
SCHOOL :
ESEA Waiver - Annual Progress Targets
The tables represent the annual proficiency targets, established for this School under ESEA Waiver
Schools and Subgroups could meet expectations either by meeting the statewide proficiency rate of 90 percent, or reaching their individually
determined progress targets. The statewide proficiency rate will be increased to 95 percent in 2015.
Performance Targets - Language Arts Literacy
Subgroup# of Valid
Test Scores
Baseline
% Proficient
Yearly
Increment
2012-2013
Target (%P)
2011-2012
Target (%P)
2013-2014
Target (%P)
2014-2015
Target (%P)
2015-2016
Target (%P)
2016-2017
Target (%P)
Baseline
year
35.6 5.4 46.4 51.8 57.2 62.6 68Schoolwide 174 411011
- - - - - - -White - -1011
35.5 5.4 46.3 51.7 57.1 62.5 67.9Black 166 40.91011
- - - - - - -Hispanic - -1011
- - - - - - -American Indian - -1011
- - - - - - -Asian - -1011
- - - - - - -Two or More Races - -1011
10 7.5 25 32.5 40 47.5 55Students with Disabilities 30 17.51011
- - - - - - -Limited English Proficiency - -1011
35.9 5.4 46.7 52.1 57.5 62.9 68.3Economically Disadvantaged 167 41.31011
Performance Targets - Mathematics
Subgroup# of Valid
Test Scores
Baseline
% Proficient
Yearly
Increment
2012-2013
Target (%P)
2011-2012
Target (%P)
2013-2014
Target (%P)
2014-2015
Target (%P)
2015-2016
Target (%P)
2016-2017
Target (%P)
Baseline
year
48.8 4.3 57.4 61.7 66 70.3 74.6Schoolwide 172 53.11011
- - - - - - -White - -1011
48.8 4.3 57.4 61.7 66 70.3 74.6Black 164 53.11011
- - - - - - -Hispanic - -1011
- - - - - - -American Indian - -1011
- - - - - - -Asian - -1011
- - - - - - -Two or More Races - -1011
12.5 7.3 19.8 27.1 34.4 41.7 49Students with Disabilities 40 1112
- - - - - - -Limited English Proficiency - -1011
49.1 4.3 57.7 62 66.3 70.6 74.9Economically Disadvantaged 165 53.41011
11/5/2014
Only Includes full year students (Time In School < Year students are removed)
'-' Indicates too few students to determine (N<30)
Title I Accountability System
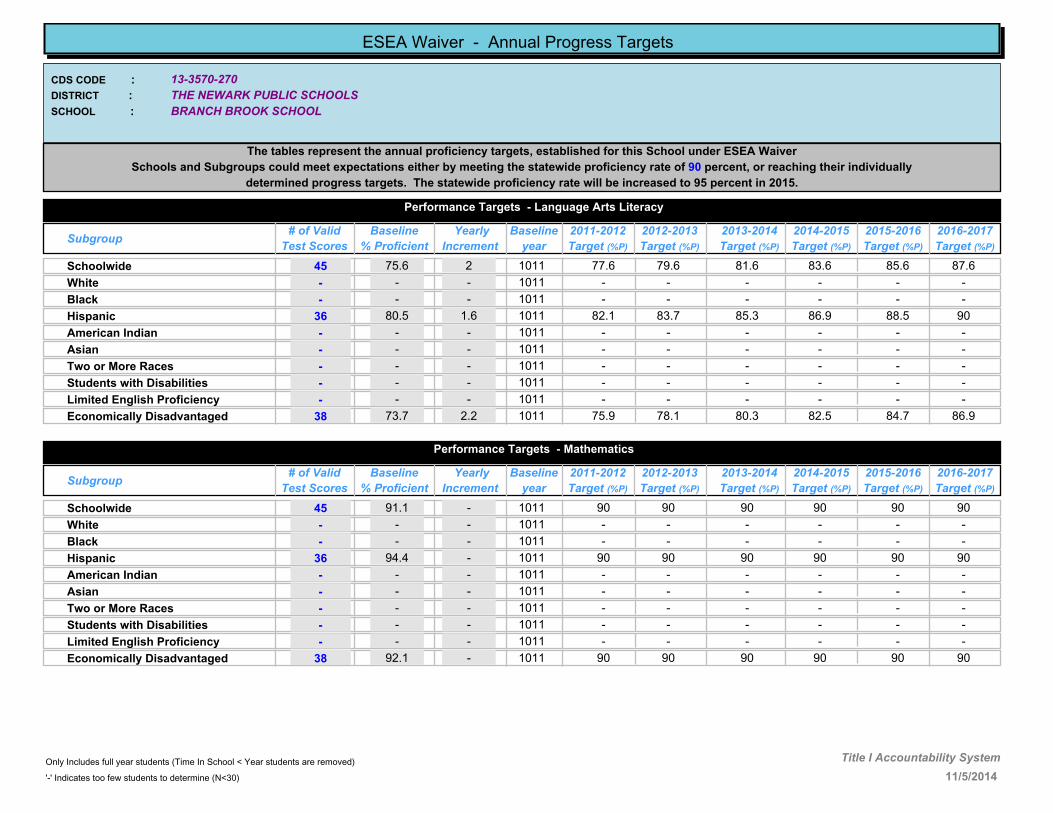
13-3570-270
BRANCH BROOK SCHOOL
THE NEWARK PUBLIC SCHOOLS
CDS CODE :
DISTRICT :
SCHOOL :
ESEA Waiver - Annual Progress Targets
The tables represent the annual proficiency targets, established for this School under ESEA Waiver
Schools and Subgroups could meet expectations either by meeting the statewide proficiency rate of 90 percent, or reaching their individually
determined progress targets. The statewide proficiency rate will be increased to 95 percent in 2015.
Performance Targets - Language Arts Literacy
Subgroup# of Valid
Test Scores
Baseline
% Proficient
Yearly
Increment
2012-2013
Target (%P)
2011-2012
Target (%P)
2013-2014
Target (%P)
2014-2015
Target (%P)
2015-2016
Target (%P)
2016-2017
Target (%P)
Baseline
year
75.6 2 79.6 81.6 83.6 85.6 87.6Schoolwide 45 77.61011
- - - - - - -White - -1011
- - - - - - -Black - -1011
80.5 1.6 83.7 85.3 86.9 88.5 90Hispanic 36 82.11011
- - - - - - -American Indian - -1011
- - - - - - -Asian - -1011
- - - - - - -Two or More Races - -1011
- - - - - - -Students with Disabilities - -1011
- - - - - - -Limited English Proficiency - -1011
73.7 2.2 78.1 80.3 82.5 84.7 86.9Economically Disadvantaged 38 75.91011
Performance Targets - Mathematics
Subgroup# of Valid
Test Scores
Baseline
% Proficient
Yearly
Increment
2012-2013
Target (%P)
2011-2012
Target (%P)
2013-2014
Target (%P)
2014-2015
Target (%P)
2015-2016
Target (%P)
2016-2017
Target (%P)
Baseline
year
91.1 - 90 90 90 90 90Schoolwide 45 901011
- - - - - - -White - -1011
- - - - - - -Black - -1011
94.4 - 90 90 90 90 90Hispanic 36 901011
- - - - - - -American Indian - -1011
- - - - - - -Asian - -1011
- - - - - - -Two or More Races - -1011
- - - - - - -Students with Disabilities - -1011
- - - - - - -Limited English Proficiency - -1011
92.1 - 90 90 90 90 90Economically Disadvantaged 38 901011
11/5/2014
Only Includes full year students (Time In School < Year students are removed)
'-' Indicates too few students to determine (N<30)
Title I Accountability System
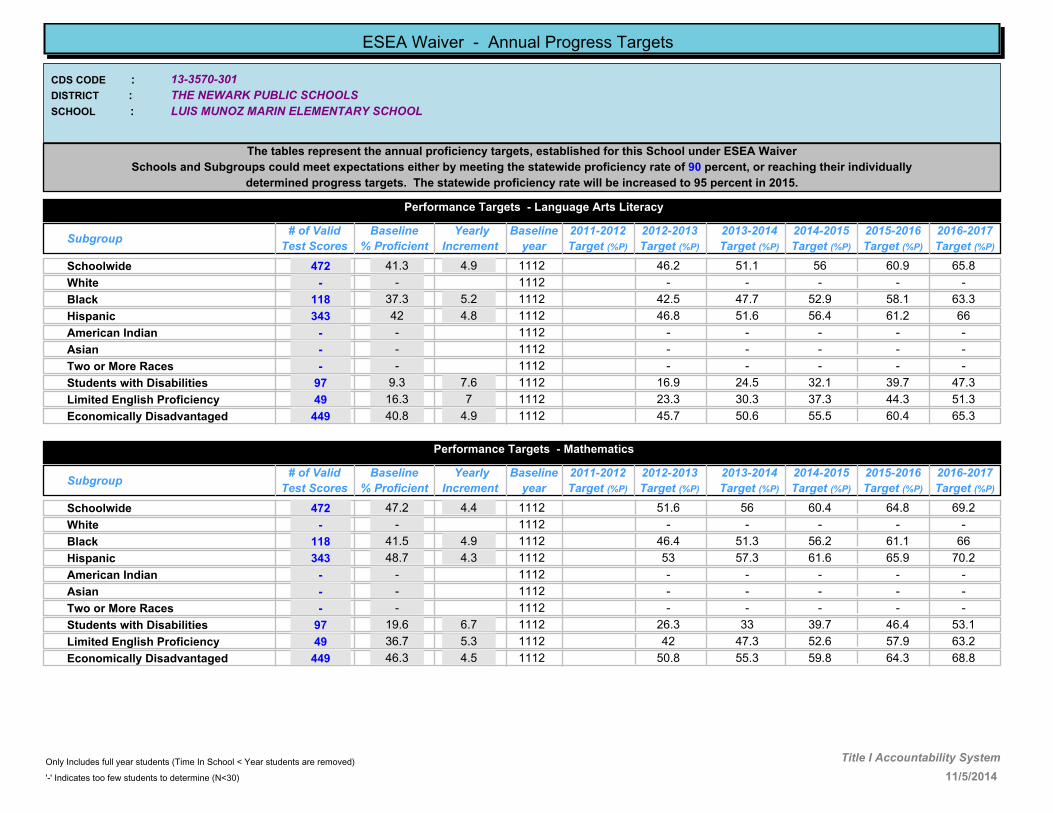
13-3570-301
LUIS MUNOZ MARIN ELEMENTARY SCHOOL
THE NEWARK PUBLIC SCHOOLS
CDS CODE :
DISTRICT :
SCHOOL :
ESEA Waiver - Annual Progress Targets
The tables represent the annual proficiency targets, established for this School under ESEA Waiver
Schools and Subgroups could meet expectations either by meeting the statewide proficiency rate of 90 percent, or reaching their individually
determined progress targets. The statewide proficiency rate will be increased to 95 percent in 2015.
Performance Targets - Language Arts Literacy
Subgroup# of Valid
Test Scores
Baseline
% Proficient
Yearly
Increment
2012-2013
Target (%P)
2011-2012
Target (%P)
2013-2014
Target (%P)
2014-2015
Target (%P)
2015-2016
Target (%P)
2016-2017
Target (%P)
Baseline
year
41.3 4.9 46.2 51.1 56 60.9 65.8Schoolwide 472 1112
- - - - - -White - 1112
37.3 5.2 42.5 47.7 52.9 58.1 63.3Black 118 1112
42 4.8 46.8 51.6 56.4 61.2 66Hispanic 343 1112
- - - - - -American Indian - 1112
- - - - - -Asian - 1112
- - - - - -Two or More Races - 1112
9.3 7.6 16.9 24.5 32.1 39.7 47.3Students with Disabilities 97 1112
16.3 7 23.3 30.3 37.3 44.3 51.3Limited English Proficiency 49 1112
40.8 4.9 45.7 50.6 55.5 60.4 65.3Economically Disadvantaged 449 1112
Performance Targets - Mathematics
Subgroup# of Valid
Test Scores
Baseline
% Proficient
Yearly
Increment
2012-2013
Target (%P)
2011-2012
Target (%P)
2013-2014
Target (%P)
2014-2015
Target (%P)
2015-2016
Target (%P)
2016-2017
Target (%P)
Baseline
year
47.2 4.4 51.6 56 60.4 64.8 69.2Schoolwide 472 1112
- - - - - -White - 1112
41.5 4.9 46.4 51.3 56.2 61.1 66Black 118 1112
48.7 4.3 53 57.3 61.6 65.9 70.2Hispanic 343 1112
- - - - - -American Indian - 1112
- - - - - -Asian - 1112
- - - - - -Two or More Races - 1112
19.6 6.7 26.3 33 39.7 46.4 53.1Students with Disabilities 97 1112
36.7 5.3 42 47.3 52.6 57.9 63.2Limited English Proficiency 49 1112
46.3 4.5 50.8 55.3 59.8 64.3 68.8Economically Disadvantaged 449 1112
11/5/2014
Only Includes full year students (Time In School < Year students are removed)
'-' Indicates too few students to determine (N<30)
Title I Accountability System
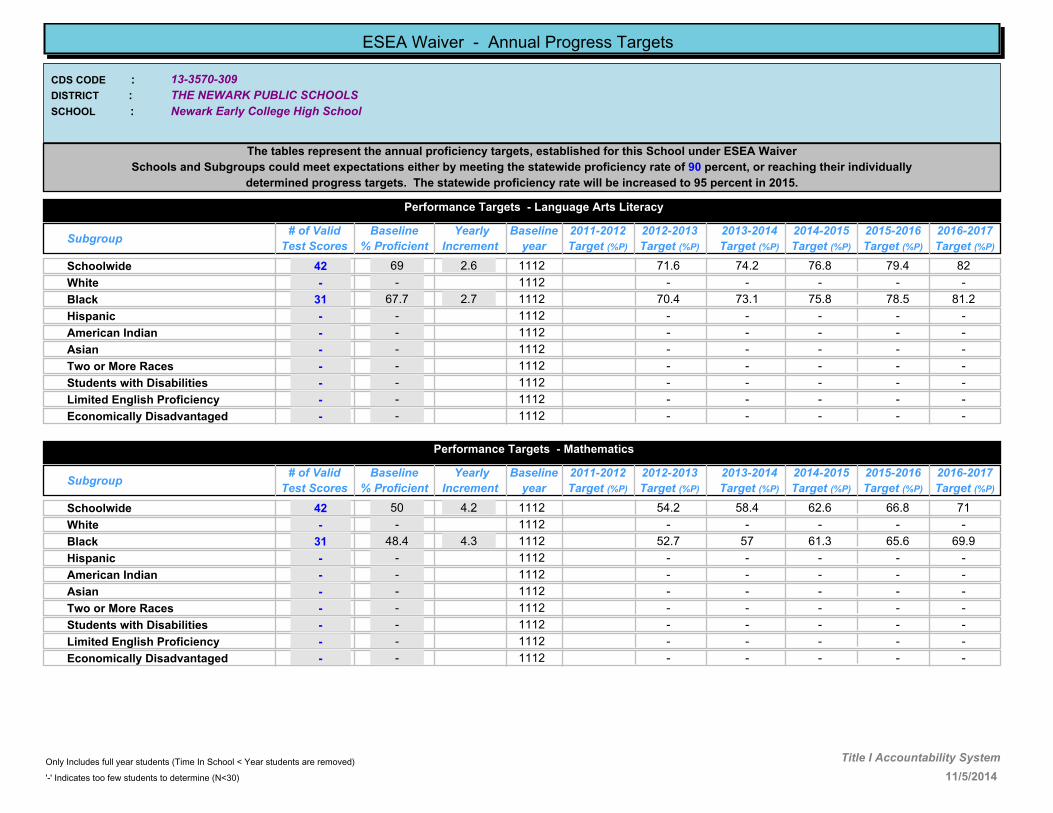
13-3570-309
Newark Early College High School
THE NEWARK PUBLIC SCHOOLS
CDS CODE :
DISTRICT :
SCHOOL :
ESEA Waiver - Annual Progress Targets
The tables represent the annual proficiency targets, established for this School under ESEA Waiver
Schools and Subgroups could meet expectations either by meeting the statewide proficiency rate of 90 percent, or reaching their individually
determined progress targets. The statewide proficiency rate will be increased to 95 percent in 2015.
Performance Targets - Language Arts Literacy
Subgroup# of Valid
Test Scores
Baseline
% Proficient
Yearly
Increment
2012-2013
Target (%P)
2011-2012
Target (%P)
2013-2014
Target (%P)
2014-2015
Target (%P)
2015-2016
Target (%P)
2016-2017
Target (%P)
Baseline
year
69 2.6 71.6 74.2 76.8 79.4 82Schoolwide 42 1112
- - - - - -White - 1112
67.7 2.7 70.4 73.1 75.8 78.5 81.2Black 31 1112
- - - - - -Hispanic - 1112
- - - - - -American Indian - 1112
- - - - - -Asian - 1112
- - - - - -Two or More Races - 1112
- - - - - -Students with Disabilities - 1112
- - - - - -Limited English Proficiency - 1112
- - - - - -Economically Disadvantaged - 1112
Performance Targets - Mathematics
Subgroup# of Valid
Test Scores
Baseline
% Proficient
Yearly
Increment
2012-2013
Target (%P)
2011-2012
Target (%P)
2013-2014
Target (%P)
2014-2015
Target (%P)
2015-2016
Target (%P)
2016-2017
Target (%P)
Baseline
year
50 4.2 54.2 58.4 62.6 66.8 71Schoolwide 42 1112
- - - - - -White - 1112
48.4 4.3 52.7 57 61.3 65.6 69.9Black 31 1112
- - - - - -Hispanic - 1112
- - - - - -American Indian - 1112
- - - - - -Asian - 1112
- - - - - -Two or More Races - 1112
- - - - - -Students with Disabilities - 1112
- - - - - -Limited English Proficiency - 1112
- - - - - -Economically Disadvantaged - 1112
11/5/2014
Only Includes full year students (Time In School < Year students are removed)
'-' Indicates too few students to determine (N<30)
Title I Accountability System

13-3570-310
CAMDEN STREET ELEMENTARY SCHOOL
THE NEWARK PUBLIC SCHOOLS
CDS CODE :
DISTRICT :
SCHOOL :
ESEA Waiver - Annual Progress Targets
The tables represent the annual proficiency targets, established for this School under ESEA Waiver
Schools and Subgroups could meet expectations either by meeting the statewide proficiency rate of 90 percent, or reaching their individually
determined progress targets. The statewide proficiency rate will be increased to 95 percent in 2015.
Performance Targets - Language Arts Literacy
Subgroup# of Valid
Test Scores
Baseline
% Proficient
Yearly
Increment
2012-2013
Target (%P)
2011-2012
Target (%P)
2013-2014
Target (%P)
2014-2015
Target (%P)
2015-2016
Target (%P)
2016-2017
Target (%P)
Baseline
year
29.7 5.9 41.5 47.4 53.3 59.2 65.1Schoolwide 111 35.61011
- - - - - - -White - -1011
25 6.3 37.6 43.9 50.2 56.5 62.8Black 88 31.31011
28.9 5.9 34.8 40.7 46.6 52.5 58.4Hispanic 38 1112
- - - - - - -American Indian - -1011
- - - - - - -Asian - -1011
- - - - - - -Two or More Races - -1011
27.6 6 39.6 45.6 51.6 57.6 63.6Students with Disabilities 58 33.61011
- - - - - - -Limited English Proficiency - -1011
29.7 5.9 41.5 47.4 53.3 59.2 65.1Economically Disadvantaged 111 35.61011
Performance Targets - Mathematics
Subgroup# of Valid
Test Scores
Baseline
% Proficient
Yearly
Increment
2012-2013
Target (%P)
2011-2012
Target (%P)
2013-2014
Target (%P)
2014-2015
Target (%P)
2015-2016
Target (%P)
2016-2017
Target (%P)
Baseline
year
33.3 5.6 44.5 50.1 55.7 61.3 66.9Schoolwide 111 38.91011
- - - - - - -White - -1011
34.1 5.5 45.1 50.6 56.1 61.6 67.1Black 88 39.61011
47.4 4.4 51.8 56.2 60.6 65 69.4Hispanic 38 1112
- - - - - - -American Indian - -1011
- - - - - - -Asian - -1011
- - - - - - -Two or More Races - -1011
15.5 7.1 29.7 36.8 43.9 51 58.1Students with Disabilities 58 22.61011
- - - - - - -Limited English Proficiency - -1011
33.3 5.6 44.5 50.1 55.7 61.3 66.9Economically Disadvantaged 111 38.91011
11/5/2014
Only Includes full year students (Time In School < Year students are removed)
'-' Indicates too few students to determine (N<30)
Title I Accountability System

13-3570-330
CHANCELLOR AVENUE SCHOOL
THE NEWARK PUBLIC SCHOOLS
CDS CODE :
DISTRICT :
SCHOOL :
ESEA Waiver - Annual Progress Targets
The tables represent the annual proficiency targets, established for this School under ESEA Waiver
Schools and Subgroups could meet expectations either by meeting the statewide proficiency rate of 90 percent, or reaching their individually
determined progress targets. The statewide proficiency rate will be increased to 95 percent in 2015.
Performance Targets - Language Arts Literacy
Subgroup# of Valid
Test Scores
Baseline
% Proficient
Yearly
Increment
2012-2013
Target (%P)
2011-2012
Target (%P)
2013-2014
Target (%P)
2014-2015
Target (%P)
2015-2016
Target (%P)
2016-2017
Target (%P)
Baseline
year
36 5.4 46.8 52.2 57.6 63 68.4Schoolwide 217 41.41011
- - - - - - -White - -1011
36.8 5.3 47.4 52.7 58 63.3 68.6Black 201 42.11011
- - - - - - -Hispanic - -1011
- - - - - - -American Indian - -1011
- - - - - - -Asian - -1011
- - - - - - -Two or More Races - -1011
4.4 8 12.4 20.4 28.4 36.4 44.4Students with Disabilities 45 1112
- - - - - - -Limited English Proficiency - -1011
37.4 5.2 47.8 53 58.2 63.4 68.6Economically Disadvantaged 195 42.61011
Performance Targets - Mathematics
Subgroup# of Valid
Test Scores
Baseline
% Proficient
Yearly
Increment
2012-2013
Target (%P)
2011-2012
Target (%P)
2013-2014
Target (%P)
2014-2015
Target (%P)
2015-2016
Target (%P)
2016-2017
Target (%P)
Baseline
year
46.3 4.5 55.3 59.8 64.3 68.8 73.3Schoolwide 216 50.81011
- - - - - - -White - -1011
45.5 4.6 54.7 59.3 63.9 68.5 73.1Black 200 50.11011
- - - - - - -Hispanic - -1011
- - - - - - -American Indian - -1011
- - - - - - -Asian - -1011
- - - - - - -Two or More Races - -1011
11.4 7.4 18.8 26.2 33.6 41 48.4Students with Disabilities 44 1112
- - - - - - -Limited English Proficiency - -1011
45.6 4.5 54.6 59.1 63.6 68.1 72.6Economically Disadvantaged 195 50.11011
11/5/2014
Only Includes full year students (Time In School < Year students are removed)
'-' Indicates too few students to determine (N<30)
Title I Accountability System
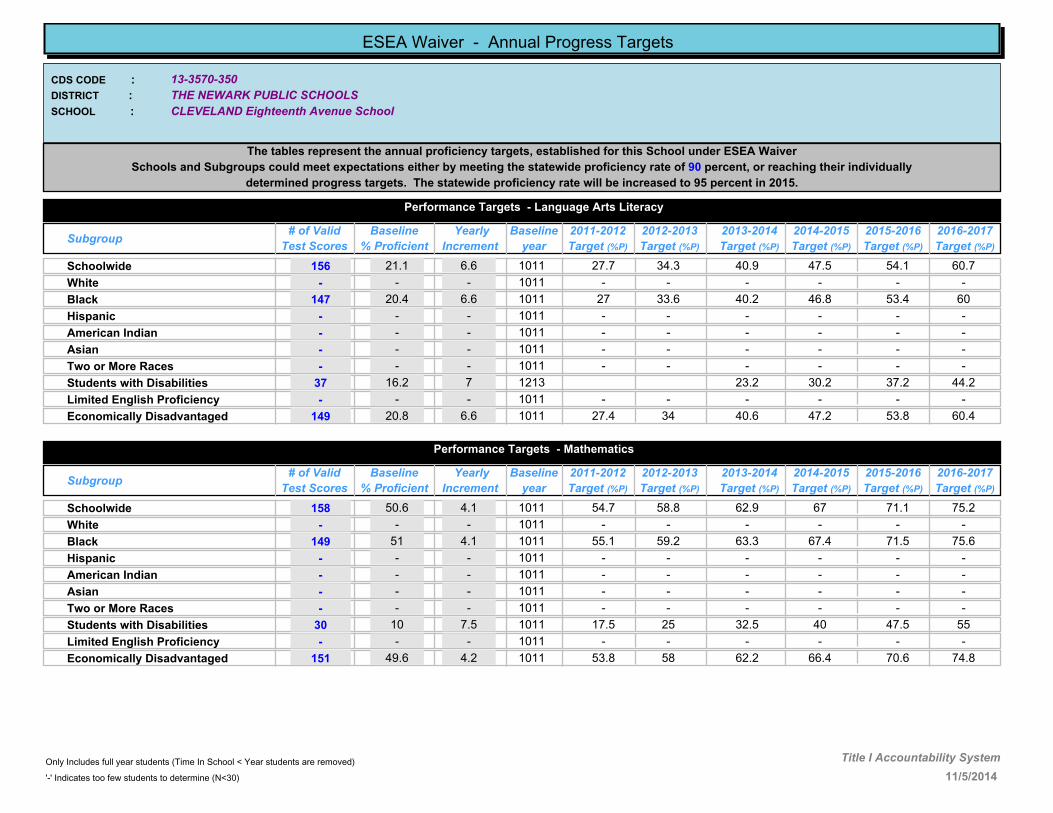
13-3570-350
CLEVELAND Eighteenth Avenue School
THE NEWARK PUBLIC SCHOOLS
CDS CODE :
DISTRICT :
SCHOOL :
ESEA Waiver - Annual Progress Targets
The tables represent the annual proficiency targets, established for this School under ESEA Waiver
Schools and Subgroups could meet expectations either by meeting the statewide proficiency rate of 90 percent, or reaching their individually
determined progress targets. The statewide proficiency rate will be increased to 95 percent in 2015.
Performance Targets - Language Arts Literacy
Subgroup# of Valid
Test Scores
Baseline
% Proficient
Yearly
Increment
2012-2013
Target (%P)
2011-2012
Target (%P)
2013-2014
Target (%P)
2014-2015
Target (%P)
2015-2016
Target (%P)
2016-2017
Target (%P)
Baseline
year
21.1 6.6 34.3 40.9 47.5 54.1 60.7Schoolwide 156 27.71011
- - - - - - -White - -1011
20.4 6.6 33.6 40.2 46.8 53.4 60Black 147 271011
- - - - - - -Hispanic - -1011
- - - - - - -American Indian - -1011
- - - - - - -Asian - -1011
- - - - - - -Two or More Races - -1011
16.2 7 23.2 30.2 37.2 44.2Students with Disabilities 37 1213
- - - - - - -Limited English Proficiency - -1011
20.8 6.6 34 40.6 47.2 53.8 60.4Economically Disadvantaged 149 27.41011
Performance Targets - Mathematics
Subgroup# of Valid
Test Scores
Baseline
% Proficient
Yearly
Increment
2012-2013
Target (%P)
2011-2012
Target (%P)
2013-2014
Target (%P)
2014-2015
Target (%P)
2015-2016
Target (%P)
2016-2017
Target (%P)
Baseline
year
50.6 4.1 58.8 62.9 67 71.1 75.2Schoolwide 158 54.71011
- - - - - - -White - -1011
51 4.1 59.2 63.3 67.4 71.5 75.6Black 149 55.11011
- - - - - - -Hispanic - -1011
- - - - - - -American Indian - -1011
- - - - - - -Asian - -1011
- - - - - - -Two or More Races - -1011
10 7.5 25 32.5 40 47.5 55Students with Disabilities 30 17.51011
- - - - - - -Limited English Proficiency - -1011
49.6 4.2 58 62.2 66.4 70.6 74.8Economically Disadvantaged 151 53.81011
11/5/2014
Only Includes full year students (Time In School < Year students are removed)
'-' Indicates too few students to determine (N<30)
Title I Accountability System
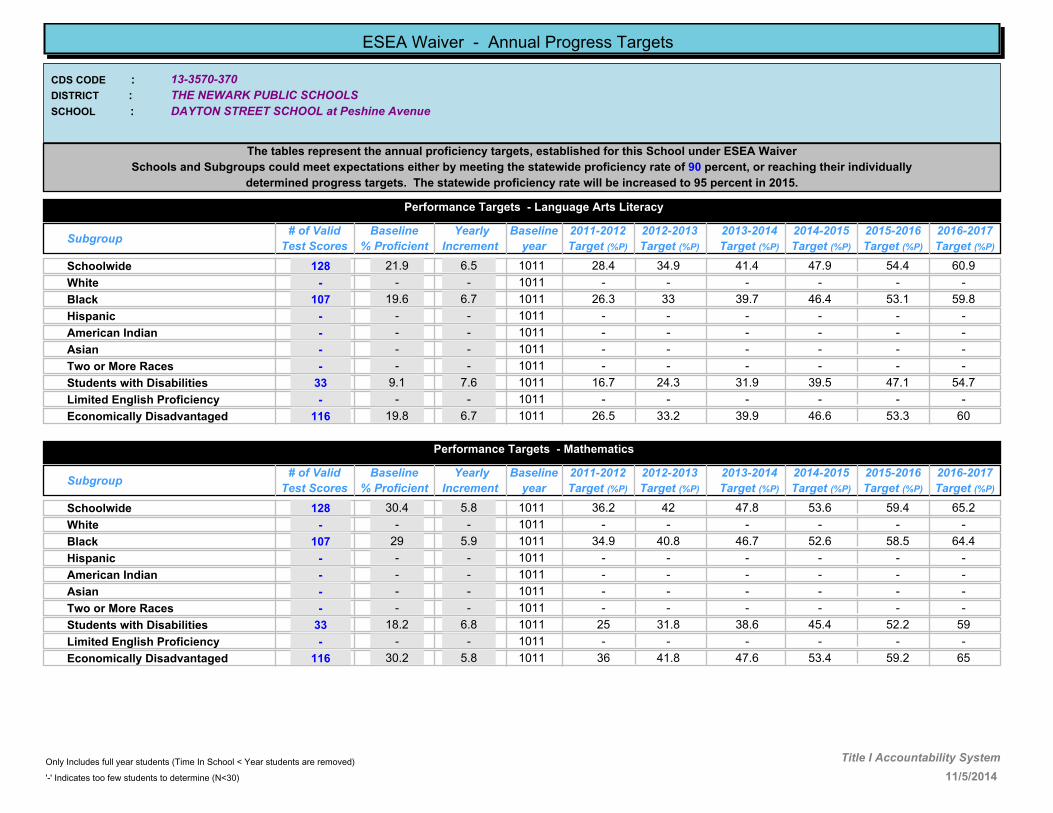
13-3570-370
DAYTON STREET SCHOOL at Peshine Avenue
THE NEWARK PUBLIC SCHOOLS
CDS CODE :
DISTRICT :
SCHOOL :
ESEA Waiver - Annual Progress Targets
The tables represent the annual proficiency targets, established for this School under ESEA Waiver
Schools and Subgroups could meet expectations either by meeting the statewide proficiency rate of 90 percent, or reaching their individually
determined progress targets. The statewide proficiency rate will be increased to 95 percent in 2015.
Performance Targets - Language Arts Literacy
Subgroup# of Valid
Test Scores
Baseline
% Proficient
Yearly
Increment
2012-2013
Target (%P)
2011-2012
Target (%P)
2013-2014
Target (%P)
2014-2015
Target (%P)
2015-2016
Target (%P)
2016-2017
Target (%P)
Baseline
year
21.9 6.5 34.9 41.4 47.9 54.4 60.9Schoolwide 128 28.41011
- - - - - - -White - -1011
19.6 6.7 33 39.7 46.4 53.1 59.8Black 107 26.31011
- - - - - - -Hispanic - -1011
- - - - - - -American Indian - -1011
- - - - - - -Asian - -1011
- - - - - - -Two or More Races - -1011
9.1 7.6 24.3 31.9 39.5 47.1 54.7Students with Disabilities 33 16.71011
- - - - - - -Limited English Proficiency - -1011
19.8 6.7 33.2 39.9 46.6 53.3 60Economically Disadvantaged 116 26.51011
Performance Targets - Mathematics
Subgroup# of Valid
Test Scores
Baseline
% Proficient
Yearly
Increment
2012-2013
Target (%P)
2011-2012
Target (%P)
2013-2014
Target (%P)
2014-2015
Target (%P)
2015-2016
Target (%P)
2016-2017
Target (%P)
Baseline
year
30.4 5.8 42 47.8 53.6 59.4 65.2Schoolwide 128 36.21011
- - - - - - -White - -1011
29 5.9 40.8 46.7 52.6 58.5 64.4Black 107 34.91011
- - - - - - -Hispanic - -1011
- - - - - - -American Indian - -1011
- - - - - - -Asian - -1011
- - - - - - -Two or More Races - -1011
18.2 6.8 31.8 38.6 45.4 52.2 59Students with Disabilities 33 251011
- - - - - - -Limited English Proficiency - -1011
30.2 5.8 41.8 47.6 53.4 59.2 65Economically Disadvantaged 116 361011
11/5/2014
Only Includes full year students (Time In School < Year students are removed)
'-' Indicates too few students to determine (N<30)
Title I Accountability System

13-3570-390
ELLIOTT STREET ELEMENTARY SCHOOL
THE NEWARK PUBLIC SCHOOLS
CDS CODE :
DISTRICT :
SCHOOL :
ESEA Waiver - Annual Progress Targets
The tables represent the annual proficiency targets, established for this School under ESEA Waiver
Schools and Subgroups could meet expectations either by meeting the statewide proficiency rate of 90 percent, or reaching their individually
determined progress targets. The statewide proficiency rate will be increased to 95 percent in 2015.
Performance Targets - Language Arts Literacy
Subgroup# of Valid
Test Scores
Baseline
% Proficient
Yearly
Increment
2012-2013
Target (%P)
2011-2012
Target (%P)
2013-2014
Target (%P)
2014-2015
Target (%P)
2015-2016
Target (%P)
2016-2017
Target (%P)
Baseline
year
34.5 5.5 45.5 51 56.5 62 67.5Schoolwide 151 401011
- - - - - - -White - -1011
- - - - - - -Black - -1011
33.4 5.6 44.6 50.2 55.8 61.4 67Hispanic 132 391011
- - - - - - -American Indian - -1011
- - - - - - -Asian - -1011
- - - - - - -Two or More Races - -1011
12.5 7.3 19.8 27.1 34.4 41.7 49Students with Disabilities 32 1112
16.2 7 30.2 37.2 44.2 51.2 58.2Limited English Proficiency 37 23.21011
34 5.5 45 50.5 56 61.5 67Economically Disadvantaged 141 39.51011
Performance Targets - Mathematics
Subgroup# of Valid
Test Scores
Baseline
% Proficient
Yearly
Increment
2012-2013
Target (%P)
2011-2012
Target (%P)
2013-2014
Target (%P)
2014-2015
Target (%P)
2015-2016
Target (%P)
2016-2017
Target (%P)
Baseline
year
57.6 3.5 64.6 68.1 71.6 75.1 78.6Schoolwide 151 61.11011
- - - - - - -White - -1011
- - - - - - -Black - -1011
56.9 3.6 64.1 67.7 71.3 74.9 78.5Hispanic 132 60.51011
- - - - - - -American Indian - -1011
- - - - - - -Asian - -1011
- - - - - - -Two or More Races - -1011
28.1 6 34.1 40.1 46.1 52.1 58.1Students with Disabilities 32 1112
37.8 5.2 48.2 53.4 58.6 63.8 69Limited English Proficiency 37 431011
56.7 3.6 63.9 67.5 71.1 74.7 78.3Economically Disadvantaged 141 60.31011
11/5/2014
Only Includes full year students (Time In School < Year students are removed)
'-' Indicates too few students to determine (N<30)
Title I Accountability System

13-3570-410
FIRST AVENUE SCHOOL
THE NEWARK PUBLIC SCHOOLS
CDS CODE :
DISTRICT :
SCHOOL :
ESEA Waiver - Annual Progress Targets
The tables represent the annual proficiency targets, established for this School under ESEA Waiver
Schools and Subgroups could meet expectations either by meeting the statewide proficiency rate of 90 percent, or reaching their individually
determined progress targets. The statewide proficiency rate will be increased to 95 percent in 2015.
Performance Targets - Language Arts Literacy
Subgroup# of Valid
Test Scores
Baseline
% Proficient
Yearly
Increment
2012-2013
Target (%P)
2011-2012
Target (%P)
2013-2014
Target (%P)
2014-2015
Target (%P)
2015-2016
Target (%P)
2016-2017
Target (%P)
Baseline
year
52.8 3.9 60.6 64.5 68.4 72.3 76.2Schoolwide 685 56.71011
- - - - - - -White - -1011
43.8 4.7 53.2 57.9 62.6 67.3 72Black 89 48.51011
53.4 3.9 61.2 65.1 69 72.9 76.8Hispanic 554 57.31011
- - - - - - -American Indian - -1011
- - - - - - -Asian - -1011
- - - - - - -Two or More Races - -1011
29.2 5.9 41 46.9 52.8 58.7 64.6Students with Disabilities 72 35.11011
30.6 5.8 42.2 48 53.8 59.6 65.4Limited English Proficiency 36 36.41011
51.3 4.1 59.5 63.6 67.7 71.8 75.9Economically Disadvantaged 600 55.41011
Performance Targets - Mathematics
Subgroup# of Valid
Test Scores
Baseline
% Proficient
Yearly
Increment
2012-2013
Target (%P)
2011-2012
Target (%P)
2013-2014
Target (%P)
2014-2015
Target (%P)
2015-2016
Target (%P)
2016-2017
Target (%P)
Baseline
year
67 2.8 72.6 75.4 78.2 81 83.8Schoolwide 685 69.81011
- - - - - - -White - -1011
60.6 3.3 67.2 70.5 73.8 77.1 80.4Black 89 63.91011
67 2.8 72.6 75.4 78.2 81 83.8Hispanic 554 69.81011
- - - - - - -American Indian - -1011
- - - - - - -Asian - -1011
- - - - - - -Two or More Races - -1011
43 4.8 52.6 57.4 62.2 67 71.8Students with Disabilities 72 47.81011
50 4.2 58.4 62.6 66.8 71 75.2Limited English Proficiency 36 54.21011
66.5 2.8 72.1 74.9 77.7 80.5 83.3Economically Disadvantaged 600 69.31011
11/5/2014
Only Includes full year students (Time In School < Year students are removed)
'-' Indicates too few students to determine (N<30)
Title I Accountability System

13-3570-415
Dr. E. ALMA FLAGG SCHOOL
THE NEWARK PUBLIC SCHOOLS
CDS CODE :
DISTRICT :
SCHOOL :
ESEA Waiver - Annual Progress Targets
The tables represent the annual proficiency targets, established for this School under ESEA Waiver
Schools and Subgroups could meet expectations either by meeting the statewide proficiency rate of 90 percent, or reaching their individually
determined progress targets. The statewide proficiency rate will be increased to 95 percent in 2015.
Performance Targets - Language Arts Literacy
Subgroup# of Valid
Test Scores
Baseline
% Proficient
Yearly
Increment
2012-2013
Target (%P)
2011-2012
Target (%P)
2013-2014
Target (%P)
2014-2015
Target (%P)
2015-2016
Target (%P)
2016-2017
Target (%P)
Baseline
year
26.9 6.1 39.1 45.2 51.3 57.4 63.5Schoolwide 334 331011
- - - - - - -White - -1011
26.1 6.2 38.5 44.7 50.9 57.1 63.3Black 149 32.31011
26.7 6.1 38.9 45 51.1 57.2 63.3Hispanic 183 32.81011
- - - - - - -American Indian - -1011
- - - - - - -Asian - -1011
- - - - - - -Two or More Races - -1011
25.5 6.2 37.9 44.1 50.3 56.5 62.7Students with Disabilities 47 31.71011
- - - - - - -Limited English Proficiency - -1011
26.4 6.1 38.6 44.7 50.8 56.9 63Economically Disadvantaged 311 32.51011
Performance Targets - Mathematics
Subgroup# of Valid
Test Scores
Baseline
% Proficient
Yearly
Increment
2012-2013
Target (%P)
2011-2012
Target (%P)
2013-2014
Target (%P)
2014-2015
Target (%P)
2015-2016
Target (%P)
2016-2017
Target (%P)
Baseline
year
47.9 4.4 56.7 61.1 65.5 69.9 74.3Schoolwide 334 52.31011
- - - - - - -White - -1011
42.3 4.8 51.9 56.7 61.5 66.3 71.1Black 149 47.11011
51.9 4 59.9 63.9 67.9 71.9 75.9Hispanic 183 55.91011
- - - - - - -American Indian - -1011
- - - - - - -Asian - -1011
- - - - - - -Two or More Races - -1011
38.3 5.2 48.7 53.9 59.1 64.3 69.5Students with Disabilities 47 43.51011
- - - - - - -Limited English Proficiency - -1011
48.5 4.3 57.1 61.4 65.7 70 74.3Economically Disadvantaged 311 52.81011
11/5/2014
Only Includes full year students (Time In School < Year students are removed)
'-' Indicates too few students to determine (N<30)
Title I Accountability System

13-3570-420
FOURTEENTH AVENUE SCHOOL
THE NEWARK PUBLIC SCHOOLS
CDS CODE :
DISTRICT :
SCHOOL :
ESEA Waiver - Annual Progress Targets
The tables represent the annual proficiency targets, established for this School under ESEA Waiver
Schools and Subgroups could meet expectations either by meeting the statewide proficiency rate of 90 percent, or reaching their individually
determined progress targets. The statewide proficiency rate will be increased to 95 percent in 2015.
Performance Targets - Language Arts Literacy
Subgroup# of Valid
Test Scores
Baseline
% Proficient
Yearly
Increment
2012-2013
Target (%P)
2011-2012
Target (%P)
2013-2014
Target (%P)
2014-2015
Target (%P)
2015-2016
Target (%P)
2016-2017
Target (%P)
Baseline
year
78.7 1.8 82.3 84.1 85.9 87.7 89.5Schoolwide 61 80.51011
- - - - - - -White - -1011
80 1.7 83.4 85.1 86.8 88.5 90Black 40 81.71011
- - - - - - -Hispanic - -1011
- - - - - - -American Indian - -1011
- - - - - - -Asian - -1011
- - - - - - -Two or More Races - -1011
- - - - - - -Students with Disabilities - -1011
- - - - - - -Limited English Proficiency - -1011
80.3 1.6 83.5 85.1 86.7 88.3 89.9Economically Disadvantaged 56 81.91011
Performance Targets - Mathematics
Subgroup# of Valid
Test Scores
Baseline
% Proficient
Yearly
Increment
2012-2013
Target (%P)
2011-2012
Target (%P)
2013-2014
Target (%P)
2014-2015
Target (%P)
2015-2016
Target (%P)
2016-2017
Target (%P)
Baseline
year
82 1.5 85 86.5 88 89.5 90Schoolwide 61 83.51011
- - - - - - -White - -1011
80 1.7 83.4 85.1 86.8 88.5 90Black 40 81.71011
- - - - - - -Hispanic - -1011
- - - - - - -American Indian - -1011
- - - - - - -Asian - -1011
- - - - - - -Two or More Races - -1011
- - - - - - -Students with Disabilities - -1011
- - - - - - -Limited English Proficiency - -1011
82.1 1.5 85.1 86.6 88.1 89.6 90Economically Disadvantaged 56 83.61011
11/5/2014
Only Includes full year students (Time In School < Year students are removed)
'-' Indicates too few students to determine (N<30)
Title I Accountability System
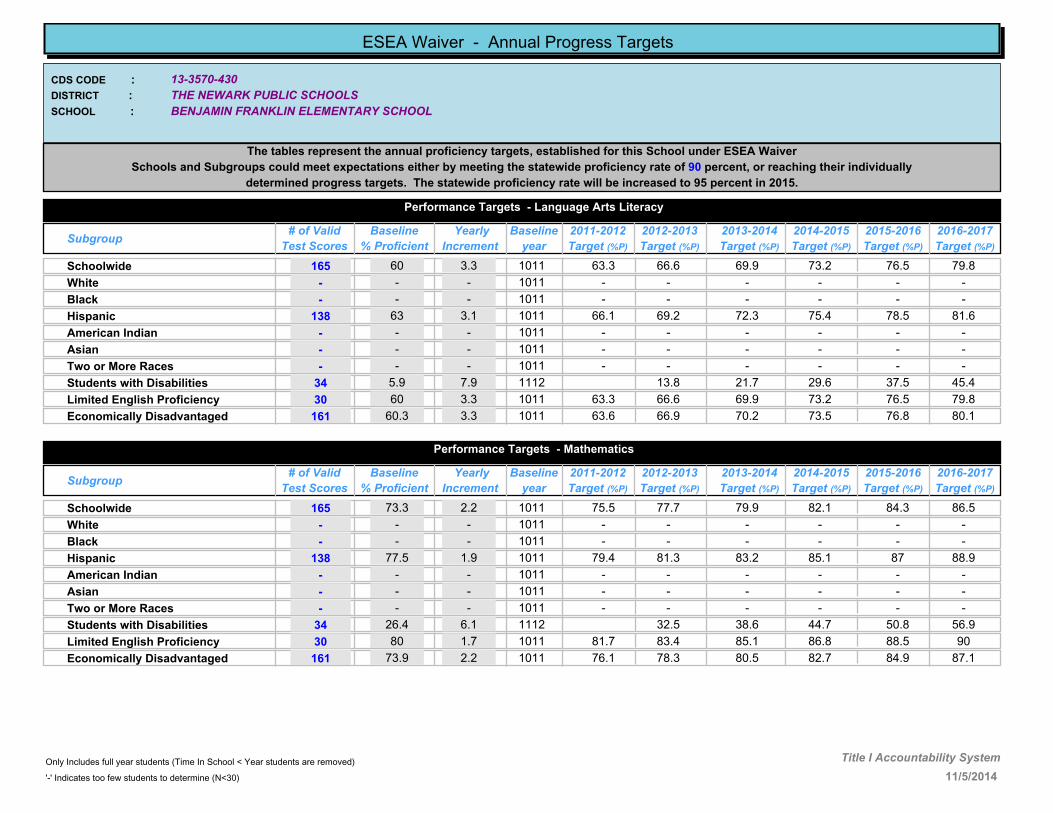
13-3570-430
BENJAMIN FRANKLIN ELEMENTARY SCHOOL
THE NEWARK PUBLIC SCHOOLS
CDS CODE :
DISTRICT :
SCHOOL :
ESEA Waiver - Annual Progress Targets
The tables represent the annual proficiency targets, established for this School under ESEA Waiver
Schools and Subgroups could meet expectations either by meeting the statewide proficiency rate of 90 percent, or reaching their individually
determined progress targets. The statewide proficiency rate will be increased to 95 percent in 2015.
Performance Targets - Language Arts Literacy
Subgroup# of Valid
Test Scores
Baseline
% Proficient
Yearly
Increment
2012-2013
Target (%P)
2011-2012
Target (%P)
2013-2014
Target (%P)
2014-2015
Target (%P)
2015-2016
Target (%P)
2016-2017
Target (%P)
Baseline
year
60 3.3 66.6 69.9 73.2 76.5 79.8Schoolwide 165 63.31011
- - - - - - -White - -1011
- - - - - - -Black - -1011
63 3.1 69.2 72.3 75.4 78.5 81.6Hispanic 138 66.11011
- - - - - - -American Indian - -1011
- - - - - - -Asian - -1011
- - - - - - -Two or More Races - -1011
5.9 7.9 13.8 21.7 29.6 37.5 45.4Students with Disabilities 34 1112
60 3.3 66.6 69.9 73.2 76.5 79.8Limited English Proficiency 30 63.31011
60.3 3.3 66.9 70.2 73.5 76.8 80.1Economically Disadvantaged 161 63.61011
Performance Targets - Mathematics
Subgroup# of Valid
Test Scores
Baseline
% Proficient
Yearly
Increment
2012-2013
Target (%P)
2011-2012
Target (%P)
2013-2014
Target (%P)
2014-2015
Target (%P)
2015-2016
Target (%P)
2016-2017
Target (%P)
Baseline
year
73.3 2.2 77.7 79.9 82.1 84.3 86.5Schoolwide 165 75.51011
- - - - - - -White - -1011
- - - - - - -Black - -1011
77.5 1.9 81.3 83.2 85.1 87 88.9Hispanic 138 79.41011
- - - - - - -American Indian - -1011
- - - - - - -Asian - -1011
- - - - - - -Two or More Races - -1011
26.4 6.1 32.5 38.6 44.7 50.8 56.9Students with Disabilities 34 1112
80 1.7 83.4 85.1 86.8 88.5 90Limited English Proficiency 30 81.71011
73.9 2.2 78.3 80.5 82.7 84.9 87.1Economically Disadvantaged 161 76.11011
11/5/2014
Only Includes full year students (Time In School < Year students are removed)
'-' Indicates too few students to determine (N<30)
Title I Accountability System
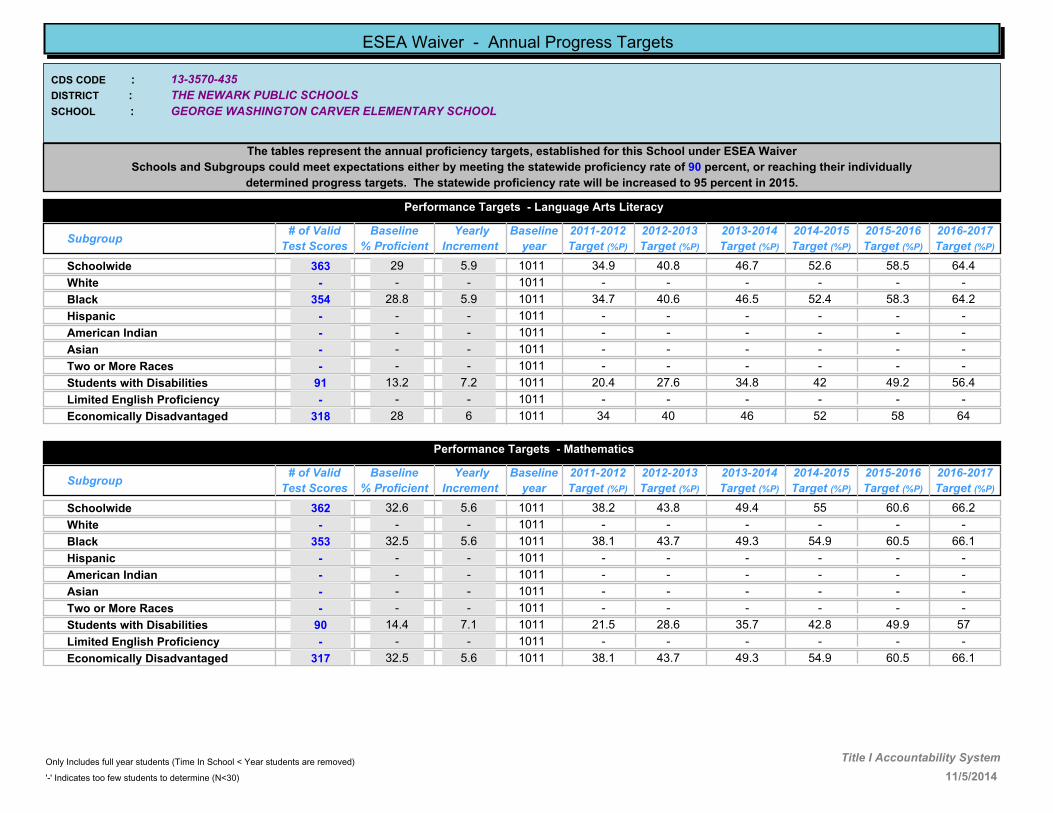
13-3570-435
GEORGE WASHINGTON CARVER ELEMENTARY SCHOOL
THE NEWARK PUBLIC SCHOOLS
CDS CODE :
DISTRICT :
SCHOOL :
ESEA Waiver - Annual Progress Targets
The tables represent the annual proficiency targets, established for this School under ESEA Waiver
Schools and Subgroups could meet expectations either by meeting the statewide proficiency rate of 90 percent, or reaching their individually
determined progress targets. The statewide proficiency rate will be increased to 95 percent in 2015.
Performance Targets - Language Arts Literacy
Subgroup# of Valid
Test Scores
Baseline
% Proficient
Yearly
Increment
2012-2013
Target (%P)
2011-2012
Target (%P)
2013-2014
Target (%P)
2014-2015
Target (%P)
2015-2016
Target (%P)
2016-2017
Target (%P)
Baseline
year
29 5.9 40.8 46.7 52.6 58.5 64.4Schoolwide 363 34.91011
- - - - - - -White - -1011
28.8 5.9 40.6 46.5 52.4 58.3 64.2Black 354 34.71011
- - - - - - -Hispanic - -1011
- - - - - - -American Indian - -1011
- - - - - - -Asian - -1011
- - - - - - -Two or More Races - -1011
13.2 7.2 27.6 34.8 42 49.2 56.4Students with Disabilities 91 20.41011
- - - - - - -Limited English Proficiency - -1011
28 6 40 46 52 58 64Economically Disadvantaged 318 341011
Performance Targets - Mathematics
Subgroup# of Valid
Test Scores
Baseline
% Proficient
Yearly
Increment
2012-2013
Target (%P)
2011-2012
Target (%P)
2013-2014
Target (%P)
2014-2015
Target (%P)
2015-2016
Target (%P)
2016-2017
Target (%P)
Baseline
year
32.6 5.6 43.8 49.4 55 60.6 66.2Schoolwide 362 38.21011
- - - - - - -White - -1011
32.5 5.6 43.7 49.3 54.9 60.5 66.1Black 353 38.11011
- - - - - - -Hispanic - -1011
- - - - - - -American Indian - -1011
- - - - - - -Asian - -1011
- - - - - - -Two or More Races - -1011
14.4 7.1 28.6 35.7 42.8 49.9 57Students with Disabilities 90 21.51011
- - - - - - -Limited English Proficiency - -1011
32.5 5.6 43.7 49.3 54.9 60.5 66.1Economically Disadvantaged 317 38.11011
11/5/2014
Only Includes full year students (Time In School < Year students are removed)
'-' Indicates too few students to determine (N<30)
Title I Accountability System

13-3570-440
DR WILLIAM H HORTON ELEMENTARY SCHOOL
THE NEWARK PUBLIC SCHOOLS
CDS CODE :
DISTRICT :
SCHOOL :
ESEA Waiver - Annual Progress Targets
The tables represent the annual proficiency targets, established for this School under ESEA Waiver
Schools and Subgroups could meet expectations either by meeting the statewide proficiency rate of 90 percent, or reaching their individually
determined progress targets. The statewide proficiency rate will be increased to 95 percent in 2015.
Performance Targets - Language Arts Literacy
Subgroup# of Valid
Test Scores
Baseline
% Proficient
Yearly
Increment
2012-2013
Target (%P)
2011-2012
Target (%P)
2013-2014
Target (%P)
2014-2015
Target (%P)
2015-2016
Target (%P)
2016-2017
Target (%P)
Baseline
year
35.4 5.4 46.2 51.6 57 62.4 67.8Schoolwide 461 40.81011
- - - - - - -White - -1011
38.1 5.2 48.5 53.7 58.9 64.1 69.3Black 92 43.31011
34.4 5.5 45.4 50.9 56.4 61.9 67.4Hispanic 355 39.91011
- - - - - - -American Indian - -1011
- - - - - - -Asian - -1011
- - - - - - -Two or More Races - -1011
25 6.3 37.6 43.9 50.2 56.5 62.8Students with Disabilities 40 31.31011
16.2 7 30.2 37.2 44.2 51.2 58.2Limited English Proficiency 68 23.21011
34.2 5.5 45.2 50.7 56.2 61.7 67.2Economically Disadvantaged 433 39.71011
Performance Targets - Mathematics
Subgroup# of Valid
Test Scores
Baseline
% Proficient
Yearly
Increment
2012-2013
Target (%P)
2011-2012
Target (%P)
2013-2014
Target (%P)
2014-2015
Target (%P)
2015-2016
Target (%P)
2016-2017
Target (%P)
Baseline
year
45.4 4.6 54.6 59.2 63.8 68.4 73Schoolwide 461 501011
- - - - - - -White - -1011
49 4.3 57.6 61.9 66.2 70.5 74.8Black 92 53.31011
44.2 4.7 53.6 58.3 63 67.7 72.4Hispanic 355 48.91011
- - - - - - -American Indian - -1011
- - - - - - -Asian - -1011
- - - - - - -Two or More Races - -1011
32.5 5.6 43.7 49.3 54.9 60.5 66.1Students with Disabilities 40 38.11011
13.2 7.2 27.6 34.8 42 49.2 56.4Limited English Proficiency 68 20.41011
44.3 4.7 53.7 58.4 63.1 67.8 72.5Economically Disadvantaged 433 491011
11/5/2014
Only Includes full year students (Time In School < Year students are removed)
'-' Indicates too few students to determine (N<30)
Title I Accountability System
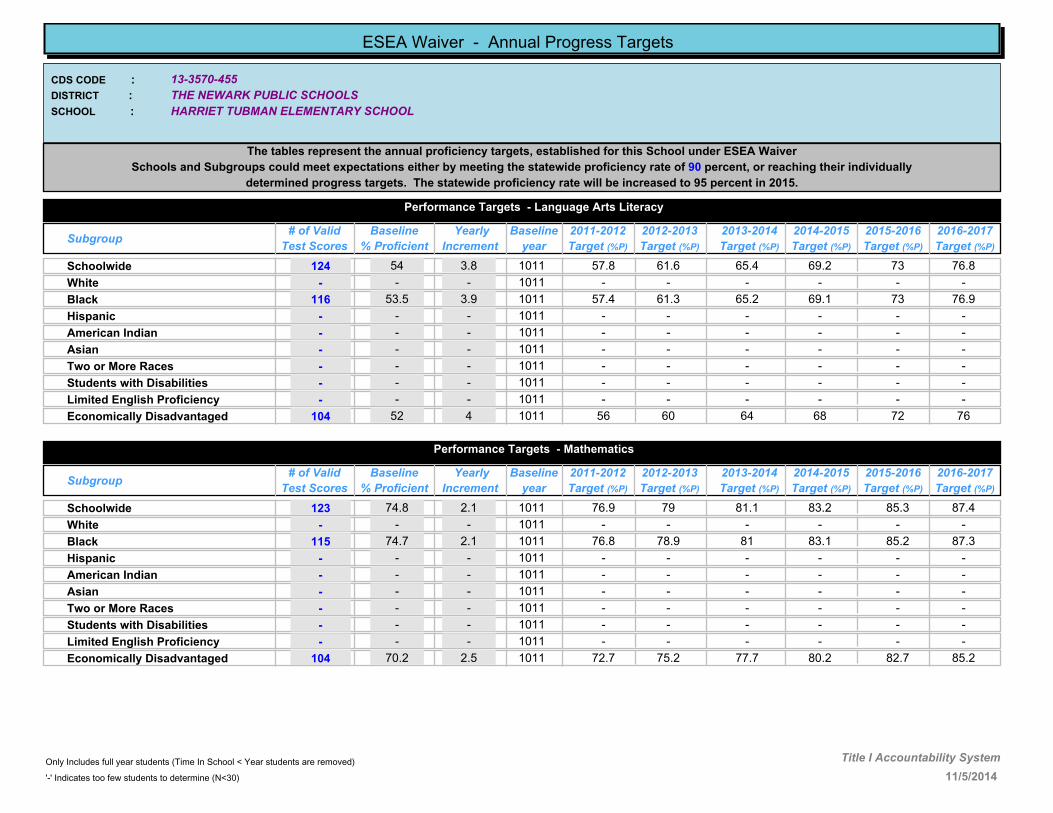
13-3570-455
HARRIET TUBMAN ELEMENTARY SCHOOL
THE NEWARK PUBLIC SCHOOLS
CDS CODE :
DISTRICT :
SCHOOL :
ESEA Waiver - Annual Progress Targets
The tables represent the annual proficiency targets, established for this School under ESEA Waiver
Schools and Subgroups could meet expectations either by meeting the statewide proficiency rate of 90 percent, or reaching their individually
determined progress targets. The statewide proficiency rate will be increased to 95 percent in 2015.
Performance Targets - Language Arts Literacy
Subgroup# of Valid
Test Scores
Baseline
% Proficient
Yearly
Increment
2012-2013
Target (%P)
2011-2012
Target (%P)
2013-2014
Target (%P)
2014-2015
Target (%P)
2015-2016
Target (%P)
2016-2017
Target (%P)
Baseline
year
54 3.8 61.6 65.4 69.2 73 76.8Schoolwide 124 57.81011
- - - - - - -White - -1011
53.5 3.9 61.3 65.2 69.1 73 76.9Black 116 57.41011
- - - - - - -Hispanic - -1011
- - - - - - -American Indian - -1011
- - - - - - -Asian - -1011
- - - - - - -Two or More Races - -1011
- - - - - - -Students with Disabilities - -1011
- - - - - - -Limited English Proficiency - -1011
52 4 60 64 68 72 76Economically Disadvantaged 104 561011
Performance Targets - Mathematics
Subgroup# of Valid
Test Scores
Baseline
% Proficient
Yearly
Increment
2012-2013
Target (%P)
2011-2012
Target (%P)
2013-2014
Target (%P)
2014-2015
Target (%P)
2015-2016
Target (%P)
2016-2017
Target (%P)
Baseline
year
74.8 2.1 79 81.1 83.2 85.3 87.4Schoolwide 123 76.91011
- - - - - - -White - -1011
74.7 2.1 78.9 81 83.1 85.2 87.3Black 115 76.81011
- - - - - - -Hispanic - -1011
- - - - - - -American Indian - -1011
- - - - - - -Asian - -1011
- - - - - - -Two or More Races - -1011
- - - - - - -Students with Disabilities - -1011
- - - - - - -Limited English Proficiency - -1011
70.2 2.5 75.2 77.7 80.2 82.7 85.2Economically Disadvantaged 104 72.71011
11/5/2014
Only Includes full year students (Time In School < Year students are removed)
'-' Indicates too few students to determine (N<30)
Title I Accountability System

13-3570-460
HAWKINS STREET SCHOOL
THE NEWARK PUBLIC SCHOOLS
CDS CODE :
DISTRICT :
SCHOOL :
ESEA Waiver - Annual Progress Targets
The tables represent the annual proficiency targets, established for this School under ESEA Waiver
Schools and Subgroups could meet expectations either by meeting the statewide proficiency rate of 90 percent, or reaching their individually
determined progress targets. The statewide proficiency rate will be increased to 95 percent in 2015.
Performance Targets - Language Arts Literacy
Subgroup# of Valid
Test Scores
Baseline
% Proficient
Yearly
Increment
2012-2013
Target (%P)
2011-2012
Target (%P)
2013-2014
Target (%P)
2014-2015
Target (%P)
2015-2016
Target (%P)
2016-2017
Target (%P)
Baseline
year
32.6 5.6 43.8 49.4 55 60.6 66.2Schoolwide 294 38.21011
- - - - - - -White - -1011
28.7 6 40.7 46.7 52.7 58.7 64.7Black 101 34.71011
32.2 5.7 43.6 49.3 55 60.7 66.4Hispanic 171 37.91011
- - - - - - -American Indian - -1011
- - - - - - -Asian - -1011
- - - - - - -Two or More Races - -1011
7.3 7.7 22.7 30.4 38.1 45.8 53.5Students with Disabilities 55 151011
- - - - - - -Limited English Proficiency - -1011
33.5 5.6 44.7 50.3 55.9 61.5 67.1Economically Disadvantaged 248 39.11011
Performance Targets - Mathematics
Subgroup# of Valid
Test Scores
Baseline
% Proficient
Yearly
Increment
2012-2013
Target (%P)
2011-2012
Target (%P)
2013-2014
Target (%P)
2014-2015
Target (%P)
2015-2016
Target (%P)
2016-2017
Target (%P)
Baseline
year
44.2 4.7 53.6 58.3 63 67.7 72.4Schoolwide 294 48.91011
- - - - - - -White - -1011
27.8 6 39.8 45.8 51.8 57.8 63.8Black 101 33.81011
52 4 60 64 68 72 76Hispanic 171 561011
- - - - - - -American Indian - -1011
- - - - - - -Asian - -1011
- - - - - - -Two or More Races - -1011
31.5 5.7 42.9 48.6 54.3 60 65.7Students with Disabilities 54 37.21011
- - - - - - -Limited English Proficiency - -1011
44.4 4.6 53.6 58.2 62.8 67.4 72Economically Disadvantaged 248 491011
11/5/2014
Only Includes full year students (Time In School < Year students are removed)
'-' Indicates too few students to determine (N<30)
Title I Accountability System

13-3570-470
HAWTHORNE AVENUE SCHOOL
THE NEWARK PUBLIC SCHOOLS
CDS CODE :
DISTRICT :
SCHOOL :
ESEA Waiver - Annual Progress Targets
The tables represent the annual proficiency targets, established for this School under ESEA Waiver
Schools and Subgroups could meet expectations either by meeting the statewide proficiency rate of 90 percent, or reaching their individually
determined progress targets. The statewide proficiency rate will be increased to 95 percent in 2015.
Performance Targets - Language Arts Literacy
Subgroup# of Valid
Test Scores
Baseline
% Proficient
Yearly
Increment
2012-2013
Target (%P)
2011-2012
Target (%P)
2013-2014
Target (%P)
2014-2015
Target (%P)
2015-2016
Target (%P)
2016-2017
Target (%P)
Baseline
year
18.5 6.8 32.1 38.9 45.7 52.5 59.3Schoolwide 211 25.31011
- - - - - - -White - -1011
19.7 6.7 33.1 39.8 46.5 53.2 59.9Black 193 26.41011
- - - - - - -Hispanic - -1011
- - - - - - -American Indian - -1011
- - - - - - -Asian - -1011
- - - - - - -Two or More Races - -1011
3.3 8.1 19.5 27.6 35.7 43.8 51.9Students with Disabilities 61 11.41011
- - - - - - -Limited English Proficiency - -1011
17.6 6.9 31.4 38.3 45.2 52.1 59Economically Disadvantaged 199 24.51011
Performance Targets - Mathematics
Subgroup# of Valid
Test Scores
Baseline
% Proficient
Yearly
Increment
2012-2013
Target (%P)
2011-2012
Target (%P)
2013-2014
Target (%P)
2014-2015
Target (%P)
2015-2016
Target (%P)
2016-2017
Target (%P)
Baseline
year
28.8 5.9 40.6 46.5 52.4 58.3 64.2Schoolwide 212 34.71011
- - - - - - -White - -1011
27.8 6 39.8 45.8 51.8 57.8 63.8Black 194 33.81011
- - - - - - -Hispanic - -1011
- - - - - - -American Indian - -1011
- - - - - - -Asian - -1011
- - - - - - -Two or More Races - -1011
14.7 7.1 28.9 36 43.1 50.2 57.3Students with Disabilities 61 21.81011
- - - - - - -Limited English Proficiency - -1011
28.5 6 40.5 46.5 52.5 58.5 64.5Economically Disadvantaged 200 34.51011
11/5/2014
Only Includes full year students (Time In School < Year students are removed)
'-' Indicates too few students to determine (N<30)
Title I Accountability System

13-3570-480
LAFAYETTE STREET SCHOOL
THE NEWARK PUBLIC SCHOOLS
CDS CODE :
DISTRICT :
SCHOOL :
ESEA Waiver - Annual Progress Targets
The tables represent the annual proficiency targets, established for this School under ESEA Waiver
Schools and Subgroups could meet expectations either by meeting the statewide proficiency rate of 90 percent, or reaching their individually
determined progress targets. The statewide proficiency rate will be increased to 95 percent in 2015.
Performance Targets - Language Arts Literacy
Subgroup# of Valid
Test Scores
Baseline
% Proficient
Yearly
Increment
2012-2013
Target (%P)
2011-2012
Target (%P)
2013-2014
Target (%P)
2014-2015
Target (%P)
2015-2016
Target (%P)
2016-2017
Target (%P)
Baseline
year
62.7 3.1 68.9 72 75.1 78.2 81.3Schoolwide 487 65.81011
71.5 2.4 76.3 78.7 81.1 83.5 85.9White 133 73.91011
- - - - - - -Black - -1011
58.3 3.5 65.3 68.8 72.3 75.8 79.3Hispanic 326 61.81011
- - - - - - -American Indian - -1011
- - - - - - -Asian - -1011
- - - - - - -Two or More Races - -1011
17.4 6.9 31.2 38.1 45 51.9 58.8Students with Disabilities 46 24.31011
47.6 4.4 56.4 60.8 65.2 69.6 74Limited English Proficiency 42 521011
60.9 3.3 67.5 70.8 74.1 77.4 80.7Economically Disadvantaged 396 64.21011
Performance Targets - Mathematics
Subgroup# of Valid
Test Scores
Baseline
% Proficient
Yearly
Increment
2012-2013
Target (%P)
2011-2012
Target (%P)
2013-2014
Target (%P)
2014-2015
Target (%P)
2015-2016
Target (%P)
2016-2017
Target (%P)
Baseline
year
81.9 1.5 84.9 86.4 87.9 89.4 90Schoolwide 487 83.41011
86.5 1.1 88.7 89.8 90 90 90White 133 87.61011
- - - - - - -Black - -1011
80.6 1.6 83.8 85.4 87 88.6 90Hispanic 326 82.21011
- - - - - - -American Indian - -1011
- - - - - - -Asian - -1011
- - - - - - -Two or More Races - -1011
56.5 3.6 63.7 67.3 70.9 74.5 78.1Students with Disabilities 46 60.11011
61.9 3.2 68.3 71.5 74.7 77.9 81.1Limited English Proficiency 42 65.11011
83.1 1.4 85.9 87.3 88.7 90 90Economically Disadvantaged 396 84.51011
11/5/2014
Only Includes full year students (Time In School < Year students are removed)
'-' Indicates too few students to determine (N<30)
Title I Accountability System

13-3570-490
LINCOLN
THE NEWARK PUBLIC SCHOOLS
CDS CODE :
DISTRICT :
SCHOOL :
ESEA Waiver - Annual Progress Targets
The tables represent the annual proficiency targets, established for this School under ESEA Waiver
Schools and Subgroups could meet expectations either by meeting the statewide proficiency rate of 90 percent, or reaching their individually
determined progress targets. The statewide proficiency rate will be increased to 95 percent in 2015.
Performance Targets - Language Arts Literacy
Subgroup# of Valid
Test Scores
Baseline
% Proficient
Yearly
Increment
2012-2013
Target (%P)
2011-2012
Target (%P)
2013-2014
Target (%P)
2014-2015
Target (%P)
2015-2016
Target (%P)
2016-2017
Target (%P)
Baseline
year
41.9 4.9 51.7 56.6 61.5 66.4 71.3Schoolwide 215 46.81011
- - - - - - -White - -1011
41.7 4.9 51.5 56.4 61.3 66.2 71.1Black 211 46.61011
- - - - - - -Hispanic - -1011
- - - - - - -American Indian - -1011
- - - - - - -Asian - -1011
- - - - - - -Two or More Races - -1011
22.5 6.5 35.5 42 48.5 55 61.5Students with Disabilities 40 291011
- - - - - - -Limited English Proficiency - -1011
43.1 4.7 52.5 57.2 61.9 66.6 71.3Economically Disadvantaged 183 47.81011
Performance Targets - Mathematics
Subgroup# of Valid
Test Scores
Baseline
% Proficient
Yearly
Increment
2012-2013
Target (%P)
2011-2012
Target (%P)
2013-2014
Target (%P)
2014-2015
Target (%P)
2015-2016
Target (%P)
2016-2017
Target (%P)
Baseline
year
45.1 4.6 54.3 58.9 63.5 68.1 72.7Schoolwide 213 49.71011
- - - - - - -White - -1011
45 4.6 54.2 58.8 63.4 68 72.6Black 209 49.61011
- - - - - - -Hispanic - -1011
- - - - - - -American Indian - -1011
- - - - - - -Asian - -1011
- - - - - - -Two or More Races - -1011
23 6.4 35.8 42.2 48.6 55 61.4Students with Disabilities 39 29.41011
- - - - - - -Limited English Proficiency - -1011
43.6 4.7 53 57.7 62.4 67.1 71.8Economically Disadvantaged 181 48.31011
11/5/2014
Only Includes full year students (Time In School < Year students are removed)
'-' Indicates too few students to determine (N<30)
Title I Accountability System

13-3570-495
LOUISE A SPENCER ELEMENTARY SCHOOL
THE NEWARK PUBLIC SCHOOLS
CDS CODE :
DISTRICT :
SCHOOL :
ESEA Waiver - Annual Progress Targets
The tables represent the annual proficiency targets, established for this School under ESEA Waiver
Schools and Subgroups could meet expectations either by meeting the statewide proficiency rate of 90 percent, or reaching their individually
determined progress targets. The statewide proficiency rate will be increased to 95 percent in 2015.
Performance Targets - Language Arts Literacy
Subgroup# of Valid
Test Scores
Baseline
% Proficient
Yearly
Increment
2012-2013
Target (%P)
2011-2012
Target (%P)
2013-2014
Target (%P)
2014-2015
Target (%P)
2015-2016
Target (%P)
2016-2017
Target (%P)
Baseline
year
25.3 6.2 37.7 43.9 50.1 56.3 62.5Schoolwide 300 31.51011
- - - - - - -White - -1011
25.5 6.2 37.9 44.1 50.3 56.5 62.7Black 243 31.71011
61.6 3.2 64.8 68 71.2 74.4 77.6Hispanic 65 1112
- - - - - - -American Indian - -1011
- - - - - - -Asian - -1011
- - - - - - -Two or More Races - -1011
6.5 7.8 22.1 29.9 37.7 45.5 53.3Students with Disabilities 46 14.31011
- - - - - - -Limited English Proficiency - -1011
24.4 6.3 37 43.3 49.6 55.9 62.2Economically Disadvantaged 254 30.71011
Performance Targets - Mathematics
Subgroup# of Valid
Test Scores
Baseline
% Proficient
Yearly
Increment
2012-2013
Target (%P)
2011-2012
Target (%P)
2013-2014
Target (%P)
2014-2015
Target (%P)
2015-2016
Target (%P)
2016-2017
Target (%P)
Baseline
year
29.1 5.9 40.9 46.8 52.7 58.6 64.5Schoolwide 299 351011
- - - - - - -White - -1011
26.9 6.1 39.1 45.2 51.3 57.4 63.5Black 242 331011
68.2 2.7 70.9 73.6 76.3 79 81.7Hispanic 66 1112
- - - - - - -American Indian - -1011
- - - - - - -Asian - -1011
- - - - - - -Two or More Races - -1011
11.1 7.4 25.9 33.3 40.7 48.1 55.5Students with Disabilities 45 18.51011
- - - - - - -Limited English Proficiency - -1011
27.2 6.1 39.4 45.5 51.6 57.7 63.8Economically Disadvantaged 253 33.31011
11/5/2014
Only Includes full year students (Time In School < Year students are removed)
'-' Indicates too few students to determine (N<30)
Title I Accountability System
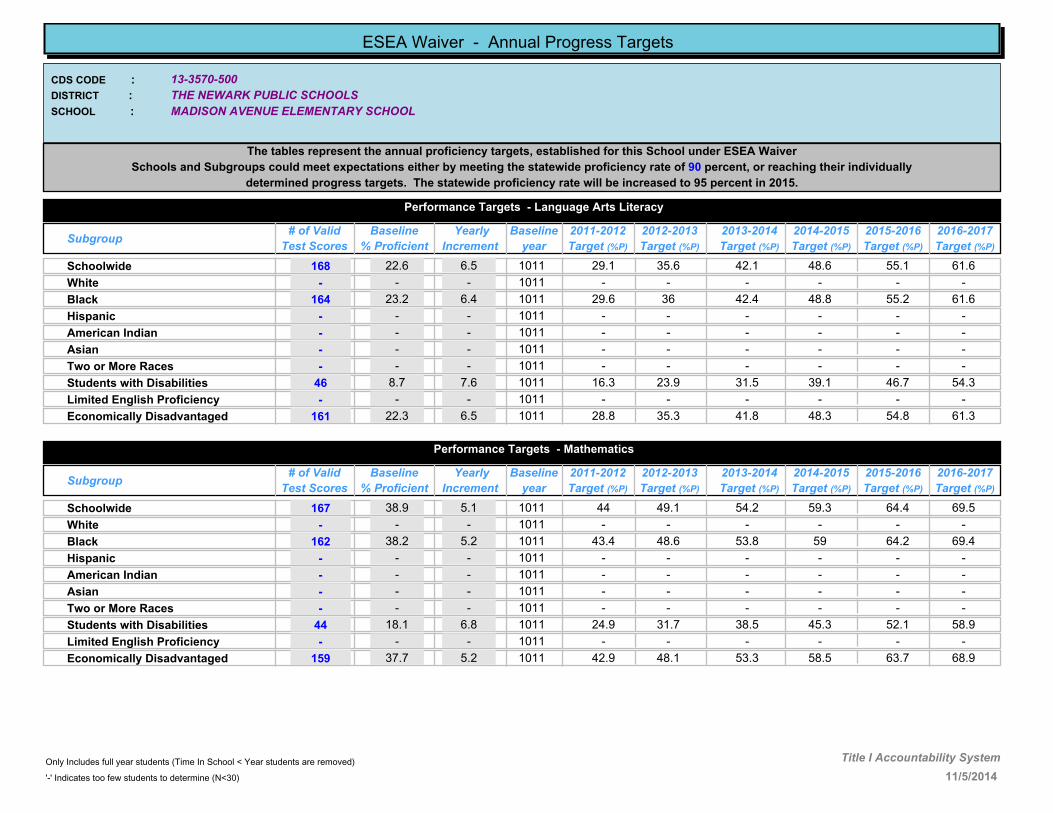
13-3570-500
MADISON AVENUE ELEMENTARY SCHOOL
THE NEWARK PUBLIC SCHOOLS
CDS CODE :
DISTRICT :
SCHOOL :
ESEA Waiver - Annual Progress Targets
The tables represent the annual proficiency targets, established for this School under ESEA Waiver
Schools and Subgroups could meet expectations either by meeting the statewide proficiency rate of 90 percent, or reaching their individually
determined progress targets. The statewide proficiency rate will be increased to 95 percent in 2015.
Performance Targets - Language Arts Literacy
Subgroup# of Valid
Test Scores
Baseline
% Proficient
Yearly
Increment
2012-2013
Target (%P)
2011-2012
Target (%P)
2013-2014
Target (%P)
2014-2015
Target (%P)
2015-2016
Target (%P)
2016-2017
Target (%P)
Baseline
year
22.6 6.5 35.6 42.1 48.6 55.1 61.6Schoolwide 168 29.11011
- - - - - - -White - -1011
23.2 6.4 36 42.4 48.8 55.2 61.6Black 164 29.61011
- - - - - - -Hispanic - -1011
- - - - - - -American Indian - -1011
- - - - - - -Asian - -1011
- - - - - - -Two or More Races - -1011
8.7 7.6 23.9 31.5 39.1 46.7 54.3Students with Disabilities 46 16.31011
- - - - - - -Limited English Proficiency - -1011
22.3 6.5 35.3 41.8 48.3 54.8 61.3Economically Disadvantaged 161 28.81011
Performance Targets - Mathematics
Subgroup# of Valid
Test Scores
Baseline
% Proficient
Yearly
Increment
2012-2013
Target (%P)
2011-2012
Target (%P)
2013-2014
Target (%P)
2014-2015
Target (%P)
2015-2016
Target (%P)
2016-2017
Target (%P)
Baseline
year
38.9 5.1 49.1 54.2 59.3 64.4 69.5Schoolwide 167 441011
- - - - - - -White - -1011
38.2 5.2 48.6 53.8 59 64.2 69.4Black 162 43.41011
- - - - - - -Hispanic - -1011
- - - - - - -American Indian - -1011
- - - - - - -Asian - -1011
- - - - - - -Two or More Races - -1011
18.1 6.8 31.7 38.5 45.3 52.1 58.9Students with Disabilities 44 24.91011
- - - - - - -Limited English Proficiency - -1011
37.7 5.2 48.1 53.3 58.5 63.7 68.9Economically Disadvantaged 159 42.91011
11/5/2014
Only Includes full year students (Time In School < Year students are removed)
'-' Indicates too few students to determine (N<30)
Title I Accountability System

13-3570-510
MAPLE AVENUE SCHOOL`
THE NEWARK PUBLIC SCHOOLS
CDS CODE :
DISTRICT :
SCHOOL :
ESEA Waiver - Annual Progress Targets
The tables represent the annual proficiency targets, established for this School under ESEA Waiver
Schools and Subgroups could meet expectations either by meeting the statewide proficiency rate of 90 percent, or reaching their individually
determined progress targets. The statewide proficiency rate will be increased to 95 percent in 2015.
Performance Targets - Language Arts Literacy
Subgroup# of Valid
Test Scores
Baseline
% Proficient
Yearly
Increment
2012-2013
Target (%P)
2011-2012
Target (%P)
2013-2014
Target (%P)
2014-2015
Target (%P)
2015-2016
Target (%P)
2016-2017
Target (%P)
Baseline
year
33 5.6 44.2 49.8 55.4 61 66.6Schoolwide 291 38.61011
- - - - - - -White - -1011
33.3 5.6 44.5 50.1 55.7 61.3 66.9Black 282 38.91011
- - - - - - -Hispanic - -1011
- - - - - - -American Indian - -1011
- - - - - - -Asian - -1011
- - - - - - -Two or More Races - -1011
18.5 6.8 32.1 38.9 45.7 52.5 59.3Students with Disabilities 54 25.31011
- - - - - - -Limited English Proficiency - -1011
33.1 5.6 44.3 49.9 55.5 61.1 66.7Economically Disadvantaged 254 38.71011
Performance Targets - Mathematics
Subgroup# of Valid
Test Scores
Baseline
% Proficient
Yearly
Increment
2012-2013
Target (%P)
2011-2012
Target (%P)
2013-2014
Target (%P)
2014-2015
Target (%P)
2015-2016
Target (%P)
2016-2017
Target (%P)
Baseline
year
37 5.3 47.6 52.9 58.2 63.5 68.8Schoolwide 292 42.31011
- - - - - - -White - -1011
36.9 5.3 47.5 52.8 58.1 63.4 68.7Black 282 42.21011
- - - - - - -Hispanic - -1011
- - - - - - -American Indian - -1011
- - - - - - -Asian - -1011
- - - - - - -Two or More Races - -1011
24.5 6.3 37.1 43.4 49.7 56 62.3Students with Disabilities 53 30.81011
- - - - - - -Limited English Proficiency - -1011
35.4 5.4 46.2 51.6 57 62.4 67.8Economically Disadvantaged 254 40.81011
11/5/2014
Only Includes full year students (Time In School < Year students are removed)
'-' Indicates too few students to determine (N<30)
Title I Accountability System
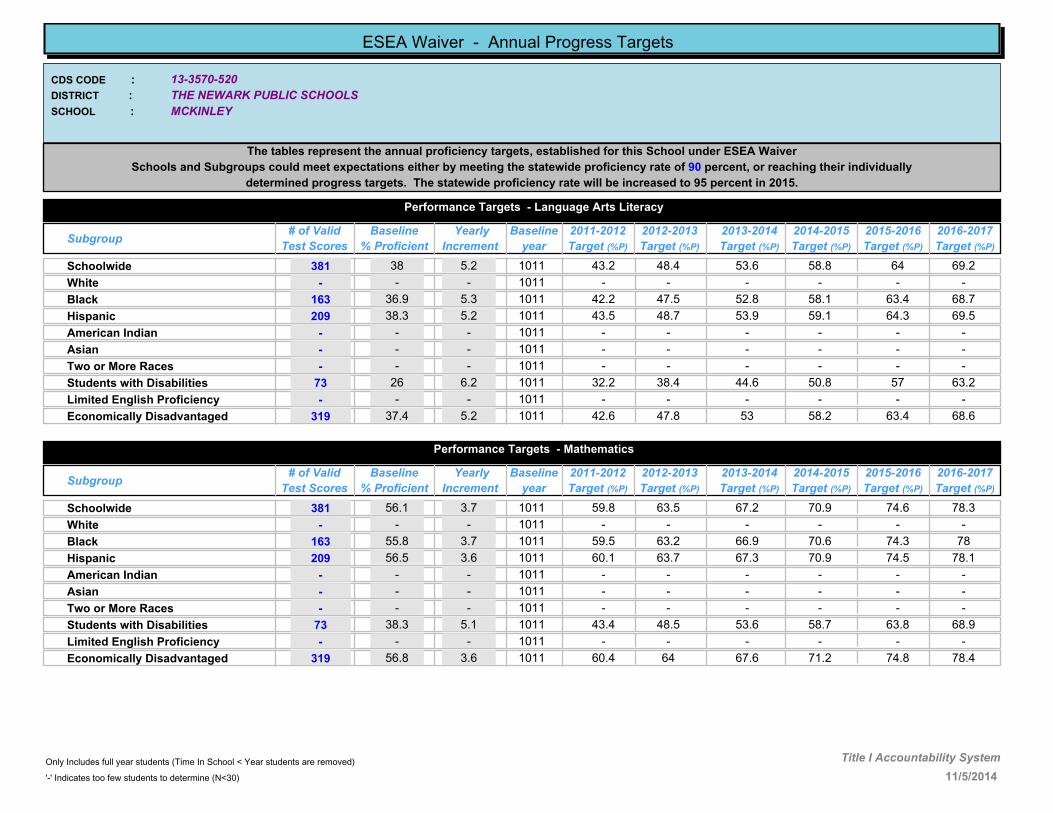
13-3570-520
MCKINLEY
THE NEWARK PUBLIC SCHOOLS
CDS CODE :
DISTRICT :
SCHOOL :
ESEA Waiver - Annual Progress Targets
The tables represent the annual proficiency targets, established for this School under ESEA Waiver
Schools and Subgroups could meet expectations either by meeting the statewide proficiency rate of 90 percent, or reaching their individually
determined progress targets. The statewide proficiency rate will be increased to 95 percent in 2015.
Performance Targets - Language Arts Literacy
Subgroup# of Valid
Test Scores
Baseline
% Proficient
Yearly
Increment
2012-2013
Target (%P)
2011-2012
Target (%P)
2013-2014
Target (%P)
2014-2015
Target (%P)
2015-2016
Target (%P)
2016-2017
Target (%P)
Baseline
year
38 5.2 48.4 53.6 58.8 64 69.2Schoolwide 381 43.21011
- - - - - - -White - -1011
36.9 5.3 47.5 52.8 58.1 63.4 68.7Black 163 42.21011
38.3 5.2 48.7 53.9 59.1 64.3 69.5Hispanic 209 43.51011
- - - - - - -American Indian - -1011
- - - - - - -Asian - -1011
- - - - - - -Two or More Races - -1011
26 6.2 38.4 44.6 50.8 57 63.2Students with Disabilities 73 32.21011
- - - - - - -Limited English Proficiency - -1011
37.4 5.2 47.8 53 58.2 63.4 68.6Economically Disadvantaged 319 42.61011
Performance Targets - Mathematics
Subgroup# of Valid
Test Scores
Baseline
% Proficient
Yearly
Increment
2012-2013
Target (%P)
2011-2012
Target (%P)
2013-2014
Target (%P)
2014-2015
Target (%P)
2015-2016
Target (%P)
2016-2017
Target (%P)
Baseline
year
56.1 3.7 63.5 67.2 70.9 74.6 78.3Schoolwide 381 59.81011
- - - - - - -White - -1011
55.8 3.7 63.2 66.9 70.6 74.3 78Black 163 59.51011
56.5 3.6 63.7 67.3 70.9 74.5 78.1Hispanic 209 60.11011
- - - - - - -American Indian - -1011
- - - - - - -Asian - -1011
- - - - - - -Two or More Races - -1011
38.3 5.1 48.5 53.6 58.7 63.8 68.9Students with Disabilities 73 43.41011
- - - - - - -Limited English Proficiency - -1011
56.8 3.6 64 67.6 71.2 74.8 78.4Economically Disadvantaged 319 60.41011
11/5/2014
Only Includes full year students (Time In School < Year students are removed)
'-' Indicates too few students to determine (N<30)
Title I Accountability System

13-3570-530
MILLER STREET SCHOOL
THE NEWARK PUBLIC SCHOOLS
CDS CODE :
DISTRICT :
SCHOOL :
ESEA Waiver - Annual Progress Targets
The tables represent the annual proficiency targets, established for this School under ESEA Waiver
Schools and Subgroups could meet expectations either by meeting the statewide proficiency rate of 90 percent, or reaching their individually
determined progress targets. The statewide proficiency rate will be increased to 95 percent in 2015.
Performance Targets - Language Arts Literacy
Subgroup# of Valid
Test Scores
Baseline
% Proficient
Yearly
Increment
2012-2013
Target (%P)
2011-2012
Target (%P)
2013-2014
Target (%P)
2014-2015
Target (%P)
2015-2016
Target (%P)
2016-2017
Target (%P)
Baseline
year
45.9 4.5 54.9 59.4 63.9 68.4 72.9Schoolwide 218 50.41011
- - - - - - -White - -1011
38.8 5.1 49 54.1 59.2 64.3 69.4Black 116 43.91011
53 3.9 60.8 64.7 68.6 72.5 76.4Hispanic 100 56.91011
- - - - - - -American Indian - -1011
- - - - - - -Asian - -1011
- - - - - - -Two or More Races - -1011
12.1 7.3 26.7 34 41.3 48.6 55.9Students with Disabilities 33 19.41011
- - - - - - -Limited English Proficiency - -1011
46.1 4.5 55.1 59.6 64.1 68.6 73.1Economically Disadvantaged 208 50.61011
Performance Targets - Mathematics
Subgroup# of Valid
Test Scores
Baseline
% Proficient
Yearly
Increment
2012-2013
Target (%P)
2011-2012
Target (%P)
2013-2014
Target (%P)
2014-2015
Target (%P)
2015-2016
Target (%P)
2016-2017
Target (%P)
Baseline
year
70.5 2.5 75.5 78 80.5 83 85.5Schoolwide 220 731011
- - - - - - -White - -1011
69.8 2.5 74.8 77.3 79.8 82.3 84.8Black 116 72.31011
70.6 2.5 75.6 78.1 80.6 83.1 85.6Hispanic 102 73.11011
- - - - - - -American Indian - -1011
- - - - - - -Asian - -1011
- - - - - - -Two or More Races - -1011
20 6.7 33.4 40.1 46.8 53.5 60.2Students with Disabilities 35 26.71011
- - - - - - -Limited English Proficiency - -1011
71.4 2.4 76.2 78.6 81 83.4 85.8Economically Disadvantaged 210 73.81011
11/5/2014
Only Includes full year students (Time In School < Year students are removed)
'-' Indicates too few students to determine (N<30)
Title I Accountability System

13-3570-565
IVY HILL ELEMENTARY SCHOOL
THE NEWARK PUBLIC SCHOOLS
CDS CODE :
DISTRICT :
SCHOOL :
ESEA Waiver - Annual Progress Targets
The tables represent the annual proficiency targets, established for this School under ESEA Waiver
Schools and Subgroups could meet expectations either by meeting the statewide proficiency rate of 90 percent, or reaching their individually
determined progress targets. The statewide proficiency rate will be increased to 95 percent in 2015.
Performance Targets - Language Arts Literacy
Subgroup# of Valid
Test Scores
Baseline
% Proficient
Yearly
Increment
2012-2013
Target (%P)
2011-2012
Target (%P)
2013-2014
Target (%P)
2014-2015
Target (%P)
2015-2016
Target (%P)
2016-2017
Target (%P)
Baseline
year
31 5.8 42.6 48.4 54.2 60 65.8Schoolwide 300 36.81011
- - - - - - -White - -1011
30.5 5.8 42.1 47.9 53.7 59.5 65.3Black 292 36.31011
- - - - - - -Hispanic - -1011
- - - - - - -American Indian - -1011
- - - - - - -Asian - -1011
- - - - - - -Two or More Races - -1011
6.5 7.8 14.3 22.1 29.9 37.7 45.5Students with Disabilities 31 1112
12.8 7.3 27.4 34.7 42 49.3 56.6Limited English Proficiency 39 20.11011
30.5 5.8 42.1 47.9 53.7 59.5 65.3Economically Disadvantaged 233 36.31011
Performance Targets - Mathematics
Subgroup# of Valid
Test Scores
Baseline
% Proficient
Yearly
Increment
2012-2013
Target (%P)
2011-2012
Target (%P)
2013-2014
Target (%P)
2014-2015
Target (%P)
2015-2016
Target (%P)
2016-2017
Target (%P)
Baseline
year
42.9 4.8 52.5 57.3 62.1 66.9 71.7Schoolwide 299 47.71011
- - - - - - -White - -1011
42.2 4.8 51.8 56.6 61.4 66.2 71Black 291 471011
- - - - - - -Hispanic - -1011
- - - - - - -American Indian - -1011
- - - - - - -Asian - -1011
- - - - - - -Two or More Races - -1011
22.6 6.5 29.1 35.6 42.1 48.6 55.1Students with Disabilities 31 1112
30.7 5.8 42.3 48.1 53.9 59.7 65.5Limited English Proficiency 39 36.51011
42.6 4.8 52.2 57 61.8 66.6 71.4Economically Disadvantaged 232 47.41011
11/5/2014
Only Includes full year students (Time In School < Year students are removed)
'-' Indicates too few students to determine (N<30)
Title I Accountability System

13-3570-570
MT VERNON PLACE SCHOOL
THE NEWARK PUBLIC SCHOOLS
CDS CODE :
DISTRICT :
SCHOOL :
ESEA Waiver - Annual Progress Targets
The tables represent the annual proficiency targets, established for this School under ESEA Waiver
Schools and Subgroups could meet expectations either by meeting the statewide proficiency rate of 90 percent, or reaching their individually
determined progress targets. The statewide proficiency rate will be increased to 95 percent in 2015.
Performance Targets - Language Arts Literacy
Subgroup# of Valid
Test Scores
Baseline
% Proficient
Yearly
Increment
2012-2013
Target (%P)
2011-2012
Target (%P)
2013-2014
Target (%P)
2014-2015
Target (%P)
2015-2016
Target (%P)
2016-2017
Target (%P)
Baseline
year
57.1 3.6 64.3 67.9 71.5 75.1 78.7Schoolwide 384 60.71011
- - - - - - -White - -1011
56.2 3.7 63.6 67.3 71 74.7 78.4Black 226 59.91011
49.4 4.2 57.8 62 66.2 70.4 74.6Hispanic 87 53.61011
- - - - - - -American Indian - -1011
65.4 2.9 71.2 74.1 77 79.9 82.8Asian 55 68.31011
- - - - - - -Two or More Races - -1011
25.5 6.2 37.9 44.1 50.3 56.5 62.7Students with Disabilities 47 31.71011
20.6 6.6 27.2 33.8 40.4 47 53.6Limited English Proficiency 34 1112
57.3 3.6 64.5 68.1 71.7 75.3 78.9Economically Disadvantaged 316 60.91011
Performance Targets - Mathematics
Subgroup# of Valid
Test Scores
Baseline
% Proficient
Yearly
Increment
2012-2013
Target (%P)
2011-2012
Target (%P)
2013-2014
Target (%P)
2014-2015
Target (%P)
2015-2016
Target (%P)
2016-2017
Target (%P)
Baseline
year
69.5 2.6 74.7 77.3 79.9 82.5 85.1Schoolwide 384 72.11011
- - - - - - -White - -1011
65.1 2.9 70.9 73.8 76.7 79.6 82.5Black 226 681011
72.4 2.3 77 79.3 81.6 83.9 86.2Hispanic 87 74.71011
- - - - - - -American Indian - -1011
78.2 1.8 81.8 83.6 85.4 87.2 89Asian 55 801011
- - - - - - -Two or More Races - -1011
55.3 3.7 62.7 66.4 70.1 73.8 77.5Students with Disabilities 47 591011
23.5 6.4 29.9 36.3 42.7 49.1 55.5Limited English Proficiency 34 1112
68.7 2.6 73.9 76.5 79.1 81.7 84.3Economically Disadvantaged 316 71.31011
11/5/2014
Only Includes full year students (Time In School < Year students are removed)
'-' Indicates too few students to determine (N<30)
Title I Accountability System

13-3570-575
RAFAEL HERNANDEZ SCHOOL
THE NEWARK PUBLIC SCHOOLS
CDS CODE :
DISTRICT :
SCHOOL :
ESEA Waiver - Annual Progress Targets
The tables represent the annual proficiency targets, established for this School under ESEA Waiver
Schools and Subgroups could meet expectations either by meeting the statewide proficiency rate of 90 percent, or reaching their individually
determined progress targets. The statewide proficiency rate will be increased to 95 percent in 2015.
Performance Targets - Language Arts Literacy
Subgroup# of Valid
Test Scores
Baseline
% Proficient
Yearly
Increment
2012-2013
Target (%P)
2011-2012
Target (%P)
2013-2014
Target (%P)
2014-2015
Target (%P)
2015-2016
Target (%P)
2016-2017
Target (%P)
Baseline
year
55.4 3.7 62.8 66.5 70.2 73.9 77.6Schoolwide 370 59.11011
- - - - - - -White - -1011
53.5 3.9 61.3 65.2 69.1 73 76.9Black 86 57.41011
57.7 3.5 64.7 68.2 71.7 75.2 78.7Hispanic 267 61.21011
- - - - - - -American Indian - -1011
- - - - - - -Asian - -1011
15.8 7 22.8 29.8 36.8 43.8 50.8Two or More Races 38 1112
17.6 6.9 31.4 38.3 45.2 52.1 59Students with Disabilities 51 24.51011
- - - - - - -Limited English Proficiency - -1011
58.6 3.5 65.6 69.1 72.6 76.1 79.6Economically Disadvantaged 319 62.11011
Performance Targets - Mathematics
Subgroup# of Valid
Test Scores
Baseline
% Proficient
Yearly
Increment
2012-2013
Target (%P)
2011-2012
Target (%P)
2013-2014
Target (%P)
2014-2015
Target (%P)
2015-2016
Target (%P)
2016-2017
Target (%P)
Baseline
year
62.3 3.2 68.7 71.9 75.1 78.3 81.5Schoolwide 371 65.51011
- - - - - - -White - -1011
61.6 3.2 68 71.2 74.4 77.6 80.8Black 86 64.81011
62 3.2 68.4 71.6 74.8 78 81.2Hispanic 268 65.21011
- - - - - - -American Indian - -1011
- - - - - - -Asian - -1011
26.3 6.2 32.5 38.7 44.9 51.1 57.3Two or More Races 38 1112
28 6 40 46 52 58 64Students with Disabilities 50 341011
- - - - - - -Limited English Proficiency - -1011
60.6 3.3 67.2 70.5 73.8 77.1 80.4Economically Disadvantaged 320 63.91011
11/5/2014
Only Includes full year students (Time In School < Year students are removed)
'-' Indicates too few students to determine (N<30)
Title I Accountability System

13-3570-580
NEWTON STREET SCHOOL
THE NEWARK PUBLIC SCHOOLS
CDS CODE :
DISTRICT :
SCHOOL :
ESEA Waiver - Annual Progress Targets
The tables represent the annual proficiency targets, established for this School under ESEA Waiver
Schools and Subgroups could meet expectations either by meeting the statewide proficiency rate of 90 percent, or reaching their individually
determined progress targets. The statewide proficiency rate will be increased to 95 percent in 2015.
Performance Targets - Language Arts Literacy
Subgroup# of Valid
Test Scores
Baseline
% Proficient
Yearly
Increment
2012-2013
Target (%P)
2011-2012
Target (%P)
2013-2014
Target (%P)
2014-2015
Target (%P)
2015-2016
Target (%P)
2016-2017
Target (%P)
Baseline
year
37.8 5.2 48.2 53.4 58.6 63.8 69Schoolwide 161 431011
- - - - - - -White - -1011
37.8 5.2 48.2 53.4 58.6 63.8 69Black 140 431011
- - - - - - -Hispanic - -1011
- - - - - - -American Indian - -1011
- - - - - - -Asian - -1011
- - - - - - -Two or More Races - -1011
- - - - - - -Students with Disabilities - -1011
- - - - - - -Limited English Proficiency - -1011
37 5.3 47.6 52.9 58.2 63.5 68.8Economically Disadvantaged 154 42.31011
Performance Targets - Mathematics
Subgroup# of Valid
Test Scores
Baseline
% Proficient
Yearly
Increment
2012-2013
Target (%P)
2011-2012
Target (%P)
2013-2014
Target (%P)
2014-2015
Target (%P)
2015-2016
Target (%P)
2016-2017
Target (%P)
Baseline
year
44.7 4.6 53.9 58.5 63.1 67.7 72.3Schoolwide 161 49.31011
- - - - - - -White - -1011
45.7 4.5 54.7 59.2 63.7 68.2 72.7Black 140 50.21011
- - - - - - -Hispanic - -1011
- - - - - - -American Indian - -1011
- - - - - - -Asian - -1011
- - - - - - -Two or More Races - -1011
- - - - - - -Students with Disabilities - -1011
- - - - - - -Limited English Proficiency - -1011
44.8 4.6 54 58.6 63.2 67.8 72.4Economically Disadvantaged 154 49.41011
11/5/2014
Only Includes full year students (Time In School < Year students are removed)
'-' Indicates too few students to determine (N<30)
Title I Accountability System

13-3570-581
PARK ELEMENTARY SCHOOL
THE NEWARK PUBLIC SCHOOLS
CDS CODE :
DISTRICT :
SCHOOL :
ESEA Waiver - Annual Progress Targets
The tables represent the annual proficiency targets, established for this School under ESEA Waiver
Schools and Subgroups could meet expectations either by meeting the statewide proficiency rate of 90 percent, or reaching their individually
determined progress targets. The statewide proficiency rate will be increased to 95 percent in 2015.
Performance Targets - Language Arts Literacy
Subgroup# of Valid
Test Scores
Baseline
% Proficient
Yearly
Increment
2012-2013
Target (%P)
2011-2012
Target (%P)
2013-2014
Target (%P)
2014-2015
Target (%P)
2015-2016
Target (%P)
2016-2017
Target (%P)
Baseline
year
52.6 4 60.6 64.6 68.6 72.6 76.6Schoolwide 388 56.61011
- - - - - - -White - -1011
35.6 5.4 46.4 51.8 57.2 62.6 68Black 73 411011
57.3 3.6 64.5 68.1 71.7 75.3 78.9Hispanic 295 60.91011
- - - - - - -American Indian - -1011
- - - - - - -Asian - -1011
- - - - - - -Two or More Races - -1011
15.6 7 29.6 36.6 43.6 50.6 57.6Students with Disabilities 64 22.61011
61.1 3.3 64.4 67.7 71 74.3 77.6Limited English Proficiency 36 1112
50.7 4.1 58.9 63 67.1 71.2 75.3Economically Disadvantaged 353 54.81011
Performance Targets - Mathematics
Subgroup# of Valid
Test Scores
Baseline
% Proficient
Yearly
Increment
2012-2013
Target (%P)
2011-2012
Target (%P)
2013-2014
Target (%P)
2014-2015
Target (%P)
2015-2016
Target (%P)
2016-2017
Target (%P)
Baseline
year
66.9 2.8 72.5 75.3 78.1 80.9 83.7Schoolwide 390 69.71011
- - - - - - -White - -1011
49.3 4.2 57.7 61.9 66.1 70.3 74.5Black 73 53.51011
71.1 2.4 75.9 78.3 80.7 83.1 85.5Hispanic 297 73.51011
- - - - - - -American Indian - -1011
- - - - - - -Asian - -1011
- - - - - - -Two or More Races - -1011
36.9 5.3 47.5 52.8 58.1 63.4 68.7Students with Disabilities 65 42.21011
72.2 2.3 74.5 76.8 79.1 81.4 83.7Limited English Proficiency 36 1112
66 2.9 71.8 74.7 77.6 80.5 83.4Economically Disadvantaged 355 68.91011
11/5/2014
Only Includes full year students (Time In School < Year students are removed)
'-' Indicates too few students to determine (N<30)
Title I Accountability System
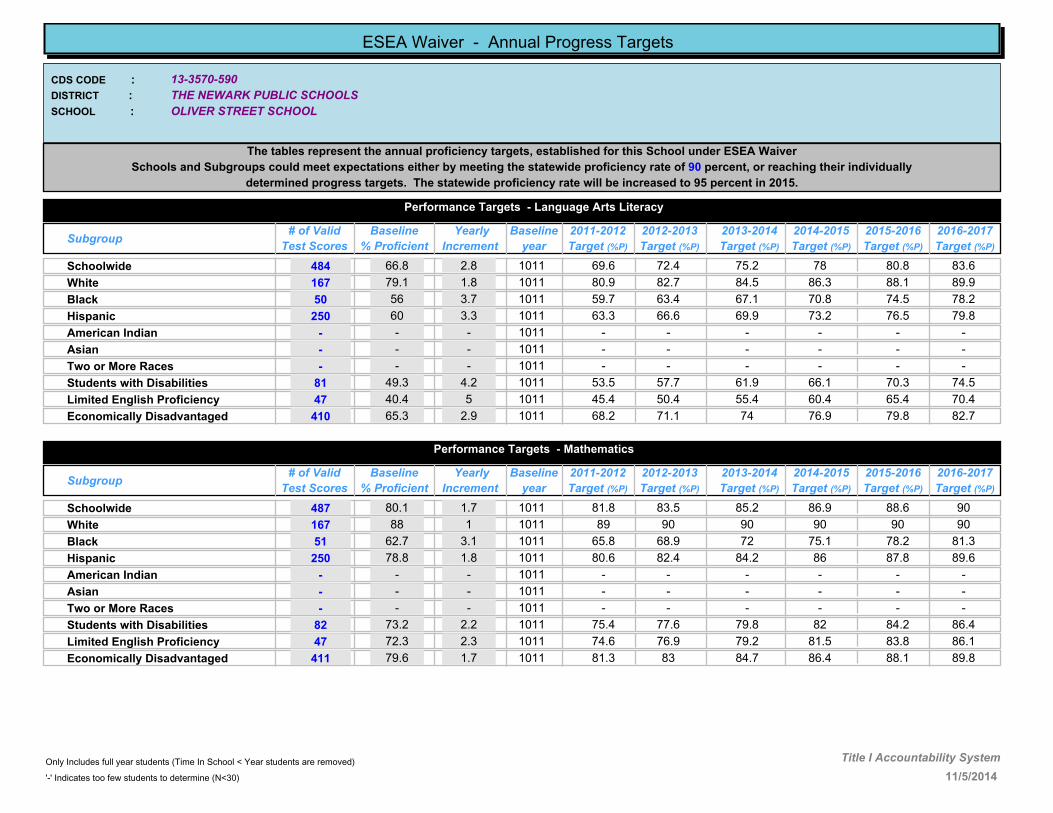
13-3570-590
OLIVER STREET SCHOOL
THE NEWARK PUBLIC SCHOOLS
CDS CODE :
DISTRICT :
SCHOOL :
ESEA Waiver - Annual Progress Targets
The tables represent the annual proficiency targets, established for this School under ESEA Waiver
Schools and Subgroups could meet expectations either by meeting the statewide proficiency rate of 90 percent, or reaching their individually
determined progress targets. The statewide proficiency rate will be increased to 95 percent in 2015.
Performance Targets - Language Arts Literacy
Subgroup# of Valid
Test Scores
Baseline
% Proficient
Yearly
Increment
2012-2013
Target (%P)
2011-2012
Target (%P)
2013-2014
Target (%P)
2014-2015
Target (%P)
2015-2016
Target (%P)
2016-2017
Target (%P)
Baseline
year
66.8 2.8 72.4 75.2 78 80.8 83.6Schoolwide 484 69.61011
79.1 1.8 82.7 84.5 86.3 88.1 89.9White 167 80.91011
56 3.7 63.4 67.1 70.8 74.5 78.2Black 50 59.71011
60 3.3 66.6 69.9 73.2 76.5 79.8Hispanic 250 63.31011
- - - - - - -American Indian - -1011
- - - - - - -Asian - -1011
- - - - - - -Two or More Races - -1011
49.3 4.2 57.7 61.9 66.1 70.3 74.5Students with Disabilities 81 53.51011
40.4 5 50.4 55.4 60.4 65.4 70.4Limited English Proficiency 47 45.41011
65.3 2.9 71.1 74 76.9 79.8 82.7Economically Disadvantaged 410 68.21011
Performance Targets - Mathematics
Subgroup# of Valid
Test Scores
Baseline
% Proficient
Yearly
Increment
2012-2013
Target (%P)
2011-2012
Target (%P)
2013-2014
Target (%P)
2014-2015
Target (%P)
2015-2016
Target (%P)
2016-2017
Target (%P)
Baseline
year
80.1 1.7 83.5 85.2 86.9 88.6 90Schoolwide 487 81.81011
88 1 90 90 90 90 90White 167 891011
62.7 3.1 68.9 72 75.1 78.2 81.3Black 51 65.81011
78.8 1.8 82.4 84.2 86 87.8 89.6Hispanic 250 80.61011
- - - - - - -American Indian - -1011
- - - - - - -Asian - -1011
- - - - - - -Two or More Races - -1011
73.2 2.2 77.6 79.8 82 84.2 86.4Students with Disabilities 82 75.41011
72.3 2.3 76.9 79.2 81.5 83.8 86.1Limited English Proficiency 47 74.61011
79.6 1.7 83 84.7 86.4 88.1 89.8Economically Disadvantaged 411 81.31011
11/5/2014
Only Includes full year students (Time In School < Year students are removed)
'-' Indicates too few students to determine (N<30)
Title I Accountability System

13-3570-605
QUITMAN COMMUNITY SCHOOL
THE NEWARK PUBLIC SCHOOLS
CDS CODE :
DISTRICT :
SCHOOL :
ESEA Waiver - Annual Progress Targets
The tables represent the annual proficiency targets, established for this School under ESEA Waiver
Schools and Subgroups could meet expectations either by meeting the statewide proficiency rate of 90 percent, or reaching their individually
determined progress targets. The statewide proficiency rate will be increased to 95 percent in 2015.
Performance Targets - Language Arts Literacy
Subgroup# of Valid
Test Scores
Baseline
% Proficient
Yearly
Increment
2012-2013
Target (%P)
2011-2012
Target (%P)
2013-2014
Target (%P)
2014-2015
Target (%P)
2015-2016
Target (%P)
2016-2017
Target (%P)
Baseline
year
21.6 6.5 34.6 41.1 47.6 54.1 60.6Schoolwide 255 28.11011
- - - - - - -White - -1011
19.8 6.7 33.2 39.9 46.6 53.3 60Black 207 26.51011
30.4 5.8 42 47.8 53.6 59.4 65.2Hispanic 46 36.21011
- - - - - - -American Indian - -1011
- - - - - - -Asian - -1011
- - - - - - -Two or More Races - -1011
6.4 7.8 22 29.8 37.6 45.4 53.2Students with Disabilities 63 14.21011
- - - - - - -Limited English Proficiency - -1011
23.4 6.4 36.2 42.6 49 55.4 61.8Economically Disadvantaged 226 29.81011
Performance Targets - Mathematics
Subgroup# of Valid
Test Scores
Baseline
% Proficient
Yearly
Increment
2012-2013
Target (%P)
2011-2012
Target (%P)
2013-2014
Target (%P)
2014-2015
Target (%P)
2015-2016
Target (%P)
2016-2017
Target (%P)
Baseline
year
31.7 5.7 43.1 48.8 54.5 60.2 65.9Schoolwide 255 37.41011
- - - - - - -White - -1011
28.5 6 40.5 46.5 52.5 58.5 64.5Black 207 34.51011
47.8 4.4 56.6 61 65.4 69.8 74.2Hispanic 46 52.21011
- - - - - - -American Indian - -1011
- - - - - - -Asian - -1011
- - - - - - -Two or More Races - -1011
12.7 7.3 27.3 34.6 41.9 49.2 56.5Students with Disabilities 63 201011
- - - - - - -Limited English Proficiency - -1011
33.2 5.6 44.4 50 55.6 61.2 66.8Economically Disadvantaged 226 38.81011
11/5/2014
Only Includes full year students (Time In School < Year students are removed)
'-' Indicates too few students to determine (N<30)
Title I Accountability System

13-3570-610
RIDGE STREET SCHOOL
THE NEWARK PUBLIC SCHOOLS
CDS CODE :
DISTRICT :
SCHOOL :
ESEA Waiver - Annual Progress Targets
The tables represent the annual proficiency targets, established for this School under ESEA Waiver
Schools and Subgroups could meet expectations either by meeting the statewide proficiency rate of 90 percent, or reaching their individually
determined progress targets. The statewide proficiency rate will be increased to 95 percent in 2015.
Performance Targets - Language Arts Literacy
Subgroup# of Valid
Test Scores
Baseline
% Proficient
Yearly
Increment
2012-2013
Target (%P)
2011-2012
Target (%P)
2013-2014
Target (%P)
2014-2015
Target (%P)
2015-2016
Target (%P)
2016-2017
Target (%P)
Baseline
year
76.1 2 80.1 82.1 84.1 86.1 88.1Schoolwide 334 78.11011
- - - - - - -White - -1011
- - - - - - -Black - -1011
76 2 80 82 84 86 88Hispanic 292 781011
- - - - - - -American Indian - -1011
- - - - - - -Asian - -1011
- - - - - - -Two or More Races - -1011
24.2 6.3 30.5 36.8 43.1 49.4 55.7Students with Disabilities 33 1112
68.6 2.6 71.2 73.8 76.4 79 81.6Limited English Proficiency 35 1112
76 2 80 82 84 86 88Economically Disadvantaged 287 781011
Performance Targets - Mathematics
Subgroup# of Valid
Test Scores
Baseline
% Proficient
Yearly
Increment
2012-2013
Target (%P)
2011-2012
Target (%P)
2013-2014
Target (%P)
2014-2015
Target (%P)
2015-2016
Target (%P)
2016-2017
Target (%P)
Baseline
year
79 1.8 82.6 84.4 86.2 88 89.8Schoolwide 334 80.81011
- - - - - - -White - -1011
- - - - - - -Black - -1011
79.4 1.7 82.8 84.5 86.2 87.9 89.6Hispanic 292 81.11011
- - - - - - -American Indian - -1011
- - - - - - -Asian - -1011
- - - - - - -Two or More Races - -1011
30.3 5.8 36.1 41.9 47.7 53.5 59.3Students with Disabilities 33 1112
77.1 1.9 79 80.9 82.8 84.7 86.6Limited English Proficiency 35 1112
78.4 1.8 82 83.8 85.6 87.4 89.2Economically Disadvantaged 287 80.21011
11/5/2014
Only Includes full year students (Time In School < Year students are removed)
'-' Indicates too few students to determine (N<30)
Title I Accountability System

13-3570-615
ROBERTO CLEMENTE ELEMENTARY SCHOOL
THE NEWARK PUBLIC SCHOOLS
CDS CODE :
DISTRICT :
SCHOOL :
ESEA Waiver - Annual Progress Targets
The tables represent the annual proficiency targets, established for this School under ESEA Waiver
Schools and Subgroups could meet expectations either by meeting the statewide proficiency rate of 90 percent, or reaching their individually
determined progress targets. The statewide proficiency rate will be increased to 95 percent in 2015.
Performance Targets - Language Arts Literacy
Subgroup# of Valid
Test Scores
Baseline
% Proficient
Yearly
Increment
2012-2013
Target (%P)
2011-2012
Target (%P)
2013-2014
Target (%P)
2014-2015
Target (%P)
2015-2016
Target (%P)
2016-2017
Target (%P)
Baseline
year
37.4 5.2 47.8 53 58.2 63.4 68.6Schoolwide 171 42.61011
- - - - - - -White - -1011
- - - - - - -Black - -1011
35.2 5.4 46 51.4 56.8 62.2 67.6Hispanic 145 40.61011
- - - - - - -American Indian - -1011
- - - - - - -Asian - -1011
- - - - - - -Two or More Races - -1011
- - - - - - -Students with Disabilities - -1011
29.3 5.9 35.2 41.1 47 52.9Limited English Proficiency 41 1213
38 5.2 48.4 53.6 58.8 64 69.2Economically Disadvantaged 166 43.21011
Performance Targets - Mathematics
Subgroup# of Valid
Test Scores
Baseline
% Proficient
Yearly
Increment
2012-2013
Target (%P)
2011-2012
Target (%P)
2013-2014
Target (%P)
2014-2015
Target (%P)
2015-2016
Target (%P)
2016-2017
Target (%P)
Baseline
year
58.7 3.5 65.7 69.2 72.7 76.2 79.7Schoolwide 172 62.21011
- - - - - - -White - -1011
- - - - - - -Black - -1011
58.2 3.5 65.2 68.7 72.2 75.7 79.2Hispanic 146 61.71011
- - - - - - -American Indian - -1011
- - - - - - -Asian - -1011
- - - - - - -Two or More Races - -1011
- - - - - - -Students with Disabilities - -1011
30.9 5.8 36.7 42.5 48.3 54.1Limited English Proficiency 42 1213
59.3 3.4 66.1 69.5 72.9 76.3 79.7Economically Disadvantaged 167 62.71011
11/5/2014
Only Includes full year students (Time In School < Year students are removed)
'-' Indicates too few students to determine (N<30)
Title I Accountability System

13-3570-630
ROSEVILLE AVENUE SCHOOL
THE NEWARK PUBLIC SCHOOLS
CDS CODE :
DISTRICT :
SCHOOL :
ESEA Waiver - Annual Progress Targets
The tables represent the annual proficiency targets, established for this School under ESEA Waiver
Schools and Subgroups could meet expectations either by meeting the statewide proficiency rate of 90 percent, or reaching their individually
determined progress targets. The statewide proficiency rate will be increased to 95 percent in 2015.
Performance Targets - Language Arts Literacy
Subgroup# of Valid
Test Scores
Baseline
% Proficient
Yearly
Increment
2012-2013
Target (%P)
2011-2012
Target (%P)
2013-2014
Target (%P)
2014-2015
Target (%P)
2015-2016
Target (%P)
2016-2017
Target (%P)
Baseline
year
83.3 1.4 86.1 87.5 88.9 90 90Schoolwide 42 84.71011
- - - - - - -White - -1011
- - - - - - -Black - -1011
- - - - - - -Hispanic - -1011
- - - - - - -American Indian - -1011
- - - - - - -Asian - -1011
- - - - - - -Two or More Races - -1011
- - - - - - -Students with Disabilities - -1011
- - - - - - -Limited English Proficiency - -1011
84.2 1.3 86.8 88.1 89.4 90 90Economically Disadvantaged 38 85.51011
Performance Targets - Mathematics
Subgroup# of Valid
Test Scores
Baseline
% Proficient
Yearly
Increment
2012-2013
Target (%P)
2011-2012
Target (%P)
2013-2014
Target (%P)
2014-2015
Target (%P)
2015-2016
Target (%P)
2016-2017
Target (%P)
Baseline
year
85.7 1.2 88.1 89.3 90 90 90Schoolwide 42 86.91011
- - - - - - -White - -1011
- - - - - - -Black - -1011
- - - - - - -Hispanic - -1011
- - - - - - -American Indian - -1011
- - - - - - -Asian - -1011
- - - - - - -Two or More Races - -1011
- - - - - - -Students with Disabilities - -1011
- - - - - - -Limited English Proficiency - -1011
86.9 1.1 89.1 90 90 90 90Economically Disadvantaged 38 881011
11/5/2014
Only Includes full year students (Time In School < Year students are removed)
'-' Indicates too few students to determine (N<30)
Title I Accountability System

13-3570-640
SOUTH STREET ELEMENTARY SCHOOL
THE NEWARK PUBLIC SCHOOLS
CDS CODE :
DISTRICT :
SCHOOL :
ESEA Waiver - Annual Progress Targets
The tables represent the annual proficiency targets, established for this School under ESEA Waiver
Schools and Subgroups could meet expectations either by meeting the statewide proficiency rate of 90 percent, or reaching their individually
determined progress targets. The statewide proficiency rate will be increased to 95 percent in 2015.
Performance Targets - Language Arts Literacy
Subgroup# of Valid
Test Scores
Baseline
% Proficient
Yearly
Increment
2012-2013
Target (%P)
2011-2012
Target (%P)
2013-2014
Target (%P)
2014-2015
Target (%P)
2015-2016
Target (%P)
2016-2017
Target (%P)
Baseline
year
34.6 5.5 45.6 51.1 56.6 62.1 67.6Schoolwide 127 40.11011
- - - - - - -White - -1011
29.7 5.9 41.5 47.4 53.3 59.2 65.1Black 37 35.61011
30.8 5.8 42.4 48.2 54 59.8 65.6Hispanic 68 36.61011
- - - - - - -American Indian - -1011
- - - - - - -Asian - -1011
- - - - - - -Two or More Races - -1011
12.9 7.3 27.5 34.8 42.1 49.4 56.7Students with Disabilities 31 20.21011
- - - - - - -Limited English Proficiency - -1011
34.4 5.5 45.4 50.9 56.4 61.9 67.4Economically Disadvantaged 116 39.91011
Performance Targets - Mathematics
Subgroup# of Valid
Test Scores
Baseline
% Proficient
Yearly
Increment
2012-2013
Target (%P)
2011-2012
Target (%P)
2013-2014
Target (%P)
2014-2015
Target (%P)
2015-2016
Target (%P)
2016-2017
Target (%P)
Baseline
year
55.1 3.8 62.7 66.5 70.3 74.1 77.9Schoolwide 127 58.91011
- - - - - - -White - -1011
43.2 4.7 52.6 57.3 62 66.7 71.4Black 37 47.91011
58.8 3.4 65.6 69 72.4 75.8 79.2Hispanic 68 62.21011
- - - - - - -American Indian - -1011
- - - - - - -Asian - -1011
- - - - - - -Two or More Races - -1011
32.2 5.7 43.6 49.3 55 60.7 66.4Students with Disabilities 31 37.91011
- - - - - - -Limited English Proficiency - -1011
54.3 3.8 61.9 65.7 69.5 73.3 77.1Economically Disadvantaged 116 58.11011
11/5/2014
Only Includes full year students (Time In School < Year students are removed)
'-' Indicates too few students to determine (N<30)
Title I Accountability System

13-3570-670
SOUTH SEVENTEENTH STREET SCHOOL
THE NEWARK PUBLIC SCHOOLS
CDS CODE :
DISTRICT :
SCHOOL :
ESEA Waiver - Annual Progress Targets
The tables represent the annual proficiency targets, established for this School under ESEA Waiver
Schools and Subgroups could meet expectations either by meeting the statewide proficiency rate of 90 percent, or reaching their individually
determined progress targets. The statewide proficiency rate will be increased to 95 percent in 2015.
Performance Targets - Language Arts Literacy
Subgroup# of Valid
Test Scores
Baseline
% Proficient
Yearly
Increment
2012-2013
Target (%P)
2011-2012
Target (%P)
2013-2014
Target (%P)
2014-2015
Target (%P)
2015-2016
Target (%P)
2016-2017
Target (%P)
Baseline
year
49.6 4.2 58 62.2 66.4 70.6 74.8Schoolwide 214 53.81011
- - - - - - -White - -1011
50.2 4.2 58.6 62.8 67 71.2 75.4Black 189 54.41011
39.4 5.1 44.5 49.6 54.7 59.8 64.9Hispanic 33 1112
- - - - - - -American Indian - -1011
- - - - - - -Asian - -1011
- - - - - - -Two or More Races - -1011
4.7 8 12.7 20.7 28.7 36.7 44.7Students with Disabilities 43 1112
- - - - - - -Limited English Proficiency - -1011
49.5 4.2 57.9 62.1 66.3 70.5 74.7Economically Disadvantaged 206 53.71011
Performance Targets - Mathematics
Subgroup# of Valid
Test Scores
Baseline
% Proficient
Yearly
Increment
2012-2013
Target (%P)
2011-2012
Target (%P)
2013-2014
Target (%P)
2014-2015
Target (%P)
2015-2016
Target (%P)
2016-2017
Target (%P)
Baseline
year
61.3 3.2 67.7 70.9 74.1 77.3 80.5Schoolwide 214 64.51011
- - - - - - -White - -1011
61.9 3.2 68.3 71.5 74.7 77.9 81.1Black 189 65.11011
51.5 4.1 55.6 59.7 63.8 67.9 72Hispanic 33 1112
- - - - - - -American Indian - -1011
- - - - - - -Asian - -1011
- - - - - - -Two or More Races - -1011
21 6.6 27.6 34.2 40.8 47.4 54Students with Disabilities 43 1112
- - - - - - -Limited English Proficiency - -1011
61.1 3.2 67.5 70.7 73.9 77.1 80.3Economically Disadvantaged 206 64.31011
11/5/2014
Only Includes full year students (Time In School < Year students are removed)
'-' Indicates too few students to determine (N<30)
Title I Accountability System

13-3570-690
SPEEDWAY AVENUE SCHOOL
THE NEWARK PUBLIC SCHOOLS
CDS CODE :
DISTRICT :
SCHOOL :
ESEA Waiver - Annual Progress Targets
The tables represent the annual proficiency targets, established for this School under ESEA Waiver
Schools and Subgroups could meet expectations either by meeting the statewide proficiency rate of 90 percent, or reaching their individually
determined progress targets. The statewide proficiency rate will be increased to 95 percent in 2015.
Performance Targets - Language Arts Literacy
Subgroup# of Valid
Test Scores
Baseline
% Proficient
Yearly
Increment
2012-2013
Target (%P)
2011-2012
Target (%P)
2013-2014
Target (%P)
2014-2015
Target (%P)
2015-2016
Target (%P)
2016-2017
Target (%P)
Baseline
year
13.2 7.2 27.6 34.8 42 49.2 56.4Schoolwide 114 20.41011
- - - - - - -White - -1011
13.5 7.2 27.9 35.1 42.3 49.5 56.7Black 111 20.71011
- - - - - - -Hispanic - -1011
- - - - - - -American Indian - -1011
- - - - - - -Asian - -1011
- - - - - - -Two or More Races - -1011
9.1 7.6 16.7 24.3 31.9 39.5 47.1Students with Disabilities 33 1112
- - - - - - -Limited English Proficiency - -1011
12.8 7.3 27.4 34.7 42 49.3 56.6Economically Disadvantaged 94 20.11011
Performance Targets - Mathematics
Subgroup# of Valid
Test Scores
Baseline
% Proficient
Yearly
Increment
2012-2013
Target (%P)
2011-2012
Target (%P)
2013-2014
Target (%P)
2014-2015
Target (%P)
2015-2016
Target (%P)
2016-2017
Target (%P)
Baseline
year
35.9 5.3 46.5 51.8 57.1 62.4 67.7Schoolwide 114 41.21011
- - - - - - -White - -1011
35.1 5.4 45.9 51.3 56.7 62.1 67.5Black 111 40.51011
- - - - - - -Hispanic - -1011
- - - - - - -American Indian - -1011
- - - - - - -Asian - -1011
- - - - - - -Two or More Races - -1011
12.1 7.3 19.4 26.7 34 41.3 48.6Students with Disabilities 33 1112
- - - - - - -Limited English Proficiency - -1011
36.2 5.3 46.8 52.1 57.4 62.7 68Economically Disadvantaged 94 41.51011
11/5/2014
Only Includes full year students (Time In School < Year students are removed)
'-' Indicates too few students to determine (N<30)
Title I Accountability System

13-3570-710
SUSSEX AVENUE SCHOOL Burnet Street School
THE NEWARK PUBLIC SCHOOLS
CDS CODE :
DISTRICT :
SCHOOL :
ESEA Waiver - Annual Progress Targets
The tables represent the annual proficiency targets, established for this School under ESEA Waiver
Schools and Subgroups could meet expectations either by meeting the statewide proficiency rate of 90 percent, or reaching their individually
determined progress targets. The statewide proficiency rate will be increased to 95 percent in 2015.
Performance Targets - Language Arts Literacy
Subgroup# of Valid
Test Scores
Baseline
% Proficient
Yearly
Increment
2012-2013
Target (%P)
2011-2012
Target (%P)
2013-2014
Target (%P)
2014-2015
Target (%P)
2015-2016
Target (%P)
2016-2017
Target (%P)
Baseline
year
38.5 5.1 48.7 53.8 58.9 64 69.1Schoolwide 213 43.61011
- - - - - - -White - -1011
35.5 5.4 46.3 51.7 57.1 62.5 67.9Black 107 40.91011
41 4.9 50.8 55.7 60.6 65.5 70.4Hispanic 105 45.91011
- - - - - - -American Indian - -1011
- - - - - - -Asian - -1011
- - - - - - -Two or More Races - -1011
8.3 7.7 23.7 31.4 39.1 46.8 54.5Students with Disabilities 36 161011
- - - - - - -Limited English Proficiency - -1011
38.7 5.1 48.9 54 59.1 64.2 69.3Economically Disadvantaged 199 43.81011
Performance Targets - Mathematics
Subgroup# of Valid
Test Scores
Baseline
% Proficient
Yearly
Increment
2012-2013
Target (%P)
2011-2012
Target (%P)
2013-2014
Target (%P)
2014-2015
Target (%P)
2015-2016
Target (%P)
2016-2017
Target (%P)
Baseline
year
53.5 3.9 61.3 65.2 69.1 73 76.9Schoolwide 213 57.41011
- - - - - - -White - -1011
43 4.8 52.6 57.4 62.2 67 71.8Black 107 47.81011
63.8 3 69.8 72.8 75.8 78.8 81.8Hispanic 105 66.81011
- - - - - - -American Indian - -1011
- - - - - - -Asian - -1011
- - - - - - -Two or More Races - -1011
19.5 6.7 32.9 39.6 46.3 53 59.7Students with Disabilities 36 26.21011
- - - - - - -Limited English Proficiency - -1011
53.3 3.9 61.1 65 68.9 72.8 76.7Economically Disadvantaged 199 57.21011
11/5/2014
Only Includes full year students (Time In School < Year students are removed)
'-' Indicates too few students to determine (N<30)
Title I Accountability System
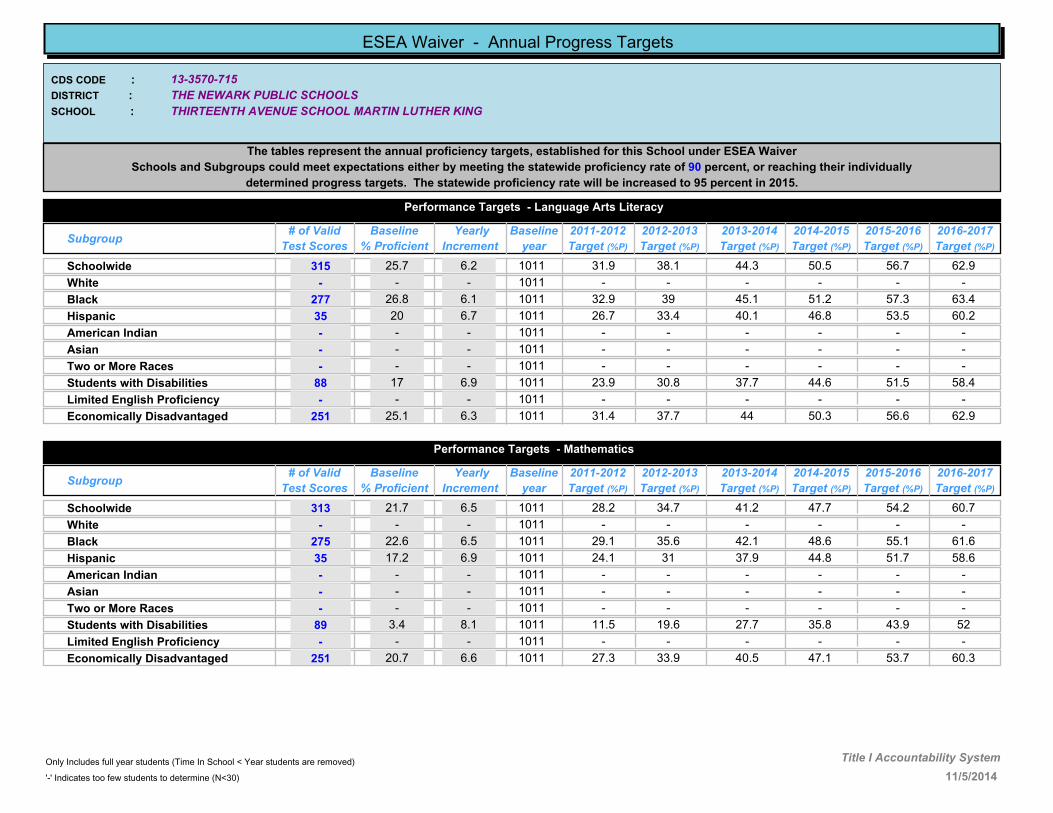
13-3570-715
THIRTEENTH AVENUE SCHOOL MARTIN LUTHER KING
THE NEWARK PUBLIC SCHOOLS
CDS CODE :
DISTRICT :
SCHOOL :
ESEA Waiver - Annual Progress Targets
The tables represent the annual proficiency targets, established for this School under ESEA Waiver
Schools and Subgroups could meet expectations either by meeting the statewide proficiency rate of 90 percent, or reaching their individually
determined progress targets. The statewide proficiency rate will be increased to 95 percent in 2015.
Performance Targets - Language Arts Literacy
Subgroup# of Valid
Test Scores
Baseline
% Proficient
Yearly
Increment
2012-2013
Target (%P)
2011-2012
Target (%P)
2013-2014
Target (%P)
2014-2015
Target (%P)
2015-2016
Target (%P)
2016-2017
Target (%P)
Baseline
year
25.7 6.2 38.1 44.3 50.5 56.7 62.9Schoolwide 315 31.91011
- - - - - - -White - -1011
26.8 6.1 39 45.1 51.2 57.3 63.4Black 277 32.91011
20 6.7 33.4 40.1 46.8 53.5 60.2Hispanic 35 26.71011
- - - - - - -American Indian - -1011
- - - - - - -Asian - -1011
- - - - - - -Two or More Races - -1011
17 6.9 30.8 37.7 44.6 51.5 58.4Students with Disabilities 88 23.91011
- - - - - - -Limited English Proficiency - -1011
25.1 6.3 37.7 44 50.3 56.6 62.9Economically Disadvantaged 251 31.41011
Performance Targets - Mathematics
Subgroup# of Valid
Test Scores
Baseline
% Proficient
Yearly
Increment
2012-2013
Target (%P)
2011-2012
Target (%P)
2013-2014
Target (%P)
2014-2015
Target (%P)
2015-2016
Target (%P)
2016-2017
Target (%P)
Baseline
year
21.7 6.5 34.7 41.2 47.7 54.2 60.7Schoolwide 313 28.21011
- - - - - - -White - -1011
22.6 6.5 35.6 42.1 48.6 55.1 61.6Black 275 29.11011
17.2 6.9 31 37.9 44.8 51.7 58.6Hispanic 35 24.11011
- - - - - - -American Indian - -1011
- - - - - - -Asian - -1011
- - - - - - -Two or More Races - -1011
3.4 8.1 19.6 27.7 35.8 43.9 52Students with Disabilities 89 11.51011
- - - - - - -Limited English Proficiency - -1011
20.7 6.6 33.9 40.5 47.1 53.7 60.3Economically Disadvantaged 251 27.31011
11/5/2014
Only Includes full year students (Time In School < Year students are removed)
'-' Indicates too few students to determine (N<30)
Title I Accountability System
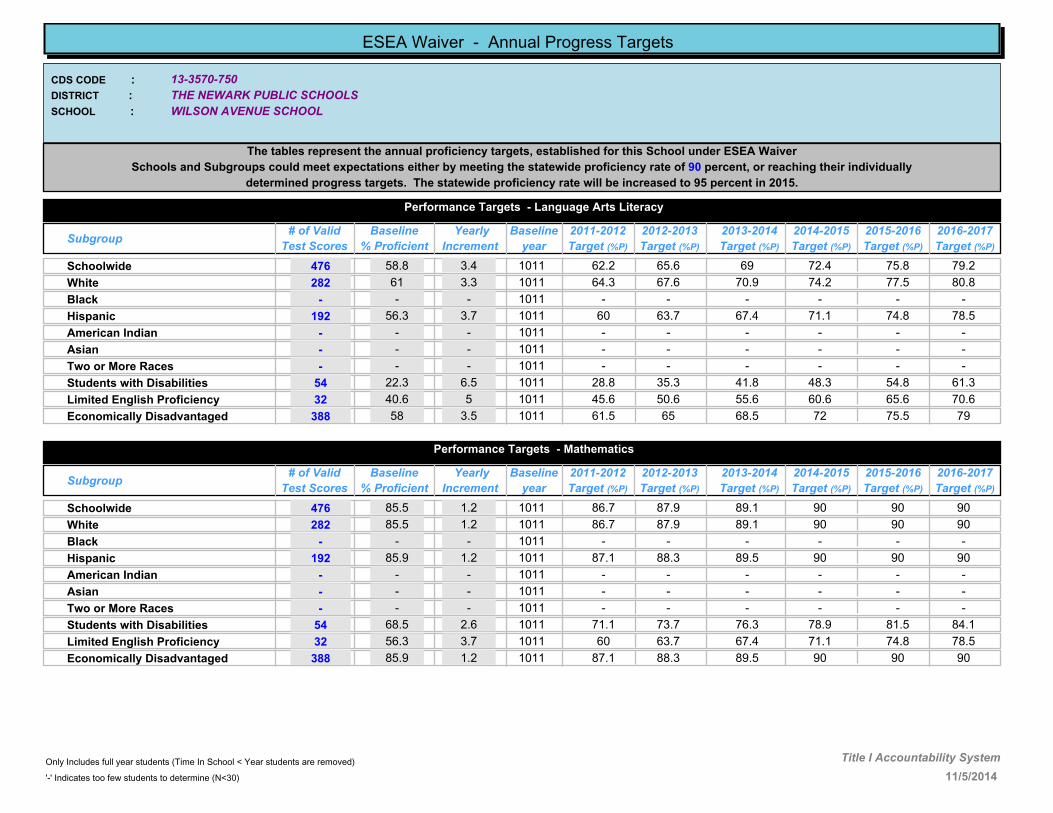
13-3570-750
WILSON AVENUE SCHOOL
THE NEWARK PUBLIC SCHOOLS
CDS CODE :
DISTRICT :
SCHOOL :
ESEA Waiver - Annual Progress Targets
The tables represent the annual proficiency targets, established for this School under ESEA Waiver
Schools and Subgroups could meet expectations either by meeting the statewide proficiency rate of 90 percent, or reaching their individually
determined progress targets. The statewide proficiency rate will be increased to 95 percent in 2015.
Performance Targets - Language Arts Literacy
Subgroup# of Valid
Test Scores
Baseline
% Proficient
Yearly
Increment
2012-2013
Target (%P)
2011-2012
Target (%P)
2013-2014
Target (%P)
2014-2015
Target (%P)
2015-2016
Target (%P)
2016-2017
Target (%P)
Baseline
year
58.8 3.4 65.6 69 72.4 75.8 79.2Schoolwide 476 62.21011
61 3.3 67.6 70.9 74.2 77.5 80.8White 282 64.31011
- - - - - - -Black - -1011
56.3 3.7 63.7 67.4 71.1 74.8 78.5Hispanic 192 601011
- - - - - - -American Indian - -1011
- - - - - - -Asian - -1011
- - - - - - -Two or More Races - -1011
22.3 6.5 35.3 41.8 48.3 54.8 61.3Students with Disabilities 54 28.81011
40.6 5 50.6 55.6 60.6 65.6 70.6Limited English Proficiency 32 45.61011
58 3.5 65 68.5 72 75.5 79Economically Disadvantaged 388 61.51011
Performance Targets - Mathematics
Subgroup# of Valid
Test Scores
Baseline
% Proficient
Yearly
Increment
2012-2013
Target (%P)
2011-2012
Target (%P)
2013-2014
Target (%P)
2014-2015
Target (%P)
2015-2016
Target (%P)
2016-2017
Target (%P)
Baseline
year
85.5 1.2 87.9 89.1 90 90 90Schoolwide 476 86.71011
85.5 1.2 87.9 89.1 90 90 90White 282 86.71011
- - - - - - -Black - -1011
85.9 1.2 88.3 89.5 90 90 90Hispanic 192 87.11011
- - - - - - -American Indian - -1011
- - - - - - -Asian - -1011
- - - - - - -Two or More Races - -1011
68.5 2.6 73.7 76.3 78.9 81.5 84.1Students with Disabilities 54 71.11011
56.3 3.7 63.7 67.4 71.1 74.8 78.5Limited English Proficiency 32 601011
85.9 1.2 88.3 89.5 90 90 90Economically Disadvantaged 388 87.11011
11/5/2014
Only Includes full year students (Time In School < Year students are removed)
'-' Indicates too few students to determine (N<30)
Title I Accountability System

13-3630-050
Gould/Mountain Elementary School
NORTH CALDWELL BOARD OF EDUCATION
CDS CODE :
DISTRICT :
SCHOOL :
ESEA Waiver - Annual Progress Targets
The tables represent the annual proficiency targets, established for this School under ESEA Waiver
Schools and Subgroups could meet expectations either by meeting the statewide proficiency rate of 90 percent, or reaching their individually
determined progress targets. The statewide proficiency rate will be increased to 95 percent in 2015.
Performance Targets - Language Arts Literacy
Subgroup# of Valid
Test Scores
Baseline
% Proficient
Yearly
Increment
2012-2013
Target (%P)
2011-2012
Target (%P)
2013-2014
Target (%P)
2014-2015
Target (%P)
2015-2016
Target (%P)
2016-2017
Target (%P)
Baseline
year
89.2 .9 90 90 90 90 90Schoolwide 278 901011
90.9 - 90 90 90 90 90White 253 901011
- - - - - - -Black - -1011
- - - - - - -Hispanic - -1011
- - - - - - -American Indian - -1011
- - - - - - -Asian - -1011
- - - - - - -Two or More Races - -1011
69.2 2.6 74.4 77 79.6 82.2 84.8Students with Disabilities 52 71.81011
- - - - - - -Limited English Proficiency - -1011
- - - - - - -Economically Disadvantaged - -1011
Performance Targets - Mathematics
Subgroup# of Valid
Test Scores
Baseline
% Proficient
Yearly
Increment
2012-2013
Target (%P)
2011-2012
Target (%P)
2013-2014
Target (%P)
2014-2015
Target (%P)
2015-2016
Target (%P)
2016-2017
Target (%P)
Baseline
year
94.6 - 90 90 90 90 90Schoolwide 278 901011
95.6 - 90 90 90 90 90White 253 901011
- - - - - - -Black - -1011
- - - - - - -Hispanic - -1011
- - - - - - -American Indian - -1011
- - - - - - -Asian - -1011
- - - - - - -Two or More Races - -1011
86.6 1.1 88.8 89.9 90 90 90Students with Disabilities 52 87.71011
- - - - - - -Limited English Proficiency - -1011
- - - - - - -Economically Disadvantaged - -1011
11/5/2014
Only Includes full year students (Time In School < Year students are removed)
'-' Indicates too few students to determine (N<30)
Title I Accountability System

13-3630-060
Grandview Elementary School
NORTH CALDWELL BOARD OF EDUCATION
CDS CODE :
DISTRICT :
SCHOOL :
ESEA Waiver - Annual Progress Targets
The tables represent the annual proficiency targets, established for this School under ESEA Waiver
Schools and Subgroups could meet expectations either by meeting the statewide proficiency rate of 90 percent, or reaching their individually
determined progress targets. The statewide proficiency rate will be increased to 95 percent in 2015.
Performance Targets - Language Arts Literacy
Subgroup# of Valid
Test Scores
Baseline
% Proficient
Yearly
Increment
2012-2013
Target (%P)
2011-2012
Target (%P)
2013-2014
Target (%P)
2014-2015
Target (%P)
2015-2016
Target (%P)
2016-2017
Target (%P)
Baseline
year
87 1.1 89.2 90 90 90 90Schoolwide 92 88.11011
86.1 1.2 88.5 89.7 90 90 90White 79 87.31011
- - - - - - -Black - -1011
- - - - - - -Hispanic - -1011
- - - - - - -American Indian - -1011
- - - - - - -Asian - -1011
- - - - - - -Two or More Races - -1011
- - - - - - -Students with Disabilities - -1011
- - - - - - -Limited English Proficiency - -1011
- - - - - - -Economically Disadvantaged - -1011
Performance Targets - Mathematics
Subgroup# of Valid
Test Scores
Baseline
% Proficient
Yearly
Increment
2012-2013
Target (%P)
2011-2012
Target (%P)
2013-2014
Target (%P)
2014-2015
Target (%P)
2015-2016
Target (%P)
2016-2017
Target (%P)
Baseline
year
94.6 - 90 90 90 90 90Schoolwide 92 901011
93.6 - 90 90 90 90 90White 79 901011
- - - - - - -Black - -1011
- - - - - - -Hispanic - -1011
- - - - - - -American Indian - -1011
- - - - - - -Asian - -1011
- - - - - - -Two or More Races - -1011
- - - - - - -Students with Disabilities - -1011
- - - - - - -Limited English Proficiency - -1011
- - - - - - -Economically Disadvantaged - -1011
11/5/2014
Only Includes full year students (Time In School < Year students are removed)
'-' Indicates too few students to determine (N<30)
Title I Accountability System
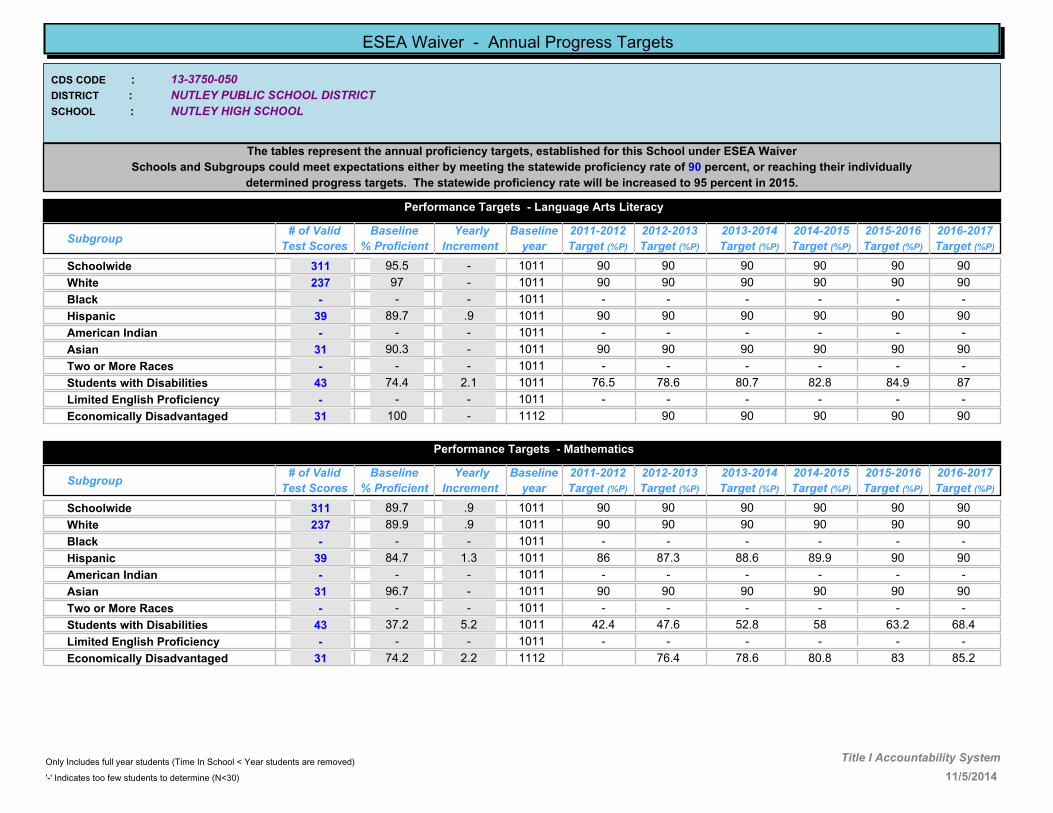
13-3750-050
NUTLEY HIGH SCHOOL
NUTLEY PUBLIC SCHOOL DISTRICT
CDS CODE :
DISTRICT :
SCHOOL :
ESEA Waiver - Annual Progress Targets
The tables represent the annual proficiency targets, established for this School under ESEA Waiver
Schools and Subgroups could meet expectations either by meeting the statewide proficiency rate of 90 percent, or reaching their individually
determined progress targets. The statewide proficiency rate will be increased to 95 percent in 2015.
Performance Targets - Language Arts Literacy
Subgroup# of Valid
Test Scores
Baseline
% Proficient
Yearly
Increment
2012-2013
Target (%P)
2011-2012
Target (%P)
2013-2014
Target (%P)
2014-2015
Target (%P)
2015-2016
Target (%P)
2016-2017
Target (%P)
Baseline
year
95.5 - 90 90 90 90 90Schoolwide 311 901011
97 - 90 90 90 90 90White 237 901011
- - - - - - -Black - -1011
89.7 .9 90 90 90 90 90Hispanic 39 901011
- - - - - - -American Indian - -1011
90.3 - 90 90 90 90 90Asian 31 901011
- - - - - - -Two or More Races - -1011
74.4 2.1 78.6 80.7 82.8 84.9 87Students with Disabilities 43 76.51011
- - - - - - -Limited English Proficiency - -1011
100 - 90 90 90 90 90Economically Disadvantaged 31 1112
Performance Targets - Mathematics
Subgroup# of Valid
Test Scores
Baseline
% Proficient
Yearly
Increment
2012-2013
Target (%P)
2011-2012
Target (%P)
2013-2014
Target (%P)
2014-2015
Target (%P)
2015-2016
Target (%P)
2016-2017
Target (%P)
Baseline
year
89.7 .9 90 90 90 90 90Schoolwide 311 901011
89.9 .9 90 90 90 90 90White 237 901011
- - - - - - -Black - -1011
84.7 1.3 87.3 88.6 89.9 90 90Hispanic 39 861011
- - - - - - -American Indian - -1011
96.7 - 90 90 90 90 90Asian 31 901011
- - - - - - -Two or More Races - -1011
37.2 5.2 47.6 52.8 58 63.2 68.4Students with Disabilities 43 42.41011
- - - - - - -Limited English Proficiency - -1011
74.2 2.2 76.4 78.6 80.8 83 85.2Economically Disadvantaged 31 1112
11/5/2014
Only Includes full year students (Time In School < Year students are removed)
'-' Indicates too few students to determine (N<30)
Title I Accountability System

13-3750-060
JOHN H. WALKER MIDDLE SCHOOL
NUTLEY PUBLIC SCHOOL DISTRICT
CDS CODE :
DISTRICT :
SCHOOL :
ESEA Waiver - Annual Progress Targets
The tables represent the annual proficiency targets, established for this School under ESEA Waiver
Schools and Subgroups could meet expectations either by meeting the statewide proficiency rate of 90 percent, or reaching their individually
determined progress targets. The statewide proficiency rate will be increased to 95 percent in 2015.
Performance Targets - Language Arts Literacy
Subgroup# of Valid
Test Scores
Baseline
% Proficient
Yearly
Increment
2012-2013
Target (%P)
2011-2012
Target (%P)
2013-2014
Target (%P)
2014-2015
Target (%P)
2015-2016
Target (%P)
2016-2017
Target (%P)
Baseline
year
85.8 1.2 88.2 89.4 90 90 90Schoolwide 598 871011
87 1.1 89.2 90 90 90 90White 439 88.11011
- - - - - - -Black - -1011
73 2.3 77.6 79.9 82.2 84.5 86.8Hispanic 78 75.31011
- - - - - - -American Indian - -1011
96.6 - 90 90 90 90 90Asian 59 901011
- - - - - - -Two or More Races - -1011
60.7 3.3 67.3 70.6 73.9 77.2 80.5Students with Disabilities 84 641011
- - - - - - -Limited English Proficiency - -1011
77.6 1.9 81.4 83.3 85.2 87.1 89Economically Disadvantaged 58 79.51011
Performance Targets - Mathematics
Subgroup# of Valid
Test Scores
Baseline
% Proficient
Yearly
Increment
2012-2013
Target (%P)
2011-2012
Target (%P)
2013-2014
Target (%P)
2014-2015
Target (%P)
2015-2016
Target (%P)
2016-2017
Target (%P)
Baseline
year
81 1.6 84.2 85.8 87.4 89 90Schoolwide 599 82.61011
82.5 1.5 85.5 87 88.5 90 90White 440 841011
- - - - - - -Black - -1011
69.2 2.6 74.4 77 79.6 82.2 84.8Hispanic 78 71.81011
- - - - - - -American Indian - -1011
93.2 - 90 90 90 90 90Asian 59 901011
- - - - - - -Two or More Races - -1011
63.5 3.1 69.7 72.8 75.9 79 82.1Students with Disabilities 85 66.61011
- - - - - - -Limited English Proficiency - -1011
70.7 2.5 75.7 78.2 80.7 83.2 85.7Economically Disadvantaged 58 73.21011
11/5/2014
Only Includes full year students (Time In School < Year students are removed)
'-' Indicates too few students to determine (N<30)
Title I Accountability System

13-3750-070
LINCOLN SCHOOL
NUTLEY PUBLIC SCHOOL DISTRICT
CDS CODE :
DISTRICT :
SCHOOL :
ESEA Waiver - Annual Progress Targets
The tables represent the annual proficiency targets, established for this School under ESEA Waiver
Schools and Subgroups could meet expectations either by meeting the statewide proficiency rate of 90 percent, or reaching their individually
determined progress targets. The statewide proficiency rate will be increased to 95 percent in 2015.
Performance Targets - Language Arts Literacy
Subgroup# of Valid
Test Scores
Baseline
% Proficient
Yearly
Increment
2012-2013
Target (%P)
2011-2012
Target (%P)
2013-2014
Target (%P)
2014-2015
Target (%P)
2015-2016
Target (%P)
2016-2017
Target (%P)
Baseline
year
62.3 3.2 68.7 71.9 75.1 78.3 81.5Schoolwide 273 65.51011
62.8 3.1 69 72.1 75.2 78.3 81.4White 196 65.91011
- - - - - - -Black - -1011
48.8 4.3 57.4 61.7 66 70.3 74.6Hispanic 43 53.11011
- - - - - - -American Indian - -1011
- - - - - - -Asian - -1011
- - - - - - -Two or More Races - -1011
27.4 6.1 39.6 45.7 51.8 57.9 64Students with Disabilities 73 33.51011
- - - - - - -Limited English Proficiency - -1011
48.1 4.3 56.7 61 65.3 69.6 73.9Economically Disadvantaged 52 52.41011
Performance Targets - Mathematics
Subgroup# of Valid
Test Scores
Baseline
% Proficient
Yearly
Increment
2012-2013
Target (%P)
2011-2012
Target (%P)
2013-2014
Target (%P)
2014-2015
Target (%P)
2015-2016
Target (%P)
2016-2017
Target (%P)
Baseline
year
78.8 1.8 82.4 84.2 86 87.8 89.6Schoolwide 273 80.61011
78.6 1.8 82.2 84 85.8 87.6 89.4White 196 80.41011
- - - - - - -Black - -1011
69.8 2.5 74.8 77.3 79.8 82.3 84.8Hispanic 43 72.31011
- - - - - - -American Indian - -1011
- - - - - - -Asian - -1011
- - - - - - -Two or More Races - -1011
63.1 3.1 69.3 72.4 75.5 78.6 81.7Students with Disabilities 73 66.21011
- - - - - - -Limited English Proficiency - -1011
69.2 2.6 74.4 77 79.6 82.2 84.8Economically Disadvantaged 52 71.81011
11/5/2014
Only Includes full year students (Time In School < Year students are removed)
'-' Indicates too few students to determine (N<30)
Title I Accountability System
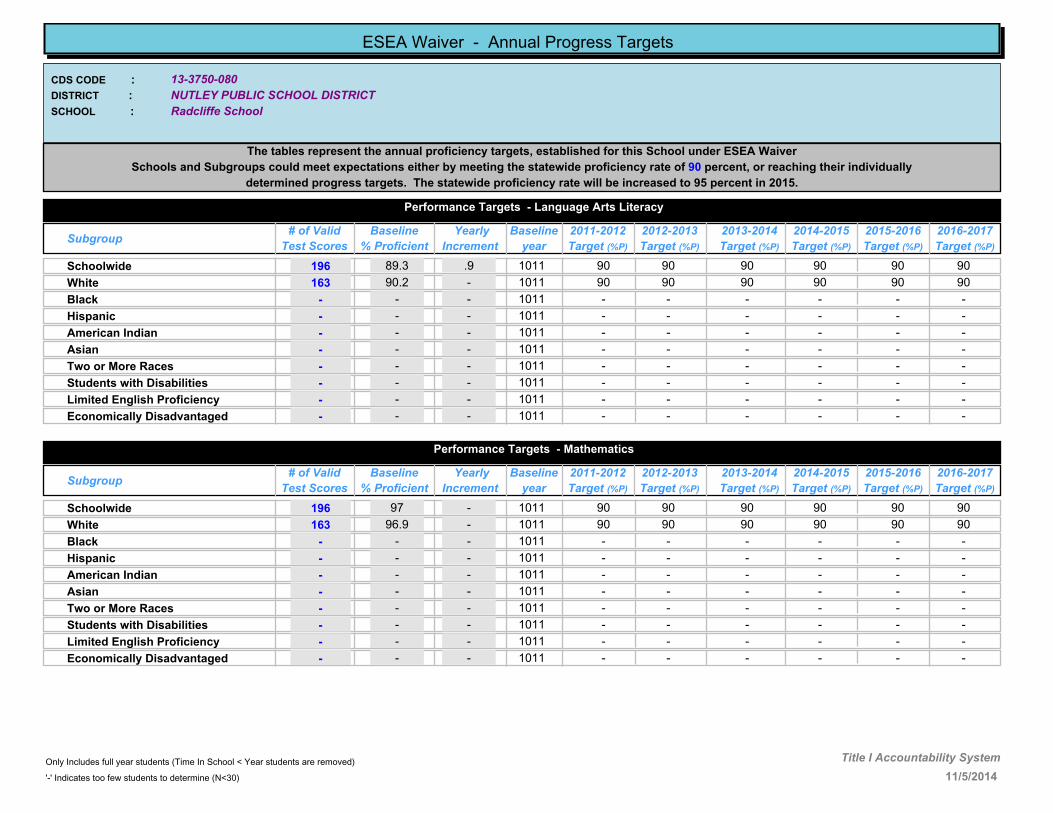
13-3750-080
Radcliffe School
NUTLEY PUBLIC SCHOOL DISTRICT
CDS CODE :
DISTRICT :
SCHOOL :
ESEA Waiver - Annual Progress Targets
The tables represent the annual proficiency targets, established for this School under ESEA Waiver
Schools and Subgroups could meet expectations either by meeting the statewide proficiency rate of 90 percent, or reaching their individually
determined progress targets. The statewide proficiency rate will be increased to 95 percent in 2015.
Performance Targets - Language Arts Literacy
Subgroup# of Valid
Test Scores
Baseline
% Proficient
Yearly
Increment
2012-2013
Target (%P)
2011-2012
Target (%P)
2013-2014
Target (%P)
2014-2015
Target (%P)
2015-2016
Target (%P)
2016-2017
Target (%P)
Baseline
year
89.3 .9 90 90 90 90 90Schoolwide 196 901011
90.2 - 90 90 90 90 90White 163 901011
- - - - - - -Black - -1011
- - - - - - -Hispanic - -1011
- - - - - - -American Indian - -1011
- - - - - - -Asian - -1011
- - - - - - -Two or More Races - -1011
- - - - - - -Students with Disabilities - -1011
- - - - - - -Limited English Proficiency - -1011
- - - - - - -Economically Disadvantaged - -1011
Performance Targets - Mathematics
Subgroup# of Valid
Test Scores
Baseline
% Proficient
Yearly
Increment
2012-2013
Target (%P)
2011-2012
Target (%P)
2013-2014
Target (%P)
2014-2015
Target (%P)
2015-2016
Target (%P)
2016-2017
Target (%P)
Baseline
year
97 - 90 90 90 90 90Schoolwide 196 901011
96.9 - 90 90 90 90 90White 163 901011
- - - - - - -Black - -1011
- - - - - - -Hispanic - -1011
- - - - - - -American Indian - -1011
- - - - - - -Asian - -1011
- - - - - - -Two or More Races - -1011
- - - - - - -Students with Disabilities - -1011
- - - - - - -Limited English Proficiency - -1011
- - - - - - -Economically Disadvantaged - -1011
11/5/2014
Only Includes full year students (Time In School < Year students are removed)
'-' Indicates too few students to determine (N<30)
Title I Accountability System

13-3750-090
Spring Garden School
NUTLEY PUBLIC SCHOOL DISTRICT
CDS CODE :
DISTRICT :
SCHOOL :
ESEA Waiver - Annual Progress Targets
The tables represent the annual proficiency targets, established for this School under ESEA Waiver
Schools and Subgroups could meet expectations either by meeting the statewide proficiency rate of 90 percent, or reaching their individually
determined progress targets. The statewide proficiency rate will be increased to 95 percent in 2015.
Performance Targets - Language Arts Literacy
Subgroup# of Valid
Test Scores
Baseline
% Proficient
Yearly
Increment
2012-2013
Target (%P)
2011-2012
Target (%P)
2013-2014
Target (%P)
2014-2015
Target (%P)
2015-2016
Target (%P)
2016-2017
Target (%P)
Baseline
year
82.8 1.4 85.6 87 88.4 89.8 90Schoolwide 215 84.21011
82.6 1.5 85.6 87.1 88.6 90 90White 190 84.11011
- - - - - - -Black - -1011
- - - - - - -Hispanic - -1011
- - - - - - -American Indian - -1011
- - - - - - -Asian - -1011
- - - - - - -Two or More Races - -1011
57.6 3.5 64.6 68.1 71.6 75.1 78.6Students with Disabilities 33 61.11011
- - - - - - -Limited English Proficiency - -1011
- - - - - - -Economically Disadvantaged - -1011
Performance Targets - Mathematics
Subgroup# of Valid
Test Scores
Baseline
% Proficient
Yearly
Increment
2012-2013
Target (%P)
2011-2012
Target (%P)
2013-2014
Target (%P)
2014-2015
Target (%P)
2015-2016
Target (%P)
2016-2017
Target (%P)
Baseline
year
93.5 - 90 90 90 90 90Schoolwide 215 901011
92.6 - 90 90 90 90 90White 190 901011
- - - - - - -Black - -1011
- - - - - - -Hispanic - -1011
- - - - - - -American Indian - -1011
- - - - - - -Asian - -1011
- - - - - - -Two or More Races - -1011
90.9 - 90 90 90 90 90Students with Disabilities 33 901011
- - - - - - -Limited English Proficiency - -1011
- - - - - - -Economically Disadvantaged - -1011
11/5/2014
Only Includes full year students (Time In School < Year students are removed)
'-' Indicates too few students to determine (N<30)
Title I Accountability System

13-3750-100
WASHINGTON SCHOOL
NUTLEY PUBLIC SCHOOL DISTRICT
CDS CODE :
DISTRICT :
SCHOOL :
ESEA Waiver - Annual Progress Targets
The tables represent the annual proficiency targets, established for this School under ESEA Waiver
Schools and Subgroups could meet expectations either by meeting the statewide proficiency rate of 90 percent, or reaching their individually
determined progress targets. The statewide proficiency rate will be increased to 95 percent in 2015.
Performance Targets - Language Arts Literacy
Subgroup# of Valid
Test Scores
Baseline
% Proficient
Yearly
Increment
2012-2013
Target (%P)
2011-2012
Target (%P)
2013-2014
Target (%P)
2014-2015
Target (%P)
2015-2016
Target (%P)
2016-2017
Target (%P)
Baseline
year
72.9 2.3 77.5 79.8 82.1 84.4 86.7Schoolwide 203 75.21011
74.1 2.2 78.5 80.7 82.9 85.1 87.3White 127 76.31011
- - - - - - -Black - -1011
64.3 3 70.3 73.3 76.3 79.3 82.3Hispanic 42 67.31011
- - - - - - -American Indian - -1011
83.9 1.4 85.3 86.7 88.1 89.5 90.9Asian 31 1112
- - - - - - -Two or More Races - -1011
62.2 3.2 68.6 71.8 75 78.2 81.4Students with Disabilities 37 65.41011
- - - - - - -Limited English Proficiency - -1011
68.5 2.6 71.1 73.7 76.3 78.9 81.5Economically Disadvantaged 38 1112
Performance Targets - Mathematics
Subgroup# of Valid
Test Scores
Baseline
% Proficient
Yearly
Increment
2012-2013
Target (%P)
2011-2012
Target (%P)
2013-2014
Target (%P)
2014-2015
Target (%P)
2015-2016
Target (%P)
2016-2017
Target (%P)
Baseline
year
86.7 1.1 88.9 90 90 90 90Schoolwide 203 87.81011
89 .9 90 90 90 90 90White 127 89.91011
- - - - - - -Black - -1011
78.6 1.8 82.2 84 85.8 87.6 89.4Hispanic 42 80.41011
- - - - - - -American Indian - -1011
96.8 - 90 90 90 90 90Asian 31 1112
- - - - - - -Two or More Races - -1011
81 1.6 84.2 85.8 87.4 89 90Students with Disabilities 37 82.61011
- - - - - - -Limited English Proficiency - -1011
81.6 1.5 83.1 84.6 86.1 87.6 89.1Economically Disadvantaged 38 1112
11/5/2014
Only Includes full year students (Time In School < Year students are removed)
'-' Indicates too few students to determine (N<30)
Title I Accountability System

13-3750-110
YANTACAW SCHOOL
NUTLEY PUBLIC SCHOOL DISTRICT
CDS CODE :
DISTRICT :
SCHOOL :
ESEA Waiver - Annual Progress Targets
The tables represent the annual proficiency targets, established for this School under ESEA Waiver
Schools and Subgroups could meet expectations either by meeting the statewide proficiency rate of 90 percent, or reaching their individually
determined progress targets. The statewide proficiency rate will be increased to 95 percent in 2015.
Performance Targets - Language Arts Literacy
Subgroup# of Valid
Test Scores
Baseline
% Proficient
Yearly
Increment
2012-2013
Target (%P)
2011-2012
Target (%P)
2013-2014
Target (%P)
2014-2015
Target (%P)
2015-2016
Target (%P)
2016-2017
Target (%P)
Baseline
year
80.3 1.7 83.7 85.4 87.1 88.8 90Schoolwide 264 821011
80.1 1.7 83.5 85.2 86.9 88.6 90White 206 81.81011
- - - - - - -Black - -1011
73.3 2.2 77.7 79.9 82.1 84.3 86.5Hispanic 30 75.51011
- - - - - - -American Indian - -1011
- - - - - - -Asian - -1011
- - - - - - -Two or More Races - -1011
63.9 3 69.9 72.9 75.9 78.9 81.9Students with Disabilities 36 66.91011
- - - - - - -Limited English Proficiency - -1011
- - - - - - -Economically Disadvantaged - -1011
Performance Targets - Mathematics
Subgroup# of Valid
Test Scores
Baseline
% Proficient
Yearly
Increment
2012-2013
Target (%P)
2011-2012
Target (%P)
2013-2014
Target (%P)
2014-2015
Target (%P)
2015-2016
Target (%P)
2016-2017
Target (%P)
Baseline
year
90.1 - 90 90 90 90 90Schoolwide 264 901011
90.2 - 90 90 90 90 90White 206 901011
- - - - - - -Black - -1011
80 1.7 83.4 85.1 86.8 88.5 90Hispanic 30 81.71011
- - - - - - -American Indian - -1011
- - - - - - -Asian - -1011
- - - - - - -Two or More Races - -1011
91.7 - 90 90 90 90 90Students with Disabilities 36 901011
- - - - - - -Limited English Proficiency - -1011
- - - - - - -Economically Disadvantaged - -1011
11/5/2014
Only Includes full year students (Time In School < Year students are removed)
'-' Indicates too few students to determine (N<30)
Title I Accountability System

13-3880-050
ORANGE HIGH SCHOOL
ORANGE BOARD OF EDUCATION
CDS CODE :
DISTRICT :
SCHOOL :
ESEA Waiver - Annual Progress Targets
The tables represent the annual proficiency targets, established for this School under ESEA Waiver
Schools and Subgroups could meet expectations either by meeting the statewide proficiency rate of 90 percent, or reaching their individually
determined progress targets. The statewide proficiency rate will be increased to 95 percent in 2015.
Performance Targets - Language Arts Literacy
Subgroup# of Valid
Test Scores
Baseline
% Proficient
Yearly
Increment
2012-2013
Target (%P)
2011-2012
Target (%P)
2013-2014
Target (%P)
2014-2015
Target (%P)
2015-2016
Target (%P)
2016-2017
Target (%P)
Baseline
year
75.9 2 79.9 81.9 83.9 85.9 87.9Schoolwide 216 77.91011
- - - - - - -White - -1011
75.4 2.1 79.6 81.7 83.8 85.9 88Black 183 77.51011
- - - - - - -Hispanic - -1011
- - - - - - -American Indian - -1011
- - - - - - -Asian - -1011
- - - - - - -Two or More Races - -1011
34.2 5.5 45.2 50.7 56.2 61.7 67.2Students with Disabilities 38 39.71011
- - - - - - -Limited English Proficiency - -1011
75 2.1 79.2 81.3 83.4 85.5 87.6Economically Disadvantaged 172 77.11011
Performance Targets - Mathematics
Subgroup# of Valid
Test Scores
Baseline
% Proficient
Yearly
Increment
2012-2013
Target (%P)
2011-2012
Target (%P)
2013-2014
Target (%P)
2014-2015
Target (%P)
2015-2016
Target (%P)
2016-2017
Target (%P)
Baseline
year
43.8 4.7 53.2 57.9 62.6 67.3 72Schoolwide 217 48.51011
- - - - - - -White - -1011
44.2 4.7 53.6 58.3 63 67.7 72.4Black 183 48.91011
40 5 50 55 60 65 70Hispanic 30 451011
- - - - - - -American Indian - -1011
- - - - - - -Asian - -1011
- - - - - - -Two or More Races - -1011
5.2 7.9 21 28.9 36.8 44.7 52.6Students with Disabilities 38 13.11011
- - - - - - -Limited English Proficiency - -1011
41.9 4.9 51.7 56.6 61.5 66.4 71.3Economically Disadvantaged 172 46.81011
11/5/2014
Only Includes full year students (Time In School < Year students are removed)
'-' Indicates too few students to determine (N<30)
Title I Accountability System

13-3880-070
CLEVELAND STREET ELEMENTARY SCHOOL
ORANGE BOARD OF EDUCATION
CDS CODE :
DISTRICT :
SCHOOL :
ESEA Waiver - Annual Progress Targets
The tables represent the annual proficiency targets, established for this School under ESEA Waiver
Schools and Subgroups could meet expectations either by meeting the statewide proficiency rate of 90 percent, or reaching their individually
determined progress targets. The statewide proficiency rate will be increased to 95 percent in 2015.
Performance Targets - Language Arts Literacy
Subgroup# of Valid
Test Scores
Baseline
% Proficient
Yearly
Increment
2012-2013
Target (%P)
2011-2012
Target (%P)
2013-2014
Target (%P)
2014-2015
Target (%P)
2015-2016
Target (%P)
2016-2017
Target (%P)
Baseline
year
43.3 4.7 52.7 57.4 62.1 66.8 71.5Schoolwide 157 481011
- - - - - - -White - -1011
40.4 5 50.4 55.4 60.4 65.4 70.4Black 131 45.41011
- - - - - - -Hispanic - -1011
- - - - - - -American Indian - -1011
- - - - - - -Asian - -1011
- - - - - - -Two or More Races - -1011
12.5 7.3 27.1 34.4 41.7 49 56.3Students with Disabilities 32 19.81011
- - - - - - -Limited English Proficiency - -1011
41.8 4.9 51.6 56.5 61.4 66.3 71.2Economically Disadvantaged 146 46.71011
Performance Targets - Mathematics
Subgroup# of Valid
Test Scores
Baseline
% Proficient
Yearly
Increment
2012-2013
Target (%P)
2011-2012
Target (%P)
2013-2014
Target (%P)
2014-2015
Target (%P)
2015-2016
Target (%P)
2016-2017
Target (%P)
Baseline
year
69.5 2.6 74.7 77.3 79.9 82.5 85.1Schoolwide 157 72.11011
- - - - - - -White - -1011
69.5 2.6 74.7 77.3 79.9 82.5 85.1Black 131 72.11011
- - - - - - -Hispanic - -1011
- - - - - - -American Indian - -1011
- - - - - - -Asian - -1011
- - - - - - -Two or More Races - -1011
37.5 5.2 47.9 53.1 58.3 63.5 68.7Students with Disabilities 32 42.71011
- - - - - - -Limited English Proficiency - -1011
68.5 2.6 73.7 76.3 78.9 81.5 84.1Economically Disadvantaged 146 71.11011
11/5/2014
Only Includes full year students (Time In School < Year students are removed)
'-' Indicates too few students to determine (N<30)
Title I Accountability System
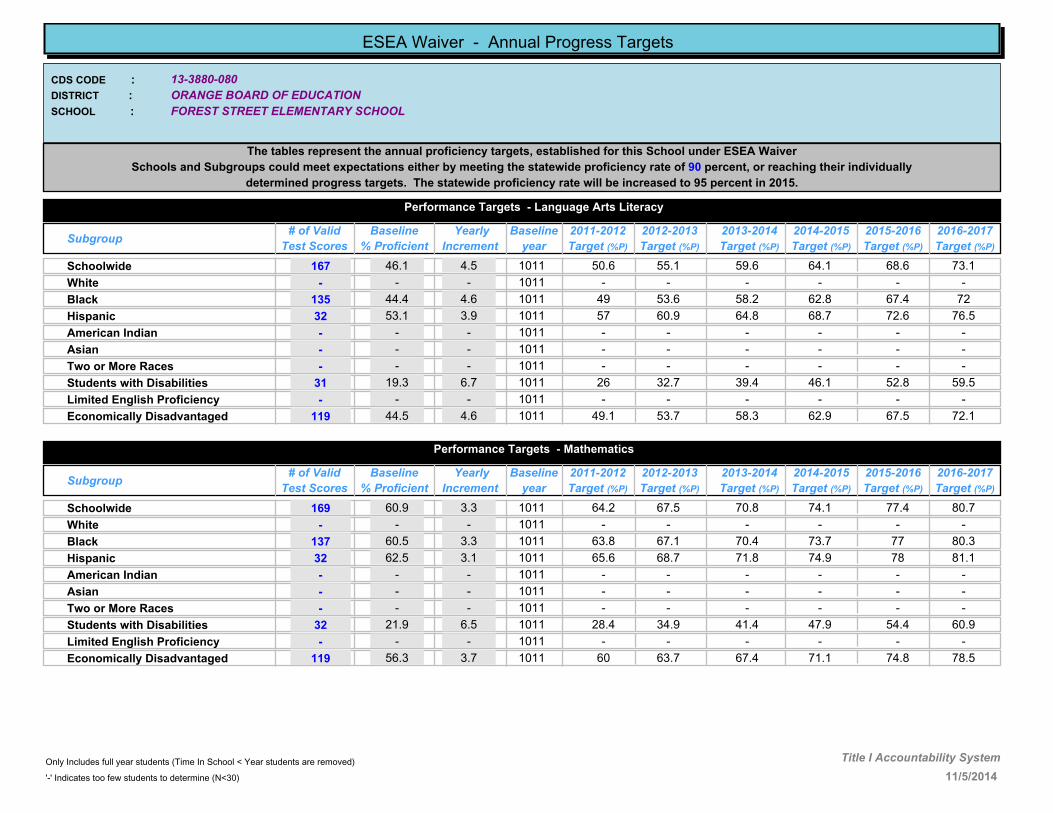
13-3880-080
FOREST STREET ELEMENTARY SCHOOL
ORANGE BOARD OF EDUCATION
CDS CODE :
DISTRICT :
SCHOOL :
ESEA Waiver - Annual Progress Targets
The tables represent the annual proficiency targets, established for this School under ESEA Waiver
Schools and Subgroups could meet expectations either by meeting the statewide proficiency rate of 90 percent, or reaching their individually
determined progress targets. The statewide proficiency rate will be increased to 95 percent in 2015.
Performance Targets - Language Arts Literacy
Subgroup# of Valid
Test Scores
Baseline
% Proficient
Yearly
Increment
2012-2013
Target (%P)
2011-2012
Target (%P)
2013-2014
Target (%P)
2014-2015
Target (%P)
2015-2016
Target (%P)
2016-2017
Target (%P)
Baseline
year
46.1 4.5 55.1 59.6 64.1 68.6 73.1Schoolwide 167 50.61011
- - - - - - -White - -1011
44.4 4.6 53.6 58.2 62.8 67.4 72Black 135 491011
53.1 3.9 60.9 64.8 68.7 72.6 76.5Hispanic 32 571011
- - - - - - -American Indian - -1011
- - - - - - -Asian - -1011
- - - - - - -Two or More Races - -1011
19.3 6.7 32.7 39.4 46.1 52.8 59.5Students with Disabilities 31 261011
- - - - - - -Limited English Proficiency - -1011
44.5 4.6 53.7 58.3 62.9 67.5 72.1Economically Disadvantaged 119 49.11011
Performance Targets - Mathematics
Subgroup# of Valid
Test Scores
Baseline
% Proficient
Yearly
Increment
2012-2013
Target (%P)
2011-2012
Target (%P)
2013-2014
Target (%P)
2014-2015
Target (%P)
2015-2016
Target (%P)
2016-2017
Target (%P)
Baseline
year
60.9 3.3 67.5 70.8 74.1 77.4 80.7Schoolwide 169 64.21011
- - - - - - -White - -1011
60.5 3.3 67.1 70.4 73.7 77 80.3Black 137 63.81011
62.5 3.1 68.7 71.8 74.9 78 81.1Hispanic 32 65.61011
- - - - - - -American Indian - -1011
- - - - - - -Asian - -1011
- - - - - - -Two or More Races - -1011
21.9 6.5 34.9 41.4 47.9 54.4 60.9Students with Disabilities 32 28.41011
- - - - - - -Limited English Proficiency - -1011
56.3 3.7 63.7 67.4 71.1 74.8 78.5Economically Disadvantaged 119 601011
11/5/2014
Only Includes full year students (Time In School < Year students are removed)
'-' Indicates too few students to determine (N<30)
Title I Accountability System

13-3880-090
HEYWOOD AVENUE ELEMENTARY SCHOOL
ORANGE BOARD OF EDUCATION
CDS CODE :
DISTRICT :
SCHOOL :
ESEA Waiver - Annual Progress Targets
The tables represent the annual proficiency targets, established for this School under ESEA Waiver
Schools and Subgroups could meet expectations either by meeting the statewide proficiency rate of 90 percent, or reaching their individually
determined progress targets. The statewide proficiency rate will be increased to 95 percent in 2015.
Performance Targets - Language Arts Literacy
Subgroup# of Valid
Test Scores
Baseline
% Proficient
Yearly
Increment
2012-2013
Target (%P)
2011-2012
Target (%P)
2013-2014
Target (%P)
2014-2015
Target (%P)
2015-2016
Target (%P)
2016-2017
Target (%P)
Baseline
year
47.7 4.4 56.5 60.9 65.3 69.7 74.1Schoolwide 189 52.11011
- - - - - - -White - -1011
50 4.2 58.4 62.6 66.8 71 75.2Black 170 54.21011
- - - - - - -Hispanic - -1011
- - - - - - -American Indian - -1011
- - - - - - -Asian - -1011
- - - - - - -Two or More Races - -1011
18.2 6.8 31.8 38.6 45.4 52.2 59Students with Disabilities 44 251011
- - - - - - -Limited English Proficiency - -1011
46.1 4.5 55.1 59.6 64.1 68.6 73.1Economically Disadvantaged 128 50.61011
Performance Targets - Mathematics
Subgroup# of Valid
Test Scores
Baseline
% Proficient
Yearly
Increment
2012-2013
Target (%P)
2011-2012
Target (%P)
2013-2014
Target (%P)
2014-2015
Target (%P)
2015-2016
Target (%P)
2016-2017
Target (%P)
Baseline
year
70.9 2.4 75.7 78.1 80.5 82.9 85.3Schoolwide 189 73.31011
- - - - - - -White - -1011
71.8 2.4 76.6 79 81.4 83.8 86.2Black 170 74.21011
- - - - - - -Hispanic - -1011
- - - - - - -American Indian - -1011
- - - - - - -Asian - -1011
- - - - - - -Two or More Races - -1011
47.7 4.4 56.5 60.9 65.3 69.7 74.1Students with Disabilities 44 52.11011
- - - - - - -Limited English Proficiency - -1011
72.7 2.3 77.3 79.6 81.9 84.2 86.5Economically Disadvantaged 128 751011
11/5/2014
Only Includes full year students (Time In School < Year students are removed)
'-' Indicates too few students to determine (N<30)
Title I Accountability System

13-3880-100
LINCOLN AVENUE ELEMENTARY SCHOOL
ORANGE BOARD OF EDUCATION
CDS CODE :
DISTRICT :
SCHOOL :
ESEA Waiver - Annual Progress Targets
The tables represent the annual proficiency targets, established for this School under ESEA Waiver
Schools and Subgroups could meet expectations either by meeting the statewide proficiency rate of 90 percent, or reaching their individually
determined progress targets. The statewide proficiency rate will be increased to 95 percent in 2015.
Performance Targets - Language Arts Literacy
Subgroup# of Valid
Test Scores
Baseline
% Proficient
Yearly
Increment
2012-2013
Target (%P)
2011-2012
Target (%P)
2013-2014
Target (%P)
2014-2015
Target (%P)
2015-2016
Target (%P)
2016-2017
Target (%P)
Baseline
year
47.5 4.4 56.3 60.7 65.1 69.5 73.9Schoolwide 234 51.91011
- - - - - - -White - -1011
51.6 4 59.6 63.6 67.6 71.6 75.6Black 153 55.61011
37.9 5.2 48.3 53.5 58.7 63.9 69.1Hispanic 79 43.11011
- - - - - - -American Indian - -1011
- - - - - - -Asian - -1011
- - - - - - -Two or More Races - -1011
13.6 7.2 28 35.2 42.4 49.6 56.8Students with Disabilities 44 20.81011
17.6 6.9 31.4 38.3 45.2 52.1 59Limited English Proficiency 34 24.51011
48.4 4.3 57 61.3 65.6 69.9 74.2Economically Disadvantaged 196 52.71011
Performance Targets - Mathematics
Subgroup# of Valid
Test Scores
Baseline
% Proficient
Yearly
Increment
2012-2013
Target (%P)
2011-2012
Target (%P)
2013-2014
Target (%P)
2014-2015
Target (%P)
2015-2016
Target (%P)
2016-2017
Target (%P)
Baseline
year
63.4 3.1 69.6 72.7 75.8 78.9 82Schoolwide 235 66.51011
- - - - - - -White - -1011
66.2 2.8 71.8 74.6 77.4 80.2 83Black 154 691011
56.9 3.6 64.1 67.7 71.3 74.9 78.5Hispanic 79 60.51011
- - - - - - -American Indian - -1011
- - - - - - -Asian - -1011
- - - - - - -Two or More Races - -1011
34 5.5 45 50.5 56 61.5 67Students with Disabilities 44 39.51011
41.1 4.9 50.9 55.8 60.7 65.6 70.5Limited English Proficiency 34 461011
65 2.9 70.8 73.7 76.6 79.5 82.4Economically Disadvantaged 197 67.91011
11/5/2014
Only Includes full year students (Time In School < Year students are removed)
'-' Indicates too few students to determine (N<30)
Title I Accountability System
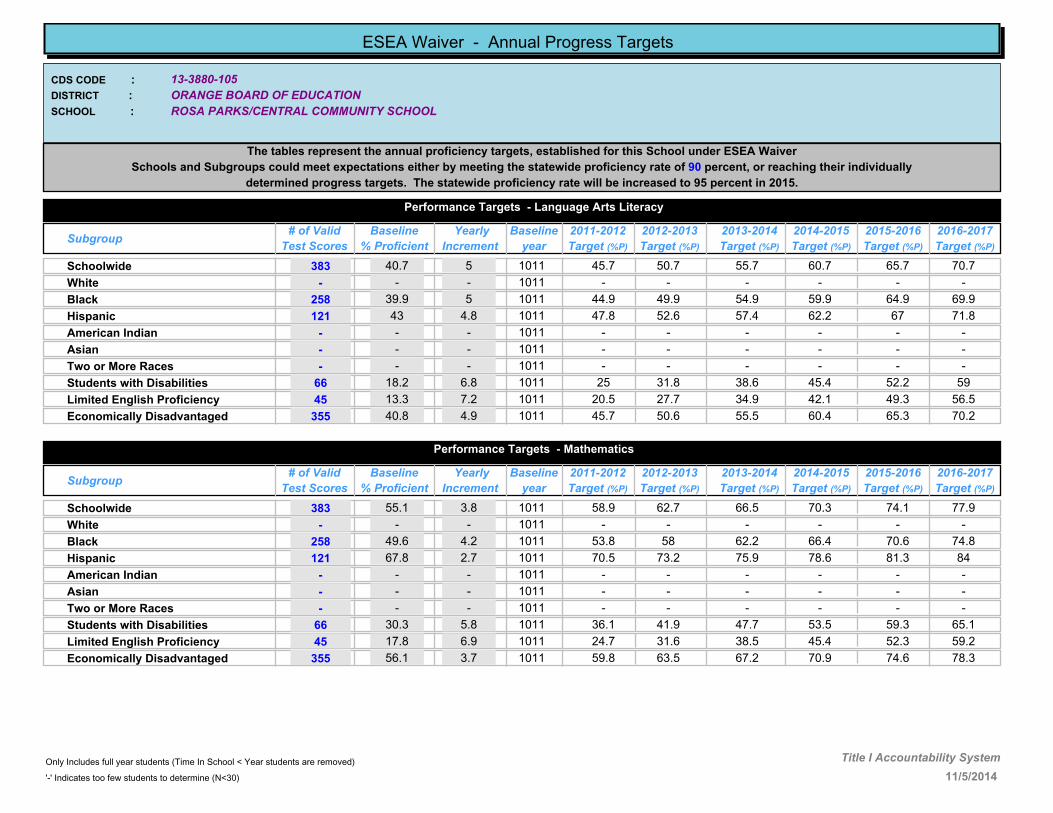
13-3880-105
ROSA PARKS/CENTRAL COMMUNITY SCHOOL
ORANGE BOARD OF EDUCATION
CDS CODE :
DISTRICT :
SCHOOL :
ESEA Waiver - Annual Progress Targets
The tables represent the annual proficiency targets, established for this School under ESEA Waiver
Schools and Subgroups could meet expectations either by meeting the statewide proficiency rate of 90 percent, or reaching their individually
determined progress targets. The statewide proficiency rate will be increased to 95 percent in 2015.
Performance Targets - Language Arts Literacy
Subgroup# of Valid
Test Scores
Baseline
% Proficient
Yearly
Increment
2012-2013
Target (%P)
2011-2012
Target (%P)
2013-2014
Target (%P)
2014-2015
Target (%P)
2015-2016
Target (%P)
2016-2017
Target (%P)
Baseline
year
40.7 5 50.7 55.7 60.7 65.7 70.7Schoolwide 383 45.71011
- - - - - - -White - -1011
39.9 5 49.9 54.9 59.9 64.9 69.9Black 258 44.91011
43 4.8 52.6 57.4 62.2 67 71.8Hispanic 121 47.81011
- - - - - - -American Indian - -1011
- - - - - - -Asian - -1011
- - - - - - -Two or More Races - -1011
18.2 6.8 31.8 38.6 45.4 52.2 59Students with Disabilities 66 251011
13.3 7.2 27.7 34.9 42.1 49.3 56.5Limited English Proficiency 45 20.51011
40.8 4.9 50.6 55.5 60.4 65.3 70.2Economically Disadvantaged 355 45.71011
Performance Targets - Mathematics
Subgroup# of Valid
Test Scores
Baseline
% Proficient
Yearly
Increment
2012-2013
Target (%P)
2011-2012
Target (%P)
2013-2014
Target (%P)
2014-2015
Target (%P)
2015-2016
Target (%P)
2016-2017
Target (%P)
Baseline
year
55.1 3.8 62.7 66.5 70.3 74.1 77.9Schoolwide 383 58.91011
- - - - - - -White - -1011
49.6 4.2 58 62.2 66.4 70.6 74.8Black 258 53.81011
67.8 2.7 73.2 75.9 78.6 81.3 84Hispanic 121 70.51011
- - - - - - -American Indian - -1011
- - - - - - -Asian - -1011
- - - - - - -Two or More Races - -1011
30.3 5.8 41.9 47.7 53.5 59.3 65.1Students with Disabilities 66 36.11011
17.8 6.9 31.6 38.5 45.4 52.3 59.2Limited English Proficiency 45 24.71011
56.1 3.7 63.5 67.2 70.9 74.6 78.3Economically Disadvantaged 355 59.81011
11/5/2014
Only Includes full year students (Time In School < Year students are removed)
'-' Indicates too few students to determine (N<30)
Title I Accountability System
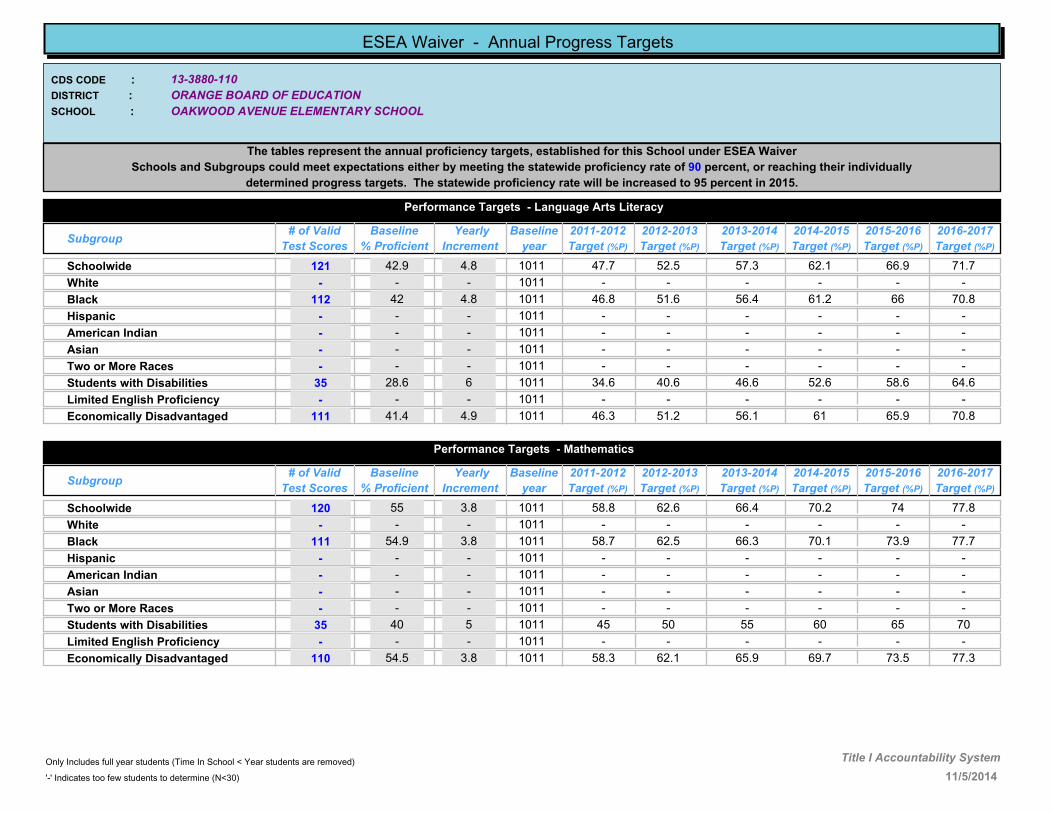
13-3880-110
OAKWOOD AVENUE ELEMENTARY SCHOOL
ORANGE BOARD OF EDUCATION
CDS CODE :
DISTRICT :
SCHOOL :
ESEA Waiver - Annual Progress Targets
The tables represent the annual proficiency targets, established for this School under ESEA Waiver
Schools and Subgroups could meet expectations either by meeting the statewide proficiency rate of 90 percent, or reaching their individually
determined progress targets. The statewide proficiency rate will be increased to 95 percent in 2015.
Performance Targets - Language Arts Literacy
Subgroup# of Valid
Test Scores
Baseline
% Proficient
Yearly
Increment
2012-2013
Target (%P)
2011-2012
Target (%P)
2013-2014
Target (%P)
2014-2015
Target (%P)
2015-2016
Target (%P)
2016-2017
Target (%P)
Baseline
year
42.9 4.8 52.5 57.3 62.1 66.9 71.7Schoolwide 121 47.71011
- - - - - - -White - -1011
42 4.8 51.6 56.4 61.2 66 70.8Black 112 46.81011
- - - - - - -Hispanic - -1011
- - - - - - -American Indian - -1011
- - - - - - -Asian - -1011
- - - - - - -Two or More Races - -1011
28.6 6 40.6 46.6 52.6 58.6 64.6Students with Disabilities 35 34.61011
- - - - - - -Limited English Proficiency - -1011
41.4 4.9 51.2 56.1 61 65.9 70.8Economically Disadvantaged 111 46.31011
Performance Targets - Mathematics
Subgroup# of Valid
Test Scores
Baseline
% Proficient
Yearly
Increment
2012-2013
Target (%P)
2011-2012
Target (%P)
2013-2014
Target (%P)
2014-2015
Target (%P)
2015-2016
Target (%P)
2016-2017
Target (%P)
Baseline
year
55 3.8 62.6 66.4 70.2 74 77.8Schoolwide 120 58.81011
- - - - - - -White - -1011
54.9 3.8 62.5 66.3 70.1 73.9 77.7Black 111 58.71011
- - - - - - -Hispanic - -1011
- - - - - - -American Indian - -1011
- - - - - - -Asian - -1011
- - - - - - -Two or More Races - -1011
40 5 50 55 60 65 70Students with Disabilities 35 451011
- - - - - - -Limited English Proficiency - -1011
54.5 3.8 62.1 65.9 69.7 73.5 77.3Economically Disadvantaged 110 58.31011
11/5/2014
Only Includes full year students (Time In School < Year students are removed)
'-' Indicates too few students to determine (N<30)
Title I Accountability System

13-3880-115
ORANGE PREPARATORY ACADEMY
ORANGE BOARD OF EDUCATION
CDS CODE :
DISTRICT :
SCHOOL :
ESEA Waiver - Annual Progress Targets
The tables represent the annual proficiency targets, established for this School under ESEA Waiver
Schools and Subgroups could meet expectations either by meeting the statewide proficiency rate of 90 percent, or reaching their individually
determined progress targets. The statewide proficiency rate will be increased to 95 percent in 2015.
Performance Targets - Language Arts Literacy
Subgroup# of Valid
Test Scores
Baseline
% Proficient
Yearly
Increment
2012-2013
Target (%P)
2011-2012
Target (%P)
2013-2014
Target (%P)
2014-2015
Target (%P)
2015-2016
Target (%P)
2016-2017
Target (%P)
Baseline
year
53.3 3.9 61.1 65 68.9 72.8 76.7Schoolwide 236 57.21011
- - - - - - -White - -1011
53.1 3.9 60.9 64.8 68.7 72.6 76.5Black 190 571011
50 4.2 58.4 62.6 66.8 71 75.2Hispanic 42 54.21011
- - - - - - -American Indian - -1011
- - - - - - -Asian - -1011
- - - - - - -Two or More Races - -1011
11.3 7.4 26.1 33.5 40.9 48.3 55.7Students with Disabilities 53 18.71011
- - - - - - -Limited English Proficiency - -1011
55.1 3.8 62.7 66.5 70.3 74.1 77.9Economically Disadvantaged 196 58.91011
Performance Targets - Mathematics
Subgroup# of Valid
Test Scores
Baseline
% Proficient
Yearly
Increment
2012-2013
Target (%P)
2011-2012
Target (%P)
2013-2014
Target (%P)
2014-2015
Target (%P)
2015-2016
Target (%P)
2016-2017
Target (%P)
Baseline
year
29.2 5.9 41 46.9 52.8 58.7 64.6Schoolwide 233 35.11011
- - - - - - -White - -1011
27.6 6 39.6 45.6 51.6 57.6 63.6Black 188 33.61011
31.8 5.7 43.2 48.9 54.6 60.3 66Hispanic 41 37.51011
- - - - - - -American Indian - -1011
- - - - - - -Asian - -1011
- - - - - - -Two or More Races - -1011
3.9 8 19.9 27.9 35.9 43.9 51.9Students with Disabilities 51 11.91011
- - - - - - -Limited English Proficiency - -1011
28.2 6 40.2 46.2 52.2 58.2 64.2Economically Disadvantaged 195 34.21011
11/5/2014
Only Includes full year students (Time In School < Year students are removed)
'-' Indicates too few students to determine (N<30)
Title I Accountability System

13-3880-120
PARK AVENUE ELEMENTARY SCHOOL
ORANGE BOARD OF EDUCATION
CDS CODE :
DISTRICT :
SCHOOL :
ESEA Waiver - Annual Progress Targets
The tables represent the annual proficiency targets, established for this School under ESEA Waiver
Schools and Subgroups could meet expectations either by meeting the statewide proficiency rate of 90 percent, or reaching their individually
determined progress targets. The statewide proficiency rate will be increased to 95 percent in 2015.
Performance Targets - Language Arts Literacy
Subgroup# of Valid
Test Scores
Baseline
% Proficient
Yearly
Increment
2012-2013
Target (%P)
2011-2012
Target (%P)
2013-2014
Target (%P)
2014-2015
Target (%P)
2015-2016
Target (%P)
2016-2017
Target (%P)
Baseline
year
56.7 3.6 63.9 67.5 71.1 74.7 78.3Schoolwide 178 60.31011
- - - - - - -White - -1011
57.9 3.5 64.9 68.4 71.9 75.4 78.9Black 157 61.41011
- - - - - - -Hispanic - -1011
- - - - - - -American Indian - -1011
- - - - - - -Asian - -1011
- - - - - - -Two or More Races - -1011
30.3 5.8 41.9 47.7 53.5 59.3 65.1Students with Disabilities 33 36.11011
- - - - - - -Limited English Proficiency - -1011
56.9 3.6 64.1 67.7 71.3 74.9 78.5Economically Disadvantaged 153 60.51011
Performance Targets - Mathematics
Subgroup# of Valid
Test Scores
Baseline
% Proficient
Yearly
Increment
2012-2013
Target (%P)
2011-2012
Target (%P)
2013-2014
Target (%P)
2014-2015
Target (%P)
2015-2016
Target (%P)
2016-2017
Target (%P)
Baseline
year
83.8 1.4 86.6 88 89.4 90 90Schoolwide 179 85.21011
- - - - - - -White - -1011
83.4 1.4 86.2 87.6 89 90 90Black 157 84.81011
- - - - - - -Hispanic - -1011
- - - - - - -American Indian - -1011
- - - - - - -Asian - -1011
- - - - - - -Two or More Races - -1011
65.7 2.9 71.5 74.4 77.3 80.2 83.1Students with Disabilities 35 68.61011
- - - - - - -Limited English Proficiency - -1011
83.1 1.4 85.9 87.3 88.7 90 90Economically Disadvantaged 154 84.51011
11/5/2014
Only Includes full year students (Time In School < Year students are removed)
'-' Indicates too few students to determine (N<30)
Title I Accountability System

13-4530-020
Lester C Noecker
Roseland School district
CDS CODE :
DISTRICT :
SCHOOL :
ESEA Waiver - Annual Progress Targets
The tables represent the annual proficiency targets, established for this School under ESEA Waiver
Schools and Subgroups could meet expectations either by meeting the statewide proficiency rate of 90 percent, or reaching their individually
determined progress targets. The statewide proficiency rate will be increased to 95 percent in 2015.
Performance Targets - Language Arts Literacy
Subgroup# of Valid
Test Scores
Baseline
% Proficient
Yearly
Increment
2012-2013
Target (%P)
2011-2012
Target (%P)
2013-2014
Target (%P)
2014-2015
Target (%P)
2015-2016
Target (%P)
2016-2017
Target (%P)
Baseline
year
81.3 1.6 84.5 86.1 87.7 89.3 90Schoolwide 288 82.91011
81 1.6 84.2 85.8 87.4 89 90White 232 82.61011
- - - - - - -Black - -1011
- - - - - - -Hispanic - -1011
- - - - - - -American Indian - -1011
- - - - - - -Asian - -1011
- - - - - - -Two or More Races - -1011
50.9 4.1 59.1 63.2 67.3 71.4 75.5Students with Disabilities 55 551011
- - - - - - -Limited English Proficiency - -1011
- - - - - - -Economically Disadvantaged - -1011
Performance Targets - Mathematics
Subgroup# of Valid
Test Scores
Baseline
% Proficient
Yearly
Increment
2012-2013
Target (%P)
2011-2012
Target (%P)
2013-2014
Target (%P)
2014-2015
Target (%P)
2015-2016
Target (%P)
2016-2017
Target (%P)
Baseline
year
86.5 1.1 88.7 89.8 90 90 90Schoolwide 289 87.61011
86.3 1.2 88.7 89.9 90 90 90White 233 87.51011
- - - - - - -Black - -1011
- - - - - - -Hispanic - -1011
- - - - - - -American Indian - -1011
- - - - - - -Asian - -1011
- - - - - - -Two or More Races - -1011
59 3.4 65.8 69.2 72.6 76 79.4Students with Disabilities 56 62.41011
- - - - - - -Limited English Proficiency - -1011
- - - - - - -Economically Disadvantaged - -1011
11/5/2014
Only Includes full year students (Time In School < Year students are removed)
'-' Indicates too few students to determine (N<30)
Title I Accountability System

13-4900-030
Columbia High School
South Orange-Maplewood School District
CDS CODE :
DISTRICT :
SCHOOL :
ESEA Waiver - Annual Progress Targets
The tables represent the annual proficiency targets, established for this School under ESEA Waiver
Schools and Subgroups could meet expectations either by meeting the statewide proficiency rate of 90 percent, or reaching their individually
determined progress targets. The statewide proficiency rate will be increased to 95 percent in 2015.
Performance Targets - Language Arts Literacy
Subgroup# of Valid
Test Scores
Baseline
% Proficient
Yearly
Increment
2012-2013
Target (%P)
2011-2012
Target (%P)
2013-2014
Target (%P)
2014-2015
Target (%P)
2015-2016
Target (%P)
2016-2017
Target (%P)
Baseline
year
94.2 - 90 90 90 90 90Schoolwide 410 901011
99.3 - 90 90 90 90 90White 161 901011
90.4 - 90 90 90 90 90Black 208 901011
- - - - - - -Hispanic - -1011
- - - - - - -American Indian - -1011
- - - - - - -Asian - -1011
- - - - - - -Two or More Races - -1011
73.1 2.3 77.7 80 82.3 84.6 86.9Students with Disabilities 63 75.41011
- - - - - - -Limited English Proficiency - -1011
87.7 1 89.7 90 90 90 90Economically Disadvantaged 73 88.71011
Performance Targets - Mathematics
Subgroup# of Valid
Test Scores
Baseline
% Proficient
Yearly
Increment
2012-2013
Target (%P)
2011-2012
Target (%P)
2013-2014
Target (%P)
2014-2015
Target (%P)
2015-2016
Target (%P)
2016-2017
Target (%P)
Baseline
year
84.6 1.3 87.2 88.5 89.8 90 90Schoolwide 410 85.91011
96.3 - 90 90 90 90 90White 161 901011
76 2 80 82 84 86 88Black 208 781011
- - - - - - -Hispanic - -1011
- - - - - - -American Indian - -1011
- - - - - - -Asian - -1011
- - - - - - -Two or More Races - -1011
52.4 4 60.4 64.4 68.4 72.4 76.4Students with Disabilities 63 56.41011
- - - - - - -Limited English Proficiency - -1011
72.6 2.3 77.2 79.5 81.8 84.1 86.4Economically Disadvantaged 73 74.91011
11/5/2014
Only Includes full year students (Time In School < Year students are removed)
'-' Indicates too few students to determine (N<30)
Title I Accountability System

13-4900-040
Maplewood Middle School
South Orange-Maplewood School District
CDS CODE :
DISTRICT :
SCHOOL :
ESEA Waiver - Annual Progress Targets
The tables represent the annual proficiency targets, established for this School under ESEA Waiver
Schools and Subgroups could meet expectations either by meeting the statewide proficiency rate of 90 percent, or reaching their individually
determined progress targets. The statewide proficiency rate will be increased to 95 percent in 2015.
Performance Targets - Language Arts Literacy
Subgroup# of Valid
Test Scores
Baseline
% Proficient
Yearly
Increment
2012-2013
Target (%P)
2011-2012
Target (%P)
2013-2014
Target (%P)
2014-2015
Target (%P)
2015-2016
Target (%P)
2016-2017
Target (%P)
Baseline
year
80 1.7 83.4 85.1 86.8 88.5 90Schoolwide 691 81.71011
93.9 - 90 90 90 90 90White 342 901011
62.2 3.2 68.6 71.8 75 78.2 81.4Black 291 65.41011
86.7 1.1 88.9 90 90 90 90Hispanic 30 87.81011
- - - - - - -American Indian - -1011
- - - - - - -Asian - -1011
- - - - - - -Two or More Races - -1011
37.7 5.2 48.1 53.3 58.5 63.7 68.9Students with Disabilities 101 42.91011
- - - - - - -Limited English Proficiency - -1011
56.1 3.7 63.5 67.2 70.9 74.6 78.3Economically Disadvantaged 146 59.81011
Performance Targets - Mathematics
Subgroup# of Valid
Test Scores
Baseline
% Proficient
Yearly
Increment
2012-2013
Target (%P)
2011-2012
Target (%P)
2013-2014
Target (%P)
2014-2015
Target (%P)
2015-2016
Target (%P)
2016-2017
Target (%P)
Baseline
year
80.5 1.6 83.7 85.3 86.9 88.5 90Schoolwide 689 82.11011
94.1 - 90 90 90 90 90White 340 901011
62.8 3.1 69 72.1 75.2 78.3 81.4Black 291 65.91011
90 - 90 90 90 90 90Hispanic 30 901011
- - - - - - -American Indian - -1011
- - - - - - -Asian - -1011
- - - - - - -Two or More Races - -1011
37.7 5.2 48.1 53.3 58.5 63.7 68.9Students with Disabilities 101 42.91011
- - - - - - -Limited English Proficiency - -1011
57.6 3.6 64.8 68.4 72 75.6 79.2Economically Disadvantaged 146 61.21011
11/5/2014
Only Includes full year students (Time In School < Year students are removed)
'-' Indicates too few students to determine (N<30)
Title I Accountability System
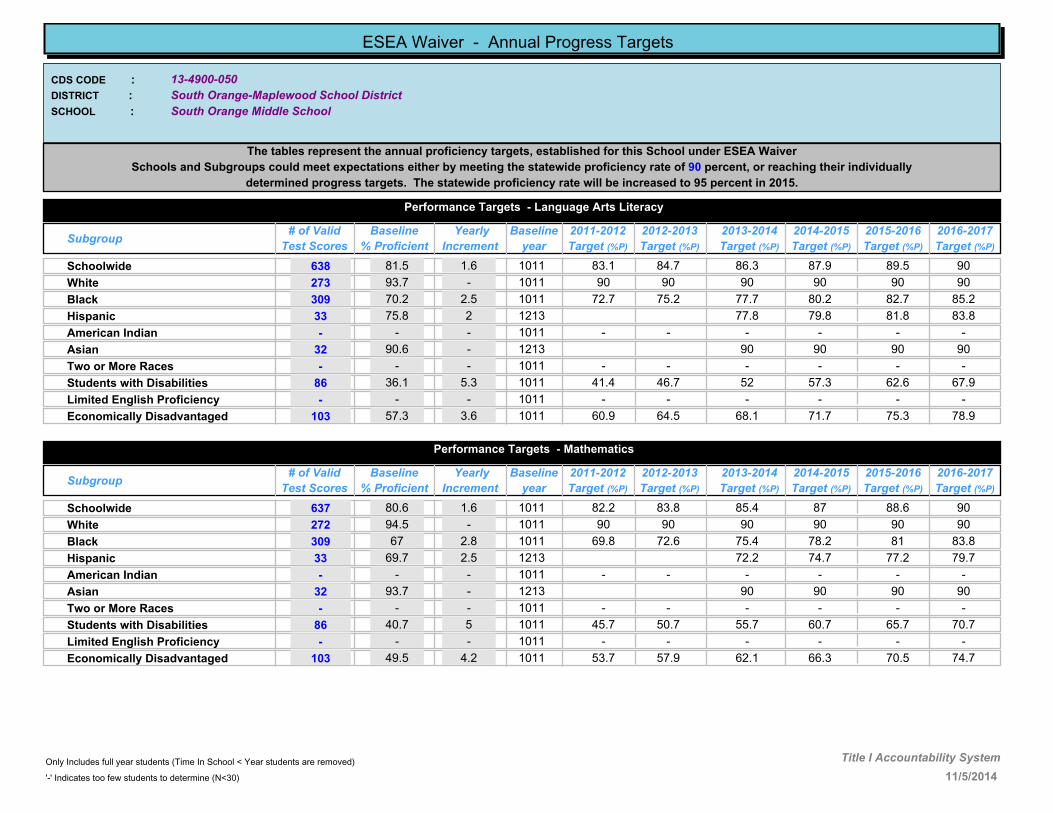
13-4900-050
South Orange Middle School
South Orange-Maplewood School District
CDS CODE :
DISTRICT :
SCHOOL :
ESEA Waiver - Annual Progress Targets
The tables represent the annual proficiency targets, established for this School under ESEA Waiver
Schools and Subgroups could meet expectations either by meeting the statewide proficiency rate of 90 percent, or reaching their individually
determined progress targets. The statewide proficiency rate will be increased to 95 percent in 2015.
Performance Targets - Language Arts Literacy
Subgroup# of Valid
Test Scores
Baseline
% Proficient
Yearly
Increment
2012-2013
Target (%P)
2011-2012
Target (%P)
2013-2014
Target (%P)
2014-2015
Target (%P)
2015-2016
Target (%P)
2016-2017
Target (%P)
Baseline
year
81.5 1.6 84.7 86.3 87.9 89.5 90Schoolwide 638 83.11011
93.7 - 90 90 90 90 90White 273 901011
70.2 2.5 75.2 77.7 80.2 82.7 85.2Black 309 72.71011
75.8 2 77.8 79.8 81.8 83.8Hispanic 33 1213
- - - - - - -American Indian - -1011
90.6 - 90 90 90 90Asian 32 1213
- - - - - - -Two or More Races - -1011
36.1 5.3 46.7 52 57.3 62.6 67.9Students with Disabilities 86 41.41011
- - - - - - -Limited English Proficiency - -1011
57.3 3.6 64.5 68.1 71.7 75.3 78.9Economically Disadvantaged 103 60.91011
Performance Targets - Mathematics
Subgroup# of Valid
Test Scores
Baseline
% Proficient
Yearly
Increment
2012-2013
Target (%P)
2011-2012
Target (%P)
2013-2014
Target (%P)
2014-2015
Target (%P)
2015-2016
Target (%P)
2016-2017
Target (%P)
Baseline
year
80.6 1.6 83.8 85.4 87 88.6 90Schoolwide 637 82.21011
94.5 - 90 90 90 90 90White 272 901011
67 2.8 72.6 75.4 78.2 81 83.8Black 309 69.81011
69.7 2.5 72.2 74.7 77.2 79.7Hispanic 33 1213
- - - - - - -American Indian - -1011
93.7 - 90 90 90 90Asian 32 1213
- - - - - - -Two or More Races - -1011
40.7 5 50.7 55.7 60.7 65.7 70.7Students with Disabilities 86 45.71011
- - - - - - -Limited English Proficiency - -1011
49.5 4.2 57.9 62.1 66.3 70.5 74.7Economically Disadvantaged 103 53.71011
11/5/2014
Only Includes full year students (Time In School < Year students are removed)
'-' Indicates too few students to determine (N<30)
Title I Accountability System

13-4900-060
Clinton Elementary School
South Orange-Maplewood School District
CDS CODE :
DISTRICT :
SCHOOL :
ESEA Waiver - Annual Progress Targets
The tables represent the annual proficiency targets, established for this School under ESEA Waiver
Schools and Subgroups could meet expectations either by meeting the statewide proficiency rate of 90 percent, or reaching their individually
determined progress targets. The statewide proficiency rate will be increased to 95 percent in 2015.
Performance Targets - Language Arts Literacy
Subgroup# of Valid
Test Scores
Baseline
% Proficient
Yearly
Increment
2012-2013
Target (%P)
2011-2012
Target (%P)
2013-2014
Target (%P)
2014-2015
Target (%P)
2015-2016
Target (%P)
2016-2017
Target (%P)
Baseline
year
68.1 2.7 73.5 76.2 78.9 81.6 84.3Schoolwide 241 70.81011
88.9 .9 90 90 90 90 90White 99 89.81011
53 3.9 60.8 64.7 68.6 72.5 76.4Black 115 56.91011
- - - - - - -Hispanic - -1011
- - - - - - -American Indian - -1011
- - - - - - -Asian - -1011
- - - - - - -Two or More Races - -1011
26.2 6.2 38.6 44.8 51 57.2 63.4Students with Disabilities 42 32.41011
- - - - - - -Limited English Proficiency - -1011
43.3 4.7 52.7 57.4 62.1 66.8 71.5Economically Disadvantaged 67 481011
Performance Targets - Mathematics
Subgroup# of Valid
Test Scores
Baseline
% Proficient
Yearly
Increment
2012-2013
Target (%P)
2011-2012
Target (%P)
2013-2014
Target (%P)
2014-2015
Target (%P)
2015-2016
Target (%P)
2016-2017
Target (%P)
Baseline
year
72.2 2.3 76.8 79.1 81.4 83.7 86Schoolwide 241 74.51011
87.9 1 89.9 90 90 90 90White 99 88.91011
58.3 3.5 65.3 68.8 72.3 75.8 79.3Black 115 61.81011
- - - - - - -Hispanic - -1011
- - - - - - -American Indian - -1011
- - - - - - -Asian - -1011
- - - - - - -Two or More Races - -1011
33.3 5.6 44.5 50.1 55.7 61.3 66.9Students with Disabilities 42 38.91011
- - - - - - -Limited English Proficiency - -1011
53.7 3.9 61.5 65.4 69.3 73.2 77.1Economically Disadvantaged 67 57.61011
11/5/2014
Only Includes full year students (Time In School < Year students are removed)
'-' Indicates too few students to determine (N<30)
Title I Accountability System
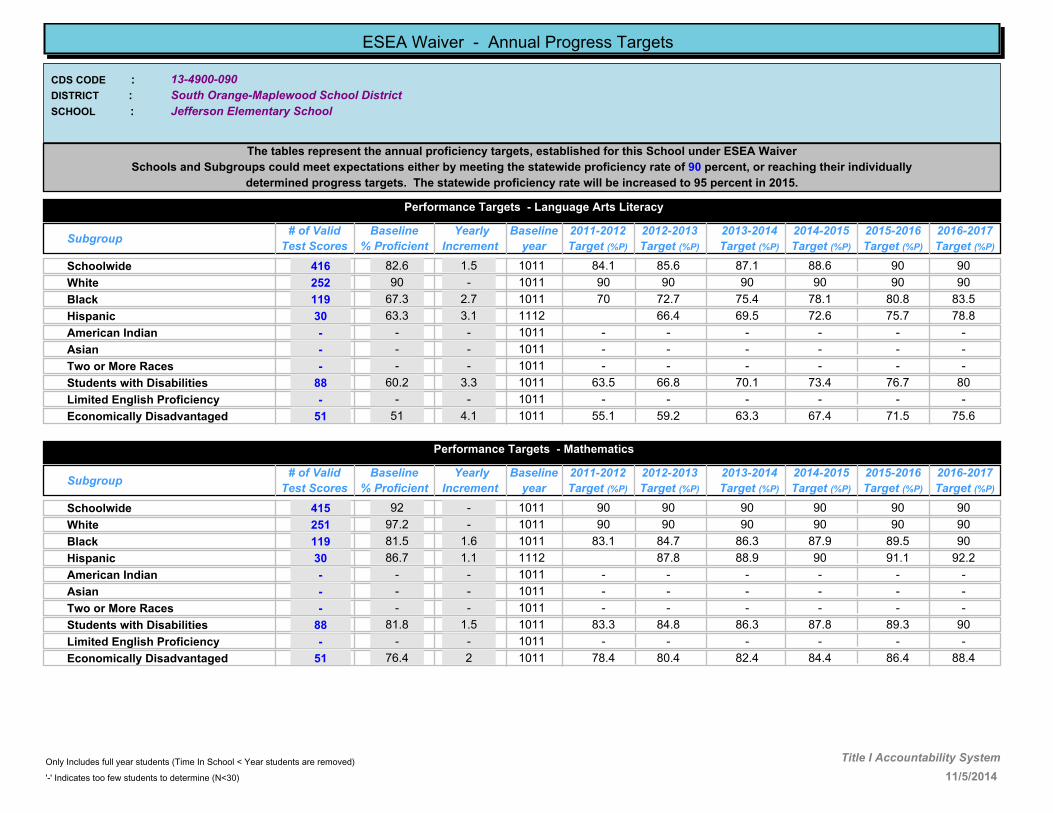
13-4900-090
Jefferson Elementary School
South Orange-Maplewood School District
CDS CODE :
DISTRICT :
SCHOOL :
ESEA Waiver - Annual Progress Targets
The tables represent the annual proficiency targets, established for this School under ESEA Waiver
Schools and Subgroups could meet expectations either by meeting the statewide proficiency rate of 90 percent, or reaching their individually
determined progress targets. The statewide proficiency rate will be increased to 95 percent in 2015.
Performance Targets - Language Arts Literacy
Subgroup# of Valid
Test Scores
Baseline
% Proficient
Yearly
Increment
2012-2013
Target (%P)
2011-2012
Target (%P)
2013-2014
Target (%P)
2014-2015
Target (%P)
2015-2016
Target (%P)
2016-2017
Target (%P)
Baseline
year
82.6 1.5 85.6 87.1 88.6 90 90Schoolwide 416 84.11011
90 - 90 90 90 90 90White 252 901011
67.3 2.7 72.7 75.4 78.1 80.8 83.5Black 119 701011
63.3 3.1 66.4 69.5 72.6 75.7 78.8Hispanic 30 1112
- - - - - - -American Indian - -1011
- - - - - - -Asian - -1011
- - - - - - -Two or More Races - -1011
60.2 3.3 66.8 70.1 73.4 76.7 80Students with Disabilities 88 63.51011
- - - - - - -Limited English Proficiency - -1011
51 4.1 59.2 63.3 67.4 71.5 75.6Economically Disadvantaged 51 55.11011
Performance Targets - Mathematics
Subgroup# of Valid
Test Scores
Baseline
% Proficient
Yearly
Increment
2012-2013
Target (%P)
2011-2012
Target (%P)
2013-2014
Target (%P)
2014-2015
Target (%P)
2015-2016
Target (%P)
2016-2017
Target (%P)
Baseline
year
92 - 90 90 90 90 90Schoolwide 415 901011
97.2 - 90 90 90 90 90White 251 901011
81.5 1.6 84.7 86.3 87.9 89.5 90Black 119 83.11011
86.7 1.1 87.8 88.9 90 91.1 92.2Hispanic 30 1112
- - - - - - -American Indian - -1011
- - - - - - -Asian - -1011
- - - - - - -Two or More Races - -1011
81.8 1.5 84.8 86.3 87.8 89.3 90Students with Disabilities 88 83.31011
- - - - - - -Limited English Proficiency - -1011
76.4 2 80.4 82.4 84.4 86.4 88.4Economically Disadvantaged 51 78.41011
11/5/2014
Only Includes full year students (Time In School < Year students are removed)
'-' Indicates too few students to determine (N<30)
Title I Accountability System
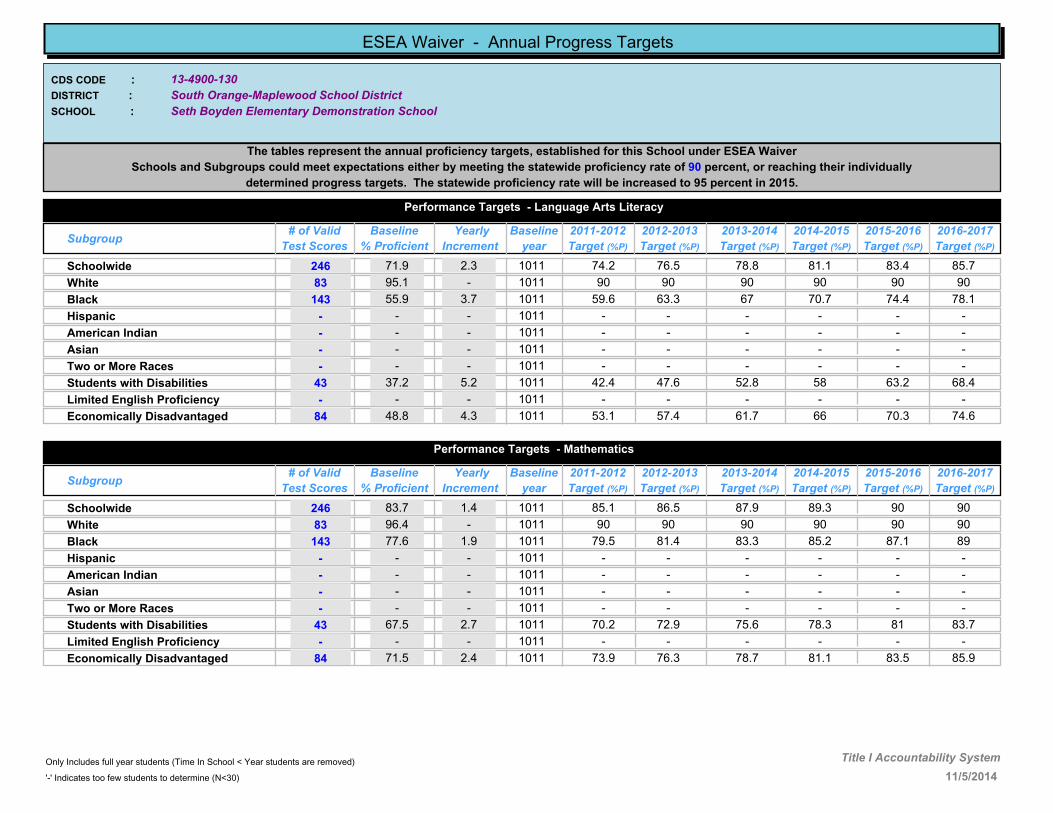
13-4900-130
Seth Boyden Elementary Demonstration School
South Orange-Maplewood School District
CDS CODE :
DISTRICT :
SCHOOL :
ESEA Waiver - Annual Progress Targets
The tables represent the annual proficiency targets, established for this School under ESEA Waiver
Schools and Subgroups could meet expectations either by meeting the statewide proficiency rate of 90 percent, or reaching their individually
determined progress targets. The statewide proficiency rate will be increased to 95 percent in 2015.
Performance Targets - Language Arts Literacy
Subgroup# of Valid
Test Scores
Baseline
% Proficient
Yearly
Increment
2012-2013
Target (%P)
2011-2012
Target (%P)
2013-2014
Target (%P)
2014-2015
Target (%P)
2015-2016
Target (%P)
2016-2017
Target (%P)
Baseline
year
71.9 2.3 76.5 78.8 81.1 83.4 85.7Schoolwide 246 74.21011
95.1 - 90 90 90 90 90White 83 901011
55.9 3.7 63.3 67 70.7 74.4 78.1Black 143 59.61011
- - - - - - -Hispanic - -1011
- - - - - - -American Indian - -1011
- - - - - - -Asian - -1011
- - - - - - -Two or More Races - -1011
37.2 5.2 47.6 52.8 58 63.2 68.4Students with Disabilities 43 42.41011
- - - - - - -Limited English Proficiency - -1011
48.8 4.3 57.4 61.7 66 70.3 74.6Economically Disadvantaged 84 53.11011
Performance Targets - Mathematics
Subgroup# of Valid
Test Scores
Baseline
% Proficient
Yearly
Increment
2012-2013
Target (%P)
2011-2012
Target (%P)
2013-2014
Target (%P)
2014-2015
Target (%P)
2015-2016
Target (%P)
2016-2017
Target (%P)
Baseline
year
83.7 1.4 86.5 87.9 89.3 90 90Schoolwide 246 85.11011
96.4 - 90 90 90 90 90White 83 901011
77.6 1.9 81.4 83.3 85.2 87.1 89Black 143 79.51011
- - - - - - -Hispanic - -1011
- - - - - - -American Indian - -1011
- - - - - - -Asian - -1011
- - - - - - -Two or More Races - -1011
67.5 2.7 72.9 75.6 78.3 81 83.7Students with Disabilities 43 70.21011
- - - - - - -Limited English Proficiency - -1011
71.5 2.4 76.3 78.7 81.1 83.5 85.9Economically Disadvantaged 84 73.91011
11/5/2014
Only Includes full year students (Time In School < Year students are removed)
'-' Indicates too few students to determine (N<30)
Title I Accountability System

13-4900-140
South Mountain Elementary/Annex
South Orange-Maplewood School District
CDS CODE :
DISTRICT :
SCHOOL :
ESEA Waiver - Annual Progress Targets
The tables represent the annual proficiency targets, established for this School under ESEA Waiver
Schools and Subgroups could meet expectations either by meeting the statewide proficiency rate of 90 percent, or reaching their individually
determined progress targets. The statewide proficiency rate will be increased to 95 percent in 2015.
Performance Targets - Language Arts Literacy
Subgroup# of Valid
Test Scores
Baseline
% Proficient
Yearly
Increment
2012-2013
Target (%P)
2011-2012
Target (%P)
2013-2014
Target (%P)
2014-2015
Target (%P)
2015-2016
Target (%P)
2016-2017
Target (%P)
Baseline
year
84.3 1.3 86.9 88.2 89.5 90 90Schoolwide 312 85.61011
89.9 .9 90 90 90 90 90White 216 901011
61.3 3.2 67.7 70.9 74.1 77.3 80.5Black 62 64.51011
- - - - - - -Hispanic - -1011
- - - - - - -American Indian - -1011
- - - - - - -Asian - -1011
- - - - - - -Two or More Races - -1011
39.4 5.1 49.6 54.7 59.8 64.9 70Students with Disabilities 33 44.51011
- - - - - - -Limited English Proficiency - -1011
- - - - - - -Economically Disadvantaged - -1011
Performance Targets - Mathematics
Subgroup# of Valid
Test Scores
Baseline
% Proficient
Yearly
Increment
2012-2013
Target (%P)
2011-2012
Target (%P)
2013-2014
Target (%P)
2014-2015
Target (%P)
2015-2016
Target (%P)
2016-2017
Target (%P)
Baseline
year
92.6 - 90 90 90 90 90Schoolwide 312 901011
96.8 - 90 90 90 90 90White 216 901011
75.8 2 79.8 81.8 83.8 85.8 87.8Black 62 77.81011
- - - - - - -Hispanic - -1011
- - - - - - -American Indian - -1011
- - - - - - -Asian - -1011
- - - - - - -Two or More Races - -1011
66.7 2.8 72.3 75.1 77.9 80.7 83.5Students with Disabilities 33 69.51011
- - - - - - -Limited English Proficiency - -1011
- - - - - - -Economically Disadvantaged - -1011
11/5/2014
Only Includes full year students (Time In School < Year students are removed)
'-' Indicates too few students to determine (N<30)
Title I Accountability System

13-4900-150
Tuscan Elementary
South Orange-Maplewood School District
CDS CODE :
DISTRICT :
SCHOOL :
ESEA Waiver - Annual Progress Targets
The tables represent the annual proficiency targets, established for this School under ESEA Waiver
Schools and Subgroups could meet expectations either by meeting the statewide proficiency rate of 90 percent, or reaching their individually
determined progress targets. The statewide proficiency rate will be increased to 95 percent in 2015.
Performance Targets - Language Arts Literacy
Subgroup# of Valid
Test Scores
Baseline
% Proficient
Yearly
Increment
2012-2013
Target (%P)
2011-2012
Target (%P)
2013-2014
Target (%P)
2014-2015
Target (%P)
2015-2016
Target (%P)
2016-2017
Target (%P)
Baseline
year
81.4 1.6 84.6 86.2 87.8 89.4 90Schoolwide 307 831011
90.3 - 90 90 90 90 90White 207 901011
57.2 3.6 64.4 68 71.6 75.2 78.8Black 70 60.81011
- - - - - - -Hispanic - -1011
- - - - - - -American Indian - -1011
- - - - - - -Asian - -1011
- - - - - - -Two or More Races - -1011
42.5 4.8 52.1 56.9 61.7 66.5 71.3Students with Disabilities 33 47.31011
- - - - - - -Limited English Proficiency - -1011
50 4.2 54.2 58.4 62.6 66.8Economically Disadvantaged 30 1213
Performance Targets - Mathematics
Subgroup# of Valid
Test Scores
Baseline
% Proficient
Yearly
Increment
2012-2013
Target (%P)
2011-2012
Target (%P)
2013-2014
Target (%P)
2014-2015
Target (%P)
2015-2016
Target (%P)
2016-2017
Target (%P)
Baseline
year
88.9 .9 90 90 90 90 90Schoolwide 306 89.81011
96.2 - 90 90 90 90 90White 207 901011
69.6 2.5 74.6 77.1 79.6 82.1 84.6Black 69 72.11011
- - - - - - -Hispanic - -1011
- - - - - - -American Indian - -1011
- - - - - - -Asian - -1011
- - - - - - -Two or More Races - -1011
48.5 4.3 57.1 61.4 65.7 70 74.3Students with Disabilities 33 52.81011
- - - - - - -Limited English Proficiency - -1011
76.7 2 78.7 80.7 82.7 84.7Economically Disadvantaged 30 1213
11/5/2014
Only Includes full year students (Time In School < Year students are removed)
'-' Indicates too few students to determine (N<30)
Title I Accountability System

13-5370-050
Verona High School
Verona Public Schools
CDS CODE :
DISTRICT :
SCHOOL :
ESEA Waiver - Annual Progress Targets
The tables represent the annual proficiency targets, established for this School under ESEA Waiver
Schools and Subgroups could meet expectations either by meeting the statewide proficiency rate of 90 percent, or reaching their individually
determined progress targets. The statewide proficiency rate will be increased to 95 percent in 2015.
Performance Targets - Language Arts Literacy
Subgroup# of Valid
Test Scores
Baseline
% Proficient
Yearly
Increment
2012-2013
Target (%P)
2011-2012
Target (%P)
2013-2014
Target (%P)
2014-2015
Target (%P)
2015-2016
Target (%P)
2016-2017
Target (%P)
Baseline
year
96.7 - 90 90 90 90 90Schoolwide 150 901011
96.8 - 90 90 90 90 90White 125 901011
- - - - - - -Black - -1011
- - - - - - -Hispanic - -1011
- - - - - - -American Indian - -1011
- - - - - - -Asian - -1011
- - - - - - -Two or More Races - -1011
- - - - - - -Students with Disabilities - -1011
- - - - - - -Limited English Proficiency - -1011
- - - - - - -Economically Disadvantaged - -1011
Performance Targets - Mathematics
Subgroup# of Valid
Test Scores
Baseline
% Proficient
Yearly
Increment
2012-2013
Target (%P)
2011-2012
Target (%P)
2013-2014
Target (%P)
2014-2015
Target (%P)
2015-2016
Target (%P)
2016-2017
Target (%P)
Baseline
year
85.3 1.2 87.7 88.9 90 90 90Schoolwide 150 86.51011
86.4 1.1 88.6 89.7 90 90 90White 125 87.51011
- - - - - - -Black - -1011
- - - - - - -Hispanic - -1011
- - - - - - -American Indian - -1011
- - - - - - -Asian - -1011
- - - - - - -Two or More Races - -1011
- - - - - - -Students with Disabilities - -1011
- - - - - - -Limited English Proficiency - -1011
- - - - - - -Economically Disadvantaged - -1011
11/5/2014
Only Includes full year students (Time In School < Year students are removed)
'-' Indicates too few students to determine (N<30)
Title I Accountability System

13-5370-070
Brookdale Avenue School
Verona Public Schools
CDS CODE :
DISTRICT :
SCHOOL :
ESEA Waiver - Annual Progress Targets
The tables represent the annual proficiency targets, established for this School under ESEA Waiver
Schools and Subgroups could meet expectations either by meeting the statewide proficiency rate of 90 percent, or reaching their individually
determined progress targets. The statewide proficiency rate will be increased to 95 percent in 2015.
Performance Targets - Language Arts Literacy
Subgroup# of Valid
Test Scores
Baseline
% Proficient
Yearly
Increment
2012-2013
Target (%P)
2011-2012
Target (%P)
2013-2014
Target (%P)
2014-2015
Target (%P)
2015-2016
Target (%P)
2016-2017
Target (%P)
Baseline
year
84.4 1.3 87 88.3 89.6 90 90Schoolwide 64 85.71011
87.5 1.1 89.7 90 90 90 90White 56 88.61011
- - - - - - -Black - -1011
- - - - - - -Hispanic - -1011
- - - - - - -American Indian - -1011
- - - - - - -Asian - -1011
- - - - - - -Two or More Races - -1011
- - - - - - -Students with Disabilities - -1011
- - - - - - -Limited English Proficiency - -1011
- - - - - - -Economically Disadvantaged - -1011
Performance Targets - Mathematics
Subgroup# of Valid
Test Scores
Baseline
% Proficient
Yearly
Increment
2012-2013
Target (%P)
2011-2012
Target (%P)
2013-2014
Target (%P)
2014-2015
Target (%P)
2015-2016
Target (%P)
2016-2017
Target (%P)
Baseline
year
89.1 .9 90 90 90 90 90Schoolwide 64 901011
91.1 - 90 90 90 90 90White 56 901011
- - - - - - -Black - -1011
- - - - - - -Hispanic - -1011
- - - - - - -American Indian - -1011
- - - - - - -Asian - -1011
- - - - - - -Two or More Races - -1011
- - - - - - -Students with Disabilities - -1011
- - - - - - -Limited English Proficiency - -1011
- - - - - - -Economically Disadvantaged - -1011
11/5/2014
Only Includes full year students (Time In School < Year students are removed)
'-' Indicates too few students to determine (N<30)
Title I Accountability System

13-5370-080
Frederic N. Brown Elementary School
Verona Public Schools
CDS CODE :
DISTRICT :
SCHOOL :
ESEA Waiver - Annual Progress Targets
The tables represent the annual proficiency targets, established for this School under ESEA Waiver
Schools and Subgroups could meet expectations either by meeting the statewide proficiency rate of 90 percent, or reaching their individually
determined progress targets. The statewide proficiency rate will be increased to 95 percent in 2015.
Performance Targets - Language Arts Literacy
Subgroup# of Valid
Test Scores
Baseline
% Proficient
Yearly
Increment
2012-2013
Target (%P)
2011-2012
Target (%P)
2013-2014
Target (%P)
2014-2015
Target (%P)
2015-2016
Target (%P)
2016-2017
Target (%P)
Baseline
year
77.5 1.9 81.3 83.2 85.1 87 88.9Schoolwide 98 79.41011
78.5 1.8 82.1 83.9 85.7 87.5 89.3White 79 80.31011
- - - - - - -Black - -1011
- - - - - - -Hispanic - -1011
- - - - - - -American Indian - -1011
- - - - - - -Asian - -1011
- - - - - - -Two or More Races - -1011
- - - - - - -Students with Disabilities - -1011
- - - - - - -Limited English Proficiency - -1011
- - - - - - -Economically Disadvantaged - -1011
Performance Targets - Mathematics
Subgroup# of Valid
Test Scores
Baseline
% Proficient
Yearly
Increment
2012-2013
Target (%P)
2011-2012
Target (%P)
2013-2014
Target (%P)
2014-2015
Target (%P)
2015-2016
Target (%P)
2016-2017
Target (%P)
Baseline
year
79.6 1.7 83 84.7 86.4 88.1 89.8Schoolwide 98 81.31011
84.8 1.3 87.4 88.7 90 90 90White 79 86.11011
- - - - - - -Black - -1011
- - - - - - -Hispanic - -1011
- - - - - - -American Indian - -1011
- - - - - - -Asian - -1011
- - - - - - -Two or More Races - -1011
- - - - - - -Students with Disabilities - -1011
- - - - - - -Limited English Proficiency - -1011
- - - - - - -Economically Disadvantaged - -1011
11/5/2014
Only Includes full year students (Time In School < Year students are removed)
'-' Indicates too few students to determine (N<30)
Title I Accountability System
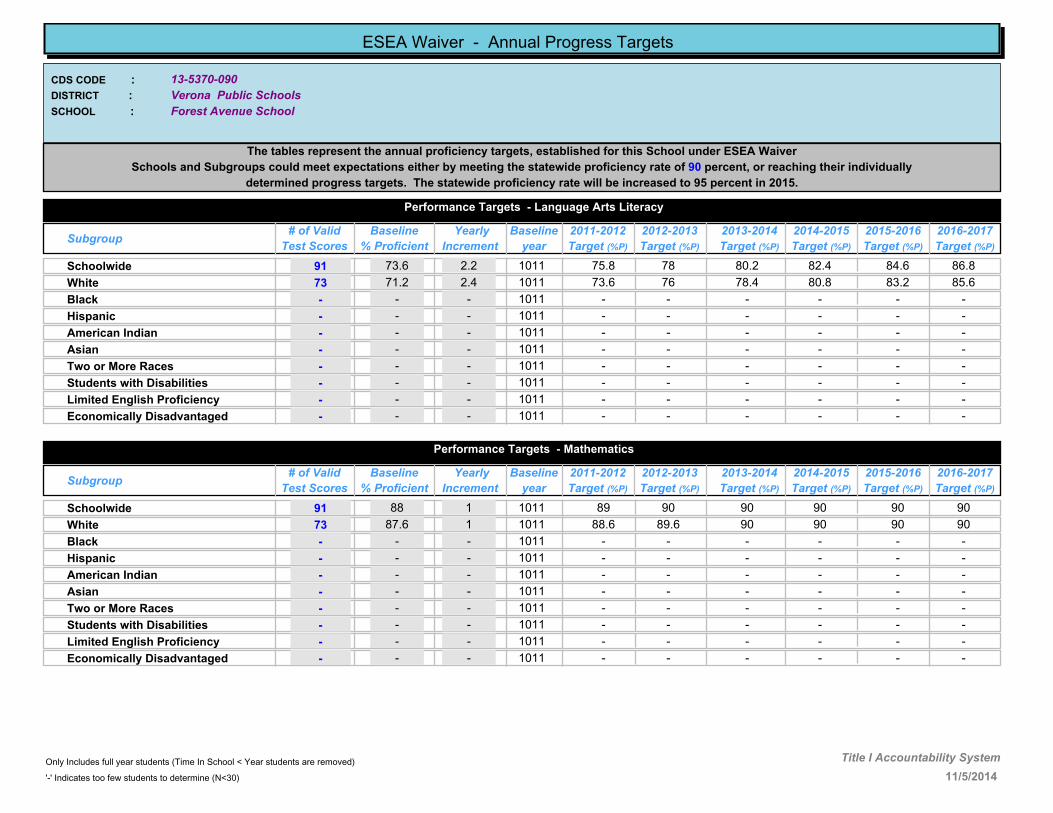
13-5370-090
Forest Avenue School
Verona Public Schools
CDS CODE :
DISTRICT :
SCHOOL :
ESEA Waiver - Annual Progress Targets
The tables represent the annual proficiency targets, established for this School under ESEA Waiver
Schools and Subgroups could meet expectations either by meeting the statewide proficiency rate of 90 percent, or reaching their individually
determined progress targets. The statewide proficiency rate will be increased to 95 percent in 2015.
Performance Targets - Language Arts Literacy
Subgroup# of Valid
Test Scores
Baseline
% Proficient
Yearly
Increment
2012-2013
Target (%P)
2011-2012
Target (%P)
2013-2014
Target (%P)
2014-2015
Target (%P)
2015-2016
Target (%P)
2016-2017
Target (%P)
Baseline
year
73.6 2.2 78 80.2 82.4 84.6 86.8Schoolwide 91 75.81011
71.2 2.4 76 78.4 80.8 83.2 85.6White 73 73.61011
- - - - - - -Black - -1011
- - - - - - -Hispanic - -1011
- - - - - - -American Indian - -1011
- - - - - - -Asian - -1011
- - - - - - -Two or More Races - -1011
- - - - - - -Students with Disabilities - -1011
- - - - - - -Limited English Proficiency - -1011
- - - - - - -Economically Disadvantaged - -1011
Performance Targets - Mathematics
Subgroup# of Valid
Test Scores
Baseline
% Proficient
Yearly
Increment
2012-2013
Target (%P)
2011-2012
Target (%P)
2013-2014
Target (%P)
2014-2015
Target (%P)
2015-2016
Target (%P)
2016-2017
Target (%P)
Baseline
year
88 1 90 90 90 90 90Schoolwide 91 891011
87.6 1 89.6 90 90 90 90White 73 88.61011
- - - - - - -Black - -1011
- - - - - - -Hispanic - -1011
- - - - - - -American Indian - -1011
- - - - - - -Asian - -1011
- - - - - - -Two or More Races - -1011
- - - - - - -Students with Disabilities - -1011
- - - - - - -Limited English Proficiency - -1011
- - - - - - -Economically Disadvantaged - -1011
11/5/2014
Only Includes full year students (Time In School < Year students are removed)
'-' Indicates too few students to determine (N<30)
Title I Accountability System

13-5370-095
Henry B. Whitehorne Middle School
Verona Public Schools
CDS CODE :
DISTRICT :
SCHOOL :
ESEA Waiver - Annual Progress Targets
The tables represent the annual proficiency targets, established for this School under ESEA Waiver
Schools and Subgroups could meet expectations either by meeting the statewide proficiency rate of 90 percent, or reaching their individually
determined progress targets. The statewide proficiency rate will be increased to 95 percent in 2015.
Performance Targets - Language Arts Literacy
Subgroup# of Valid
Test Scores
Baseline
% Proficient
Yearly
Increment
2012-2013
Target (%P)
2011-2012
Target (%P)
2013-2014
Target (%P)
2014-2015
Target (%P)
2015-2016
Target (%P)
2016-2017
Target (%P)
Baseline
year
86 1.2 88.4 89.6 90 90 90Schoolwide 625 87.21011
87.4 1.1 89.6 90 90 90 90White 533 88.51011
- - - - - - -Black - -1011
86.1 1.2 88.5 89.7 90 90 90Hispanic 36 87.31011
- - - - - - -American Indian - -1011
87.9 1 88.9 89.9 90.9 91.9Asian 33 1213
- - - - - - -Two or More Races - -1011
55.2 3.7 62.6 66.3 70 73.7 77.4Students with Disabilities 87 58.91011
- - - - - - -Limited English Proficiency - -1011
- - - - - - -Economically Disadvantaged - -1011
Performance Targets - Mathematics
Subgroup# of Valid
Test Scores
Baseline
% Proficient
Yearly
Increment
2012-2013
Target (%P)
2011-2012
Target (%P)
2013-2014
Target (%P)
2014-2015
Target (%P)
2015-2016
Target (%P)
2016-2017
Target (%P)
Baseline
year
82.6 1.5 85.6 87.1 88.6 90 90Schoolwide 625 84.11011
84.5 1.3 87.1 88.4 89.7 90 90White 533 85.81011
- - - - - - -Black - -1011
77.8 1.9 81.6 83.5 85.4 87.3 89.2Hispanic 36 79.71011
- - - - - - -American Indian - -1011
90.9 - 90 90 90 90Asian 33 1213
- - - - - - -Two or More Races - -1011
52.8 3.9 60.6 64.5 68.4 72.3 76.2Students with Disabilities 87 56.71011
- - - - - - -Limited English Proficiency - -1011
- - - - - - -Economically Disadvantaged - -1011
11/5/2014
Only Includes full year students (Time In School < Year students are removed)
'-' Indicates too few students to determine (N<30)
Title I Accountability System

13-5370-100
Laning Avenue School
Verona Public Schools
CDS CODE :
DISTRICT :
SCHOOL :
ESEA Waiver - Annual Progress Targets
The tables represent the annual proficiency targets, established for this School under ESEA Waiver
Schools and Subgroups could meet expectations either by meeting the statewide proficiency rate of 90 percent, or reaching their individually
determined progress targets. The statewide proficiency rate will be increased to 95 percent in 2015.
Performance Targets - Language Arts Literacy
Subgroup# of Valid
Test Scores
Baseline
% Proficient
Yearly
Increment
2012-2013
Target (%P)
2011-2012
Target (%P)
2013-2014
Target (%P)
2014-2015
Target (%P)
2015-2016
Target (%P)
2016-2017
Target (%P)
Baseline
year
83.7 1.4 86.5 87.9 89.3 90 90Schoolwide 92 85.11011
84 1.3 86.6 87.9 89.2 90 90White 75 85.31011
- - - - - - -Black - -1011
- - - - - - -Hispanic - -1011
- - - - - - -American Indian - -1011
- - - - - - -Asian - -1011
- - - - - - -Two or More Races - -1011
- - - - - - -Students with Disabilities - -1011
- - - - - - -Limited English Proficiency - -1011
- - - - - - -Economically Disadvantaged - -1011
Performance Targets - Mathematics
Subgroup# of Valid
Test Scores
Baseline
% Proficient
Yearly
Increment
2012-2013
Target (%P)
2011-2012
Target (%P)
2013-2014
Target (%P)
2014-2015
Target (%P)
2015-2016
Target (%P)
2016-2017
Target (%P)
Baseline
year
94.6 - 90 90 90 90 90Schoolwide 92 901011
93.3 - 90 90 90 90 90White 75 901011
- - - - - - -Black - -1011
- - - - - - -Hispanic - -1011
- - - - - - -American Indian - -1011
- - - - - - -Asian - -1011
- - - - - - -Two or More Races - -1011
- - - - - - -Students with Disabilities - -1011
- - - - - - -Limited English Proficiency - -1011
- - - - - - -Economically Disadvantaged - -1011
11/5/2014
Only Includes full year students (Time In School < Year students are removed)
'-' Indicates too few students to determine (N<30)
Title I Accountability System

13-5630-050
West Essex High School
West Essex Regional School District
CDS CODE :
DISTRICT :
SCHOOL :
ESEA Waiver - Annual Progress Targets
The tables represent the annual proficiency targets, established for this School under ESEA Waiver
Schools and Subgroups could meet expectations either by meeting the statewide proficiency rate of 90 percent, or reaching their individually
determined progress targets. The statewide proficiency rate will be increased to 95 percent in 2015.
Performance Targets - Language Arts Literacy
Subgroup# of Valid
Test Scores
Baseline
% Proficient
Yearly
Increment
2012-2013
Target (%P)
2011-2012
Target (%P)
2013-2014
Target (%P)
2014-2015
Target (%P)
2015-2016
Target (%P)
2016-2017
Target (%P)
Baseline
year
96.6 - 90 90 90 90 90Schoolwide 262 901011
97.1 - 90 90 90 90 90White 240 901011
- - - - - - -Black - -1011
- - - - - - -Hispanic - -1011
- - - - - - -American Indian - -1011
- - - - - - -Asian - -1011
- - - - - - -Two or More Races - -1011
76.6 2 78.6 80.6 82.6 84.6 86.6Students with Disabilities 30 1112
- - - - - - -Limited English Proficiency - -1011
- - - - - - -Economically Disadvantaged - -1011
Performance Targets - Mathematics
Subgroup# of Valid
Test Scores
Baseline
% Proficient
Yearly
Increment
2012-2013
Target (%P)
2011-2012
Target (%P)
2013-2014
Target (%P)
2014-2015
Target (%P)
2015-2016
Target (%P)
2016-2017
Target (%P)
Baseline
year
92.8 - 90 90 90 90 90Schoolwide 262 901011
94.2 - 90 90 90 90 90White 240 901011
- - - - - - -Black - -1011
- - - - - - -Hispanic - -1011
- - - - - - -American Indian - -1011
- - - - - - -Asian - -1011
- - - - - - -Two or More Races - -1011
60 3.3 63.3 66.6 69.9 73.2 76.5Students with Disabilities 30 1112
- - - - - - -Limited English Proficiency - -1011
- - - - - - -Economically Disadvantaged - -1011
11/5/2014
Only Includes full year students (Time In School < Year students are removed)
'-' Indicates too few students to determine (N<30)
Title I Accountability System

13-5630-070
West Essex Middle School
West Essex Regional School District
CDS CODE :
DISTRICT :
SCHOOL :
ESEA Waiver - Annual Progress Targets
The tables represent the annual proficiency targets, established for this School under ESEA Waiver
Schools and Subgroups could meet expectations either by meeting the statewide proficiency rate of 90 percent, or reaching their individually
determined progress targets. The statewide proficiency rate will be increased to 95 percent in 2015.
Performance Targets - Language Arts Literacy
Subgroup# of Valid
Test Scores
Baseline
% Proficient
Yearly
Increment
2012-2013
Target (%P)
2011-2012
Target (%P)
2013-2014
Target (%P)
2014-2015
Target (%P)
2015-2016
Target (%P)
2016-2017
Target (%P)
Baseline
year
92.1 - 90 90 90 90 90Schoolwide 276 901011
92.1 - 90 90 90 90 90White 240 901011
- - - - - - -Black - -1011
- - - - - - -Hispanic - -1011
- - - - - - -American Indian - -1011
- - - - - - -Asian - -1011
- - - - - - -Two or More Races - -1011
64.5 3 70.5 73.5 76.5 79.5 82.5Students with Disabilities 31 67.51011
- - - - - - -Limited English Proficiency - -1011
- - - - - - -Economically Disadvantaged - -1011
Performance Targets - Mathematics
Subgroup# of Valid
Test Scores
Baseline
% Proficient
Yearly
Increment
2012-2013
Target (%P)
2011-2012
Target (%P)
2013-2014
Target (%P)
2014-2015
Target (%P)
2015-2016
Target (%P)
2016-2017
Target (%P)
Baseline
year
88.5 1 90 90 90 90 90Schoolwide 277 89.51011
88.8 1 90 90 90 90 90White 240 89.81011
- - - - - - -Black - -1011
- - - - - - -Hispanic - -1011
- - - - - - -American Indian - -1011
- - - - - - -Asian - -1011
- - - - - - -Two or More Races - -1011
53.1 3.9 60.9 64.8 68.7 72.6 76.5Students with Disabilities 32 571011
- - - - - - -Limited English Proficiency - -1011
- - - - - - -Economically Disadvantaged - -1011
11/5/2014
Only Includes full year students (Time In School < Year students are removed)
'-' Indicates too few students to determine (N<30)
Title I Accountability System
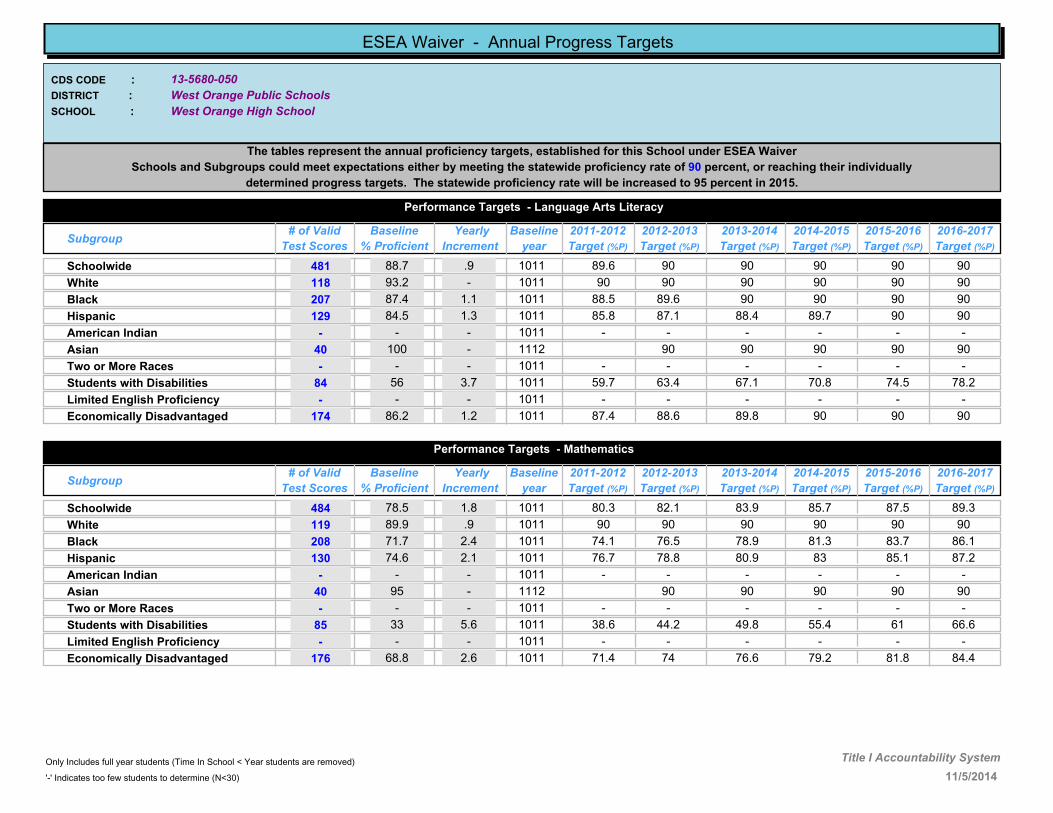
13-5680-050
West Orange High School
West Orange Public Schools
CDS CODE :
DISTRICT :
SCHOOL :
ESEA Waiver - Annual Progress Targets
The tables represent the annual proficiency targets, established for this School under ESEA Waiver
Schools and Subgroups could meet expectations either by meeting the statewide proficiency rate of 90 percent, or reaching their individually
determined progress targets. The statewide proficiency rate will be increased to 95 percent in 2015.
Performance Targets - Language Arts Literacy
Subgroup# of Valid
Test Scores
Baseline
% Proficient
Yearly
Increment
2012-2013
Target (%P)
2011-2012
Target (%P)
2013-2014
Target (%P)
2014-2015
Target (%P)
2015-2016
Target (%P)
2016-2017
Target (%P)
Baseline
year
88.7 .9 90 90 90 90 90Schoolwide 481 89.61011
93.2 - 90 90 90 90 90White 118 901011
87.4 1.1 89.6 90 90 90 90Black 207 88.51011
84.5 1.3 87.1 88.4 89.7 90 90Hispanic 129 85.81011
- - - - - - -American Indian - -1011
100 - 90 90 90 90 90Asian 40 1112
- - - - - - -Two or More Races - -1011
56 3.7 63.4 67.1 70.8 74.5 78.2Students with Disabilities 84 59.71011
- - - - - - -Limited English Proficiency - -1011
86.2 1.2 88.6 89.8 90 90 90Economically Disadvantaged 174 87.41011
Performance Targets - Mathematics
Subgroup# of Valid
Test Scores
Baseline
% Proficient
Yearly
Increment
2012-2013
Target (%P)
2011-2012
Target (%P)
2013-2014
Target (%P)
2014-2015
Target (%P)
2015-2016
Target (%P)
2016-2017
Target (%P)
Baseline
year
78.5 1.8 82.1 83.9 85.7 87.5 89.3Schoolwide 484 80.31011
89.9 .9 90 90 90 90 90White 119 901011
71.7 2.4 76.5 78.9 81.3 83.7 86.1Black 208 74.11011
74.6 2.1 78.8 80.9 83 85.1 87.2Hispanic 130 76.71011
- - - - - - -American Indian - -1011
95 - 90 90 90 90 90Asian 40 1112
- - - - - - -Two or More Races - -1011
33 5.6 44.2 49.8 55.4 61 66.6Students with Disabilities 85 38.61011
- - - - - - -Limited English Proficiency - -1011
68.8 2.6 74 76.6 79.2 81.8 84.4Economically Disadvantaged 176 71.41011
11/5/2014
Only Includes full year students (Time In School < Year students are removed)
'-' Indicates too few students to determine (N<30)
Title I Accountability System
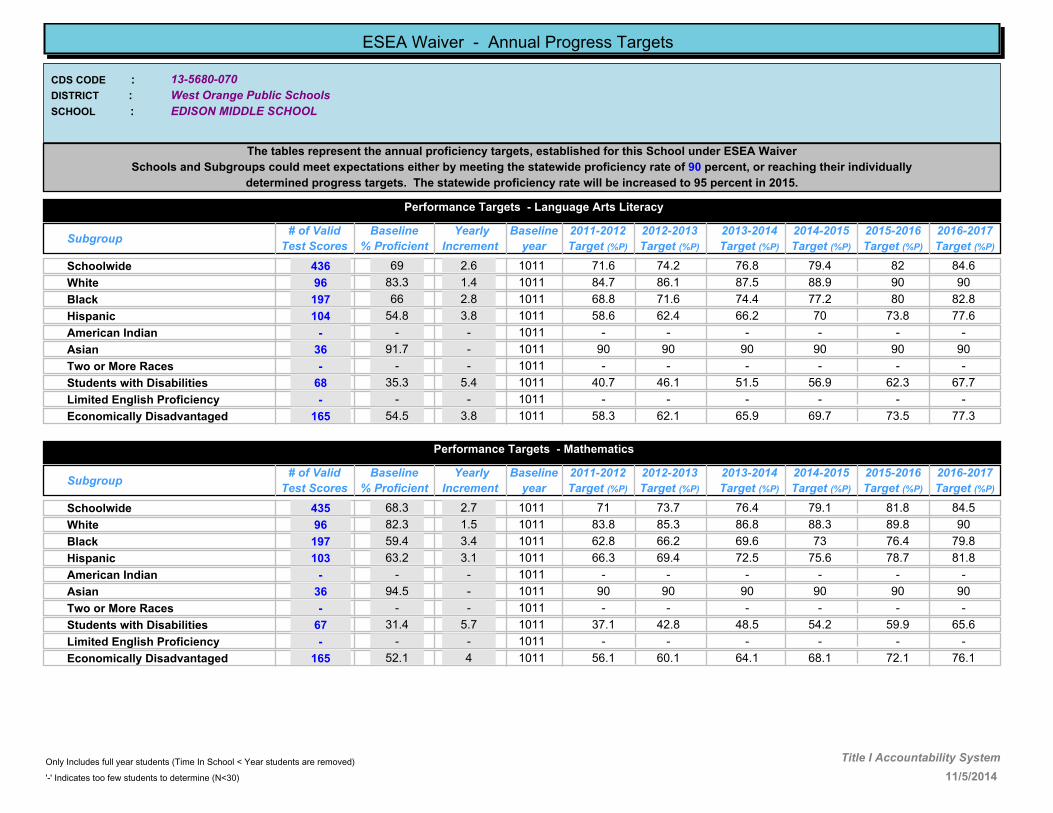
13-5680-070
EDISON MIDDLE SCHOOL
West Orange Public Schools
CDS CODE :
DISTRICT :
SCHOOL :
ESEA Waiver - Annual Progress Targets
The tables represent the annual proficiency targets, established for this School under ESEA Waiver
Schools and Subgroups could meet expectations either by meeting the statewide proficiency rate of 90 percent, or reaching their individually
determined progress targets. The statewide proficiency rate will be increased to 95 percent in 2015.
Performance Targets - Language Arts Literacy
Subgroup# of Valid
Test Scores
Baseline
% Proficient
Yearly
Increment
2012-2013
Target (%P)
2011-2012
Target (%P)
2013-2014
Target (%P)
2014-2015
Target (%P)
2015-2016
Target (%P)
2016-2017
Target (%P)
Baseline
year
69 2.6 74.2 76.8 79.4 82 84.6Schoolwide 436 71.61011
83.3 1.4 86.1 87.5 88.9 90 90White 96 84.71011
66 2.8 71.6 74.4 77.2 80 82.8Black 197 68.81011
54.8 3.8 62.4 66.2 70 73.8 77.6Hispanic 104 58.61011
- - - - - - -American Indian - -1011
91.7 - 90 90 90 90 90Asian 36 901011
- - - - - - -Two or More Races - -1011
35.3 5.4 46.1 51.5 56.9 62.3 67.7Students with Disabilities 68 40.71011
- - - - - - -Limited English Proficiency - -1011
54.5 3.8 62.1 65.9 69.7 73.5 77.3Economically Disadvantaged 165 58.31011
Performance Targets - Mathematics
Subgroup# of Valid
Test Scores
Baseline
% Proficient
Yearly
Increment
2012-2013
Target (%P)
2011-2012
Target (%P)
2013-2014
Target (%P)
2014-2015
Target (%P)
2015-2016
Target (%P)
2016-2017
Target (%P)
Baseline
year
68.3 2.7 73.7 76.4 79.1 81.8 84.5Schoolwide 435 711011
82.3 1.5 85.3 86.8 88.3 89.8 90White 96 83.81011
59.4 3.4 66.2 69.6 73 76.4 79.8Black 197 62.81011
63.2 3.1 69.4 72.5 75.6 78.7 81.8Hispanic 103 66.31011
- - - - - - -American Indian - -1011
94.5 - 90 90 90 90 90Asian 36 901011
- - - - - - -Two or More Races - -1011
31.4 5.7 42.8 48.5 54.2 59.9 65.6Students with Disabilities 67 37.11011
- - - - - - -Limited English Proficiency - -1011
52.1 4 60.1 64.1 68.1 72.1 76.1Economically Disadvantaged 165 56.11011
11/5/2014
Only Includes full year students (Time In School < Year students are removed)
'-' Indicates too few students to determine (N<30)
Title I Accountability System
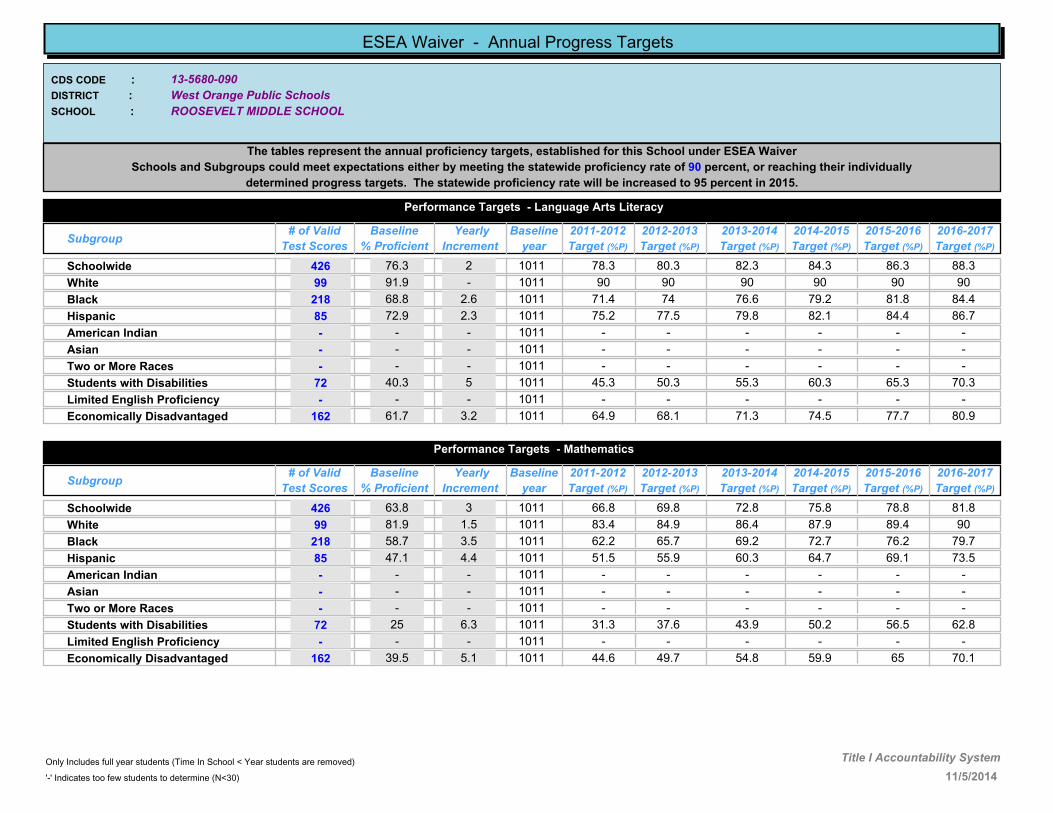
13-5680-090
ROOSEVELT MIDDLE SCHOOL
West Orange Public Schools
CDS CODE :
DISTRICT :
SCHOOL :
ESEA Waiver - Annual Progress Targets
The tables represent the annual proficiency targets, established for this School under ESEA Waiver
Schools and Subgroups could meet expectations either by meeting the statewide proficiency rate of 90 percent, or reaching their individually
determined progress targets. The statewide proficiency rate will be increased to 95 percent in 2015.
Performance Targets - Language Arts Literacy
Subgroup# of Valid
Test Scores
Baseline
% Proficient
Yearly
Increment
2012-2013
Target (%P)
2011-2012
Target (%P)
2013-2014
Target (%P)
2014-2015
Target (%P)
2015-2016
Target (%P)
2016-2017
Target (%P)
Baseline
year
76.3 2 80.3 82.3 84.3 86.3 88.3Schoolwide 426 78.31011
91.9 - 90 90 90 90 90White 99 901011
68.8 2.6 74 76.6 79.2 81.8 84.4Black 218 71.41011
72.9 2.3 77.5 79.8 82.1 84.4 86.7Hispanic 85 75.21011
- - - - - - -American Indian - -1011
- - - - - - -Asian - -1011
- - - - - - -Two or More Races - -1011
40.3 5 50.3 55.3 60.3 65.3 70.3Students with Disabilities 72 45.31011
- - - - - - -Limited English Proficiency - -1011
61.7 3.2 68.1 71.3 74.5 77.7 80.9Economically Disadvantaged 162 64.91011
Performance Targets - Mathematics
Subgroup# of Valid
Test Scores
Baseline
% Proficient
Yearly
Increment
2012-2013
Target (%P)
2011-2012
Target (%P)
2013-2014
Target (%P)
2014-2015
Target (%P)
2015-2016
Target (%P)
2016-2017
Target (%P)
Baseline
year
63.8 3 69.8 72.8 75.8 78.8 81.8Schoolwide 426 66.81011
81.9 1.5 84.9 86.4 87.9 89.4 90White 99 83.41011
58.7 3.5 65.7 69.2 72.7 76.2 79.7Black 218 62.21011
47.1 4.4 55.9 60.3 64.7 69.1 73.5Hispanic 85 51.51011
- - - - - - -American Indian - -1011
- - - - - - -Asian - -1011
- - - - - - -Two or More Races - -1011
25 6.3 37.6 43.9 50.2 56.5 62.8Students with Disabilities 72 31.31011
- - - - - - -Limited English Proficiency - -1011
39.5 5.1 49.7 54.8 59.9 65 70.1Economically Disadvantaged 162 44.61011
11/5/2014
Only Includes full year students (Time In School < Year students are removed)
'-' Indicates too few students to determine (N<30)
Title I Accountability System

13-5680-120
GREGORY ELEMENTARY SCHOOL
West Orange Public Schools
CDS CODE :
DISTRICT :
SCHOOL :
ESEA Waiver - Annual Progress Targets
The tables represent the annual proficiency targets, established for this School under ESEA Waiver
Schools and Subgroups could meet expectations either by meeting the statewide proficiency rate of 90 percent, or reaching their individually
determined progress targets. The statewide proficiency rate will be increased to 95 percent in 2015.
Performance Targets - Language Arts Literacy
Subgroup# of Valid
Test Scores
Baseline
% Proficient
Yearly
Increment
2012-2013
Target (%P)
2011-2012
Target (%P)
2013-2014
Target (%P)
2014-2015
Target (%P)
2015-2016
Target (%P)
2016-2017
Target (%P)
Baseline
year
74.5 2.1 78.7 80.8 82.9 85 87.1Schoolwide 227 76.61011
84.4 1.3 87 88.3 89.6 90 90White 83 85.71011
68 2.7 73.4 76.1 78.8 81.5 84.2Black 97 70.71011
64.6 3 70.6 73.6 76.6 79.6 82.6Hispanic 31 67.61011
- - - - - - -American Indian - -1011
- - - - - - -Asian - -1011
- - - - - - -Two or More Races - -1011
46.2 4.5 55.2 59.7 64.2 68.7 73.2Students with Disabilities 39 50.71011
- - - - - - -Limited English Proficiency - -1011
56.3 3.7 63.7 67.4 71.1 74.8 78.5Economically Disadvantaged 32 601011
Performance Targets - Mathematics
Subgroup# of Valid
Test Scores
Baseline
% Proficient
Yearly
Increment
2012-2013
Target (%P)
2011-2012
Target (%P)
2013-2014
Target (%P)
2014-2015
Target (%P)
2015-2016
Target (%P)
2016-2017
Target (%P)
Baseline
year
92.1 - 90 90 90 90 90Schoolwide 227 901011
94 - 90 90 90 90 90White 83 901011
89.7 .9 90 90 90 90 90Black 97 901011
93.6 - 90 90 90 90 90Hispanic 31 901011
- - - - - - -American Indian - -1011
- - - - - - -Asian - -1011
- - - - - - -Two or More Races - -1011
76.9 1.9 80.7 82.6 84.5 86.4 88.3Students with Disabilities 39 78.81011
- - - - - - -Limited English Proficiency - -1011
81.3 1.6 84.5 86.1 87.7 89.3 90Economically Disadvantaged 32 82.91011
11/5/2014
Only Includes full year students (Time In School < Year students are removed)
'-' Indicates too few students to determine (N<30)
Title I Accountability System

13-5680-130
HAZEL AVENUE ELEMENTARY SCHOOL
West Orange Public Schools
CDS CODE :
DISTRICT :
SCHOOL :
ESEA Waiver - Annual Progress Targets
The tables represent the annual proficiency targets, established for this School under ESEA Waiver
Schools and Subgroups could meet expectations either by meeting the statewide proficiency rate of 90 percent, or reaching their individually
determined progress targets. The statewide proficiency rate will be increased to 95 percent in 2015.
Performance Targets - Language Arts Literacy
Subgroup# of Valid
Test Scores
Baseline
% Proficient
Yearly
Increment
2012-2013
Target (%P)
2011-2012
Target (%P)
2013-2014
Target (%P)
2014-2015
Target (%P)
2015-2016
Target (%P)
2016-2017
Target (%P)
Baseline
year
52.2 4 60.2 64.2 68.2 72.2 76.2Schoolwide 163 56.21011
- - - - - - -White - -1011
46.8 4.4 55.6 60 64.4 68.8 73.2Black 77 51.21011
47.5 4.4 56.3 60.7 65.1 69.5 73.9Hispanic 61 51.91011
- - - - - - -American Indian - -1011
- - - - - - -Asian - -1011
- - - - - - -Two or More Races - -1011
23.3 6.4 29.7 36.1 42.5 48.9Students with Disabilities 30 1213
- - - - - - -Limited English Proficiency - -1011
38.7 5.1 48.9 54 59.1 64.2 69.3Economically Disadvantaged 93 43.81011
Performance Targets - Mathematics
Subgroup# of Valid
Test Scores
Baseline
% Proficient
Yearly
Increment
2012-2013
Target (%P)
2011-2012
Target (%P)
2013-2014
Target (%P)
2014-2015
Target (%P)
2015-2016
Target (%P)
2016-2017
Target (%P)
Baseline
year
74 2.2 78.4 80.6 82.8 85 87.2Schoolwide 162 76.21011
- - - - - - -White - -1011
70.2 2.5 75.2 77.7 80.2 82.7 85.2Black 77 72.71011
71.7 2.4 76.5 78.9 81.3 83.7 86.1Hispanic 60 74.11011
- - - - - - -American Indian - -1011
- - - - - - -Asian - -1011
- - - - - - -Two or More Races - -1011
60 3.3 63.3 66.6 69.9 73.2Students with Disabilities 30 1213
- - - - - - -Limited English Proficiency - -1011
63.1 3.1 69.3 72.4 75.5 78.6 81.7Economically Disadvantaged 92 66.21011
11/5/2014
Only Includes full year students (Time In School < Year students are removed)
'-' Indicates too few students to determine (N<30)
Title I Accountability System

13-5680-135
LIBERTY MIDDLE SCHOOL
West Orange Public Schools
CDS CODE :
DISTRICT :
SCHOOL :
ESEA Waiver - Annual Progress Targets
The tables represent the annual proficiency targets, established for this School under ESEA Waiver
Schools and Subgroups could meet expectations either by meeting the statewide proficiency rate of 90 percent, or reaching their individually
determined progress targets. The statewide proficiency rate will be increased to 95 percent in 2015.
Performance Targets - Language Arts Literacy
Subgroup# of Valid
Test Scores
Baseline
% Proficient
Yearly
Increment
2012-2013
Target (%P)
2011-2012
Target (%P)
2013-2014
Target (%P)
2014-2015
Target (%P)
2015-2016
Target (%P)
2016-2017
Target (%P)
Baseline
year
73.7 2.2 78.1 80.3 82.5 84.7 86.9Schoolwide 525 75.91011
84.2 1.3 86.8 88.1 89.4 90 90White 108 85.51011
69 2.6 74.2 76.8 79.4 82 84.6Black 232 71.61011
67.2 2.7 72.6 75.3 78 80.7 83.4Hispanic 128 69.91011
- - - - - - -American Indian - -1011
93.5 - 90 90 90 90 90Asian 46 901011
- - - - - - -Two or More Races - -1011
40 5 50 55 60 65 70Students with Disabilities 110 451011
- - - - - - -Limited English Proficiency - -1011
66.4 2.8 72 74.8 77.6 80.4 83.2Economically Disadvantaged 208 69.21011
Performance Targets - Mathematics
Subgroup# of Valid
Test Scores
Baseline
% Proficient
Yearly
Increment
2012-2013
Target (%P)
2011-2012
Target (%P)
2013-2014
Target (%P)
2014-2015
Target (%P)
2015-2016
Target (%P)
2016-2017
Target (%P)
Baseline
year
59.6 3.4 66.4 69.8 73.2 76.6 80Schoolwide 525 631011
75 2.1 79.2 81.3 83.4 85.5 87.6White 108 77.11011
53.9 3.9 61.7 65.6 69.5 73.4 77.3Black 232 57.81011
48.4 4.3 57 61.3 65.6 69.9 74.2Hispanic 128 52.71011
- - - - - - -American Indian - -1011
84.8 1.3 87.4 88.7 90 90 90Asian 46 86.11011
- - - - - - -Two or More Races - -1011
22.8 6.5 35.8 42.3 48.8 55.3 61.8Students with Disabilities 110 29.31011
- - - - - - -Limited English Proficiency - -1011
48.1 4.3 56.7 61 65.3 69.6 73.9Economically Disadvantaged 208 52.41011
11/5/2014
Only Includes full year students (Time In School < Year students are removed)
'-' Indicates too few students to determine (N<30)
Title I Accountability System
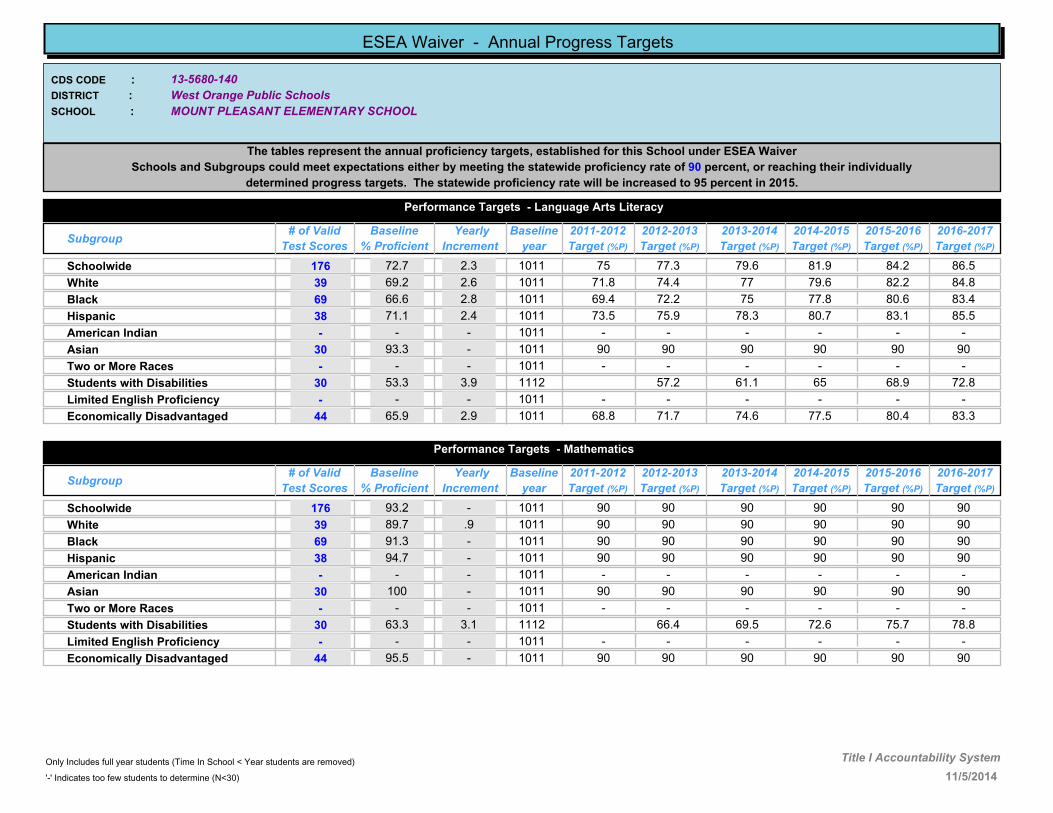
13-5680-140
MOUNT PLEASANT ELEMENTARY SCHOOL
West Orange Public Schools
CDS CODE :
DISTRICT :
SCHOOL :
ESEA Waiver - Annual Progress Targets
The tables represent the annual proficiency targets, established for this School under ESEA Waiver
Schools and Subgroups could meet expectations either by meeting the statewide proficiency rate of 90 percent, or reaching their individually
determined progress targets. The statewide proficiency rate will be increased to 95 percent in 2015.
Performance Targets - Language Arts Literacy
Subgroup# of Valid
Test Scores
Baseline
% Proficient
Yearly
Increment
2012-2013
Target (%P)
2011-2012
Target (%P)
2013-2014
Target (%P)
2014-2015
Target (%P)
2015-2016
Target (%P)
2016-2017
Target (%P)
Baseline
year
72.7 2.3 77.3 79.6 81.9 84.2 86.5Schoolwide 176 751011
69.2 2.6 74.4 77 79.6 82.2 84.8White 39 71.81011
66.6 2.8 72.2 75 77.8 80.6 83.4Black 69 69.41011
71.1 2.4 75.9 78.3 80.7 83.1 85.5Hispanic 38 73.51011
- - - - - - -American Indian - -1011
93.3 - 90 90 90 90 90Asian 30 901011
- - - - - - -Two or More Races - -1011
53.3 3.9 57.2 61.1 65 68.9 72.8Students with Disabilities 30 1112
- - - - - - -Limited English Proficiency - -1011
65.9 2.9 71.7 74.6 77.5 80.4 83.3Economically Disadvantaged 44 68.81011
Performance Targets - Mathematics
Subgroup# of Valid
Test Scores
Baseline
% Proficient
Yearly
Increment
2012-2013
Target (%P)
2011-2012
Target (%P)
2013-2014
Target (%P)
2014-2015
Target (%P)
2015-2016
Target (%P)
2016-2017
Target (%P)
Baseline
year
93.2 - 90 90 90 90 90Schoolwide 176 901011
89.7 .9 90 90 90 90 90White 39 901011
91.3 - 90 90 90 90 90Black 69 901011
94.7 - 90 90 90 90 90Hispanic 38 901011
- - - - - - -American Indian - -1011
100 - 90 90 90 90 90Asian 30 901011
- - - - - - -Two or More Races - -1011
63.3 3.1 66.4 69.5 72.6 75.7 78.8Students with Disabilities 30 1112
- - - - - - -Limited English Proficiency - -1011
95.5 - 90 90 90 90 90Economically Disadvantaged 44 901011
11/5/2014
Only Includes full year students (Time In School < Year students are removed)
'-' Indicates too few students to determine (N<30)
Title I Accountability System
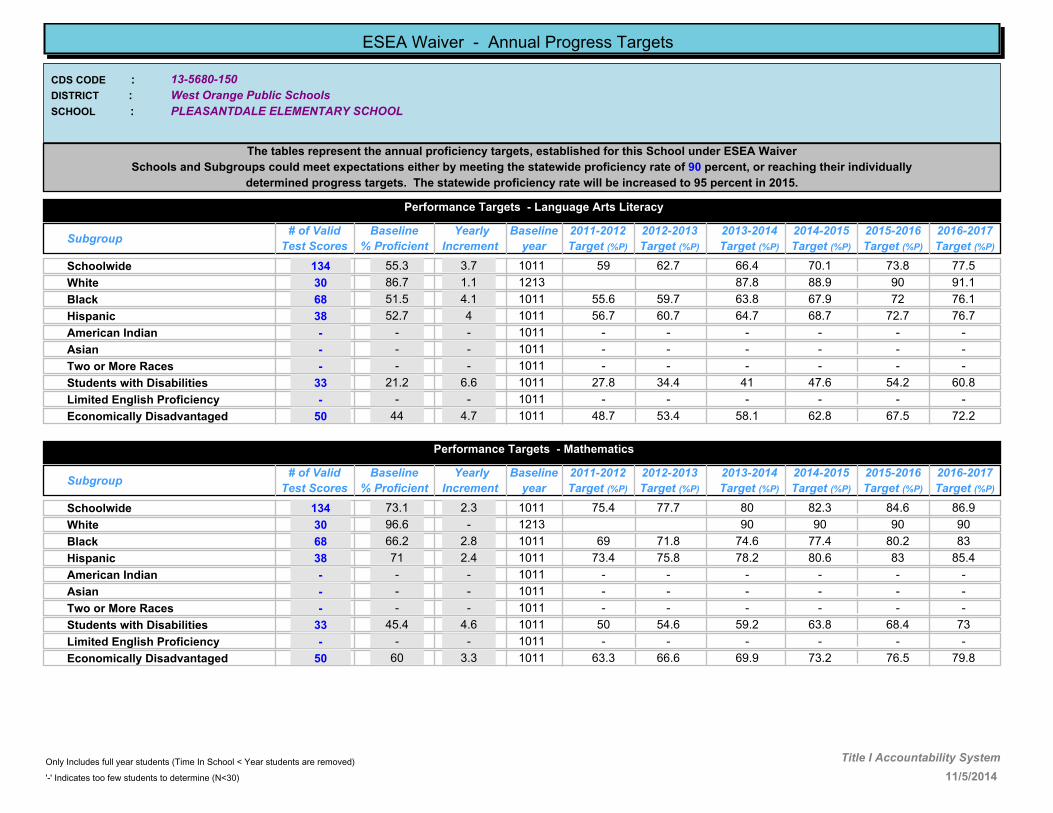
13-5680-150
PLEASANTDALE ELEMENTARY SCHOOL
West Orange Public Schools
CDS CODE :
DISTRICT :
SCHOOL :
ESEA Waiver - Annual Progress Targets
The tables represent the annual proficiency targets, established for this School under ESEA Waiver
Schools and Subgroups could meet expectations either by meeting the statewide proficiency rate of 90 percent, or reaching their individually
determined progress targets. The statewide proficiency rate will be increased to 95 percent in 2015.
Performance Targets - Language Arts Literacy
Subgroup# of Valid
Test Scores
Baseline
% Proficient
Yearly
Increment
2012-2013
Target (%P)
2011-2012
Target (%P)
2013-2014
Target (%P)
2014-2015
Target (%P)
2015-2016
Target (%P)
2016-2017
Target (%P)
Baseline
year
55.3 3.7 62.7 66.4 70.1 73.8 77.5Schoolwide 134 591011
86.7 1.1 87.8 88.9 90 91.1White 30 1213
51.5 4.1 59.7 63.8 67.9 72 76.1Black 68 55.61011
52.7 4 60.7 64.7 68.7 72.7 76.7Hispanic 38 56.71011
- - - - - - -American Indian - -1011
- - - - - - -Asian - -1011
- - - - - - -Two or More Races - -1011
21.2 6.6 34.4 41 47.6 54.2 60.8Students with Disabilities 33 27.81011
- - - - - - -Limited English Proficiency - -1011
44 4.7 53.4 58.1 62.8 67.5 72.2Economically Disadvantaged 50 48.71011
Performance Targets - Mathematics
Subgroup# of Valid
Test Scores
Baseline
% Proficient
Yearly
Increment
2012-2013
Target (%P)
2011-2012
Target (%P)
2013-2014
Target (%P)
2014-2015
Target (%P)
2015-2016
Target (%P)
2016-2017
Target (%P)
Baseline
year
73.1 2.3 77.7 80 82.3 84.6 86.9Schoolwide 134 75.41011
96.6 - 90 90 90 90White 30 1213
66.2 2.8 71.8 74.6 77.4 80.2 83Black 68 691011
71 2.4 75.8 78.2 80.6 83 85.4Hispanic 38 73.41011
- - - - - - -American Indian - -1011
- - - - - - -Asian - -1011
- - - - - - -Two or More Races - -1011
45.4 4.6 54.6 59.2 63.8 68.4 73Students with Disabilities 33 501011
- - - - - - -Limited English Proficiency - -1011
60 3.3 66.6 69.9 73.2 76.5 79.8Economically Disadvantaged 50 63.31011
11/5/2014
Only Includes full year students (Time In School < Year students are removed)
'-' Indicates too few students to determine (N<30)
Title I Accountability System

13-5680-160
REDWOOD ELEMENTARY SCHOOL
West Orange Public Schools
CDS CODE :
DISTRICT :
SCHOOL :
ESEA Waiver - Annual Progress Targets
The tables represent the annual proficiency targets, established for this School under ESEA Waiver
Schools and Subgroups could meet expectations either by meeting the statewide proficiency rate of 90 percent, or reaching their individually
determined progress targets. The statewide proficiency rate will be increased to 95 percent in 2015.
Performance Targets - Language Arts Literacy
Subgroup# of Valid
Test Scores
Baseline
% Proficient
Yearly
Increment
2012-2013
Target (%P)
2011-2012
Target (%P)
2013-2014
Target (%P)
2014-2015
Target (%P)
2015-2016
Target (%P)
2016-2017
Target (%P)
Baseline
year
74.1 2.2 78.5 80.7 82.9 85.1 87.3Schoolwide 224 76.31011
74.7 2.1 78.9 81 83.1 85.2 87.3White 75 76.81011
73.6 2.2 78 80.2 82.4 84.6 86.8Black 87 75.81011
56.8 3.6 64 67.6 71.2 74.8 78.4Hispanic 37 60.41011
- - - - - - -American Indian - -1011
- - - - - - -Asian - -1011
- - - - - - -Two or More Races - -1011
42 4.8 51.6 56.4 61.2 66 70.8Students with Disabilities 50 46.81011
- - - - - - -Limited English Proficiency - -1011
48.9 4.3 57.5 61.8 66.1 70.4 74.7Economically Disadvantaged 45 53.21011
Performance Targets - Mathematics
Subgroup# of Valid
Test Scores
Baseline
% Proficient
Yearly
Increment
2012-2013
Target (%P)
2011-2012
Target (%P)
2013-2014
Target (%P)
2014-2015
Target (%P)
2015-2016
Target (%P)
2016-2017
Target (%P)
Baseline
year
89.7 .9 90 90 90 90 90Schoolwide 224 901011
89.3 .9 90 90 90 90 90White 75 901011
83.9 1.4 86.7 88.1 89.5 90 90Black 87 85.31011
97.3 - 90 90 90 90 90Hispanic 37 901011
- - - - - - -American Indian - -1011
- - - - - - -Asian - -1011
- - - - - - -Two or More Races - -1011
64 3 70 73 76 79 82Students with Disabilities 50 671011
- - - - - - -Limited English Proficiency - -1011
77.8 1.9 81.6 83.5 85.4 87.3 89.2Economically Disadvantaged 45 79.71011
11/5/2014
Only Includes full year students (Time In School < Year students are removed)
'-' Indicates too few students to determine (N<30)
Title I Accountability System
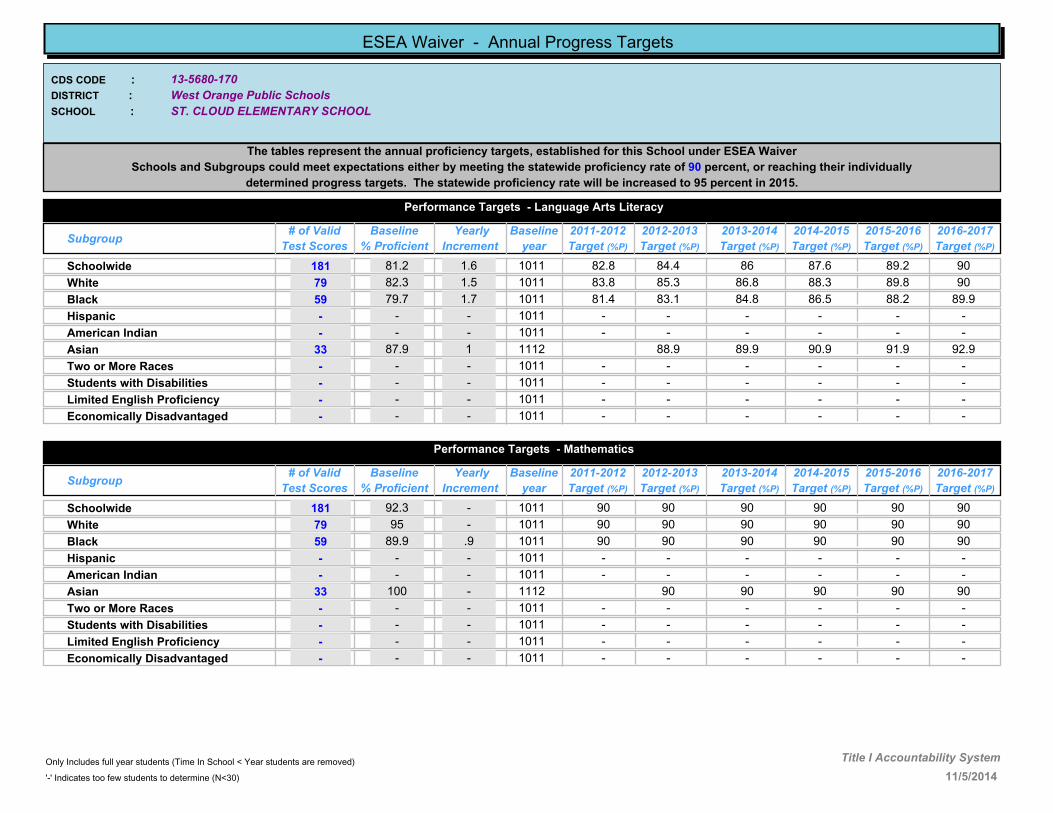
13-5680-170
ST. CLOUD ELEMENTARY SCHOOL
West Orange Public Schools
CDS CODE :
DISTRICT :
SCHOOL :
ESEA Waiver - Annual Progress Targets
The tables represent the annual proficiency targets, established for this School under ESEA Waiver
Schools and Subgroups could meet expectations either by meeting the statewide proficiency rate of 90 percent, or reaching their individually
determined progress targets. The statewide proficiency rate will be increased to 95 percent in 2015.
Performance Targets - Language Arts Literacy
Subgroup# of Valid
Test Scores
Baseline
% Proficient
Yearly
Increment
2012-2013
Target (%P)
2011-2012
Target (%P)
2013-2014
Target (%P)
2014-2015
Target (%P)
2015-2016
Target (%P)
2016-2017
Target (%P)
Baseline
year
81.2 1.6 84.4 86 87.6 89.2 90Schoolwide 181 82.81011
82.3 1.5 85.3 86.8 88.3 89.8 90White 79 83.81011
79.7 1.7 83.1 84.8 86.5 88.2 89.9Black 59 81.41011
- - - - - - -Hispanic - -1011
- - - - - - -American Indian - -1011
87.9 1 88.9 89.9 90.9 91.9 92.9Asian 33 1112
- - - - - - -Two or More Races - -1011
- - - - - - -Students with Disabilities - -1011
- - - - - - -Limited English Proficiency - -1011
- - - - - - -Economically Disadvantaged - -1011
Performance Targets - Mathematics
Subgroup# of Valid
Test Scores
Baseline
% Proficient
Yearly
Increment
2012-2013
Target (%P)
2011-2012
Target (%P)
2013-2014
Target (%P)
2014-2015
Target (%P)
2015-2016
Target (%P)
2016-2017
Target (%P)
Baseline
year
92.3 - 90 90 90 90 90Schoolwide 181 901011
95 - 90 90 90 90 90White 79 901011
89.9 .9 90 90 90 90 90Black 59 901011
- - - - - - -Hispanic - -1011
- - - - - - -American Indian - -1011
100 - 90 90 90 90 90Asian 33 1112
- - - - - - -Two or More Races - -1011
- - - - - - -Students with Disabilities - -1011
- - - - - - -Limited English Proficiency - -1011
- - - - - - -Economically Disadvantaged - -1011
11/5/2014
Only Includes full year students (Time In School < Year students are removed)
'-' Indicates too few students to determine (N<30)
Title I Accountability System

13-5680-180
WASHINGTON ELEMENTARY SCHOOL
West Orange Public Schools
CDS CODE :
DISTRICT :
SCHOOL :
ESEA Waiver - Annual Progress Targets
The tables represent the annual proficiency targets, established for this School under ESEA Waiver
Schools and Subgroups could meet expectations either by meeting the statewide proficiency rate of 90 percent, or reaching their individually
determined progress targets. The statewide proficiency rate will be increased to 95 percent in 2015.
Performance Targets - Language Arts Literacy
Subgroup# of Valid
Test Scores
Baseline
% Proficient
Yearly
Increment
2012-2013
Target (%P)
2011-2012
Target (%P)
2013-2014
Target (%P)
2014-2015
Target (%P)
2015-2016
Target (%P)
2016-2017
Target (%P)
Baseline
year
57.3 3.6 64.5 68.1 71.7 75.3 78.9Schoolwide 190 60.91011
- - - - - - -White - -1011
50.6 4.1 58.8 62.9 67 71.1 75.2Black 81 54.71011
60.9 3.3 67.5 70.8 74.1 77.4 80.7Hispanic 97 64.21011
- - - - - - -American Indian - -1011
- - - - - - -Asian - -1011
- - - - - - -Two or More Races - -1011
17.5 6.9 31.3 38.2 45.1 52 58.9Students with Disabilities 40 24.41011
- - - - - - -Limited English Proficiency - -1011
52.3 4 60.3 64.3 68.3 72.3 76.3Economically Disadvantaged 147 56.31011
Performance Targets - Mathematics
Subgroup# of Valid
Test Scores
Baseline
% Proficient
Yearly
Increment
2012-2013
Target (%P)
2011-2012
Target (%P)
2013-2014
Target (%P)
2014-2015
Target (%P)
2015-2016
Target (%P)
2016-2017
Target (%P)
Baseline
year
73.7 2.2 78.1 80.3 82.5 84.7 86.9Schoolwide 190 75.91011
- - - - - - -White - -1011
66.7 2.8 72.3 75.1 77.9 80.7 83.5Black 81 69.51011
78.4 1.8 82 83.8 85.6 87.4 89.2Hispanic 97 80.21011
- - - - - - -American Indian - -1011
- - - - - - -Asian - -1011
- - - - - - -Two or More Races - -1011
40 5 50 55 60 65 70Students with Disabilities 40 451011
- - - - - - -Limited English Proficiency - -1011
70 2.5 75 77.5 80 82.5 85Economically Disadvantaged 147 72.51011
11/5/2014
Only Includes full year students (Time In School < Year students are removed)
'-' Indicates too few students to determine (N<30)
Title I Accountability System