
Escaping Flatland: Towards Better Documentation for ... · Escaping Flatland: Towards Better...
62
Escaping Flatland: Towards Better Documentation for Information Architects
Transcript of Escaping Flatland: Towards Better Documentation for ... · Escaping Flatland: Towards Better...

Escaping Flatland:Towards Better Documentation for Information Architects

Illustrate the depth of knowledge that we have acquired and the amount of effort expunged throughout the whole project.
Key questions
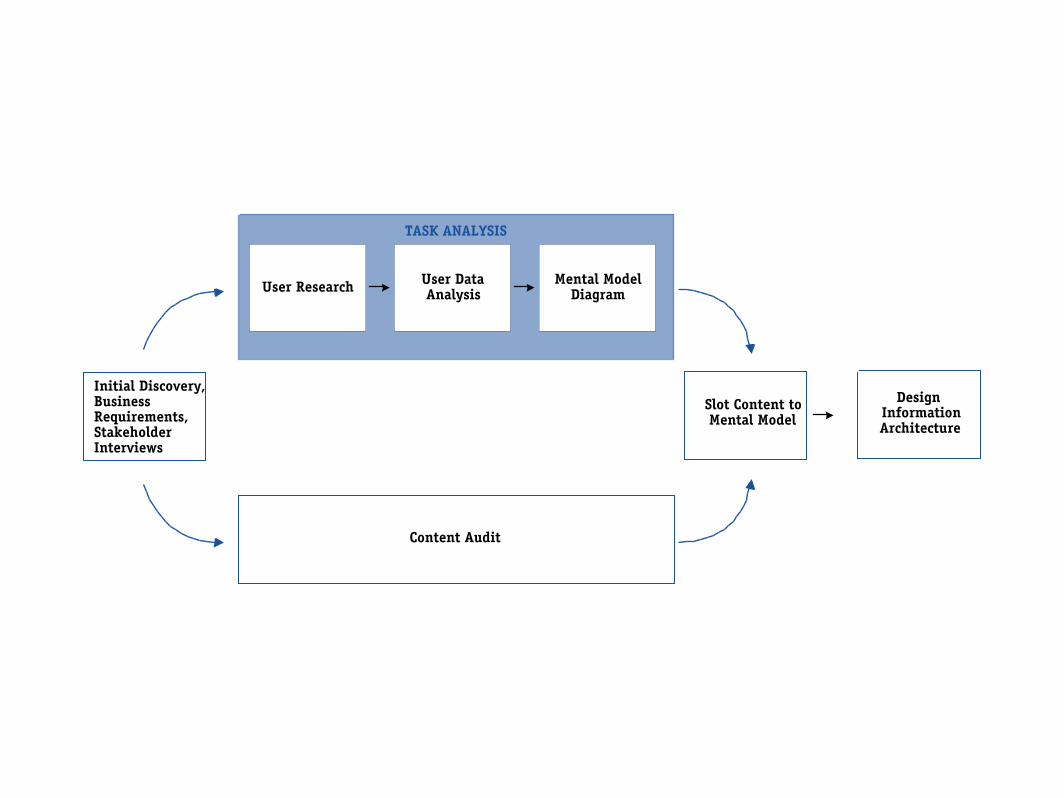
Initial Discovery,BusinessRequirements,StakeholderInterviews
TASK ANALYSIS
User Research User DataAnalysis
Mental ModelDiagram
Slot Content toMental Model
Content Audit
DesignInformationArchitecture

Content type
AuthorAudience
Date Made
Task Location
Varietal
Price
WineryWeight
content attributes subject attributes
Data from wine.com
Region
Subject

How to provide rich data - an overview - in a small space for the intended audience - the non-working group.


Improve effectiveness of current documentation practice
Set of diagramming/visualization guidelines
Enhanced understanding of different diagramming types --proper usage, strengths, weaknesses, and techniques
Development of application libraries to allow rapid development of diagrams
Outcomes
Definitions
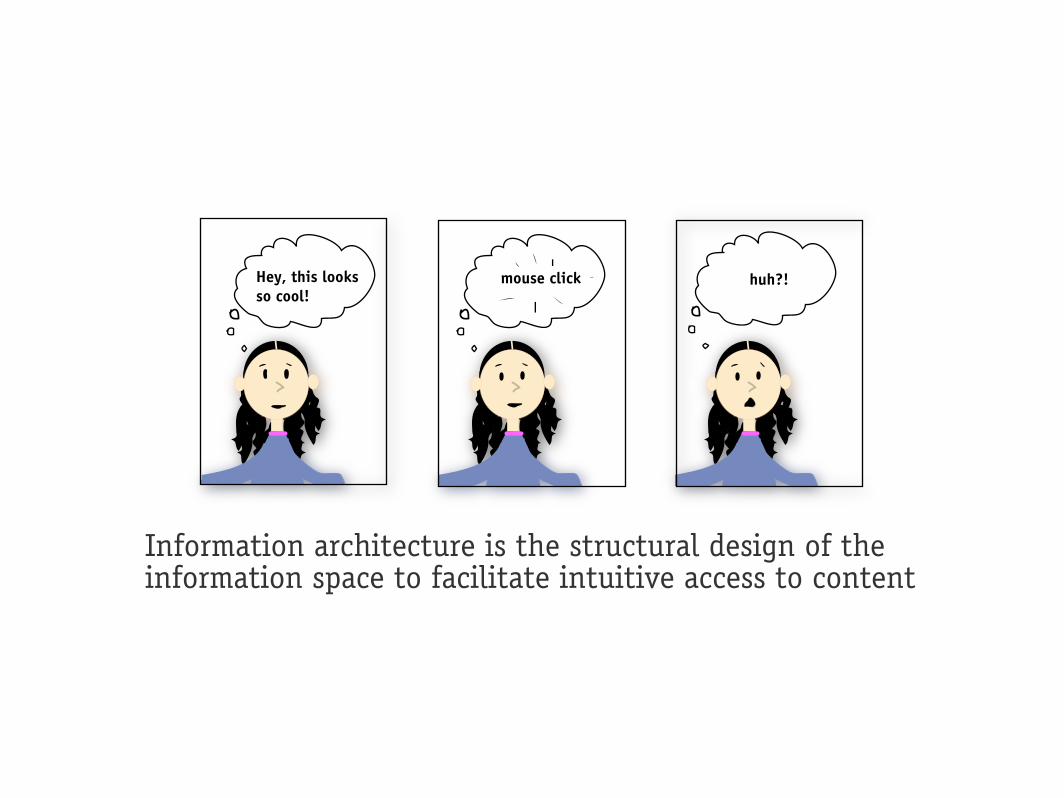
Information architecture is the structural design of the information space to facilitate intuitive access to content
Hey, this looks so cool!
mouse click huh?!
Information architecture (IA) is primarily about cognition - how people process information and construe relationships between different pieces of information.
I.A. belongs to the realm of the abstract, concerning itself more with the structures in the mind than the structures on the page or screen.
Purpose of Documentation

"...the process of documenting a system's functionality or information structure is creative. It is creative in that we are at once designing the system and designing the documentation to represent that system. "
"Through the documentation, we come to a better understanding of our own conception of the system. As we develop a clearer vision of the system through the documentation, we find ways to improve the system."
Because of the rather abstract nature of this work, information architecture is defined by it's deliverables. The documentation is key to understanding, educating, and selling the work.
Our deliverables, therefore, become high profile.

In the “real world” of business, abstract means:
Not usefulNot implement-ableNot understandableNot sellable!

What comprises deliverable's?
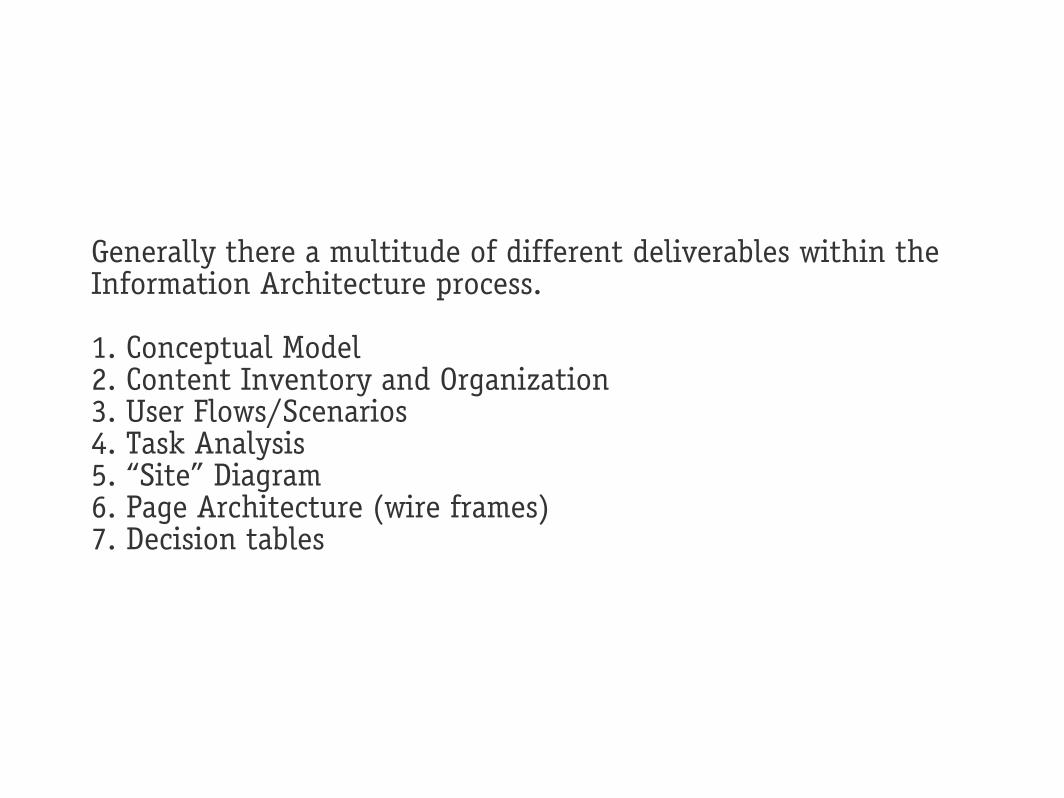
Generally there a multitude of different deliverables within the Information Architecture process.
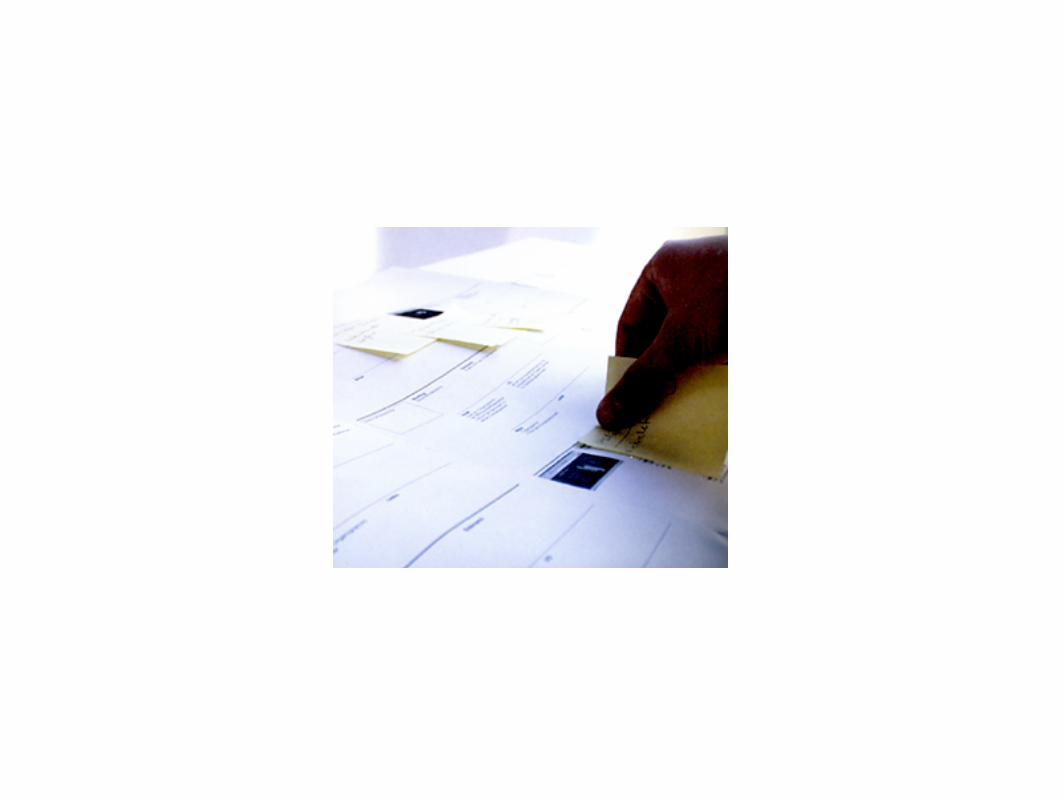
1. Conceptual Model 2. Content Inventory and Organization 3. User Flows/Scenarios 4. Task Analysis 5. “Site” Diagram6. Page Architecture (wire frames)7. Decision tables

All of these types of deliverables are extremely important to the working team but will be seldom read and understood by others who are important to the total decision making process. For them these deliverables can not be viewed in their "raw" state.
We need to incorporate as much of this data as needed and as possible in a visualisation that the target can understand and utilise.
Lessons from Edward Tuftee
“Make all visual distinctions as subtle as possible, but still clear and effective” (Explanations 73). The intent of this strategy is to discourage authors from creating a greater visual distinction than the data implies. “Confusion and clutter are failures of design, not attributes of information” (Envisioning 53). In a way, this sentence—which begins the chapter in Envisioning Information on Layering and Separation—captures the essence of Tufte's work.
Conventions

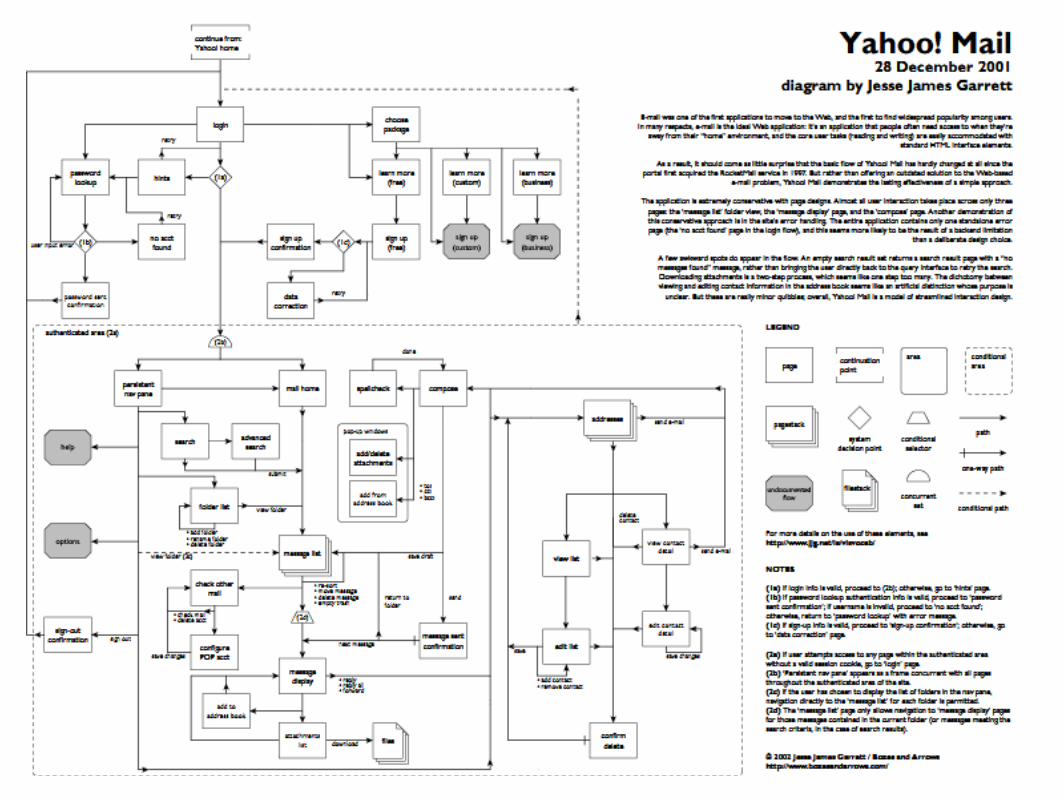
Visual conventions play a critical role in our ability to perceive the meaning of a diagram. If a web site is actually an invisible, multi-dimensional abstraction, we may understand it as a set of cards or boxes connected by lines, color, or symbols in part because we know, from our previous experience, what cards, boxes, and lines can represent.

Here are a few of the decisions to be made when diagramming the mentioned information:
The kind of information to be represented must be defined. There are many possible dimensions to illustrate: click depth, page type, logical grouping, major navigation path, link relationships within the site or out to other sites, access rights, media types, user tasks, flows and scenerios, etc.

The information must be organized into a visual pattern. Choices of what to use to represent link relationships must be made.

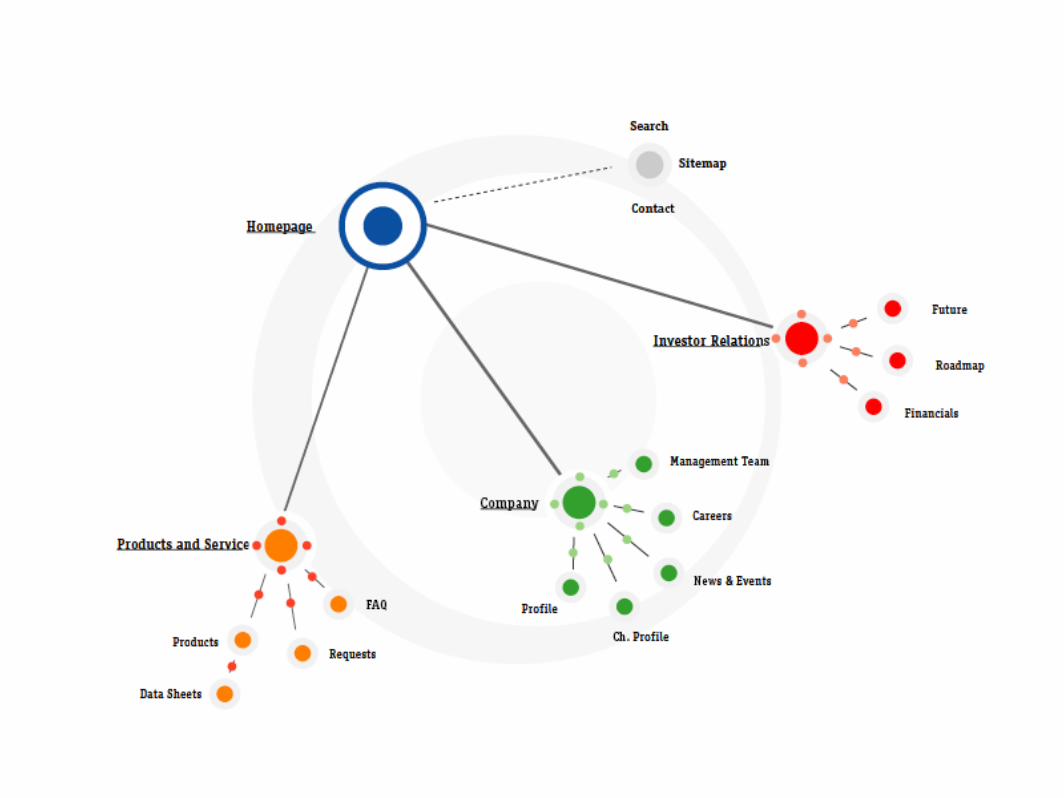
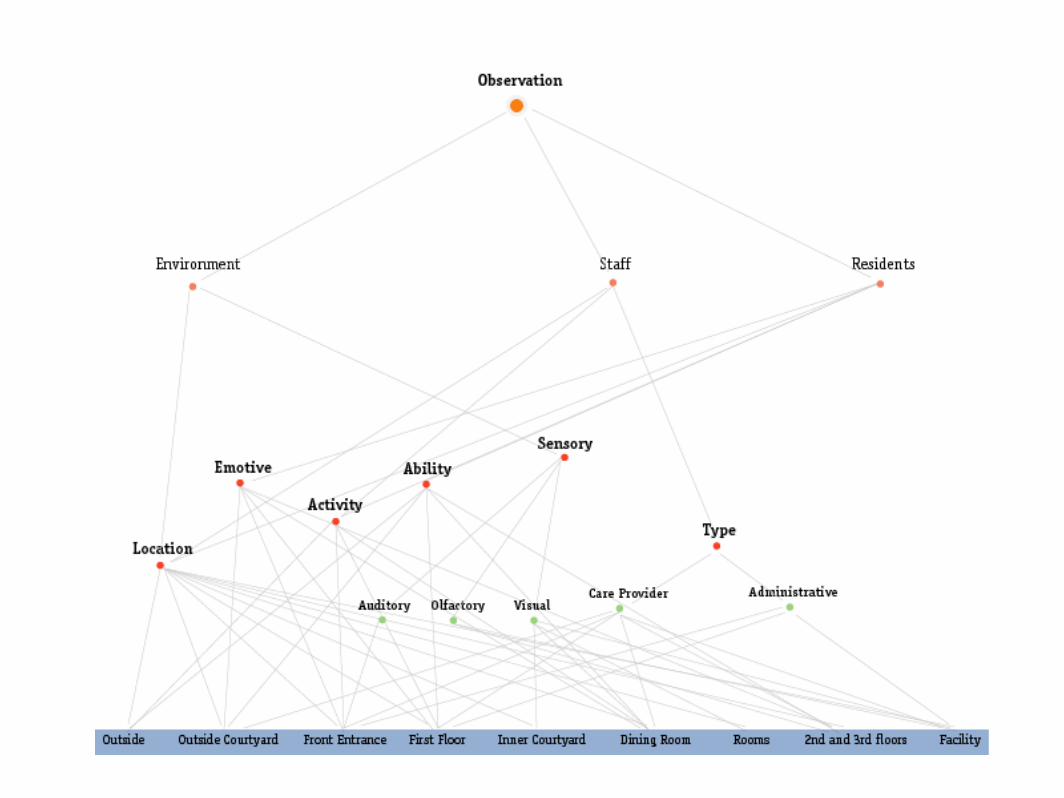
Current Practice

2d diagram

Node link diagram
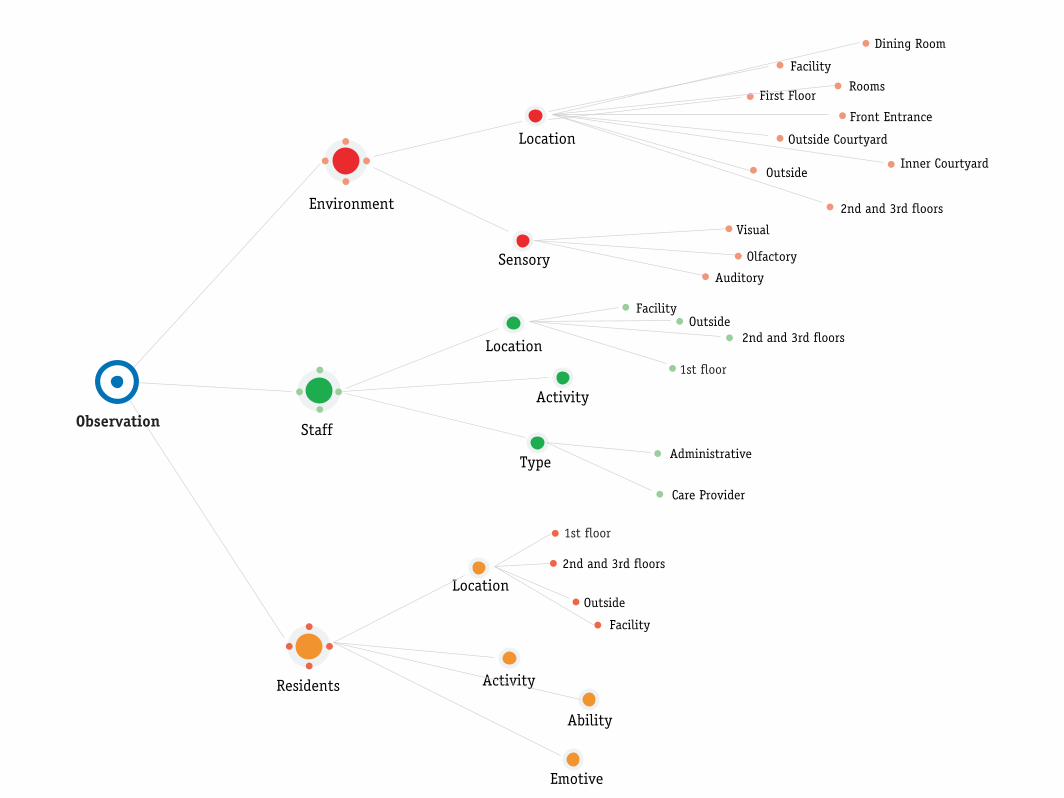
Outside Courtyard
FacilityRooms
2nd and 3rd floors
Dining Room
Inner CourtyardOutside
Front Entrance
First Floor
Location
Environment
Sensory
Visual
Olfactory
Auditory
Staff
Location
FacilityOutside
1st floor
2nd and 3rd floors
Activity
Type Administrative
Care Provider
Residents
Location
1st floor
2nd and 3rd floors
Outside
Facility
Ability
Emotive
Activity
Observation
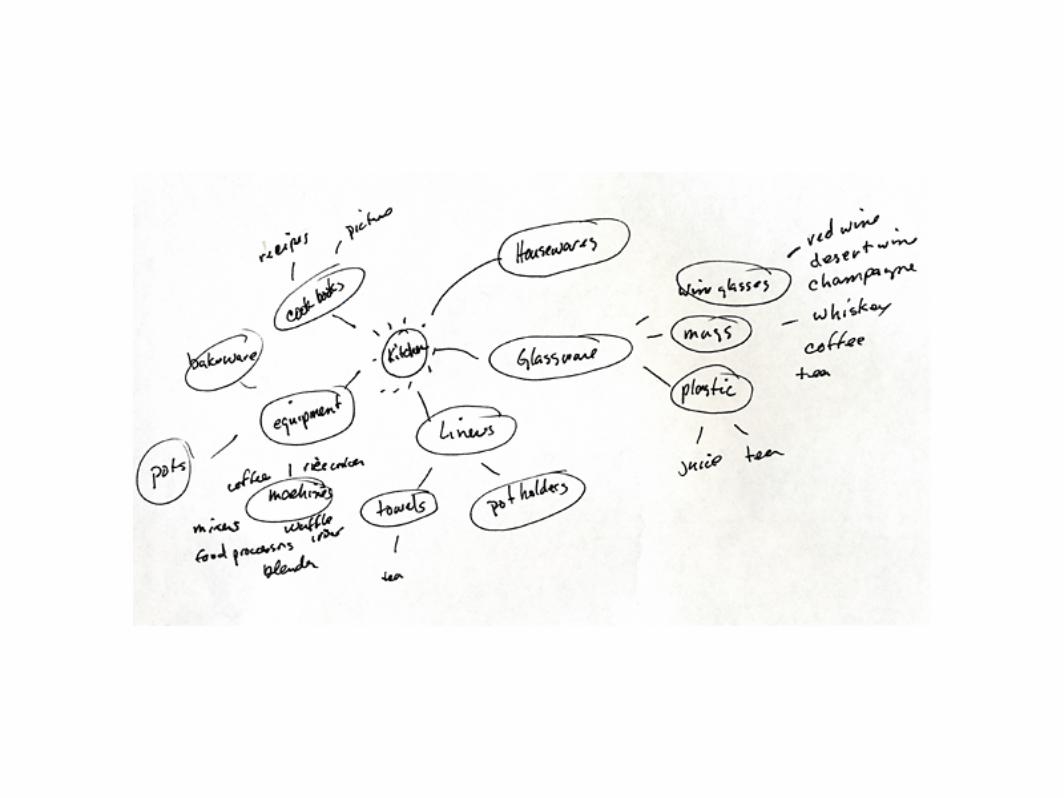
Mind map / Topic maps
The most common problems with these approaches are utilization of space and the representation of links that do not adhere to the tree topology.
The space problem is simple to explain. A flat representation of the tree becomes wide (or long) very quickly. This makes the overview difficult to grasp in a single view. The application of magnification on sections of the tree in combination with a reduced view of the entire structure can and has been used.

While these techniques are useful, the loss of visual context and the absence of appropriate detail do not satisfy the need for a single comprehensible view. In my experience, the target needs a single overview of the entire structure to grasp the shape of the product.
Dimensional paper
Dimensional Deliverables: Exploring the Realm Between Paper and Screen
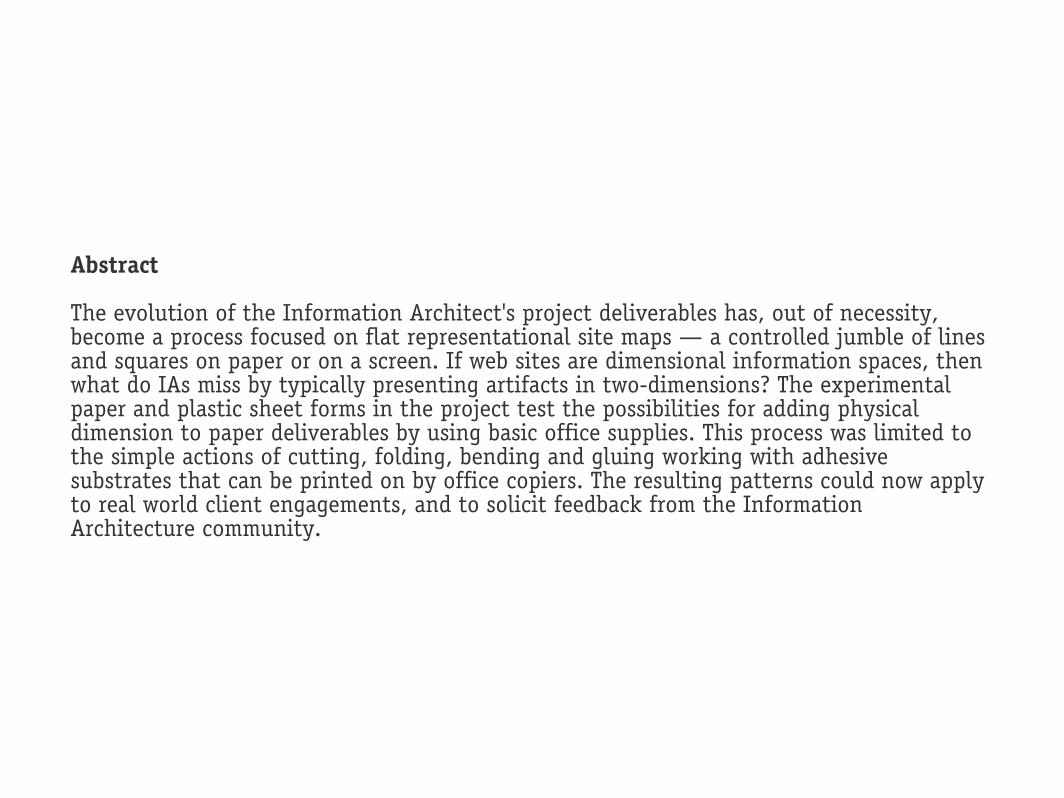
Abstract The evolution of the Information Architect's project deliverables has, out of necessity, become a process focused on flat representational site maps — a controlled jumble of lines and squares on paper or on a screen. If web sites are dimensional information spaces, then what do IAs miss by typically presenting artifacts in two-dimensions? The experimental paper and plastic sheet forms in the project test the possibilities for adding physical dimension to paper deliverables by using basic office supplies. This process was limited to the simple actions of cutting, folding, bending and gluing working with adhesive substrates that can be printed on by office copiers. The resulting patterns could now apply to real world client engagements, and to solicit feedback from the Information Architecture community.
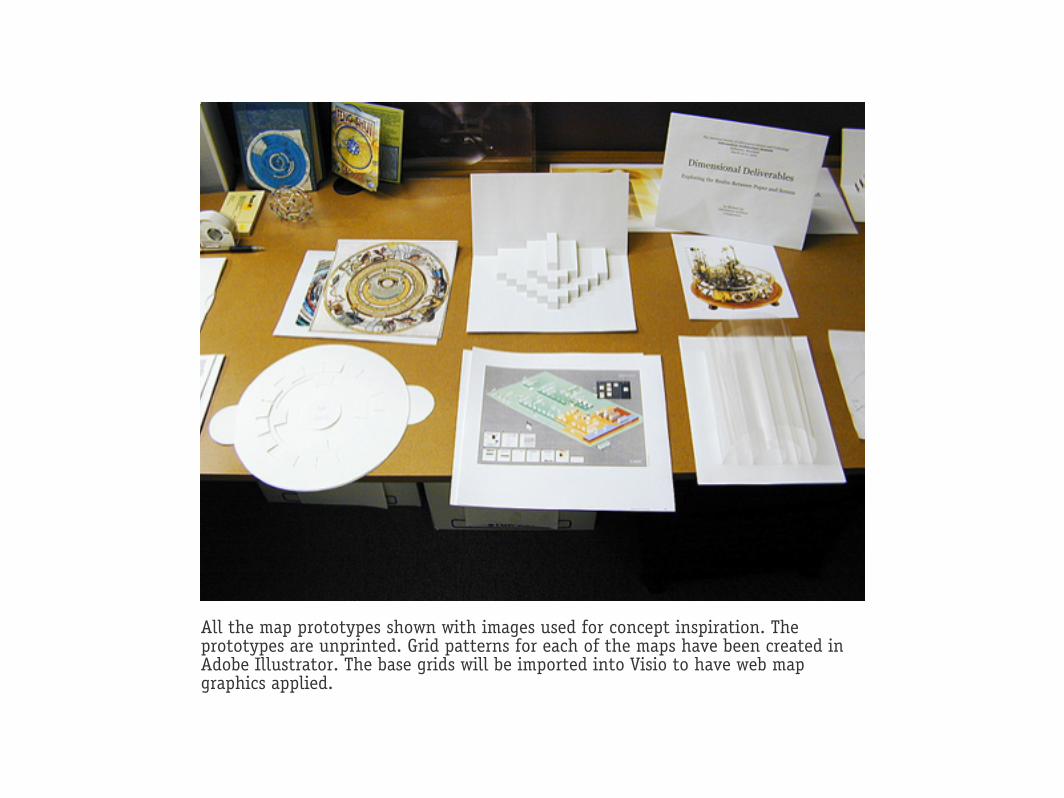
All the map prototypes shown with images used for concept inspiration. The prototypes are unprinted. Grid patterns for each of the maps have been created in Adobe Illustrator. The base grids will be imported into Visio to have web map graphics applied.

The Circular Cutout Book Map with pages partially lifted. Holding the large half-circle on the right level keeps the 1.0 Home disk label label no matter which way the map is rotated. All map box IDs and labels will be printed to always read correctly in the bottom quadrant of the map as the whole book is rotated. The pages are all cut from 11 x 17" card stock that will be printed via color laser.
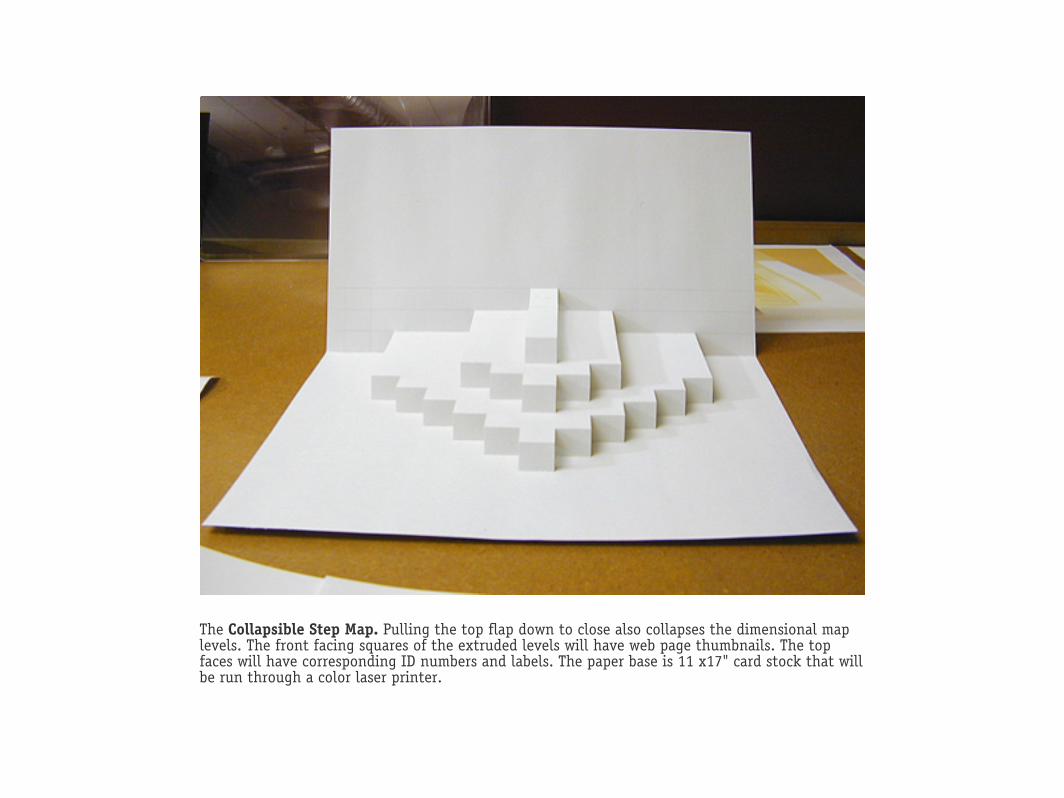
The Collapsible Step Map. Pulling the top flap down to close also collapses the dimensional map levels. The front facing squares of the extruded levels will have web page thumbnails. The top faces will have corresponding ID numbers and labels. The paper base is 11 x17" card stock that will be run through a color laser printer.

A sketch of the Step Map labeling. We are limited to 3 or four levels, and maybe a couple dozen facets per level on an 11x17" sheet. A web site architecture map that is limited by the paper it's visualized on might be a good thing.

The Concentric Transparency Map without graphics applied. The next prototype will incorporate the ability to collapse the transprent sheets.
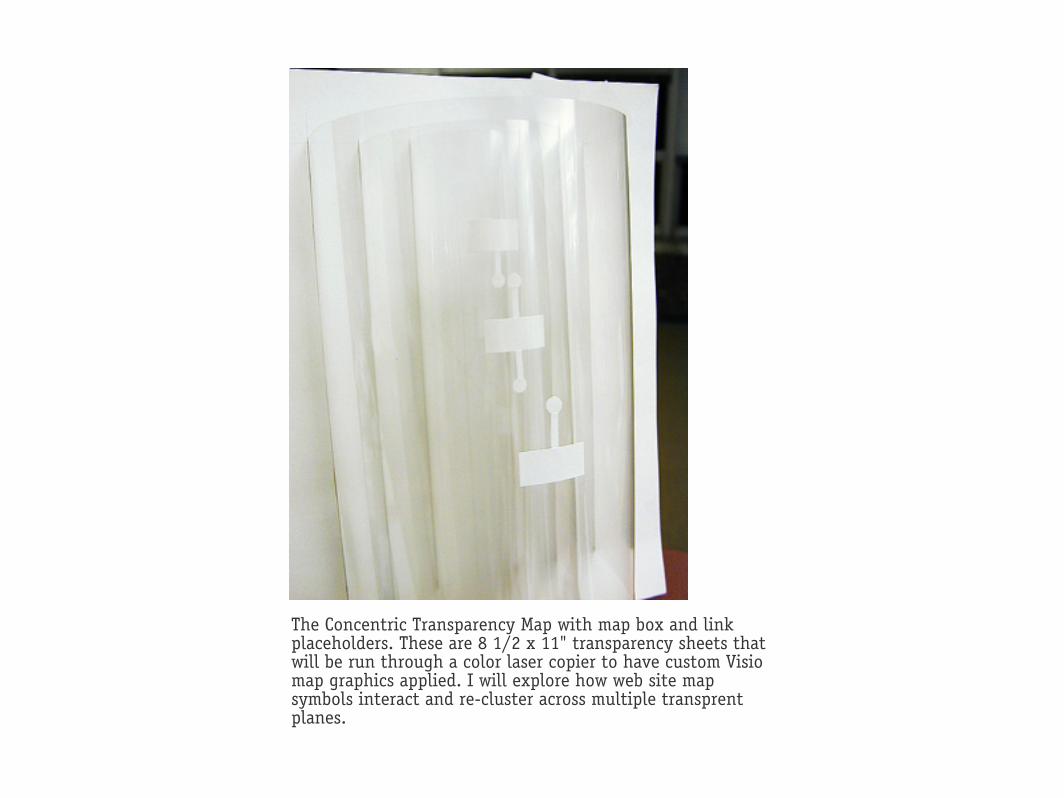
The Concentric Transparency Map with map box and link placeholders. These are 8 1/2 x 11" transparency sheets that will be run through a color laser copier to have custom Visio map graphics applied. I will explore how web site map symbols interact and re-cluster across multiple transprent planes.

Isometric projection
Of or exhibiting equality in dimensions or measurement
The American Heritage® Dictionary of the English Language, Fourth Edition
Isometric projection , a species of orthographic projection, in which but a single plane of projection is used. It is so named from the fact that the projections of three equal lines, parallel respectively to three rectangular axes, are equal to one another. This kind of projection is principally used in delineating buildings or machinery, in which the principal lines are parallel to three rectangular axes, and the principal planes are parallel to three rectangular planes passing through the three axes.
Webster's Revised Unabridged Dictionary
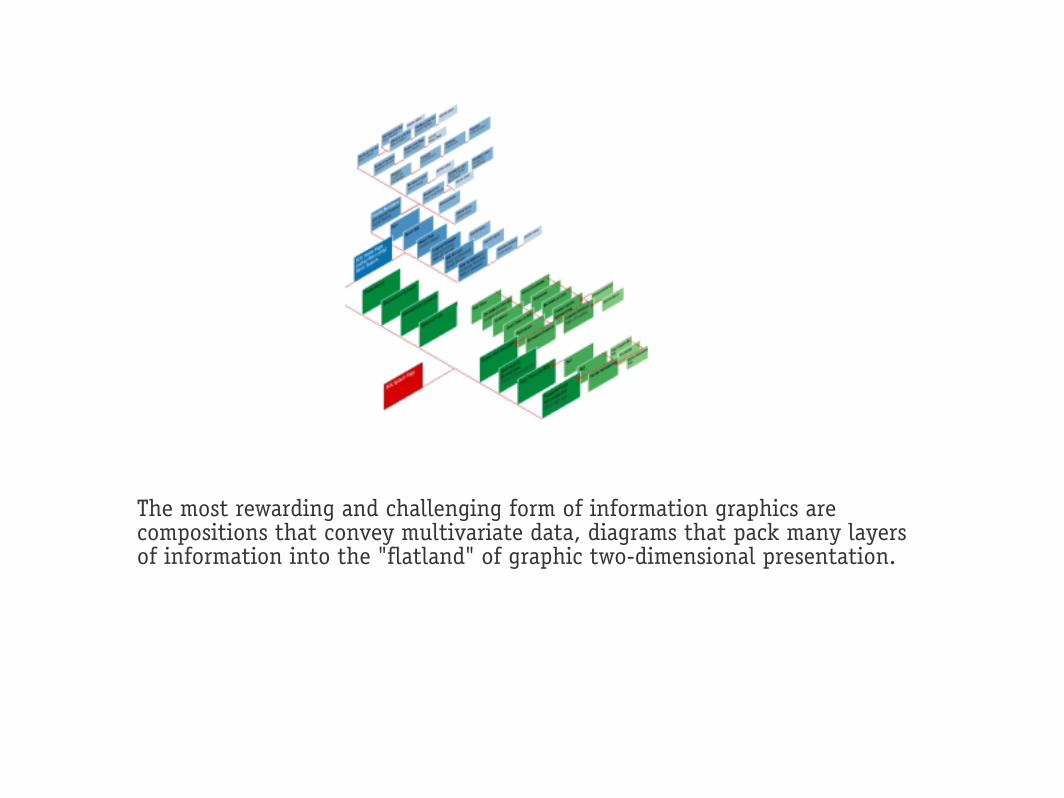
The most rewarding and challenging form of information graphics are compositions that convey multivariate data, diagrams that pack many layers of information into the "flatland" of graphic two-dimensional presentation.

The application of isometric projection to represent a web site grew from several models.
The technique is commonly used for architectural drawings. By representing a building on an isometric grid, the drawing can present details in the foreground and background on a uniform plane, aligned to the parallel lines of the grid.

The same technique has been applied for mapping cities.

graphic from Mapping Web Sites

graphic from Mapping Web Sites

Elements of an isometric diagram (visual library)
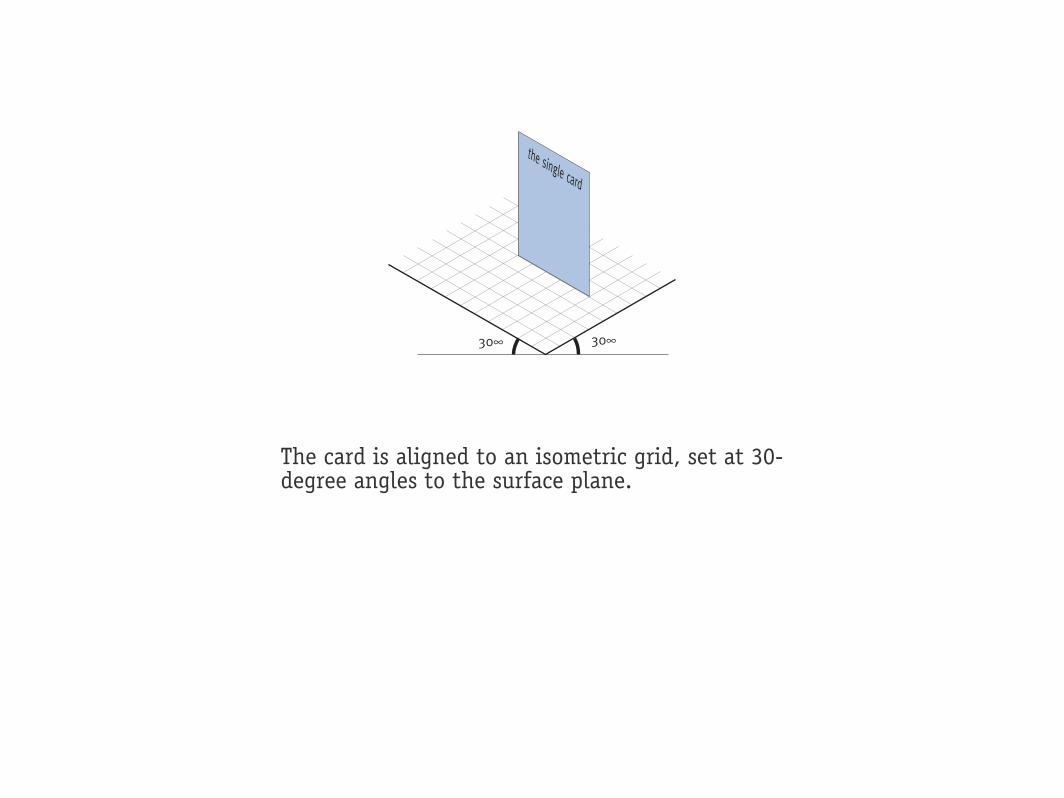
The single card
The element representing a web page is a rectangle, or card. This element can have text, color, or symbol applied to signify information about the page.
30∞30∞
the single card
The card is aligned to an isometric grid, set at 30-degree angles to the surface plane.

“Slide
Tray”
Cards can be grouped into slide trays, with individual cards raised from the tray to expose additional surface.
�
������
��������
������
�
�
����������
Every good boy
deservesfudge.
�
Every good boy
deservesfudge.
Every good boy
deservesfudge.
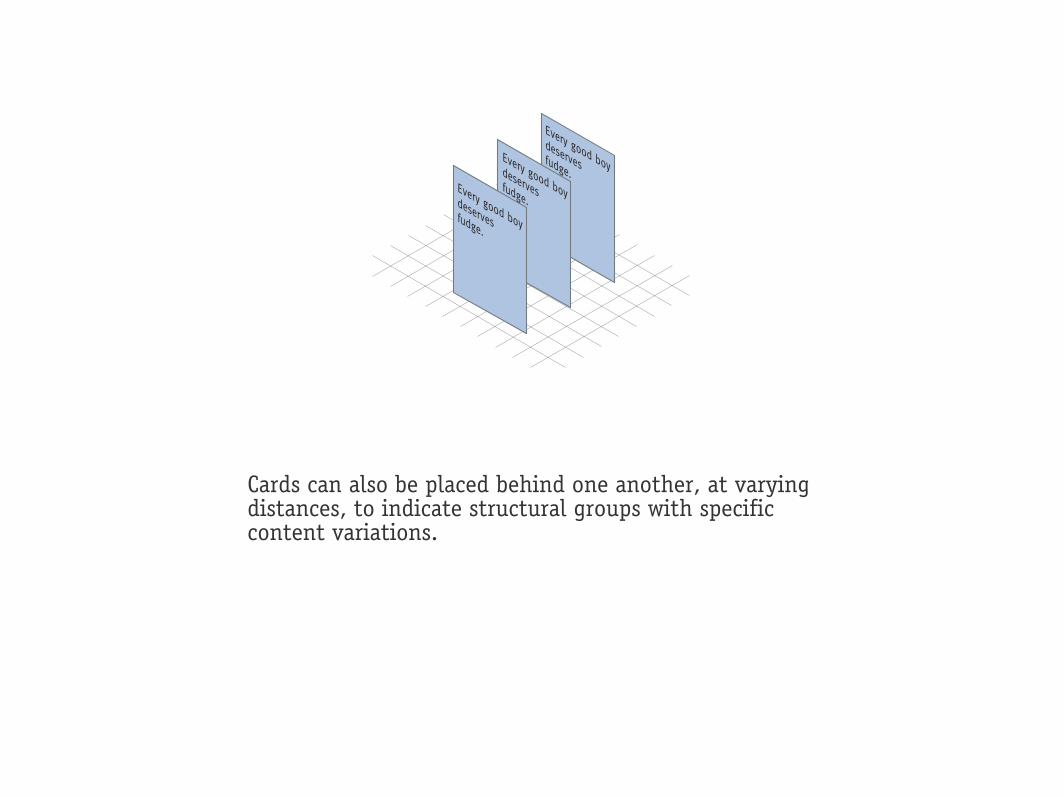
Cards can also be placed behind one another, at varying distances, to indicate structural groups with specific content variations.
Carpet 1
Carpet 2Carpet 3
Raised above
base plane
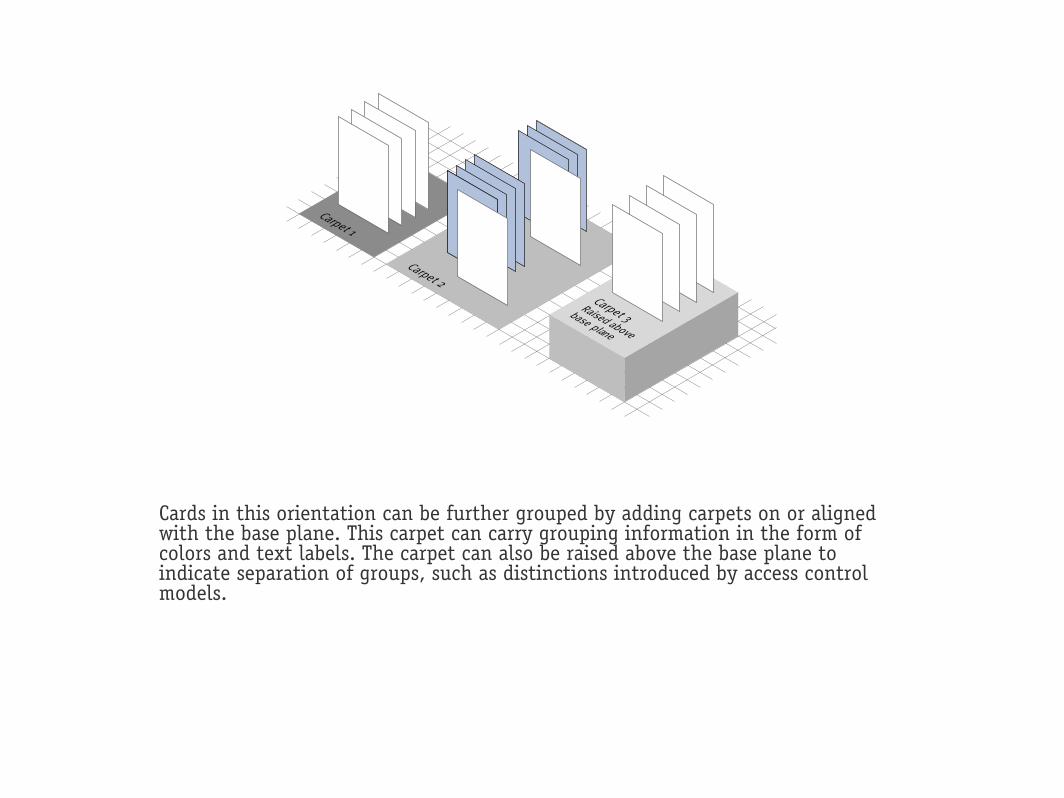
Cards in this orientation can be further grouped by adding carpets on or aligned with the base plane. This carpet can carry grouping information in the form of colors and text labels. The carpet can also be raised above the base plane to indicate separation of groups, such as distinctions introduced by access control models.
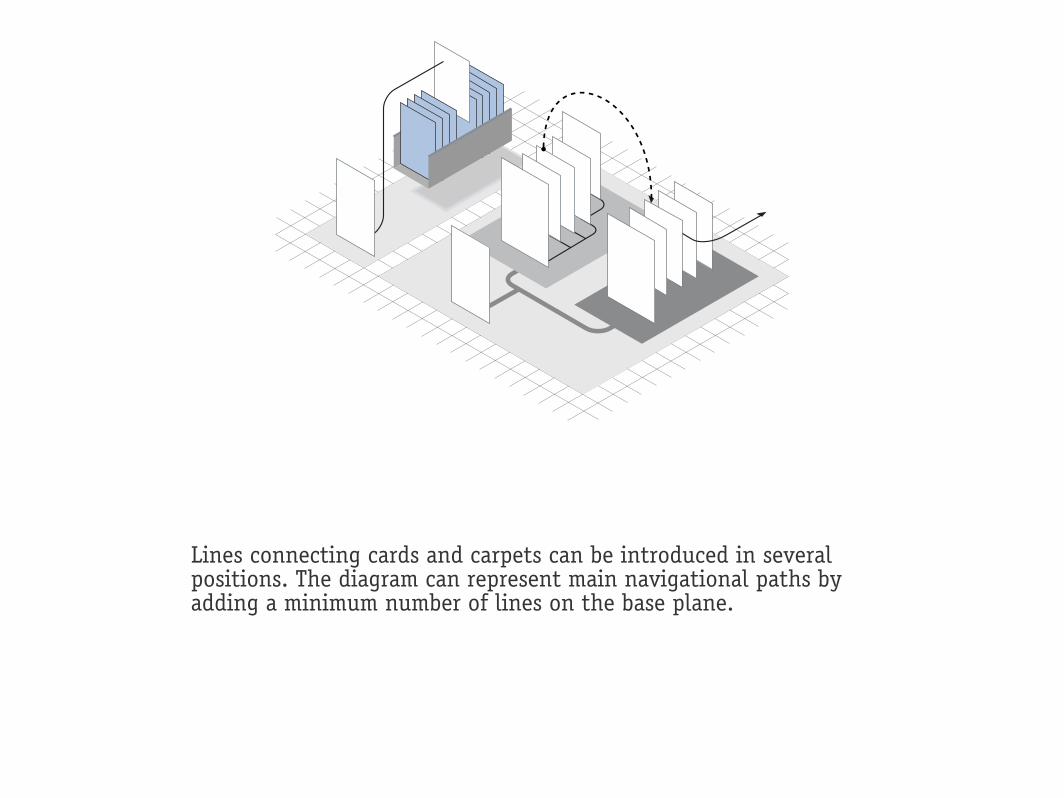
Lines connecting cards and carpets can be introduced in several positions. The diagram can represent main navigational paths by adding a minimum number of lines on the base plane.
������
��
����
����
������
� ���
�� � �� ���
� �� �
��
� ��������
�� � � �� � � ��
¦� −� �
���� ����
��
���
�-� � ��
�� ��
�
��
����
���
��
����� � ��� ��
� �
�����
¦
����� ��
� �������
�
�� ������ � �
� ��
�−
�
¦
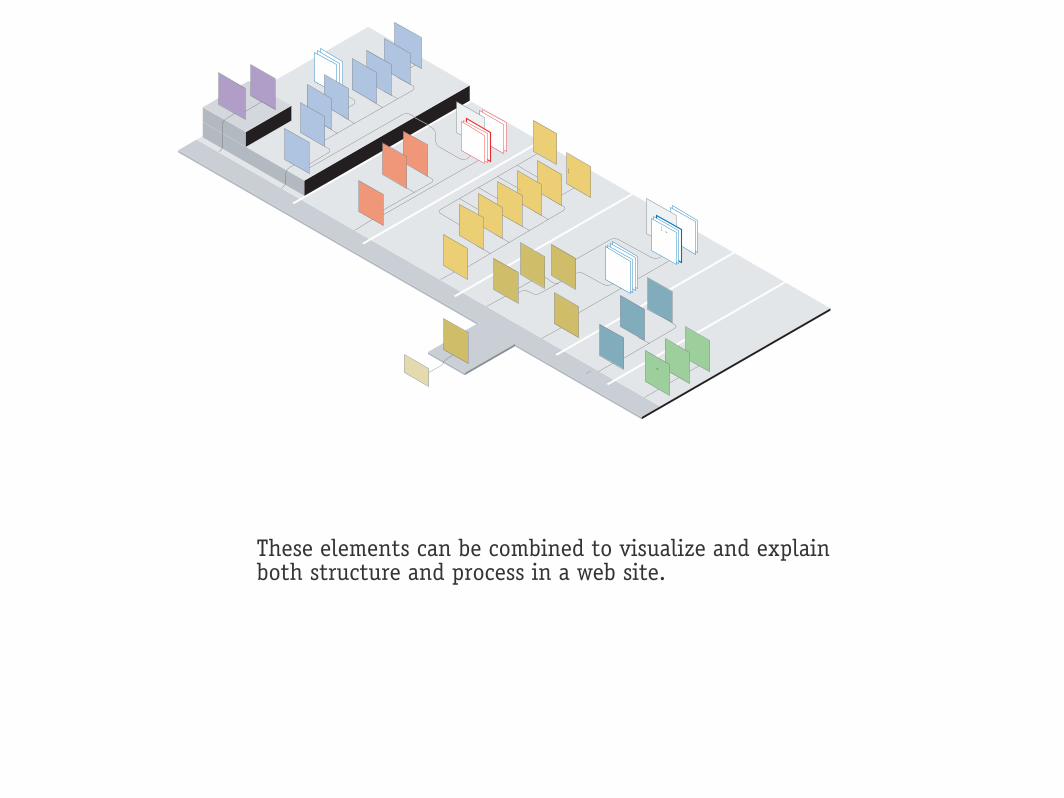
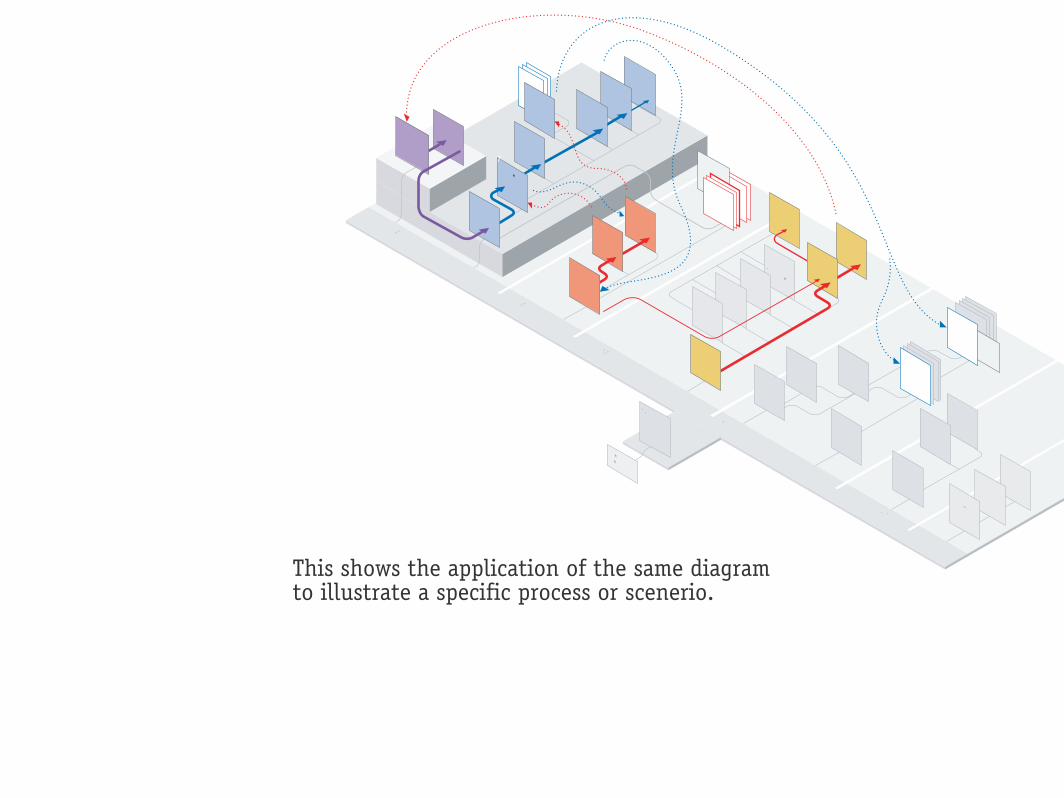
These elements can be combined to visualize and explain both structure and process in a web site.
������
��
���
�����
������
����
�������� � � ���
�� � � � ���� ������
� �� ����
��� � � �� ����������
� � �- � ��� × �
��
�����
��
� �
�� ��� �� � ����
�
�
�
�������
����
��
��−
-�.� � �
' ¦ �
�� �
- '
,
�
� � ¦
�
¦
��
× ��×�
��� �
� �� ��� �� � � ���� � ��
7
��
��� �
This shows the application of the same diagramto illustrate a specific process or scenerio.

Information Architecture for the World Wide Web Louis Rosenfeld, Peter Morville.
Information Architecture: Blueprints for the Web Christina Wodtke.
Mapping Web Sites Paul Kahn, Krzysztof Lenk
Digital Stories: The Poetics of CommunicationMaia Engeli
The Social Life of Information John Seely Brown, Paul Duguid.
“Dimensional Deliverables: Exploring the Realm Between Paper and Screen” Mike Lee
Envisioning Information, Visual Explanations Edward Tufte.
Elements of User ExperienceJesse James Garrett
Opening Pandora's Box: Special Deliverable #1Dan Brown
References


![[the annotated] flatLAND](https://static.fdocuments.in/doc/165x107/568bd8311a28ab2034a2788f/the-annotated-flatland.jpg)


