Escaping and Falling into Poverty in India Today and Falling into Poverty in India Today AMIT...
14
Escaping and Falling into Poverty in India Today AMIT THORAT a , REEVE VANNEMAN b , SONALDE DESAI b and AMARESH DUBEY a,* a Jawaharlal Nehru University, India b University of Maryland, USA Summary. — The study examines the dynamic nature of movements into and out of poverty over a period when poverty has fallen sub- stantially in India. The analysis identifies people who escaped poverty and those who fell into it over the period 2005–12. Using panel data from the India Human Development Survey for 2005 and 2012, we find that the risks of marginalized communities such as Dalits and Adivasis of falling into or remaining in poverty were higher than those for more privileged groups. Some, but not all of these higher risks are explained by educational, financial, and social disadvantages of these groups in 2005. Results from a logistic regression show that some factors that help people escape poverty differ from those that push people into it and that the strength of their effects varies. Ó 2017 Elsevier Ltd. All rights reserved. Key words — India, poverty, panel, escaping, falling, social groups 1. INTRODUCTION The Indian economy has grown by leaps and bounds over the last two decades of its liberalized journey. The world eco- nomic crisis notwithstanding, both rural and urban poverty fell substantially over this time period although some debate remains over the magnitude of this fall. Official estimates show a decline from a high of 37% in 1993–94 to 22% in 2011–12, a decline of 15 percentage points. 1 Though everyone agrees poverty rates have fallen over time, we are less certain about who are the people who have risen out of poverty most rapidly and what advantages they enjoyed that might have helped explain their upward mobil- ity. Moreover, despite the overall decline in net poverty rates, many others have newly fallen into poverty but have been almost forgotten in academic and policy discourse (Krishna, 2010). Poverty analysis in India has largely depended upon cross sectional data, relying on the ‘‘thick” quinquennial and the ‘‘thin” annual consumption expenditure surveys by the NSSO. Though highly useful for a continuous mon- itoring of national progress, these cross-sectional surveys do not allow for examining the dynamics of household outcomes. The lack of national panel data has prevented us from asking what household characteristics increase the odds of exiting or entering poverty? How does occupa- tional diversification affect the risks of poverty? Are histor- ical caste disadvantages reproduced in recent poverty dynamics? The completion of the second wave of the India Human Development Survey (IHDS, 2016) presents a unique oppor- tunity to observe the movements into and out of poverty by Indian households across the country during a rapidly chang- ing economy. We find that traditional caste and religious dif- ferences remain a major impediment for escaping poverty and an equally strong risk for falling into poverty. In con- trast, educational attainment and a salaried position offer protection against the danger of falling into poverty but somewhat less help in escaping once there. Urban location offers similar protections against falling into poverty but almost no advantage in escaping poverty after holding con- stant the educational and occupational advantages typical of urban households. 2. BACKGROUND AND MOTIVATION Contemporary poverty in India has always been under- pinned by the age-old divisions of caste and religious differ- ences. Patterns of poverty and underdevelopment show consistent intergroup differences over time, even during phases of growth and development. India’s class differentials have his- torically mirrored the traditional caste differentials. Brahmins and other forward castes have been the traditional decision makers through their ownership of land and capital, while Dalits (Scheduled Castes) have more often worked as landless laborers. Indigenous tribal groups (Adivasis), often set apart geographically and socially from the rest of India, have typi- cally been the poorest of the poor. Despite aggressive affirmative action policies by the Govern- ment of India and despite substantial improvements in incomes among all Indians, poverty continues to be concen- trated among these most traditionally disadvantaged groups. A recent report based on the 2004–05 India Human Develop- ment Survey (Desai et al., 2010) found that while Forward Caste Hindus experienced a 12% poverty rate, Dalit poverty was more than two and half times as high (32%) and a crip- pling 50% of Adivasis were poor. Intermediate castes (OBCs—Other Backward Classes) had, not surprisingly, inter- mediate levels of poverty (23%). Comparable estimates of * We are grateful to our colleagues at the National Council of Applied Economic Research (NCAER), New Delhi, and especially the IHDS team there for helpful comments, throughout the preparation of this paper. An earlier version of the paper was presented at Jawaharlal Nehru University where we received several useful suggestions. We are also grateful for several useful ideas from World Development reviewers. Our data are from the India Human Development Surveys, 2005 and 2012. These surveys were jointly organized by researchers at the University of Maryland and NCAER. The data collection was funded by grants R01HD041455, R01HD046166, and R01HD061408 from the National Institutes of Health and by a supplementary grant from the Ford Foundation. Data management was funded by the UK government as part of its Knowledge Partnership Program (KPP) and analysis was carried out with the aid of a grant from the International Development Research Centre, Ottawa, Canada. Final revision accepted: January 1, 2017. World Development Vol. 93, pp. 413–426, 2017 0305-750X/Ó 2017 Elsevier Ltd. All rights reserved. www.elsevier.com/locate/worlddev http://dx.doi.org/10.1016/j.worlddev.2017.01.004 413
-
Upload
phungxuyen -
Category
Documents
-
view
218 -
download
0
Transcript of Escaping and Falling into Poverty in India Today and Falling into Poverty in India Today AMIT...
World Development Vol. 93, pp. 413–426, 20170305-750X/� 2017 Elsevier Ltd. All rights reserved.
www.elsevier.com/locate/worlddevhttp://dx.doi.org/10.1016/j.worlddev.2017.01.004
Escaping and Falling into Poverty in India Today
AMIT THORAT a, REEVE VANNEMANb, SONALDE DESAI b and AMARESH DUBEYa,*
a Jawaharlal Nehru University, IndiabUniversity of Maryland, USA
Summary. — The study examines the dynamic nature of movements into and out of poverty over a period when poverty has fallen sub-stantially in India. The analysis identifies people who escaped poverty and those who fell into it over the period 2005–12. Using paneldata from the India Human Development Survey for 2005 and 2012, we find that the risks of marginalized communities such as Dalitsand Adivasis of falling into or remaining in poverty were higher than those for more privileged groups. Some, but not all of these higherrisks are explained by educational, financial, and social disadvantages of these groups in 2005. Results from a logistic regression showthat some factors that help people escape poverty differ from those that push people into it and that the strength of their effects varies.� 2017 Elsevier Ltd. All rights reserved.
Key words — India, poverty, panel, escaping, falling, social groups
*We are grateful to our colleagues at the National Council of Applied
Economic Research (NCAER), New Delhi, and especially the IHDS team
there for helpful comments, throughout the preparation of this paper. An
earlier version of the paper was presented at Jawaharlal Nehru University
where we received several useful suggestions. We are also grateful for
several useful ideas from World Development reviewers. Our data are
from the India Human Development Surveys, 2005 and 2012. These
surveys were jointly organized by researchers at the University of
Maryland and NCAER. The data collection was funded by grants
R01HD041455, R01HD046166, and R01HD061408 from the National
Institutes of Health and by a supplementary grant from the Ford
Foundation. Data management was funded by the UK government as
part of its Knowledge Partnership Program (KPP) and analysis was
carried out with the aid of a grant from the International Development
Research Centre, Ottawa, Canada. Final revision accepted: January 1,2017.
1. INTRODUCTION
The Indian economy has grown by leaps and bounds overthe last two decades of its liberalized journey. The world eco-nomic crisis notwithstanding, both rural and urban povertyfell substantially over this time period although some debateremains over the magnitude of this fall. Official estimates showa decline from a high of 37% in 1993–94 to 22% in 2011–12, adecline of 15 percentage points. 1
Though everyone agrees poverty rates have fallen overtime, we are less certain about who are the people who haverisen out of poverty most rapidly and what advantages theyenjoyed that might have helped explain their upward mobil-ity. Moreover, despite the overall decline in net poverty rates,many others have newly fallen into poverty but have beenalmost forgotten in academic and policy discourse(Krishna, 2010).Poverty analysis in India has largely depended upon
cross sectional data, relying on the ‘‘thick” quinquennialand the ‘‘thin” annual consumption expenditure surveysby the NSSO. Though highly useful for a continuous mon-itoring of national progress, these cross-sectional surveysdo not allow for examining the dynamics of householdoutcomes. The lack of national panel data has preventedus from asking what household characteristics increasethe odds of exiting or entering poverty? How does occupa-tional diversification affect the risks of poverty? Are histor-ical caste disadvantages reproduced in recent povertydynamics?The completion of the second wave of the India Human
Development Survey (IHDS, 2016) presents a unique oppor-tunity to observe the movements into and out of poverty byIndian households across the country during a rapidly chang-ing economy. We find that traditional caste and religious dif-ferences remain a major impediment for escaping povertyand an equally strong risk for falling into poverty. In con-trast, educational attainment and a salaried position offerprotection against the danger of falling into poverty butsomewhat less help in escaping once there. Urban locationoffers similar protections against falling into poverty butalmost no advantage in escaping poverty after holding con-stant the educational and occupational advantages typicalof urban households.
413
2. BACKGROUND AND MOTIVATION
Contemporary poverty in India has always been under-pinned by the age-old divisions of caste and religious differ-ences. Patterns of poverty and underdevelopment showconsistent intergroup differences over time, even during phasesof growth and development. India’s class differentials have his-torically mirrored the traditional caste differentials. Brahminsand other forward castes have been the traditional decisionmakers through their ownership of land and capital, whileDalits (Scheduled Castes) have more often worked as landlesslaborers. Indigenous tribal groups (Adivasis), often set apartgeographically and socially from the rest of India, have typi-cally been the poorest of the poor.Despite aggressive affirmative action policies by the Govern-
ment of India and despite substantial improvements inincomes among all Indians, poverty continues to be concen-trated among these most traditionally disadvantaged groups.A recent report based on the 2004–05 India Human Develop-ment Survey (Desai et al., 2010) found that while ForwardCaste Hindus experienced a 12% poverty rate, Dalit povertywas more than two and half times as high (32%) and a crip-pling 50% of Adivasis were poor. Intermediate castes(OBCs—Other Backward Classes) had, not surprisingly, inter-mediate levels of poverty (23%). Comparable estimates of
414 WORLD DEVELOPMENT
poverty (Thorat & Dubey, 2012) based on data from NationalSample Survey also show similar inter group differences. Whilethe head count ratio (HCR) for the Dalits and Adivasis wereas high as 32% and 30%, they are only 17% for the Forwardcaste Hindus.Religious differences in poverty are more complex owing to
different levels of urbanization, education, and non-agricultural employment. Nevertheless, 31% of minority Mus-lims were poor, a rate not much different from Dalits (IHDS,2005). Other minority religious groups, Jains, Sikhs, and to alesser extent Christians, have been relatively prosperous;together their 2005 poverty rate was only 12%, about the sameas Forward Caste Hindus.
3. PANEL LITERATURE AND ANALYSIS
Poverty analyses in India have depended largely on the crosssectional National Sample Surveys (NSS) consumption expen-diture data collected every five years 2 by the Ministry ofStatistics and Programme Implementation. Panel data analysishas been less common; what has been available has usedmostly selected rural samples from NCAER (Mehta &Bhide, 2003) and from ICRISAT, the International CropsResearch Institute for the Semi-Arid Tropics (Gaiha & Imai,2004; Singh & Binswanger, 1993). The last available year fromICRISAT is 2008 and from NCAER, 1998–99. Lacking suffi-cient panel data, others (Hatlebakk, 2014; Krishna, 2010) havedeveloped retrospective methods for inquiring about transi-tions into and out of poverty.
(a) Social background
These earlier panel analyses of rural poverty persistence con-firmed that the most disadvantaged groups also realized thelowest rates of escape from poverty. The evidence is clearestfor Adivasis, while Dalits and especially OBCs occasionallyshow escape rates more similar to forward castes. For exam-ple, Mehta and Bhide (2003) studying 3,139 rural householdsfound that while 63% of ‘‘Upper Caste” households who werepoor in 1970–71 were no longer poor a decade later, only 37%of Dalits and, even fewer, 30%, of Adivasis had managed toescape poverty during that time. Escape rates for OBC house-holds, 43%, fell between these two extremes. Dhamija andBhide (2013) extended the analysis of the same NCAER datato 1998–99 and also found that both Dalits and Adivasis wereless likely to escape poverty, although the coefficient estimat-ing the log odds of escape for Adivasis, �1.18, was over twicethat for Dalits, �0.56 (2013, p. 692).Krishna (2003) using retrospective accounts for 6,376
Rajasthan households found that while 45% of previouslypoor Upper Caste households had escaped poverty a gener-ation later, 42% of poor OBC households, 33% of Dalithouseholds, and only 31% of Adivasi households had beenable to escape. Using similar methods with 2,245 Gujarathouseholds, Krishna, Kapila, Porwal, and Singh (2005)found escape rates of 22% for ‘‘General” Hindu house-holds, 18%, for Dalits, and 15% for Adivasis. More surpris-ingly, the lowest rates of escape in Gujarat were foundamong poor OBC households, only 12% of whom escapedpoverty. Hatlebakk (2014) using a similar retrospectivemethod with 754 households in two Orissa districts foundsimilar rates of escape for poor OBCs (50%) and Dalits(58%) but much lower for poor Adivasis (17%). Unfortu-nately, the sample size of poor forward castes was toosmall to estimate escape rates.
The analyses most similar to what we report here were cal-culated by Krishna and Shariff (2011) using income, notexpenditure data, from a national panel of 13,593 rural house-holds interviewed in 1993–94 and 2004–05. They found thefamiliar hierarchy of escapes associated with higher caste sta-tus: Dalits and Adivasis (46%), OBCs (53%), and forwardcastes (60%). Interestingly, in a multivariate state fixed effectsregression controlling for other household characteristics,these caste differences proved to be not statistically significant.Their results do not indicate so much a lack of caste differencesin escaping poverty but rather that a reasonably comprehen-sive set of intervening variables can explain much of why castestatus is related to escapes from poverty.There has been less research attention to caste differences in
falling into poverty, despite widespread acknowledgment thatpoverty rates are a product of both escapes and descents.Bhide and Mehta (2008) using the NCAER data found evi-dence for higher rates for Adivasis falling into severe povertyand for Dalits falling into moderate poverty. Dhamija andBhide (2013), analyzing the same data in a multivariate model,found only non-significant caste differences after controllingfor other household and area characteristics. The retrospectivemethods in smaller state-specific samples generally find higherdescent rates for disadvantaged castes than for forward castesalthough the differences among the disadvantaged castes var-ies from one location to another. Krishna and Shariff’s all-India data found large caste differences for falling into povertywith 43% of non-poor Adivasis and Dalits falling into povertya decade later, 36% of OBCs and 23% of forward castes.Religious differences have usually been smaller. Mehta and
Bhide (2003) found 48% of poor Hindus had escaped povertycompared to 40% of poor Muslims. Krishna and Shariff foundonly 45% of Muslims escaped poverty during 1994–2005, com-parable to the low rates for Dalits and Adivasis (46%). And39% of nonpoor Muslims fell into poverty during this period,only slightly less than for Dalits and Adivasis (43%) and wellbelow the higher caste risk (23%).
(b) Economic and educational background
A review of the existing panel data literature on India as wellas other countries suggests that in rural areas, households thatescaped poverty over time, were those that managed toincrease their land holding or to use existing land more inten-sively either by increasing irrigation or crop diversification,found off-farm work, increased skill or education, acquiredmore assets, or reduced family size. At the same time thosehouseholds that fell into poverty were the ones that lost landor operational area, experienced cropping shocks, increasedfamily size, did not accumulate wealth, did not reduce liabili-ties, had members who fell ill, suffered a natural calamity,belonged to lower caste, were landless, mostly less educatedand could not easily change occupation (Aldeman,Subbarao, & Vashishtha, 1985; Baulch & McCulloch, 2002;Gaiha, 1989).
4. OBJECTIVE
The panel studies reviewed above, while suggestive, havevarious limitations: all are rural, several are based on smallor local samples, and poverty definitions vary widely fromone study to another and rarely conform to the standardNSS definition. This study will use a nationally representativepanel data of 38,853 households for India, the India HumanDevelopment Survey (Desai et al., 2010), fielded in two waves,
ESCAPING AND FALLING INTO POVERTY IN INDIA TODAY 415
2004–05 and 2011–12. This is the only nationally representa-tive panel that has collected data on household incomes andconsumption expenditures, and also includes data on manyother socio-economic indicators that might protect householdsfrom poverty.We concentrate on the prior characteristics of households
that would predispose them to escape from or descend intopoverty, particularly the socio-religious profile of these house-holds. We also try to identify the economic and socialresources households have to resist poverty: the household’smain source of income, level of education, land ownership,social and financial capital, and household composition. Forcaste and religion, we first report reduced form differences inexits and entrances and then use lagged logistic regressionsto investigate the conditional effects of household characteris-tics in exposing households to risks of falling into poverty orchances of escaping it. We are also interested in understandinghow much of the caste and community disadvantages areexplained by these household characteristics.When considering poverty transitions, we need to take
account not only of the levels of income and its determinants,but also the steadiness of that income. Steadiness and highlevels are easily conflated because they often (but not always)co-occur. Salaried positions in India usually pay better thanwage labor, but their advantage in poverty transitions stemsalso from the greater steadiness of that income as comparedto hourly wages. Households with steady incomes avoid thepoverty transitions that come from more volatile incomesources. Cross-sectional analyses of poverty that miss thechurning of exits from and entrances into poverty also missthe importance of steady incomes for protecting householdsfrom poverty.Household characteristics that are relatively enduring prop-
erties should be especially important in protecting against fall-ing into poverty: capital of all types—financial, physical,human, and social—can buffer a household against the risksof falling into poverty during bad years. Agricultural capitalmight seem to be an exception to that benefit because of theinherent volatility of agricultural production due to weatherand climatic conditions. But even in agriculture, landownersare better protected from falling into poverty than are agricul-tural laborers who are the first to suffer from failed crops. Per-haps, more importantly, irrigation can buffer the consequencesof rainfall failures and protect cultivators from falling intopoverty.Bank accounts can also provide protection against the
volatility of Indian incomes; they not only can hold savingsto smooth consumption spending, they can provide betteraccess to credit. Access to banking continues to expand inIndia, but at the time of the first IHDS survey only a thirdof Indian households had an account, making this a poten-tially important difference for families avoiding falling intopoverty. And while access to future borrowing may providea means for households to maintain their living standards, cur-rent debt may also create a risk for falling further behind. Theretrospective studies described above frequently identify debtsas a common path into household poverty.Human capital, because it remains with a worker through
good times and bad, can act also as insurance against descentsinto poverty just as physical capital can. A college degree or asecondary school diploma remains a credential workers takewith them from position to position.Finally, social capital, like financial and human capital, can
be a household resource that may help protect householdsfrom falling into poverty during bad times or help efforts torise out of poverty after setbacks. Memberships in formal
organizations, especially micro-credit societies, can providespecifically economic assistance for upward mobility; andmore general informal contacts with local influentials can pro-vide the social safety nets that protect against sudden descentsor that extend a hand up when trying to recover from a set-back.Of course, the steadiness of income, the buffer of a stock of
capital, or the credential that protects employment is not asmuch assistance if that income has not been sufficient to pre-vent poverty in the first place. A steady but poverty-levelincome is poor consolation. For this reason, we expect thesepredictors of steady income to be more important as protec-tion against falling into poverty than assistance in escapingpoverty.
5. METHODS
(a) Data source
IHDS began as a multi-topic panel study of 41,554 house-holds from 33 states and union territories across 1,503 villagesand 971 urban neighborhoods. The survey was designed to benationally representative at its inception. In 2011–12, all of the2004–05 households as well as any households separating fromthe root household but residing in the same area were selectedfor re-interviews.Comparison of IHDS data with other reputable data
sources such as the Census, National Sample Surveys(NSS) and National Family Health Survey (NFHS) showsthat the IHDS compares well with these sources on commonitems (Desai et al., 2010). For example, the NSS estimatespoverty rate to be 37% in 2004–05 and 22% in 2011–12;IHDS estimates are similar at 38% in 2004–05 and 21% in2011–12.IHDS2 reinterviewed 83% of the original IHDS1 house-
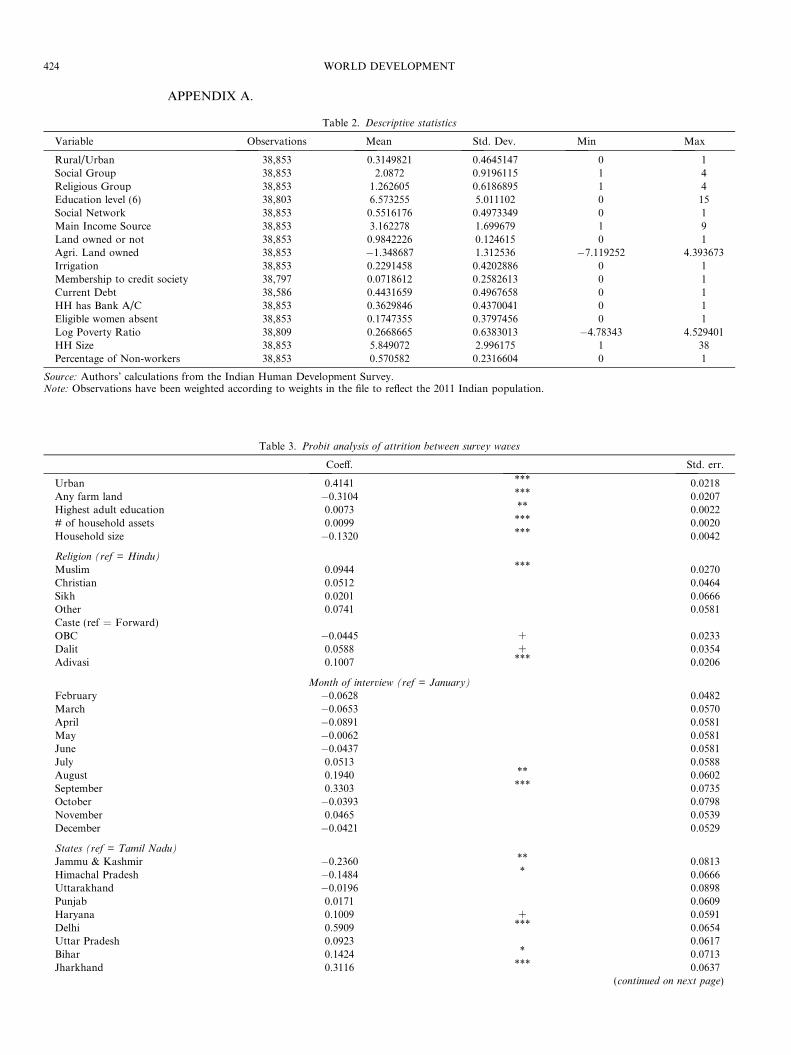
holds that housed 85% of the Indian population—92% ofhouseholds in rural areas and 76% in urban areas. Attritionwas lower among larger, rural households, especially thosewho owned agricultural land. Attrition was also slightly higherfor the non-poor, 13%, than for the poor, 9%. These differ-ences raise the question of a possible selection bias in ourresults since we can analyze poverty transitions only for house-holds interviewed in both surveys. Table 3 presents resultsfrom a probit analysis of attrition from which we calculatedthe inverse Mills’ ratio included in all the analyses of povertytransitions.
(b) Poverty
The IHDS panel collected data on household consumptionexpenditures using an abridged schedule, similar to the oneused by the NSS for their Employment Survey. We convertreported consumption of 47 different items (slightly revisedto 52 items in 2012) to monthly per capita consumption expen-ditures. Head count poverty ratios have been calculated usingper capita household consumption and the official poverty line(Tendulkar Committee poverty lines 3). These poverty lineshave been used by the Planning Commission, Governmentof India for estimating poverty ratios. (PlanningCommission, 2009, see also Himanshu, 2010). While the Plan-ning Commission acknowledged the multi-dimensionality ofpoverty, it maintained the historical reliance on survey con-sumption data but revised the Rupee cutoff values away froma calorie criterion toward a broader basket of food, health,and education expenditures.
416 WORLD DEVELOPMENT
Our analysis compares the poverty status of a household in2012 (round two) to its status in 2005 (round one). For poorhouseholds in round one, we investigate whether they escapedpoverty or remained poor; for non-poor households, we inves-tigate whether they fell into poverty or remained non-poor.Thus our dependent variable is the poor or non-poor statusesof a household in round two given that the household wasnon-poor or poor in round one. For new household splits inround two, we trace back their poverty status to the originhousehold in round one.
(c) Variables
We investigate round one household characteristics, focus-ing especially on caste and religion. In the multivariate models,we add highest adult education in the household, main sourceof income, land owned, irrigated land or not, household com-position, social networks, and state dummies (see means inTable 2).
i. Caste—we divide all households into four groups, Adi-vasis (Scheduled Tribes), Dalits (Scheduled Castes),OBCs (Other Backward Classes) and Forward Castes(all others). We use this fourfold classification for bothHindu and non-Hindu households because in other anal-yses not reported here we find that the differencesbetween self-reported caste groups among Muslims,Sikhs, Christians, and others largely parallel thoseamong Hindus.
ii. Religion—we include four groups: Hindus, Muslims,Sikhs, and Christians, and all others which includesBuddhists, Jains, Zoroastrians, Tribals, others, andnone (not reporting any religious affiliations)
iii. Highest Educated Adult—this variable gives the highestlevel of education attained by any adult aged 21 or overin the household; for the few households with no adult,we used the education of the person designated as thehousehold head. We divide years of educational attain-ment into six groups.
iv. Main Income Source—IHDS collected detailed incomedata from over 50 possible sources. We group these intoeight major sources (farm, agricultural wage labor, non-agricultural labor, regular salaried, self employment,family business, property or pension income, remit-tances, and government benefits) and classify the house-hold according to the source of the largest income share.
v. Land Class—we first divide households into those whodo and do not own agricultural land, and then for thosewith land, we calculate the logarithm of hectares owned.In order to avoid missing values, non-landed householdsare assigned a low value on landsize (0.1 ha), thus con-straining the landed/landless dummy coefficient to com-pare non-landowners with very small landowners andreserving the analysis of land size only to householdswith some land. We also included a dummy variablefor whether any of the household’s land was irrigated.
vi. Bank account—an ‘‘eligible woman” in the household,an ever-married woman 15–49, was asked whether thehousehold had a bank account and whether her namewas on the account. Approximately 1 in 6 householdsdid not include an eligible woman so the survey hasno information on whether the household had a bankaccount or not. This information is important enoughthat we tested the role of bank accounts for these eligi-ble woman households, substituting the mean (0.36) formissing data and adding a dummy variable to identifythe households with missing data. 4
vii. Member of credit/savings group—IHDS askedwhether a household was a member of any of nine dif-ferent types of organizations; we focus on membershipin a ‘‘credit/ savings group”.
viii. Debts—households were asked to report how muchthey currently owed others, from which we calculateda simple dichotomy of any debt versus no debt.
ix. Social networks—this variable captures whether ahousehold is acquainted with a government official, ateacher or school staff, or a medical official.
x. Household structure—household size is the total num-ber of persons in the household and the dependencyratio is the number of non-working household membersper working members of the household.
xi. We also included 21 state dummies to control for thewide range of regional differences in levels of andchanges in poverty. We collapse several smaller stateswith small survey samples into regional groups, narrow-ing the number of states from 31 to 22.
(d) Analyses
We begin by reporting simple cross-tabulations of povertyrates, exits, and entrances by caste, religion, and other back-ground variables. We compare groups using simple percentagedifferences, but as will be quickly apparent, those statistics canbe misleading when groups are starting at such different levelsof poverty.The more analytic part of the paper uses a dynamic logistic
regression model that takes as the dependent variable the pov-erty status (0/1) of households in time t (the 2012 IHDS sur-vey) separately for households who were poor or nonpoor attime period t�1, factoring in a range of control.
fY t ¼/ þbX t�1 þ cY t�1 þ kt�1 þ etgYt = Poverty status in current period.Yt�1 = Poverty status in initial time period.Xt�1 = Set of controls in initial time period (social group,education etc.)Yt�1 = Inverse Mills’ ratioet = Error termThe logistic regressions have the advantage of comparing
groups by their log odds of escaping or entering poverty, com-parisons that are not so closely determined by their initial pov-erty levels, as are percentages differences. For example, agroup with a 20% poverty head count ratio that fell to 10%experienced the same change in log odds as a group that beganwith a 50% poverty rate that fell to 31%. Although the formergroup changed by only 10 percentage points, its poverty ratewas cut in half; while the latter group had a 19 percentagepoint change but its poverty rate was reduced by only 38%.All analyses are weighted by the sample weights in the
IHDS2 files to reflect the national population. We also correctthe standard errors to account for clustering into the 2,435 pri-mary sampling units.
(e) Robustness checks
Our main analyses use the conventional Indian measure ofhousehold poverty that is based on consumption expendituresper capita using a poverty line drawn by the Tendulkar Com-mission. There are many other possible ways of identifyingIndian poverty, and it is possible that our results would differwith different poverty definitions. We re-compute the analysisfor some although certainly not all of these possibilities.Instead of adjusting for household size by using a per capita
ESCAPING AND FALLING INTO POVERTY IN INDIA TODAY 417
measure of consumption, we also use an ‘‘equivalenced” mea-sure that divides total household consumption by the squareroot of the number of persons in the household—an adjust-ment more common in poverty measures in high-income coun-tries. We also construct a measure of ‘‘severe poverty” with acutoff at 80% of the official line and a measure of ‘‘nearpoverty” with a cutoff at 125% of the poverty line. Finally,we take advantage of the wide range of economic indicatorsavailable in the IHDS using household income and householdassets as measures of economic standing, drawing the povertylines at a level to identify an equivalent percentage of the pop-ulation as with the more conventional consumption measure.
6. RESULTS
(a) Descriptive statistics
(i) Poverty declineAs with other data sources, we find that the head count ratio
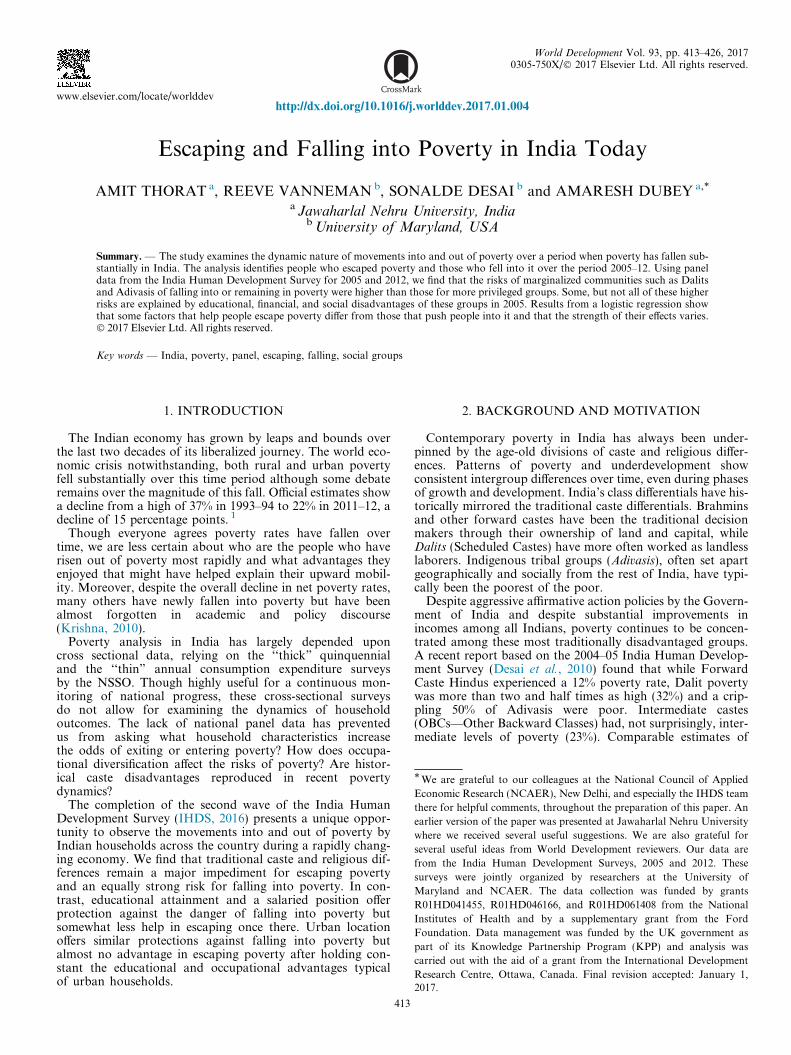
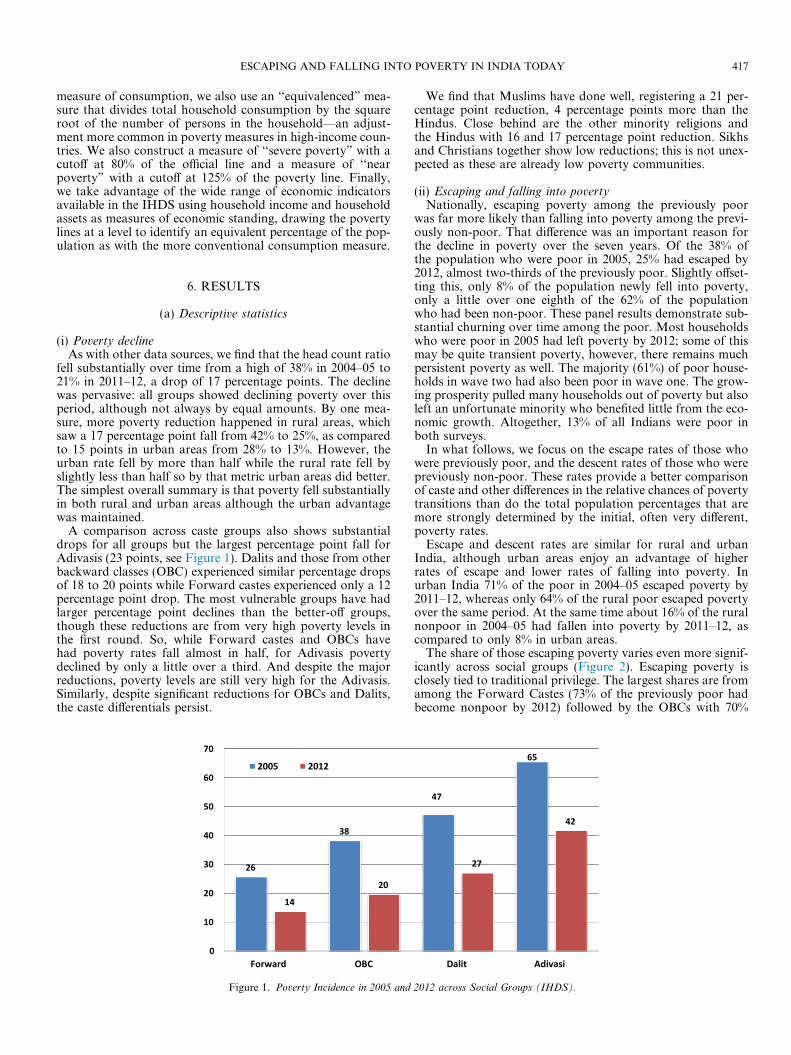
fell substantially over time from a high of 38% in 2004–05 to21% in 2011–12, a drop of 17 percentage points. The declinewas pervasive: all groups showed declining poverty over thisperiod, although not always by equal amounts. By one mea-sure, more poverty reduction happened in rural areas, whichsaw a 17 percentage point fall from 42% to 25%, as comparedto 15 points in urban areas from 28% to 13%. However, theurban rate fell by more than half while the rural rate fell byslightly less than half so by that metric urban areas did better.The simplest overall summary is that poverty fell substantiallyin both rural and urban areas although the urban advantagewas maintained.A comparison across caste groups also shows substantial
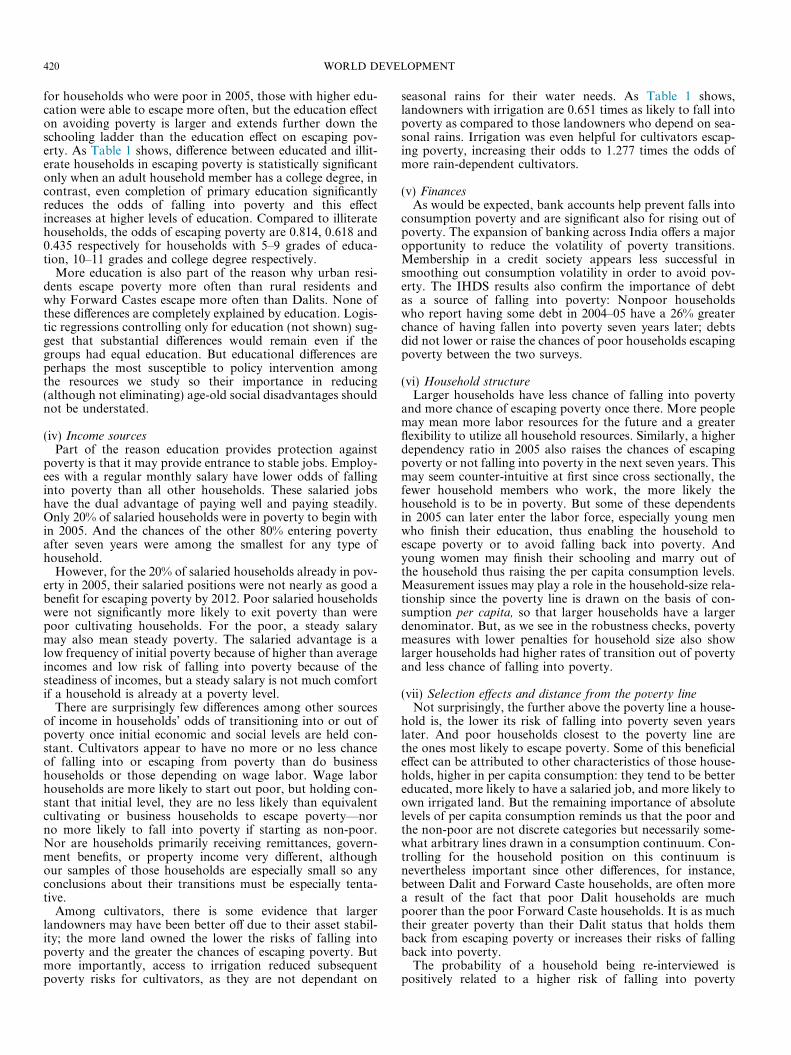
drops for all groups but the largest percentage point fall forAdivasis (23 points, see Figure 1). Dalits and those from otherbackward classes (OBC) experienced similar percentage dropsof 18 to 20 points while Forward castes experienced only a 12percentage point drop. The most vulnerable groups have hadlarger percentage point declines than the better-off groups,though these reductions are from very high poverty levels inthe first round. So, while Forward castes and OBCs havehad poverty rates fall almost in half, for Adivasis povertydeclined by only a little over a third. And despite the majorreductions, poverty levels are still very high for the Adivasis.Similarly, despite significant reductions for OBCs and Dalits,the caste differentials persist.
26
38
14
20
0
10
20
30
40
50
60
70
Forward OBC
2005 2012
Figure 1. Poverty Incidence in 2005 and
We find that Muslims have done well, registering a 21 per-centage point reduction, 4 percentage points more than theHindus. Close behind are the other minority religions andthe Hindus with 16 and 17 percentage point reduction. Sikhsand Christians together show low reductions; this is not unex-pected as these are already low poverty communities.
(ii) Escaping and falling into povertyNationally, escaping poverty among the previously poor
was far more likely than falling into poverty among the previ-ously non-poor. That difference was an important reason forthe decline in poverty over the seven years. Of the 38% ofthe population who were poor in 2005, 25% had escaped by2012, almost two-thirds of the previously poor. Slightly offset-ting this, only 8% of the population newly fell into poverty,only a little over one eighth of the 62% of the populationwho had been non-poor. These panel results demonstrate sub-stantial churning over time among the poor. Most householdswho were poor in 2005 had left poverty by 2012; some of thismay be quite transient poverty, however, there remains muchpersistent poverty as well. The majority (61%) of poor house-holds in wave two had also been poor in wave one. The grow-ing prosperity pulled many households out of poverty but alsoleft an unfortunate minority who benefited little from the eco-nomic growth. Altogether, 13% of all Indians were poor inboth surveys.In what follows, we focus on the escape rates of those who
were previously poor, and the descent rates of those who werepreviously non-poor. These rates provide a better comparisonof caste and other differences in the relative chances of povertytransitions than do the total population percentages that aremore strongly determined by the initial, often very different,poverty rates.Escape and descent rates are similar for rural and urban
India, although urban areas enjoy an advantage of higherrates of escape and lower rates of falling into poverty. Inurban India 71% of the poor in 2004–05 escaped poverty by2011–12, whereas only 64% of the rural poor escaped povertyover the same period. At the same time about 16% of the ruralnonpoor in 2004–05 had fallen into poverty by 2011–12, ascompared to only 8% in urban areas.The share of those escaping poverty varies even more signif-
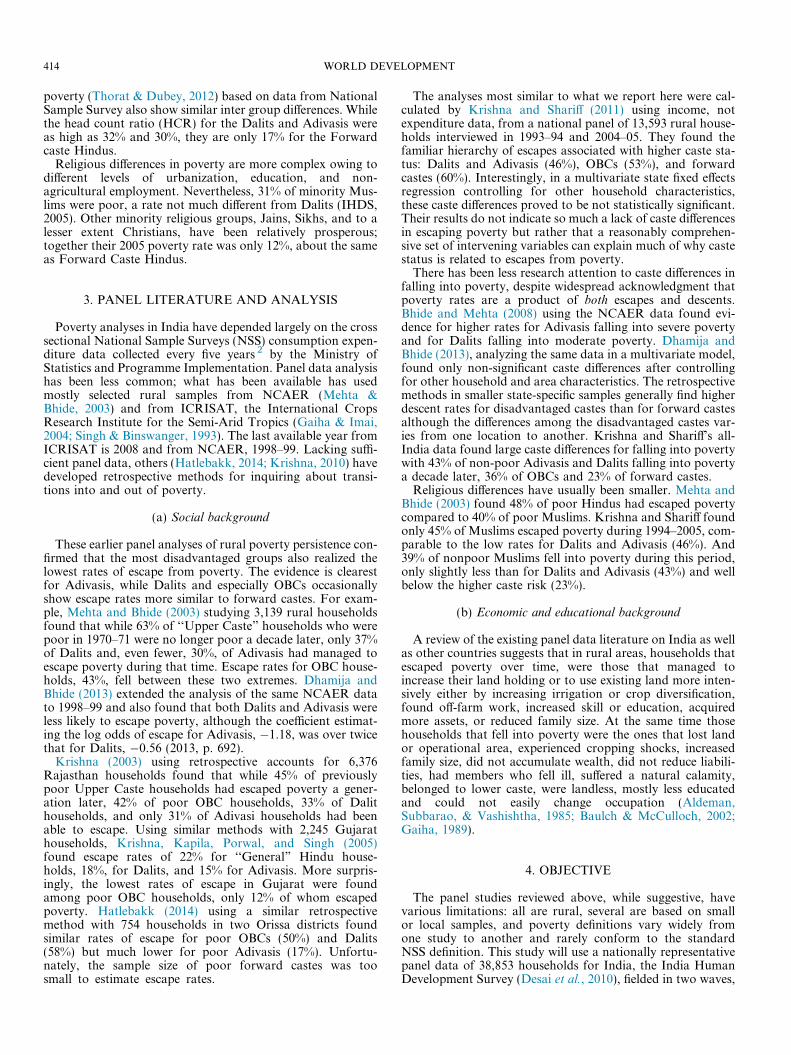
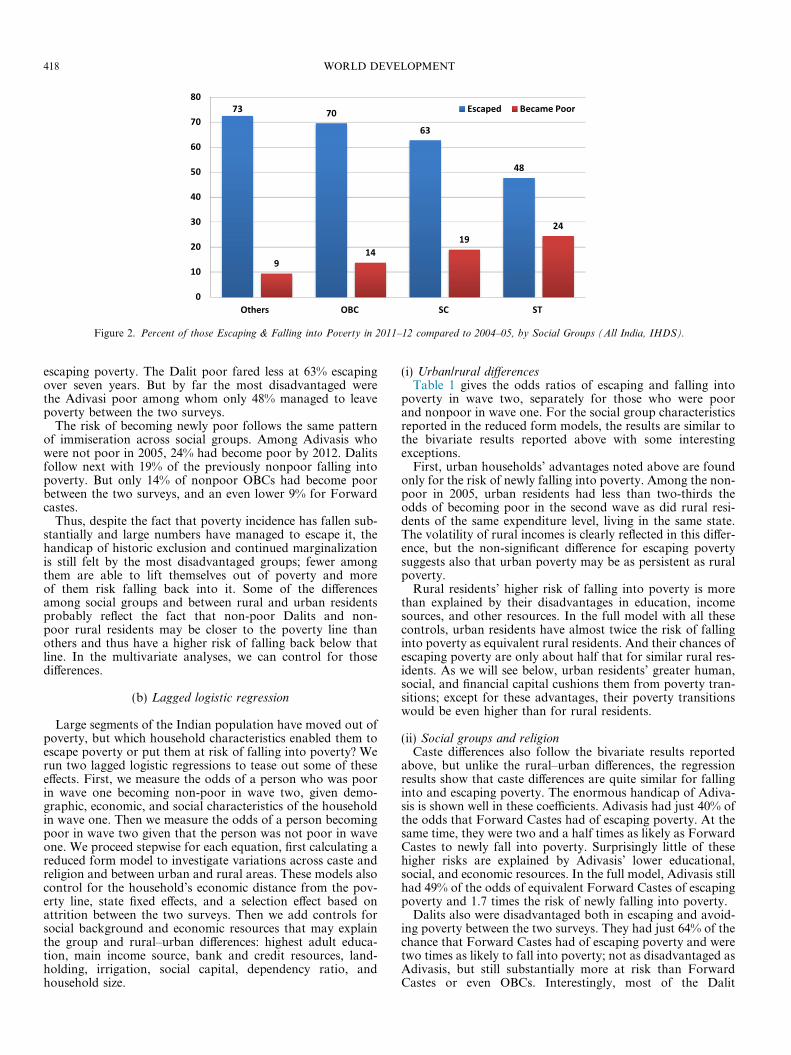
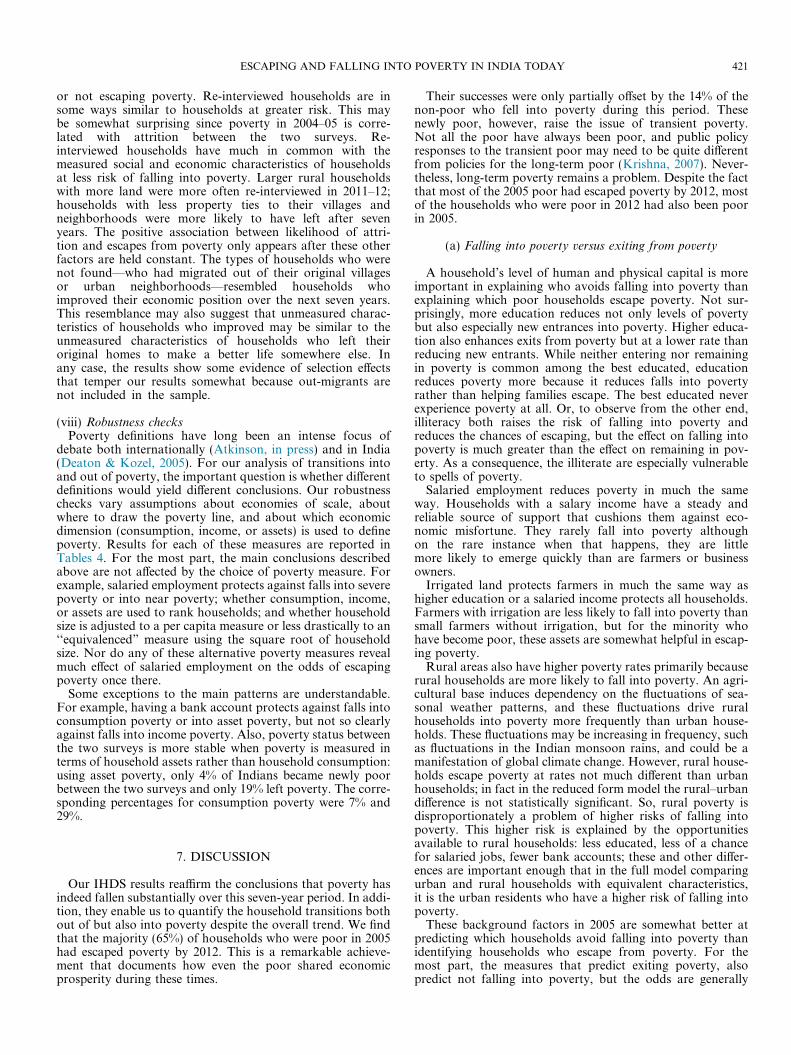
icantly across social groups (Figure 2). Escaping poverty isclosely tied to traditional privilege. The largest shares are fromamong the Forward Castes (73% of the previously poor hadbecome nonpoor by 2012) followed by the OBCs with 70%
47
65
27
42
Dalit Adivasi
2012 across Social Groups (IHDS).
73 70
63
48
914
1924
0
10
20
30
40
50
60
70
80
Others OBC SC ST
Escaped Became Poor
Figure 2. Percent of those Escaping & Falling into Poverty in 2011–12 compared to 2004–05, by Social Groups (All India, IHDS).
418 WORLD DEVELOPMENT
escaping poverty. The Dalit poor fared less at 63% escapingover seven years. But by far the most disadvantaged werethe Adivasi poor among whom only 48% managed to leavepoverty between the two surveys.The risk of becoming newly poor follows the same pattern
of immiseration across social groups. Among Adivasis whowere not poor in 2005, 24% had become poor by 2012. Dalitsfollow next with 19% of the previously nonpoor falling intopoverty. But only 14% of nonpoor OBCs had become poorbetween the two surveys, and an even lower 9% for Forwardcastes.Thus, despite the fact that poverty incidence has fallen sub-
stantially and large numbers have managed to escape it, thehandicap of historic exclusion and continued marginalizationis still felt by the most disadvantaged groups; fewer amongthem are able to lift themselves out of poverty and moreof them risk falling back into it. Some of the differencesamong social groups and between rural and urban residentsprobably reflect the fact that non-poor Dalits and non-poor rural residents may be closer to the poverty line thanothers and thus have a higher risk of falling back below thatline. In the multivariate analyses, we can control for thosedifferences.
(b) Lagged logistic regression
Large segments of the Indian population have moved out ofpoverty, but which household characteristics enabled them toescape poverty or put them at risk of falling into poverty? Werun two lagged logistic regressions to tease out some of theseeffects. First, we measure the odds of a person who was poorin wave one becoming non-poor in wave two, given demo-graphic, economic, and social characteristics of the householdin wave one. Then we measure the odds of a person becomingpoor in wave two given that the person was not poor in waveone. We proceed stepwise for each equation, first calculating areduced form model to investigate variations across caste andreligion and between urban and rural areas. These models alsocontrol for the household’s economic distance from the pov-erty line, state fixed effects, and a selection effect based onattrition between the two surveys. Then we add controls forsocial background and economic resources that may explainthe group and rural–urban differences: highest adult educa-tion, main income source, bank and credit resources, land-holding, irrigation, social capital, dependency ratio, andhousehold size.
(i) Urban/rural differencesTable 1 gives the odds ratios of escaping and falling into
poverty in wave two, separately for those who were poorand nonpoor in wave one. For the social group characteristicsreported in the reduced form models, the results are similar tothe bivariate results reported above with some interestingexceptions.First, urban households’ advantages noted above are found
only for the risk of newly falling into poverty. Among the non-poor in 2005, urban residents had less than two-thirds theodds of becoming poor in the second wave as did rural resi-dents of the same expenditure level, living in the same state.The volatility of rural incomes is clearly reflected in this differ-ence, but the non-significant difference for escaping povertysuggests also that urban poverty may be as persistent as ruralpoverty.Rural residents’ higher risk of falling into poverty is more
than explained by their disadvantages in education, incomesources, and other resources. In the full model with all thesecontrols, urban residents have almost twice the risk of fallinginto poverty as equivalent rural residents. And their chances ofescaping poverty are only about half that for similar rural res-idents. As we will see below, urban residents’ greater human,social, and financial capital cushions them from poverty tran-sitions; except for these advantages, their poverty transitionswould be even higher than for rural residents.
(ii) Social groups and religionCaste differences also follow the bivariate results reported
above, but unlike the rural–urban differences, the regressionresults show that caste differences are quite similar for fallinginto and escaping poverty. The enormous handicap of Adiva-sis is shown well in these coefficients. Adivasis had just 40% ofthe odds that Forward Castes had of escaping poverty. At thesame time, they were two and a half times as likely as ForwardCastes to newly fall into poverty. Surprisingly little of thesehigher risks are explained by Adivasis’ lower educational,social, and economic resources. In the full model, Adivasis stillhad 49% of the odds of equivalent Forward Castes of escapingpoverty and 1.7 times the risk of newly falling into poverty.Dalits also were disadvantaged both in escaping and avoid-
ing poverty between the two surveys. They had just 64% of thechance that Forward Castes had of escaping poverty and weretwo times as likely to fall into poverty; not as disadvantaged asAdivasis, but still substantially more at risk than ForwardCastes or even OBCs. Interestingly, most of the Dalit
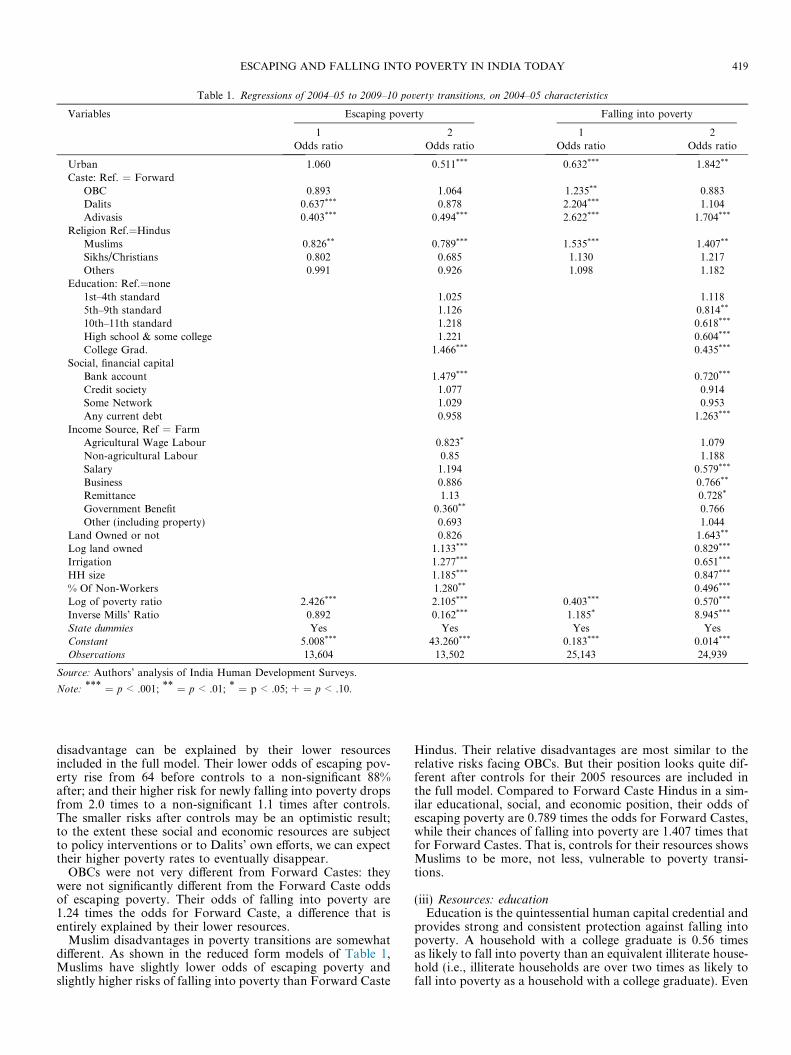
Table 1. Regressions of 2004–05 to 2009–10 poverty transitions, on 2004–05 characteristics
Variables Escaping poverty Falling into poverty
1 2 1 2Odds ratio Odds ratio Odds ratio Odds ratio
Urban 1.060 0.511*** 0.632*** 1.842**
Caste: Ref. = ForwardOBC 0.893 1.064 1.235** 0.883Dalits 0.637*** 0.878 2.204*** 1.104Adivasis 0.403*** 0.494*** 2.622*** 1.704***
Religion Ref.=HindusMuslims 0.826** 0.789*** 1.535*** 1.407**
Sikhs/Christians 0.802 0.685 1.130 1.217Others 0.991 0.926 1.098 1.182
Education: Ref.=none1st–4th standard 1.025 1.1185th–9th standard 1.126 0.814**
10th–11th standard 1.218 0.618***
High school & some college 1.221 0.604***
College Grad. 1.466*** 0.435***
Social, financial capitalBank account 1.479*** 0.720***
Credit society 1.077 0.914Some Network 1.029 0.953Any current debt 0.958 1.263***
Income Source, Ref = FarmAgricultural Wage Labour 0.823* 1.079Non-agricultural Labour 0.85 1.188Salary 1.194 0.579***
Business 0.886 0.766**
Remittance 1.13 0.728*
Government Benefit 0.360** 0.766Other (including property) 0.693 1.044
Land Owned or not 0.826 1.643**
Log land owned 1.133*** 0.829***
Irrigation 1.277*** 0.651***
HH size 1.185*** 0.847***
% Of Non-Workers 1.280** 0.496***
Log of poverty ratio 2.426*** 2.105*** 0.403*** 0.570***
Inverse Mills’ Ratio 0.892 0.162*** 1.185* 8.945***
State dummies Yes Yes Yes YesConstant 5.008*** 43.260*** 0.183*** 0.014***
Observations 13,604 13,502 25,143 24,939
Source: Authors’ analysis of India Human Development Surveys.
Note: *** = p < .001; ** = p < .01; * = p < .05; + = p < .10.
ESCAPING AND FALLING INTO POVERTY IN INDIA TODAY 419
disadvantage can be explained by their lower resourcesincluded in the full model. Their lower odds of escaping pov-erty rise from 64 before controls to a non-significant 88%after; and their higher risk for newly falling into poverty dropsfrom 2.0 times to a non-significant 1.1 times after controls.The smaller risks after controls may be an optimistic result;to the extent these social and economic resources are subjectto policy interventions or to Dalits’ own efforts, we can expecttheir higher poverty rates to eventually disappear.OBCs were not very different from Forward Castes: they
were not significantly different from the Forward Caste oddsof escaping poverty. Their odds of falling into poverty are1.24 times the odds for Forward Caste, a difference that isentirely explained by their lower resources.Muslim disadvantages in poverty transitions are somewhat
different. As shown in the reduced form models of Table 1,Muslims have slightly lower odds of escaping poverty andslightly higher risks of falling into poverty than Forward Caste
Hindus. Their relative disadvantages are most similar to therelative risks facing OBCs. But their position looks quite dif-ferent after controls for their 2005 resources are included inthe full model. Compared to Forward Caste Hindus in a sim-ilar educational, social, and economic position, their odds ofescaping poverty are 0.789 times the odds for Forward Castes,while their chances of falling into poverty are 1.407 times thatfor Forward Castes. That is, controls for their resources showsMuslims to be more, not less, vulnerable to poverty transi-tions.
(iii) Resources: educationEducation is the quintessential human capital credential and
provides strong and consistent protection against falling intopoverty. A household with a college graduate is 0.56 timesas likely to fall into poverty than an equivalent illiterate house-hold (i.e., illiterate households are over two times as likely tofall into poverty as a household with a college graduate). Even
420 WORLD DEVELOPMENT
for households who were poor in 2005, those with higher edu-cation were able to escape more often, but the education effecton avoiding poverty is larger and extends further down theschooling ladder than the education effect on escaping pov-erty. As Table 1 shows, difference between educated and illit-erate households in escaping poverty is statistically significantonly when an adult household member has a college degree, incontrast, even completion of primary education significantlyreduces the odds of falling into poverty and this effectincreases at higher levels of education. Compared to illiteratehouseholds, the odds of escaping poverty are 0.814, 0.618 and0.435 respectively for households with 5–9 grades of educa-tion, 10–11 grades and college degree respectively.More education is also part of the reason why urban resi-
dents escape poverty more often than rural residents andwhy Forward Castes escape more often than Dalits. None ofthese differences are completely explained by education. Logis-tic regressions controlling only for education (not shown) sug-gest that substantial differences would remain even if thegroups had equal education. But educational differences areperhaps the most susceptible to policy intervention amongthe resources we study so their importance in reducing(although not eliminating) age-old social disadvantages shouldnot be understated.
(iv) Income sourcesPart of the reason education provides protection against
poverty is that it may provide entrance to stable jobs. Employ-ees with a regular monthly salary have lower odds of fallinginto poverty than all other households. These salaried jobshave the dual advantage of paying well and paying steadily.Only 20% of salaried households were in poverty to begin within 2005. And the chances of the other 80% entering povertyafter seven years were among the smallest for any type ofhousehold.However, for the 20% of salaried households already in pov-
erty in 2005, their salaried positions were not nearly as good abenefit for escaping poverty by 2012. Poor salaried householdswere not significantly more likely to exit poverty than werepoor cultivating households. For the poor, a steady salarymay also mean steady poverty. The salaried advantage is alow frequency of initial poverty because of higher than averageincomes and low risk of falling into poverty because of thesteadiness of incomes, but a steady salary is not much comfortif a household is already at a poverty level.There are surprisingly few differences among other sources
of income in households’ odds of transitioning into or out ofpoverty once initial economic and social levels are held con-stant. Cultivators appear to have no more or no less chanceof falling into or escaping from poverty than do businesshouseholds or those depending on wage labor. Wage laborhouseholds are more likely to start out poor, but holding con-stant that initial level, they are no less likely than equivalentcultivating or business households to escape poverty—norno more likely to fall into poverty if starting as non-poor.Nor are households primarily receiving remittances, govern-ment benefits, or property income very different, althoughour samples of those households are especially small so anyconclusions about their transitions must be especially tenta-tive.Among cultivators, there is some evidence that larger
landowners may have been better off due to their asset stabil-ity; the more land owned the lower the risks of falling intopoverty and the greater the chances of escaping poverty. Butmore importantly, access to irrigation reduced subsequentpoverty risks for cultivators, as they are not dependant on
seasonal rains for their water needs. As Table 1 shows,landowners with irrigation are 0.651 times as likely to fall intopoverty as compared to those landowners who depend on sea-sonal rains. Irrigation was even helpful for cultivators escap-ing poverty, increasing their odds to 1.277 times the odds ofmore rain-dependent cultivators.
(v) FinancesAs would be expected, bank accounts help prevent falls into
consumption poverty and are significant also for rising out ofpoverty. The expansion of banking across India offers a majoropportunity to reduce the volatility of poverty transitions.Membership in a credit society appears less successful insmoothing out consumption volatility in order to avoid pov-erty. The IHDS results also confirm the importance of debtas a source of falling into poverty: Nonpoor householdswho report having some debt in 2004–05 have a 26% greaterchance of having fallen into poverty seven years later; debtsdid not lower or raise the chances of poor households escapingpoverty between the two surveys.
(vi) Household structureLarger households have less chance of falling into poverty
and more chance of escaping poverty once there. More peoplemay mean more labor resources for the future and a greaterflexibility to utilize all household resources. Similarly, a higherdependency ratio in 2005 also raises the chances of escapingpoverty or not falling into poverty in the next seven years. Thismay seem counter-intuitive at first since cross sectionally, thefewer household members who work, the more likely thehousehold is to be in poverty. But some of these dependentsin 2005 can later enter the labor force, especially young menwho finish their education, thus enabling the household toescape poverty or to avoid falling back into poverty. Andyoung women may finish their schooling and marry out ofthe household thus raising the per capita consumption levels.Measurement issues may play a role in the household-size rela-tionship since the poverty line is drawn on the basis of con-sumption per capita, so that larger households have a largerdenominator. But, as we see in the robustness checks, povertymeasures with lower penalties for household size also showlarger households had higher rates of transition out of povertyand less chance of falling into poverty.
(vii) Selection effects and distance from the poverty lineNot surprisingly, the further above the poverty line a house-
hold is, the lower its risk of falling into poverty seven yearslater. And poor households closest to the poverty line arethe ones most likely to escape poverty. Some of this beneficialeffect can be attributed to other characteristics of those house-holds, higher in per capita consumption: they tend to be bettereducated, more likely to have a salaried job, and more likely toown irrigated land. But the remaining importance of absolutelevels of per capita consumption reminds us that the poor andthe non-poor are not discrete categories but necessarily some-what arbitrary lines drawn in a consumption continuum. Con-trolling for the household position on this continuum isnevertheless important since other differences, for instance,between Dalit and Forward Caste households, are often morea result of the fact that poor Dalit households are muchpoorer than the poor Forward Caste households. It is as muchtheir greater poverty than their Dalit status that holds themback from escaping poverty or increases their risks of fallingback into poverty.The probability of a household being re-interviewed is
positively related to a higher risk of falling into poverty
ESCAPING AND FALLING INTO POVERTY IN INDIA TODAY 421
or not escaping poverty. Re-interviewed households are insome ways similar to households at greater risk. This maybe somewhat surprising since poverty in 2004–05 is corre-lated with attrition between the two surveys. Re-interviewed households have much in common with themeasured social and economic characteristics of householdsat less risk of falling into poverty. Larger rural householdswith more land were more often re-interviewed in 2011–12;households with less property ties to their villages andneighborhoods were more likely to have left after sevenyears. The positive association between likelihood of attri-tion and escapes from poverty only appears after these otherfactors are held constant. The types of households who werenot found—who had migrated out of their original villagesor urban neighborhoods—resembled households whoimproved their economic position over the next seven years.This resemblance may also suggest that unmeasured charac-teristics of households who improved may be similar to theunmeasured characteristics of households who left theiroriginal homes to make a better life somewhere else. Inany case, the results show some evidence of selection effectsthat temper our results somewhat because out-migrants arenot included in the sample.
(viii) Robustness checksPoverty definitions have long been an intense focus of
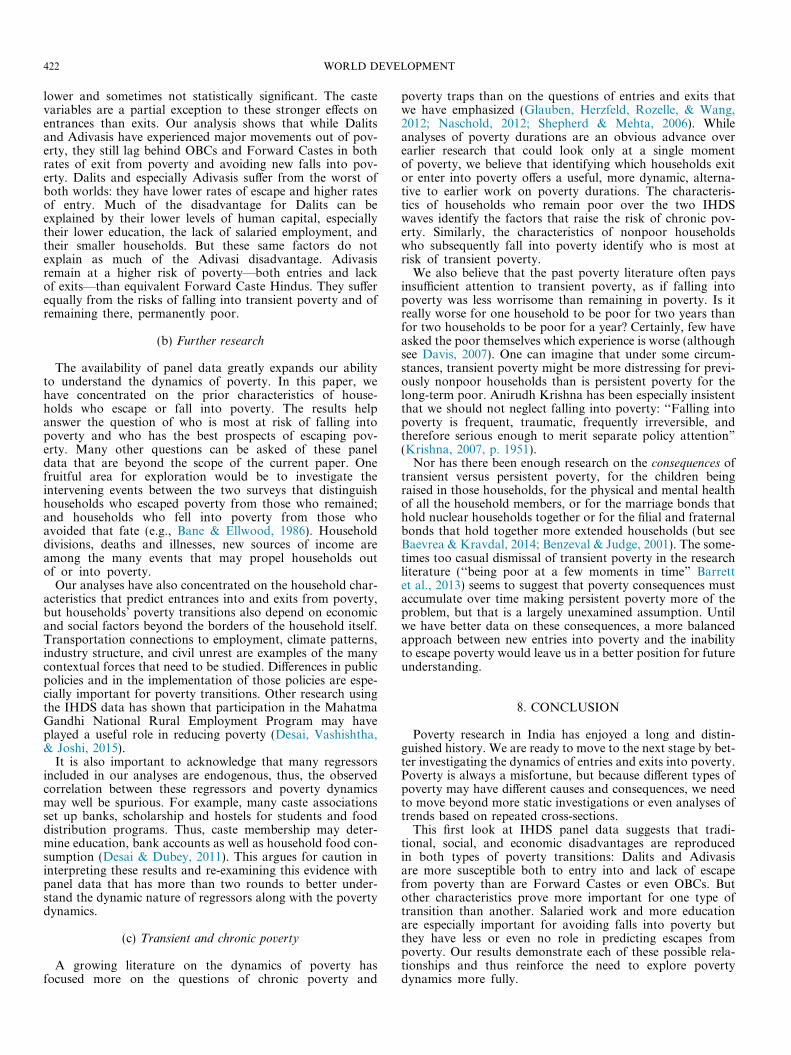
debate both internationally (Atkinson, in press) and in India(Deaton & Kozel, 2005). For our analysis of transitions intoand out of poverty, the important question is whether differentdefinitions would yield different conclusions. Our robustnesschecks vary assumptions about economies of scale, aboutwhere to draw the poverty line, and about which economicdimension (consumption, income, or assets) is used to definepoverty. Results for each of these measures are reported inTables 4. For the most part, the main conclusions describedabove are not affected by the choice of poverty measure. Forexample, salaried employment protects against falls into severepoverty or into near poverty; whether consumption, income,or assets are used to rank households; and whether householdsize is adjusted to a per capita measure or less drastically to an‘‘equivalenced” measure using the square root of householdsize. Nor do any of these alternative poverty measures revealmuch effect of salaried employment on the odds of escapingpoverty once there.Some exceptions to the main patterns are understandable.
For example, having a bank account protects against falls intoconsumption poverty or into asset poverty, but not so clearlyagainst falls into income poverty. Also, poverty status betweenthe two surveys is more stable when poverty is measured interms of household assets rather than household consumption:using asset poverty, only 4% of Indians became newly poorbetween the two surveys and only 19% left poverty. The corre-sponding percentages for consumption poverty were 7% and29%.
7. DISCUSSION
Our IHDS results reaffirm the conclusions that poverty hasindeed fallen substantially over this seven-year period. In addi-tion, they enable us to quantify the household transitions bothout of but also into poverty despite the overall trend. We findthat the majority (65%) of households who were poor in 2005had escaped poverty by 2012. This is a remarkable achieve-ment that documents how even the poor shared economicprosperity during these times.
Their successes were only partially offset by the 14% of thenon-poor who fell into poverty during this period. Thesenewly poor, however, raise the issue of transient poverty.Not all the poor have always been poor, and public policyresponses to the transient poor may need to be quite differentfrom policies for the long-term poor (Krishna, 2007). Never-theless, long-term poverty remains a problem. Despite the factthat most of the 2005 poor had escaped poverty by 2012, mostof the households who were poor in 2012 had also been poorin 2005.
(a) Falling into poverty versus exiting from poverty
A household’s level of human and physical capital is moreimportant in explaining who avoids falling into poverty thanexplaining which poor households escape poverty. Not sur-prisingly, more education reduces not only levels of povertybut also especially new entrances into poverty. Higher educa-tion also enhances exits from poverty but at a lower rate thanreducing new entrants. While neither entering nor remainingin poverty is common among the best educated, educationreduces poverty more because it reduces falls into povertyrather than helping families escape. The best educated neverexperience poverty at all. Or, to observe from the other end,illiteracy both raises the risk of falling into poverty andreduces the chances of escaping, but the effect on falling intopoverty is much greater than the effect on remaining in pov-erty. As a consequence, the illiterate are especially vulnerableto spells of poverty.Salaried employment reduces poverty in much the same
way. Households with a salary income have a steady andreliable source of support that cushions them against eco-nomic misfortune. They rarely fall into poverty althoughon the rare instance when that happens, they are littlemore likely to emerge quickly than are farmers or businessowners.Irrigated land protects farmers in much the same way as
higher education or a salaried income protects all households.Farmers with irrigation are less likely to fall into poverty thansmall farmers without irrigation, but for the minority whohave become poor, these assets are somewhat helpful in escap-ing poverty.Rural areas also have higher poverty rates primarily because
rural households are more likely to fall into poverty. An agri-cultural base induces dependency on the fluctuations of sea-sonal weather patterns, and these fluctuations drive ruralhouseholds into poverty more frequently than urban house-holds. These fluctuations may be increasing in frequency, suchas fluctuations in the Indian monsoon rains, and could be amanifestation of global climate change. However, rural house-holds escape poverty at rates not much different than urbanhouseholds; in fact in the reduced form model the rural–urbandifference is not statistically significant. So, rural poverty isdisproportionately a problem of higher risks of falling intopoverty. This higher risk is explained by the opportunitiesavailable to rural households: less educated, less of a chancefor salaried jobs, fewer bank accounts; these and other differ-ences are important enough that in the full model comparingurban and rural households with equivalent characteristics,it is the urban residents who have a higher risk of falling intopoverty.These background factors in 2005 are somewhat better at
predicting which households avoid falling into poverty thanidentifying households who escape from poverty. For themost part, the measures that predict exiting poverty, alsopredict not falling into poverty, but the odds are generally
422 WORLD DEVELOPMENT
lower and sometimes not statistically significant. The castevariables are a partial exception to these stronger effects onentrances than exits. Our analysis shows that while Dalitsand Adivasis have experienced major movements out of pov-erty, they still lag behind OBCs and Forward Castes in bothrates of exit from poverty and avoiding new falls into pov-erty. Dalits and especially Adivasis suffer from the worst ofboth worlds: they have lower rates of escape and higher ratesof entry. Much of the disadvantage for Dalits can beexplained by their lower levels of human capital, especiallytheir lower education, the lack of salaried employment, andtheir smaller households. But these same factors do notexplain as much of the Adivasi disadvantage. Adivasisremain at a higher risk of poverty—both entries and lackof exits—than equivalent Forward Caste Hindus. They sufferequally from the risks of falling into transient poverty and ofremaining there, permanently poor.
(b) Further research
The availability of panel data greatly expands our abilityto understand the dynamics of poverty. In this paper, wehave concentrated on the prior characteristics of house-holds who escape or fall into poverty. The results helpanswer the question of who is most at risk of falling intopoverty and who has the best prospects of escaping pov-erty. Many other questions can be asked of these paneldata that are beyond the scope of the current paper. Onefruitful area for exploration would be to investigate theintervening events between the two surveys that distinguishhouseholds who escaped poverty from those who remained;and households who fell into poverty from those whoavoided that fate (e.g., Bane & Ellwood, 1986). Householddivisions, deaths and illnesses, new sources of income areamong the many events that may propel households outof or into poverty.Our analyses have also concentrated on the household char-
acteristics that predict entrances into and exits from poverty,but households’ poverty transitions also depend on economicand social factors beyond the borders of the household itself.Transportation connections to employment, climate patterns,industry structure, and civil unrest are examples of the manycontextual forces that need to be studied. Differences in publicpolicies and in the implementation of those policies are espe-cially important for poverty transitions. Other research usingthe IHDS data has shown that participation in the MahatmaGandhi National Rural Employment Program may haveplayed a useful role in reducing poverty (Desai, Vashishtha,& Joshi, 2015).It is also important to acknowledge that many regressors
included in our analyses are endogenous, thus, the observedcorrelation between these regressors and poverty dynamicsmay well be spurious. For example, many caste associationsset up banks, scholarship and hostels for students and fooddistribution programs. Thus, caste membership may deter-mine education, bank accounts as well as household food con-sumption (Desai & Dubey, 2011). This argues for caution ininterpreting these results and re-examining this evidence withpanel data that has more than two rounds to better under-stand the dynamic nature of regressors along with the povertydynamics.
(c) Transient and chronic poverty
A growing literature on the dynamics of poverty hasfocused more on the questions of chronic poverty and
poverty traps than on the questions of entries and exits thatwe have emphasized (Glauben, Herzfeld, Rozelle, & Wang,2012; Naschold, 2012; Shepherd & Mehta, 2006). Whileanalyses of poverty durations are an obvious advance overearlier research that could look only at a single momentof poverty, we believe that identifying which households exitor enter into poverty offers a useful, more dynamic, alterna-tive to earlier work on poverty durations. The characteris-tics of households who remain poor over the two IHDSwaves identify the factors that raise the risk of chronic pov-erty. Similarly, the characteristics of nonpoor householdswho subsequently fall into poverty identify who is most atrisk of transient poverty.We also believe that the past poverty literature often pays
insufficient attention to transient poverty, as if falling intopoverty was less worrisome than remaining in poverty. Is itreally worse for one household to be poor for two years thanfor two households to be poor for a year? Certainly, few haveasked the poor themselves which experience is worse (althoughsee Davis, 2007). One can imagine that under some circum-stances, transient poverty might be more distressing for previ-ously nonpoor households than is persistent poverty for thelong-term poor. Anirudh Krishna has been especially insistentthat we should not neglect falling into poverty: ‘‘Falling intopoverty is frequent, traumatic, frequently irreversible, andtherefore serious enough to merit separate policy attention”(Krishna, 2007, p. 1951).Nor has there been enough research on the consequences of
transient versus persistent poverty, for the children beingraised in those households, for the physical and mental healthof all the household members, or for the marriage bonds thathold nuclear households together or for the filial and fraternalbonds that hold together more extended households (but seeBaevrea & Kravdal, 2014; Benzeval & Judge, 2001). The some-times too casual dismissal of transient poverty in the researchliterature (‘‘being poor at a few moments in time” Barrettet al., 2013) seems to suggest that poverty consequences mustaccumulate over time making persistent poverty more of theproblem, but that is a largely unexamined assumption. Untilwe have better data on these consequences, a more balancedapproach between new entries into poverty and the inabilityto escape poverty would leave us in a better position for futureunderstanding.
8. CONCLUSION
Poverty research in India has enjoyed a long and distin-guished history. We are ready to move to the next stage by bet-ter investigating the dynamics of entries and exits into poverty.Poverty is always a misfortune, but because different types ofpoverty may have different causes and consequences, we needto move beyond more static investigations or even analyses oftrends based on repeated cross-sections.This first look at IHDS panel data suggests that tradi-
tional, social, and economic disadvantages are reproducedin both types of poverty transitions: Dalits and Adivasisare more susceptible both to entry into and lack of escapefrom poverty than are Forward Castes or even OBCs. Butother characteristics prove more important for one type oftransition than another. Salaried work and more educationare especially important for avoiding falls into poverty butthey have less or even no role in predicting escapes frompoverty. Our results demonstrate each of these possible rela-tionships and thus reinforce the need to explore povertydynamics more fully.
ESCAPING AND FALLING INTO POVERTY IN INDIA TODAY 423
NOTES
1. These estimates are based on the ‘‘thick” rounds of ConsumptionExpenditure Survey for 2004–05 and 2011–12 conducted by the NationalSample Survey Organisation. Planning Commission of India Press Release
2. NSS—Consumption Expenditure Data is a large countrywide samplesurvey conducted every 5 years and collects household-level informationon rupee expenditure on consumed items. This household consumptionexpenditure is then used as a proxy for the household’s monthly income.
3. The Government of India appointed a committee under the chair-manship of the Suresh Tendulkar. The Committee reviewed the existing
methodology of estimating poverty in India and recommended newpoverty lines for the rural and urban areas (Planning Commission, 2009).For details of methodology, click link to online the report (TendulkarCommittee Report Online)
4. Thus, the coefficient for having a bank account reflects theimportance of banks only for the 82% of households with eligiblewomen; we cannot test whether the estimate would be different inother households. The value of the substituted mean, 0.36, has noeffect on this coefficient but determines the size of the eligible womandummy coefficient.
REFERENCES
Aldeman, I., Subbarao, K., & Vashishtha, P. (1985). Some dynamicaspects of rural poverty in India. Economic and Political Weekly, 20(39), A103–A116.
Atkinson, T. et al. (in press). Commission on global poverty: Report onmeasuring poverty. Washington DC: World Bank.
Baevrea, K., & Kravdal, O. (2014). The effects of earlier income variationon mortality: An analysis of Norwegian register data. PopulationStudies, 68(1), 81–94.
Bane, M. J., & Ellwood, D. T. (1986). Slipping into and out ofpoverty: The dynamics of spells. Journal of Human Resources, 21(1),1–23.
Barrett, C. B., Little, P., Carter, M. (2013). Understanding and reducingpersistent poverty in Africa. Routledge.
Baulch, B., & McCulloch, N. (2002). Being poor and becoming poor:Poverty status and poverty transitions in rural Pakistan. Journal ofAsian and African Studies, 37(2), 168–185.
Benzeval, M., & Judge, K. (2001). Income and health: The timedimension. Social Science & Medicine, 52(9), 1371–1390.
Bhide, S., & Mehta, A. K. (2008). Economic growth and povertydynamics. Chronic Poverty Research Centre Working Paper, 120.
Davis, P. (2007). Discussions among the poor: Exploring poverty dynamicswith focus groups in Bangladesh, Working paper. London: ChronicPoverty Research Centre, Number 84.
Deaton, A., & Kozel, V. (2005). Data and dogma: The great Indianpoverty debate. World Bank Research Observer, 20(2), 177–199.
Desai, S., & Dubey, A. (2011). Caste in 21st century India: Competingnarratives. Economic and Political Weekly, 46(11), 40–49.
Desai, S. B., Dubey, A., Joshi, B. L., Sen, M., Shariff, A., & Vanneman, R.(2010). Human development in India: Challenges for a society intransition. New Delhi: Oxford University Press.
Desai, S., Vashishtha, P., & Joshi, O. (2015). Mahatma GandhiNational Rural Employment Guarantee Act: A catalyst for ruraltransformation. New Delhi: National Council of Applied EconomicResearch.
Dhamija, N., & Bhide, S. (2013). Poverty in rural India: Variations infactors influencing dynamics of chronic poverty. Journal of Interna-tional Development, 25(5), 674–695.
Gaiha, R. (1989). Are the chronically poor also the poorest in rural India?.Development and Change, 20(2), 295–322.
Gaiha, R., & Imai, K. (2004). Vulnerability, shocks and persistence ofpoverty: Estimates for semi-arid rural South India. Oxford Develop-ment Studies, 32(2), 261–281.
Glauben, T., Herzfeld, T., Rozelle, S., & Wang, X. (2012). Persistentpoverty in rural China: Where, why, and how to escape?. WorldDevelopment, 40(4), 784–795.
Hatlebakk, M. (2014). Poverty dynamics in rural Orissa: Transitions inassets and occupations over generations. Journal of DevelopmentStudies, 50(6), 877–893.
Himanshu 2010 Planning Commission. Report on construction of Ten-dulkar poverty lines <http://planningcommission.nic.in/reports/gen-rep/himanshu.pdf>.
India Human Development Survey (2016). http://ihds.info/IHDS-II.Krishna, A. (2003). Falling into poverty: Other side of poverty reduction.
Economic and Political Weekly, 8, 533–542.Krishna, A. (2007). For reducing poverty faster: Target reasons before
people. World Development, 35(11), 1947–1960.Krishna, A. (2010). One illness away: Why people become poor and how
they escape poverty. New York: Oxford University Press.Krishna, A., & Shariff, A. (2011). The irrelevance of national strategies?
Rural poverty dynamics in states and regions of India, 1993–2005.World Development, 39(4), 533–549.
Krishna, A., Kapila, M., Porwal, M., & Singh, V. (2005). Why growth isnot enough: Household poverty dynamics in Northeast Gujarat, India.Journal of Development Studies, 41(7), 1163–1192.
Mehta, A. K., & Bhide, S. (2003). Issues in chronic poverty: Panel databased analysis. Chronic Poverty Research Centre Working Paper.
Naschold, F. (2012). ‘‘The poor stay poor”: Household asset poverty trapsin rural semi-arid India. World Development, 40(10), 2033–2043.
Planning Commission (2009). Report of the expert group to review themethodology for estimation of poverty. Government of India.
Shepherd, A., & Mehta, A. K. (2006). Chronic poverty in India. In A. K.Mehta, & A. Shepherd (Eds.), Chronic poverty and development policyin India (pp. 23–52). New Delhi: Sage.
Singh, R. P., & Binswanger, H. P. (1993). Income growth in poor drylandareas of India’s semi-arid tropics. Indian Journal of AgriculturalEconomics, 48(1), 51.
Thorat, S., & Dubey, A. (2012). Has growth been socially inclusive during1993-94–2009-10. Economic and Political Weekly, 47(10), 43–53.
424 WORLD DEVELOPMENT
APPENDIX A.
Table 2. Descrip
Variable Observations Mean
Rural/Urban 38,853 0.31498Social Group 38,853 2.087Religious Group 38,853 1.2626Education level (6) 38,803 6.5732Social Network 38,853 0.55161Main Income Source 38,853 3.1622Land owned or not 38,853 0.98422Agri. Land owned 38,853 �1.348Irrigation 38,853 0.22914Membership to credit society 38,797 0.07186Current Debt 38,586 0.44316HH has Bank A/C 38,853 0.36298Eligible women absent 38,853 0.17473Log Poverty Ratio 38,809 0.26686HH Size 38,853 5.8490Percentage of Non-workers 38,853 0.5705
Source: Authors’ calculations from the Indian Human Development Survey.Note: Observations have been weighted according to weights in the file to refl
Table 3. Probit analysis of attr
Coeff.
Urban 0.4141Any farm land �0.3104Highest adult education 0.0073# of household assets 0.0099Household size �0.1320
Religion (ref = Hindu)
Muslim 0.0944Christian 0.0512Sikh 0.0201Other 0.0741Caste (ref = Forward)OBC �0.0445Dalit 0.0588Adivasi 0.1007
Month of interview (
February �0.0628March �0.0653April �0.0891May �0.0062June �0.0437July 0.0513August 0.1940September 0.3303October �0.0393November 0.0465December �0.0421
States (ref = Tamil Nadu)
Jammu & Kashmir �0.2360Himachal Pradesh �0.1484Uttarakhand �0.0196Punjab 0.0171Haryana 0.1009Delhi 0.5909Uttar Pradesh 0.0923Bihar 0.1424Jharkhand 0.3116
tive statistics
Std. Dev. Min Max
21 0.4645147 0 12 0.9196115 1 405 0.6186895 1 455 5.011102 0 1576 0.4973349 0 178 1.699679 1 926 0.124615 0 1687 1.312536 �7.119252 4.39367358 0.4202886 0 112 0.2582613 0 159 0.4967658 0 146 0.4370041 0 155 0.3797456 0 165 0.6383013 �4.78343 4.52940172 2.996175 1 3882 0.2316604 0 1
ect the 2011 Indian population.
ition between survey waves
Std. err.
*** 0.0218*** 0.0207** 0.0022*** 0.0020*** 0.0042
*** 0.02700.04640.06660.0581
+ 0.0233+ 0.0354*** 0.0206
ref = January)
0.04820.05700.05810.05810.05810.0588
** 0.0602*** 0.0735
0.07980.05390.0529
** 0.0813* 0.0666
0.08980.0609
+ 0.0591*** 0.0654
0.0617* 0.0713*** 0.0637
(continued on next page)
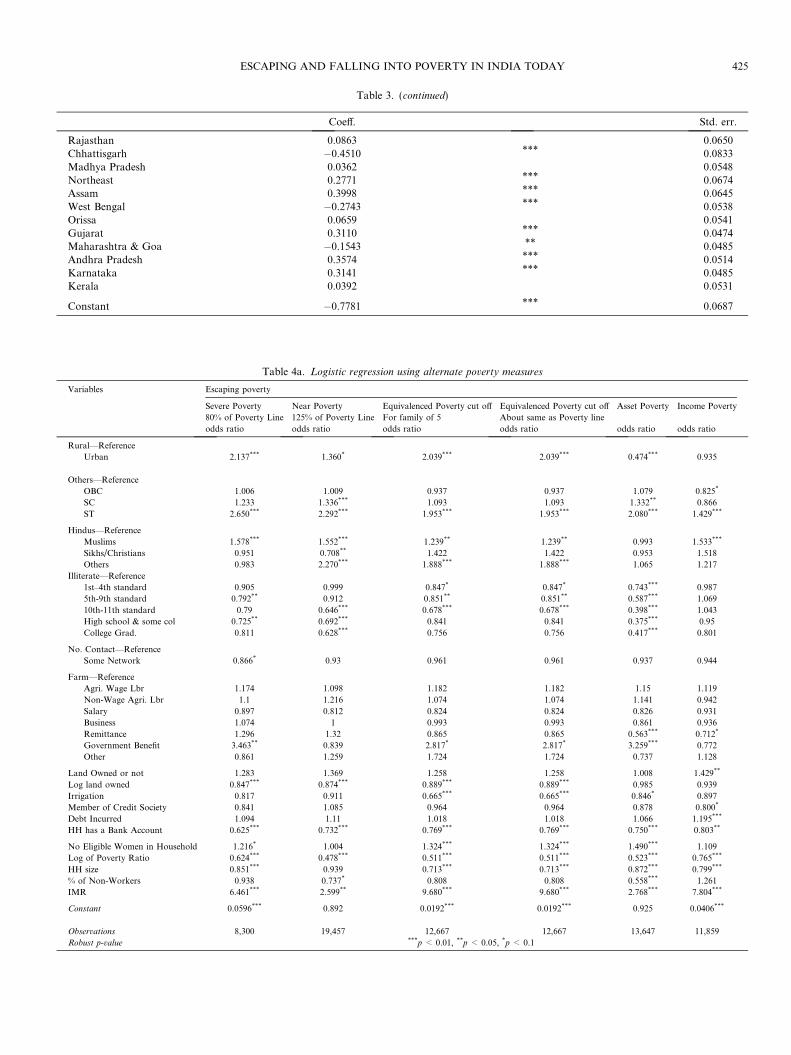
Table 4a. Logistic regression using alternate poverty measures
Variables Escaping poverty
Severe Poverty Near Poverty Equivalenced Poverty cut off Equivalenced Poverty cut off Asset Poverty Income Poverty
80% of Poverty Line 125% of Poverty Line For family of 5 About same as Poverty line
odds ratio odds ratio odds ratio odds ratio odds ratio odds ratio
Rural—Reference
Urban 2.137*** 1.360* 2.039*** 2.039*** 0.474*** 0.935
Others—Reference
OBC 1.006 1.009 0.937 0.937 1.079 0.825*
SC 1.233 1.336*** 1.093 1.093 1.332** 0.866
ST 2.650*** 2.292*** 1.953*** 1.953*** 2.080*** 1.429***
Hindus—Reference
Muslims 1.578*** 1.552*** 1.239** 1.239** 0.993 1.533***
Sikhs/Christians 0.951 0.708** 1.422 1.422 0.953 1.518
Others 0.983 2.270*** 1.888*** 1.888*** 1.065 1.217
Illiterate—Reference
1st–4th standard 0.905 0.999 0.847* 0.847* 0.743*** 0.987
5th-9th standard 0.792** 0.912 0.851** 0.851** 0.587*** 1.069
10th-11th standard 0.79 0.646*** 0.678*** 0.678*** 0.398*** 1.043
High school & some col 0.725** 0.692*** 0.841 0.841 0.375*** 0.95
College Grad. 0.811 0.628*** 0.756 0.756 0.417*** 0.801
No. Contact—Reference
Some Network 0.866* 0.93 0.961 0.961 0.937 0.944
Farm—Reference
Agri. Wage Lbr 1.174 1.098 1.182 1.182 1.15 1.119
Non-Wage Agri. Lbr 1.1 1.216 1.074 1.074 1.141 0.942
Salary 0.897 0.812 0.824 0.824 0.826 0.931
Business 1.074 1 0.993 0.993 0.861 0.936
Remittance 1.296 1.32 0.865 0.865 0.563*** 0.712*
Government Benefit 3.463** 0.839 2.817* 2.817* 3.259*** 0.772
Other 0.861 1.259 1.724 1.724 0.737 1.128
Land Owned or not 1.283 1.369 1.258 1.258 1.008 1.429**
Log land owned 0.847*** 0.874*** 0.889*** 0.889*** 0.985 0.939
Irrigation 0.817 0.911 0.665*** 0.665*** 0.846* 0.897
Member of Credit Society 0.841 1.085 0.964 0.964 0.878 0.800*
Debt Incurred 1.094 1.11 1.018 1.018 1.066 1.195***
HH has a Bank Account 0.625*** 0.732*** 0.769*** 0.769*** 0.750*** 0.803**
No Eligible Women in Household 1.216* 1.004 1.324*** 1.324*** 1.490*** 1.109
Log of Poverty Ratio 0.624*** 0.478*** 0.511*** 0.511*** 0.523*** 0.765***
HH size 0.851*** 0.939 0.713*** 0.713*** 0.872*** 0.799***
% of Non-Workers 0.938 0.737* 0.808 0.808 0.558*** 1.261
IMR 6.461*** 2.599** 9.680*** 9.680*** 2.768*** 7.804***
Constant 0.0596*** 0.892 0.0192*** 0.0192*** 0.925 0.0406***
Observations 8,300 19,457 12,667 12,667 13,647 11,859
Robust p-value ***p < 0.01, **p < 0.05, *p < 0.1
Table 3. (continued)
Coeff. Std. err.
Rajasthan 0.0863 0.0650Chhattisgarh �0.4510 *** 0.0833Madhya Pradesh 0.0362 0.0548Northeast 0.2771 *** 0.0674Assam 0.3998 *** 0.0645West Bengal �0.2743 *** 0.0538Orissa 0.0659 0.0541Gujarat 0.3110 *** 0.0474Maharashtra & Goa �0.1543 ** 0.0485Andhra Pradesh 0.3574 *** 0.0514Karnataka 0.3141 *** 0.0485Kerala 0.0392 0.0531
Constant �0.7781 *** 0.0687
ESCAPING AND FALLING INTO POVERTY IN INDIA TODAY 425
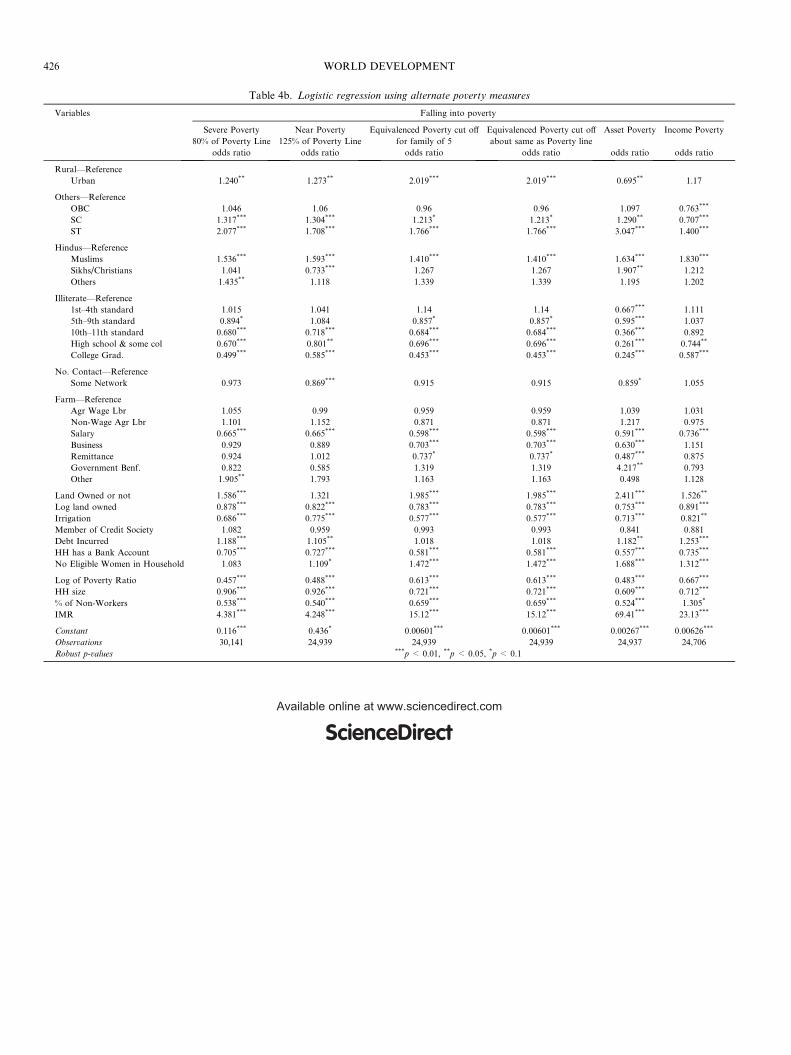
Table 4b. Logistic regression using alternate poverty measures
Variables Falling into poverty
Severe Poverty Near Poverty Equivalenced Poverty cut off Equivalenced Poverty cut off Asset Poverty Income Poverty
80% of Poverty Line 125% of Poverty Line for family of 5 about same as Poverty line
odds ratio odds ratio odds ratio odds ratio odds ratio odds ratio
Rural—Reference
Urban 1.240** 1.273** 2.019*** 2.019*** 0.695** 1.17
Others—Reference
OBC 1.046 1.06 0.96 0.96 1.097 0.763***
SC 1.317*** 1.304*** 1.213* 1.213* 1.290** 0.707***
ST 2.077*** 1.708*** 1.766*** 1.766*** 3.047*** 1.400***
Hindus—Reference
Muslims 1.536*** 1.593*** 1.410*** 1.410*** 1.634*** 1.830***
Sikhs/Christians 1.041 0.733*** 1.267 1.267 1.907** 1.212
Others 1.435** 1.118 1.339 1.339 1.195 1.202
Illiterate—Reference
1st–4th standard 1.015 1.041 1.14 1.14 0.667*** 1.111
5th–9th standard 0.894* 1.084 0.857* 0.857* 0.595*** 1.037
10th–11th standard 0.680*** 0.718*** 0.684*** 0.684*** 0.366*** 0.892
High school & some col 0.670*** 0.801** 0.696*** 0.696*** 0.261*** 0.744**
College Grad. 0.499*** 0.585*** 0.453*** 0.453*** 0.245*** 0.587***
No. Contact—Reference
Some Network 0.973 0.869*** 0.915 0.915 0.859* 1.055
Farm—Reference
Agr Wage Lbr 1.055 0.99 0.959 0.959 1.039 1.031
Non-Wage Agr Lbr 1.101 1.152 0.871 0.871 1.217 0.975
Salary 0.665*** 0.665*** 0.598*** 0.598*** 0.591*** 0.736***
Business 0.929 0.889 0.703*** 0.703*** 0.630*** 1.151
Remittance 0.924 1.012 0.737* 0.737* 0.487*** 0.875
Government Benf. 0.822 0.585 1.319 1.319 4.217** 0.793
Other 1.905** 1.793 1.163 1.163 0.498 1.128
Land Owned or not 1.586*** 1.321 1.985*** 1.985*** 2.411*** 1.526**
Log land owned 0.878*** 0.822*** 0.783*** 0.783*** 0.753*** 0.891***
Irrigation 0.686*** 0.775*** 0.577*** 0.577*** 0.713*** 0.821**
Member of Credit Society 1.082 0.959 0.993 0.993 0.841 0.881
Debt Incurred 1.188*** 1.105** 1.018 1.018 1.182** 1.253***
HH has a Bank Account 0.705*** 0.727*** 0.581*** 0.581*** 0.557*** 0.735***
No Eligible Women in Household 1.083 1.109* 1.472*** 1.472*** 1.688*** 1.312***
Log of Poverty Ratio 0.457*** 0.488*** 0.613*** 0.613*** 0.483*** 0.667***
HH size 0.906*** 0.926*** 0.721*** 0.721*** 0.609*** 0.712***
% of Non-Workers 0.538*** 0.540*** 0.659*** 0.659*** 0.524*** 1.305*
IMR 4.381*** 4.248*** 15.12*** 15.12*** 69.41*** 23.13***
Constant 0.116*** 0.436* 0.00601*** 0.00601*** 0.00267*** 0.00626***
Observations 30,141 24,939 24,939 24,939 24,937 24,706
Robust p-values ***p < 0.01, **p < 0.05, *p < 0.1
426 WORLD DEVELOPMENT
ScienceDirectAvailable online at www.sciencedirect.com