ESC International Conference on Critical Infrastructure Protection A Computational Asset...
37
ESC International Conference on Critical Infrastructure Protection A Computational Asset Vulnerability Model for Strategic Protection of Critical Infrastructure Richard White, Terrance Boult, and C. Edward Chow A Decision Support Tool for a Computational Unified Homeland Security Strategy Richard White, Aaron M. Burkhart, C. Edward Chow, and Logan L. Maynard Presented by C. Edward Chow International Federation for Information Processing Eighth Annual Working Group SRI International Arlington, VA March 17-19, 2014 1
-
Upload
reynard-mitchell -
Category
Documents
-
view
232 -
download
0
Transcript of ESC International Conference on Critical Infrastructure Protection A Computational Asset...
ESC
International Conference on Critical Infrastructure Protection
A Computational Asset Vulnerability Model for Strategic Protection of Critical Infrastructure
Richard White, Terrance Boult, and C. Edward Chow
A Decision Support Tool for a Computational Unified Homeland Security Strategy
Richard White, Aaron M. Burkhart, C. Edward Chow, and Logan L. Maynard
Presented by C. Edward Chow
International Federation for Information ProcessingEighth Annual Working GroupSRI InternationalArlington, VAMarch 17-19, 2014
1
ESC
Presentation Outline
1. Asset Vulnerability Model2. AVM Analysis of Alternative Critical
Infrastructure Protection Investment Strategies
3. AVM Decision Support Tool
2
ESC
1Asset Vulnerability Model
3

ESC
2001, Attacks on World Trade Center and PentagonExposed vulnerability of critical infrastructure.
2002, Homeland Security ActMade critical infrastructure protection Department of Homeland Security mission
2010, National Research Council Report“did not find any DHS risk analysis capabilities and methods that are yet adequate for supporting DHS decision making”
Motivations
4
2002 HSA 2005 INIPP (I & II) 2006 NIPP 2009 NIPP 2013 NIPP
ESC
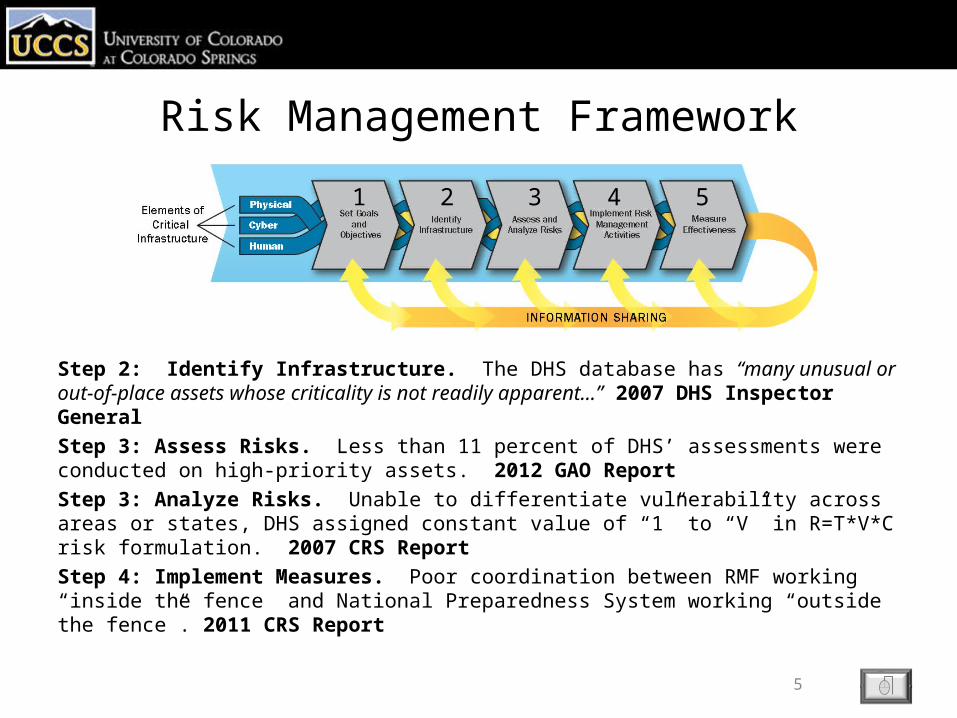
Risk Management Framework
Step 2: Identify Infrastructure. The DHS database has “many unusual or out-of-place assets whose criticality is not readily apparent...” 2007 DHS Inspector GeneralStep 3: Assess Risks. Less than 11 percent of DHS’ assessments were conducted on high-priority assets. 2012 GAO ReportStep 3: Analyze Risks. Unable to differentiate vulnerability across areas or states, DHS assigned constant value of “1” to “V” in R=T*V*C risk formulation. 2007 CRS ReportStep 4: Implement Measures. Poor coordination between RMF working “inside the fence” and National Preparedness System working “outside the fence”. 2011 CRS Report
5
1 2 3 4 5
ESC
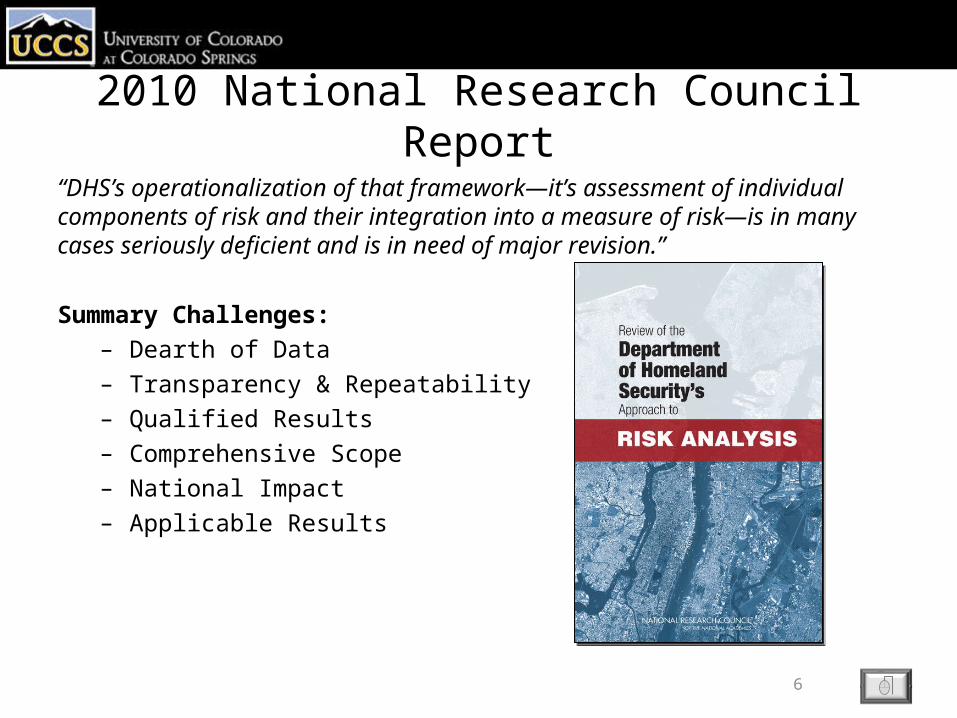
2010 National Research Council Report
“DHS’s operationalization of that framework—it’s assessment of individual components of risk and their integration into a measure of risk—is in many cases seriously deficient and is in need of major revision.”
Summary Challenges:– Dearth of Data– Transparency & Repeatability– Qualified Results– Comprehensive Scope– National Impact– Applicable Results
6

ESC
Infrastructure Risk Models
7
1. AIMS 8. CIPDSS*^ 15. EMCAs 22. KM&V 29. NEXUS-FF 36. RVA*+^
2. Athena 9. CIPMA^ 16. EURACOM^ 23. MDM+ 30. NGtools 37. SRAM*
3. BIRR*^ 10. CISIA 17. FAIT^ 24. MIN+^ 31. NSRAM* 38. TRAGIS
4. BMI* 11. CommAspen+^ 18. FINSIM 25. MUNICIPAL 32. PFNAM 39. TRANSIMS
5. CAPRA*+^- 12. COUNTERACT* 19. Fort Future 26. N-ABLE+ 33. RAMCAP-Plus* 40. UIS
6. CARVER2™^ 13. DECRIS*^ 20. IEISS 27. NEMO 34. RMCIS*^ 41. WISE
7. CIMS^ 14. DEW 21. IIM 28. Net-Centric GIS 35. RMF (DHS)* +^-
250 reported infrastructure risk models 41 (listed above) identified in two summary reports 22 (highlighted) offered information to draw some inferences 12 (identified with *) employed a threat-driven risk methodology 7 (identified with +) were described as “complicated” 14 (identified with ^) did not address “resiliency” 2 (identified with -) did not capture broader impacts of disaster 0 overcame challenges cited by National Research Council report

ESC
Asset Vulnerability Model
1. Baseline AnalysisΘ = P(dis)*P(def)*P(den)*P(dim)*%(dam)
2. Cost-Benefit AnalysisΔΘ = P(Δdis)*P(Δdef)*P(Δden)*P(Δdim)*%(dam)
3. Decision Support Tools
8

ESC
Choice of Metric• 1988 Sandler & Lapan research used
game theory to examine attacker’s choice of target.
• Findings:– A coordinated defense is more efficient
than an uncoordinated one.– The optimum defense strategy is to
protect all targets equally, not necessarily maximally,
• Attacker’s choice depended on perceived probability of failure, S&L designated as θ.
9
Sandler & Lapan Attack Model
ESC
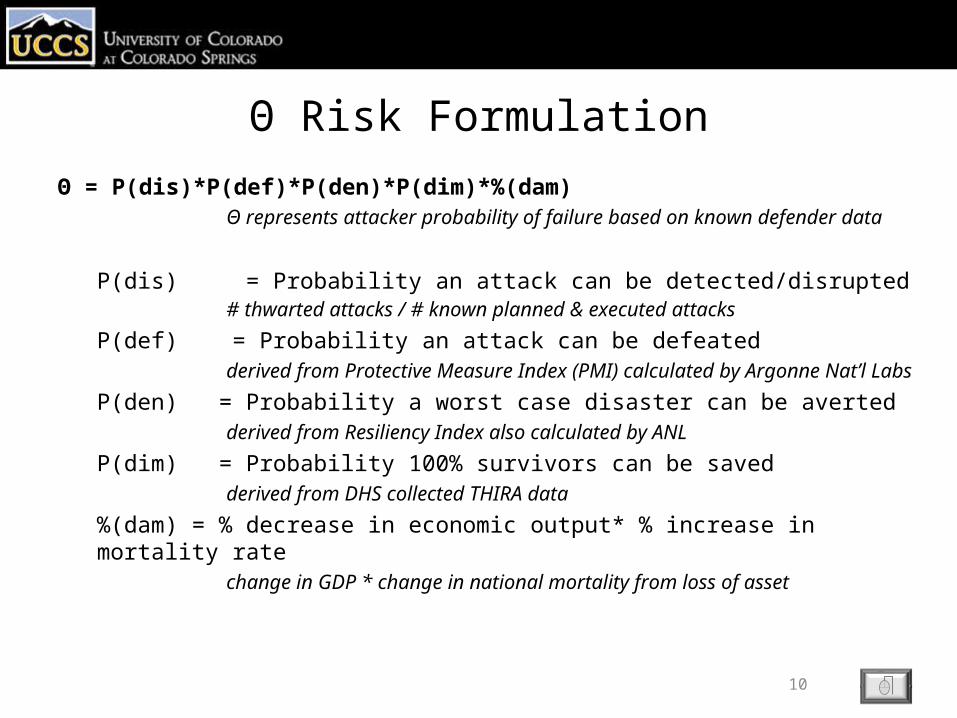
Θ Risk Formulation
Θ = P(dis)*P(def)*P(den)*P(dim)*%(dam)Θ represents attacker probability of failure based on known defender data
P(dis) = Probability an attack can be detected/disrupted# thwarted attacks / # known planned & executed attacks
P(def) = Probability an attack can be defeatedderived from Protective Measure Index (PMI) calculated by Argonne Nat’l Labs
P(den) = Probability a worst case disaster can be avertedderived from Resiliency Index also calculated by ANL
P(dim) = Probability 100% survivors can be savedderived from DHS collected THIRA data
%(dam) = % decrease in economic output* % increase in mortality ratechange in GDP * change in national mortality from loss of asset
10

ESC
Comprehensive Scope
Θ = P(dis)*P(def)*P(den)*P(dim)*%(dam)
Prevent Protect Mitigate Respond Recover
11
Right of “Boom”Left of “Boom”

ESC
National Impact
Θ = P(dis)*P(def)*P(den)*P(dim)*%(dam)
•9/11 registered a 47% decrease in GDP and 20% increase in national homicide rates•Quantifying the magnitude component in terms of trending data:
– Captures effects of both destructive and disruptive incidents– Expresses effects over time, beyond immediate consequences– Avoids difficulty of comparing lost lives and damaged property
12

ESC
Qualified Results
Sensitivity Analysis•Interval Risk Reduction Worth•Ratio Risk Reduction Worth•F-V Measure of Importance•Fractional Risk Reduction
Stable Formulation
13

ESC
Threat Localization
14
ESC
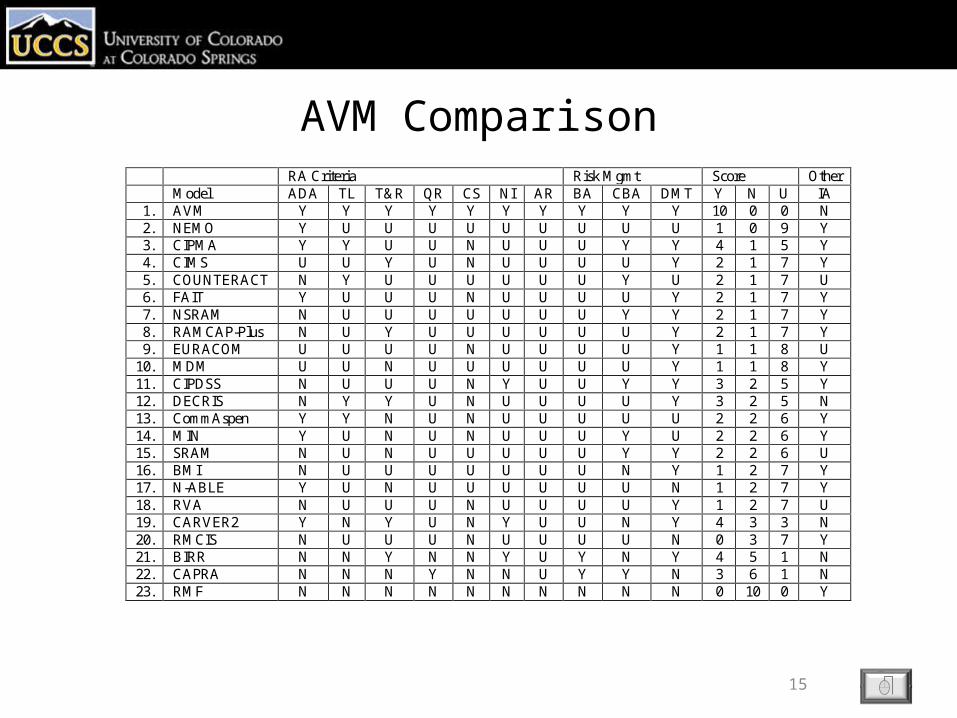
AVM Comparison RA Criteria Risk Mgmt Score Other Model ADA TL T&R QR CS NI AR BA CBA DMT Y N U IA 1. AVM Y Y Y Y Y Y Y Y Y Y 10 0 0 N 2. NEMO Y U U U U U U U U U 1 0 9 Y 3. CIPMA Y Y U U N U U U Y Y 4 1 5 Y 4. CIMS U U Y U N U U U U Y 2 1 7 Y 5. COUNTERACT N Y U U U U U U Y U 2 1 7 U 6. FAIT Y U U U N U U U U Y 2 1 7 Y 7. NSRAM N U U U U U U U Y Y 2 1 7 Y 8. RAMCAP-Plus N U Y U U U U U U Y 2 1 7 Y 9. EURACOM U U U U N U U U U Y 1 1 8 U
10. MDM U U N U U U U U U Y 1 1 8 Y 11. CIPDSS N U U U N Y U U Y Y 3 2 5 Y 12. DECRIS N Y Y U N U U U U Y 3 2 5 N 13. CommAspen Y Y N U N U U U U U 2 2 6 Y 14. MIN Y U N U N U U U Y U 2 2 6 Y 15. SRAM N U N U U U U U Y Y 2 2 6 U 16. BMI N U U U U U U U N Y 1 2 7 Y 17. N-ABLE Y U N U U U U U U N 1 2 7 Y 18. RVA N U U U N U U U U Y 1 2 7 U 19. CARVER2 Y N Y U N Y U U N Y 4 3 3 N 20. RMCIS N U U U N U U U U N 0 3 7 Y 21. BIRR N N Y N N Y U Y N Y 4 5 1 N 22. CAPRA N N N Y N N U Y Y N 3 6 1 N 23. RMF N N N N N N N N N N 0 10 0 Y
15

ESC
AVM Cost-Benefit Analysis
ΔΘ = P(Δdis)*P(Δdef)*P(Δden)*P(Δdim)*%(dam)
P(Δdis) = Increased prob. attack can be detected/disruptedP(Δdef) = Increased prob. an attack can be defeatedP(Δden) = Increased prob. Worst Case Disaster can be avertedP(Δdim) = Increased prob. 100% survivors can be saved%(dam) = % decrease in economic output* %increase in mortality rate
D(ΔΘ) = D(Δdis)+D(Δdef)+D(Δden)+D(Δdim)
16
ESC
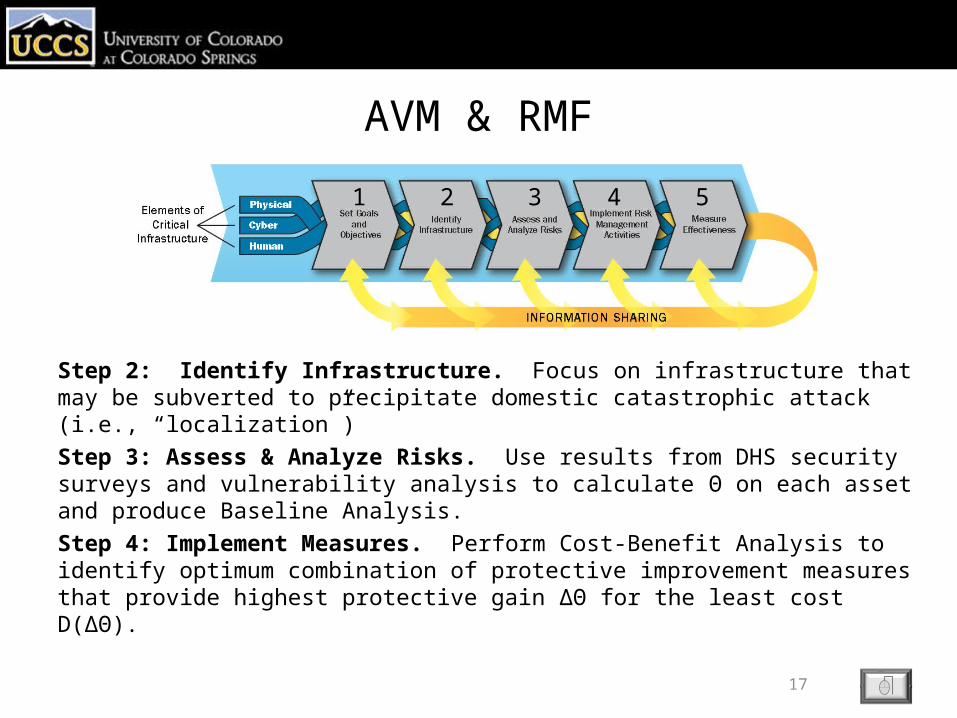
AVM & RMF
Step 2: Identify Infrastructure. Focus on infrastructure that may be subverted to precipitate domestic catastrophic attack (i.e., “localization”)Step 3: Assess & Analyze Risks. Use results from DHS security surveys and vulnerability analysis to calculate Θ on each asset and produce Baseline Analysis.Step 4: Implement Measures. Perform Cost-Benefit Analysis to identify optimum combination of protective improvement measures that provide highest protective gain ΔΘ for the least cost D(ΔΘ).
17
1 2 3 4 5

ESC
2AVM Analysis of Alternative Critical
Infrastructure Protection Investment Strategies
18
ESC
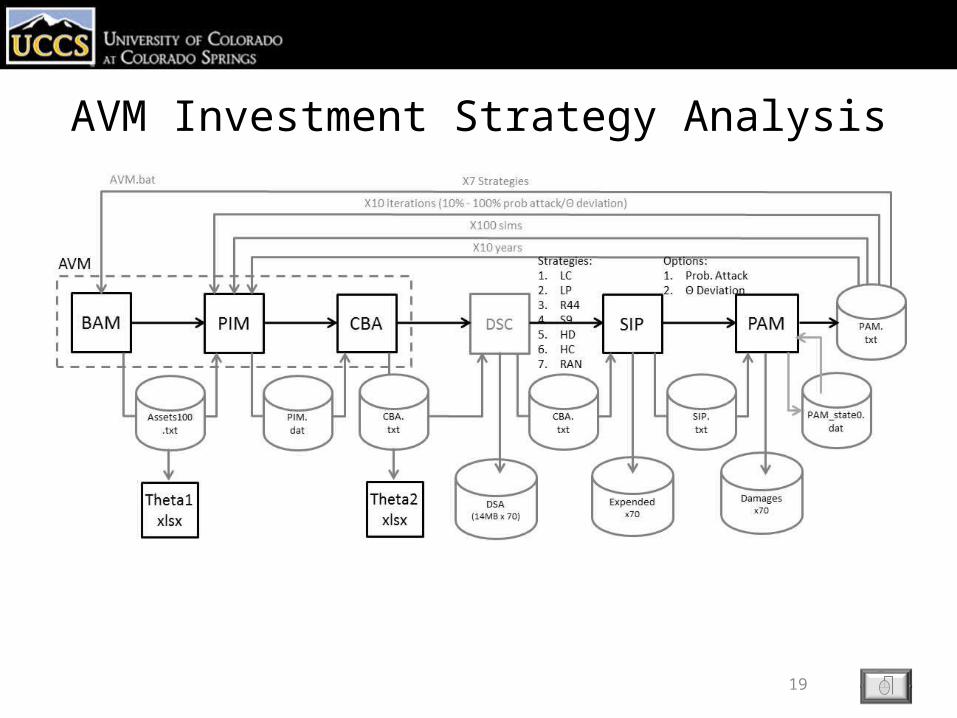
AVM Investment Strategy Analysis
19
ESC
Alternative Investment Strategies
1. Least Cost (LC)2. Least Protected (LP)3. Region Protection (RP)4. Sector Protection (SP)5. Highest DTheta (HD)6. Highest Consequence (HC)
7. Random Purchases (RAN)
20
ESC
Strategy Simulation• Applied simulated investment strategy against 100 assets over 10-year period• Calculated probability of attack and tabulated annual damages• Collected results over 100 simulations• Performed simulations under three different conditions:
1. AVM18 varied probabilities of attack (0%-100%)2. AVM19 varied attacker perceptions of Θ (0%-100%)3. AVM20 used different attack model
21
ESC
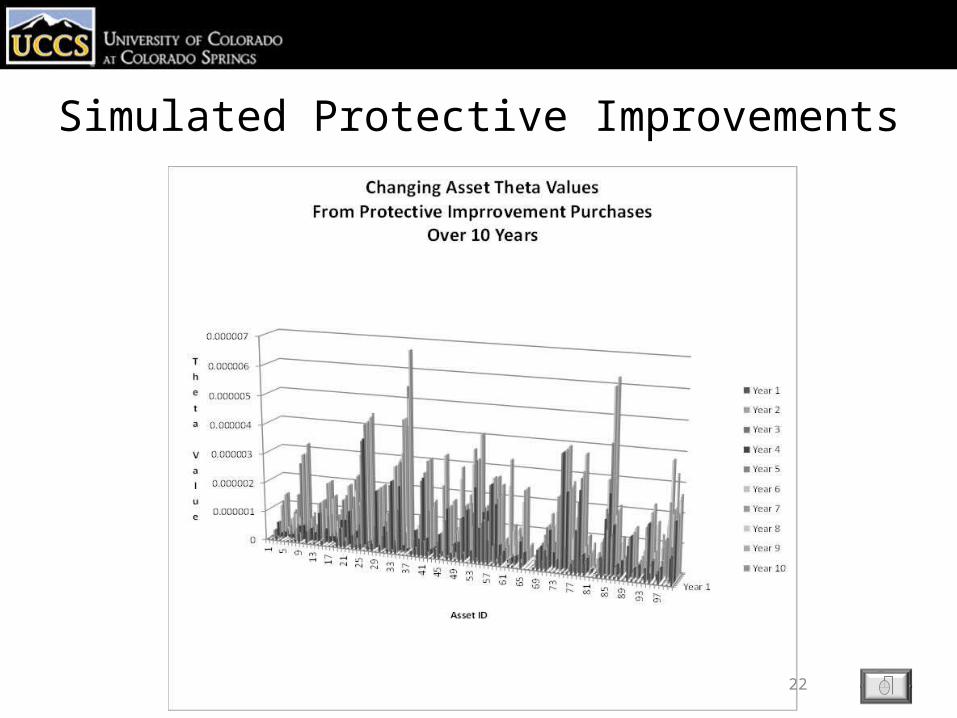
Simulated Protective Improvements
22
ESC
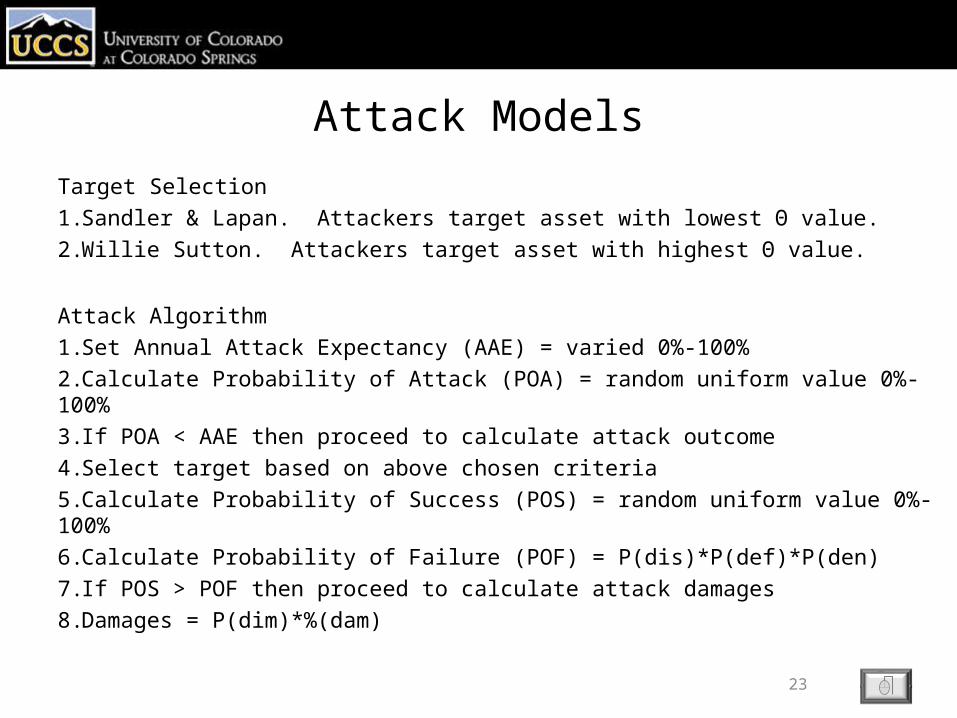
Attack Models
Target Selection1.Sandler & Lapan. Attackers target asset with lowest Θ value.2.Willie Sutton. Attackers target asset with highest Θ value.
Attack Algorithm1.Set Annual Attack Expectancy (AAE) = varied 0%-100%2.Calculate Probability of Attack (POA) = random uniform value 0%-100%3.If POA < AAE then proceed to calculate attack outcome4.Select target based on above chosen criteria5.Calculate Probability of Success (POS) = random uniform value 0%-100%6.Calculate Probability of Failure (POF) = P(dis)*P(def)*P(den)7.If POS > POF then proceed to calculate attack damages8.Damages = P(dim)*%(dam)
23
ESC
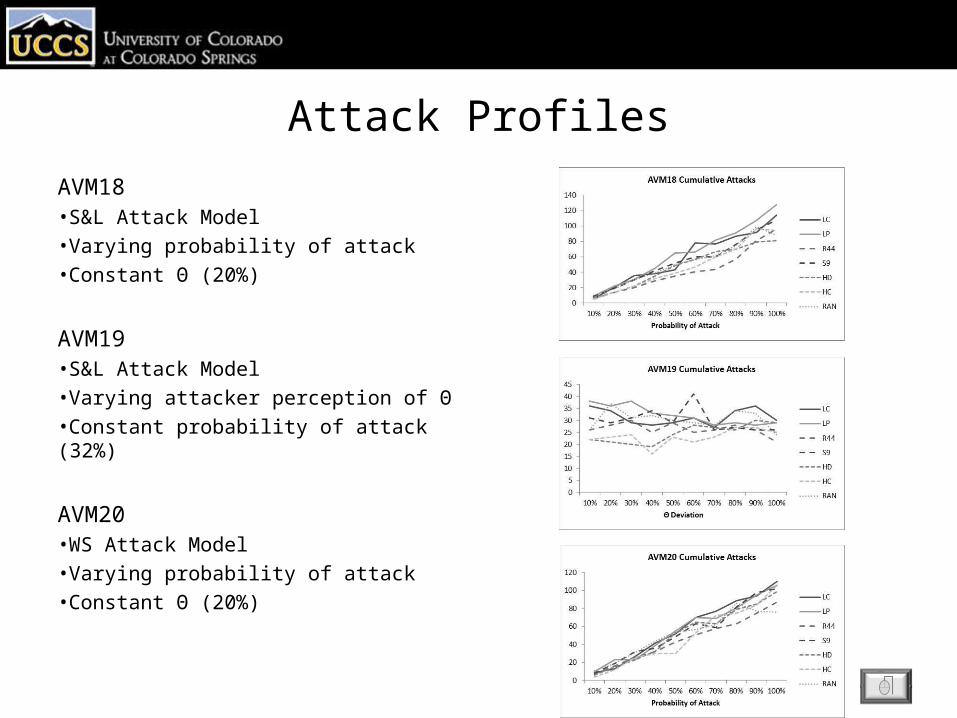
Attack Profiles
AVM18•S&L Attack Model•Varying probability of attack•Constant Θ (20%)
AVM19•S&L Attack Model•Varying attacker perception of Θ•Constant probability of attack (32%)
AVM20•WS Attack Model•Varying probability of attack•Constant Θ (20%)
24
ESC
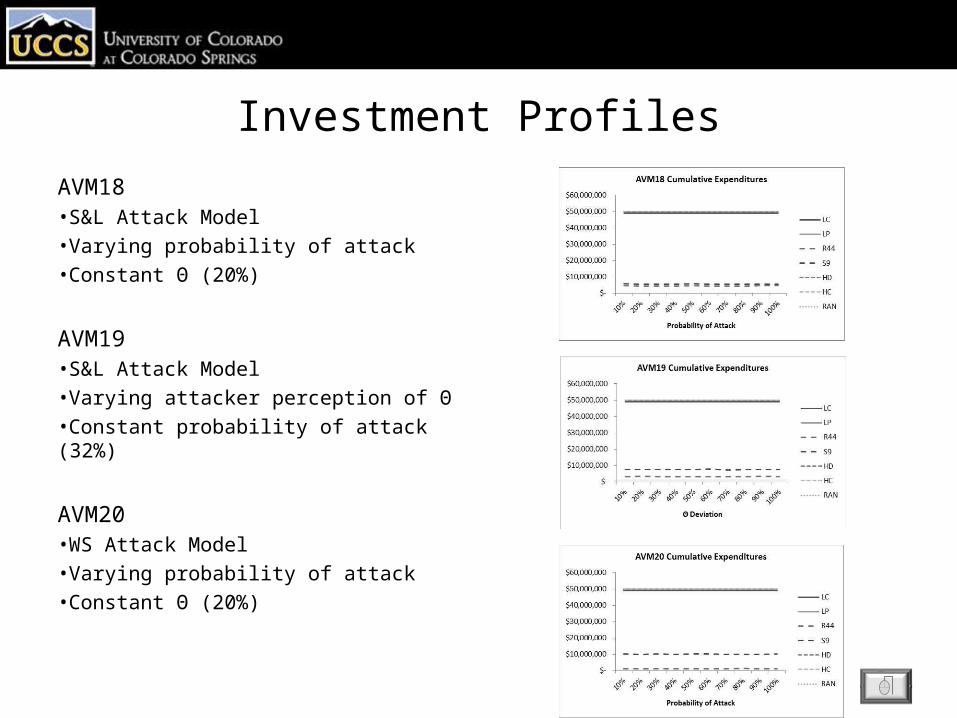
Investment Profiles
AVM18•S&L Attack Model•Varying probability of attack•Constant Θ (20%)
AVM19•S&L Attack Model•Varying attacker perception of Θ•Constant probability of attack (32%)
AVM20•WS Attack Model•Varying probability of attack•Constant Θ (20%)
25
ESC
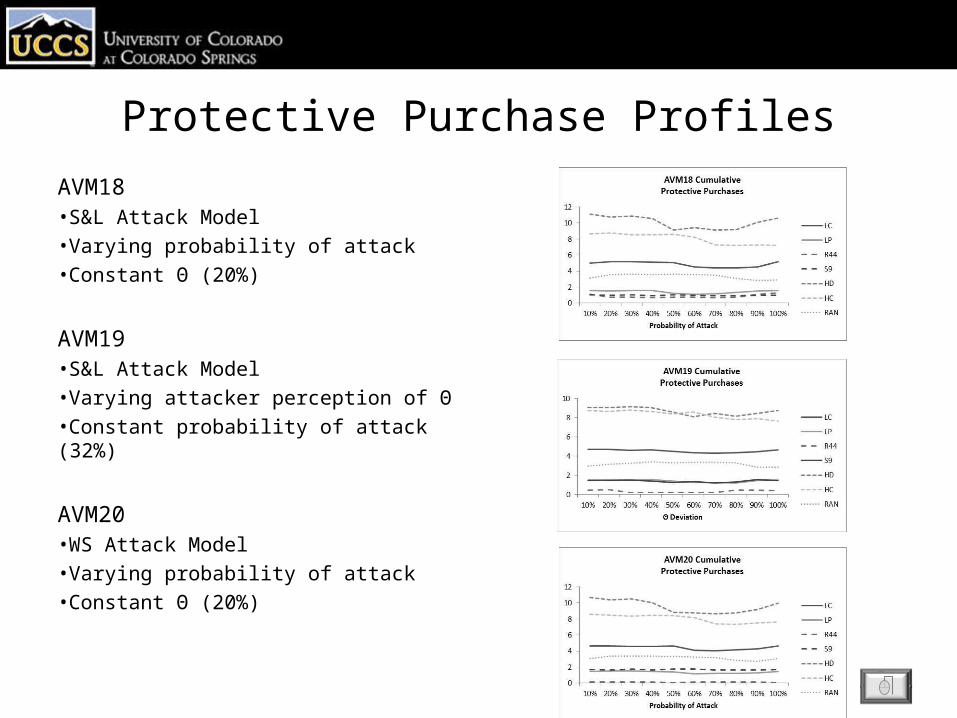
Protective Purchase Profiles
AVM18•S&L Attack Model•Varying probability of attack•Constant Θ (20%)
AVM19•S&L Attack Model•Varying attacker perception of Θ•Constant probability of attack (32%)
AVM20•WS Attack Model•Varying probability of attack•Constant Θ (20%)
26
ESC
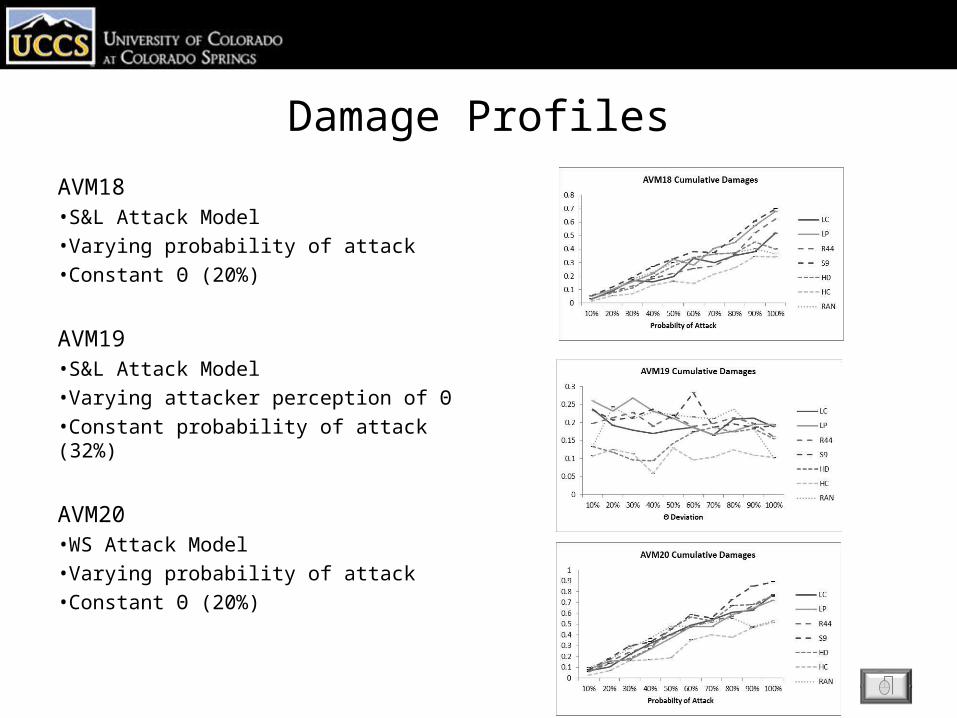
Damage Profiles
AVM18•S&L Attack Model•Varying probability of attack•Constant Θ (20%)
AVM19•S&L Attack Model•Varying attacker perception of Θ•Constant probability of attack (32%)
AVM20•WS Attack Model•Varying probability of attack•Constant Θ (20%)
27
ESC
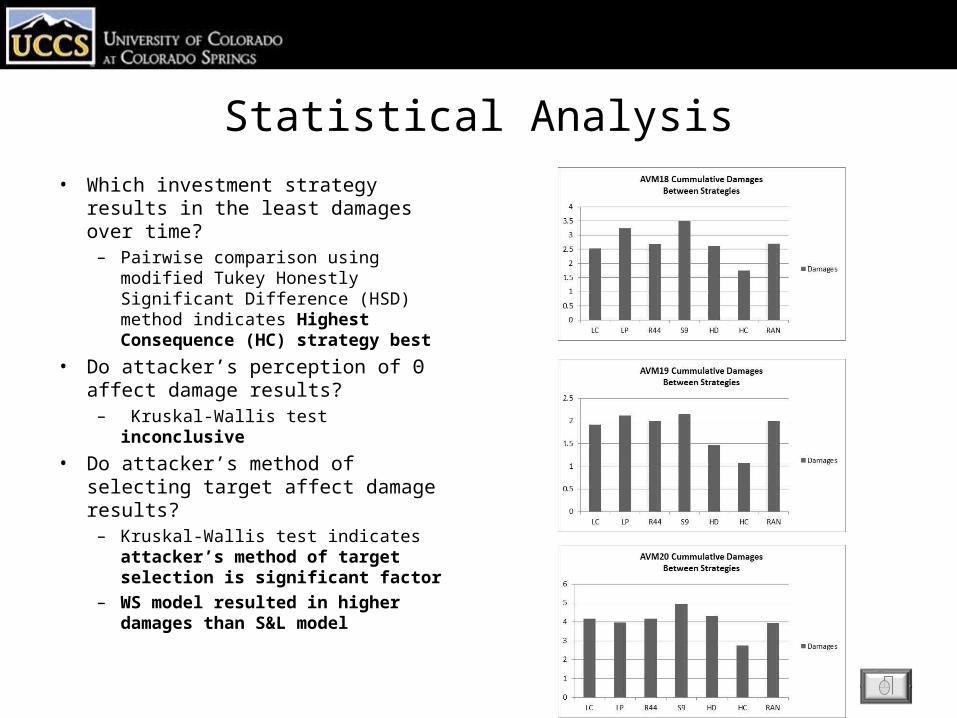
Statistical Analysis• Which investment strategy results in
the least damages over time?– Pairwise comparison using modified
Tukey Honestly Significant Difference (HSD) method indicates Highest Consequence (HC) strategy best
• Do attacker’s perception of Θ affect damage results?– Kruskal-Wallis test inconclusive
• Do attacker’s method of selecting target affect damage results?– Kruskal-Wallis test indicates
attacker’s method of target selection is significant factor
– WS model resulted in higher damages than S&L model
28
ESC
3AVM Decision Support Tool
29

ESC
Applicable Results
National Research Council attributes of a good risk analysis:•Convey current risk levels•Support cost-benefit analysis•Demonstrate risk reduction effects across multiple assets at different levels of management•Measure and track investments and improvement in overall system resiliency over time
30
ESC
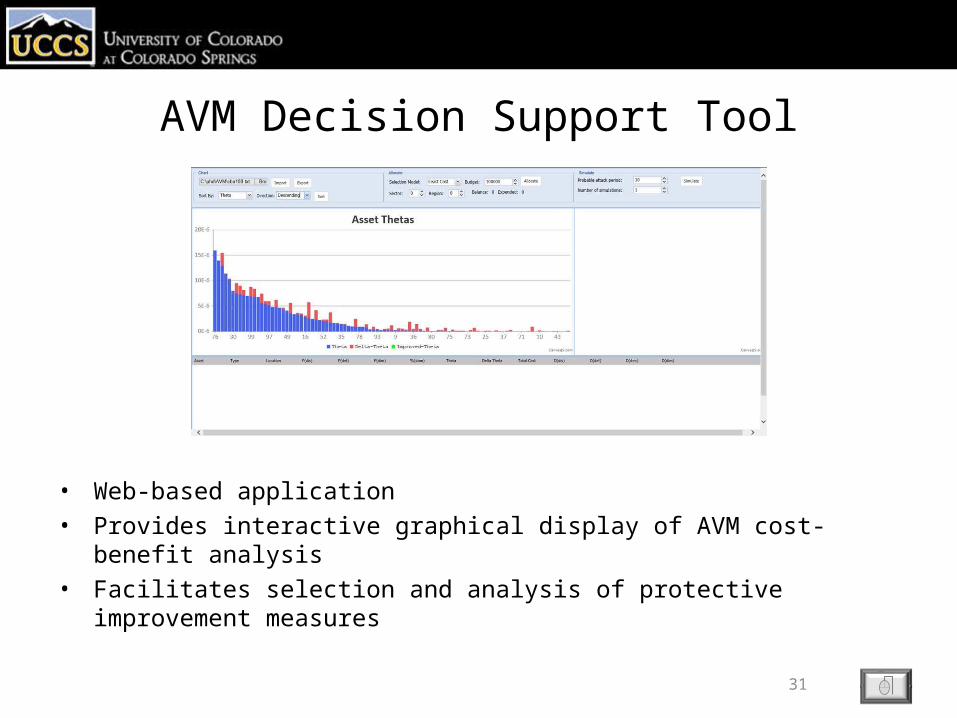
AVM Decision Support Tool
• Web-based application• Provides interactive graphical display of AVM cost-benefit analysis• Facilitates selection and analysis of protective improvement measures
31

ESC
Protective Improvement Selection
• Select by investment strategy: LC, LP, RP, SP, HD, HC, or RAN• Select individually• Edit selections
32
ESC
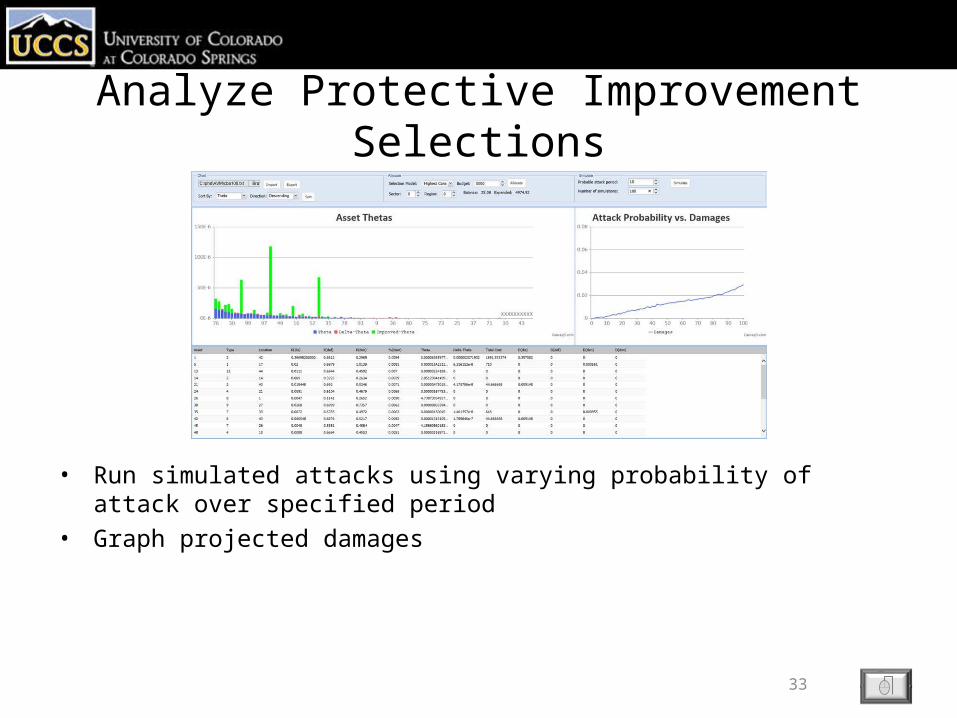
Analyze Protective Improvement Selections
• Run simulated attacks using varying probability of attack over specified period• Graph projected damages
33
ESC
AVM-DST Lessons Learned
1. Stand-alone client model exceptionally fast because no network delays2. Canvas JS renders charts significantly faster than Ext JS3. Optimized sorting algorithm keeps browser from becoming unresponsive
34
ESC
Future Research
AVM-DST•Expansion•Fidelity•Performance Enhancements
AVM•Validation•Refinement•Further Analysis
35
ESC
Contributions• Risk model for strategic protection of critical infrastructure.
– Overcomes challenges with current models– Compatible with DHS Risk Management Framework– Clarifies identification of critical infrastructure– Unifies efforts “inside” and “outside” the perimeter
• Strategy analysis support– Demonstrated advantage of Highest Consequence investment strategy
• Decision support for all levels of management– Convey current risk levels– Support cost-benefit-analysis– Demonstrate risk reduction across multiple assets– Measure and track improvement over time
36
ESC
AVM & AVM-DST
Questions?
37