ESA/STAT/AC - unstats.un.org · This work was undertaken as part of the project Advancing the SEEA...
91
DEPARTMENT OF ECONOMIC AND SOCIAL AFFAIRS STATISTICS DIVISION UNITED NATIONS ESA/STAT/AC.301 UNCEEA/10/Bk10b _____________________________________________________________________________ Tenth Meeting of the UN Committee of Experts on Environmental-Economic Accounting New York, 24-26 June 2015 SEEA Experimental Ecosystem Accounting: Technical Guidance (for information)
Transcript of ESA/STAT/AC - unstats.un.org · This work was undertaken as part of the project Advancing the SEEA...

DEPARTMENT OF ECONOMIC AND SOCIAL AFFAIRS
STATISTICS DIVISION
UNITED NATIONS
ESA/STAT/AC.301
UNCEEA/10/Bk10b
_____________________________________________________________________________
Tenth Meeting of the UN Committee of Experts on
Environmental-Economic Accounting
New York, 24-26 June 2015
SEEA Experimental Ecosystem Accounting: Technical Guidance
(for information)

ii
SEEA Experimental Ecosystem
Accounting: Technical Guidance
DRAFT
Editor: Carl Obst1
Version: 3.0 (Draft for review, 03 April 2015)
Contributors: (to be completed)
This work was undertaken as part of the project Advancing the SEEA Experimental
Ecosystem Accounting. The project is led by the United Nations Statistics Division in
collaboration with United Nations Environment Programme through its The Economics of
Ecosystems and Biodiversity Office, and the Secretariat of the Convention on Biological
Diversity. It is funded by the Norwegian Ministry of Foreign Affairs.
1 The views and opinions expressed in this report are those of the authors and do not necessarily reflect the
official policy or position of the United Nations or the Government of Norway.

i
Background
This document has been prepared to support discussion at the forthcoming Expert Forum on
ecosystem accounting. It has been prepared on the basis of a range of materials but has not
been subject to substantial consultation at this point. It should therefore be considered an
initial draft and not circulated broadly at this stage. It is intended that following discussion at
the expert forum a revised document taking on board the inputs from the experts will be
prepared for circulation.
The content builds on the SEEA Experimental Ecosystem Accounting initially released in
2013 and provides updates and further clarification. It is hoped that the summary and
overview style of this document can provide a relatively common understanding of ecosystem
accounting for the participants in the Expert Forum and hence aid discussion and exchange at
the meeting.
A particular note is that the referencing in the document is incomplete and needs substantive
work. Advice on amend or additional references would be welcome.
Also, most chapters have final sections outlining conclusions and recommendations for
compilation, testing and further research. These sections have not yet been drafted, in large
part pending the discussion at the Expert Forum. The text generally provides a good
indication of the types of conclusions and recommendations that may emerge.
Acknowledgements (to be completed)

ii
Contents 1. Introduction ....................................................................................................................... 1
1.1. Definition and role of ecosystem accounting ............................................................ 1
1.2. Scope and purpose of SEEA EEA Technical Guidance ............................................. 2
1.3 Links between EEA TG and other initiatives ............................................................. 4
1.4 Links to corporate accounting initiatives .................................................................. 9
1.5 Structure of EEA TG ................................................................................................ 10
2. Main aspects of ecosystem accounting ............................................................................ 11
2.1 Introduction ............................................................................................................. 11
2.2 The SEEA EEA ecosystem accounting model and key accounting principles ......... 11
2.3 The steps in compiling ecosystem accounts ............................................................. 13
2.4 Key boundary and conceptual issues....................................................................... 16
2.5 Key features of a national accounting approach to ecosystem measurement ......... 19
3. Ecosystem accounting units of SEEA EEA .................................................................... 26
3.1 Introduction ............................................................................................................. 26
3.2 The SEEA EEA units model ..................................................................................... 26
3.3 Data sources, classifications and methods for delineating spatial units ................. 28
3.4 Key issues and challenges in delineating spatial units for ecosystem accounting .. 30
3.5 Conclusions ............................................................................................................. 31
4. Main ecosystem accounts ................................................................................................ 32
4.1 Introduction ............................................................................................................. 32
4.2 Key considerations in defining ecosystem accounts ................................................ 33
4.3 Ecosystem extent accounts ...................................................................................... 35
4.4 Ecosystem condition accounts ................................................................................. 36
4.5 Ecosystem services supply account ......................................................................... 37
4.6 Ecosystem services use account .............................................................................. 38
4.7 Additional accounts for ecosystems ......................................................................... 40
4.8 Ecosystem component accounts .............................................................................. 43
5. Accounting for flows of ecosystem services ................................................................... 44
5.1 Introduction ............................................................................................................. 44
5.2 The definition of ecosystem services ........................................................................ 44
5.3 The classification of ecosystem services .................................................................. 47
5.4 The role and use of biophysical modelling .............................................................. 48
5.5 Data sources, materials and methods for measuring ecosystem service flows ....... 50
5.6 Key issues and challenges in measuring ecosystem service flows .......................... 53
5.7 Conclusions ............................................................................................................. 54
6. Accounting for specific ecosystem components ............................................................. 55

iii
6.1 Introduction ............................................................................................................. 55
6.2 Accounting for land cover ....................................................................................... 55
6.3 Accounting for water related stocks and flows ........................................................ 57
6.4 Accounting for carbon related stocks and flows ..................................................... 59
6.5 Accounting for biodiversity ..................................................................................... 60
6.6 Other supporting accounts and data ....................................................................... 60
7. Accounting for ecosystem assets ..................................................................................... 62
7.1 Introduction ............................................................................................................. 62
7.2 Dimensions in the measurement of ecosystem assets .............................................. 62
7.3 Compiling ecosystem condition accounts ................................................................ 64
7.4 Aggregate measures of condition ............................................................................ 66
7.5 Developing the concept of ecosystem capacity ........................................................ 67
7.6 Conclusions, recommended activities and research issues ..................................... 69
8. Valuation in ecosystem accounting ................................................................................. 70
8.1 Introduction ............................................................................................................. 70
8.2 Valuation principles for ecosystem accounting ....................................................... 70
8.3 Key challenges in valuation ..................................................................................... 71
8.4 Relevant data and source materials ........................................................................ 73
8.5 Conclusions ............................................................................................................. 76
9. Integrating ecosystem accounting with standard economic data ..................................... 77
9.1 Introduction ............................................................................................................. 77
9.2 Steps required for full integration with the national accounts ................................ 77
9.3 The role of combined presentations......................................................................... 78
9.4 Integrated accounting structures ............................................................................. 79
9.5 Key challenges in full integration ............................................................................ 82
9.6 Alternative approaches to integration ..................................................................... 85
9.7 Conclusions ............................................................................................................. 86

1
1. Introduction
1.1. Definition and role of ecosystem accounting
1.1. Ecosystem accounting is a coherent and integrated approach to the measurement of
ecosystems and measurement of ecosystems and the flows of services from them into
economic and other human activity. Ecosystem accounting complements and builds
on the accounting for environmental assets as described in the SEEA Central
Framework. In the SEEA Central Framework environmental assets are accounted for
as individual resources such as timber resources, soil resources and water resources.
In ecosystem accounting the accounting is for these individual resources operating in
combination as an ecosystem.
1.2. A prime motivation for ecosystem accounting is that a separate analysis of
ecosystems and the economy does not reinforce the vital nature of the relationship
between humans and the environment in which we live. In this context, the SEEA
EEA provides a platform for the integration of relevant information on ecosystem
extent condition, capacity and services with information on economic and other
human activity.
1.3. The accounting approach outlined in SEEA EEA extends and complements a range of
other ecosystem and biodiversity measurement initiatives in a number of important
ways.
First, the SEEA EEA framework includes accounting for the changes in
ecosystem condition and function (including changes in biodiversity) and the
flows of ecosystem services. Often measurement of these two aspects of
ecosystems are separate fields of research.
Second, the SEEA EEA framework encompasses measurement in both
biophysical terms (e.g. in hectares, tonnes) and in monetary terms where flows of
ecosystem services are ascribed monetary valuations through various non-market
valuation techniques.
Third, the SEEA EEA framework is designed to facilitate comparison and
integration with the economic data prepared following the System of National
Accounts (SNA). This leads to several design elements concerning valuation and
measurement boundaries that are not systematically applied traditionally in
ecosystem measurement but, at the same time, facilitates the mainstreaming of
ecosystem information with standard measures of income, production and wealth
that is required for analysis of, for example, sustainability and green economy.
Fourth, the aim of the SEEA EEA framework is to provide a broad, cross-cutting
perspective on ecosystems at a country or large-sub-national level. While in
principle many of the concepts can be applied at a detailed level the intent is to
provide a broad picture to enable integration with the broad picture of the
economy from the national accounts. Since many ecosystem measurements are
conducted at a detailed, local level there is an important methodological
challenge to utilize these data to provide a national view.
1.4. In this context, ecosystem accounting does not represent a competing measurement
approach. Rather it is hoped that the benefits of building an integrated set of
information concerning ecosystem condition, ecosystem services and economic
activity can provide a basis for discussion and integration between the various
perspectives, disciplines and related initiatives that are involved in this area of work.

2
1.5. The SEEA EEA has emerged from work initiated by the international community of
official statisticians and their development of the SEEA Central Framework. While
there has long been recognition of ecosystems in the context of environmental-
economic accounting and of the need to account for the degradation of ecosystems
the approach described in the SEEA EEA has only emerged in recent years. Its design
is attributable to the relatively recent development of concepts of ecosystem services.
With these concepts it has been possible to incorporate accounting for ecosystems
using the accounting approaches that have been developed for recording economic
activity and individual environmental stocks and flows (water, energy, timber
resources, GHG emissions, etc).
1.6. One result of this bringing together of traditional national accounting and newer
concepts of ecosystem services is that ecosystem accounting is considered to be an
emerging and still developing area of work. Thus, while it shows considerable
potential as an integrating framework, there remain a number of areas that require
much further discussion and testing. In addition, it is by nature an inter-disciplinary
undertaking and, since each discipline (statistics, economics, national accounts,
ecology, geography, et al) brings its own perspective and language, all involved must
recognize the additional effort required to respect and understand the other
perspectives.
1.2. Scope and purpose of SEEA EEA Technical Guidance
Connection to the SEEA EEA
1.7. The SEEA Experimental Ecosystem Accounting: Technical Guidance (EEA TG)
provides a range of content to support the testing and implementation of ecosystem
accounting at national level. It complements SEEA Experimental Ecosystem
Accounting (SEEA EEA) released in 2013 that described a framework for ecosystem
accounting and provided an initial foundation for discussion and collaboration on
ecosystem and biodiversity measurement issues.
1.8. EEA TG uses the SEEA EEA as its starting point and basis for conceptual discussion.
However, since its drafting in 2012, there has been further discussion and testing of
concepts and engagement with a broader range of interested experts. The core
conceptual framework remains solid but some additional issues, interpretations and
approaches have arisen and EEA TG seeks to introduce those new topics and
thoughts into the discussion on ecosystem accounting.
1.9. EEA TG should not be considered to reflect the definitive word on the issues of
ecosystem accounting since further testing and discussion in this emerging field is
required. Thus, it provides additional background, context and clarification to the
concepts outlined in SEEA EEA with the intent of increasing understanding of the
ecosystem accounting approach and its potential. Where relevant, advances in
thinking on specific topics, for example on the topic of ecosystem capacity, have been
introduced to ensure that the content is as up to date as possible in this rapidly
developing field.
Connection to other materials
1.10. The EEA TG also aims to place in context a range of other materials on
ecosystem accounting that have developed over the past few years. Examples include
the CBD’s “Ecosystem Natural Capital Accounts: A Quick Start Package” (ENCA
QSP); UNEP’s “Guidance Manual on Valuation and Accounting of Ecosystem
Services for Small Island Developing States”; the World Bank WAVES’ “Designing

3
Pilots for Ecosystem Accounting”; and the EU’s “Mapping and Assessment of
Ecosystems and their Services (2nd
report)”. These materials have been developed by
different agencies and for different contexts but have an important role to play in the
testing of SEEA EEA and communicating the potential of a national accounting
approach to ecosystem measurement. A short overview of these different documents
is provided later in this chapter.
1.11. As described in SEEA EEA, there are often strong connections between
accounting for ecosystem condition and ecosystem services, and accounting for
individual ecosystem components such as water and land. Consequently, work on
ecosystem accounting should take advantage of the range of materials that have been
developed relating to the measurement of water resources (including SEEA Water),
forests and timber, fisheries, and land. While these materials have not generally been
developed with ecosystem accounting in mind, they nonetheless support the
development of relevant estimates and accounts. As well, these document often point
to potential applications of ecosystem accounting which can provide a useful focus
for compilers.
1.12. Throughout the EEA TG, references to these documents and other relevant
material are included as appropriate. Consequently, EEA TG should reflect somewhat
of a reference guide in addition to being an up-to-date description of the state of
ecosystem accounting.
The audience for EEA TG
1.13. The primary audience of the EEA TG are those people working on the
compilation and testing of ecosystem accounts at national level and those providing
data to those exercises, perhaps as part of separately established ecosystem and
biodiversity monitoring and assessment programs. The content should also assist
those who may use the information that emerges from sets of ecosystem accounts but
the potential applications of ecosystem accounts is not the focus of this document.
The scope of EEA TG
1.14. All aspects of ecosystem accounting as described in SEEA EEA are within
scope of EEA TG. However, far more emphasis has been placed on measurement in
biophysical terms than on issues concerning valuation and integration into the
standard national accounts. This balance reflects that work over the past few years in
the context of SEEA EEA has tended to focus on biophysical measurement in terms
of land and ecosystem condition accounting. It also reflects a pragmatic view that the
valuation of ecosystem services and ecosystem assets requires a strong grasp of the
relevant stocks and flows in biophysical terms. Consequently, resolving the
accounting issues in biophysical terms can be considered a necessary first step.
1.15. It is recognized that there is a substantial field of expertise and experience on
the valuation of ecosystem services but it is less clear that there have been significant
advances in linking this knowledge to the challenge of valuation for SEEA EEA
based accounting purposes – a challenge raised substantively in the SEEA EEA
Chapter 5. While some developments will be reported on in this document, This area
requires further work both in testing valuation approaches in an accounting context
and in discussion among relevant experts (mainly in accounting and economics) to
broaden the understanding of the valuation of ecosystem services for accounting
purposes.
1.16. Since the field of ecosystem accounting is quite new and is likely to advance
quickly given the range of testing underway, the EEA TG cannot be considered a

4
definitive document but rather a summary at a point in time. However, it is intended
that in the coming 3-5 years a process will be undertaken to update the SEEA EEA,
taking advantage of all relevant conceptual and practical development, and put in
place an international statistical standard for ecosystem accounting. Through this
process it is also proposed that relevant guidance be updated and shared on an
ongoing basis with the EEA TG providing the structure.
1.3 Links between EEA TG and other initiatives
1.17. As noted in Section 1.2, the content of EEA TG is based on the conceptual
ecosystem accounting model described in SEEA EEA. In turn, the conceptual model
complements the accounting for environmental assets in the SEEA Central
Framework and the accounting structures themselves are applications of the
principles and structures described in the System of National Accounts (SNA). Thus,
the EEA TG is firmly rooted in national accounting conventions and approaches to
the organization of information.
1.18. At the same time, the ongoing testing and development of ecosystem
accounting as reflected in the EEA TG continues to demonstrate that this area of
accounting is not a straightforward application of national accounting principles. The
primary driver for this is that ecosystems are not standard assets in the ways generally
conceived by traditional economic accounting. Instead they are characterized by
having multiple owners, generating multiple services and have the potential to
regenerate themselves in the future.
1.19. The second key driver is that the information set required for the compilation
of a full set of ecosystem accounts is very diverse and not generally coordinated at
national level. Economic statistics are, on the whole, quite well coordinated by a
small number of leading institutions (e.g. national statistics office, central bank,
taxation office). The lack of co-ordination of the underlying information needed for
ecosystem accounting has meant that ecosystem accounting is one among a number
of information integration initiatives concerning environmental data. For the EEA TG
and those compiling ecosystem accounts, it means that connections can and should be
made to a variety of information and data projects across a number of agencies.
1.20. Finally, since ecosystem accounting is a relatively new field it is natural that
different approaches and perspectives are developing. There are thus a range of
documents describing approaches that are essentially ecosystem accounting even if
not fully aligned with the conceptual model described in the SEEA EEA. Since these
documents provide useful information for SEEA based ecosystem accounting
purposes, the following paragraphs provide a short summary of some key documents
of this type.
a. CBD Ecosystem Natural Capital Accounts: Quick Start Package (ENCA QSP)
(October 2014)
The ENCA QSP is a detailed technical document aimed at supporting countries in
the implementation of Aichi Biodiversity Target 2 on the integration of
biodiversity values in national accounting systems. Using techniques developed
in a European context (European Environment Agency, 2011) and applied in
Europe and in Mauritius, the ENCA QSP gives practical guidance on establishing
detailed spatial datasets on land cover, carbon, water, species diversity, and
various landscape level indicators (e.g. on fragmentation and ecotones).
The two key strengths of the ENCA QSP are its demonstration of the potential to
integrate large volumes of data at country level, often using global level datasets;
5
and its demonstration of a national accounting approach to ecosystem
measurement wherein data are scaled up and down as required to provide an
overall picture of change for a country as a whole. The ambition to provide a
broad picture for a country as distinct from a precise estimate for a specific
ecosystem is an important distinction of ecosystem accounting.
The focus of the ENCA QSP is on the measurement of ecosystem extent and
condition. It does indicate a link to the measurement of ecosystem services but
this is done only via an assumption that for a given ecosystem condition there
will be a specific basket of ecosystem services. Ecosystem services are not
measured directly. A consequence is that the measurement scope of ENCA QSP
is narrower than the SEEA EEA.
With regard to the measurement of ecosystem condition the ENCA QSP proposes
an approach that uses indicators of a limited number of ecosystem characteristics
that are applied to all ecosystem types. This broad brush approach may well seem
inappropriate from an ecological perspective but the intention is to provide a
quick and broad assessment.
ENCA QSP does proceed to valuation but does so in a limited way via the use of
restoration costs as a measure of ecosystem degradation. There is no valuation of
ecosystem services nor valuation of ecosystem assets as outlined in the SEEA
EEA. Concerns about the use of restoration cost approaches are discussed in
Chapter 8 of EEA TG.
Overall, its detailed proposals for the estimation of accounts with national
coverage for land, carbon and water and various high-level indicators concerning
ecosystem function are important contributions and should be of direct support to
compilers of ecosystem accounts as described in the SEEA EEA.
b. World Bank WAVES Designing Pilots for Ecosystem Accounting (May 2014)
This guidance material provides a summary of the key features of ecosystem
accounting and how a country or region might work towards developing a set of
ecosystem accounts. Its coverage includes discussion on the types of issues that
might benefit from the compilation of ecosystem accounts, the selection of a case
study area/site, assessment of the relevant ecosystem services, guidance on the
biophysical mapping and analysis of ecosystem services, and shows an
application of the approach to a study area in Peru.
The focus of the material is on providing appropriate context and criteria / factors
that are relevant for making decisions in respect to ecosystem accounting. While
there is some mention of the measurement of ecosystem condition and somewhat
more discussion on the issue of ecosystem capacity, on the whole the primary
focus of the material concerns ecosystem services. Methods for the valuation of
ecosystem services are mentioned.
This material should provide a useful complement to other materials, such as
those focused on ecosystem condition (ENCA QSP, above) and those focused on
valuation (UNEP SIDS Guide, below). Indeed, this presence of complementarity
speaks to the breadth of the requirements for ecosystem accounting.
Since the focus of the guidance is on the practical implementation and testing of
ecosystem accounting there are no specific departures from the SEEA EEA
concepts. Of course, the precise manner and methods by which ecosystem
accounts should be compiled remain the object of the testing and in this regard
the WAVES guidance material should usefully complement the EEA TG as well.

6

7
c. UNEP Guidance Manual on Valuation and Accounting of Ecosystem Services for
Small Island Developing States (SIDS) (January 2015)
This manual was prepared in the context of the particular imperatives for SIDS to
manage their development in the context of climate change and recognizing the
particularly strong link between SIDS economies and their natural environment.
The first part (chap. 2 - 4) of the guidance is focused on the measurement and
valuation of ecosystem services and a thorough overview of relevant concepts
and methods is provided with a particular focus on measurement in the context of
SIDS. Step by step guides to the most relevant methods are also provided. The
coverage of this discussion is not solely on valuation for accounting purposes
since there are other reasons for valuation other than accounting (e.g. cost benefit
analysis, program evaluation, etc).
Chapter 5 describes two aspects of “ecosystem service accounting. The first is a
summary of work in Mauritius that is an application of the methods described
above in the ENCA QSP. In effect this work does not reflect accounting for
ecosystem services but rather accounting for ecosystem condition. The second
aspect outlines some steps to the valuation of ecosystem services for inclusion in
the standard national accounts. The use of a production function approach is
summarized for a small set of provisioning and cultural services.
The guidance does not cover the valuation of regulating services in an accounting
context and while pointing towards the integration of ecosystem services into the
national accounts, it does not discuss the relevant measurement issues or mention
issues such as the valuation of ecosystem degradation.
This Guidance Manual should provide useful information for those wishing to
undertake the valuation of ecosystem services as part of implementation of work
on SEEA EEA however care is needed on the discussion of the integration of
ecosystem services value within the standard national accounts since some of the
important integration issues are not considered.
d. EU Mapping and Assessment of Ecosystems and their Services (MAES)
The EU’s MAES project is a large measurement project working towards
completion of Action 5 of the EU Biodiversity Strategy to 2020. The MAES
framework encompasses the two key dimensions of measurement that are also in
the SEEA EEA namely ecosystem condition and ecosystem services. In that
sense, the developments in the MAES provide a relevant example of the types of
measurement issues likely to arise in ecosystem accounting. Indeed, part of the
MAES project is the development of a methodological approach to natural capital
accounting.
To date the main output from the MAES project is its report (February 2014) on
“Indicators for ecosystem assessments under Action 5 of the EU Biodiversity
Strategy to 2020”. In this report it documents the establishment of six pilots
across Europe and the results from assessing ecosystem condition and an array of
ecosystem services in different ecosystem types (forests, cropland and grasslands,
freshwater, and marine).
The document is useful in highlighting measurement possibilities and challenges
in a summary manner thus providing insights for those aiming to establish
ecosystem accounting projects. Particularly useful are the listings of (and
recommendations regarding) potential indicators for different ecosystem services
across the range of provisioning, regulating and cultural services. Such listings

8
are particularly useful in trying to understand the type of information that might
be relevant.
In the context of ecosystem accounting the approach taken is particularly
appropriate since it is working form the intent of measuring ecosystems and their
services at a national and pan-European level. This type of broad assessment and
the use of relevant frameworks and classifications is well aligned with the
intentions of ecosystem accounting.
A draft reference document on natural capital accounting has also been released
for consultation (January 2015). Largely it is a description of the various
approaches to natural capital accounting, including the SEEA and includes
discussion of natural capital itself, and the role of natural capital accounting in
policy. The document discusses also the role of valuation, in both monetary and
non-monetary terms. The document does not provide methodological guidance
but is useful in providing background material to SEEA EEA based accounting
exercises.
1.21. In addition to these documents, there is an increasing body of work
developing that is testing the conceptual model for ecosystem accounting as
described in the SEEA EEA. Projects are taking place at national level and sub-
national level, and being undertaken as part of international initiatives, by national
and provincial governments, by non-government organisations and by academia.
Chapter 14 of EEA TG provides some brief summaries of relevant work to give a
sense of the directions being pursued. Links to relevant outputs and documentation
from these projects will be of value to those seeking to establish ecosystem
accounting projects.
1.22. Also, there are an increasing number of examples of projects and initiatives
focused on particular components relevant to ecosystem accounting. Work on
biodiversity, soil, land cover, water, carbon in the context of accounting is
proceeding, sometimes in awareness of the SEEA EEA framework, sometimes not. It
is very likely that the learnings from these component based studies can be integrated
into the SEEA EEA and hence discussion with those undertaking these studies is
particularly important for the compiler of ecosystem accounts. While it is likely that
results may need to be tailored to suit the particular requirements of integration with
the national accounts, this step is more straightforward than the gathering of specific
intelligence and knowledge on ecosystems and their components.

9
1.4 Links to corporate accounting initiatives
1.23. In parallel with the work on developing environmental-economic accounting
as a complement to the SNA, there is an equally long history of work on the
integration of environmental information into corporate accounting. By and large,
these two streams of accounting have not interacted in a significant way. While there
are differences between national and corporate accounting, there appear more
similarities than differences and a joining of efforts in this space would be a positive
step forward.
1.24. To this point however, the integrated ecosystem accounting approach
described in SEEA EEA has not been applied in corporate accounting. Efforts at
environmental or natural capital accounting have either focused on integrating the
costs of residual flows (emissions, pollutants, etc) into current accounting structures
or focused on a more generic reporting on environmental and natural capital issues as
a complement to the standard suite of accounts.
1.25. The second approach has developed considerable momentum via the Global
Reporting Initiative (GRI) and the International Integrated Reporting Council (IIRC
but neither of these approaches yet incorporates an integrated approach to accounting.
1.26. Work on integration into standard accounting structures is being developed
via the Natural Capital Protocol (NCP) by the Natural Capital Coalition and the work
on the Natural Capital Declaration being co-ordinated by the UNEP-Finance
Initiative. However, at this stage whether ecosystem accounting type approaches will
be incorporated is unclear.
1.27. Research funded by the UK Government’s Natural Capital Committee has
proposed a corporate natural capital accounting model whereby the value of
ecosystems is incorporated on a company’s balance sheet using the net present value
of ecosystem services – thus following the logic of SEEA EEA. However, measures
of ecosystem degradation are then estimated using a restoration cost approach and
further, no alteration to the company’s income or production boundary is developed.
These two matters are inconsistent with the direction of the SEEA EEA. (Further
discussion on these issues is in section 9.6.)
1.28. Notwithstanding the current lack of overlap between the natural capital
accounting work at national and corporate levels, in relation to the testing and
development of ecosystem accounting at a national level there are a number of
reasons for establishing a relationship between these two branches of accounting.
First, in many cases understanding the environment-economic relationship requires
assessment of public goods. Consequently, the development of corporate accounting
requires information beyond their own operations. Second, there may be a good
opportunity for the public sector to improve their collection of data on the
environment through appropriate coordination with the business community. Third,
the business community relies on public data, such as the national accounts, to
understand its wider operating environment both nationally and globally. Widely
developed ecosystem accounts should be able to offer similar advantages in terms of
standardised approaches to assessing operational risks and opportunities. Fourth, joint
development and exchange should help to more quickly advance the research agenda
especially via a common understanding of terms and concepts.

10
1.5 Structure of EEA TG
1.29. EEA TG Chapter 2 covers the general principles of ecosystem accounting
with a summary of the ecosystem accounting model described in SEEA EEA and a
discussion of key boundary issues.
1.30. Chapter 3 summarises the various accounting units and classifications used in
ecosystem accounting.
1.31. Chapter 4 describes the main types of ecosystem accounts.
1.32. Chapter 5 introduces accounting for flows of ecosystem services with a
description of some of the key boundary and classification related issues and the
relationships to other concepts such as benefits and well-being.
1.33. Chapter 6 provides an introduction to accounting for various components of
ecosystems namely land, carbon, water and biodiversity.
1.34. Chapter 7 considers the issue of accounting for ecosystem assets in a holistic
way which, in particular, involves dealing with the aggregation of information and
the measurement of condition, capacity and degradation.
1.35. Chapter 8 summarises the important and often controversial topic of
monetary valuation from an ecosystem accounting perspective. The aim is to support
a considered discussion of the role and relevance of valuation rather than provide
detailed guidance on the application of particular valuation techniques.
1.36. Chapter 9 updates the discussion in the SEEA EEA Chapter 6 on the
integration of ecosystem and economic information via the accounting framework.
Since the release of the SEEA EEA there have been some additional insights that take
forward discussion in this area although there remain outstanding issues from a
conceptual and practical perspective.
1.37. To support the discussion in the EEA TG and also to assist in advancing the
research agenda for ecosystem accounting, a series of ANCA Research Papers has
also be released covering a range of topics in much greater depth than conveyed in
this document. The list of ANCA Research Papers is provided in Annex 1.
11
2. Main aspects of ecosystem accounting
2.1 Introduction
2.1. This section complements the text in SEEA EEA Chapter 2 by providing additional
descriptions of key elements of the SEEA ecosystem accounting model. In doing so
the section also provides some additional material to reflect the ongoing discussion of
the ecosystem accounting model. This particularly relates to a discussion on the
concept of ecosystem capacity and the treatment of inter-ecosystem flows. First
though a quick summary of the ecosystem accounting model is presented.
2.2 The SEEA EEA ecosystem accounting model and key accounting principles
2.2.1 The Ecosystem Accounting Model
2.2. The SEEA EEA ecosystem accounting model has 6 main components that are
reflected in figure 2.1 below. Starting at the bottom of Figure 2.1 the model is based
around accounting for an ecosystem asset that is defined spatial area. Each ecosystem
asset has a range of relevant ecosystem characteristics and processes that together
describe the functioning of the ecosystem. The accounting model proposes that the
stock and changes in stock of ecosystem assets is measured by considering the
ecosystem asset’s extent and condition which can be done using indicators of the
relevant ecosystem’s area, characteristics and processes.
Figure 2.1 Ecosystem accounting model (SEEA EEA Figure 2.2)

12
2.3. Each ecosystem asset generates a set of ecosystem services which, in turn, contribute
the production of benefits. Benefits may be goods or services currently included in
the economic production boundary of the SNA, SNA benefits, or they may be
benefits received by individuals that are not produced by economic units (e.g. clean
air). These are non-SNA benefits. Benefits, both SNA and non-SNA, contribute to
individual and societal well-being or welfare.
2.4. The chain of relationships from ecosystem assets to well-being is at the core of the
SEEA EEA. While there remain some important issues of definition in terms of the
boundaries between different components, and there remain significant measurement
challenges in both physical and monetary terms, the core model reflecting the
relationships between ecosystem assets, ecosystem services and individual and
societal well-being remains strong.
2.2.2 Assets and services
2.5. At the core of the ecosystem accounting model of the SEEA EEA is the distinction
between ecosystem assets and ecosystem services. The former are the stocks within
the accounting system and the latter are the flows. The distinction is an application of
the separation in standard accounting between capital and income.
2.6. By accounting for both of these components and presenting both in a single integrated
model, two key advantages accrue
First, a significant amount of data can be integrated in both bio-physical
and monetary terms
Second, issues of sustainability can be considered since the capacity of
the ecosystem asset to deliver services can be considered separately from
the flows of ecosystem services themselves.
2.7. There are a number of approaches in the field of ecosystem measurement that focus
on either the assessment of ecosystem assets or on the flows of ecosystem services.
Those that focus on ecosystem assets tend to work in bio-physical terms and while
this information is undoubtedly of value and relevance, the issue of why ecosystem
assets are important is not addressed. That is, the information does not directly
highlight the connections between ecosystem assets and economic and human
activity.
2.8. On the other hand, approaches that focus on ecosystem services, particularly those
targeting monetary valuation of ecosystem services, can tend to infer or assume a
connection to the underlying ecosystem assets which generate the services. This is
consistent with standard accounting and economics where the value of an asset is
considered to be equal to its discounted future income stream. However, using this
assumption in ecosystem accounting puts to one side significant issues of the multi-
faceted connection between ecosystem assets and the services they generate.
2.9. The significance of the SEEA ecosystem accounting model thus lies in requiring
consideration of both assets and services and in the recognition of the connection
between the two key components.
13
2.3 The steps in compiling ecosystem accounts
2.10. While the conceptual model for ecosystem accounting in Figure 2.1 provides
a general description of the relationships between the different stocks and flows, it
does not provide a sense of how a compilation of ecosystem accounts might proceed.
This section provides a broad overview of the steps involved in compiling ecosystem
accounts. Later chapters in the EEA TG provide more detail on the various types of
accounts and the related measurement issues and recommendations.
2.11. In broad terms the compilation of ecosystem accounts will proceed from
basic physical measures of ecosystem assets to the measurement of ecosystem
services in physical terms and, from there, to valuation and integration with standard
economic accounts. This broad sequence is shown in Figure 2.2 where the first series
of steps is in physical terms and the second series of steps is in monetary terms. This
logic might be circumvented somewhat by first measuring physical flows of
ecosystem services but without a clear articulation of the ecosystem assets of interest
this task is likely to be somewhat more challenging. Further, it is noted that since
ecosystem services are not traded on markets, then valuation must follow
measurement in physical terms.
Figure 2.2 Basic steps in developing ecosystem accounts
a. Steps in physical terms
b. Steps in monetary terms
2.12. Step 1: For ecosystem accounting, as for national accounting, the first
important step is to delineate the spatial areas that are to be the focus for the accounts.
In principle, these areas should cover the entirety of a country’s terrestrial area and as
appropriate, relevant marine areas – perhaps extending to a country’s EEZ. As a first
step, information on the total area should be classified by type of land cover/marine
area thus providing a very broad approximation of ecosystems. More detailed
classifications of total areas will also be appropriate. Chapter 3 discusses at more
length the issues of delineating and classifying spatial areas for ecosystem accounting
purposes.
2.13. Information on the total area, generally in hectares, is presented in an
ecosystem extent account. This account presents an opening and closing area by
type of land cover or more detailed classification, together with information on the
additions and reductions in area. The structure of the ecosystem extent account
Ecosystem extent
account
(by ecosystem
type)
Ecosystem condition account
(by ecosystem
type)
Ecosystem services accounts
(by ecosystem
type)
Benefits received by
economy and
households
Ecosystem services accounts
(supply and
use)
Ecosystem asset
account
Integrated accounts
Augmented input-output tables Integrated sector accounts and
balance sheets

14
mirrors that of the land cover account described in the SEEA Central Framework
noting the likely incorporation of more detailed classes of spatial areas for ecosystem
accounting purposes. The compilation of the ecosystem extent account is described in
Chapters 4 and 7 with relevant information also in the discussion of land accounts in
Chapter 6.
2.14. Step 2: Using the breakdown of ecosystem assets determined for the
ecosystem extent account, the next step is to compile the ecosystem condition
account. This account records information on the various characteristics that reflect
the condition or quality of an ecosystem. This may include information on water,
carbon, biodiversity, and soil. The set of relevant characteristics will depend both on
the type of ecosystem (i.e. indicators for forests will likely be different indicators for
coastal ecosystems) and on the use of the ecosystem since the way in which an
ecosystem is used will usually have a direct effect on the way in which its condition
may change.
2.15. Chapters 4 and 7 discuss the compilation of ecosystem condition accounts in
more detail. Chapter 6 discusses the compilation of information on carbon, water and
biodiversity using accounting approaches since these data are likely to be highly
relevant in monitoring the condition of most ecosystems.
2.16. Step 3: The next step involves the measurement of ecosystem services in
physical terms. This measurement is completed by considering each ecosystem in
turn and determining the relevant ecosystem services and appropriate indicators. This
task should be conducted by using a classification of ecosystem services such as
CICES. In effect a classification can provide a checklist to ensure appropriate
coverage in measurement. This work should lead to the compilation of an ecosystem
services supply account. The possible approaches to measurement are discussed in
Chapter 5.
2.17. Still on ecosystem services, the next aspect is understanding the link between
the supply of ecosystem services and the beneficiaries who use those services. To
support integration with the national economic accounts the beneficiaries in
ecosystem accounting are grouped in the same way as for the economic accounts –
i.e. by industry group and by institutional sector. This information on the types of
ecosystem service used by different beneficiaries is contained in an ecosystem
services use account. The compilation of this account is also discussed in Chapter 5.
2.18. Step 4: Although there are differing views on the merits of monetary
valuation (see Chapter 8 for a discussion), it is the case that there are many examples
of the valuation of ecosystem services and it is a necessary step for the integration of
ecosystem measures into the standard national accounts. There are two main parts to
valuation in ecosystem accounting. First, the valuation of ecosystem services by
applying relevant prices to the physical flows of ecosystem services measured in Step
3. This permits the compilation of ecosystem service supply and use tables in
monetary terms.
2.19. Second, the valuation of ecosystem assets and measurement of ecosystem
degradation. This is done by estimating the net present value of each future flow of
ecosystem service from each ecosystem. There are, of course, many challenges in this
step (discussed further in chapter 8) but a particularly important one is assessing the
extent to which current ecosystem services supply can be maintained. This requires
an assessment of ecosystem capacity – in essence the connection between ecosystem
condition and ecosystem services. Information on ecosystem capacity can be
presented in an ecosystem capacity account, although this area of work is less
developed than other aspects of ecosystem accounting. Using the change in the net
present value of ecosystem assets, a value for ecosystem degradation can be
determined. Opening and closing values for ecosystem assets and changes in those

15
values over an accounting period can be presented in an asset account for
ecosystems.
2.20. The final part of step 4 is the use of information on the value of ecosystem
services, ecosystem assets and ecosystem degradation to augment the current,
standard national accounts. This may be done in a number places including (i) the
input-output table where ecosystems can be incorporated to show the supply of
additional services and the extension of the supply chain; (ii) the sequence of
accounts where measures such as GDP, national income, and saving are adjusted for
the cost of ecosystem degradation; and (iii) the national balance sheet where the value
of ecosystem assets is incorporated to derive extended measures of national wealth.
There are challenges in all of these areas that are discussed at more length in Chapter
9 on integrated ecosystem accounts.
What constitutes ecosystem accounting?
2.21. A reasonable question, in light of the lengthy list of different accounts just
described, is which accounts constitute ecosystem accounting? Further, do all of the
accounts need to be compiled? The response to these questions has two main aspects.
First, ecosystem accounting is as much an approach to measurement as it is a set of
accounts. As outlined further in Section 2.5 ecosystem accounting embodies
important underlying aspects of national accounting by establishing broad and
comprehensive boundaries and standardised relationships between different stocks
and flows. In this context, ecosystem accounting is an approach to measurement that
goes well beyond the measurement of individual ecosystems or the valuation of
individual ecosystem services. It is the bringing together of a variety of information
that is the feature of ecosystem accounting.
2.22. Second, in the context of this comprehensive approach, it must be accepted
that all of the accounts described above cannot be completed at once and there is a
quite natural progression through the accounts. As the progression takes place
ecosystem accounting becomes more advanced but at each point along the way the
completed accounts will be relevant for particular policy purposes and analysis. That
is, it is not necessary to complete the full series of accounts for the information to
become relevant.
2.23. Based on current experience a reasonable first level of attainment in terms of
ecosystem accounting would be the compilation of accounts for ecosystem extent,
ecosystem condition and ecosystem services supply, all in physical terms. These three
accounts form the basis for all accounts beyond and in their own right comprise a
coverage of the key elements of the ecosystem accounting model in Figure 2.1. It is
also likely to be the case that in compiling these accounts it is relevant to compile
several component accounts such as accounts for land cover, carbon, water resources
and biodiversity. These accounts will organise data of value in their own right but
will also directly support the compilation of the primary ecosystem accounts.
2.24. In compiling these first three accounts (extent, condition and ecosystem
services supply) the largest gap lies in the lack of meaningful aggregates that permits
broad assessment across ecosystems (aside from aggregation in terms of total hectares
in the extent account). One path toward aggregation is the use of monetary valuation
and it is in this context that the drive towards valuation and ultimately towards
integration with the standard economic accounts has most relevance. Some may argue
that without this objective being obtained then ecosystem accounting is a “detour”
(Bartelmus, 2015) and lacks real meaning. However, the SEEA perspective is that all
of the accounts described embody national accounting principles and structures and

16
hence work towards the meaningful mainstreaming of environmental information into
economic and other decision making which is the overriding objective of this work.
Further advice on implementation strategies
2.25. To be completed: could include here reference to national work plans, advice
from WAVES document and CBD QSP, reference to the SEEA Implementation
Guide and any other implementation materials
2.4 Key boundary and conceptual issues
2.4.1 Introduction
2.26. Within the context of the conceptual model for ecosystem accounting just
outlined there are many measurement challenges. This section is aimed at
highlighting five key aspects of ecosystem accounting that should be considered in
advancing work in this area. Further discussion of these aspects is presented in the
remaining chapters, sometimes in the form of recommendations for compilation and
testing and sometimes in the form of issues requiring further research and discussion.
2.4.2 The spatial approach to ecosystem accounting
2.27. The ecosystem assets that are the basis for ecosystem accounting are spatial
areas. Consequently, the delineation of spatial areas within a country is a fundamental
part of ecosystem accounting. To support the process of delineation the SEEA EEA
describes a units model in which different types of spatial areas (units) are related to
each other. The units for ecosystem accounting are described in SEEA EEA section
2.3 and the logic is summarized briefly in EEA TG Chapter 3 together with an
introduction to the related issues of classification of units.
2.28. The delineation of units is important for ecosystem accounting since the
ultimate intent is to provide a comprehensive picture of ecosystem assets and the
services they supply across a country without gaps and overlaps in measurement.
Thus defining the units appropriately and consistently in relation to each and over
time is a central feature. An analogous approach is taken in economic measurement
where individual economic units (businesses, households, governments) are classified
to mutually exclusive classes of industries to provide a better understanding of the
changing structure and performance of the economy.
2.29. As discussed in Chapter 3 there remain a number of issues to be resolved in
applying the broad units model to ecosystem accounting. These issues include (i)
determining the appropriate scale for analysis, (ii) defining the relationship between
the delineation of spatial areas (and hence ecosystem assets) and the generation of
ecosystem services since ecosystem services, particularly regulating services, which
may be generated over spatial areas that cross ecosystem asset types; and (iii)
connecting the spatial areas relevant for measuring the generation of ecosystem
services with the location of beneficiaries of those services.
2.30. Another role of the units model is to facilitate the upscaling and downscaling
of information. Since so many different data are likely to be required from national
level production data to site specific condition data, an important challenge in
ecosystem accounting is the integration of information to a common scale, using

17
scaling techniques, and then re-presentation of the data to the relevant level for
aggregation and communication. Chapters 5 and 7 provide a summary of possible
approaches to scaling and the related issues that arise in the context of biophysical
modeling of ecosystem services and indicators of condition.
2.4.3 The treatment of final and intermediate ecosystem services
2.31. The explicit focus of accounting in SEEA EEA with regard to ecosystem
services is final ecosystem services – i.e. the contributions of ecosystems to benefits
used in economic and other human activity. The word “final” was deliberately
dropped in the drafting of SEEA EEA with the intention of making it clear that those
flows that were not considered final were also not considered to be ecosystem
services.
2.32. While this choice was clear and internally consistent, subsequent discussion
and explanation of the ecosystem accounting model suggests that use of the word
“final” as appropriate would help considerably in explaining the model, especially to
those already in the field of ecosystem measurement.
2.33. A primary reason for this change is the increasing recognition of the need to
incorporate into the ecosystem accounting model flows between ecosystems that can
be explicitly linked to the generation of final ecosystem services. A fairly standard
example concerns the soil retention and water purification services provided by
upstream forests to downstream surface water resources from which water is
abstracted for irrigation or household consumption.
2.34. Further discussion on the issue of final and intermediate services is presented
in Chapter 5.
2.4.4 Distinguishing final ecosystem services from benefits
2.35. The SEEA EEA ecosystem accounting model has a clear distinction between
final ecosystem services and benefits. From an accounting perspective the distinction
is meaningful since it facilitates the integration of final ecosystem service flows with
existing flows of goods and services, it recognizes the role of human inputs in the
production process and especially the fact that the relative share of final ecosystem
services may change over time, and it helps in identifying the appropriate target of
valuation since final ecosystem services that contribute to marketed products (e.g.
crops, timber, fish, tourism services) will have a different (lower) price than the
corresponding benefits.
2.36. For these reasons the principle of distinguishing between ecosystem services
and benefits is appropriate. It is also consistent with the approach taken in TEEB
(2010), Boyd and Banzhaf (2007), Haines-Young and Potschin (20xx) and the UK
NEA (2011) although the precise definitions and terms applied for ecosystem
services and benefits varies in the different cases.
2.37. In practice however, particularly at large scales, the explanation and
application of this principle can be challenging. The issues arise differently in the
context of provisioning services and regulating services. For provisioning services,
the difficulties lie in fully describing the various ecosystem services involved in
generating, so-called, cultivated biological resources. Thus for crops, including
plantation timber, and aquaculture, the treatment is that these outputs are benefits
produced as a combination of ecosystem services and human inputs. Further, since
the balance of inputs between ecosystem services and human inputs will vary by

18
production process, this means that the using the measure of output/benefits as a
measure of the ecosystem service may be misleading.
2.38. For regulating services there are generally no human inputs in the production
of benefits and consequently the quantity of ecosystem service will be equal to the
quantity of the benefit. The challenge however is to appropriately describe the benefit
and the ecosystem service such that the focus of measurement is appropriate. The
focus in describing the ecosystem service should be a description of ecosystem
processes or characteristics rather than on why the ecosystem services is a good thing.
For example, in the case of air filtration services the benefit is reduced risk (to the
local population) of respiratory diseases. Or, in the case of the service of soil
retention the benefit is reduced risk of landslides. Focusing on this distinction enables
a clearer description of what the ecosystem is actually doing to be established.
2.4.5 Ecosystem degradation and enhancement
2.39. The measurement of ecosystem degradation is one of the key drivers of
ecosystem accounting and for the SEEA more generally. Indeed, without a concern
for a falling ability of the environment to provide ecosystem services it would be
possible to continue to view the environment as infinitely capable of regeneration and
of supporting economic and human activity.
2.40. While the general idea of ecosystem degradation as reflecting a fall in the
capacity of ecosystems to supply ecosystem services is well accepted – there remains
debate about how this concept should be defined for measurement purposes. The
alternatives are described in SEEA EEA Chapter 4 and are summarized in EEA TG
Chapter 7.
2.41. The related concept is ecosystem enhancement which arises when there is an
increase in the capacity of an ecosystem to supply ecosystem services. Again, there
are some alternative concepts that can be used and also some interesting connections
to the recording of investment in ecosystems which should be recorded as a standard
entry in economic accounts.
2.42. The measurement of degradation and enhancement is closely tied to the
definition of the concept of capacity, which as noted earlier, is a topic of ongoing
discussion. This issue is also picked up in Chapter 7. Ecosystem degradation related
issues also arise in the context of valuation, discussed in Chapter 8, and in terms of
how degradation costs may be allocated across economic units, discussed in Chapter
9.
2.43. In the context of describing general principles for ecosystem accounting the
most relevant observation is that ecosystem degradation is not something that can be
directly measured. It requires consideration of changes in overall ecosystem
condition, in the capacity of the ecosystem and in the overall basket of ecosystem
services. Given that the relationships between these elements are many and varied
then, depending on the assumptions used, different measures and interpretations of
ecosystem degradation will arise. Careful consideration of the relevant building
blocks is required.
2.4.6 Valuation in ecosystem accounting
2.44. Valuation is commonly one of the most controversial issues in ecosystem
accounting. Given this reality, the intent of discussion of this topic in the SEEA EEA
and in EEA TG is to provide a broad base for discussion by articulating the different
elements of the debate and the key conceptual points from a national accounting

19
perspective. The general conclusion to date is that effective valuation in monetary
terms requires careful consideration of the purpose of the valuation – for example for
accounting purposes or for the assessment of trade-offs between alternative scenarios.
Once the purpose is defined the appropriate valuation concept can be selected and
from these relevant valuation methods and techniques can be applied. Often the focus
moves directly to methods and techniques but it is simply not the case of one size fits
all. Chapter 8 provides a description of the relevant issues.
2.45. A fundamental aspect of valuation in an accounting context is that the first
step required is the valuation of individual ecosystem services. In general this will
mean finding an appropriate price to apply to an imputed exchange of ecosystem
services between a given ecosystem asset (e.g. a forest) and an economic unit or
individual (e.g. a forester). Valuing this imputed exchange is the starting point for
broader valuation.
2.46. Valuing ecosystem assets requires considering the future flows of ecosystem
services that are expected to be generated by the ecosystem asset. Generally, this will
mean that a basket of ecosystem services needs to be forecast and priced with the
value of the ecosystem asset then equal to the net present value of the future flows of
expected ecosystem services. Recognising the steps that are required to move from
the valuation of ecosystem services to the valuation of ecosystem assets is important
in making decisions about the nature of implementation of ecosystem accounting.
2.5 Key features of a national accounting approach to ecosystem measurement
2.5.1 Introduction
2.47. Given the focus of ecosystem accounting in the SEEA is predominantly on
the organisation of biophysical information pertaining to ecosystems, it may be
reasonable to conclude that there is little connection to the standard approaches to
national accounting which focuses on the integration of monetary measures of stocks
and flows of goods, services and assets. This section is aimed at explaining the key
features of a national accounting approach and why it provides a distinct
measurement discipline that works very effectively towards the mainstreaming of
environmental information into economic measures.
2.48. First, to place accounting frameworks in context it is relevant to consider the
information pyramid (Figure 2.3). This pyramid has as its base a full range of basic
statistics and data from various sources including surveys, censuses and
administrative sources. Generally, these data will be collected for various purposes
with the use of different measurement scopes, frequencies, definitions and
classifications. Each of these data sources will be relevant to analysis or monitoring
of specific themes.

20
Figure 2.3 Information pyramid
2.49. The role of accounting frameworks (at the middle levels of the pyramid) is to
integrate these data to provide a single best picture of a broader concepts or set of
concepts – for example economic growth or ecosystem condition. The compiler of
accounts must therefore reconcile and merge data from various sources taking into
account differences in scope, frequency, definition and classification as appropriate.
2.50. Finally, having integrated the data within a single framework, indicators can
be derived that provide insights into the changes in composition, changes in
relationships between stocks and flows, and other features taking advantage of the
underlying relationships in the accounts between stocks and flows, between capital
and labour, between production and consumption, etc. Indicators such as GDP,
national saving, national wealth, terms of trade and multi-factor productivity all
emerge from the one national accounts framework.
2.51. This section focuses on the approach that national accountants take to
providing the single best picture in the middle section of the pyramid.
2.5.2 Key features of a national accounting approach
2.52. For those not familiar with the way in which national accountants work
through measurement issues there are two key aspects that should be understood.
First, national accounting approaches generally always commence using data from
multiple sources that has already been collected. National accounting is therefore not
a challenge in defining questions, determining sample sizes, collecting and processing
data, etc. Those tasks are assumed to be completed by experts in specific subject
matter areas or those in charge of administrative data. Ideally, there would be a close
relationship between the national accounts compiler and those collecting the data but
this can take time to evolve and in any event the national accountant will always
remain one step removed from the source data.
2.53. Second, in part as a result of not collecting data but largely as a result of the
underpinning conceptual framework, national accountants work “from the outside
Indicators
Accounts: assets, condition, services
Frameworks: measurement, process, quality
Basic data: environmental, economic, social statistics

21
in”. National accounting is not a “bottom up” measurement approach whereby
aggregates are formed by summing available data. Rather, most effort goes into
ensuring that the estimates that are compiled appropriately reflect the target concept,
for example, economic growth or fixed capital formation or household consumption.
Generally, it will be the case that no single data source can fully measure a single
concept and hence the role of the national accountant is to meld, integrate and
otherwise combine data from multiple sources to estimate the concept as best as
possible.
2.54. Further, on this same point. It is not sufficient to obtain the best estimate of
each concept in isolation. Rather the measurement of each concept must be
considered in the context of the measurement of other concepts following national
accounts identities. Thus, for example, total supply and total use of each product must
align. Ultimately it is the ambition to produce, at a single point in time, the single best
picture, of the concepts in scope of the national accounts framework. This cannot be
achieved by relying on a bottom up strategy where the micro builds neatly to the
macro. Instead, a top down or working from the outside in approach must be applied.
2.55. Building on these two key aspects there are some related national accounting
approaches that should be recognised.
The maintenance of time series is fundamental. In creating the “single
best picture” it is not sufficient for each data point to stand alone and
hence movements and levels must both be considered. Often national
accounts time series extend for over 30 or 40 years and there are few if
any data sources that are maintained consistently over these time frames.
Indeed, generally data sources will improve their methods and coverage
over time. Consequently, a key role in national accounts in linking
information from different sources and over time, various methods may
need to be applied to consistently measure the same concept.
Prices, quantities (volumes) and values are all relevant. While the vast
bulk of the national accounts framework is presented in terms of
relationships in value terms (i.e. in terms of the actual monetary amounts
transacted); the most significant proportion of resources on compiling
national accounts are targeted at decomposing the changes in value
between changes in prices or changes in underlying volumes. Generally,
most analysis of the national accounts, e.g. growth rates, productivity,
investment levels, are conducted in volume terms (i.e. after removing
price effects). Again the single best picture ambition requires balancing
these different perspectives at an aggregate level.
Focus on the aggregate and then the allocation. Although an iterative
approach is necessary at the final stage decisions must be made on the
aggregate measure and then the impact of this decision filtered through
the underlying data to various levels in the classifications – either by
product, industry or institutional sector. This final process of allocation is
the means by which the national accounts approach ensures consistency
and coherence between the various concepts within the framework. It
cannot be assured through coordination of the underlying data.
The need for revisions. Without a time constraint on the integration of
data and the release of results it is likely that the national accounts would
never be completed. Given their scope there is always new information
that might be considered or new methods that might be adopted to refine
the single best picture. National accounting thus works by ensuring the
release at regular intervals of the best picture with the knowledge that it
will be revised in due course and additional information comes to hand.

22
The reality of revisions is an important feature of national accounting
approaches.
Accounting is iterative. Fundamentally, the process of integrating data is
not a once through process. Each time a set of accounts is compiled
different integration issues will arise and will generally only be resolved
through attempting integration, understanding the reasons for imbalances,
and implementing possible solutions. Gradually, a single best picture
emerges. Ideally, resolving these integration issues is a task that involves
both accountants and data supplying areas – often this joint level of
operation is not a feature of accounting in practice.
2.56. One overall consequence of a national accounting approach to estimation is
that comparability between different estimates is not assessed primarily on the basis
of method. In the first instance, comparability is based on the extent to which
different estimates accurately reflect the target concept. Indeed, since each national
accountant will be faced with the integration of different source data a focus on
comparability of methods is likely not a helpful starting point although it must be
accepted that not all methods will produce estimates of equal quality.
2.57. One benefit of a focus on concepts is that countries will tend to focus their
resources on measuring those aspects that are of most relevance to them. For
example, in a country in which agriculture is a dominant activity, resources should be
allocated to measurement of this activity. In a different economic structure, for
example a country with a large finance sector, the balance of resources and the
associated accuracy of methods will and should be different. Since economic
structures changes over time, methods will also need to adapt. The development of
services statistics and associated measurement methods in the past 25 years is a good
example of this process.
2.5.3 Applying the national accounting approach to ecosystem accounting
2.58. For those not of a national accounting background, this description of the
national accounting approach may seem overly loose and lacking in rigour. While it
is certainly the case that national accounting entertains a different approach, it must
be recognised that the ambition in national accounting is different from the objectives
of most statistical or database managers. In most cases, including in the datasets that
underpin ecosystem accounting, the ambition is to generate databases pertaining to a
single theme or topic and to provide the best estimates based on the selected methods
and resources available. While this may well and should involve comparison with
other datasets as part of editing the dataset, it generally does not involve full
integration with those datasets.
2.59. A national accountant is not compiling such a dataset but rather is seeking to
undertake the integration. In many respects this is a role that must be undertaken by
an analyst or decision maker – i.e. making tradeoffs between different data sources
that may suggest different trends. Within the scope of economic analysis, national
accountants have been making these tradeoff decisions about relative data quality (for
example between quarterly and annual data) within the rigour of the national
accounting framework, rather than a situation where each economic analyst was
required to make their own tradeoffs and likely to different definitions of economic
aggregates.
2.60. The application of a national accounting approach within ecosystem
accounting thus extends this approach to the consideration of biophysical and
scientific data. That is, within ecosystem accounting the ambition is to integrate the

23
various sources of information on ecosystem condition, ecosystem services,
economic production and consumption, etc. and to present the single best picture,
based on the available data.
2.61. One consequence is that for ecosystem accounting it is necessary but not
sufficient to have data for a particular ecosystem type (e.g. forests) or for a selected
set of ecosystem services. Rather, effort must be made to obtain information that
permits assessment of the whole area of interest or full scope of supply of ecosystem
services. Certainly it would be relevant to place most resources into measuring those
ecosystems and their services that are considered most relevant but this should not
detract from the ambition to measure the whole.
2.62. In putting these estimates together it means that data that may be regarded as
of good quality are adjusted to ensure an integrated picture. As well, since the
emphasis is on the measurement of a defined framework, some data sources may not
be used, whatever their quality, since they are not defined following the required
concepts.
2.63. While these statements are somewhat stark, in practice, a national accounts
approach is very reluctant to ignore any information. Rather, efforts are generally
made to examine all relevant data and where necessary make adjustments to concepts
to permit integration.
2.64. Further, in the area of ecosystem accounting, work is ongoing to define the
final integrated framework. In this context, there remains considerable scope for an
active dialogue between those managing the underlying data sets and those designing
the ecosystem accounting framework. This dialogue is essential for the generation of
high quality information.
2.5.4 Principles and tools of national accounting
2.65. In this final part of section 2.5, discussion focuses on the main aspect of the
national accounting framework that underpin the design and application of the
ecosystem accounting model described in section 2.2. The focus here is on the main
principles and tools that national accountants apply to ensure coherence in the
integration of data from multiple sources.
2.66. The following paragraphs present a brief description of the relevant
principles. An extensive discussion of the principles is contained in the SNA 2008
and an extended overview is provided in SEEA 2012 Central Framework.
2.67. Accounting identities. The accounting system relies on a number of identities
– that is, expressions of relationships between different variables. There are two of
particular important in ecosystem accounting. First, there is the supply and use
identity in which the supply of a product (or in this case ecosystem service) must
balance with the use of that same product. This identity applies in both physical and
monetary terms. Often information on the supply and use of a product will be from
multiple sources and hence this identity provides a means by which data can be
reconciled.
2.68. Second, there is the relationship between balance sheets and changes in
assets. This identity is that the opening stock plus additions to stock less reductions in
stock must equal the closing stock. Again, this identity applies in both physical and
monetary terms. Without this identity there would be no particular reason to ensure
that observed changes in ecosystem assets aligned with the series of point in time
estimates of ecosystem condition that underpin the balance sheets.

24
2.69. Time of recording. In order to provide a single best picture across multiple
data sources it is essential that there is a common reference point referred to in
accounting terms as the accounting period. Generally, it is recommended that the
accounting period used in the SEEA is one year thus permitting alignment with
economic data that are usually compiled on this basis. Flows are measured in terms of
recording all that takes place during the selected accounting period and stocks are
measured at the opening and closing dates of the accounting period.
2.70. Commonly, different data sources will have different reference periods and
thus adjustments will be required to allow appropriate integration. For example, flows
may cover a date range that is not aligned with the selected accounting period and/or
stock information will relate to a non-opening or closing period date. Where
adjustments are made these should be made explicit or if no adjustments are made
then the implicit assumptions should be described.
2.71. In addition to these key principles there are a few common tools and methods
that national accounts apply. These are
2.72. Benchmarking, interpolation and extrapolation. Among the range of different
data sources there will usually be a particularly sound source in terms of coverage
and quality. Commonly such a source will provide a benchmark at a point in time or
for a given accounting period. Using this information as a base it is then common to
apply indicators to extrapolate this information to provide more up to date estimates
and also to interpolate between benchmarks, for example in cases where the best data
are collected every 3 years but annual estimates are required for accounting purposes.
Generally, these techniques are applied to generate the first estimates for a particular
variable and may be subsequently adjusted through the balancing and integration
process.
2.73. In some respects these types of benchmarking and interpolation/extrapolation
techniques may be regarded as a form of modelling. The extent to which this is the
case will depend on the sophistication of the technique that is used. Generally,
regressions and the like are not utilised since maintaining these models across the full
gamut of a national accounts framework would be very resource intensive. Further,
since the outputs are eventually integrated within a series of accounting identities it
may be difficult to rationalise the statistical advantage of applying detailed modelling
approaches for individual series.
2.74. Modelling. Where modelling does become more in evidence is when there is
a clear shortage of data for particular variables – i.e. there are no direct estimates or
benchmarks that can be used to provide a starting point. In this case, modelling may
be required. An example in standard national accounts is the estimation of estimates
of consumption of fixed capital (depreciation) which are commonly estimated using
the so-called perpetual inventory model (PIM) that requires estimates of capital
formation and assumptions regarding asset lives and depreciation rates.
2.75. In the context of ecosystem accounting, the spatial detail required is likely to
considerably increase the need for modelling and this will be new ground for many
national accountants. Later sections in this EEA TG consider the role of biophysical
modelling in ecosystem accounting and the general issue of benefit transfer where
information from one location is applied in other locations is one that confronts all
those involved in larger scale ecosystem measurement. While these may not be
traditional sources of information for national accounts type work, there is no
particular reason that such modelled data cannot be directly incorporated. It remains
the task of the accountant to integrate all available data as best as possible.
2.76. A general issue that crosses all of the discussion through this section is that of
data quality. Unlike many of the source data that feed into the national accounts it is

25
not usually possible to give a precise estimate of common measures of data quality
such as standard errors. The melding and synthesis of multiple data sources makes
this task relatively intractable. In the same context it is challenging to measure the
significance of the application of accounting principles. While clearly these principles
lead to coherence in the final data – it is often unclear how much adjustment might
have been required in order for the coherence to be enforced.
2.77. Ultimately it will often be the case that accounts are considered of a
relatively good quality if the picture that they present is broadly considered a
reasonably accurate one. This may emerge from consideration of (i) how well the
accounts reflect and incorporate data that are considered to be of high quality; (ii) in
commentary by accountants as to the extent of adjustment required (noting that in a
number of situations accounts may be left unbalanced and the size of the discrepancy
may be a measure of quality); (iii) the size of revisions to the estimates where a
consistent pattern of large revisions to initial estimates either up or down would give
an indication as to the relative quality of the source and methods; and (iv) the
usefulness of the data from the accounts to users. At the end of the day if the data
from the accounts do not support meaningful decision making or analysis then the
quality of the accounts must be questioned.
2.78. A final area of mention concerns the treatment of uncertainty in accounting
contexts. SEEA EEA Chapter 5 provide an overview of several areas of uncertainty
that may affect information used in ecosystem accounting. These include By its
nature, accounting aims to provide a single best picture and in this context would
seem to ignore issues of uncertainty. Two points should be noted. First, to the extent
that the inputs into an accounting exercise are subject to uncertainty then this should
be taken into consideration in the compilation of the accounts themselves. Ideally,
degrees of concern about the data would be the subject of description in the reporting
of accounting outputs. The same holds true for any assumptions that are applied in
the construction of accounting estimates – for example in terms of estimating future
flows of ecosystem services in net present value calculations.
2.79. Second, while not generally undertaken, it would be plausible to consider
publishing some ecosystem accounting aggregates within sensitivity bounds. The
challenge of course is to ensure that a balance in the accounting identities would be
meaningfully maintained but some further consideration of how uncertainty can be
usefully reflected within an accounting context would be welcome.
2.80. Third, accounting does not represent a model for estimating future changes in
systems. The national accounts therefore, organise information about the composition
and changes in economic activity but do not purport to provide future estimates of
economic growth. Economic models, generally using time series of national accounts
data, perform this role.
2.81. In the same way, ecosystem accounting is not designed to provide a model of
how the ecosystem behaves. It records, ex post, measures of changes in ecosystem
condition and flows of ecosystem services. How this information might be combined
to support estimates of future flows or changes in condition is a separate issue and
likely subject to considerable uncertainties. This distinction between creating a
structured set of information and modelling future states is often not made in
scientific discourse and usually forgotten by economists. However, it is fundamental
to understanding the role that accounting may be able to play in supporting the
mainstreaming of environmental information into decision making.

26
3. Ecosystem accounting units of SEEA EEA
3.1 Introduction
3.1. The starting point for ecosystem accounting is the delineation of spatial areas that
represent ecosystem assets. The focus on spatial areas enables the application of
accounting approaches since it means that all areas within a country or region can be
considered in a mutually exclusive manner. The challenge for ecosystem accounting
however is that delineating spatial areas for ecosystems is not a straightforward task
and is certainly not equivalent to using existing administrative or political boundaries
as would normally be applied in socio-economic statistics.
3.2. An initial challenge is that ecosystems are not easy to define spatially. In ecological
terms, ecosystems may be very small or very large and hence determining the
appropriate scale for measurement and analysis is the main requirement. The SEEA
EEA applies the definition of ecosystems from the Convention on Biological
Diversity – “ecosystems are a dynamic complex of plant, animal and micro-organism
communities and their non-living environment interacting as a functional unit” (CBD,
2003, Article 2, Use of Terms).
3.3. From this starting point the SEEA EEA describes a units model that provides a
hierarchy of units at different spatial scales. While the definitions may appear
prescriptive it is recognised that the precise application of the units model will require
testing and application before more definitive guidance can be provided.
3.4. This chapter summarises the units model developed in SEEA EEA. An extended
discussion on the units model and the approaches to delineating relevant spatial units
is provided in ANCA Research Paper #1 (Bordt 2015).
3.2 The SEEA EEA units model
3.5. The role of the units model is two fold. First it allows the organization of information
into separate entities that can then be compared and aggregated. This is akin to the
role of a units model in economic statistics where different types of economic units
(businesses, households and governments) are distinguished by their types of
economic activity and legal structure. Second, the units model and the associated
classifications provide a basis for the structuring of data for ecosystem extent,
condition, and services.
3.6. Generally, the scale imagined for ecosystem accounting relates to broad types of land
cover such as forests, wetlands, grasslands or urban areas. Where these types of land
cover are quite mixed, the scale considered is more at a landscape level. While land
cover is a primary driver of the types of ecosystems considered in ecosystem
accounting, it is recognised that this should not be the only consideration and hence
the SEEA EEA has developed the notion of Land Cover Ecosystem functional Units
(LCEU). An LCEU, in most terrestrial areas, is defined as those areas that satisfy a
pre-determined set of factors relating to the characteristics of an ecosystem. Examples
of these factors include land cover type, water resources, climate, altitude and soil
type (SEEA EEA 2.57).
3.7. To support measurement and recognizing that spatial areas often change
incrementally overtime, the second component of the units model has been defined as
the Basic Spatial Unit (BSU). A BSU is a small spatial area (say 1km2) often formed
by overlaying a grid on a map of a larger area or country. Each BSU can be attributed
a basic set of information (e.g. on land cover, soil type, elevation, land ownership,
etc) and then, using selected characteristics, BSU with common features can be
grouped together. In this sense, LCEU may be formed by combining contiguous BSU
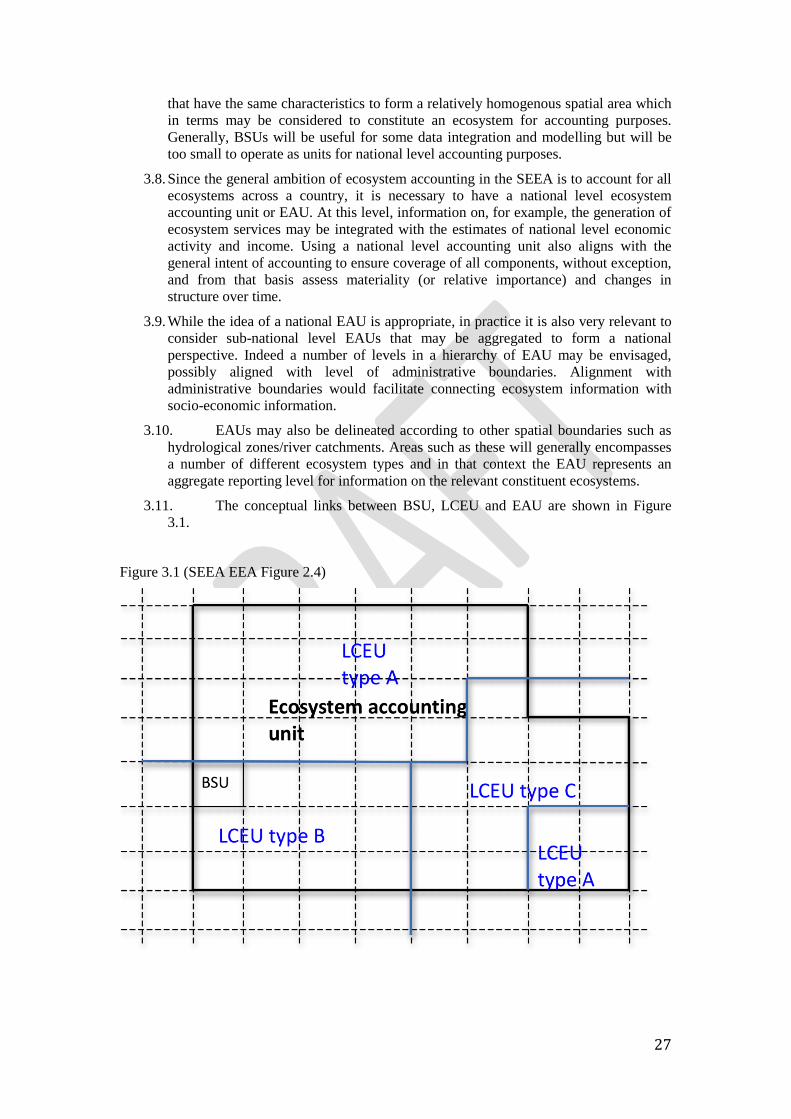
27
that have the same characteristics to form a relatively homogenous spatial area which
in terms may be considered to constitute an ecosystem for accounting purposes.
Generally, BSUs will be useful for some data integration and modelling but will be
too small to operate as units for national level accounting purposes.
3.8. Since the general ambition of ecosystem accounting in the SEEA is to account for all
ecosystems across a country, it is necessary to have a national level ecosystem
accounting unit or EAU. At this level, information on, for example, the generation of
ecosystem services may be integrated with the estimates of national level economic
activity and income. Using a national level accounting unit also aligns with the
general intent of accounting to ensure coverage of all components, without exception,
and from that basis assess materiality (or relative importance) and changes in
structure over time.
3.9. While the idea of a national EAU is appropriate, in practice it is also very relevant to
consider sub-national level EAUs that may be aggregated to form a national
perspective. Indeed a number of levels in a hierarchy of EAU may be envisaged,
possibly aligned with level of administrative boundaries. Alignment with
administrative boundaries would facilitate connecting ecosystem information with
socio-economic information.
3.10. EAUs may also be delineated according to other spatial boundaries such as
hydrological zones/river catchments. Areas such as these will generally encompasses
a number of different ecosystem types and in that context the EAU represents an
aggregate reporting level for information on the relevant constituent ecosystems.
3.11. The conceptual links between BSU, LCEU and EAU are shown in Figure
3.1.
Figure 3.1 (SEEA EEA Figure 2.4)

28
3.12. In the SEEA EEA there was not a great deal of clarity on the relationship
between LCEU and EAU. Further discussion and consideration of the practical
application of the spatial units model has led to the following conclusions.
That LCEU, being defined as areas that are relatively homogenous in
their characteristics, should be considered ecosystem assets for the
purposes of ecosystem accounting.
That LCEU should be delineated such that no LCEU is larger than an
EAU in which it is located. Thus combinations of homogenous and
contiguous BSU may need to be split to not cross the relevant EAU
boundaries.
EAU should not be considered ecosystem assets but rather as higher level
reporting units.
While at the most aggregated level of a classification LCEU may be
delineated solely on the basis of land cover, it is likely that finer level
classes will need to be used in which case factors other than land cover
will be needed to delineate LCEU.
3.13. Given these conclusions the delineation of LCEU and hence of ecosystem
assets is a fundamental step in ecosystem accounting. A balance must be struck
between providing a highly detailed typology of ecosystem assets and providing more
aggregated information that can be more readily translated to providing information
about trends at an aggregate level. Approaches to delineating LCEU and the other
elements of the units model are described below.
3.3 Data sources, classifications and methods for delineating spatial units
3.14. The delineation of spatial units will involve the use of a range of information.
Typical of the type of data are those relating to:
The physical topography of the country (coastline, digital elevation
model(DEM), slopes, river basins and drainage areas)
Land cover
Soil resources
Meteorological data
Bathymetry (for marine areas)
Administrative boundaries
Population
Transport and communication (roads, railways, power lines, pipelines)
3.15. Using these types of information it is possible to construct maps for a given
country outlining different spatial units. In practice, to integrate information from
these different data sources it will be necessary to put in place a standardised grid that
can be used to provide a stable working base for the data. Further, a projection system
that permits translation of information into a flat, two dimensional structure will be
needed. And finally assimilation grids will be needed.

29
3.16. With these data source and tools in place there are a range of choices
available for delineating the spatial units needed for ecosystem accounting. The
following considerations are relevant.
3.17. For BSUs. Most commonly in ecosystem accounting discussion, BSUs are
conceptualised as reflecting individual grid squares or rasters/pixels. This question is
not whether such a concept is appropriate but rather what size the squares should be
for ecosystem accounting purposes. This may, at least at present, be a limited choice
depending on what data are currently available. Generally, information at the level of
1km2 would be considered to be the largest BSU that was appropriate. BSUs down to
5m2 or 10m2 are now possible for some countries, but whether delineation at that
level of detail is required or appropriate for ecosystem accounting remains to be
tested. Another alternative is to define BSUs based on the delineation of cadastres
that are available in some countries. A concern for this approach is that the resulting
characteristics of the BSU may be too heterogeneous to be aggregated meaningfully.
3.18. For LCEUs. There as yet no standardised method for delineating LCEUs and
the approaches for delineating LCEUs depend in part on the amount of information
available that can be attributed to the BSU level and hence be grouped to form
LCEUs.
3.19. At a minimum information on land cover by BSU can be used as a basis for
forming LCEU. An example of this approach is described in the CBD ENCA QSP
(chapter 4) where land cover data, classified using the FAO LCCS v3, is used to form
LCEUs aligned with the proposed LCEU classes in the SEEA EEA. (See table 3.1
below). Depending on the size of the BSUs being used, it may be necessary when
attributing a BSU to a land cover class, to determine the dominant land cover for each
particular grid cell.
Table 3.1 Provisional Land cover/ Ecosystem functional unit (LCEU) classes
Description of classes
Urban and associated developed areas
Medium to large fields rainfed herbaceous cropland
Medium to large fields irrigated herbaceous cropland
Permanent crops, agriculture plantations
Agriculture associations and mosaics
Pastures and natural grassland
Forest tree cover
Shrubland, bushland, heathland
Sparsely vegetated areas
Natural vegetation associations and mosaics
Barren land
Permanent snow and glaciers
Open wetlands
Inland water bodies
Coastal water bodies
Sea
Source: SEEA EEA Table 2.1
3.20. Other approaches have used a broader range of characteristics to delineate
LCEU. These include the approach of the MEGS project in Canada and the work in
Victoria, Australia. Work by SANBI also shows how the same principles of using
multiple characteristics can be applied in the case of marine ecosystems. These
various methods are described in ANCA Research Paper #1.

30
3.21. Another consideration is that accounting may be possible without delineating
LCEUs as such and rather ensuring that all information on ecosystem condition and
ecosystem services is attributed to the BSU level. If this can be done then accounting
may take place at any aggregated scale – i.e. there is no specific requirement to
enforce LCEU classes.
3.22. For EAUs. The most obvious choices of delineation for EAUs relate to
administrative boundaries. These boundaries correspond best to the level of coverage
of government decision making and hence to a range of other socio-economic data.
Depending on the decision making context however other boundaries may be relevant
including river basins, landscapes and viewscapes, and protected areas. In line with
the conclusions above EAUs should reflect an aggregation of both BSU and LCEU.
3.4 Key issues and challenges in delineating spatial units for ecosystem accounting
3.23. As approaches to delineating the SEEA EEA’s units model are developing
there are a number of considerations that should be kept in mind. These issues are
considered in more detail in ANCA Research paper #1.
3.24. First, it is likely that there is no perfect set of spatial units that can deal with
all of the ways in which data might be integrated. Consequently, it is likely to be
useful to develop approaches that permit a degree of flexibility in the delineation of
spatial units.
3.25. Second, the standard model of BSU, LCEU and EAU has been developed to
deal with terrestrial units. Although some work has commenced on the application of
the model to marine areas (South Africa, Mauritius) and to river systems (South
Africa), more work is needed to appropriately incorporate the atmosphere and
airsheds, to deal with linear features such as coastlines and hedgerows, and to account
for the zones between different ecosystem types – known as ecotones – since it is in
these zones that concentrations of ecosystem functions and processes are at their
highest.
3.26. Third, ideally the delineation of spatial units should consider issues of
upward and downwards scaling of information particularly the attribution of
information to the BSU level. Delineating units in a manner that requires a heavier
burden of assumptions to permit scaling would likely reduce the general quality of
the accounts.
3.27. Fourth, it is likely to be the case that delineation of spatial units will involve
the use of satellite and remote sensing data. This is an important step forward but is
not without its challenges particularly in the context of maintaining a consistent time
series for accounting purposes. Particular care is needed in the organisation of
satellite based data since higher resolution is not necessarily the most important factor
for accounting purposes.
3.28. Fifth, particularly for LCEU the choice of classification and the associated
level of detail is particularly important for the preparation of accounts. As explained
further in Chapter 4, the accounts to be compiled in the first stage of ecosystem
accounting – the ecosystem extent account, ecosystem condition account and the
ecosystem services supply account – are all structured based on data at the LCEU
level. Since each LCEU represents an ecosystem asset, measures of condition should
be able to be developed at the LCEU level which in turn should require an
understanding of the relevant characteristics in the supply of ecosystem services at
that level. How effectively these considerations may be brought into the delineation
process requires ongoing discussion and testing.

31
3.29. Another point associated with this last consideration is the extent to which
the LCEU are consistent with ecological factors. Thus, if the LCEU are to represent
ecosystem assets for accounting purposes, it may be reasonable to suppose that they
would also reflect spatial areas that ecologists would consider to be appropriate
functional units.
3.5 Conclusions
3.7.1 Recommended activities and approaches
3.30. To be drafted pending further discussion
3.7.2 Issues requiring ongoing research
3.31. To be drafted and prioritised pending further discussion

32
4. Main ecosystem accounts
4.1 Introduction
4.1. The compilation of accounts is the most obvious task in ecosystem accounting.
Consequently, the presentation of the main ecosystem accounts as explained in this
chapter helps to frame much of the discussion concerning data sources and
compilation methods that follows in the remainder of EEA TG. At the same time, the
accounts should not be taken at face value and there are a number of aspects
concerning the design of the accounts that should be considered before compilation.
These aspects are outlined in section 4.2.
4.2. The remainder of this chapter describes the set of ecosystem accounts as shown in
Table 4.1. As is shown in that table there are some accounts which are considered to
be quite amenable to compilation based on generally available data and methods and
for which the structure of the accounts is well advanced. These are the primary
ecosystem accounts in the top right of Table 4.1. The compilation of these ecosystem
accounts is expected to be complemented and supported by a range of component
accounts that focus on particular ecosystem components. Generally the development
of these accounts is well advanced.
4.3. In the bottom part of Table 4.1 a number of accounts are listed for which further work
on the structure and compilation methods is required. The first two accounts of this
type, the ecosystem capacity account and the asset account for ecosystems are
described further in this chapter. The second two accounts are described in Chapter 9
when the EEA TG discusses issues of integrating ecosystem accounting data within
the structures of the standard national accounts.
Table 4.1: Set of ecosystem accounts
Primary ecosystem accounts Ecosystem component accounts
and related information
Feasibility and
structure of accounts
well advanced
Ecosystem extent account Land cover account
Ecosystem condition account Carbon account
Ecosystem services supply account Water resources account
Ecosystem services use account Biodiversity account
Drivers of ecosystem condition &
change
Structure of accounts
under development
and discussion
Ecosystem capacity account Valuations of ecosystem services
Asset account for ecosystems Reference conditions
Augmented input-output table*
Integrated sector accounts & balance
sheets*
* These accounts reflect the integration of ecosystem accounting based information into the standard
set of national accounts
4.4. While each account stands alone, there are also important connections between the
accounts. These connections reflect the accounting relationships between stocks and
flows that underpin the application of various accounting identities such as the supply
and use identity. Thus, for example, changes in the asset account for ecosystems must
be consistent with recorded changes in the ecosystem condition account.
4.5. The ultimate ambition from a SEEA perspective is to integrated information on
ecosystems into the standard national accounts. It is clear however that this achieving

33
this ambition will require a series of steps to be completed. On the whole, this series
of steps reflects following a path from the ecosystem extent account down the first
column in Table 4.1 towards integrated sector accounts. In effect, each account
provides a base for compilation of the next account in the series. This series of steps
is portrayed more clearly in Figure 4.1 below.
Figure 4.1 Steps in the compilation of ecosystem accounts (building on Figure 2.2)
4.6. At this stage of development of ecosystem accounting it seems most likely that efforts
will should be placed on compiling physical accounts (in the top half of Figure 4.1)
and potentially on compiling the values of the supply and use of ecosystem services
in monetary terms. Beyond this, there remains an ongoing discussion about the
relevant methods and accounting structures and hence these accounts remain clearly
on the development and research agenda.
4.2 Key considerations in defining ecosystem accounts
4.7. Six key considerations emerge in understanding the nature of the set of ecosystem
accounts as presented in the EEA TG. First, it is a set of accounts that is presented
each of which contains specific pieces of information applicable to one part of the
ecosystem accounting model outlined in Chapter 2. There is not a single “ecosystem
account” and it would be inconsistent with accounting principles to force all
information on stocks and flows into a single account while retaining notions of
internal consistency and coverage.
4.8. Second, as far as possible the accounts are designed to link together such that
information can be readily compared between accounts. Thus while there is more
than one account and each can stand alone in accounting terms, there are relationships

34
between the information in different accounts that can be drawn out by structuring the
information appropriately.
4.9. Third, a very specific design feature of the ecosystem accounts is that ultimately the
information should be able to be integrated with the standard national accounts that
record economic activity. This design feature does not impact on all accounts but is a
particularly relevant consideration for accounts concerning ecosystem services.
4.10. Fourth, the structures presented should not be considered unchangeable with
regard to the level of detail they contain. For example, the accounts concerning
ecosystem assets tend to be structured to show high-level LCEU types within an
EAU. In practice it may be relevant to provide finer detail on specific land cover
types (e.g. by type of forest) and to include in the accounts a number of EAU. The
accounting principle of working from the outside-in (see Chapter 2) implies that
rearrangement of information inside the boundary is perfectly reasonable and the
level of detail should be determined based on requirements.
4.11. Fifth, the accounts described in this chapter present information regarding
one accounting period. Most commonly the interest in accounting information stems
from its presentation of time series of information. Presuming that time series of
accounts are compiled, users of accounting information are likely to require a re-
organisation of the information such that time is one of the dimensions recorded. In
practice, this is an issue of data management and dissemination rather than a
conceptual matter. Compilers should feel free to restructure accounts in such a way to
best suit the presentation and analysis of data.
4.12. Sixth, the structure of accounts will generally represent the level of detail
suitable for presentation and analysis. It represents the level of detail at which
accounting relationships (e.g. supply and use, balancing end of period stocks and
changes in stocks) are applied. However, it will generally be relevant for underlying
information to be compiled at different, usually lower, levels of aggregation before
entry into the accounts. Put differently, it is not necessary for the structure of the
input data to match the structure of the output data.
4.13. In the case of ecosystem accounting, it is likely to be ideal to compile data at
an appropriately detailed level, e.g. by BSU, and then aggregate to the relevant LCEU
or EAU level for accounting purposes. This does not require that accounts are
developed at the BSU level but rather that the input data and the output data
contained in the accounts are managed distinctly. Making this distinction is essential
if changes in input data – which is by far the most common situation – are to be
managed without affecting the integrity of the time series of data contained in the
accounts themselves.
4.14. With all this in mind the following accounts should be taken as a guide to the
types of information that can be organized following an accounting logic. Countries
are encouraged to compile accounts using structures that are most appropriate to
analyzing the aspects of ecosystems that are most material to understanding the
relationship between ecosystems and the economy in their country.
4.15. The following accounts should also be considered as a guide in the sense that
further testing and discussion is required before a more definitive set of ecosystem
accounts can be articulated. This is true from both a measurement perspective and
from a user perspective. These accounts reflect the most current understanding of
likely data availability and the most useful level for analysis but both of these issues
are matters of ongoing discussion.

35
4.3 Ecosystem extent accounts
4.16. The starting point for ecosystem accounting is most likely organizing
information on the extent or area of different ecosystems across a country. This is
important for three reasons. First, the task of establishing the ecosystem of interest for
accounting purposes is by no means straightforward and a balance between scales of
analysis, available data and policy questions will need to be found. Starting the
discussion of the balance by looking at the most conceptually straightforward issue of
area is very appropriate.
4.17. Second, the organisation of information and data sources required to establish
an ecosystem extent account is likely to be a good entry point for establishing the
spatial infrastructure required for ecosystem accounting. As described in more detail
in Chapter 3 the delineation of spatial units will require the co-ordination of a range
of information. Ecosystem extent accounts will be a first application of this process.
4.18. Third, the structure of the ecosystem extent account, as shown below, gives a
clear indication of the nature of accounting for assets in a SEEA context. The
requirement to produce a time series of data to allow meaningful comparison between
the opening and closing of an accounting period is clear but one that is likely to be
challenging in a spatial data context.
4.19. Fourth and finally, while the ecosystem extent account provides a clear base
for the development of the other ecosystem accounts it also provides important
information in its own right. Commonly, higher level extent accounts will be based
primarily on land cover information. It is generally recognised that monitoring
changes in land cover is an important and effective high-level monitoring approach
that should reflect the most significant changes in ecosystem condition and
biodiversity (e.g. PBL Globio modelling, Costanza et al change in ecosystem service
values, others??).
4.20. A structure of a basic ecosystem extent account is shown in Table 4.2. The
structure of the columns reflects the basic logic of asset accounts as described in the
SEEA Central Framework with an opening extent (likely in hectares), closing extent
and both additions and reductions. The rows reflect the chosen classification to reflect
the ecosystem types across a country. The proposed structure here uses LCEU classes
based on the interim LCEU classification in the SEEA EEA. Additional classes may
be added depending on the ecosystem types of most relevance within the country.
Table 4.2 Ecosystem extent account
Cover
Open
wetlands Total
Use Infrastructure Residential
Permananet
crops Maintenance Forestry Protected Infrastructure Aquaculture Maintenance
Ownership Government Private Private Private Private Government Government Private Government
Units
Opening Stock
Additions to Stock
Managed expansion
Natural expansion
Reductions to stock
Managed regression
Natural regression
Closing stock
Urban and associated
Rainfed herbaceous
cropland Forest tree cover Inland water bodies
hectares
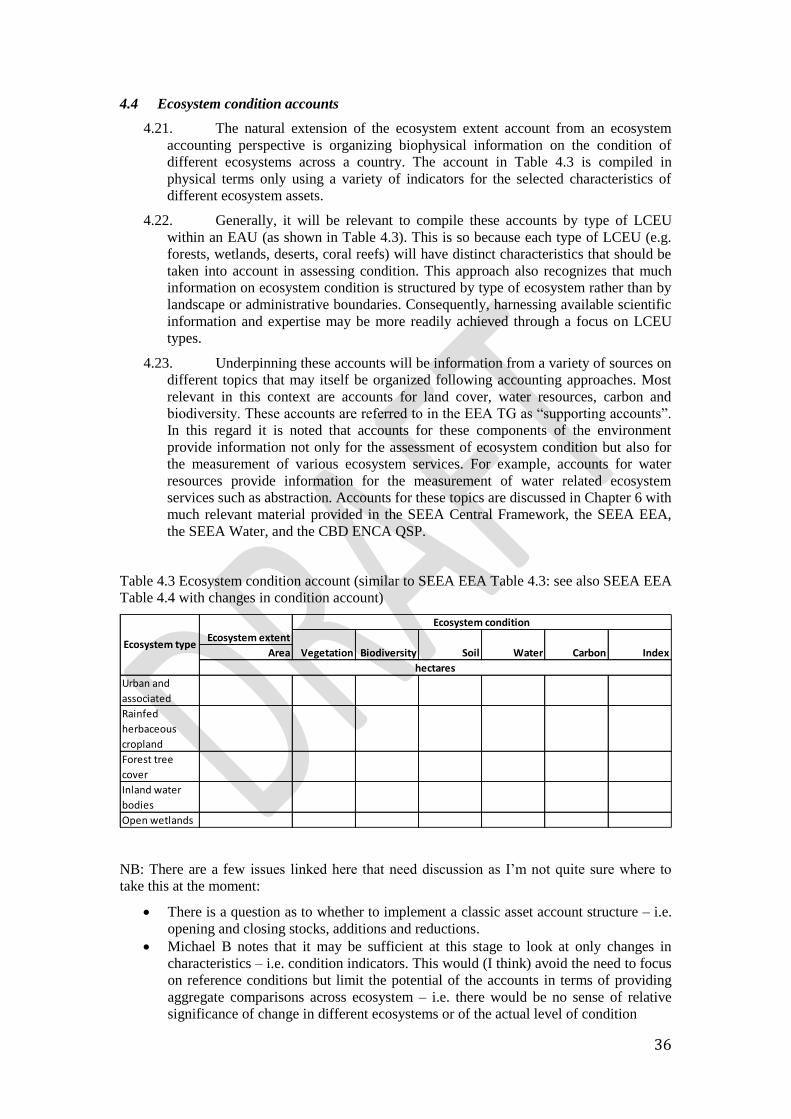
36
4.4 Ecosystem condition accounts
4.21. The natural extension of the ecosystem extent account from an ecosystem
accounting perspective is organizing biophysical information on the condition of
different ecosystems across a country. The account in Table 4.3 is compiled in
physical terms only using a variety of indicators for the selected characteristics of
different ecosystem assets.
4.22. Generally, it will be relevant to compile these accounts by type of LCEU
within an EAU (as shown in Table 4.3). This is so because each type of LCEU (e.g.
forests, wetlands, deserts, coral reefs) will have distinct characteristics that should be
taken into account in assessing condition. This approach also recognizes that much
information on ecosystem condition is structured by type of ecosystem rather than by
landscape or administrative boundaries. Consequently, harnessing available scientific
information and expertise may be more readily achieved through a focus on LCEU
types.
4.23. Underpinning these accounts will be information from a variety of sources on
different topics that may itself be organized following accounting approaches. Most
relevant in this context are accounts for land cover, water resources, carbon and
biodiversity. These accounts are referred to in the EEA TG as “supporting accounts”.
In this regard it is noted that accounts for these components of the environment
provide information not only for the assessment of ecosystem condition but also for
the measurement of various ecosystem services. For example, accounts for water
resources provide information for the measurement of water related ecosystem
services such as abstraction. Accounts for these topics are discussed in Chapter 6 with
much relevant material provided in the SEEA Central Framework, the SEEA EEA,
the SEEA Water, and the CBD ENCA QSP.
Table 4.3 Ecosystem condition account (similar to SEEA EEA Table 4.3: see also SEEA EEA
Table 4.4 with changes in condition account)
NB: There are a few issues linked here that need discussion as I’m not quite sure where to
take this at the moment:
There is a question as to whether to implement a classic asset account structure – i.e.
opening and closing stocks, additions and reductions.
Michael B notes that it may be sufficient at this stage to look at only changes in
characteristics – i.e. condition indicators. This would (I think) avoid the need to focus
on reference conditions but limit the potential of the accounts in terms of providing
aggregate comparisons across ecosystem – i.e. there would be no sense of relative
significance of change in different ecosystems or of the actual level of condition
Area
Urban and
associated
Rainfed
herbaceous
cropland
Forest tree
cover
Inland water
bodies
Open wetlands
hectares
Ecosystem typeEcosystem extent
Ecosystem condition
Vegetation Biodiversity Soil Water Carbon Index
37
I’m not sure what advice we are thinking of giving countries on condition accounts.
Part of it seems to be that the condition accounts provide a place whereby a lot of
useful information can be brought together which is OK but perhaps some more focus
is needed.
Do we have a good example of a condition account that we can refer to?
Some discussion on the choice of characteristics that would be relevant in monitoring
condition is appropriate but I think this would be placed in Chapter 7.
4.5 Ecosystem services supply account
4.24. The supply of ecosystem services by ecosystem assets is perhaps one of the
most important aspects of ecosystem accounting since this is the flow that reflects the
link between ecosystems and economic and human activity. This account records the
actual flows of ecosystem services supplied by ecosystem assets during an accounting
period within an EAU by type of ecosystem service and by type of LCEU. The
account may be compiled in either physical or monetary terms.
4.25. The challenge in compiling this account may be attributing the generation of
ecosystem services to a specific LCEU. This is unlikely to be an issue for
provisioning or cultural services but it may be of concern for regulating services in
cases where the service is effectively provided through a combination of ecosystem
types.
4.26. Given this, it is recommended that, as a first step in accounting for ecosystem
services, compilers create a table showing which ecosystem services are likely to be
generated from each LCEU type for their country or target EAU area. In undertaking
this task, it is relevant to use a classification of ecosystem services such as CICES as
a type of checklist. It is to be expected that for some services, particularly regulating
services, the same service is generated by more than one LCEU type.
4.27. It may be relevant to use this initial table as a discussion document to get
input from various experts. At the same time it is important the development of such
a table be informed by people experienced in considering the link between
ecosystems and economic and human activity such that commonly overlooked
services are not ignored.
4.28. This table would also serve as a basis for scoping and prioritising the
required work, and comparing compilation exercises across countries (for example
comparing lists of ecosystem services attributed to forests). Completing such a table
is also a good expression of the accounting approach of working from the outside-in,
in contrast to the measurement of selected ecosystem services for specific ecosystem
types.
4.29. The proposed ecosystem services supply account (Table 4.4) has rows
reflecting the various ecosystem types and columns reflecting the range of different
ecosystem services, in this case classified following CICES. Note that in this table
there is no direct recording of the beneficiaries or users of ecosystem services, this
takes place in the ecosystem services use account. At the same time, it may be
relevant to compile information on the combination of ecosystem, ecosystem service
and beneficiary at the same time.
4.30. The choice of indicators for measuring the flows of different ecosystem
services is discussed in Chapter 5 and relevant data sources and examples are
provided in that chapter. Recommendations for countries and avenues requiring
further testing and research are also discussed in Chapter 5.

38
Table 4.4 Ecosystem services supply account (LCEU by CICES)
4.31. The ecosystem services supply account shown in Table 4.4 is intended to be
compiled in physical terms. Thus for each ecosystem service there will be a different
indicator of the flow. One consequence is that there can be no aggregation of
ecosystem service flows either across different ecosystem types or across different
ecosystem service types. Further, no relative importance of individual ecosystem
services can be immediately determined.
4.32. For accounting purposes, the primary approach to aggregation and assessing
relative importance is the use of monetary valuation. The ecosystem services supply
account can be compiled in monetary terms by applying appropriate prices to the
physical flows of each ecosystem service. The ecosystem services supply account
shown in Table 4.4 is then extended with additional rows and columns to record the
total flows of ecosystem services. The estimation of prices for ecosystem services is
discussed in Chapter 8.
4.6 Ecosystem services use account
4.33. This account builds on the ecosystem services supply account. However,
unlike the supply account, the focus is not on use within defined spatial areas. Rather,
the primary focus is on understanding the link between type of ecosystem services
and types of beneficiaries. These beneficiaries include economic units classified by
industry, government sector and household sector units, following the common
conventions of organising the national accounts.
4.34. This focus arises because, while the supply of ecosystem services can be
directly linked to a spatial area (e.g. to an LCEU), there is no requirement that the
location of the beneficiary and the location of the area in which the ecosystem service
is supplied are the same – this is especially the case for regulating services but also
for some cultural services.
4.35. Given the lack of a definitive spatial link, the design of the ecosystem
services use account must be guided by possible uses and analysis of data. The choice
made here is to structure the ecosystem services use account for an EAU (possibly at
national level) showing the total supply of each ecosystem service (in the first
column) and the allocation of this supply to the various economic and other units.
This allocation provides the first sense of a direct link to the national accounts
datasets. The ecosystem services use account is shown in Table 4.5.
Units Urban Pasture Cropland Forest Heath Peat Water
Other
nature
Provincial
total
Hunting kg meat - 9,100 14,732 8,100 678 70 1,513 34,193
Drinking water
extraction103 m3 water
4,071 7,026 11,227 3,117 214 - 478 862 26,995
Crop production 106 kg produce - - 1,868 - - - - - 1,868
Fodder production106 kg dry
matter 533 251 784
Air quality
regulation103 kg PM10 272 404 717 700 45 7 40 69 2,254
Carbon
sequestration106 kg carbon
875 8,019 273 50,664 393 149 - 1,056 61,429
Cultural Recreational cycling 103 trips 2,690 1,863 2,611 1,565 30 3 139 220 9,121
Land cover type
Provisioning
Regulation
Ecosystem service

39
Table 4.5 Ecosystem services use account
4.36. While a precise link between beneficiaries and the spatial areas from which
ecosystem services are supplied may be difficult to define, it is likely to be useful to
consider, for different ecosystem services, whether the beneficiaries are, in general
terms, local, national or globally connected. For example, in the case of most
provisioning services the direct beneficiaries will be located within the supplying
spatial area (e.g. farmers, foresters, fishermen, water supply companies). This will
also be true of many cultural services where there is a recreational or touristic
component. However for many regulating services the beneficiaries will be located in
neighbouring ecosystems (for example air filtration) or will be global beneficiaries
(for example with respect to carbon sequestration).
4.37. As for the ecosystem services supply account, this account may be compiled
in both physical and monetary terms. In physical terms entries will be limited to
measures of indicators for each ecosystem service noting that since supply must equal
use, the unit of measure applied for each ecosystem service must be the same in both
the supply and use table in order for a balance to be obtained.
4.38. In monetary terms entries for the total use of ecosystem services will also be
able to be derived both for individual ecosystem service types and for total use by
each beneficiary. The estimation of prices for ecosystem services is discussed in
Chapter 8.
4.39. The presentation of accounts outlined here may suggest that the supply of
ecosystem services would necessarily be compiled before measuring the use of
ecosystem services. In practice the reverse may be the case or at least compilation of
the accounts should take place in an iterative fashion. For example, measures of
provisioning services are likely to be determined in the first instance by the extraction
of materials or energy from the environment by economic units, i.e. a use perspective.
It is then this perspective then drives the estimation of supply. Since for all final
ecosystem services there must be some link to economic units and other human
activity, there is a strong case for compiling both the supply and use of ecosystem
services in tandem.

40
4.7 Additional accounts for ecosystems
4.7.1 Introduction
4.40. Most measurement effort in the scope of ecosystem accounting has focused
on the four accounts just described concerning ecosystem extent, ecosystem
condition, ecosystem services supply and ecosystem services use. Generally not all of
these accounts have been compiled within a single project but there is a steadily
increasing body of practical knowledge on approaches to measurement, including on
the valuation of ecosystem services.
4.41. Nonetheless from a complete ecosystem accounting perspective these four
accounts do not cover the full range of information that would lead to ecosystem
accounting data being fully integrated with the standard national accounts. This
section describes the four accounts that are relevant in this context – the ecosystem
capacity account, the asset account for ecosystems, the augmented input-output table
and the integrated sector accounts and balance sheets.
4.42. These accounts are currently considered to be on the research agenda for
ecosystem accounting although many ideas for relating to these accounts are quite
well developed or at least well understood if not resolved. Three of the accounts, all
except the capacity account, can be compiled only in monetary terms and hence, in
addition to resolving any conceptual issues, their development and testing relies both
on advancing the techniques for valuation of ecosystem services and also on
decisions about whether monetary valuation should be undertaken.
4.7.2 Ecosystem capacity account
4.43. The accounts to this point have contained information on the state and
changes in state of ecosystem assets and on the flows of ecosystem services from
those assets to beneficiaries including into the economy. These two broad sets of
information are important and useful and cover the key parts of the ecosystem
accounting model. What is missing however are accounts that highlight the
relationship between the assets and the services and that start to aid discussion of the
complexities around the issues of trade-offs and sustainability that lie at the heart of
ecosystem accounting.
4.44. In this context, research and discussion on ecosystem accounting is working
towards defining the concept of ecosystem capacity and the design of an ecosystem
capacity account. In principle, this account would record information on the capacity
of different ecosystem assets to supply ecosystem services into the future and record
the nature of any changes (increases or decreases) in this capacity.
4.45. The idea of ecosystem capacity is mentioned in SEEA EEA (Chapter 4) but a
definition appropriate for measurement and accounting purposes was not developed.
Thus, ecosystem capacity accounts are also not presented in the SEEA EEA. A
summary of current thinking on ecosystem capacity is presented in Chapter 7 and
work on developing accounting structures will emerge from this ongoing work.
4.46. Given this situation, it is not expected that countries compile ecosystem
capacity accounts. However, it should be recognised that a general requirement to
consider questions of capacity will emerge when interpreting and applying the
ecosystem accounting information contained in the initial four tables. In effect, a
focus on measuring ecosystem capacity becomes a natural extension of the initial
accounting work.

41
4.7.3 Asset account for ecosystems
4.47. The SEEA Central Framework uses the asset account structure to record
information on stocks and changes in stocks (additions and reductions) of individual
environmental assets such as mineral and energy resources, timber resources, water
resources, etc. This standardised approach to recording information about specific
asset types is particularly useful way of structuring relevant information about
changes in the asset base.
4.48. When focusing on individual environmental assets it is possible to develop
asset accounts in both physical and monetary terms since the units of measurement in
physical terms can be consistently used in a single account. For example, all timber
resources can be measured in cubic metres.
4.49. For ecosystem assets, their measurement in physical terms is a much more
complex process requiring the integration of data on a range of characteristics.
Aggregation to form single measures of the opening stock of the condition of an
ecosystem is not straightforward in physical terms and hence an asset account for
ecosystems in physical terms is not developed in the SEEA EEA.
4.50. Aggregation through monetary valuation of ecosystem services does however
provide a way of developing an asset account for ecosystems. Applying the standard
national accounting technique of net present value, the opening and closing stock
value of an ecosystem asset can be estimated by forecasting the future flows of
ecosystem services and discounting these flows to provide a current, point in time,
estimate of their value. Additions and reductions in the stock can be measured by
recording the value of the relevant flows – e.g. reductions in stock due to extraction
would be equal to the value of relevant provisioning services.
4.51. The relevant accounting structure is shown in Table 4.6. This structure
reflects the proposal from SEEA EEA Table 6.1. The entries in the columns are
relatively standard asset account entries similar to those from the SEEA Central
Framework. In the columns different presentations are possible given that the data are
in monetary terms. That is, the asset account may relate to an individual ecosystem
asset (e.g. a specific wetland), to a type of ecosystem (e.g. all forests), or to an
administrative region or country.

42
Table 4.6 Stylised ecosystem asset account entries (from SEEA EEA Table 6.1)
Ecosystem accounting unit or
LCEU
Opening stock
Additions to stock
Regeneration - natural (net of normal natural losses)
Regeneration – through human activity
Reclassifications
Total additions to stock
Reductions in stock
Reductions due to extraction and harvest of resources
Reductions due to ongoing human activity
Catastrophic losses due to human activity
Catastrophic losses due to natural events
Reclassifications
Total reductions in stock
Revaluations
Closing stock of ecosystem assets
4.52. Entries in the asset account for ecosystems go beyond the measurement
requirements of the ecosystem services supply account in monetary terms by
incorporating the use of net present value techniques. That is, the focus is on the
measurement of the value of ecosystem assets as distinct from ecosystem services. In
measurement terms this represents a considerable increase in uncertainty given the
general challenges of net present value based estimation.
4.53. Using the data recorded within an asset account it is possible to derive an
estimate of ecosystem degradation in monetary terms. In general terms, ecosystem
degradation will reflect the decline in the value of an ecosystem asset over an
accounting period (i.e. between opening and closing positions) where the decline is
considered to be due to human activity. However, further consideration of exactly
how ecosystem degradation should be measured is required building on the
discussion of this issue in SEEA EEA Chapter 4.
4.7.4 Integrating ecosystem accounts with standard national accounts
4.54. The structures of the previous accounts do not require any significant
consideration of the links to the standard economic accounts of the SNA. In essence
they are accounts that concern ecosystems in the first instance and consequently their
structures reflect information relevant to both compiling and interpreting information
about ecosystems. Certainly, the accounts use, as appropriate national accounting
classifications (e.g. of beneficiaries) and follow standard accounting structures, but
there is no integration with the national accounts beyond this.
4.55. There are two types of accounts that focus on the integration of ecosystem
accounting data as developed in the accounts above with the standard national
accounts. The first is an augmented input-output table. The logic for this table is
recognising that as part of developing the ecosystem accounting model the production
boundary for the national accounts has been extended to incorporate the flows of

43
ecosystem services. Consequently, the standard input-output table can be augmented
by including these additional “products” alongside the standard set of good and
services. Further, this requires that ecosystems be recognised as additional
“industries” in the input-output framework. Due to the objective of integration, the
augmented input-output table would be compiled in monetary terms using as inputs
valuations of flows of ecosystem services.
4.56. While the concept of an augmented input-output table is a natural application
of the extended production boundary, this type of table was not developed in the
SEEA EEA and further work is required to advance its design and potential role. A
longer description of the proposed table, including its distinction from
environmentally extended input-output tables (EE-IOT), is presented in Chapter 9.
4.57. The second type of accounts is integrated institutional sector accounts and
balance sheets. These accounts, commonly referred to in national accounting as the
sequence of accounts, record information on the generation and distribution of
income, saving and investment by institutional sectors (e.g. household saving),
transactions in financial assets and liabilities, and estimates of net wealth by sector.
4.58. Developing these accounts is important as they record the attribution of
ecosystem degradation to economic units and the extension to the asset boundary in
the measurement of net wealth. However, while the purpose of these accounts is clear
there remain long standing issues, primarily about the allocation of degradation to
economic units, that have meant a resolution to the design of these accounts has not
been found. The SEEA EEA Chapter 6 discusses these issues and some further
aspects are presented here in Chapter 9.
4.8 Ecosystem component accounts
4.59. Table 4.1 highlighted that, in addition to the primary ecosystem accounts that
have been described in this chapter, there are also a number of ecosystem component
accounts that may be compiled as part of an ecosystem accounting program of work.
For component accounts are noted in Table 4.1 – land cover accounts, carbon
accounts, water accounts and biodiversity accounts.
4.60. These component accounts are aimed at supporting the compilation of
ecosystem accounts by organising underlying information in a manner consistent with
the accounting framework. In addition the component accounts can stand alone and
may provide very useful information in their own right. For example, the carbon
stock account may be used directly to support estimation and analysis of GHG
emissions.
4.61. A discussion of component accounts is provided in Chapter 6 building on
descriptions of the four accounts in the SEEA Central Framework and in the SEEA
EEA.

44
5. Accounting for flows of ecosystem services
5.1 Introduction
5.1. Ecosystem services are the glue that enables the connection to be forged between
ecosystem assets on the one hand and measurement of economic production and
consumption on the other. Their measurement is thus central to the ambition to
integrate environmental information fully into the existing national accounts.
5.2. Recognition of the potential role of the ecosystem services concept in an accounting
context however has come well after the development and testing of the concept in
other disciplines. The reality that confronts the ecosystem accountant is one of
multiple definitions, alternative boundaries and classifications and a wide array of
measurement methods. The SEEA EEA attempted to chart a course through the
various discussions on ecosystem services and consequently made a range of choices
about the definition and measurement of ecosystem services for the purpose of
integrating measures of ecosystem services within the national accounts framework.
5.3. This chapter summarises the main points from the SEEA EEA concerning ecosystem
services, discusses possible refinements, describes the main measurement issues and
outlines some of the remaining challenges. Further detail on the measurement and
classification of ecosystem services is presented in Part II Chapter 10.
5.2 The definition of ecosystem services
5.4. Because of the ambition to integrate measures of ecosystem services with the
standard national accounts, the measurement scope and definition of ecosystem
services in the SEEA EEA must be defined in the context of the boundary used in the
SNA to set the measurement scope for the production of goods and services, the
production boundary. This boundary in turn sets the scope for the measurement of
GDP and related measures of production, income and consumption.
5.5. An important part of the rationale for measuring ecosystem services is the
understanding that much economic production (for example in agriculture, forestry
and fisheries) utilizes inputs from ecosystems but these inputs are not recorded in the
standard accounting framework. In these situations, the logic of the SEEA EEA is
that ecosystem services should be differentiated from the goods and services that are
produced and rather the ecosystem services represent the contribution of the
ecosystem to the production of those goods and services. In effect this sets up an
extended input-output or supply chain that includes ecosystems as a supplier whose
contribution was previously not explicitly recognised.
5.6. A second important part of the rationale for measuring ecosystem services is the
understanding that there are many benefits that economic units and society more
generally receive from the functioning of ecosystems and that a full and proper
accounting would incorporate this production of services by ecosystems, and the
consumption of them in economic and human activity.
5.7. With these two rationales in mind, the SEEA measurement of ecosystem services
recognizes all of the additional production by ecosystems. If accounting had been
starting from a zero base of information on ecosystem services then it seems possible
that measurement would be simply limited to this scope. However, as noted, the
measurement of ecosystem services has a longer and wider history and consequently
the following factors need to be taken into account.

45
5.8. Distinguishing ecosystem services and benefits: The SEEA EEA accounting model
makes a clear distinction between ecosystem services and the benefits to which they
contribute (see discussion in section 2.5). The distinction is important such that (i)
ecosystem services can be integrated with the standard system of national accounts;
(ii) that clear objects for measurement and valuation can be described; and (iii) to
ensure that the contribution of ecosystems can be clearly described and changes in the
contribution can be understood.
5.9. Distinguishing final and intermediate ecosystem services: The distinction between
final and intermediate services reflects the principles of national accounting wherein
aggregate production is measured by netting out flows along the supply chain such
that double counting is removed. In the context of ecosystem accounting this means
that cases where ecosystems provide services to a neighbouring ecosystem (e.g. via
pollination, water filtration or soil retention) these should be considered intermediate
and considered inputs to the generation of other ecosystem services. While
straightforward in theory the complexity in the functioning of ecosystems means that
in practice it can be difficult to make this distinction.
5.10. Further, while at an aggregate level a focus on only final ecosystem services
is appropriate, this may not be the case when considering the contribution of
individual ecosystems whose primary function might be to support neighbouring
ecosystems.
5.11. Since the drafting of SEEA EEA, further consideration highlights another
important issue in the treatment of intermediate services. In the SEEA EEA, the flows
between ecosystem assets, if recorded, were considered inter-ecosystem flows and in
turn these flows were equated with intermediate services. However, recording only
the physical flows does not serve to highlight the dependencies between ecosystems
and indeed there are many ecosystem services both final and intermediate for which
there is no direct physical flow. For example, the filtering of air by trees happens in
situ. It is important then to separate the issue of accounting for physical flows of
materials and energy between ecosystems and accounting for flows of intermediate
ecosystem services.
5.12. With a focus on intermediate services, the challenge from an accounting
perspective is not that flows of services between ecosystem assets cannot be recorded
in the system, but rather that defining the measurement boundary is quite unclear.
That is, there is a general sense that it is not advisable to attempt to measure all flows
and dependencies between ecosystems and, indeed, current ecological knowledge
would seem to suggest this was not practical in any event. Consequently, it is an open
question as to which intermediate ecosystem services should be considered within
scope of ecosystem accounting.
5.13. In this situation the following observations are relevant
One of the most important and common inter-ecosystem flows is water
and hence it is likely that some of the most important intermediate
ecosystem services are related to flows of water.
A second area of likely importance is the provision of habitat services by
certain ecosystem types where the role of these services is embodied in
the mature animal that is an input to final ecosystem services, commonly
in a separate ecosystem.
One means by which the scope of intermediate services may be contained
is to ensure recording only of those intermediate services from another

46
ecosystem asset that are considered a direct input to a final ecosystem
service.
It also seems appropriate - for accounting purposes, to ignore the flows
within the bounds of an ecosystem asset since these services will be
embodied within the final ecosystem services generated by the asset.
Based on these last two observations the recording of intermediate
services will be directly affected by the scale of analysis since with
smaller ecosystem assets there will be an increased likelihood of
intermediate services being recorded.
While restricting the scope of intermediate services may seem limiting, it
is appropriate to regard any measures of ecosystem services as reflecting
a lower bound of the quantity of services that may be flowing between
ecosystem assets.
The recording of intermediate services would seem most useful for the
purposes of management information. In aggregate, at national level, it is
likely that most intermediate services will offset each other since
ultimately their value is embodied in final ecosystem services. However,
recognizing the relative value of different ecosystems within a country is
likely to be very relevant for management purposes.
Increasing the measurement scope to include certain intermediate
services causes no specific issues in terms of accounting structure. The
changes needed would be to recognize additional service types and also
to recognize flows between ecosystem assets in addition to those flows of
final ecosystem services from ecosystems to economic and human
activity.
5.14. The treatment of other environmental services: As noted in the SEEA EEA
Table 2.3, not all flows from the bio-physical environment to the economy and
society can be considered ecosystem services. There are a range of so-called “abiotic”
services reflecting the flows we receive in the form of mineral and energy resources,
flows of renewable energy such as solar, wind, wave and geo-thermal energy, solar
energy for photosynthesis, oxygen for combustion, air for respiration and more
generally, the space for people to live, work and play.
5.15. Since the focus of the SEEA EEA is on ecosystems accounting for these
various flows is not considered in the ecosystem accounting model. Many of these
flows are considered in specific accounts described in the SEEA Central Framework
(e.g. mineral and energy accounts, energy supply and use tables and land use
accounts). At the same time, the spatially explicit approach outlined in the SEEA
EEA may mean that it is highly relevant to consider incorporating measures of abiotic
services to consider the full range of issues within a defined area. The extension of
the accounting tables to consider this aspect has not been developed at this stage.
5.16. Determining the link between biodiversity and ecosystem services: This is a
complex issue. On the whole, the perspective taken for ecosystem accounting in the
SEEA EEA is that biodiversity is more fundamentally a characteristics of ecosystems
– that is, changes in biodiversity are more directly reflected in changes in the
condition of ecosystems. The exact nature of the relationship between biodiversity
and ecosystem condition is a matter of considerable uncertainty but in principle the
discussion of that issue lies in that part of the ecosystem accounting model.
5.17. At the same time it is recognised that there are some aspects of biodiversity,
especially species diversity, that supply final ecosystem services. This includes, for
example, the cultural service of iconic species or the recreational services from a zoo.

47
There are most likely other examples in this area. The issue from an ecosystem
accounting perspective is to aim to discuss biodiversity in a manner that does not aim
to place all information on biodiversity in one place but to recognise that measures
related to biodiversity may be appropriate in different contexts.
5.18. The treatment of ecosystem disservices: Ecosystem disservices pertain to
cases where the interaction between the ecosystem and humans is considered to be
bad. Usually this refers to things such as pests and diseases that emerge from
ecosystems to negatively affect economic production and human life. The SEEA
EEA recognises the frequent discussion on the measurement of ecosystem disservices
but does not propose a treatment in accounting terms.
5.19. This is because, unfortunately, accounting principles do not work well when
trying to make a distinction between products that may be considered as either
“goods” and “bads”. Accounting makes no assumptions as to the welfare effects of
use and focuses instead on the activity associated with the generation of products and
the associated patterns of use by economic actors. As a consequence all flows
between producers and consumers have positive values in the accounts irrespective of
their possible welfare effects. The positive values arise since it is difficult to envisage
either component of value, prices or quantities, being negative.
5.20. A related matter is the treatment in ecosystem accounting of negative
externalities, such as carbon emissions, where economic and human activity leads to
changes in the condition of ecosystems. Any associated environmental flows,
pollutants, emissions, etc are not considered ecosystem disservices and their negative
impacts on welfare are not captured directly in the accounting system.
5.21. For both disservices and negative externalities work is ongoing to outline the
appropriate treatment in the context of the ecosystem accounting model.
5.3 The classification of ecosystem services
5.22. The classification of ecosystem services is an important aspect of
measurement since classifications can provide important guidance to ensure that the
appropriate breadth of measurement is undertaken or, at least, that partial measures
are understood within a broader context.
5.23. The classification included in the SEEA EEA is the Common International
Classification of Ecosystem Services version 3 (CICES v3). It was considered an
interim version and subsequent releases have been made with the latest being CICES
version 4.3.
5.24. While this classification has been adopted for work on the EU MAES project
it must be recognised that alternative approaches to the classification of ecosystem
services are under development and over time it will be necessary to consider the
different merits and roles that might be played by the different classifications.
Perhaps the most important alternative approach is the work by the US EPA on FEGS
which places it attention on the links between ecosystem types and the classification
of beneficiaries from the final services supplied by those ecosystem types.
5.25. One of the most important roles of a classification of ecosystem services is
that it can be used to frame a discussion on the measurement and significance of
ecosystem services. In effect, a classification can operate as a checklist and be
applied in initial discussions by considering each LCEU type in turn and noting those
ecosystem services that are considered most likely to be generated from that LCEU.
The resultant “baskets” of services for each LCEU type can aid in discussion of the

48
role of accounting, the structuring of information, the assessment of resources
required for compilation and generally communicating the message about the breadth
of the relationship between ecosystems and economic and human activity.
5.26. A clear finding of work on ecosystem services is that the choice of words to
describe an ecosystem service can have significant impact on how it is visualized and
understood by those involved. In particular for regulating services the choice of
words to distinguish the benefit that people receive (e.g. reduced risk of landslide)
from the corresponding ecosystem service (e.g. soil retention) can be very material in
the selection of indicators. Much further discussion across the full suite of ecosystem
services and the related benefits is required to ensure that the measures and the
concepts are appropriately aligned.
5.27. There is commonly misunderstanding of the role of classifications with
regard to the distinction between final and intermediate ecosystem services.
Unfortunately, from the perspective of the classification of ecosystem services, it is
not the case that ecosystem services can be neatly classified between those that
contribute directly to economic and social beneficiaries and those that are directly
beneficial to ecosystems. For example, when a household abstracts water from a lake
and a wild deer drinks from the same lake, the ecosystem flow of the provisioning of
water is the same.
5.28. However, a similar situation arises in economic statistics. The classification
of products (e.g. following the international standard Central Production
Classification) includes, appropriately, a large number of products that may be
considered intermediate or final depending on the beneficiary. For example, the
purchase of bread is considered final if purchased by a household but intermediate if
purchased by a restaurant. However, the CPC appropriately only contains one
product, bread, rather than two (or more) products.
5.29. Given this situation, the CICES and other classifications of ecosystem
services, must be used in conjunction with an understanding of the beneficiaries that
are within scope of the measurement concept. Without clearly defining the
beneficiaries there is likely to be an overestimation of the quantity of ecosystem
services by adding together the intra- and inter-ecosystem flows that reflect the
operation of an ecosystem, and the “final” ecosystem services that are direct
contributions to economic and social beneficiaries.
5.30. These considerations on the role of classifications are important in
developing agreed accounting structures both in the case of ecosystem services alone
and in the context of integrating measures of ecosystem services within standard
accounting structures such as input-output and supply and use tables.
5.4 The role and use of biophysical modelling
5.4.1 Introduction
5.31. Biophysical modelling, in the context of this guidance document, is defined
as the modelling of biological and/or physical processes in order to understand the
biophysical elements to be recorded in an ecosystem account. These elements are part
of either ecosystem asset (including ecosystem condition and the ecosystem’s
capacity to generate services) or ecosystem services flow. In this chapter the focus is
on ecosystem services flow and modelling as applicable to ecosystem assets is
discussed in Chapter 7.

49
5.32. The intention here is to provide some general guidance on the type of
biophysical modelling approaches that can be used to analyse ecosystem service flow
as distinct from models that can be used to analyse ecosystem processes for the
purpose of understanding ecosystem processes (e.g. nutrient cycling, energy flows).
In the scientific literature, a wide range of different modelling approaches have been
described in the fields of ecology, geography, and hydrology, many of them
potentially relevant to ecosystem accounting depending upon the environmental
characteristics and the uses of the ecosystem, the scale of the analysis, and the
available data. It is impossible to describe all these different modelling approaches in
one document, and thus this guidance provides an overview of the different
approaches, and their main uses for the biophysical modelling of ecosystem services.
5.33. An important aspect of applying biophysical models in ecosystem accounting
is recognising the nature of the connections between ecosystem service flows and the
condition of the relevant ecosystem asset. This connection is reflected in the concept
of ecosystem capacity. Although the definition of ecosystem capacity remains a
matter of ongoing discussion (see section 7.4), it is accepted broadly that modelling
ecosystem service flows must take into consideration the current and expected
condition of the ecosystem and its various functions and processes.
5.34. ANCA Research Paper #3 “Guidance for the Biophysical Modelling and
Analysis of Ecosystem Services in an Ecosystem Accounting Context” provides more
detail and relevant references on this topic.
5.4.2 Overview of biophysical modelling approaches
5.35. The two most relevant forms of modelling are spatial and temporal modelling
techniques. Spatial modelling is required to produce wall-to-wall maps of ecosystem
services for a complete EAU, including to national level. Thus where data is lacking
in relation to some spatial areas, spatial modelling can fill the gaps. Spatial modelling
is most commonly undertaken using GIS packages such as Arc GIS and Quantum
GIS. There are also several ecosystem services specific modelling tools such as
ARIES, MIMES and InVEST. Further discussion on these models is presented in
ANCA Research Paper #3.
5.36. Within the general GIS packages, spatial modelling tools including the use of
look-up tables, and the application of statistically based approaches such as Maxent
(Philips, et al 2006). There are a range of geostatistical interpolation techniques such
as kriging rely on statistical algorithms to predict the value of un-sampled pixels on
the basis of nearby pixels in combination with other characteristics of the pixel. The
basic interpolation methods use simple interpolation algorithms, for instance nearest-
neighbor interpolation, but there are more sophisticated geostatistic tools that also
considers sets of correlated variables. For instance, timber productivity may be
related to productivity in nearby pixels, but in a more comprehensive approach it may
also be related to factors such as soil fertility or water availability for which spatial
maps are available. Critical in applying geostatistics is that a sufficiently large
sample size is available, and that samples are representative of the overall spatial
variability found.
5.37. In ecosystem accounting, temporal modelling is required to forecast the
capacity of an ecosystem to generate ecosystem services. The modelling approach
most consistent with coming to an understanding of flows of ecosystem services is a
dynamic systems approach, which can also be applied in combination with a spatial
model. This approach is based upon modelling a set of state (level) and flow (rate)
variables in order to capture the state of the ecosystem, including relevant inputs,
throughputs and outputs, over time. Dynamic systems models use a set of equations

50
linking ecosystem state, management and flows of services. For instance, a model
may include the amount of standing biomass (state), the harvest of wood (flow), and
the price of wood (time dependent variable).
5.38. The systems approach can contain non-linear dynamic processes, feedback
mechanisms and control strategies, and can therefore deal with complex ecosystem
dynamics. However, it is often a challenge to understand these complex dynamics,
and their spatial variability, and data shortages may be a concern in the context of
ecosystem accounting that requires large scale analysis of ecosystem dynamics and
forecasted flows of ecosystem services.
5.39. In some cases, spatial and temporal modelling approaches need to be
combined. For instance, process based models are generally required to model
regulating services such as erosion control, or ground and surface water flows.
Erosion, and erosion control is often modelled with the USLE (Universal Soil Loss
Equation) approach (even though its reliability outside of the USA (where it was
developed) has proven to be variable). Other examples of process based models are
the hydrological models such as SWAT and (CSIRO) SedNet. These models are both
temporally and spatially explicit, using a dynamic systems modelling approach
integrated in a GIS environment.
5.5 Data sources, materials and methods for measuring ecosystem service flows
5.5.1 Introduction
5.40. SEEA EEA Annex A3.1 provides some stylised figures to help articulate the
measurement required to estimate flows of ecosystem services. The models included
in that annex only relate to selected services but the basic logic of the models can be
applied more generally. Of particular importance is recognising the distinction
between the ecosystem service and the associated benefit and the choice of words to
reflect this distinction.
5.41. It will generally be helpful for measurement purposes to distinguish clearly
between provisioning, regulating and cultural services. For this task the use of a
clearly defined classification of ecosystem services, such as CICES, can serve as a
useful checklist. Further, it is likely to be useful to consider measurement of
ecosystem services in relation to broad ecosystem types such as forests, wetlands, and
agricultural areas.
5.42. A useful structuring of indicators is presented in Chapter 5 of the EC
Mapping and Assessment of Ecosystems and their Services, Final report (February
2014). In this chapter indicators for different ecosystem services are mapped out
within four broad ecosystem types – forest, cropland and grassland, freshwater and
marine. A review of this material highlights the likely broad range of data sources
that will need to be considered in generating a full coverage of ecosystem services for
ecosystem accounting purposes.
5.43. In a different setting, the World Bank working paper “Designing Pilots for
Ecosystem Accounting” Chapter 3 provides some suggested approaches and
indicators for provisioning and regulating services using a case study in San Martin,
Peru.
5.44. Other relevant materials on the measurement of ecosystem services include:
o books and text books
o journal articles,

51
o ecosystem services databases (e.g. PAGE, ESVD, EVRI)
o national and other projects (e.g. UK NEA, MEGS, EU MAES,
Limburg province)
o other datasets
NB: This section of text needs expansion to provide some guidance to compilers.
5.45. While there is an increasing amount of information and examples of
measurement of ecosystem service flows, a challenge is likely to lie in adapting and
scaling the available information for ecosystem accounting purposes. The issue of
scaling is considered further in Chapter 7 and is lso discussed further below (section
5.6). From a practical perspective it is sufficient to note here that, when accounting
for multiple ecosystem services, the aim must be to measure the generation of
ecosystem services at a broad landscape scale (ideally up to national level) and also
over a series of accounting periods. As appropriate, adjustments to ensure that
measures of different ecosystem services align to the same spatial areas and same
time periods should be made.
5.5.2 Measuring the supply of ecosystem services
5.46. Commonly in the discussion of ecosystem accounting, a focus is placed on
the measurement of regulating services. This is so for two reasons. First, regulating
services are, by and large, the most significant environmental flows that are not
captured in standard economic accounting. Second, provisioning services are
considered quite straightforward to measure and cultural services often considered
too difficult to measure. While these characterisations are not inappropriate, it is
relevant to ensure that measurement does not consider only regulating services.
5.47. The measurement of provisioning services can generally be linked to
measures commonly available in statistical systems. Thus production of crops,
livestock, other agricultural products, forestry products and fisheries products are all
of direct relevance in the estimation of provisioning services. In some cases, data may
be available at a fine level of spatial detail, for example from an agricultural census.
In other cases it may be necessary to allocate national or regional level estimates to
the spatial units being applied for ecosystem accounting using spatial modelling
techniques.
5.48. For some cultural services particularly those relating to tourism and
recreation, the use of available administrative and survey based information is also
appropriate. The measurement of so-called non-use cultural services is more
problematic and is considered further in section 5.6.
5.49. For regulating services some specific suggestions for measurement using bio-
physical models are suggested in Table 5.1 (from ANCA Research Paper #3). These
are intended as guide only and consideration of the applicability of these approaches
should be made in each circumstance. Also, some specific considerations with respect
to the measurement of ecosystem services related to carbon and water are discussed
in ANCA Research Papers #7 and #8)

52
Table 5.1: Indicators and mapping methods for selected ecosystem services (Source: ANCA
Research Paper #3 – Lars Hein Biophysical modelling) Service Potential indicator Description Carbon storage Ton of carbon (or
carbon-dioxide) per
hectare or square
kilometer.
Carbon storage includes storage in vegetation (above ground, root, dead wood,
and litter carbon) and soil carbon. Soil carbon may be low compared to
vegetation carbon, as in some types of poor fertility tropical forest soils, or it
may be by far the largest component of total carbon storage, as in peatland
soils in deep peat (World Bank, 2014). Above ground carbon can be measured
with radar remote sensing, but the measurement of below-ground carbon with
optical techniques is generally not possible. Instead, for this part of the carbon
stock, soil sampling and interpolation of data points is required. Carbon maps
are increasingly available for different parts of the world (see also Chapter 4),
and the capacity to map above ground carbon stock globally also increases
with the launch of the Sentinel radar satellites.
Carbon
sequestration
Ton of carbon (or
carbon-dioxide)
sequestered per year,
per hectare or per square
kilometer.
Carbon sequestration can be related to net ecosystem productivity (NEP), i.e.
the difference between net primary productivity (NPP) and soil respiration.
NPP can be derived from the Normalized Difference Vegetation Index
(NDVI) that can be measured with remote sensing images. However care
needs to be taken that the relation between NDVI and NPP is well established
for the ecosystems involved, and that accuracy levels are calculated based on
sample points. It is often difficult to find credible values for the spatially very
variable soil respiration rate, which depends on bacterial and fungi activity
which are in turn guided by the local availability of organic matter (e.g. fallen
leaves), temperature, moisture, etc.
Maintaining
rainfall patterns
mm water
evapotranspiration per
hectare per year, mm
rainfall generated per
hectare per year.
Rainfall patterns depend on vegetation patterns at large scales. For instance, it
has been estimated that maintaining rainfall patterns in the Amazon at current
levels requires maintaining at least some 30% of the forest cover in the basin.
Reductions in rainfall in the Western Sahel and the Murray Basin in Australia
have also been correlated to past losses of forest cover. This is a significant
ecosystem service, however the value of individual pixels is difficult to
establish since it requires understanding large scale, complex climatological
patterns, large scale analyses of potential damage costs, and interpolations of
values generated at large scales to individual pixels with detailed climate-
biosphere models.
Water
regulation
- water storage capacity
in the ecosystem in m3
per hectare (or in mm);
- difference between
rainfall and evapo-
transpiration in
m3/ha/year;
Water regulation includes several different aspects, including (i) flood control;
(ii) maintaining dry season flows; and (iii) water quality control – e.g. by
trapping sediments and reducing siltation rates). Temporal, i.e. inter-annual
and intra-annual, variation is particularly important for this service. Modelling
this service is often data-intensive and also analytically complex. SWAT is a
model often used to model this kind of flows, however extensions of the
SWAT model are needed to link land use to water flows, see also Chapter 4.
Surface water
modelling;
Flood
protection
Surface water modelling
can be deployed to
analyze reductions in
flood risk, expressed
either as reduction in
probability of
occurrence, reduction in
average duration of the
flood, or reduction in
water level depending
on context
Flood protection depends on linear elements in the landscape that act as a
buffer against high water levels (e.g. a mangrove, dune or riparian system).
Modelling this service requires modelling flood patterns and the influence of
the vegetation. It may not always be needed to model flood protection in
physical terms in order to understand the monetary value of the service - in
particular in those areas where it is certain that natural systems, if lost, would
be replaced by artificial ones (e.g. a dyke), as would be the case in most of the
Netherlands, for instance. In this case, valuation may be done on the basis of a
replacement cost approach that does not require understanding the physical
service in full.
Erosion and
sedimentation
control
- difference between
sediment run-off and
sediment deposition in
ton/ha/year
There is relatively much experience with modelling this service. Erosion
models can be integrated in a catchment hydrological models (such as SWAT
or CSIRO SedNet, both freeware) to predict sediment rates. In SWAT, a
watershed is divided into Hydrological Response Units (HRUs), representing
homogeneous land use, management, and soil characteristics. Erosion rates
need to be estimated for each HRU, for instance on the basis of the MUSLE or
RUSLE erosion models or alternatively SWAT landscape can be used which
includes grid based land cover units.
Water
purification
Amount of excess
nitrogen and or
phosphorous removed in
the ecosystem
Various hydrological models, including SWAT include modules that allow
estimating the nutrient loads in rivers as a function of streamflow, discharge,
temperature, etc. Nitrogen is broken down by bacterial activity, phosphorous
is typically removed in ecosystems by binding to the soil particles. Modelling

53
these processes in SWAT requires large datasets, preferably with daily time-
steps, of nutrient concentrations in various sampling stations along the river
course. Simulation in SWAT using predefined modules allows calculating the
nutrient concentrations in other parts of the river.
5.5.3 Recording the beneficiaries of ecosystem services
5.50. Within the ecosystem accounting model all benefits must have a
corresponding beneficiary. Given that ecosystem services are “contributions to
benefits” this implies that all ecosystem services also have a corresponding
beneficiary. Using broad national accounting categories these beneficiaries can be
grouped as being corporations, governments and households. Another perspective of
grouping is to consider industry groupings whereby individual establishments or
businesses are grouped into those that undertake similar activities such as agriculture
or manufacturing.
5.51. When measuring the generation of ecosystem services and mapping out their
generation across a specific ecosystem type (e.g. forests) it is likely to be useful to
consider the range of beneficiaries. This approach has been extensively applied in the
development of the Final Ecosystem Goods and Services (FEGS) concept by the US
EPA and its associated classification system.
5.52. To support integration with the national accounts and its tables such as input-
output tables, it is recommended that the matching of ecosystem services to
beneficiaries use the classification of beneficiaries used by the national accounts
either by institutional sector or by industry/economic activity.
5.6 Key issues and challenges in measuring ecosystem service flows
Suggestions for topics include (some of which are introduced in section 5.2 above).
Distinguishing final and intermediate services, and benefits.
Measurement of non-use cultural services
Linking biodiversity and ecosystem services
Scaling data for measuring ecosystem services
Benefit transfer methods
Valuation – link to chapter 8

54
5.7 Conclusions
5.7.1 Recommended activities and approaches
To be determined : Suggestion to focus on (i) using a classification of ecosystem services to
list out relevant ecosystem services for each main ecosystem type; (ii) to consider this list in
the context of likely beneficiaries both local and national/global; (iii) to develop indicators of
physical flows of each ecosystem service. This would form the basis for an ecosystem
services supply account and a use account. Issues of valuation and aggregation would remain
on the research agenda.
5.7.2 Issues requiring ongoing research
To be determined.
5.53.

55
6. Accounting for specific ecosystem components
6.1 Introduction
6.1. The main ecosystem accounts are described in Chapter 4. Their structure reflects the
ambition of ecosystem accounting to integrate a wide range of information on a
variety of ecosystem components and for a number of ecosystem services. As with
the national economic accounts, the compilation of ecosystem accounts of such an
integrated nature requires the use of multiple data sources. In that sense, ecosystem
accounting should not be considered as reflecting a single data set but rather as a
synthesis of many data sets each of which will have its own methods and techniques.
6.2. In the development of the SEEA EEA, four data sets in particular have emerged as
central to the measurement of ecosystem assets and ecosystem services. These four
data sets concern land cover, water, carbon and biodiversity. For all of these
ecosystem components there are separate measurement techniques and guidelines that
have developed over time resulting in a varying mix of definitions and measurement
scopes that are appropriate for specific circumstances. For the purposes of integration
within ecosystem accounting there is a need to seek some alignment and co-
ordination in the measurement of these different components both in terms of
alignment among components and in terms of alignment with SEEA and SNA
accounting principles.
6.3. In the case of two components – land cover and water – the SEEA Central
Framework and the SEEA Water provide the conceptual grounding for integration.
For carbon, as a single element, it is actually quite well suited as a subject for
accounting. It has thus been relatively straightforward to consider adapting the
measurement of carbon into a broad accounting structure. The relevant concepts are
described in the SEEA EEA. For biodiversity the situation is still developing. SEEA
EEA section 4.5 introduces relevant ideas for the measurement of biodiversity in
accounting terms but more work is needed.
6.4. Aside from contributing to the bigger ecosystem accounting picture, accounts for land
cover, water, carbon and biodiversity also contain much relevant information in their
own right. Consequently, compilers of ecosystem accounts are encouraged to seek
opportunities to promote and use the information presented in these supporting
accounts to support discussion of environmental-economic issues.
6.5. This chapter provides a summary of the relevant accounting issues for each of these
four areas. More detailed descriptions are provided in the four ANCA Research
Papers #2, 7, 8 and 9. The issue of aggregating across these and other components to
provide a more complete ecosystem level assessment is discussed in Chapter 7.
6.2 Accounting for land cover
6.2.1 Introduction
6.6. Accounting for land cover and land cover change will be the most common starting
point for compilers of ecosystem accounts. As part of the accounts compilation
process the information in land cover accounts can be used to help define the relevant
spatial units, to determine the extent of different ecosystem types at a broad level, to
support understanding the links between ecosystem services supply and the
beneficiaries of those ecosystem services and finally, to facilitate the scaling of other
data to finer and broader levels of detail.

56
6.7. Generally, the initial focus of land cover accounting is on terrestrial areas of a
country including freshwater bodies. Within this scope land cover must be classified
into various classes. Often there will be relevant national classifications and datasets
but alignment or correspondence to international classifications is likely to be a
positive step. Chapter 3 discusses issues of classification in more detail.
6.8. The basic structure of a land cover account follows the structure of an asset account
as described in the SEEA Central Framework. That is, there will be an opening stock,
closing stock and additions and reductions in stock. Ideally, changes in stock over an
accounting period would be separated into those that are naturally driven and those
due to human activities. Both the SEEA Central Framework and the SEEA EEA
describe the structure of a land cover account.
6.9. In addition to an asset account information on land cover may be organised in the
form of a land cover change matrix which shows how, over an accounting period, the
composition of land cover has changed between different types of cover. An example
of such a matrix is provided in the SEEA Central Framework.
6.10. Using different data sources, additional information on land may also be
organised into accounts. For example, information on land use and land ownership or
tenure may be accounted for.
6.2.2 Relevant data and source materials
6.11. ANCA Research Paper #2 discusses the compilation of land cover accounts
in more detail. In terms of data requirements, that paper distinguishes between
dynamic and permanent features. Dynamic features include information on land use,
land cover and vegetation type. Permanent features include information on
administrative boundaries, ecological regions, and river basins.
6.12. The compilation of accounts will generally require bringing these various
data together using GIS methods to form maps for a country as a whole. The ambition
in accounting terms is to generate harmonised maps over time such that the stock and
changes in stock can be consistently accounted for.
6.13. Materials to support land cover accounting including the SEEA Central
Framework, the SEEA EEA and the ENCA QSP which has an extensive discussion
of land cover accounting and associated data sources and methods.
6.14. Additional support and guidance is available in looking at country examples
and case studies. Relevant examples include the work of the European Environment
Agency, the Australian Bureau of Statistics, Statistics Canada, the Victorian
Department of Sustainability and Environment and in Mauritius.
6.2.3 Key issues and challenges in measurement
6.15. There is a range of measurement challenges in land cover accounting. An
immediate challenge is being able to integrate the various data to produce harmonised
maps. This requires that all relevant data be aligned with a standardised grid and
while a seemingly simple objective this may be harder to achieve in practice since
data sets will be held with multiple agencies.
6.16. A related issue will be the choice of scale and resolution for the maps. In
general terms higher levels of detail will be better but will also have higher resource
costs. Balancing the work required with the degree of accuracy required will be
important. A relevant issue in this context are approaches to the validation of data
particularly since much data will be derived from remote sensing and satellite

57
imagery. Ideally some degree of sampled ground truthing should be undertaken – for
example using Google Earth.
6.17. An integrated approach involving sampled reference points to measure land
use and land cover across Europe - LUCAS - has been developed in recent years by
Eurostat. This approach may provide additional ideas for possible measurement
approaches at national level.
6.18. The approach to classifying land cover is particularly important in
communicating message on the changing composition of land cover at national level.
At a base level there is now an ISO standard Land Cover Classification Scheme
(LCCS) developed by the FAO. This classification provides the structure by which
each type of land cover around the world can be consistent classified and thus
provides a way of linking the various classifications that are in use in different
countries and regions.
6.19. While this provides a base classification, more challenging has been the
formation of higher level classes that can be used to summarise land cover in
meaningful ways. There are a number of options, one of which is the interim land
cover classification presented in the SEEA Central Framework. Determination of a
broadly accepted set of high level (say 10-15) classes of land cover (and the
associated definitions of these classes) would be an significant step forward in
coordinating information and underpinning greater alignment in ecosystem
accounting discussions and applications.
6.2.4 Conclusions, recommended activities and research issues
6.20. To be determined
6.3 Accounting for water related stocks and flows
6.3.1 Introduction
6.21. Water is a fundamental resource and accounting for the stocks and flows of
water is a key feature of both the SEEA Central Framework and the SEEA EEA. This
short section is intended only to provide direction to relevant technical and
compilation materials rather than reproduce or summarise the content of those
materials.
6.22. Water is relevant in ecosystem accounting in a number of ways. First, water
is a key component of ecosystems and hence assessment of the condition of
ecosystem assets will, in most instances, require the measurement of the stocks and
changes in stocks of water resources.
6.23. Second, there are a number of ecosystem services which related directly to
water. These include the provisioning service of water when it is abstracted for use
(irrigation, drinking, hydropower), the role of water in filtering pollutants and
residual flows, and the cultural services associated with water such as fishing and
other recreational activities. In addition, there are a number of ecosystem services to
which water is linked, for example, the regulation of water flows to provide flood
protection and the filtration of water by the soil in catchments.
6.24. Measurements in all of these areas are ultimately important within a complete
set of ecosystem accounts. The accounts of the SEEA Central Framework for water
focus on two areas – the supply and use of water and the asset account for water.

58
Information from both of these accounts is relevant for ecosystem accounting
purposes, in addition to being of importance in other contexts.
6.3.2 Relevant data and source materials
6.25. There are many relevant materials to support the compilation of water
accounts. Aside from the content in the SEEA Central Framework and the SEEA
EEA, there is a specific SEEA Water and the associated International
Recommendations on Water Statistics. Also in relation to accounting for water
Chapter 6 of the ENCA QSP has much relevant information.
6.26. There is a wide range of data sources, including global data sets that might be
considered for use in water accounting. ANCA Research Paper #8 provides a good
overview and links to these data sources and also provides a description of some
relevant country examples. To date, over 50 countries have trialled the development
of SEEA based water accounts and it is now a legislated statistical output within the
EU. Consequently there is a increasing body of knowledge and experience in water
accounting that can be drawn on.
6.3.3 Key issues and challenges in measurement
6.27. There remain some specific challenges in accounting for water, especially in
an ecosystem accounting context. Linked to the issue of defining spatial units there is
the need for clarity on the delineation of wetlands with the scale of analysis being a
particular area of concern. Many wetlands may be quite small but disproportionately
important within larger land cover types (for example in grasslands) and being able to
recognise these areas and hence better understand the stocks and flows of water
resources is important.
6.28. On a related note integrating information on groundwater within the
ecosystem accounting framework requires further consideration given that generally
the ecosystem accounts have considered primarily surface water resources.
6.29. Given that flows of water are often key pathways between different
ecosystems, more work is needed to understand and account for flows of ecosystem
services between ecosystem assets that are related to water. For example, how should
the services of soil retention in the upper reaches of water catchments be considered
in the context of the services provided by an entire river basin. SEEA EEA largely
ignored flows between ecosystems but further reflection suggests that incorporating
certain intermediate ecosystem services is required.
6.30. A general challenge in water accounting from a national accounts perspective
is that, often, national level data are not overly meaningful and instead information at
a basin or catchment level is required. While it may be straightforward to propose
measurement at this level of detail, developing estimates at a catchment level may be
resource intensive.
6.3.4 Conclusions, recommended activities and research issues
6.31. To be determined

59
6.4 Accounting for carbon related stocks and flows
6.4.1 Introduction
6.32. Carbon has a central place in ecosystem and other environmental processes
and hence accounting for carbon stocks and changes in stocks must be seen as an
important aspect of environmental-economic accounting. This short section is
intended only to provide direction to relevant technical and compilation materials
rather than reproduce or summarise the content of those materials.
6.33. Accounting for carbon in the context of the SEEA commenced in the context
of accounting for carbon in forests and in accounting for GHG emissions. With the
development of the SEEA EEA the scope of carbon accounting has been broadened
and, following the scope of the carbon stock account in the SEEA EEA, ideally it
encompasses stocks and changes in stocks of all parts of the carbon cycle. Thus it
would cover geocarbon, biocarbon, atmospheric carbon, carbon in the oceans and
carbon accumulated in the economy. In practice the scope of carbon stock accounting
at this stage is focus on biocarbon and geocarbon.
6.34. In ecosystem accounting information on stocks and flows of carbon is used in
two main areas. First, as part of the measurement of ecosystem condition, one broad
approach is to use changes in net primary production as an indicator. This single
indicator can capture changes in soil, vegetation and other biomass. Second,
information on carbon stocks and flows relate directly to the ecosystem services of
carbon sequestration and carbon storage.
6.4.2 Relevant data and source materials
6.35. The structure of a carbon stock account is presented in SEEA EEA Chapter 4.
The compilation of this account, with a focus on biocarbon and geocarbon, will
involve the collection of data on land cover and the capacity of different land cover
types to sequester carbon, data on the carbon content of soils and information on sub-
soil fossil fuel resources. A summary of relevant data sources and links to those
sources is presented in ANCA Research Paper #7. A particular source that is noted
here is information compiled by countries as part of reporting to the IPCC. The
measurement boundaries and treatments are, on the whole , well aligned between the
IPCC and the SEEA.
6.36. Advice on the compilation of carbon accounts is summarised in SEEA EEA.
A more detailed explanation is provided in Ajani & Comisari 2014 which describes
the development of a carbon account for Australia including discussion of the
relevance and application of the account.
6.4.3 Key issues and challenges in measurement
6.37. Relative to other areas of measurement, the measurement challenges in
relation to carbon are relatively limited. In large part this reflects the substantial
resources that have been applied to this measurement task within the IPCC processes.
Nonetheless there remain important issues of data quality to consider. In large part
these relate to being able to accurately measure carbon stocks across the wide variety
of vegetation and soil types since different carbon content ratios will apply. Related
to this the sourcing of information via remote sensing and using local sources in a
balance between coverage and accuracy is an ongoing challenge.

60
6.4.4 Conclusions, recommended activities and research issues
6.38. To be determined.
6.5 Accounting for biodiversity
NB: Text in this section to reflect a summary of key points from a forthcoming paper on
biodiversity accounting and other sources as appropriate
6.5.1 Introduction
6.39.
6.5.2 Relevant data and source materials
6.40.
6.5.3 Key issues and challenges in measurement
6.41.
6.5.4 Conclusions, recommended activities and research issues
6.42.
6.6 Other supporting accounts and data
6.43. As noted in the introduction to this chapter a wide range of data will need to
be integrated in the compilation of ecosystem accounts. Data on land cover, water,
carbon and biodiversity are likely the key and essential items. Other components, for
which accounting frameworks have been developed in some cases, include:
Timber resources (accounting described in the SEEA Central
Framework)
Fish and other aquatic resources (accounting described in the SEEA
Central Framework)
Other biological resources including livestock, orchards, plantations,
wild animals (accounting described in the SEEA Central Framework)
Soil resources (accounting described in the SEEA Central Framework
although further development is required)
Data on production and use of outputs from agricultural, forestry and
fisheries activity (accounting described in the SEEA Agriculture,
Forestry and Fisheries (forthcoming))
Data on tourism and recreation (some coverage of accounting in Tourism
Satellite Accounts)
Population data
6.44. It is likely that in order to generate the data at the appropriate spatial scale for
ecosystem accounting some scaling and modelling of the information encompassed

61
by the accounts listed above will be required. The issue of scaling is discussed in
ANCA Research Paper #1 (Bordt, 2015). Further, particularly for the measurement of
ecosystem services, it will be necessary to use relevant models of ecosystem
processes to estimate the relevant flows. These models will require additional data of
a scientific and ecological nature. Over time, as the accounts develop, it is likely to be
possible to investigate the alignment and consistency between the scientific data and
the socio-economic data, particularly as it pertains to specific spatial areas or
ecosystems. In this sense, the ecosystem accounting model provides both a rationale
and a place for data integration.

62
7. Accounting for ecosystem assets
7.1 Introduction
7.1. Accounting for ecosystem assets is a fundamental component of ecosystem
accounting. Without accounting for ecosystem assets, ambitions to understand and
monitor the changes in the natural capital base and hence consider issues of
sustainability are not possible. Further, understanding the connections between the
characteristics of ecosystem assets and the services that are supplied can form the
basis for better planning and management of natural capital.
7.2. This chapter builds on the initial discussion of accounting for ecosystem assets in
Chapter 4 of the SEEA EEA. When drafted there were many concepts and ideas
about how ecosystem assets might be considered and in many respects, the text of the
SEEA EEA represents a first attempt at synthesising approaches to environmental
and ecosystem assessment within a national accounting framework.
7.3. Since the first release of the SEEA EEA in 2013 (white cover) further discussion and
experience has refined some of the ideas although in number of respects there
remains important testing and research to do. The material in this chapter thus
represents an update, primarily aimed at updating and clarifying the material in SEEA
EEA but also providing some additional guidance and direction for those involved in
testing and research.
7.4. This chapter assumes, as outlined in Chapter 3 of EEA TG, that ecosystem assets are
defined as spatial areas satisfying the requirements of a land cover / ecosystem
functional unit (LCEU). The SEEA EEA was not clear on the appropriate spatial unit
that should define an ecosystem asset but the position of EEA TG is clear. This
approach remains consistent with the definition of ecosystem assets in the SEEA
EEA as being “spatial areas containing a combination of biotic and abiotic
components and other characteristics that function together” (SEEA EEA 4.1).
However, by providing a clearer link to the LCEU level a better sense of scaling and
of measurement approach can be undertaken.
7.5. The focus on LCEU level units as being ecosystem assets does not imply that more
aggregated combinations of LCEU (i.e. EAU) such as river basins and administrative
areas, cannot be the focus of accounting. Rather it suggests that the appropriate base
level unit for asset accounting purposes is the LCEU as it is at this level that the
characteristics of an ecosystem asset can be appropriately determined and monitored
and it is at this level that an understanding of the relevant ecosystem services can be
understood.
7.6. This chapter also takes as a starting point that information on specific components of
ecosystem assets, such as information on land cover, water resources, biodiversity,
soil, types of biomass (timber, fish, livestock, crops, etc.), has been appropriately
estimated and attributed to LCEU level. Chapter 6 provides an overview of the
relevant considerations concerning accounting for the components of ecosystem
assets.
7.2 Dimensions in the measurement of ecosystem assets
7.7. SEEA EEA Chapter 4 outlines a number of dimensions that are relevant to the
measurement of ecosystem assets. The three primary dimensions are ecosystem
extent, ecosystem condition, and expected ecosystem services flows. A dimension or
concept that has become increasingly of interest from an accounting perspective is
that of ecosystem capacity. SEEA EEA notes that “the capacity of an ecosystem asset
to generate a basket of ecosystem services can be understood as a function of the

63
condition and the extent of that ecosystem” (SEEA EEA 4.1). While SEEA EEA does
not provide a measurement definition for ecosystem capacity, there is recognition that
it can provide a linking point between different dimensions in the measurement of
ecosystem assets.
7.8. This section briefly outlines the different dimensions of ecosystem assets noted above
with a more extended discussion on the measurement of ecosystem condition in the
following section and a discussion on the definition of ecosystem capacity in section
7.5.
7.9. The most straightforward dimension is ecosystem extent. The preparation of
ecosystem extent accounts, introduced in Chapter 4, is the appropriate starting point
for ecosystem accounting since they will reflect fundamental choices on the
delineation of spatial areas and also provide important information on the changing
composition of ecosystem types at an aggregate level.
7.10. It is this second feature that is perhaps the most significant in accounting
terms. Because accounts about ecosystem extent are compiled in a common unit of
measurement, usually hectares, this permits aggregation and comparison at larger
scales. Thus comparison of the relative proportions of different ecosystem types and
the changes in these shares over time can be made. It is not as straightforward to
undertake this scale of comparison when considering the quality or condition of
ecosystem assets.
7.11. The second dimension is ecosystem condition. “Ecosystem condition reflects
the overall quality of an ecosystem asset in terms of its characteristics” (SEEA EEA
2.35). The measurement of ecosystem condition, discussed at more length in section
7.3, requires the selection of specific characteristics and then measurement of
relevant indicators pertaining to those characteristics.
7.12. Once indicators are measured, the task from a national accounting
perspective is to develop methods that support aggregation and comparison. Being
able to understand the relative significance of different ecosystem assets is core to the
national accounting approach. The general approach to this task outlined in the SEEA
EEA is the comparison of indicators to benchmark or reference condition. Guidance
on this is provided in section 7.3.
7.13. The third dimension concerns expected ecosystem services flows. Since the
release of SEEA EEA in 2013, this dimension of measuring ecosystem assets has not
received much focus. This seems due to two related factors. First, the concept of
expected ecosystem services flows is very much an application of standard capital
accounting to the area of ecosystems. It thus stands somewhat removed from the
experience to date in measuring ecosystems either in terms of their extent and
condition or in terms of the actual flows of ecosystem services in a given period of
time. Second, since the measurement of expected flows is forward looking and relates
to a basket of ecosystem services, it relies on an understanding of the link between
the future condition of ecosystem assets and a basket of services and also on
measuring an entire basket of services for different ecosystem types. Neither of these
measurement challenges are resolved and hence it is likely that progress toward
measuring expected ecosystem services flows will be somewhat slower. The second
challenge will be resolved as work on the measurement of ecosystem services
progresses (see Chapter 5) and the first challenge will centre around the measurement
of ecosystem capacity, a topic discussed in more detail in section 7.5 below.
7.14. Ultimately from an ecosystem accounting perspective the key ambition is for
measures of ecosystem extent, condition, capacity and expected service flows to be
able to be reconciled to provide a consistent picture of each ecosystem asset both it is
own right and in terms of measures of other assets. To this point in time, the logic of
64
the relationships established in ecosystem accounting is appropriate but further
testing in practical situations is required to ensure the relevance and usefulness of the
framework.
7.15. One perspective on ecosystem asset measurement not mentioned above
concerns measurement in monetary terms through the valuation of ecosystem
services. In concept, measurement in monetary terms permits aggregation and
comparison among ecosystem assets, as well as supporting the integration of
information on ecosystem assets with data on other assets currently included in the
national accounts balance sheets. The measurement of ecosystem extent and
ecosystem condition in monetary terms is not possible (at least not directly) and the
focus of valuation of ecosystem assets is on the measurement of expected ecosystem
services flows. More recently the idea of valuing ecosystem capacity has been raised
although further discussion on this point is required.
7.16. Conceptually, the valuation of ecosystem assets is a seemingly neat step.
However, there is a range of conceptual and practical challenges in valuation that
may mean that progress toward the full valuation of ecosystem assets is a medium to
longer term objective. A more complete discussion of the relevant issues is presented
in Chapter 8.
7.3 Compiling ecosystem condition accounts
7.17. The intent of an ecosystem condition account is to bring together a range of
information about the overall condition of different ecosystem assets. In general,
most environmental accounting and indeed most measurement activities, tend to
focus on specific characteristics in individual or multiple ecosystem assets. Thus
there may be studies on ecosystem components such as carbon, water, timber, soil,
biodiversity or characteristics such as resilience. The ambition for ecosystem
accounting is to bring all of that information together to provide an overall
assessment of ecosystem assets.
7.18. The basic approach is to identify and select certain characteristics of
ecosystem assets whose measurement would provide an indication of ecosystem
condition. Since the coverage of ecosystem accounting is national level, or at least
multiple ecosystem type level, one way of selecting characteristics is to consider a
small number that can be measured for all ecosystem types. This is the approach
adopted for the ENCA QSP where indicators of carbon, water and biodiversity have
been developed and measured for all ecosystems in a country.
7.19. The second way is to develop different indicators for different ecosystem
types and perhaps, further by different uses of ecosystem types. This is the approach
that has been used in the UK NEA, SANBI, MEGS and by the Wentworth Group in
Australia.
7.20. While there is undoubtedly merit in developing broad based approaches as in
the ENCA QSP, where resources are available, it would seem more ecologically well
founded if the second method is used – i.e. developing measurement specific
characteristics for different ecosystem services types. At the same time, given that the
ENCA QSP provides a clear foundation for ecosystem condition accounting, an
approach that may be considered is developing ENCA QSP based accounts for the
whole country in an initial phase and then progressively expanding the set of
indicators for different ecosystem types within the same spatial architecture. In this
case the expansion may be staged with initial focus on those ecosystem assets
showing the largest declines or lowest levels of condition.
65
7.21. It is not expected that the development of specific indicators for each
ecosystem type would lead to the measurement of a vast number of characteristics for
every ecosystem. From an ecosystem accounting perspective the intention remains to
provide a broad indication of the level and change in condition rather than to fully
map the functioning of every ecosystem. This is particularly the case since a key
element of accounting is monitoring change over time and hence a focus on those
characteristics that drive ecosystem condition is an important consideration.
7.22. In this respect, it has become clear that in selecting characteristics it is
necessary but not sufficient to consider only ecological factors. It is also necessary to
also take into consideration the type of use being made of an ecosystem asset. For
example, the relevant characteristics to consider for a forest being logged are likely to
be different from one which is being used primarily for recreation. In the first
instance indicators of change in timber resource (e.g. mean annual increment) may be
very relevant whereas in the second case an indicator impact of visitors (e.g. litter and
garbage) might be more relevant.
7.23. While it may seem that the potential set of indicators is unbounded, testing to
date suggests that for most ecosystem types a set of 4-6 indicators can provide a good
set of information to enable assessment of the overall condition of an ecosystem
asset.
7.24. Ideally, information on each selected characteristic would be measured or
downscaled to the BSU level. In many cases this may be possible and indeed, for
some ecosystem characteristics such as those pertaining to soil retention and water
flow there may be notable spatial variability that should be considered.
7.25. However, there will be some situations in which this may make little
conceptual sense or imply assumptions in the downscaling that are not appropriate.
For example, a key issue in ecosystem condition is fragmentation which is only
measureable at a multiple ecosystem asset or landscape level. Attribution of
fragmentation indicators to lower levels may be challenging.
7.26. The SEEA EEA points to a number of different characteristics and indicators
(see for example Table 2.3). This was done to provide an indication of the logic being
explained rather than to provide definitive recommendations. ANCA Research Paper
#5 provides a thorough assessment of the indicators in the SEEA EEA and also
describes a number of other indicators that may be considered.
7.27. One type of indicator not mentioned in SEEA EEA but which is worthy of
further consideration are holistic indicators of ecosystem health and integrity. To the
extent that for particular ecosystems scientific research has established an overall
indicator that relates well to the concept of condition being applied in ecosystem
accounting then it may be that such indicators can be applied directly for ecosystem
accounting purposes.
7.28. In terms of data sources these will be varied depending on the indicator
selected. In the areas of carbon, water and biodiversity a range of potential data
sources is introduced in Chapter 6 and it is noted that the ENCA QSP proposes many
data sources in these areas. In many cases satellite based data are likely to be useful
information especially in providing the breadth of data across different ecosystem
assets that is required for ecosystem accounting purposes.
7.29. Four considerations that might be used in selecting indicators are (i) the
sensitivity of ecosystem services supply to the indicator; (ii) the degree to which the
indicator reflects the overall health of or key processes in the ecosystem; (iii) data
availability; and (iv) the possibility to generate new data cost effectively.

66
7.30. Compilers are encouraged to consider the work described in the research
paper, the outcomes from testing in different projects, and most importantly, to
engage with national experts on ecosystems and biodiversity potentially different
experts for different ecosystem types. In this regard, the ecosystem condition account
is likely to be the primary account through which engagement with the ecological
community can be fostered.
7.4 Aggregate measures of condition
7.31. The development of aggregate measures of the condition of ecosystem assets
remains a challenge in measurement terms. This section outlines the logic of the
approach proposed for ecosystem accounting and possible ways forward. The
following text assumes that for any specific ecosystem asset a set of information for
selected characteristics of that asset has been collated.
7.32. Given this information on characteristics is available, the question of
aggregation here focuses on obtaining an overall measure of ecosystem condition for
a single ecosystem asset. The focus is not on higher levels of aggregation, for
example, to provide an aggregate measure of condition for all ecosystems in a
country. The focus on single ecosystem assets is consistent with the ecosystem
accounting focus on the capacity of ecosystem assets to supply ecosystem services
and in assessing the degradation of ecosystems. Both capacity and degradation apply
conceptually at the scale of individual assets in the first instance.
7.33. It is also noted that one approach to aggregation is to estimate prices for
ecosystem services and derive a monetary value of ecosystem assets. This approach is
not considered in this section (see Chapter 8) and, in any event, monetary valuation
can only provide an indirect estimate of ecosystem condition via the lens of
ecosystem services.
7.34. The approach to aggregation of individual condition indicators involves two
steps. First, the indicators of the different characteristics must be transformed to be on
a common measurement base and thus able to be compared. Second, a weighting of
the relative importance of each characteristic must be assumed to provide an overall
aggregate measure.
7.35. In the first step, the approach introduced in the SEEA EEA was the use of a
reference condition. In this approach, each indicator is assessed in relation to a
common reference or benchmark condition for a particular ecosystem asset. There is
a range of alternatives in setting reference conditions. For example, in the ENCA
QSP the reference condition is the beginning of the accounting period while in the
work of the Wentworth Group the reference condition is pre-European settlement.
ANCA Research Paper #5 (Bordt, 2015) provides a more fulsome consideration of
different reference condition approaches. SEEA EEA also notes a number of
conceptual considerations with respect to the use of reference condition approaches.
7.36. Having established a reference condition, the information for each indicator
is normalised commonly with the reference condition reflecting a “score” of 100 and
the actual condition as measured being between 0 and 100. A related approach used
by SANBI is to grade ecosystems on a scale of A – E with A representing a
characteristic associated with a reference or near reference condition ecosystem and E
representing a characteristic with a heavily degraded ecosystem.
7.37. Establishing reference conditions and normalising scores is another task that
should be conducted in close consultation with national experts in ecosystems and

67
biodiversity. Indeed, it may well be the case that there are existing bodies of work in
relevant government agencies and/or universities that can be used or built upon to
support this type of assessment. It is important to recognise that the use of reference
conditions is well known in ecological circles and it should be considered as an
adaptation for ecosystem accounting purposes rather than reflecting the use of an
entirely new measurement approach.
7.38. The second step is more complex and less developed. The ambition to weight
together indicators of different characteristics is not new from a statistical perspective
but, as for socio-economic indicators, the weighting of different ecosystem indicators
is a matter of debate. By far the easiest solution is to give each indicator equal weight
in an overall measure. However, this may not be appropriate from an ecological
perspective with different characteristics possibly playing a relatively more important
role. Also, equal weighting may not reflect the relative importance of different
characteristics in the supply of ecosystem services.
7.39. An extended discussion on aggregation of ecosystem measures is provided in
ANCA Research Paper #1 (Bordt, 2015). That paper points to a number of options
and issues. At this stage no clear pathways forward on this have emerged but there
are a number of areas for further testing and research described below in section 7.6.
7.5 Developing the concept of ecosystem capacity
7.40. Earlier in this chapter it was noted that in SEEA EEA the measurement of
ecosystem assets considers three main concepts: ecosystem extent, ecosystem
condition and expected ecosystem service flows. There are no significant additional
conceptual points to be made in relation to ecosystem extent and condition and the
key measurement issues are discussed above.
7.41. In relation to expected ecosystem service flows the concept remains
unchanged but a clarification is made here to ensure that the concept is understood to
relate to the actual flows of ecosystem services. That is, in any given accounting
period, a quantity of ecosystem services (measured in terms of tonnes, m3, number of
visitors, etc.) can be recorded and this would be considered the actual flow of
ecosystem services. It is likely to be different from other estimates of what the flows
of ecosystem services might have been in different situations (e.g. if prices for
resources were higher, if pollution rates had been lower, etc.).
7.42. Given this, the concept of expected ecosystem service flows is applied by
estimating what the flows of actual ecosystem services are likely to be in future
accounting periods. There is no assumption that the expected flows will reflect
sustainable management practice or some specific management regime. Nonetheless,
in terms of the asset as a whole, some mixture or basket of ecosystem services will
need to be assumed in order for an estimation to take place.
7.43. The main ecosystem asset concept not dealt with in SEEA EEA is the
concept of ecosystem capacity. This concept is implicit in making the connection
between ecosystem assets and ecosystem services but the nature of this connection
was not articulated in SEEA EEA. This was due to two key factors
First, recognition that the link between ecosystem assets and ecosystem
services is hard to describe, particularly in terms of the link between changes
in overall ecosystem condition and the generation of individual ecosystem
services. Notions of threshold effects, resilience, ecosystem dynamics and
other non-linear factors will be important to consider.

68
Second, since the concept of capacity seemed to relate to the overall
ecosystem asset, a requirement was defining the basket of ecosystem services
that would be deemed in scope and discussion on this issue was not
conclusive.
7.44. Since the drafting of SEEA EEA in 2012 it has become increasingly apparent
that the concept of ecosystem capacity is a central one in both explaining the model
and applying the model in practice, especially in terms of developing information sets
that can support discussion of sustainability. The following points have emerged from
recent discussion of the issue and help to better frame the discussion of ecosystem
capacity in the context of the ecosystem accounting model.
Ecosystem capacity is a function of ecosystem extent and condition
Ecosystem capacity should be considered in reference to a specific set of
ecosystem services
Ecosystem capacity can be conceptualized and measured (i) in relation to
an ecosystem assets capacity to supply an individual ecosystem service,
i.e. there is a capacity measure corresponding to each ecosystem service
within the chosen set; and (ii) in relation to the basket of ecosystem
services as a whole
Ideally, each individual capacity measure will be a function of the overall
condition thus bringing together the two concepts just outlined.
A distinction is needed between the capacity for an ecosystem to supply
ecosystem services independent of expected use and the capacity to
supply services taking into account likely use given levels of demand and
the potential for extraction.
Each individual capacity may be considered as a sustainable yield or flow
relevant for the specific ecosystem service. The measure should reflect
the estimated annual yield or flow for the forthcoming accounting period
given the extent and condition of the ecosystem asset at that time, and
under the constraint that the extent and condition remained unchanged
over the accounting period.
In cases where high levels of use of the ecosystem asset take place, e.g.
through extraction or pollution, it is expected that the condition of the
asset will fall and that actual flows of ecosystem services will be higher
than the sustainable flow. This set of circumstances would reflect
ecosystem degradation.
7.45. Considering capacity as relating to individual ecosystem services is an
important step forward in an accounting context, since it permits a direct link to
discussions of sustainable yield and flow that are well established in biological
models and resource economics. However, there remains the significant challenge of
understanding the links between ecosystem capacity for individual services and the
overall ecosystem condition and the balances/trade-offs between different ecosystem
services.
7.46. From an accounting perspective an important but as yet not developed aspect
of defining ecosystem capacity concerns the link between ecosystem capacity and
ecosystem degradation. In the SEEA EEA ecosystem degradation is defined in
relation to the decline in condition of an ecosystem asset through economic and other
human activity (SEEA EEA 4.31). This aligns with the approach in the national
accounts and in the SEEA Central Framework for the definition of consumption of
fixed capital (depreciation) and depletion.

69
7.47. The emerging idea is that ecosystem degradation may still be related to
declining condition but more specifically in relation to declining condition as it
affects the capacity of an ecosystem to supply ecosystem services in a sustainable
manner into the future. Since both depreciation and depletion are concepts that imply
a finite asset life the issue of the capacity for sustainable supply does not explicitly
arise. However, exactly how capacity should be taken into account in relation to
degradation and whether this can be done in a manner that remains consistent to the
accounting principles of the SNA and SEEA Central Framework requires further
investigation.
7.48. As discussion continues on defining ecosystem capacity, it is relevant to
highlight that, from a compilation perspective, the lack of a definition in no way
limits the potential to compile most other ecosystem accounts and indeed the
compilation of these various accounts (extent, condition, ecosystem services supply
and use) will be important in providing the measurement experience and detail for the
refinement of measures of ecosystem capacity that are being discussed.
7.6 Conclusions, recommended activities and research issues
7.49. To be determined

70
8. Valuation in ecosystem accounting
8.1 Introduction
8.1. Regularly, the issue of valuation clouds and constrains discussion of ecosystem and
natural capital accounting. This occurs for many reasons. For some, the concerns
about valuation relate to valuation implying that a “dollar value” is placed on all
environmental assets and services and that this is both inappropriate and misleading.
For others, the measurement issues are too great and the environment too complex to
consider that useful measures might be compiled. Finally, there are differences of
view on the purposes, concepts and techniques in relation to monetary valuation with
opinions often being well entrenched in different schools of thought.
8.2. Like SEEA EEA chapter 5, the ambition in this chapter is to provide a possible
pathway through these various issues such that the discussion on valuation in the
context of ecosystem accounting can be undertaken in as an informed way as
possible. The ANCA Research Paper on valuation in ecosystem accounting (ref#)
provides some additional details and in section 5.4 references are made to relevant
documents and materials.
8.3. This chapter is structured in the following way. In section 8.2 the main valuation
principles for ecosystem accounting are outlined drawing out the key points from the
material presented in SEEA EEA chapter 5. In section 8.3 the key challenges in
valuation are described. Section 8.4 considers relevant data and source materials. The
final two sections provide a summary of recommendations in relation to valuation
based on current practice and knowledge and a summary of the key issues requiring
further research.
8.2 Valuation principles for ecosystem accounting
8.4. At the outset, SEEA EEA recognises that the term valuation can mean different
things. For accountants and economists, valuation is almost always used in the
context of placing a monetary price (dollar value) on assets, goods or services. In
other contexts valuation may refer to a more general notion of recognising the
significance of something. In SEEA EEA the focus is on valuation in monetary terms
but this is not to discount the role or importance of other concepts of value. (A useful
introduction to the way in which non-monetary valuation may be conducted is
described in Maynard et al 2014)
8.5. Valuation in the SEEA EEA is applied to the valuation of ecosystem services and to
the valuation of ecosystem assets. There is a direct connection made between these
two distinct targets of valuation whereby the value of ecosystem assets at any point in
time, for example at the end of an accounting period, is equal to the net present value
of the future flows of ecosystem services that are expected to occur. The application
of the net present value technique (explained at length in the SEEA Central
Framework Chapter 5) is required since there are no markets that exist in the buying
and selling of ecosystems in such a way that the value of all ecosystem services is
captured.
8.6. From a practical perspective, the need to apply NPV techniques to value ecosystem
assets implies that the valuation of ecosystem assets cannot be determined directly.
Instead, the asset value relies on the estimation of the value of ecosystem services.
Thus in an accounting context the valuation of ecosystem services and the valuation
of ecosystem assets are seen as distinct but related tasks.
8.7. In terms of the valuation of ecosystem services the relevant valuation concept for
ecosystem accounting purposes is that of exchange value. If there were observable

71
markets in individual ecosystem services this value would reflect the actual prices
paid by consumers of ecosystem services to the relevant producers (i.e. the
ecosystems). Since transactions with ecosystems are not observable, these exchange
values must be estimated using one of a variety of non-market valuation techniques.
8.8. Some non-market valuation techniques do not reflect only the value of the exchange
but also incorporate the welfare effects that can arise to the consumer of the
ecosystem service. For example, the value of water abstracted from a river might be
increased if one also incorporated the positive effect that consuming water had on
health and subsequently labour productivity. While values that incorporate welfare
effects may be very useful for assessing differences between available choices, these
welfare values are not of direct use in accounting contexts. Consequently, in the
selection of non-market valuation techniques, if the objective is ecosystem
accounting, then techniques must be found that estimate only the exchange value.
8.3 Key challenges in valuation
8.9. There is a wide range of challenges in valuation. The following section describes
those that may be most commonly confronted.
8.10. The target of valuation. In the SEEA EEA ecosystem accounting model (see
chapter 2) a clear distinction is made between ecosystem services and the benefits to
which they contribute. Particularly for provisioning services, it is not uncommon to
consider that the market price of the extracted good (e.g. fish caught or timber
harvested) is equivalent to the price of the ecosystem service. In fact, the market price
reflects the value of the benefit and the appropriate price for the ecosystem service
must deduct the costs of extraction and harvest thus leaving residual.
8.11. Unfortunately, in some cases, this residual may be very small or negative (for
example in the case of abstracted water or open access fishing) and consequently the
implied price of the ecosystem service would be very low, zero or negative. A clear
resolution of this matter is required since while the residual or resource rent technique
would lead to the derivation of exchange values, these values would seem to not
reflect the broadening of the production boundary that underpins the ecosystem
accounting approach.
8.12. A second aspect concerning the target of valuation is the distinction between
the valuation of ecosystem services and the valuation of ecosystem assets. Within
ecosystem accounting, the valuation of ecosystem assets reflects the overall value of
a given spatial area and is estimated by aggregating the net present value of all
relevant ecosystem services.
8.13. Consistency in the use of valuation concepts and techniques. For ecosystem
accounting, since the ultimate objective in valuation is the integration of data with the
standard national accounts, it is essential to use a valuation concept that is consistent
with the accounts. SEEA EEA describes the appropriate concept as exchange values,
i.e. the prices that arise at the time of exchange between buyer and seller. If exchange
values are not used to estimate the value of ecosystem services then there will be no
consistent integration with the standard national accounts.
8.14. The use of a consistent valuation concept does not imply that the same
estimation technique must be applied in all circumstances. Indeed, a variety of
different techniques are likely to be required to cover the range of situations and the
different types of ecosystem services. Section 8.4 discusses possible valuation
techniques.

72
8.15. Scaling and aggregation. Often studies on the valuation of ecosystem services
are completed with regard to specific ecosystem services in specific ecosystems. A
significant challenge from an ecosystem accounting perspective is therefore
translating these “point” estimates into information that can be applied at broader
scales. This challenge is generally considered under the banner of “benefit transfer”.
A range of techniques have been developed some of which are considered more
refined and appropriate than others.
8.16. Valuation of regulating services. For most provisioning services there is a
connection to market values of benefits that can provide a base for measurement. This
is also true for some cultural services (such as those relating to tourism and
recreation). However in the area of regulating services such connections to marketed
benefits is unusual. Indeed, for regulating services it can be difficult to appropriate
define and measure the actual physical flow of the service since often the service is
simply part of ongoing ecosystem processes rather than a function of direct human
activity – for example air filtration and carbon sequestration.
8.17. The measurement of non-use values. An important part of the value of
ecosystems from a societal perspective can lie in the non-use values that a reflected in
various cultural services provided by ecosystem assets. These values include
existence values (based on the utility derived from knowing that an ecosystem exists);
altruistic value (based on utility derived from knowing that someone else is benefiting
from the ecosystem) and bequest value (based on utility derived from knowing that
the ecosystem may be used by future generations). At this point there are relatively
few studies in this area of valuation and the methods by which exchange values for
these types of use may be defined.
8.18. The valuation of ecosystem assets with respect to land. In estimating the
value of ecosystem assets at exchange values one important consideration is the value
of land that is commonly traded in markets. Depending on the circumstance, values
of land will incorporate the value of some ecosystem services but they are unlikely to
capture the value of all of the ecosystem services particularly those that are of a
public good nature. Further, market based land values will incorporate elements of
value that are not dependent on ecosystems. Consequently, when considering the
integration of ecosystem asset valuations into existing national accounts balance
sheets some adjustments will be required to ensure there is no double counting or
gaps in valuation in the estimation of total net wealth.
8.19. The valuation of biodiversity and resilience. Biodiversity and resilience are
considered in SEEA EEA more as characteristics of ecosystem assets and not as
ecosystem services. Consequently, they are not directly valued using the general
approach outlined and, even within the valuation of ecosystem assets the relative
contribution of biodiversity and resilience are unlikely to be identifiable. Further
consideration on how these aspects of ecosystem may be valued is required.
8.20. Uncertainty in measurement. While there is always uncertainty in
measurement, the valuation of ecosystem services tends to bring together a number of
uncertainties into one place. SEEA EEA (section 5.6.4) explains these uncertainties in
more depth here they are simply listed: (i) uncertainty related to the physical
measurement of ecosystem services and ecosystem assets; (ii) uncertainty in the
valuation of ecosystem services and assets; (iii) uncertainty related to the dynamics of
ecosystems and changes in flows of ecosystem services; (iv) uncertainty regarding
future prices and values of ecosystem services.

73
8.4 Relevant data and source materials
8.21. The SEEA EEA Chapter 5 suggests a logic in the valuation process such that
the first step must be to determine the purpose of valuation, with ecosystem
accounting being one among a number of purposes. Based on the purpose, the
appropriate valuation concept can be determined. For ecosystem accounting the
exchange value concepts is appropriate. Finally, knowing the concept a choice can be
made between various valuation techniques such that the exchange value concept can
be consistently applied across different ecosystem services.
8.22. A number of valuation techniques have been considered appropriate for
measuring exchange values although further discussion on this topic is required as it
has generally not been a focus on the ecosystem services valuation literature. The
SEEA EEA Chapter 5 outlines a number of these approaches and an updated
summary of valuation techniques is provided in Table 8.1.
8.23. In terms of implementation, valuation exercises require, in the first instance,
estimation of physical flows of ecosystem services. These flows are then multiplied
by a relevant price in order to estimate the value of the flows. By their nature, flows
of ecosystem services must be valued in this way. Measurement information on
physical flows of ecosystem services, as outlined in Chapter 5, is thus of direct
relevance.
8.24. In terms of estimating prices usually it is necessary to seek out studies that
have estimated a price for the relevant ecosystem services in a particular ecosystem.
There are a number of databases that house relevant studies including the Ecosystem
Services Valuation Database (ESVD) that has built on the original work of the TEEB
study and the Ecosystem Valuation Toolkit by Earth Economics. A useful link to
these and other valuation databases is on the Ecosystem Services Partnership website
(see http://www.fsd.nl/esp/80136/5/0/50).
8.25. Additional support for applying valuation in national accounting contexts
includes materials from the UNEP Ecosystem Services Economics unit, the materials
developed as part of the TEEB study, and work undertaken within the World Bank
WAVES project. It is noted however, that generally these materials are not explicit
about the valuation concept being applied and hence it is often unclear as to whether
the approaches and recommendations are suitable for ecosystem accounting purposes
in terms of measuring exchange values. Nonetheless, in conjunction with the
discussions in SEEA EEA Chapter 5, these materials should provide a reasonable
base for investigating the valuation of ecosystem services at national level.

74
Table 8.1 Summary of valuation methods and their use in ecosystem accounting
Valuation method Description Comments Suitability for
ecosystem accounting
Unit resource rent Prices determined by
deducting costs of
labour, produced
capital and
intermediate inputs
from market price of
outputs.
Estimates will be
affected by the
property rights and
market structures
surrounding
production. For
example, open access
fisheries and markets
for water supply often
generate low or zero
rents.
In principle this
method is appropriate
but consideration of
market structures is
required.
Production function
methods
Prices obtained by
determining the
contribution of the
ecosystem to a market
based price using an
assumed production
function.
In principle analogous
to resource rent but
generally focused on
the valuation of
regulating services.
May be difficult to
estimate the production
functions.
Appropriate provided
the market based price
being decomposed
refers to a product
rather than an asset –
e.g. value of housing
services rather than the
value of a house.
Payment for Ecosystem
Services (PES)
schemes
Prices are obtained
from markets for
specific regulating
services (e.g. in
relation to carbon
sequestration)
Estimates will be
affected by the type of
market structures put in
place for each PES (see
SEEA EEA 5.88-94)
Possibly appropriate depending on the
nature of the market
structures.
Hedonic pricing Prices are estimated by
decomposing the value
of an asset (e.g. house
block) into its
characteristics and
pricing each
characteristic through
regression analysis
Very data intensive
approach and
separating out the
effects of different
characteristics may be
difficult.
Appropriate in
principle. Heavily used
in the pricing of
computers in the
national accounts.
Replacement cost Prices reflect the
estimated cost of
replacing a specific
ecosystem services
using produced capital
and associated inputs.
This method requires
an understanding of the
ecosystem function
underpinning the
supply of the service
and an ability to find a
comparable “produced”
method of supplying
the same service.
Appropriate under the
assumptions (i) that the
estimation of the costs
reflects the ecosystem
services being lost and
is least-cost treatment
and (ii) that it would be
expected that society
would replace the
service if it was
removed. (Assumption
(ii) may be tested using
stated preference
methods.)
Damage costs avoided /
Costs of treatment
Prices are estimated in
terms of the value of
production losses or
damages that would
occur if the ecosystem
services were lost or
degraded.
May be challenging to
determine the
contribution of an
ecosystem service.
Appropriate under the
assumptions (i) that the
estimation of the costs
reflects the ecosystem
services being lost and
is least-cost treatment
and (ii) that it would be
expected that society
would repair the

75
damage if it occurred.
(Assumption (ii) may
be tested using stated
preference methods.)
Averting behaviour Prices are estimated
based on individuals
willingness to pay for
improved or avoided
health outcomes.
Requires an
understanding of
individual preferences
and may be difficult to
link the activity of the
individual to a specific
ecosystem service.
Likely inappropriate
since it relies on
individuals being aware
of the impacts arising
from environmental
changes.
Restoration cost Refers to the estimated
cost to restore an
ecosystem asset to an
earlier, benchmark
condition.
Should be clearly
distinguished from the
replacement cost
method.
The main issue here is
that the costs relate to a
basket of ecosystem
services rather than a
specific one. More
often used as a means
to estimate ecosystem
degradation but there
are issues in its
application in this
context also.
Inappropriate since it
does not determine a
price for an individual
ecosystem service.
Travel cost Estimates reflect the
price that consumers
are willing to pay in
relation to visits to
recreational sites.
Key challenge here is
determining the actual
contribution of the
ecosystem to the total
estimated willingness
to pay. There are also
many applications of
this method with
varying assumptions
and techniques being
used with a common
objective of estimating
consumer surplus.
Possibly appropriate depending on the
estimation techniques
and whether the
approach provides an
exchange value, i.e.
excludes consumer
surplus.
Stated preference Prices reflect
willingness to pay from
either contingent
valuation studies or
choice modelling.
These approaches are
generally used to
estimate consumer
surplus and welfare
effects and within the
range of techniques
used there can be
potential biases that
should be taken into
account.
Inappropriate since
does not measure
exchange values
Marginal values from
revealed demand
functions
Prices are estimated by
utilising an appropriate
demand function and
setting the price as a
point on that function
using (i) observed
behaviour to reflect
supply (e.g. visits to
parks) or (ii) modelling
a supply function.
This method can use
demand functions
estimated through
travel cost, state
preference, or averting
behaviour methods.
The use of supply
functions has been
termed the simulation
exchange method
(Campos & Caparros,
2011)
Appropriate since
aims to directly
measure exchange
values but the creation
of meaningful demand
functions and
estimating hypothetical
markets may be
challenging.

76
8.5 Conclusions
8.26. To be developed based on further discussion. A key focus will need to be the
need for research on the development of valuation techniques aimed at measuring
exchange values. Based on Table 8.1 there are quite number of candidate methods but
more direct accounting related valuation investigation is required.

77
9. Integrating ecosystem accounting with standard economic data
9.1 Introduction
9.1. Ultimately, the integration of ecosystem accounting based information with standard
economic data is the key driver for this work within the context of the SEEA. This
reflects that the SEEA has been developed as a system that extends and complements
the standard economic accounts structured following the SNA. Indeed, for many, the
prime ambition of applying the SEEA is the development of adjusted measures of
national income that take into account environmental information, for example in the
form of depletion or degradation adjusted measures of GDP.
9.2. The reality that emerges from the development of the SEEA EEA and its testing is
that adjustments to national income for ecosystem degradation cannot be regarded as
straightforward or direct. Indeed, what has emerged in recent years is the need to
consider the series of issues outlined through the SEEA EEA and in this Technical
Guidance concerning spatial units, scaling and aggregation, ecosystem services,
ecosystem condition and capacity and valuation, among others.
9.3. As a result while a theoretical framework for integrated accounting of ecosystems and
economic activity is largely in place, its implementation represents the end point of a
series of steps of compilation (described in section 9.2) and also requires a range of
assumptions on the nature of the require valuation and integration. Compilers should
recognise that these long standing matters are still the subject of ongoing discussion
and no definitive resolution has yet been found.
9.4. This chapter builds on the text provided in SEEA EEA Chapter 6 and summarises
some of the key points that should be recognised in pursuing full integration with
standard economic data.
9.2 Steps required for full integration with the national accounts
9.5. Historically, the approach to integrating ecosystem related information with the
national accounts has moved directly to the question of the valuation of degradation
and the appropriate recording and allocation of degradation in the accounts. This is
characteristic of the primary approaches outlined by national accountants (see for
example, Harrison 1993 and Vanoli 1995) and again demonstrated by Bartelmus
(2015). However, the question of exactly how the integration should be undertaken
has never been fully resolved.
9.6. As explained in SEEA EEA and also in recent literature (e.g. Edens and Hein, 2013)
the emergence of the concept of ecosystem services has allowed a
reconceptualization of the integration with the national accounts. It is this new basis
for integration that is reflected in the SEEA EEA.
9.7. Through the concept of ecosystem services the following (generalised) steps toward
integration become apparent
i. Delineate the relevant spatial areas to create mutually exclusive
ecosystem assets
ii. Measure the generation of ecosystem services from each ecosystem
asset
iii. Measure the monetary value of all ecosystem services
iv. Measure the condition of each ecosystem asset

78
v. Assess the future flows of ecosystem services from each ecosystem
asset based on consideration of the condition and capacity of
ecosystem assets
vi. Estimate the net present value of the future flows of each ecosystem
service and aggregate to provide a point in time estimate of the
monetary value of each ecosystem asset
vii. Estimate the change in net present value over an accounting period
and determine the monetary value of ecosystem degradation
viii. Integrate values of the production and consumption of ecosystem
services, the value of ecosystem degradation and the value of
ecosystem assets into the standard economic accounts.
9.8. It is clear from this list, which itself is somewhat stylised, that the full integration of
ecosystem accounting information into the standard national accounts is not
straightforward. At the same time, maintaining what must be a longer term objective
of integration gives a clear purpose and rationale for the selection and structuring of
the ecosystem information that is required in the early phases. Further, the
information organised in the early phases is likely to be of direct usefulness for
decision making and monitoring in its own right. Consequently, while the objective
of full integration may be challenging, it plays an important part in framing the SEEA
EEA approach to ecosystem accounting.
9.9. The measurement issues relating to the initial steps outlined above have been
described in earlier chapters in this Technical Guidance. This chapter discusses
measurement issues related to steps vi to viii. It is important to recognise that the
content of this chapter is largely in the realm of ongoing research and at this stage full
integration of ecosystem accounts with the standard national accounts is likely to be a
medium to longer term objective at national level.
9.3 The role of combined presentations
9.10. A more immediate means of combining the information from ecosystem
accounting with the standard national accounts is by means of so-called combined
presentations.
9.11. Combined presentations are described in the SEEA Central Framework
Chapter 6. In essence they are tables that support the presentation of information from
a variety of sources in a manner that facilitates comparison between economic and
environmental data. This is achieved by consistent use of common classifications and
accounting principles.
9.12. Two examples with respect to ecosystem accounting are (i) the provision of
information for specific ecosystem assets (spatial areas) of changes in condition of
the asset alongside information on the expenditure on environmental protection in
that same area; and (ii) information on the flows of ecosystem services generated by
an ecosystem asset combined with information on the value of economic production
from that asset (a specific example here might be comparison of a farm’s income with
the value of ecosystem services generated from the same farm area).
9.13. SEEA EEA Chapter 6 provides some additional comments in relation to
combined presentations. The main point here is that there is considerably flexibility in
the design of combined presentations. While they do not represent a full integration
of information they may support a more informed discussion of the relationship

79
between ecosystems and economic activity, and they may help underpin presentation
of monitoring type information and indicators.
9.4 Integrated accounting structures
9.14. Chapter 4 introduced two types of integrated accounts in the context of the
broad suite of ecosystem accounts. In this section those two types of accounts –
augmented input-output tables and integrated sector accounts and balance sheets are
described in more detail.
9.4.1 Augmented input-output tables
9.15. The augmented input-output table represents the first account in which
explicit consideration must be given to the boundaries between the current economic
measures and measures of ecosystem services in terms of the structure of the
accounts. The ambition in the augmented input-output table is to present the
information on the supply and use of ecosystem services as extensions to the standard
input-output table.
9.16. There are two key aspects to this extension. First, recalling that the ecosystem
accounting model implies an extension to the standard production boundary, the set
of products within scope of the input-output table is broader and hence the size of the
input-output table must grow. This can be done through the addition of new rows
(representing the ecosystem services).
9.17. The requirement here is to ensure that these ecosystem services are
distinguished clearly from the products that are already within the standard input-
output table – i.e. the SNA benefits. For these benefits the relevant ecosystem
services represent the intermediate consumption of the producers of the SNA
benefits. For ecosystem services that contribute to non-SNA benefits then both the
ecosystem services and the new benefits need to be added in – in effect the ecosystem
services are inputs to the production of the non-SNA benefits.
9.18. It is noted that while conceptually it would be possible to extend the input-
output table to incorporate both final and intermediate ecosystem services, it is
recommended that the extension be limited to final ecosystem services. In part this
reflects that if intermediate services were also to be added then the complexity of the
table would be increased but also that from an analytical perspective there is little
gain. The focus of the augmented input-output table is on the link between the
economy and ecosystems and this requires only inclusion of final ecosystem services.
Put differently, from a production perspective the intermediate services net
themselves out. Further, the analysis of the intermediate services and hence flows
between ecosystems may be analysed using data from the ecosystem services
generation and use tables.
9.19. The second key aspect to the augmented input-output table is that additional
columns are required to take into account the production of ecosystem services – i.e.
the ecosystems are considered additional producing units alongside the current set of
establishments classified by industry (agriculture, manufacturing, etc). Given that
input-output tables are generally compiled at national level it may be sufficient to
introduce simply one additional column to cover the production of all ecosystem
services. In this case the detail would be covered in the ecosystem services generation
account. However, there may be interest in adding columns by type of LCEU
(ensuring aggregation to national level) or by specific EAUs that cover the country.

80
9.20. While in principle the structure of an augmented input-output table may be
estimated in both physical and monetary terms, here it is suggested that only
compilation in monetary terms is undertaken. The problem in physical terms is that
the table can only be interpreted and balanced if the same measurement unit is
applied for all of the products in scope (both ecosystem services and others). The
measurement of economy wide - material flow accounts has developed over the past
20 years where all products inside the standard production boundary are measured in
tonnes but this approach is not advocated in the SEEA CF and its extension to cover
ecosystem services has not been developed.
9.21. A related augmentation of standard input-output tables are environmentally-
extended input-output tables (EE-IOT). These tables are increasingly compiled,
including at regional and world levels, for the analysis of embodied GHG emissions,
water and similar environmental flows. An introduction to EE-IOT is contained in
SEEA Applications and Extensions Chapter 3.
9.22. The distinction here is that for EE-IOT information on environmental flows
is simply appended to the standard input-output table and then matrix algebra is used
to integrate the data for analytical purposes. What is required is that the information
on environmental flows is classified and structured in the same manner as for the
standard input-output data. Further, the additional information may be in physical or
monetary form even while the standard input-output data remain in monetary form.
9.23. For the augmented input-output table envisioned here, the ecosystem services
are integrated within the standard input-output table reflecting the extension of the
production boundary. This is an important and significant development. It is noted
however that using EE-IOT techniques it is possible to analyse selected ecosystem
services without developing a full augmented input-output table.
9.24. An important result of integrating the flows of ecosystem services in this way
is that it is clear how the commonly discussed topic of “double counting” is managed
in a straightforward manner in a national accounting setting. Quite commonly, there
is concern that integrating ecosystem services with the national accounts will result in
double counting if certain flows are included. The stylised presentation in Table 9.1
demonstrates that double counting is avoided provided that the series of entries from
production to use through the supply chain are recorded appropriately. The gross
basis of recording that is used in Table 9.1 is by far the most transparent manner in
which double counting is dealt with for accounting purposes.
9.25. Table 9.1 is a stylized supply and use table and is divided into three parts.
Part A reflects a standard recording, i.e. no ecosystem services, of timber production
for furniture purchased by households. The recording ignores all other inputs and
potentially relevant flows (e.g. labour costs, retail margins).
9.26. Part B extends this recording to include the flow of the provisioning service
of timber from the ecosystem asset (the forest) to the forestry industry. The main
effect is to partition the value added of the forestry industry between the industry and
the ecosystem asset. Note that the overall value added is unchanged (at 80 currency
units) even though total supply has increased. This reflects the increase in the
production boundary and demonstrates how the accounting framework deals with the
challenge of double counting.
9.27. Part C introduces a second ecosystem service, air filtration, which is
generated by the ecosystem asset. Again total production is increased but in this case
value added also rises since the additional production is not an input to existing
products. The increase in value added is also reflected in increased final demand of
households.

81
Table 9.1: Integration of final ecosystem services with current national accounts
estimates
Ecosystem
asset (Forest)
Forestry
industry
Manufacturing
industry
Households
Final
Demand
TOTAL
PART A
Supply
Logged timber 50 50
Furniture 80 80
Use
Logged timber 50 50
Furniture 80 80
Value added (supply less use) 50 30 80
PART B
Supply
Ecosystem service – growth
in timber
30 30
Logged timber 50 50
Furniture 80 80
Use
Ecosystem service – growth
in timber
30 30
Logged timber 50 50
Furniture 80 80
Value added (supply less use) 30 20 30 80
PART C
Supply
Ecosystem service – growth
in timber
30 30
Ecosystem service – air
filtration
15 15
Logged timber 50 50
Furniture 80 80
Use
Ecosystem service – growth
in timber
30 30
Ecosystem service – air
filtration
15 15
Logged timber 50 50
Furniture 80 80
Value added 45 20 30 95
9.4.2 Integrated ecosystem institutional sector accounts and balance sheets
9.28. Beyond the augmented input-output table which integrates ecosystem
services information into the standard structures for measuring production and
consumption, it is relevant to also integrate ecosystem information into the broader
sequence of accounts and balance sheets of the SNA. The general logic and structure
of the sequence of accounts is described in detail in the SNA and summarised in the
SEEA Central Framework, Chapter 6. The focus in these accounts moves away from
industry level information on production and consumption and instead focuses on

82
sector level (i.e. corporations, governments, households) income, saving, investment
and wealth.
9.29. Chapter 6 of SEEA EEA describes the possible sequence of accounts where
there is integration of information on ecosystem degradation in particular. The SEEA
EEA is not definitive however and no clear resolution of the way in which
degradation might be allocated has been determined. Determining an appropriate
allocation of degradation requires making judgements on the attribution of the
impacts of economic activity on the environment. These impacts may occur in areas
well away from the source of the impact, may occur in time periods well in advance
of the impact, and may be unknown to the relevant unit. In addition it is not
necessarily clear in what way the loss of benefits applying to the impacted sectors
should be related to the income of the sector causing the impact. These matters have
been debated at length in the national accounting community without any clear
resolution. It may well be that, as stated in the SEEA EEA, the choice of structure for
the sequence of sector accounts should depend on the type of question being posed.
9.30. One of the main functions of the sequence of accounts is to demonstrate the
linkages between incomes, investment and balance sheets and in this context, a key
feature of the standard sequence of accounts is the attribution of consumption of fixed
capital (depreciation) to sectors as a cost against income.
9.31. The significance of developing a sequence of accounts that integrates
ecosystem information is two fold. First, it is in these accounts that the cost of
ecosystem degradation can be attributed to individual sectors and linked, at the same
time, to changes in net wealth. Second, the effect of extending the asset boundary of
the standard national accounts to include various regulating and cultural services
from ecosystems can be seen in an extended balance sheet.
9.32. From an implementation perspective, it should be recognised that the
compilation of a sequence of institutional sector accounts and balance sheets is not at
all straightforward. It relies on compilation of aggregated data for ecosystem services
and ecosystem assets in monetary terms and hence information in all of the accounts
described above will be required before a sequence of accounts can be compiled. In
that sense, the completion of these accounts should be considered of low priority and
it is likely that significant benefits can arise from placing priority on the completion
of the accounts listed above in the first instance, particularly those concerning
ecosystem condition and the generation of ecosystem services.
9.5 Key challenges in full integration
9.5.1 Allocation of ecosystem degradation to economic units
9.33. One of the most longstanding challenges in developing fully integrated
accounts is the measurement and allocation of ecosystem degradation. The SEEA
Central Framework proposes a means by which the depletion of natural resources can
be incorporated within the standard sequence of accounts of the SNA. This step
recognises that the using up of natural resources is a cost against future income of the
extractor that should be attributed to the extractor.
9.34. While such depletion due to natural resource extraction is a component of
ecosystem degradation, in concept degradation is broader since it also incorporates
the cost of reducing the future generation of all ecosystem services, not only the
provisioning services from natural resources in ecosystems. Unfortunately, it is
commonly the case that the loss in ecosystem condition and capacity that arises due

83
to economic and human activity may be difficult to directly attribute to individual
economic actors.
9.35. A number of alternative approaches to dealing with this allocative issue have
been suggested. Perhaps the most obvious is that the degradation should be attributed
to the economic unit that caused the degradation, presuming that this can be
determined. It may be made difficult due to distance (i.e. impacts are felt in
neighbouring ecosystems) or due to time (i.e. when the impacts become evident after
the activity occurred). Due to both of these factors the appropriate economic unit (i.e.
the unit who should be shown as bearing the cost) may not be the manager or owner
of a particular ecosystem asset. Further, since physical degradation of an ecosystem is
likely to impact on the generation of multiple ecosystem services received by various
beneficiaries assessing the overall impacts is complex.
9.36. These factors are all quite distinct from the estimation of depreciation (or
consumption of fixed capital) for produced assets. Depreciation can be directly
attributed since there is only one owner/user who receives all of the benefit/services
of the asset (in the generation of output and income).
9.37. Overall, the issue of allocation ecosystem degradation has not been resolved
and remains on the research agenda.
9.5.2 Valuation of ecosystem degradation
9.38. Together with this challenge of attribution, a range of valuation approaches
for ecosystem degradation have been suggested. These are described in SEEA EEA
section 6.3.3. The approach that emerges from the ecosystem service based valuation
approach described here is that the value of ecosystem degradation will be equal to
the change in the net present value of an ecosystem asset putting aside changes in
value that are not due to economic and human activity. In this sense the valuation will
directly reflect the loss of future ecosystem services.
9.39. The most commonly used alternative to valuing ecosystem degradation is the
use of restoration (maintenance) cost approaches. Such approaches were suggested in
the original 1993 SEEA and have been applied more recently in the CBD ENCA
QSP. Generally speaking, restoration cost approaches are not well accepted by the
economic community (need references). In accounting terms as well, recent work
suggests that they are not, as commonly implied, equivalent to what is done in
estimating depreciation of fixed capital (see Obst and Vardon, 2014). There is no
doubt that estimating potential restoration costs supplies an important piece of
information, particularly for planning purposes. It is less clear that it supplies a good
estimate of the value of ecosystem degradation.
9.40. A more recent suggestion for the valuation of ecosystem degradation has
emerged from discussion on ecosystem capacity. Through this discussion the idea has
arisen of estimating the net present value of the flow of services represented by an
ecosystem’s capacity at any given point in time. This is distinct from the net present
value of the flow of services that are expected to occur. The change in the NPV of the
ecosystem capacity might be a more appropriate estimate of the effect of the
reduction in future income that arises from a decline in ecosystem condition.
However further investigation of the national accounting aspects of this approach is
required.

84
9.5.3 Integrating balance sheet valuations
9.41. Perhaps the most significant measurement challenge in full integration is the
need to generate balance sheet values for ecosystem assets on a consistent basis with
the items already recorded on the national balance sheet as defined by the SNA. In
the absence of observed market prices for ecosystem assets the logic of the SEEA is
that the value of the asset would be equal to the net present value of the future flows
of all relevant ecosystem services.
9.42. As with all NPV based approaches this requires various assumptions (see
SEEA Central Framework Chapter 5) including estimating the future rates of use and
extraction and applying appropriate discount rates. Estimating the future rates of use
of ecosystems must in turn imply an understanding of the likely mix or basket of
ecosystems that will occur in the future and also the likely impact of generating this
assumed basket on the future condition of the ecosystem asset. As discussed in
Chapter 7, reaching these understandings on ecosystem capacity is a significant
challenge.
9.43. It is the case that some parts of the value of ecosystem assets are reflected in
the value of assets currently recorded on national balance sheet. The most obvious
example is the value of agricultural land which must, reasonably, be considered to
incorporate the value of some of the ecosystem services used by farmers in the
production of agricultural goods. Similar logic would apply in the case of forests.
9.44. However, as explained at some length in SEEA EEA section 6.4.2,
untangling the overlap in valuations is likely to be complex. It is certainly not simply
a case of adding on to the current balance sheets the value of ecosystem assets
obtained by summing the NPV of a basket of ecosystem services.
9.45. Given this challenge, an intermediate step may be the compilation of an
ecosystem asset account that shows, in monetary terms, the opening stocks, additions
and reductions in stocks and closing stocks for ecosystem assets as a stand alone
account. This may then be compared to current SNA based balance sheet entries,
particularly for land and natural resources, as a means of understanding the potential
differences and the significance of the recognition of ecosystem services that are
currently outside the production boundary.
9.46. In the comparison of values of ecosystem assets with values currently
incorporated into SNA balance sheets, it is important to recognise the different scopes
of environmental assets. In broad terms, the SNA balance sheets will have lower
values for environmental assets as a result of the SEEA EEA including the values of
additional ecosystem services. At the same time, the SEEA EEA values of ecosystem
assets do not cover all environmental assets – most notably sub-soil mineral and
energy resources. Hence the value of ecosystem assets derived following the SEEA
EEA will be lower than the value of environmental assets given this smaller scope.
The effects of these two differences will vary from country to country.
9.5.4 Application of integrated approaches for individual ecosystem assets
9.47. A final challenge in the area of integrating the accounts arises when aiming
to apply the accounting approach at the level of individual ecosystem assets. Recall
that the valuation of an ecosystem asset is directly related to the basket of final
ecosystem services that are expected to be generated from an asset. At the level of
individual ecosystem assets however, there will be cases where an asset supplies few
or no final ecosystem services (for example, a high mountain forest) but rather plays
a supporting role in supplying services to neighbouring ecosystems. In this situation
an ecosystem asset may be recorded as having zero monetary value and instead its
85
value is embodied in the value of the neighbouring ecosystems. While at an
aggregate, national type level this may not be a significant issue, it is likely to be of
concern if attribution of value is being examined or accounting is being undertaken at
smaller sub-national scales. Resolution of this issue requires the incorporation of
intermediate services into the ecosystem accounting model in a far more explicit
manner, something that is high on the research agenda.
9.6 Alternative approaches to integration
9.48. If in fact the longer term objective is not full integration with the standard
national accounts, then integration of ecosystem and economic data may be
considered in different ways. Three alternative integrated approaches are summarised
here.
9.49. A well developed approach is usually referred to as wealth accounting which
has developed as a branch of economics since the mid 1970s. Underpinning its
approach is that sustainability in aggregation consumption and incomes requires non-
negative changes in aggregate wealth based on the seminal work of Weitzman (1976).
Wealth accounting seeks to aggregate the value of all relevant assets/capitals
including produced, natural, human and social capital. The most prominent work has
been completed by the World Bank (The Changing Wealth of Nations, 2011) and
measures of inclusive wealth by UNU-IHDP and UNEP. Their methods vary in the
detail but they are broadly similar approaches.
9.50. In concept, wealth accounting aims to value each form of capital in terms of
its marginal contribution to human welfare (Dasgupta, 2009). By doing so shadow
prices are estimated for each asset type. From a national accounting perspective while
a focus on marginal prices is appropriate, estimation of the contribution to welfare is
different from a focus on exchange value. Nonetheless given the purpose of wealth
accounting the conceptual approach to integration is quite appropriate. In practice
however, often values for produced capital from the standard national accounts are
used which are based on exchange values and hence there may be a lack of alignment
between the valuation approaches for different capitals. For natural capital, it is clear
that the use of exchange values for ecosystem services would not correspond directly
to the conceptual requirements of wealth accounting although there will be strong
connections between the two approaches.
9.51. Another approach to integration builds on the use of restoration costs as a
measure of ecosystem degradation to create ecological liabilities on the national
balance sheet. That is, unpaid restoration costs that arise when an ecosystem declines
in condition are treated as a liability. This approach is described in the CBS ENCA
QSP and has also been suggested for use at the corporate level by the UK Natural
Capital Committee. From a national accounting perspective there are a number of
difficulties with this approach
First, there is the question of whether restoration costs are a suitable estimate
of ecosystem degradation. This is discussed in Chapter 8.
Second, there is a question of when liabilities should be recognised. If there
is no expectation that the restoration will take place then, at least for
accounting purposes, no liability should be recognised. In effect, recognising
these liabilities is a policy or analytical choice rather than an application of
accounting principles.
Third, if a liability is recognised then all else being equal net wealth will fall.
However, since the recognition of the liability reflects the degradation of an
asset there will be both a fall in an asset and an increase in a liability for the

86
same event thus implies a double counting on the balance sheet. This issue
does not arise in accounting for depreciation where the only balance sheet
change is the fall in the asset value. A solution would be to record the
liability but keep the ecosystem asset value unchanged but this seems quite
counter-intuitive.
9.52. Overall, while recording ecological debts seems attractive and may be a
useful tool in communicating the extent of ecosystem degradation, it has some
deficiencies in terms of its consistency with national accounting principles.
9.53. The final integrating approach noted here is that of full cost accounting which
is an accounting approach that has developed in the corporate accounting world. The
intent behind full cost accounting is to estimate and record the broader costs of a
companies activities on the environment as part of their ongoing operating costs. For
example, the costs of GHG emissions and the release of pollutants are common areas
of interest. Such information may be helpful in a range of management situations.
9.54. From an ecosystem accounting perspective a few points can be noted. First,
the approach largely excludes consideration of ecosystem services in terms of these
flows representing inputs to the production process. Hence, within the full cost
accounting approach there is no change in the standard production or income
boundaries.
9.55. Second, there is no recognition of ecosystem assets as part of capital base of
a company and hence no impact on the companies balance sheet or recording of
ecosystem degradation.
9.56. Third, the incorporation of costs associated with residual flows (emissions,
pollutants etc) is not something undertaken directly in ecosystem accounting. In
broad terms this reflects the valuation of a company’s negative externalities and
externalities are specifically excluded from the national accounts. It may be that in
fact the attribution of these costs is part of a measure of ecosystem degradation but
further work to understand the links between the valuation of externalities and
ecosystem accounting is required to consider this question.
9.57. Overall, while full cost accounting does represent a form of integration it is
somewhat limited in scope relative to the ambitions of ecosystem accounting.
9.7 Conclusions
9.58. To be drafted following further discussion