ESA study contract report – Radiation Report (version for ...
41
ESA study contract report – Radiation Report (version for publication, final review) ESTEC Contract No: 4000102425/10/NL/EM Subject: ECI2: Development, ESCC Evaluation and Qualification of an European Radiation Tolerant Optocoupler Contractor: Optoelettronica Italia Srl ESA CR( ) No: This is volume No. 23.C (version for publication) Contractor’s reference : A. Maglione Abstract This document summarizes the radiation tests and related results, performed by Optoi in the framework of the WP4200, for the abovementioned ESA project. This document version has been issued after the two subsequent radiation meetings, i.e. pt.1 and pt.2, held with ESA over the phone. The work described in this report was done under ESA Contract. Responsibility for the contents resides in the author or organization that prepared it. Name of authors: M. Bregoli, C. Ress Name of ESA Technical Officer: Mustapha Zahir ESA budget heading: Contents List of reference and applicable documents ....................................................................................................................... 1 List of acronyms.................................................................................................................................................................. 1 Introduction ........................................................................................................................................................................ 2 1. Proton irradiation ...................................................................................................................................................... 2 1.1. General considerations......................................................................................................................................... 2 1.2. Elaborations of the main parameters ................................................................................................................... 4 1.3. Further analyses ................................................................................................................................................... 8 1.4. CTR degradation versus NIEL............................................................................................................................ 14 2. Total Ionizing Dose .................................................................................................................................................. 15 2.1. General considerations....................................................................................................................................... 15 2.2. High dose rate (run 20229) ................................................................................................................................ 17 2.3. Low dose rate (run 20228) ................................................................................................................................. 21 Conclusion ........................................................................................................................................................................ 24 Attachments ...................................................................................................................................................................... 25
Transcript of ESA study contract report – Radiation Report (version for ...

ESA study contract report – Radiation Report (version for publication, final review)
ESTEC Contract No: 4000102425/10/NL/EM
Subject: ECI2: Development,
ESCC Evaluation and Qualification of an European Radiation Tolerant
Optocoupler
Contractor:
Optoelettronica Italia Srl
ESA CR( ) No: This is volume No. 23.C
(version for publication)
Contractor’s reference : A. Maglione
Abstract
This document summarizes the radiation tests and related results, performed by Optoi in the framework of the WP4200, for the abovementioned ESA project.
This document version has been issued after the two subsequent radiation meetings, i.e. pt.1 and pt.2, held with ESA over the phone.
The work described in this report was done under ESA Contract. Responsibility for the contents resides in the author or organization that prepared it.
Name of authors: M. Bregoli, C. Ress
Name of ESA Technical Officer:
Mustapha Zahir
ESA budget heading:
Contents List of reference and applicable documents ....................................................................................................................... 1 List of acronyms.................................................................................................................................................................. 1 Introduction ........................................................................................................................................................................ 2 1. Proton irradiation ...................................................................................................................................................... 2
1.1. General considerations......................................................................................................................................... 2 1.2. Elaborations of the main parameters ................................................................................................................... 4 1.3. Further analyses................................................................................................................................................... 8 1.4. CTR degradation versus NIEL............................................................................................................................ 14
2. Total Ionizing Dose.................................................................................................................................................. 15 2.1. General considerations....................................................................................................................................... 15 2.2. High dose rate (run 20229) ................................................................................................................................ 17 2.3. Low dose rate (run 20228) ................................................................................................................................. 21
Conclusion........................................................................................................................................................................ 24 Attachments ...................................................................................................................................................................... 25

– Radiation report –
P10.004
Project Rev. : Document # : Create Date : Print Date : Page :
0 P10.004.137.A 11-07-2013 11-07-2013 1
MOD.075.A.dot
1
List of reference and applicable documents RD-1: ECSS-E-ST-10-12C Methods for the calculation of radiation received and its effects, and a
policy for design margins AD-1: ESCC Basic Specification 22900 Total dose steady-state irradiation test method
List of acronyms
DDD : Displacement Damage Dose ECI : European Component Initiative ECSS : European Coordination for Space Standardization ESCC : European Space Component Coordination HDR : High Dose Rate LDR : Low Dose Rate TID : Total Ionizing Dose
– Radiation report –
P10.004
Project Rev. : Document # : Create Date : Print Date : Page :
0 P10.004.137.A 11-07-2013 11-07-2013 2
MOD.075.A.dot
2
Introduction The activities described in the present Radiation Report are related to the Radiation Evaluation, which is the purpose of WP4200. The reported work reviews the experimental activities conducted between March and June 2013. The contents of this document represent an extract of the more extended report coded P10.004.128.B, which was issued after the Radiation Review Meeting part 2, held by teleconference with ESA on 11th July 2013. The optocouplers under study consist of infrared LEDs and Silicon phototransistors, the latter being manufactured in FBK. The phototransistors belong to wafers no.6 and 10 of run ESA121; they were assembled by Optoi between January and February 2013 (lot codes AA-AB-AC), together with the LEDs, within LCC6 ceramic packages. The reference code of the resulting component is OIER10.
1. Proton irradiation
1.1. General considerations Proton irradiations have been conducted in KVI on 10th and 11th April 2013, following the conditions reported in Table 1 as agreed with ESA. The details of this irradiation campaign are reported in Annex 1.
Table 1: steps for proton irradiation tests; the reported fluences are measured in p/cm2
For each irradiation condition, 3 biased plus 5 unbiased optocouplers were used, all assembled in ceramic LCC6 packages. One MII 4N49 in TO-5 package has been used as reference per each irradiation step; it has been left unbiased and its purpose was to monitor the degradation of characteristics in a well-known commercial product. Non-screened versions of this commercial device have been used for this purpose. As suggested by ESA, a 1MOhm SMD resistor was connected between the emitter and the base of the phototransistor, in order to make the phototransistor (and consequently the optocoupler) more stable in terms of working point, thus reducing instabilities due for example to the external electromagnetic noise. Each irradiation step reported in Table 1 has been associated with a different group of devices, leading to an overall number of 120 parts (plus 15 MII references). This was decided because Optoi

– Radiation report –
P10.004
Project Rev. : Document # : Create Date : Print Date : Page :
0 P10.004.137.A 11-07-2013 11-07-2013 3
MOD.075.A.dot
3
preferred to perform in depth measurements on each device before and after each single radiation step, avoiding progressive tests in-situ which were considered too partial and incomplete. Traceability was possible by means of laser marks on each package lid, using the following serial syntax: AB01. Concerning the biased devices, their biasing conditions were the following: If=3mA, Vce=5V. Specific PCBs were used for this purpose, as shown in Figure 1, hosting specific sockets for the LCC6 type of package and featuring BNC connectors, in compliance with the KVI facility requirements.
Figure 1: biasing board mounted on an Aluminium plate, in compliance with KVI’s requirements; the upper board is
meant to host the unbiased devices, keeping them at the same distance from the beam as the biased ones A detailed overview of the tested devices is shown in Table 2; the underlined codes indicate optocouplers with phototransistors belonging to a different wafer, with respect to the majority of the other devices (ESA121 W6 vs. W10). The optocouplers with phototransistor belonging to this alternative wafer have been distributed across as many fluences as possible, in order to obtain the best representativeness of such variation within the test plan. Stars indicate unbiased optocouplers exposed to 60MeV (8E10p/cm2 and 3E11p/cm2) proton irradiation followed by annealing of several days at room temperature and ageing (168-hour at 100°C).
4,00E+09
Biased: AA67, AA48, AA53
Unbiased: AA57, AA58, AA54, AA56
MII ref. 18
7,00E+09
Biased: AB00, AB03, AB05
Unbiased: AB09, AB10, AB17, AB14, AC32
MII ref. 9
2,00E+10
Biased: AA18, AA14, AA08
Unbiased: AA00, AA06, AA09, AA19, AC48
MII ref. 1
2,00E+10
Biased: AA55, AA44, AA47
Unbiased: AA43, AA59, AA50, AA51, AA52
MII ref. 17
3,00E+10
Biased: AB06, AB13, AB19
Unbiased: AB20, AB21, AB12, AB22, AC49
MII ref. 7
7,00E+10
Biased: AA17, AA27, AA28
Unbiased: AA20, AA24, AA34, AA35, AC23
MII ref. 2
7,00E+10
Biased: AB77, AB75, AB65
Unbiased: AB90, AC10, AC02, AC05, AA49
MII ref. 10
8,00E+10
Biased: AB24, AB23, AB25
Unbiased: AB26*, AB38*, AB47*, AB27*,
AC50*
MII ref. 12
2,00E+11
Biased: AA30, AA31, AA33
Unbiased: AA39, AA81, AA82, AA86, AC26
MII ref. 3
2,00E+11
Biased: AB82, AB62, AB63
Unbiased: AB69, AB72, AB79, AB76, AB80
MII ref. 14
3,00E+11
Biased: AB39, AB33, AB29
Unbiased: AB37*, AB42*, AB44*, AB46*,
AC52*
MII ref. 19
5,00E+11
Biased: AA83, AA85, AA87
Unbiased: AA88, AA90, AA91, AA92, AC28
MII ref. 4
5,00E+11
Biased: AC00, AC03, AC09
Unbiased: AC08, AC01, AC13, AC14, AC15
MII ref. 13
7,00E+11
Biased: AB45, AB59, AB53
Unbiased: AB60, AB49, AB57, AB58, AB56
MII ref. 16
1,00E+12
Biased: AA93, AA94, AA95
Unbiased: AA96, AA97, AA98, AA99, AC29
MII ref. 20
Energy=185MeVEnergy=60MeVFluence Fluence FluenceEnergy = 25MeV
Table 2: device traceability for proton irradiation tests

– Radiation report –
P10.004
Project Rev. : Document # : Create Date : Print Date : Page :
0 P10.004.137.A 11-07-2013 11-07-2013 4
MOD.075.A.dot
4
Characterizations before and after irradiation have been conducted in FBK, following a standardized and automated measuring routine as originally described in the Preliminary Test Plan (P10.004.31, i.e. Annex no.6 to TN2). The results are usually summarized in panels as shown in Figure 2; in addition, raw data are generated, allowing detailed extrapolations of trends and drifts, i.e. in the LED direct and reverse biasing conditions, the phototransistor gain and other electrical parameters.
Figure 2: panel summarizing the main measured parameters
1.2. Elaborations of the main parameters The normalized CTR degradation at the three energies of 25, 60 and 185MeV is illustrated from Figure 3 to Figure 5, under nominal test conditions: If=1mA, Vce=5V and considering the average of the obtained trends. At that operating condition, the initial absolute value of CTR is around 5 as shown in Figure 2; the absolute value of CTR after proton irradiation are shown from Figure 6 to Figure 8. The obtained results are considered satisfactory by Optoi, because the normalized CTR decrease is comparable to other optocoupler brands according to Optoi’s knowledge. Although the initial absolute value of CTR might be considered slightly lower than some brands, this limitation might be overcome by Optoi through a more efficient device architecture.

– Radiation report –
P10.004
Project Rev. : Document # : Create Date : Print Date : Page :
0 P10.004.137.A 11-07-2013 11-07-2013 5
MOD.075.A.dot
5
Figure 3: normalized CTR degradation at 25MeV
Figure 4: normalized CTR degradation at 60MeV

– Radiation report –
P10.004
Project Rev. : Document # : Create Date : Print Date : Page :
0 P10.004.137.A 11-07-2013 11-07-2013 6
MOD.075.A.dot
6
Figure 5: normalized CTR degradation at 185MeV
Figure 6: absolute CTR degradation at 25MeV

– Radiation report –
P10.004
Project Rev. : Document # : Create Date : Print Date : Page :
0 P10.004.137.A 11-07-2013 11-07-2013 7
MOD.075.A.dot
7
Figure 7: absolute CTR degradation at 60MeV
Figure 8: absolute CTR degradation at 185MeV

– Radiation report –
P10.004
Project Rev. : Document # : Create Date : Print Date : Page :
0 P10.004.137.A 11-07-2013 11-07-2013 8
MOD.075.A.dot
8
1.3. Further analyses In depth electrical characterizations allow a detailed elaboration of the collected results. One first consideration regards the degradation of the phototransistor gain. Figure 9 shows the degradation of the phototransistor gain at 60MeV, with Vbe=0.7V, considering the average values of the unbiased parts with one standard deviation.
Transistor gain degradation with 60MeV DDD, measure d at Vbe=0.7V- mean values of unbiased parts -
0,50
0,55
0,60
0,65
0,70
0,75
0,80
0,85
0,90
0,95
1,00
1,00E+09 1,00E+10 1,00E+11 1,00E+12Fluence [p/cm2]
Nor
mal
ized
pho
totra
nsis
tor g
ain
Vce=5V
Vce=15V
Vce=37V
Figure 9: transistor gain degradation (one standard deviation), Vbe=0.7V
Another relevant parameter for evaluating the phototransistor degradation is the increase in dark current after proton irradiation; the absolute increase in dark current lies in the order of tens nA, measured at 20V after 60MeV proton irradiation for each of the five considered fluences. The initial value under the same test conditions is in the order of units of nA. As far as the dynamic properties of the device are concerned, previous analyses and also parallel ongoing tests proved that the phototransistor response time is in fact improved after proton radiation. So, considering that the optocoupler dynamics are well within the nominal specifications before irradiation, Optoi assumes that the rise and fall times don’t represent a critical aspect.
All the analyses on CTR reported in the previous paragraph consider a nominal biasing condition for the LED, i.e. If=1mA. It’s interesting to evaluate the optocoupler behaviour as a function of an increase in the LED forward current; such analysis is shown from Figure 10 to Figure 14, considering the reference energy of 60MeV and one unbiased sample per each irradiation step.

– Radiation report –
P10.004
Project Rev. : Document # : Create Date : Print Date : Page :
0 P10.004.137.A 11-07-2013 11-07-2013 9
MOD.075.A.dot
9
Figure 10: absolute degradation of CTR of one unbiased sample (AB09) with increasing LED forward current, after
60MeV-7E09p/cm2 proton irradiation
Figure 11: absolute degradation of CTR of one unbiased sample (AB20) with increasing LED forward current, after
60MeV-3E10p/cm2 proton irradiation
– Radiation report –
P10.004
Project Rev. : Document # : Create Date : Print Date : Page :
0 P10.004.137.A 11-07-2013 11-07-2013 10
MOD.075.A.dot
10
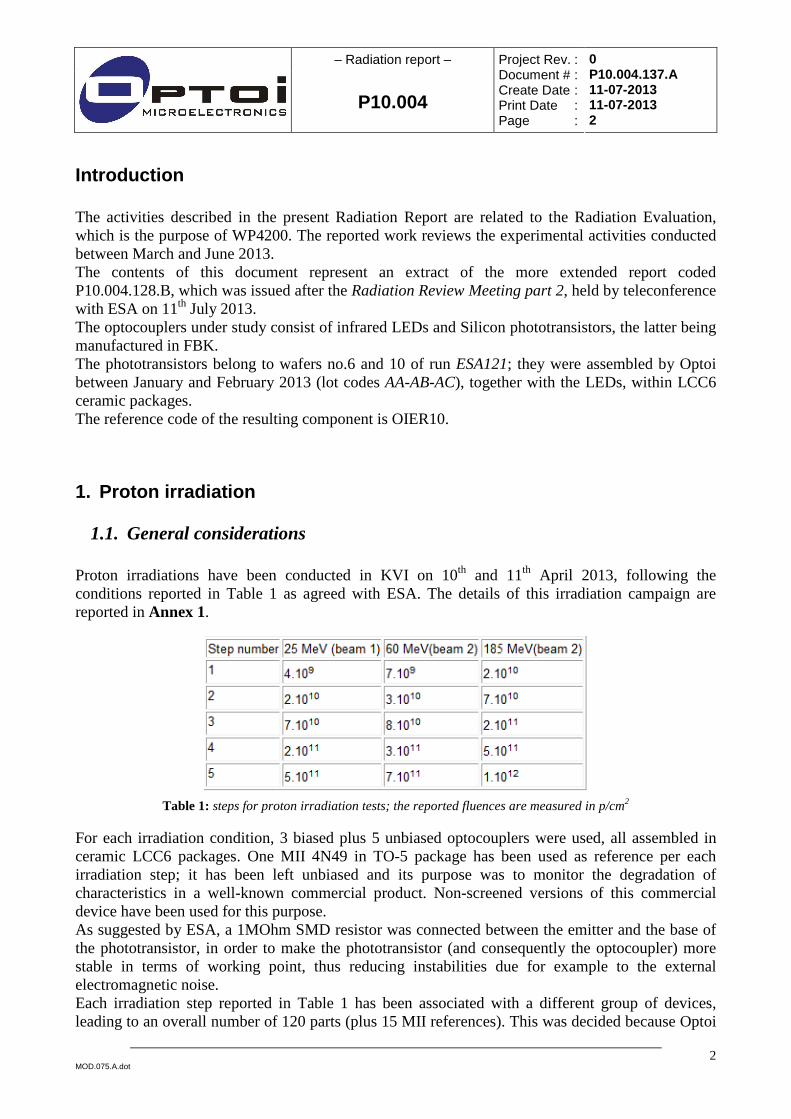
Figure 12: absolute degradation of CTR of one unbiased sample (AB47) with increasing LED forward current, after
60MeV-8E10p/cm2 proton irradiation
Figure 13: absolute degradation of CTR of one unbiased sample (AB44) with increasing LED forward current, after
60MeV-3E11p/cm2 proton irradiation
– Radiation report –
P10.004
Project Rev. : Document # : Create Date : Print Date : Page :
0 P10.004.137.A 11-07-2013 11-07-2013 11
MOD.075.A.dot
11
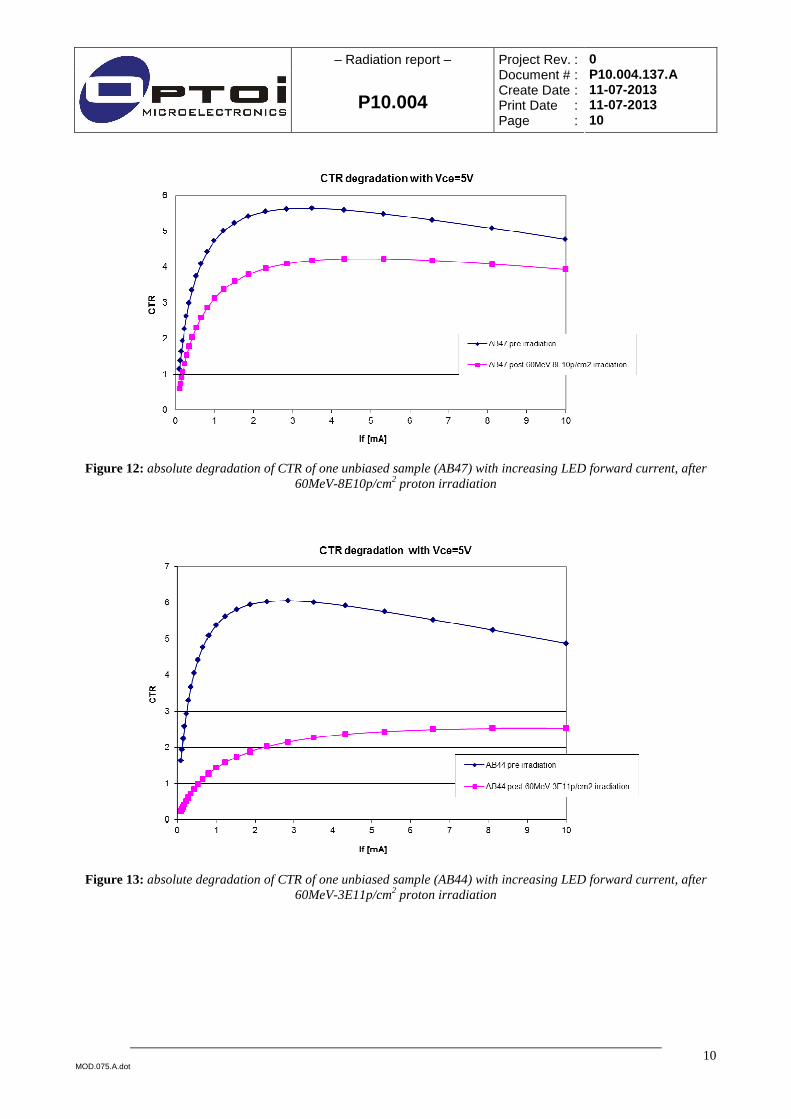
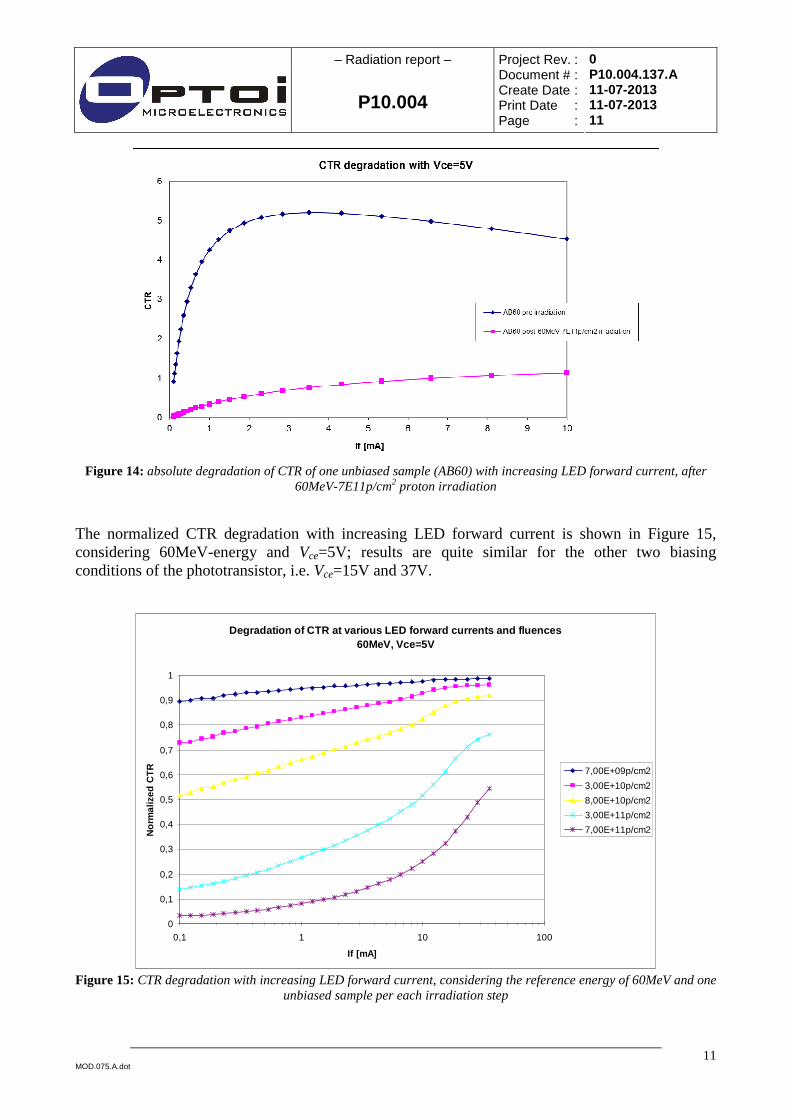
Figure 14: absolute degradation of CTR of one unbiased sample (AB60) with increasing LED forward current, after
60MeV-7E11p/cm2 proton irradiation
The normalized CTR degradation with increasing LED forward current is shown in Figure 15, considering 60MeV-energy and Vce=5V; results are quite similar for the other two biasing conditions of the phototransistor, i.e. Vce=15V and 37V.
Degradation of CTR at various LED forward currents and fluences 60MeV, Vce=5V
0
0,1
0,2
0,3
0,4
0,5
0,6
0,7
0,8
0,9
1
0,1 1 10 100
If [mA]
Nor
mal
ized
CT
R 7,00E+09p/cm2
3,00E+10p/cm2
8,00E+10p/cm2
3,00E+11p/cm2
7,00E+11p/cm2
Figure 15: CTR degradation with increasing LED forward current, considering the reference energy of 60MeV and one
unbiased sample per each irradiation step

– Radiation report –
P10.004
Project Rev. : Document # : Create Date : Print Date : Page :
0 P10.004.137.A 11-07-2013 11-07-2013 12
MOD.075.A.dot
12
The LED forward characteristic, i.e. the I-V curve with positive voltage, is not particularly affected by protons. Figure 16 shows the case of 60MeV-protons with 8E10p/cm2-fluence, on unbiased parts; Figure 17 shows the same trend with a zoom on the area with If~10mA.
Figure 16: LED I-V forward characteristics before and after proton irradiation (60MeV, 8E10p/cm2)
Figure 17: LED I-V forward characteristics before and after proton irradiation (60MeV, 8E10p/cm2), in the region
with If~10mA
– Radiation report –
P10.004
Project Rev. : Document # : Create Date : Print Date : Page :
0 P10.004.137.A 11-07-2013 11-07-2013 13
MOD.075.A.dot
13
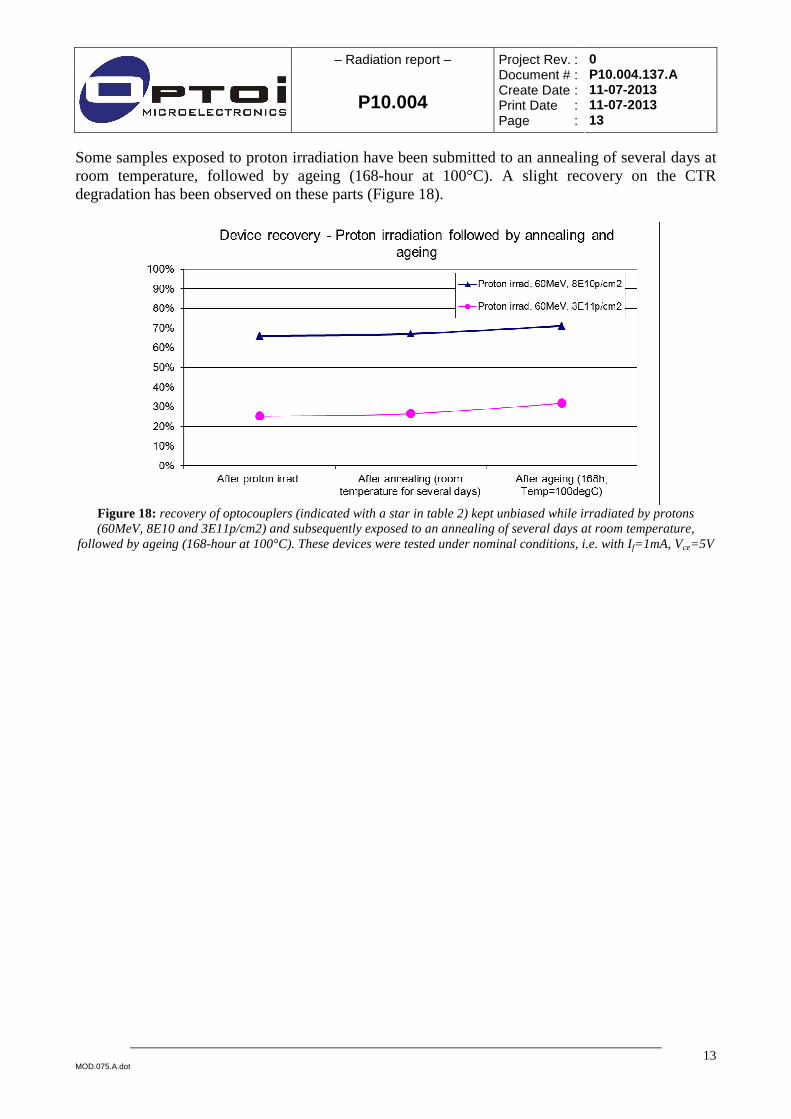
Some samples exposed to proton irradiation have been submitted to an annealing of several days at room temperature, followed by ageing (168-hour at 100°C). A slight recovery on the CTR degradation has been observed on these parts (Figure 18).
Figure 18: recovery of optocouplers (indicated with a star in table 2) kept unbiased while irradiated by protons (60MeV, 8E10 and 3E11p/cm2) and subsequently exposed to an annealing of several days at room temperature,
followed by ageing (168-hour at 100°C). These devices were tested under nominal conditions, i.e. with I f=1mA, Vce=5V

– Radiation report –
P10.004
Project Rev. : Document # : Create Date : Print Date : Page :
0 P10.004.137.A 11-07-2013 11-07-2013 14
MOD.075.A.dot
14
1.4. CTR degradation versus NIEL
A comparison of the normalized CTR degradation on all unbiased devices irradiated with different proton energies (25MeV, 60MeV, 185MeV) is shown in Figure 19, based on AdvEOTec’s elaborations. The NIEL values correspond to Silicon material [RD-1] and the Displacement Damage Dose (DDD) is calculated for all conditions (varying energies and fluences) with respect to the CTR drifts. The obtained trend is well aligned with the NIEL parameter.
Figure 19: comparison between the obtained results after DDD and the expected trend according to NIEL modelling –
each point represents an unbiased device

– Radiation report –
P10.004
Project Rev. : Document # : Create Date : Print Date : Page :
0 P10.004.137.A 11-07-2013 11-07-2013 15
MOD.075.A.dot
15
2. Total Ionizing Dose
2.1. General considerations Tests under gamma rays have been conducted according to the [AD-1] in ESTEC with the support of the Co-60 facility personnel, starting from 13th March 2013. The radiation plan basically followed the original agreements as in Figure 20; the only applied variation was the reach of 150krad(Si) for the high dose tests (360rad/h), regardless of the parallel and slower advance of the low dose rate (36rad/h). Besides, the intermediate measurements were performed leaving a reasonable margin on the value of the overall ionizing doses reported in Figure 20. The details on the irradiation steps are reported in the radiation test summary included in Annex 2.
Overall ionizing dose100krad(Si) dose rate: 36rad/h
5 biased,and 5 unbiased
Overall ionizing dose100krad(Si) dose rate: 360rad/h
5 biased and 5unbiased
Intermediate measurements: 5, 10, 20, 30, 50krad(Si)
Intermediate measurements: 5, 10, 20, 30, 50krad(Si)
Final annealing:168hours, 125 °C
Measurements
10 pcs 10 pcs
TID(36)/TID(360)< 1.2
Overall ionizing dose 50krad(Si) to 100 or
150krad(Si)dose rate: 360rad/h
5 biased and 5 unbiased
Overall ionizing dose 50krad(Si) to 100 or
150 krad(Si)dose rate: 36rad/h
5 biased and 5 unbiased
YESNO
Measurements
If drifts significant
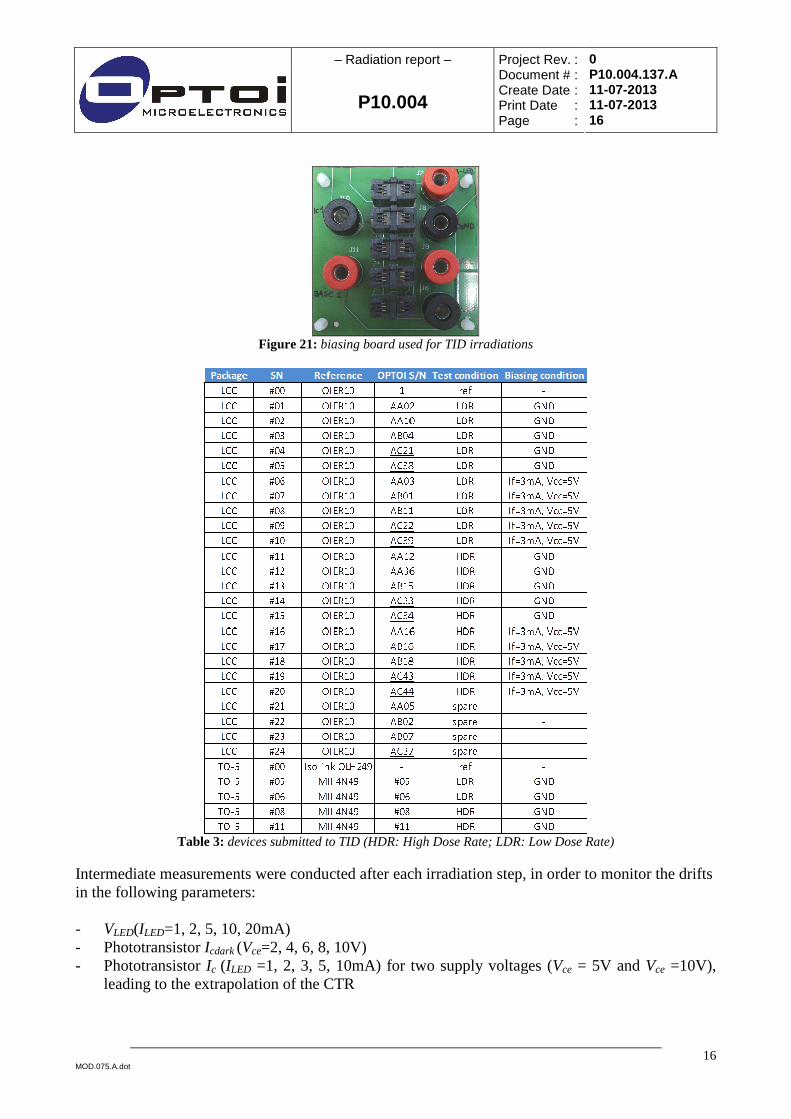
Figure 20: TID plan as originally defined Concerning the device biasing, PCBs similar to those used for proton irradiation tests were used, this time for 5 biased and 5 unbiased devices (Figure 21), with the same specific sockets for the LCC6 type of package and this time with 4mm-banana plugs. A 1MOhm SMD resistor connecting the phototransistor base to the emitter was used, as described for the proton irradiation tests. Biasing conditions during irradiation are the same as for proton irradiation, i.e. If=3mA, Vce=5V. A detailed overview of the tested devices is shown in Table 3 (including the reference devices, either submitted to the same irradiations or just used for the test bench calibration); the underlined devices feature a phototransistor belonging to a different wafer with respect to the majority of the other devices (ESA121 W6 vs. W10). As for the proton irradiation test campaign, this variation has been distributed “here and there”, in order to obtain the best representativeness of such variable.
TID
– Radiation report –
P10.004
Project Rev. : Document # : Create Date : Print Date : Page :
0 P10.004.137.A 11-07-2013 11-07-2013 16
MOD.075.A.dot
16
Figure 21: biasing board used for TID irradiations
Table 3: devices submitted to TID (HDR: High Dose Rate; LDR: Low Dose Rate)
Intermediate measurements were conducted after each irradiation step, in order to monitor the drifts in the following parameters: - VLED(ILED=1, 2, 5, 10, 20mA) - Phototransistor Icdark (Vce=2, 4, 6, 8, 10V) - Phototransistor Ic (ILED =1, 2, 3, 5, 10mA) for two supply voltages (Vce = 5V and Vce =10V),
leading to the extrapolation of the CTR

– Radiation report –
P10.004
Project Rev. : Document # : Create Date : Print Date : Page :
0 P10.004.137.A 11-07-2013 11-07-2013 17
MOD.075.A.dot
17
2.2. High dose rate (run 20229)
The irradiation at high dose rate (360rad/h) reached the overall ionizing dose of 169krad(Si) in early April, after a progressive sequence of intermediate measurements. Subsequently, devices were submitted to annealing (24h, ambient temperature), followed by an ageing step (100degC for 168h). This is the usual procedure adopted by ESA, for this kind of radiation campaigns, following the [AD-1]. Results are shown from Figure 22 to Figure 25, considering all biased and unbiased devices, with measurements performed at nominal operating condition, i.e. If=1mA, Vce=5V. 5 unbiased and 5 biased devices were submitted to each ionizing dose, whereas the two unbiased reference parts were only included for checking the effect of the growing overall ionizing dose on devices not representing the state of the art among the available radiation hardened components.
Figure 22: normalized CTR degradation with TID up to 180krad(Si), at high dose rate (360rad/h)
Figure 23: recovery in the normalized CTR after annealing and ageing, on the devices submitted to high dose rate
(360rad/h)

– Radiation report –
P10.004
Project Rev. : Document # : Create Date : Print Date : Page :
0 P10.004.137.A 11-07-2013 11-07-2013 18
MOD.075.A.dot
18
The variability in the absolute CTR values shown in Figure 24 is mainly due to the usage of phototransistors belonging to different wafers, introducing an intrinsic margin of variation in the CTR even prior to radiation.
Figure 24: absolute CTR degradation with TID up to 180krad(Si), at high dose rate (360rad/h)
Figure 25: recovery in the absolute CTR, after annealing and aging, on the devices submitted to high dose rate
(360rad/h)
The same extrapolations have been performed considering a higher biasing condition for the phototransistor, i.e. Vce=10V instead of 5V. The obtained trends are very similar as shown in Figure 26 and Figure 27.

– Radiation report –
P10.004
Project Rev. : Document # : Create Date : Print Date : Page :
0 P10.004.137.A 11-07-2013 11-07-2013 19
MOD.075.A.dot
19
Figure 26: normalized CTR degradation with TID up to 180krad(Si), at high dose rate (360rad/h)
Figure 27: recovery in the normalized CTR after annealing and aging, for the devices submitted to high dose rate
(360rad/h)
The absolute dark current degradation and the related recovery after annealing and ageing are not shown, because the measured values lie in the range of the instrumentation resolution. The LED forward current is not affected by gamma radiation; the same consideration was drawn above, in the context of proton irradiation.
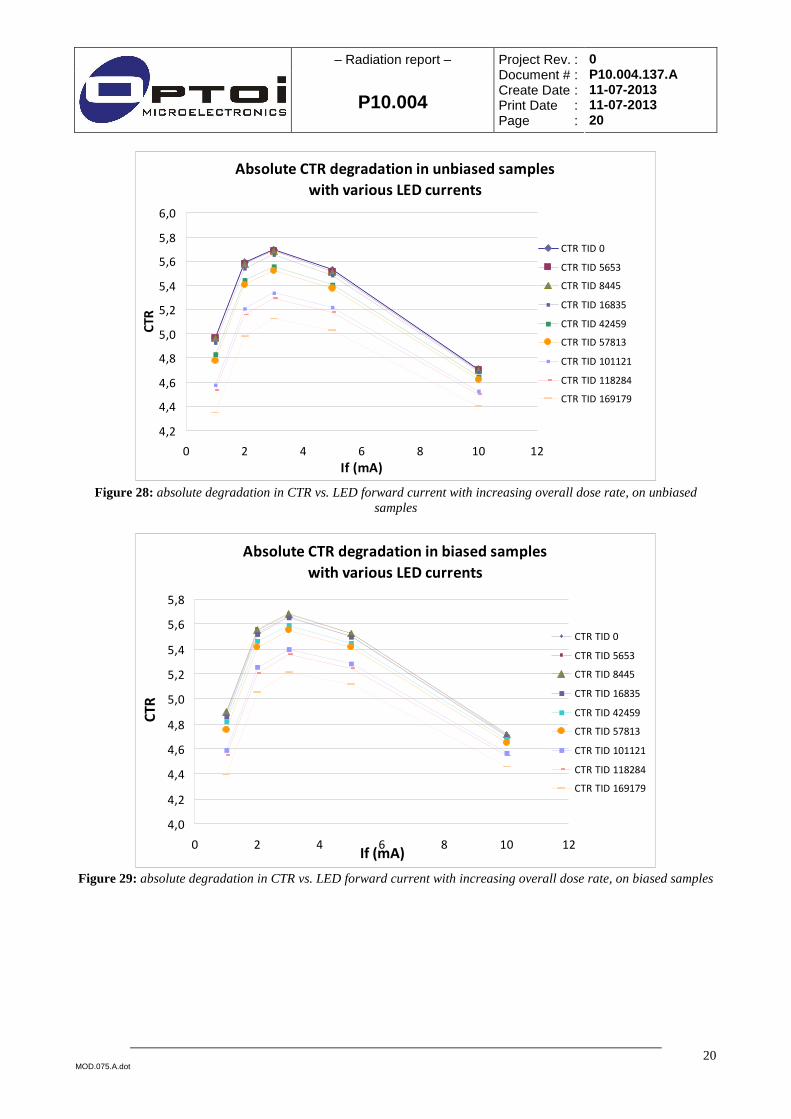
The trend in the absolute CTR degradation with various LED forward currents is shown in Figure 28 and Figure 29.
– Radiation report –
P10.004
Project Rev. : Document # : Create Date : Print Date : Page :
0 P10.004.137.A 11-07-2013 11-07-2013 20
MOD.075.A.dot
20
Absolute CTR degradation in unbiased samples
with various LED currents
4,2
4,4
4,6
4,8
5,0
5,2
5,4
5,6
5,8
6,0
0 2 4 6 8 10 12
If (mA)
CT
R
CTR TID 0
CTR TID 5653
CTR TID 8445
CTR TID 16835
CTR TID 42459
CTR TID 57813
CTR TID 101121
CTR TID 118284
CTR TID 169179
Figure 28: absolute degradation in CTR vs. LED forward current with increasing overall dose rate, on unbiased
samples
Absolute CTR degradation in biased samples
with various LED currents
4,0
4,2
4,4
4,6
4,8
5,0
5,2
5,4
5,6
5,8
0 2 4 6 8 10 12If (mA)
CT
R
CTR TID 0
CTR TID 5653
CTR TID 8445
CTR TID 16835
CTR TID 42459
CTR TID 57813
CTR TID 101121
CTR TID 118284
CTR TID 169179
Figure 29: absolute degradation in CTR vs. LED forward current with increasing overall dose rate, on biased samples

– Radiation report –
P10.004
Project Rev. : Document # : Create Date : Print Date : Page :
0 P10.004.137.A 11-07-2013 11-07-2013 21
MOD.075.A.dot
21
2.3. Low dose rate (run 20228) Irradiations at low dose rate reached the overall ionizing dose of 79.6kad(Si); ESA and Optoi decided to avoid the prosecution of this campaign considering its strong similarity to the case of high dose rate. Results are shown from Figure 30 to Figure 33. Curves with Vce=10V follow a similar trend.
Figure 30: normalized CTR degradation with TID up to 79.6 krad(Si), at low dose rate (36rad/h)
Figure 31: absolute CTR degradation with TID up to 79.6 krad(Si), at low dose rate (36rad/h)

– Radiation report –
P10.004
Project Rev. : Document # : Create Date : Print Date : Page :
0 P10.004.137.A 11-07-2013 11-07-2013 22
MOD.075.A.dot
22
Figure 32: recovery in the normalized CTR after annealing and aging, on the devices submitted to low dose rate
(36rad/h)
Figure 33: recovery in the normalized CTR after annealing and aging, on the devices submitted to low dose rate
(36rad/h)
The absolute dark current degradation is negligible. Similarly to the high dose rate, the LED forward current is not particularly affected by the gamma radiation. The trend in the absolute CTR degradation with various LED forward currents is shown in Figure 34 and Figure 35.

– Radiation report –
P10.004
Project Rev. : Document # : Create Date : Print Date : Page :
0 P10.004.137.A 11-07-2013 11-07-2013 23
MOD.075.A.dot
23
Absolute CTR degradation in unbiased samples
with various LED currents
4,0
4,2
4,4
4,6
4,8
5,0
5,2
5,4
5,6
5,8
6,0
0 2 4 6 8 10 12
I (mA)
CT
R
CTR TID 0
CTR TID 5409
CTR TID 11691
CTR TID 20623
CTR TID 30289
CTR TID 41614
CTR TID 56984
Figure 34: absolute degradation in CTR vs. LED forward current with increasing overall dose rate, on unbiased
samples
Absolute CTR degradation in biased samples
with various LED currents
4,0
4,2
4,4
4,6
4,8
5,0
5,2
5,4
5,6
5,8
6,0
0 2 4 6 8 10 12
I (mA)
CT
R
CTR TID 0
CTR TID 5409
CTR TID 11691
CTR TID 20623
CTR TID 30289
CTR TID 41614
CTR TID 56984
Figure 35: absolute degradation in CTR vs. LED forward current with increasing overall dose rate, on biased samples

– Radiation report –
P10.004
Project Rev. : Document # : Create Date : Print Date : Page :
0 P10.004.137.A 11-07-2013 11-07-2013 24
MOD.075.A.dot
24
Conclusion Optoi’s feeling on radiation results is quite optimistic. In fact, under proton irradiation the detected degradation in the CTR is comparable to other optocoupler brands, if its normalized value is considered. The absolute value of CTR might be considered lower than some other commercially available devices, since the start of the radiation campaign; this is intrinsically due to the optocoupler architecture and coupling between the two components, i.e. LED and phototransistor. In principle, improvements are possible through a more efficient device architecture.
The degradation under gamma rays is less remarkable if compared to the proton irradiation. This is in agreement with Optoi’s expectations, based on previous analyses and estimations. The obtained results are well positioned with respect to the competition.
In the framework of the proton irradiation testing campaign, Optoi took the chance to irradiate other optocouplers hosting a different type of phototransistor, and also standalone phototransistor arrays. These additional irradiations allowed indirect observations and they confirmed the overall quality in the documented achievements.

– Radiation report –
P10.004
Project Rev. : Document # : Create Date : Print Date : Page :
0 P10.004.137.A 11-07-2013 11-07-2013 25
MOD.075.A.dot
25
Attachments

– Progress report –
P10.004
Project Rev. : Document # : Create Date : Print Date :
0 P10.004.137.A 11-07-2013 11-07-2013
MOD.075.A.dot
Annex 1 – details of the proton irradiations

1/3 Reint Ostendorf
Subject: Report on the irradiation for Optoi on April 10, 2013 To: Matteo Bregoli (Optoi) From: Reint Ostendorf (KVI) Date: May 2nd, 2013
Beam energy The nominal energy of the proton beam extracted from the cyclotron was 190 MeV. After passing through the scatterers (a first homogeneous Pb foil of 1.44 mm and a second parabolically shaped W foil of 0.9 mm) and 3.45 m of air the nominal beam energy at the position of the component to be irradiated was approximately 184 MeV. We also performed irradiations with a nominal beam energy of 60 MeV, using a degrader setting of 91.5 mm of aluminium. The quantity of aluminium used to degrade the beam energy was based both on earlier energy measurements with our range telescope and on ion-stopping-and-range tables. Field size and homogeneity The field size at the DUT was defined by a 100 mm diameter collimator that was positioned upstream of the KVI beam degrader. The dose distribution was measured as the light output distribution of a LANEX (Kodak) scintillating screen. From Monte Carlo calculations we know that particles scattered from a 70 mm diameter collimator create a ~3% contribution to the dose, which is nearly homogeneous. It is therefore concluded that the homogeneity of the dose distribution reflects the homogeneity of the flux distribution. We found that using this 100 mm diameter collimator the field at the location of the device under test (DUT) had a better than 10% homogeneity in dose over an area larger than 83 mm in diameter (see figures 1 and 2 in table 3). Flux calibration procedure The intensity of the beam is monitored with our “Beam Intensity Monitor” (BIM) that is an ionisation chamber positioned in the beam at 170 cm downstream of the exit foil. The current from the ionisation chamber is transformed in a pulse train, where the rate of the pulses is proportional to the current from the chamber. As a result, every pulse or “Monitor Unit” (MU) as we have named them represents an amount of beam or similarly an amount of protons per cm2. Previously we have performed irradiations using the same primary beam, scatter foils and degrader. In that irradiation we checked the flux calibration obtained using a small plastic scintillation detector with a measurement using a calibrated dosimeter, a Farmer chamber. Those results matched well with simulations. For this irradiation we therefore obtained the flux calibration only by a measurement using this calibrated dosimeter. The measured dose was transformed into a flux using both earlier measured flux/dose data as well as simulation data. In this way we obtained the fluence (#p cm-2) per MU (Monitor Unit of the Beam Intensity Monitor) at the DUT position for the KVI degrader for the 4 different energies and their associated settings of the degrader. The calibration coefficients are given in Table 1. The statistical accuracy of these values is better than 1%. The systematic errors are estimated to be smaller than 10% on the basis of dose measurements, earlier measurements for different collimator sizes and Aluminium activation analysis.

2/3 Reint Ostendorf
Table 1: Flux calibration factors for the irradiations.
Energy [MeV]
Flux calibration [#p cm-2 MU-1]
184 2336
60 1706
Irradiations A series of 11 irradiations was performed. For each irradiation run we list the run number, a sample ID, the energy at DUT, the fluence, the duration and the average flux in table 2.
Table 2: List of irradiations.
Run #
Sample ID
Energy [MeV]
Fluence [#p cm
-2]
Duration [s]
Flux [#p cm
-2s
-1]
1 optoi1 184 2.00E+10 184.9 1.08E+08
2 optoi2 184 7.00E+10 336.5 2.08E+08
3 optoi3 184 2.00E+11 670.7 2.98E+08
4 optoi4 184 5.00E+11 1383.5 3.61E+08
5 optoi5 184 1.00E+12 1739.6 5.75E+08
6 optoi6 60 7.00E+09 35.4 1.98E+08
7 optoi-X 60 5.00E+10 234.7 2.13E+08
8 optoi7 60 3.00E+10 140.1 2.14E+08
9 optoi8 60 8.00E+10 374.1 2.14E+08
10 optoi9 60 3.00E+11 933.6 3.21E+08
11 optoi10 60 7.00E+11 1839.8 3.80E+08

3/3 Reint Ostendorf
Table 3: The horizontal profiles of the irradiation field are presented for both energies used in the irradiation runs: 184 MeV and 60 MeV. The horizontal axis is in units of CCD-pixels, 100 pixels correspond to 2.381 cm. The vertical axis is proportional to the amount of light produced in the LANEX screen.
Figure 1: 184 MeV
Figure 2: 60 MeV
100 200 300 400 500
500
1000
1500
2000
2500
3000
3500
Horizontal profile
CC
D c
on
ten
ts
100 200 300 400 500
1000
2000
3000
4000
5000
Horizontal profile
CC
D c
on
ten
ts

Details of the high energy DDD campaign
ESAsample Fluence flux duration duration Calibration Beam current QSX1 setting MMU set BIM rate Act.time Mean.flux Act.fluenceESA Energy Degrader #p/cm2 #p/cm2/s s min #protons/cm^2/MU nA MMU MMU Hz QSX1 cor factoroptoi1 184 0 2,00E+10 1,00E+08 2,00E+02 3,33 2336,41 1,09E+01 8,560 4 8,560 4,291E+04 1 184,892 1,08E+08 2,00E+10
optoi2 184 0 7,00E+10 1,00E+08 7,00E+02 11,67 2336,41 1,09E+01 29,961 4 29,961 4,291E+04 1 336,511 2,08E+08 7,00E+10
optoi3 184 0 2,00E+11 3,00E+08 6,67E+02 11,11 2336,41 3,28E+01 85,601 4 85,601 1,285E+05 1 670,709 2,98E+08 2,00E+11
optoi4 184 0 5,00E+11 4,00E+08 1,25E+03 20,83 2336,41 4,37E+01 214,004 4 214,004 1,713E+05 1 1383,518 3,61E+08 5,00E+11
optoi5 184 0 1,00E+12 4,00E+08 2,50E+03 41,67 2336,41 4,37E+01 428,007 4 428,007 1,713E+05 1 1739,577 5,75E+08 1,00E+12
optoi6 60 91,5 7,00E+09 2,00E+08 3,50E+01 0,58 1705,58 2,99E+01 4,104 4 4,104 1,174E+05 1 35,428 1,98E+08 7,00E+09
optoi7 60 91,5 3,00E+10 2,00E+08 1,50E+02 2,50 1705,58 2,99E+01 17,589 4 17,589 1,174E+05 1 140,118 2,14E+08 3,00E+10
optoi8 60 91,5 8,00E+10 2,00E+08 4,00E+02 6,67 1705,58 2,99E+01 46,905 4 46,905 1,174E+05 1 374,09 2,14E+08 8,00E+10
optoi9 60 91,5 3,00E+11 3,00E+08 1,00E+03 16,67 1705,58 4,49E+01 175,893 4 175,893 1,760E+05 1 933,647 3,21E+08 3,00E+11
optoi10 60 91,5 7,00E+11 3,50E+08 2,00E+03 33,33 1705,58 5,23E+01 410,418 4 410,418 2,053E+05 1 1839,776 3,80E+08 7,00E+11
IF QSX1=4 QSX1 setting corrected

1/3 Reint Ostendorf
Subject: Report on the irradiation for Optoi on April 11, 2013 To: Matteo Bregoli (Optoi) From: Reint Ostendorf, KVI Date: May 2nd, 2013
Beam energy The nominal energy of the proton beam extracted from the cyclotron was 40 MeV. A later, more precise estimate of the beam energy, based on magnet settings, was 38.5 MeV. In this irradiation an exact knowledge of the beam energy was very important. Therefore we measured the energy of the beam at the DUT position using our “multi-leaf-faraday-cup”. This device is in essence a stack of 64 aluminium plates all with a thickness of 0.5 mm. The aluminium plates are electrically insulated from each other by 25 µm thick kapton sheets. Ions in the beam that are stopped in this stack deposit their charge in the plate where they are stopped. All currents from the 64 aluminium plates are measured and their profile yields the range of the ions. From the measured range we calculate the energy of the ions using stopping power and range tables. In this way we determined the beam energy, at the DUT position, to be 28.9 ± 0.4 MeV. Other energies were achieved by degrading the beam with our aluminium degrader. Degrading with multiples of 1 mm aluminium lead to the energies listed in table 1. The degrader setting of 3.4 mm aluminium was added because this is the setting that produces 10 MeV protons at DUT. The error bars are of statistical nature only, i.e., they were derived from the accuracy the range could be measured with, which was typically at the level of 0.1 mm of aluminium. The error bars do not reflect the uncertainty (roughly 1%) in the knowledge of the stopping powers and ranges. A GEANT4 simulation was performed to reproduce the energy at DUT. This simulation was based on the reported beam energy of 38.5 MeV and also included the 0.34 mm thick scatter foil, the collimators in the line, the ionisation chamber and the surrounding air. The simulation predicts the average proton energy at DUT to be 28.74 MeV, which is consistent with the measured value of 28.9 ± 0.4 MeV. Table 1: Ranges in aluminium of the protons and their energies vs. the degrader setting.
Degrader Setting [mm]
Range in Al [g/cm2]
Energy [MeV]
0 1.10 ± 0.03 28.9 ± 0.4
1.0 0.83 ± 0.03 24.7 ± 0.5
2.0 0.56 ± 0.03 19.7 ± 0.6
3.0 0.29 ± 0.03 13.6 ± 0.9
3.4 0.18 ± 0.03 10.3 ± 1.1
Field size and homogeneity The device to be tested was set up at 345 cm downstream of the exit foil, where the beam leaves the vacuum in the beam transport lines. The irradiation field was defined by a 100 mm diameter collimator that was positioned upstream of the KVI beam degrader. This collimator was made of brass and having been designed to be able to stop protons at 190 MeV it was 45 mm thick. A scatter foil with a thickness of 0.34 mm of Pb was positioned 45 cm downstream of the exit foil. The dose distribution was measured as the light output distribution of a LANEX (Kodak) scintillating screen. From Monte Carlo calculations we know that particles scattered from a 70 mm diameter collimator create a ~3% contribution to the dose, which is nearly homogeneous. It is therefore concluded that the homogeneity of the dose distribution reflects the homogeneity of the flux distribution. We found that using this 100 mm diameter collimator the field at the location of the device under test (DUT) had a better than 10% homogeneity in dose over an area larger than 65 mm in diameter at 10 MeV and larger than 74 mm at all other energies (see figures 1 – 5 in table 3).

2/3 Reint Ostendorf
Flux calibration procedure The intensity of the beam is monitored with our “Beam Intensity Monitor” (BIM) that is an ionisation chamber positioned in the beam at 170 cm downstream of the exit foil. The current from the ionisation chamber is transformed in a pulse train, where the rate of the pulses is proportional to the current from the chamber. As a result, every pulse or “Monitor Unit” (MU) as we have named them represents an amount of beam or similarly an amount of protons per cm2. We have established that we can measure the flux using a small plastic scintillation detector of 1 cm diameter placed at the position of the DUT. In earlier measurements we found by means of coincidence measurements that protons, as compared to neutrons, are responsible
for ≥ 99.5% of the count rate in this small detector. We also ascertained that the effective
area of the small detector is ≥ 98% of its geometrical area. This scintillation detector was used to obtain the fluence (#p cm-2) per MU (Monitor Unit of the Beam Intensity Monitor) at the DUT position. The flux calibration values are presented in table 1. The statistical accuracy of these values is better than 1%. The systematic errors are estimated to be smaller than 10% on the basis of dose measurements, earlier measurements for different collimator sizes and aluminium activation analysis. As an independent check of the flux calibration we also measured the dose deposited in our calibrated dosimeter, a Farmer chamber. The measured flux over dose ratio reproduced the earlier measurements in the previous irradiations at the same (primary) energy well. Table 2: Calibration factors for the irradiations.
Energy [MeV]
Degrader Setting [mm]
Calibration [#p cm-2 MU-1]
28.9 0.0 509 24.7 1.0 505
19.7 2.0 497 13.6 3.0 485 10.3 3.4 452
Irradiations A series of 5 irradiations was performed. For each irradiation run we list the run number, the sample ID, the energy, the fluence, the duration, and the average flux in table 3.
Table 3: List of irradiations.
Run #
Sample ID
Energy [MeV]
Fluence [#p cm
-2]
Duration [s]
Flux [#p cm
-2s
-1]
1 optoi1 24.7 4.00E+09 90.1 4.44E+07
2 optoi2 24.7 2.00E+10 410.4 4.87E+07
3 optoi3 24.7 7.00E+10 700.1 1.00E+08
4 optoi4 24.7 2.00E+11 407.1 4.91E+08
5 optoi5 24.7 5.00E+11 983.2 5.09E+08
3/3 Reint Ostendorf
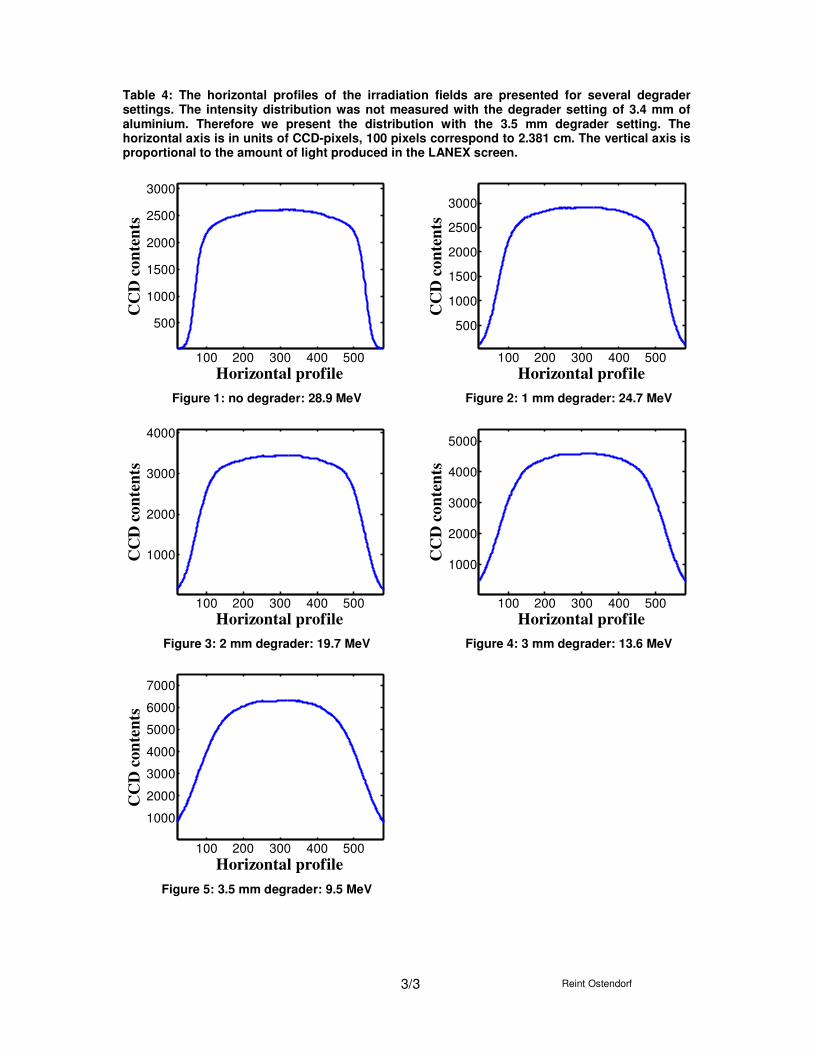
Table 4: The horizontal profiles of the irradiation fields are presented for several degrader settings. The intensity distribution was not measured with the degrader setting of 3.4 mm of aluminium. Therefore we present the distribution with the 3.5 mm degrader setting. The horizontal axis is in units of CCD-pixels, 100 pixels correspond to 2.381 cm. The vertical axis is proportional to the amount of light produced in the LANEX screen.
Figure 1: no degrader: 28.9 MeV
Figure 2: 1 mm degrader: 24.7 MeV
Figure 3: 2 mm degrader: 19.7 MeV
Figure 4: 3 mm degrader: 13.6 MeV
Figure 5: 3.5 mm degrader: 9.5 MeV
100 200 300 400 500
1000
2000
3000
4000
5000
6000
7000
Horizontal profile
CC
D c
on
ten
ts
100 200 300 400 500
500
1000
1500
2000
2500
3000
Horizontal profile
CC
D c
on
ten
ts
100 200 300 400 500
500
1000
1500
2000
2500
3000
Horizontal profile
CC
D c
on
ten
ts
100 200 300 400 500
1000
2000
3000
4000
Horizontal profile
CC
D c
on
ten
ts
100 200 300 400 500
1000
2000
3000
4000
5000
Horizontal profile
CC
D c
on
ten
ts

Details of the low energy DDD campaign
Fluence flux duration duration Calibration Beam current QSX1 setting MMU set BIM rate Act.time Mean.flux Act.fluence MMU leftESA Energy Degrader #p/cm2 #p/cm2/s s min #protons/cm^2/MU nA MMU MMU Hz QSX1 cor factoroptoi1 25 1 4,00E+09 5,00E+07 8,00E+01 1,33 504,65 4,95E+00 7,926 4 7,926 9,918E+04 1 90,073 4,44E+07 4,00E+09 0,0000optoi2 25 1 2,00E+10 1,00E+08 2,00E+02 3,33 504,65 9,91E+00 39,632 4 39,632 1,983E+05 1 410,387 4,87E+07 2,00E+10 0,0000optoi3 25 1 7,00E+10 1,00E+08 7,00E+02 11,67 504,65 9,91E+00 138,711 4 138,711 1,983E+05 1 700,129 1,00E+08 7,00E+10 0,0000optoi4 25 1 2,00E+11 5,00E+08 4,00E+02 6,67 504,65 4,95E+01 396,317 3 39,632 9,918E+04 0,1 407,129 4,91E+08 2,00E+11 0,0000optoi5 25 1 5,00E+11 5,00E+08 1,00E+03 16,67 504,65 4,95E+01 990,792 3 99,079 9,918E+04 0,1 983,184 5,09E+08 5,00E+11 0,0000
IF QSX1=4 QSX1 setting corrected

– Progress report –
P10.004
Project Rev. : Document # : Create Date : Print Date :
0 P10.004.137.A 11-07-2013 11-07-2013
MOD.075.A.dot
Annex 2 – details of the TID campaign

ESTEC 60Co Facility
Keplerlaan, 1 2200AG Noordwijk Zh (NL)
DISCLAIMER This test summary provided as a courtesy to the receiver, shall neither imply, nor be construed as
constituting, any kind of legal contractual relationship between the European Space Agency and the receiver. The receiver may reproduce the summary report only in its entirety. Reproduction of parts of the test summary is subject to the receiver obtaining prior approval by the laboratory. The European Space Agency does not assume any liability, including but not limited to liability for any damage derived from the use of the test results and the test summary.
Radiation Test Summary nr. TEC-QEC/RP 20229 Version 1.0 Page 1 of 2
RADIATION TEST SUMMARY
Number : TEC-QEC/RP 20229 Version 1.0 Date : 18 Apr 2013
Test Requester : Name OptoI Address Via Vienna n°8, 38121 Gardolo (TN) - Italia
Personnel present : M.Bregoli
Project/Cost Code : ECI2 Devices/Components irradiated : Optocouplers
Device/Component details : OIER10 (OptoI), 4N49 (Micropac) (conditions and identification) .
Dosimetry Chain used : - A - Dosimeter : Farmer model 2680 – s/n 390
Gas Ionisation Chamber : NE Type 2571 – s/n 2915
Measured Dosimetry : Total Ionising Dose in [Gy] (water)
Dosimetry Procedure :
ESCC 22900 section 4.1.1 TEC-QEC/PR001 (Total Ionising Dose accredited by RvA according to ISO/IEC 17025.2005 Certificate No. L517)
(With the exception of the above specified dosimetry equipment, ESTEC 60
Co Facility does not assume any liability for the calibration status of any other equipment lent to the requester )

ESTEC 60Co Facility
Keplerlaan, 1 2200AG Noordwijk Zh (NL)
DISCLAIMER This test summary provided as a courtesy to the receiver, shall neither imply, nor be construed as
constituting, any kind of legal contractual relationship between the European Space Agency and the receiver. The receiver may reproduce the summary report only in its entirety. Reproduction of parts of the test summary is subject to the receiver obtaining prior approval by the laboratory. The European Space Agency does not assume any liability, including but not limited to liability for any damage derived from the use of the test results and the test summary.
Radiation Test Summary nr. TEC-QEC/RP 20229 Version 1.0 Page 2 of 2
Irradiation Test Campaign Details
Source Activity : 69.32 TBq on date : 13 March 2013
units Min. Max. Time-
weighted Average
Dosimeter position relative to 60
Co source
Temperature °C 20.4 20.8 20.53 X cm 16
Pressure mbar 988.3 1023.9 1010.18 Y cm 211
Relative Humidity % 23.9 39.8 31.84 Z cm 0
Run Start
Date & Time (CET) End
Date & Time (CET) Total Ionising Dose
[Gy] (water) Dose Rate
[mGy/h] (water)
1 13/03/2013 17:35 14/03/2013 08:54 62.95 Gy 4.109 Gy/h
2 14/03/2013 09:20 14/03/2013 16:55 31.09 Gy 4.106 Gy/h
3 14/03/2013 17:11 15/03/2013 15:56 93.43 Gy 4.105 Gy/h
4 15/03/2013 16:20 18/03/2013 13:58 285.4 Gy 4.098 Gy/h
5 18/03/2013 14:23 19/03/2013 16:24 105.3 Gy 4.046 Gy/h
6 19/03/2013 18:27 21/03/2013 15:33 182.5 Gy 4.047 Gy/h
7 21/03/2013 15:40 25/03/2013 10:16 365.4 Gy 4.033 Gy/h
8 25/03/2013 11:33 26/03/2013 16:18 116.0 Gy 4.033 Gy/h
9 26/03/2013 16:48 27/03/2013 11:26 75.12 Gy 4.034 Gy/h
10 27/03/2013 11:58 02/04/2013 09:08 566.8 Gy 4.044 Gy/h
Total 1.884 kGy
Note: The uncertainty budgets (according to TEC-QEC/PR001 section 12) are: 4.2 % (k=2) for absorbed dose to water and 4.4% (k=2) for absorbed dose rate to water
Notes:
Alessandra Costantino (TEC-QEC Radiation Test Engineer)
Christian Poivey (TEC-QEC Acting Section Head)
PLEASE REMEMBER TO COMPLETE THE CUSTOMER SATISFACTION SURVEY AT :
http://task.esa.int/sites/WG/CO60Q/Lists/Customer%20Satisfaction/overview.aspx
AND SEND A COPY OF THE FINAL REPORT

ESTEC 60Co Facility
Keplerlaan, 1 2200AG Noordwijk Zh (NL)
DISCLAIMER This test summary provided as a courtesy to the receiver, shall neither imply, nor be construed as constituting, any kind of legal contractual relationship between the European Space Agency and the receiver. The receiver may reproduce the summary report only in its entirety. Reproduction of parts of the test summary is subject to the receiver obtaining prior approval by the laboratory. The European Space Agency does not assume any liability, including but not limited to liability for any damage derived from the use of the test results and the test summary.
Radiation Test Summary nr. TEC-QEC/RP 20228 Version 1.0 Page 1 of 3
RADIATION TEST SUMMARY
Number : TEC-QEC/RP 20228 Version 1.0 Date : 18 June 2013
Test Requester : Name OptoI Address Via Vienna n°8, 38121 Gardolo (TN) - Italia
Personnel present : M.Bregoli
Project/Cost Code : ECI2 Devices/Components irradiated : Optocouplers
Device/Component details (conditions and identification) :
OIER10 (OptoI), 4N49 (Micropac) See radiation test plan : P10.004.60
Dosimetry Chain used : - C -
Dosimeter : Farmer model 2680 – s/n 491 Gas Ionisation Chamber : NE Type 2571 – s/n 3573
Measured Dosimetry : Total Ionising Dose in [Gy] (water)
Dosimetry Procedure : ESCC 22900 section 4.1.1 TEC-QEC/PR001 (Total Ionising Dose accredited by RvA according to ISO/IEC 17025.2005 Certificate No. L517)
(With the exception of the above specified dosimetry equipment, ESTEC 60Co Facility does not assume any liability for the calibration status of any other equipment lent to the requester )
Irradiation Test Campaign Details
Source Activity : 69.32 TBq on date : 13 March 2013
units Min. Max. Time-
weighted Average
Dosimeter position relative to 60Co source
Temperature °C 20.40 21.90 21.14 X cm 67 Pressure mbar 988.3 1033 1012 Y cm 679
Relative Humidity % 23.90 50.10 37.87 Z cm 32
Run Start Date & Time (CET)
End Date & Time (CET)
Total Ionising Dose [Gy] (water)
Dose Rate [mGy/h] (water)
1 13-03-13 17:35 14-03-13 8:54 6.534 Gy 426.500 mGy/h 1 13-03-13 17:35 14-03-13 8:54 6.534 Gy 426.500 mGy/h 2 14-03-13 8:57 14-03-13 9:17 141.1 mGy 425.800 mGy/h 3 14-03-13 9:20 14-03-13 16:55 3.226 Gy 426.000 mGy/h 4 14-03-13 17:11 15-03-13 15:56 9.694 Gy 425.900 mGy/h 5 15-03-13 16:20 18-03-13 13:58 29.62 Gy 425.400 mGy/h

ESTEC 60Co Facility
Keplerlaan, 1 2200AG Noordwijk Zh (NL)
DISCLAIMER This test summary provided as a courtesy to the receiver, shall neither imply, nor be construed as constituting, any kind of legal contractual relationship between the European Space Agency and the receiver. The receiver may reproduce the summary report only in its entirety. Reproduction of parts of the test summary is subject to the receiver obtaining prior approval by the laboratory. The European Space Agency does not assume any liability, including but not limited to liability for any damage derived from the use of the test results and the test summary.
Radiation Test Summary nr. TEC-QEC/RP 20228 Version 1.0 Page 2 of 3
6 18-03-13 14:23 19-03-13 16:24 11.01 Gy 423.200 mGy/h 7 19-03-13 18:27 21-03-13 15:33 19.07 Gy 422.800 mGy/h 8 21-03-13 15:40 25-03-13 10:16 38.24 Gy 422.100 mGy/h 9 25-03-13 11:33 26-03-13 16:18 12.12 Gy 421.500 mGy/h
10 26-03-13 16:48 27-03-13 11:26 7.846 Gy 421.300 mGy/h 11 27-03-13 11:58 02-04-13 9:08 59.09 Gy 421.600 mGy/h 12 02-04-13 9:15 05-04-13 14:30 32.52 Gy 421.000 mGy/h 13 05-04-13 14:51 05-04-13 15:38 329.3 mGy 417.500 mGy/h 14 05-04-13 15:41 08-04-13 16:21 30.18 Gy 415.400 mGy/h 15 08-04-13 16:52 09-04-13 15:36 9.448 Gy 415.600 mGy/h 16 09-04-13 15:45 09-04-13 15:48 26.14 mGy 409.100 mGy/h 17 09-04-13 15:52 09-04-13 15:54 13.59 mGy 404.200 mGy/h 18 09-04-13 15:57 09-04-13 16:00 20.98 mGy 410.400 mGy/h 19 09-04-13 16:06 15-04-13 9:02 57.12 Gy 417.100 mGy/h 20 15-04-13 9:28 16-04-13 11:29 10.85 Gy 417.200 mGy/h 21 16-04-13 14:33 17-04-13 9:30 7.972 Gy 420.900 mGy/h 22 17-04-13 9:43 17-04-13 12:06 1.003 Gy 420.100 mGy/h 23 17-04-13 12:20 17-04-13 13:38 550.3 mGy 419.700 mGy/h 24 17-04-13 13:46 17-04-13 18:35 2.024 Gy 420.100 mGy/h 25 17-04-13 18:39 17-04-13 19:49 484.3 mGy 419.500 mGy/h 26 17-04-13 19:53 18-04-13 12:52 7.135 Gy 419.900 mGy/h 27 18-04-13 14:19 19-04-13 14:20 10.08 Gy 420.000 mGy/h 28 19-04-13 15:57 22-04-13 15:57 30.20 Gy 419.400 mGy/h 29 22-04-13 17:07 25-04-13 17:26 30.33 Gy 419.300 mGy/h 30 25-04-13 18:35 29-04-13 9:49 36.53 Gy 418.800 mGy/h 31 29-04-13 11:11 29-04-13 13:25 940.4 mGy 419.600 mGy/h 32 29-04-13 13:35 29-04-13 18:03 1.879 Gy 420.200 mGy/h 33 29-04-13 18:06 01-05-13 9:57 16.74 Gy 420.100 mGy/h 34 01-05-13 10:02 01-05-13 14:31 1.884 Gy 420.200 mGy/h 35 01-05-13 14:34 01-05-13 17:07 1.070 Gy 420.000 mGy/h 36 01-05-13 17:12 02-05-13 9:30 6.853 Gy 420.200 mGy/h 37 02-05-13 9:38 02-05-13 17:06 3.131 Gy 419.500 mGy/h 38 02-05-13 17:09 03-05-13 9:19 6.799 Gy 420.600 mGy/h 39 03-05-13 9:22 03-05-13 12:05 1.140 Gy 420.000 mGy/h 40 03-05-13 12:20 03-05-13 18:30 2.592 Gy 420.700 mGy/h 41 03-05-13 18:32 06-05-13 9:06 26.30 Gy 420.300 mGy/h 42 06-05-13 9:16 06-05-13 16:01 2.835 Gy 420.100 mGy/h 43 06-05-13 17:41 07-05-13 9:17 6.554 Gy 420.000 mGy/h

ESTEC 60Co Facility
Keplerlaan, 1 2200AG Noordwijk Zh (NL)
DISCLAIMER This test summary provided as a courtesy to the receiver, shall neither imply, nor be construed as constituting, any kind of legal contractual relationship between the European Space Agency and the receiver. The receiver may reproduce the summary report only in its entirety. Reproduction of parts of the test summary is subject to the receiver obtaining prior approval by the laboratory. The European Space Agency does not assume any liability, including but not limited to liability for any damage derived from the use of the test results and the test summary.
Radiation Test Summary nr. TEC-QEC/RP 20228 Version 1.0 Page 3 of 3
44 07-05-13 9:20 07-05-13 10:45 595.8 mGy 419.000 mGy/h 45 07-05-13 10:50 07-05-13 17:25 2.760 Gy 419.600 mGy/h 46 07-05-13 17:33 08-05-13 9:15 6.591 Gy 419.600 mGy/h 47 08-05-13 9:19 08-05-13 10:24 453.1 mGy 418.900 mGy/h 48 08-05-13 10:28 08-05-13 17:37 3.000 Gy 419.300 mGy/h 49 08-05-13 17:40 10-05-13 9:37 16.75 Gy 419.000 mGy/h 50 10-05-13 9:44 10-05-13 16:03 2.650 Gy 419.200 mGy/h 51 10-05-13 16:12 13-05-13 9:40 27.36 Gy 417.900 mGy/h 52 13-05-13 11:15 15-05-13 10:27 19.76 Gy 418.600 mGy/h 53 15-05-13 10:40 16-05-13 16:37 12.53 Gy 418.200 mGy/h 54 16-05-13 19:52 17-05-13 14:38 7.845 Gy 418.300 mGy/h 55 17-05-13 14:51 21-05-13 9:42 37.90 Gy 417.200 mGy/h 56 21-05-13 10:40 21-05-13 13:33 1.146 Gy 397.000 mGy/h 57 21-05-13 13:49 24-05-13 10:33 27.19 Gy 395.700 mGy/h 58 24-05-13 11:43 27-05-13 9:31 29.04 Gy 416.100 mGy/h 59 27-05-13 10:10 28-05-13 11:42 10.60 Gy 415.200 mGy/h 60 28-05-13 12:01 28-05-13 14:42 1.109 Gy 414.800 mGy/h 61 28-05-13 14:47 29-05-13 16:28 10.66 Gy 415.200 mGy/h 62 29-05-13 16:51 30-05-13 16:25 9.777 Gy 414.800 mGy/h 63 30-05-13 16:33 03-06-13 14:44 39.07 Gy 414.800 mGy/h 64 03-06-13 15:26 04-06-13 13:12 7.098 Gy 326.200 mGy/h 65 04-06-13 13:35 05-06-13 9:23 8.199 Gy 414.000 mGy/h 66 05-06-13 9:31 11-06-13 13:13 62.38 Gy 422.400 mGy/h
Total 886.6 Gy Note: The uncertainty budgets (according to TEC-QEC/PR001 section 12) are: 4.2 % (k=2) for absorbed dose to water and
4.4% (k=2) for absorbed dose rate to water Notes:
Alessandra Costantino (TEC-QEC Radiation Test Engineer)
Ali Zadeh (TEC-QEC Section Head)
PLEASE REMEMBER TO COMPLETE THE CUSTOMER SATISFACTION SURVEY AT : http://task.esa.int/sites/WG/CO60Q/Lists/Customer%20Satisfaction/overview.aspx AND SEND A COPY OF THE FINAL REPORT