ERSI Landfill HC 03-22-2010
86
Health Consultation ERSI LANDFILL TAYLOR, LACKAWANNA COUNTY, PENNSYLVANIA EPA FACILITY ID: PAD069601763 COST RECOVERY NO: A903 MARCH 22, 2010 U.S. DEPARTMENT OF HEALTH AND HUMAN SERVICES Agency for Toxic Substances and Disease Registry Division of Health Assessment and Consultation Atlanta, Georgia 30333
Transcript of ERSI Landfill HC 03-22-2010
Health Consultation ERSI LANDFILL
TAYLOR LACKAWANNA COUNTY PENNSYLVANIA
EPA FACILITY ID PAD069601763
COST RECOVERY NO A903
MARCH 22 2010
US DEPARTMENT OF HEALTH AND HUMAN SERVICES Agency for Toxic Substances and Disease Registry
Division of Health Assessment and Consultation Atlanta Georgia 30333
Health Consultation A Note of Explanation
A health consultation is a verbal or written response from ATSDR or ATSDRrsquos Cooperative Agreement Partners to a specific request for information about health risks related to a specific site a chemical release or the presence of hazardous material In order to prevent or mitigate exposures a consultation may lead to specific actions such as restricting use of or replacing water supplies intensifying environmental sampling restricting site access or removing the contaminated material
In addition consultations may recommend additional public health actions such as conducting health surveillance activities to evaluate exposure or trends in adverse health outcomes conducting biological indicators of exposure studies to assess exposure and providing health education for health care providers and community members This concludes the health consultation process for this site unless additional information is obtained by ATSDR or ATSDRrsquos Cooperative Agreement Partner which in the Agencyrsquos opinion indicates a need to revise or append the conclusions previously issued
You May Contact ATSDR Toll Free at 1-800-CDC-INFO
or Visit our Home Page at httpwwwatsdrcdcgov
HEALTH CONSULTATION
ERSI LANDFILL
TAYLOR LACKAWANNA COUNTY PENNSYLVANIA
EPA FACILITY ID PAD069601763
COST RECOVERY NO A903
Prepared By
US Department of Health and Human Services Agency for Toxic Substances and Disease Registry
Division of Health Assessment and Consultation
Table of Contents
Summary and Statement of Issues 1
Background 2
Site Description and History 2
DemographicsLand amp Natural Resource Use 3
Community Concerns and Odor Complaints 3 Other Community Concerns 4 Odor Complaints 4
Environmental Sampling and Chemical Analyses 5 2003 Ambient Air Investigations 5 2004 Post Ambient Air Monitoring of Hydrogen Sulfide 7 Taylor Ambient Air Monitoring Station 7
Exposure Pathways 8
Public Health Analysis9
Chemicals Selected for Further Public Health Analysis 9
Public Health Implications 11 Peak Exposures to Hydrogen Sulfide 12 Post Exposures to Hydrogen Sulfide 13 Peak Exposures to Sulfur Dioxide 13
Community Health Concerns and Related Public Health Implications 14 Multiple Sclerosis 14 Cancer Rates 15 Odors 15
Child Health Considerations16
Limitations and Uncertainties 16
Landfill Emergency ResponseContingency Plan 18
Conclusions 19
Recommendations 20
Authors21
References 23
APPENDIX A mdash Comparison Values 29
APPENDIX B mdash Tables 41
i
APPENDIX C mdash Figures 63
APPENDIX D mdash Chronological Summary of ERSIrsquos Malodorous Period 73
APPENDIX E mdash ATSDR Guidelines for Evaluating Gases Migrating from Landfills 79
ii
Summary and Statement of Issues
In December 2003 a citizen petitioned the Agency for Toxic Substances and Disease Registry (ATSDR) for assistance in evaluating the public impact of releases of airborne pollutants most notably hydrogen sulfide emanating from the Environmental and Recycling Services Inc (ERSI) Landfill in Taylor PA In response to the petition ATSDR investigated exposures to substances accidentally released from the landfill in 2003 and assessed the potential public health implications associated with those releases ATSDR conducted its investigation by reviewing ambient air monitoring data measured in 2003 and 2004
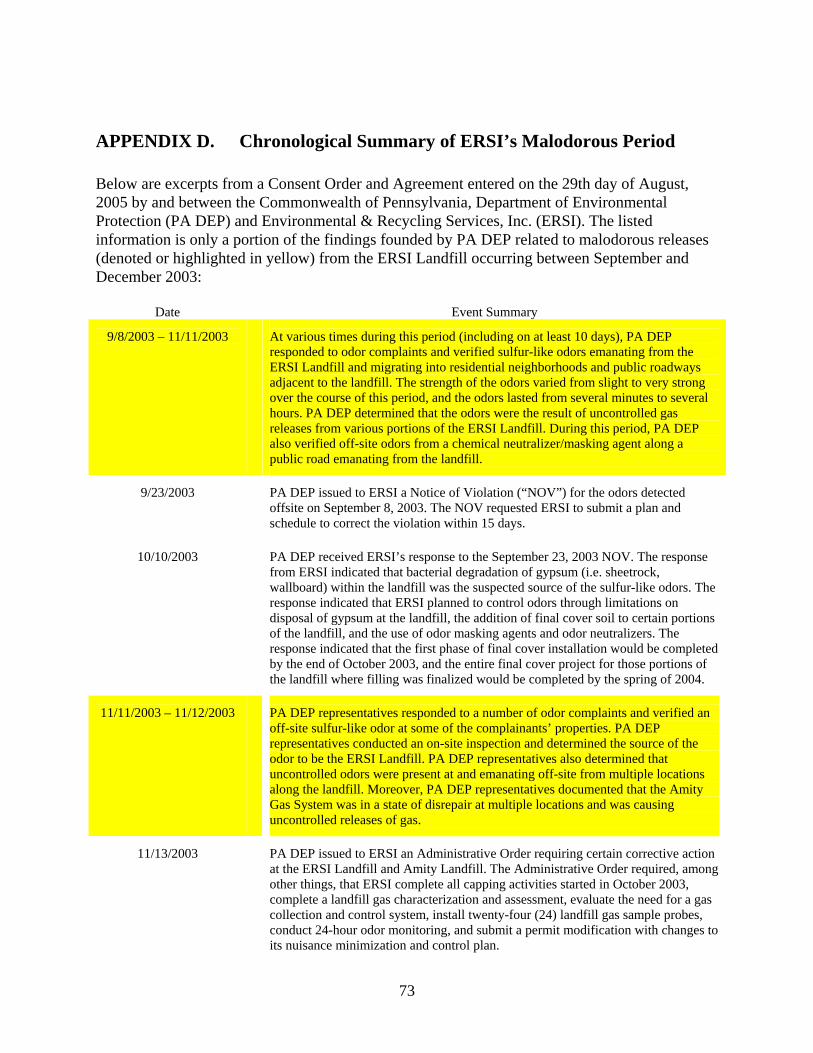
Between September 2003 and December 2003 the Commonwealth of Pennsylvania Department of Environmental Protection (PA DEP) responded to odor complaints and confirmed the ERSI Landfill as the source of sulfur-like odors These odors migrated into residential neighborhoods and along public roadways adjacent to the landfill Their strength varied from slight to very strong and lasted from several minutes to several hours PA DEP determined that the odors were the result of uncontrolled gas releases from various portions of the ERSI Landfill and the nearby Amity Landfill During that SeptemberndashDecember period PA DEP also confirmed off-site odors along a public roadway that emanated from a chemical neutralizermasking agent used to diminish the smell of the landfill odors
To conduct ambient air monitoring and individual location air sampling during the weeks of November 17 2003 and December 1 2003 PA DEP used two mobile analytical laboratories ldquoMAU 1rdquo and ldquoMAU 2rdquo After a review of the PA DEP air data and other pertinent information ATSDR concluded that residents living near the landfill may have experienced transient health effects (eg headaches nausea choking cough tearing of eyes aggravation of asthma) detectable peak levels of hydrogen sulfide measured in the air have been associated with such effects ATSDR also concluded that these peak air exposures to hydrogen sulfide and sulfur dioxide during SeptemberndashDecember 2003 posed a Past Public Health Hazard but further concluded that any public health effect was reversible (ie the peak exposures did not cause significant harm then nor would they cause harm in the future to onersquos health) Also in its review of the air monitoring data ATSDR concluded that the detectable levels of other landfill gases in the air posed No Apparent Public Health Hazard to area residents
Primarily during 2004 PA DEP conducted post-ambient air monitoring to assess whether the ERSI remediation of the malodorous air releases significantly reduced hydrogen sulfide levels in the ambient air ATSDR reviewed the 2004 post-ambient air monitoring data and concluded that post-air exposures to hydrogen sulfide emanating from the ERSI Landfill during 2004 posed No Apparent Public Health Hazard
ATSDR remains concerned however about landfill gases accidentally migrating offsite since the emergency responsecontingency plan on record may not have been activated for a severe malodorous incident that occurred on December 10 2003 (Appendix D) After the malodorous air releases landfill operators installed a gas collection system to control and prevent migration of landfill gases into nearby residential communities PA DEP also revised the original landfill permit to include a Nuisance Minimization and Control Plan The revised plan does require the landfill operators to control odors to prevent offsite migration of landfill gases and to manage and maintain the gas collection system But the plan does not cover the possibility of a
1
substantial failure to the gas collection system For example the plan does not list the emergency response contingency and community health actions necessary to mitigate or prevent likely exposures (eg residentialretail areas) to elevated levels of landfill gases
Background
Site Description and History
The ERSI Landfill is in Taylor Pennsylvania close to the town of Old Forge In or about October 1995 PA DEP issued to ERSI a Waste Disposal Operating Permit for a construction and demolition (CD) waste landfill where the landfill began operations in OctoberNovember 1996 (Tomayko 1995)
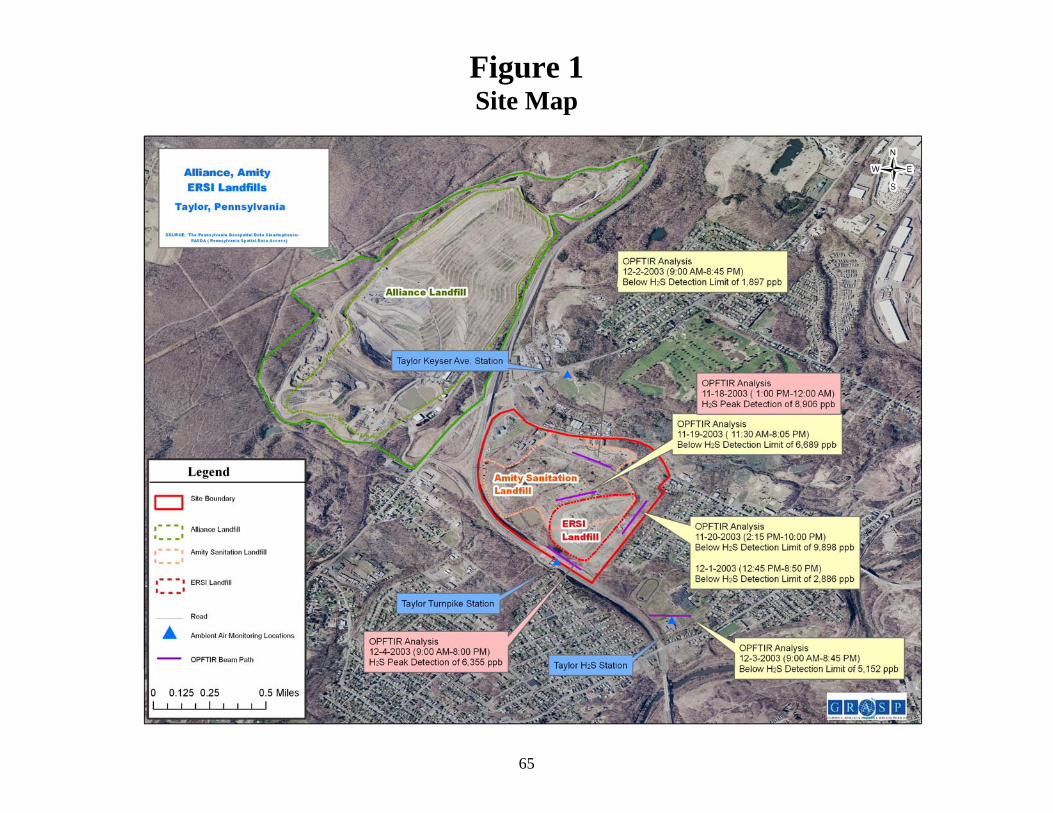
The landfill is within the permitted boundary of the former Amity Sanitary Landfill (Amity Landfill) (see Figure 1 in Appendix C) In fact ERSI used a small portion of the Amity Landfill for minor dumping The shared property of these landfills is directly across the street from Alliance Landfill an active sanitary waste landfill owned and operated by Waste Management Inc (Figure 1) After approximately 10 years of operation ERSI operators applied to PA DEP for a landfill expansion permit proposing to add some 60 acres of new disposal area within the AmityERSI Landfill property On February 1 2006 PA DEP denied the expansion proposal citing the lack of adequate safeguards against subsidence and groundwater pollution (PA DEP 2009a)
PA DEP did however renew ERSIrsquos existing Waste Disposal Operating Permit and set landfill closure for March 2007 ERSI began formal closure procedures as prescribed by the statersquos Solid Waste Management Act The procedure requires final cover of the landfill area establishes final slopes and elevations according to regulation and ensures post-closure monitoring for a specified period of years to be determined by PA DEP
In 2008 PA DEP confirmed that the ERSI landfill was closed and final cover was applied (Tomayko 2008) Currently ERSI operators have only one landfill gas control in place for the destruction of collected landfill gases a flare In the past some of the collected landfill gases were diverted to electricity producing diesel turbines however these turbines have since been decommissioned and this activity no longer takes place The landfill expansion application however remains pending The Environmental Hearing Board reversed PA DEPrsquos denial of the original expansion request and remanded the application to PA DEP for further review The review of the remanded application began in January 2008 As of the date of this health consultation the applicationrsquos public comment period has commenced and it is believed that PA DEP is continuing with its review of the remanded expansion application
Between the years of 1973 and 1990 Amity Landfill operated principally as a municipal waste landfill but received other mostly constructiondemolition waste as well In August 1987 PA DEP approved a closure plan submitted by the Amity operators The plan obligated the operators to install and maintain a gas collection system for controlling landfill gas and to implement a gas monitoring plan for the release of any landfill gases The collection conveyance and destruction system for Amity Landfill (Amity Gas System) was designed and installed and operators began to collect methane gas from Amity and process it for sale Methane gas was sold until 2006 when
2
it was diverted to a flare and burned off This operation was ongoing as of the date of this health consultation
Current regulations require that landfill dumping areas must be at least 500 feet from the nearest residential property Landfill operators stated that their dumping areas for the ERSI Landfill are approximately 700 to 800 feet from the nearest residential property and the dumping areas for the Amity Landfill are at least 1000 feet from the nearest residential property
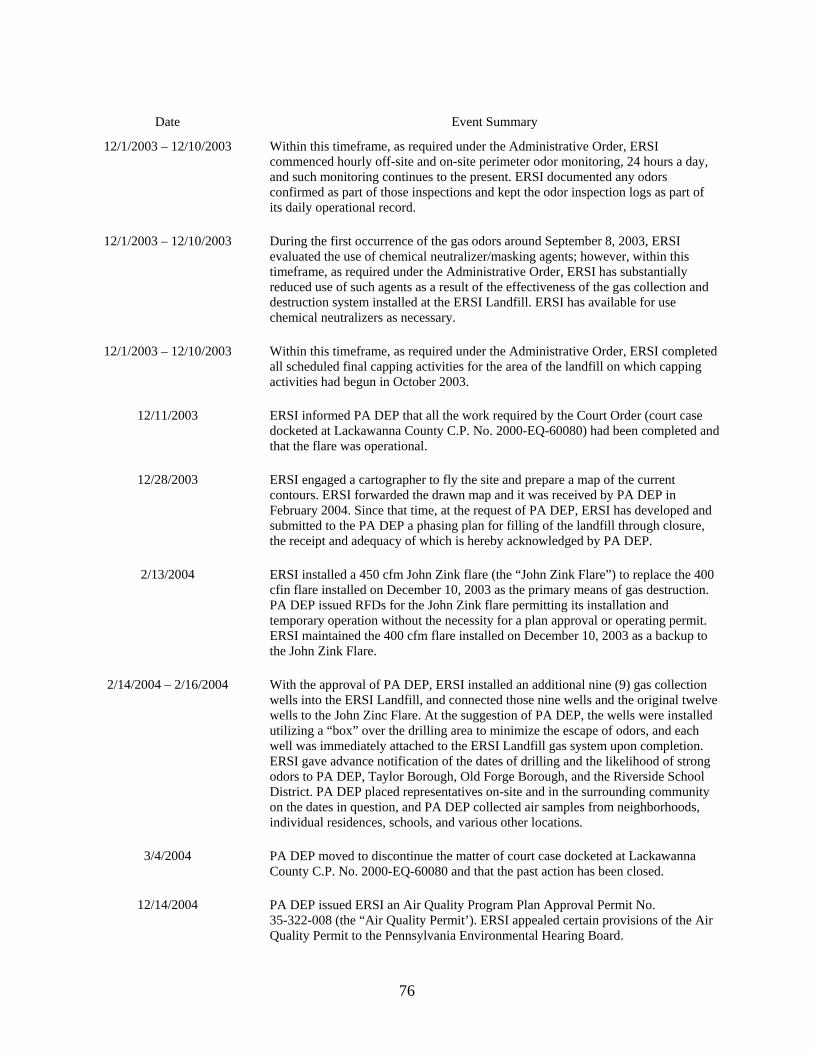
On July 22 2004 an ATSDR Regional Representative met with the operators of the ERSI Landfill to discuss the SeptemberndashDecember 2003 landfill releases The operators readily admitted to the hydrogen sulfide releases but said that their full cooperation with PA DEP had the effect of mitigating those releases In that regard the operators noted that they had installed 24 gas collection wells throughout the landfill to collect gas and route it to an open flare where the collected gas was burned Moreover the operators stated that sometime in the then-near future the open flare would be replaced with an enclosed flare and an enclosed flare was in fact installed on February 16 2005 (Appendix D) With the installation of the gas collection system hydrogen sulfide releases have greatly diminished Operators said some evidence suggested that gypsum wallboard might have been the primary source of the problematic releases
A chronological summary in Appendix D lists all actions performed by both PA DEP and ERSI Landfill operators during and after the SeptemberndashDecember 2003 hydrogen sulfide releases
DemographicsLand amp Natural Resource Use
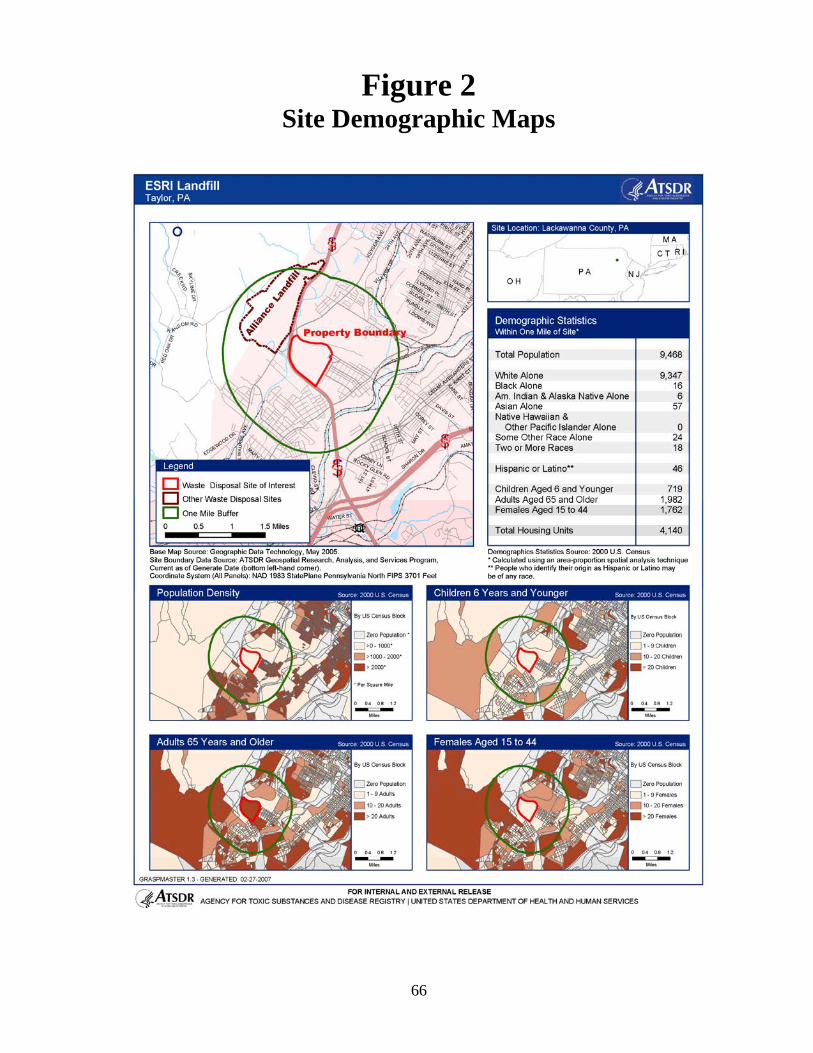
US Census data for 2000 show a total of 9468 people living within 1 mile of the site (see Figure 2) Whites comprised almost the entire population with a census count of 9347 or 987 As a group American IndiansAlaska Natives Asians and African Americans comprised 08 of the population with a census count of 79 and 05 of the population was of Hispanic origin Children 6 years and younger comprised 76 of the local population with a census count of 719 and adults older than 64 years of age comprised 209 with a census count of 1982 Females considered to be of childbearing agemdash15 to 44 yearsmdashcomprised 186 of the population with a census count of 1762 Most of the population occupied residential units adjacent to the property line of the ERSI Landfill toward the northeast east southeast south and southwest Alliance Landfill is toward the north northwest and west adjacent to the ERSI Landfill property line
The three landfills Amity ERSI and Alliance are in a mixed industrial and residential area of the Boroughs of Taylor and Old Forge PA The landfills are the dominant industrial facilities within the area other industrial activity is considered light industry and includes such businesses as auto repair auto salvage dry cleaners metal works and printing shops The area is served by public sewer and water natural gas and electricity
Community Concerns and Odor Complaints
In a December 2003 email a concerned citizen (petitioner) requested ATSDRrsquos assistance regarding malodorous releases from the ERSI Landfill In July 2004 a representative from ATSDRrsquos Region 3 Office spoke with the petitioner by telephone to discuss community health concerns The petitioner suggested referencing conversations with the PA DEP that the ERSI Landfill was a likely source of the odors about which the petitioner had several health concerns
3
High cancer rate on streets next to the dumpmdash7 persons in 29 years
Multiple sclerosis (MS) diagnoses without the presence of any real clinical evidence of the disease (ie no indication of brain lesions as detected by conducting magnetic resonance imaging MRI)
Burning eyes lips and skin
High prevalence of upper respiratory infection rates
Headachesmdashsome so severe they are considered migraines
The petitioner believed the SeptemberndashDecember 2003 releases were a continuation of years of landfill exposures that residents had endured The petitioner stated the earlier landfill (Amity Landfill) on the same property accepted all types of hazardous waste even though it was supposedly a household waste landfill permitted to accept only sanitation waste
Other Community Concerns
In March 2002 another citizen had petitioned ATSDR to conduct a public health assessment for the Alliance Landfill As stated the Alliance Landfill is directly across the street from the ERSI Landfill This petitioner also expressed concerns about ldquoair and particulate emissionsrdquo and cancer incidence rates in the community ATSDR released a health consultation in August 2003 for public comment (ie a comment period of approximately 30 days after document release) (ATSDR 2003) A final release version of the health consultation was completed in August 2004 (ATSDR 2004) Because the 2004 document recommended additional ambient air monitoring PA DEP installed an ambient air monitoring station off Keyser Ave in Taylor PA (see Figure 1) After data collection was complete PA DOH assessed the public health implications and on February 28 2008 ATSDR (per state cooperative agreement) released the findings of that public health evaluation (ATSDR 2008) As recommended in the public health evaluation additional monitoring near the Alliance Landfill has been completed (Bellas 2008) ATSDR (per a state cooperative agreement) hopes to release the findings from these efforts in the near future documented within another health consultation
Odor Complaints
As stated between the months of September and December 2003 area residents complained to the PA DEP that they had smelled foul odors and PA DEP confirmed that the odors emanated from the ERSI Landfill Appendix D lists a chronological summary of these malodorous releases that occurred between September 2003 and December 2003 Appendix D also lists the summarized descriptions of six malodorous releases highlighted in yellow as reported to the PA DEP
Residents also stated in newspapers and in televised news segments that the odors were so bad they virtually became ill (Appendix D) Residents stated the odors were intermittent (ie a noticeable smell that dissipates after a few minutes to several hours) but that the strongest odors reportedly occurred mostly at night or in the early morning On December 10 2003 due to excessive hydrogen sulfide odors school officials evacuated over 1000 students from two schools and Pennsylvania Turnpike toll collectors closed their booths This particular malodorous release resulted in an Emergency Court Order issued by Lackawanna County Court
4
Judge Robert Mazzoni on that same day PA DEP officials also reported that during the several malodorous releases between September and December 2003 residents complained of headaches feelings of nausea and eye throat and respiratory tract irritations
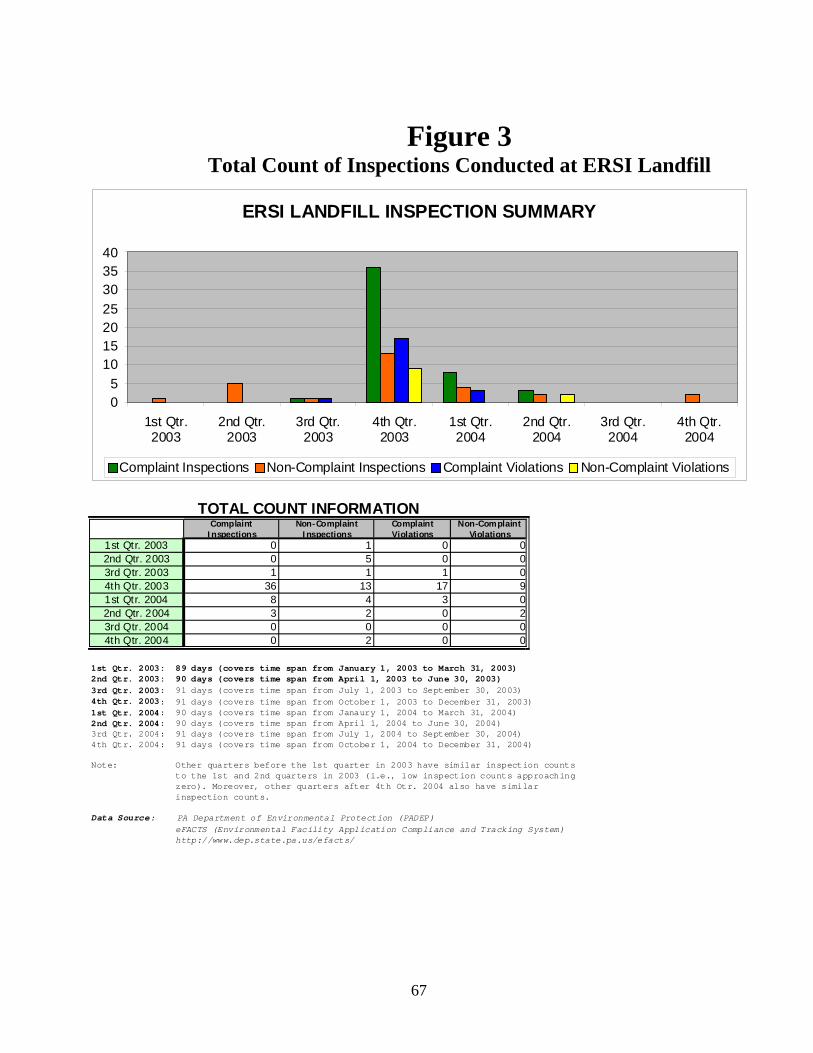
As part of its investigation ATSDR retrieved and reviewed compliance and inspection data from PA DEPrsquos Environment Facility Application Compliance and Tracking System (eFACTS) for the ERSI Landfill (PA DEP 2008a) ATSDR used this data to create Figure 3 which shows the number of inspections conducted per quarter by PA DEP at the ERSI Landfill for calendar years 2003 and 2004 Most inspections and violations occurred in the 4th quarter of 2003 (time span of 91 days between 10012003 to 12312003) This corresponds with the period of malodorous releases for the ERSI Landfill that occurred between the months of September and December 2003 Figure 3 also shows that the 4th quarter of 2003 had the most complaint inspections (ie an inspection prompted by an odor complaint from a nearby resident)
Because of odor complaints that occurred during the 4th quarter of 2003 PA DEP conducted inspections at the ERSI Landfill about every 2 to 3 days and wrote odor complaint violations about every 5 days (ie approximately 1 complaint violation for every 2 complaint inspections) During the 1st quarter of 2004 corrective actions at the ERSI Landfill mitigated and eventually prevented malodorous releases Complaint inspections and violations together with public anxiety also began to diminish Eventually complaint inspections and violations diminished to a level considered a norm (ie no more than 1 to 2 complaint inspections per quarter) This is evident for the early quarters (1 and 2) of 2003 and the latter quarters (3 and 4) of 2004 The level of complaint inspections also holds true for other quarters not shown (before 2003 and after 2004) in Figure 3 Moreover for the quarters considered a norm in which PA DEP actually conducted inspections for the one or two reported odor complaints many instances PA DEP did not issue violations when departmental inspectors arrived at the designated location the odors had subsided
Environmental Sampling and Chemical Analyses
2003 Ambient Air Investigations
In late 2003 to ascertain the substances present in the air and to identify those causing odor complaints PA DEP dispatched two mobile analytical laboratories 1 (ldquoMAU 1rdquo) and 2 (ldquoMAU 2rdquo) on November 18ndash20 2003 and December 1ndash4 2003 (Conrad 2003) Mobile laboratory personnel also made ambient air measurements to detect substances in the atmosphere and to estimate the levels or concentrations of detected substances
For the air analyses conducted during these investigations the mobile laboratories used four instruments
1 Multi-Polymer Array Response Network (Electronic Nose)
2 Gas ChromatographMass Spectrometer (GCMS)
3 TAGA IIE MSMS spectrometer
4 Open Path Fourier Transform InfraRed spectrometer (OPFTIR)
The first three instruments provided qualitative results meaning ambient air levels or concentrations of the substances could not be approximated These three instruments employed
5
methods of gathering data instantaneously implying the spectral scans (measured data) are representative of the time a sample is collected not a time-weighted average for a series of collected samples The fourth instrument also gathers data instantaneously but quantitative measures are approximated ATSDR primarily used the results of the fourth instrument in its assessment of potential public health implications the other three instruments did however provide supporting weight of evidence that odorous substances were present in the atmosphere and most were volatile in nature similar to those detected by the fourth instrument
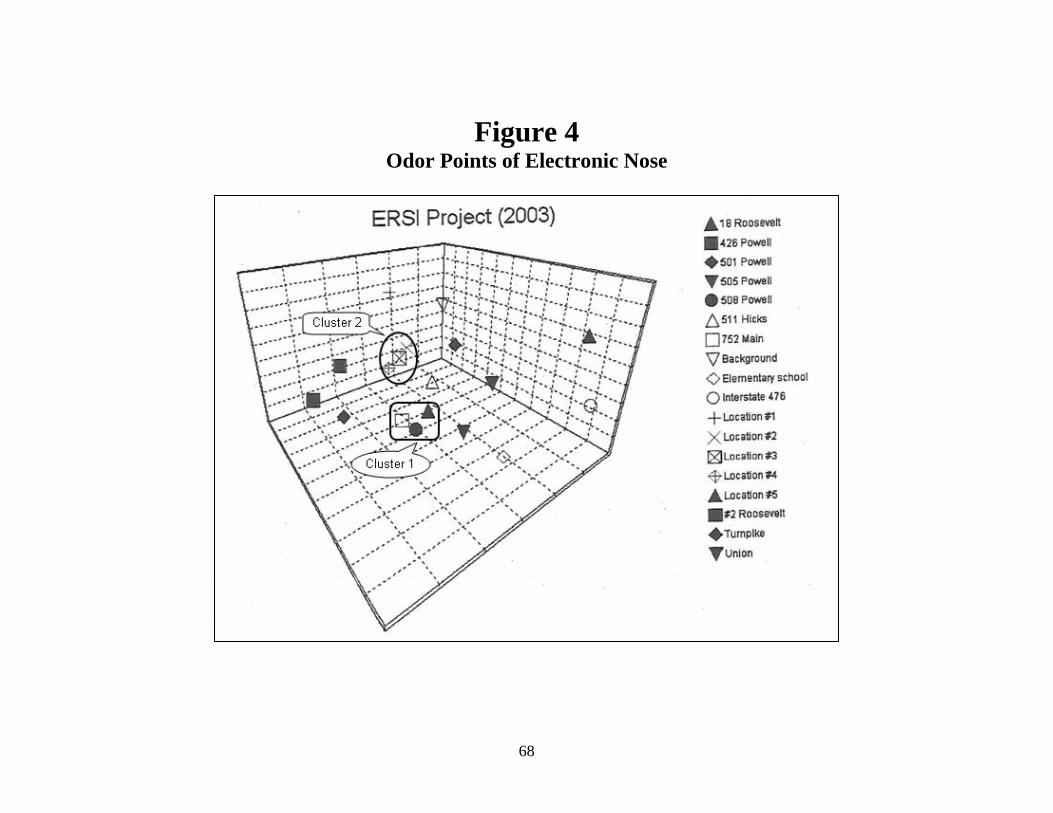
The first instrument used in the investigations was the Multi-Polymer Array Response Network (Electronic Nose) This instrument uses an array of polymer sensors to mimic the human nose The sensors change their electrical resistance in the presence of differing chemicals Each sensor has a different characteristic response which is logged and mapped to provide a visualqualitative representation of a specific odor
Results from the electronic nose are shown as a composite graph in Figure 4 Odor samples were collected for the 7 days of sampling that resulted in odor points residing in a common area within the neural-net (3-dimensional mapping space of odor points in Figure 4 defined by the intensity level of electrical signals from device sensors) The formation of the odor points in this specific arrangement formed a unique reference profile for the overall investigation
Of the odor samples gathered all were plotted within the neutral-net and displayed in Figure 4 In two distinct groups of odor samples the instrument deemed to have similar odor characteristics otherwise the remaining odor points were distinct and dissimilar to each other and to the cluster groups Each cluster group consisted of three odor points and was labeled as Cluster 1 and Cluster 2 consisting of the following sampling locations
Cluster 1 Location 5 508 Powell and 752 Main Cluster 2 Location 2 Location 3 Location 4
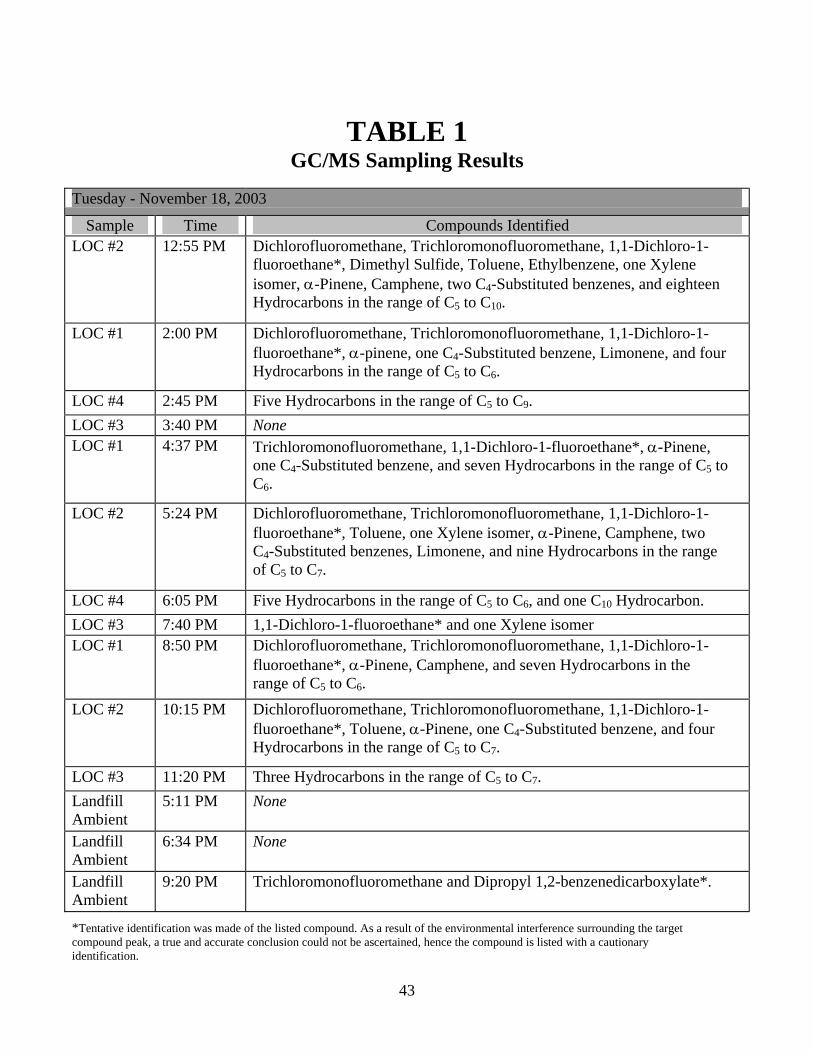
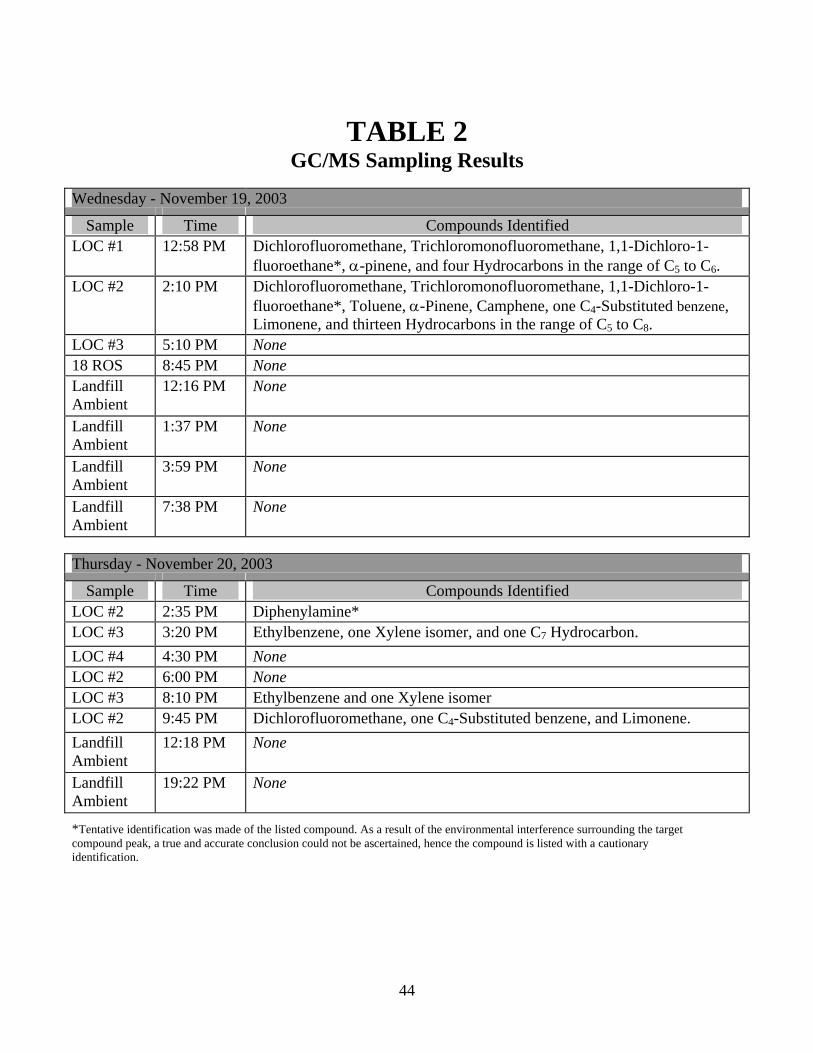
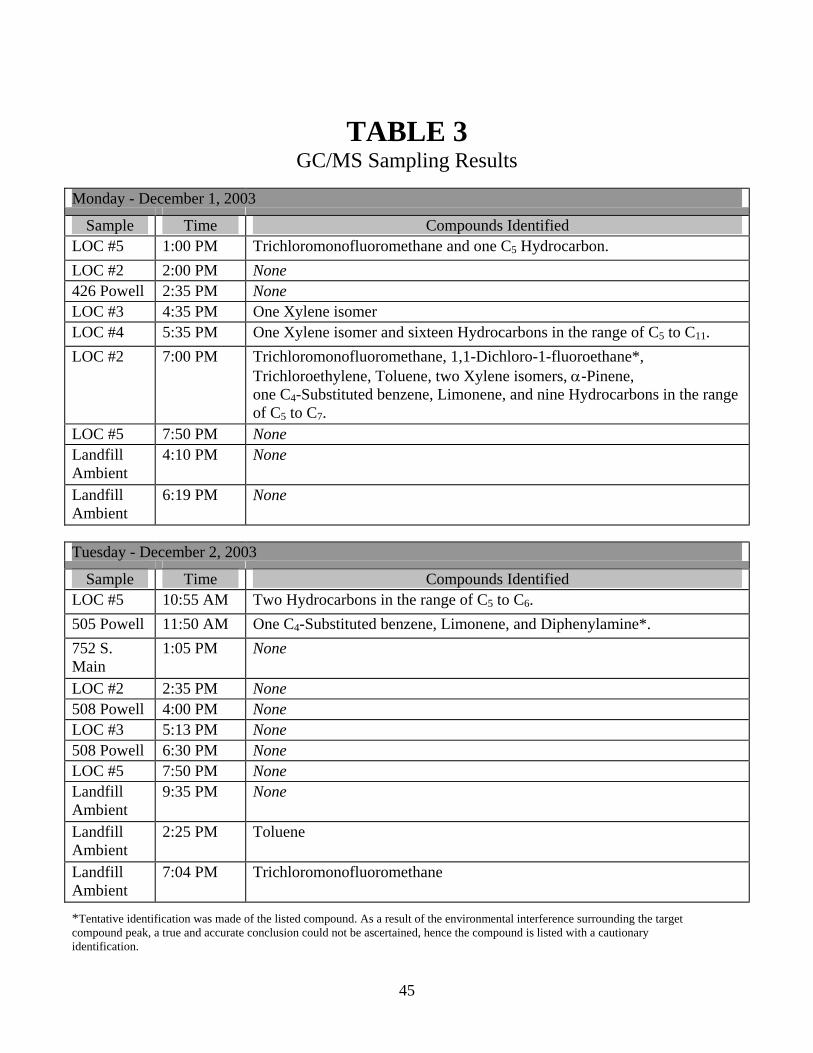
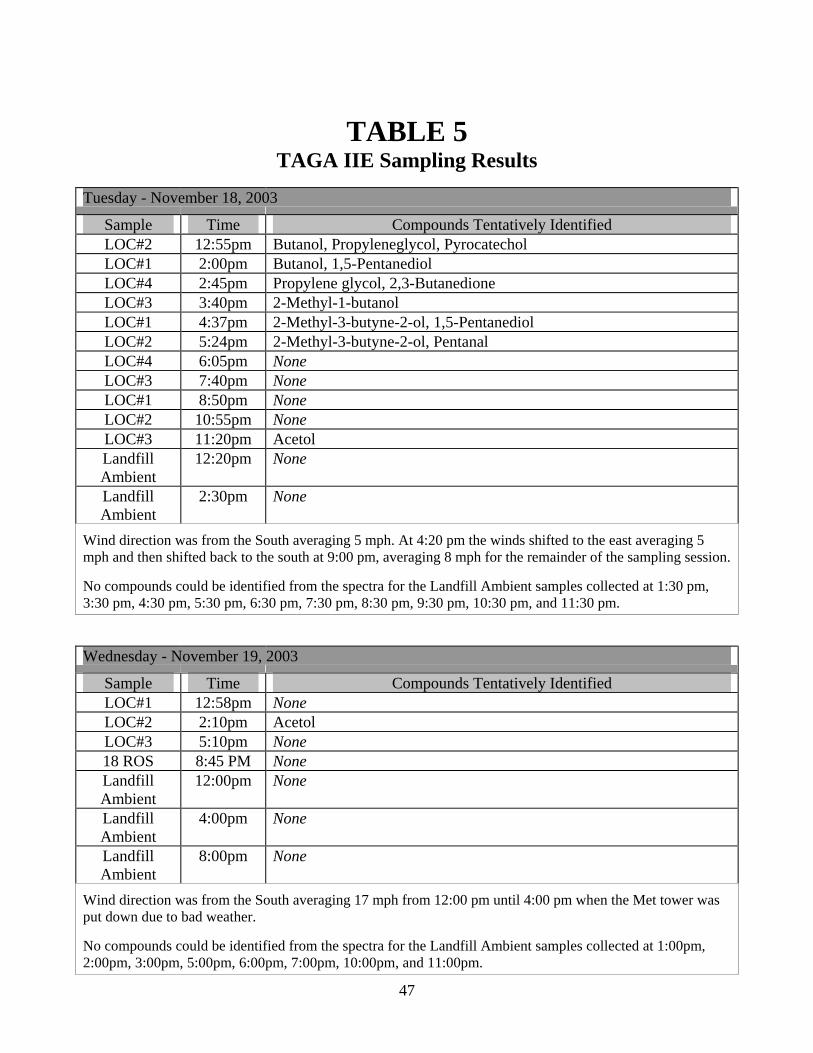
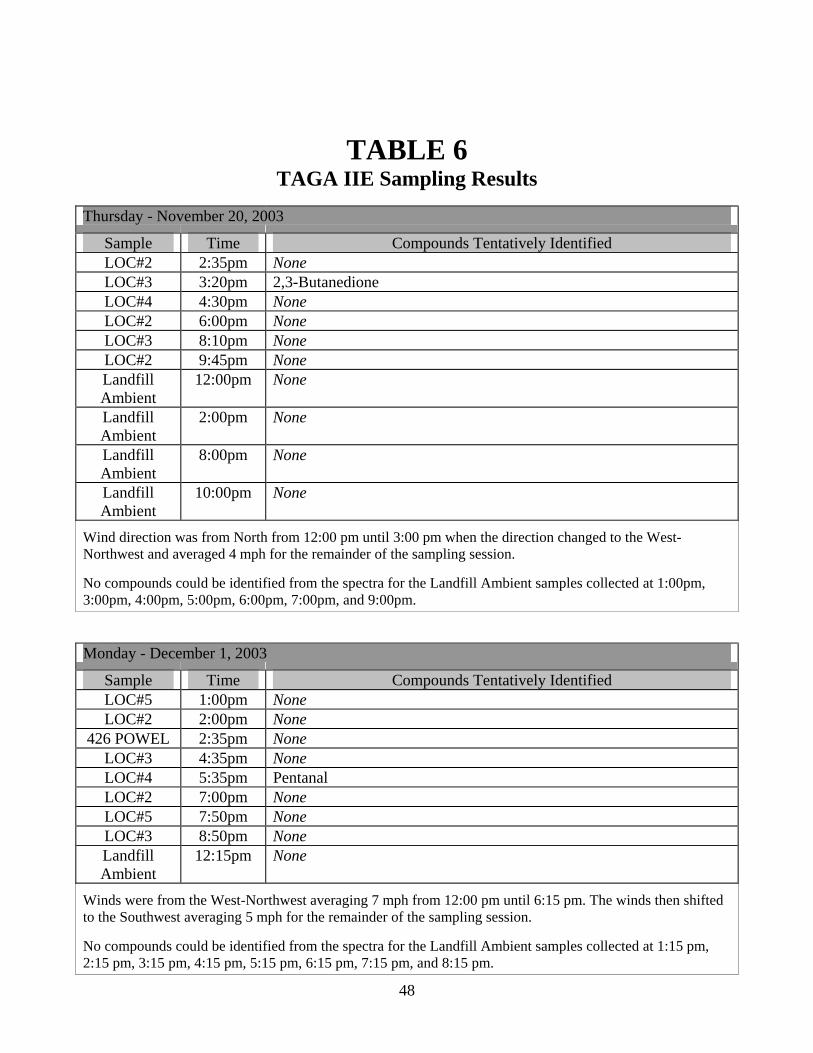
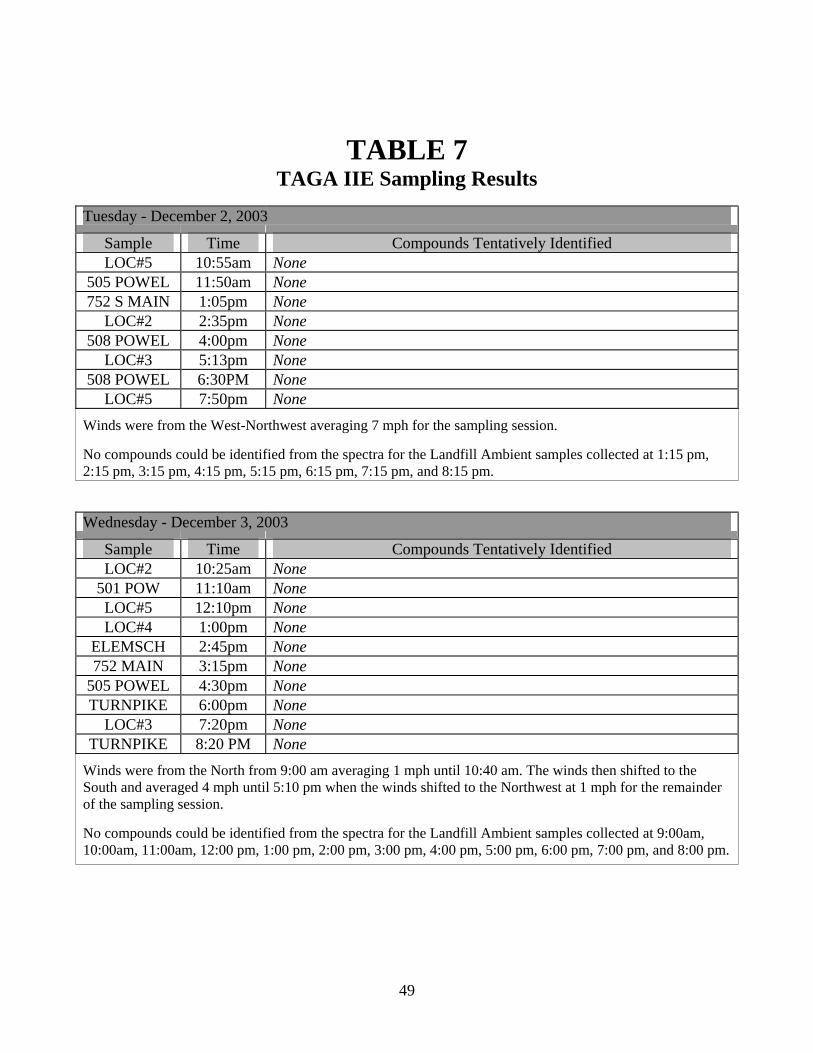
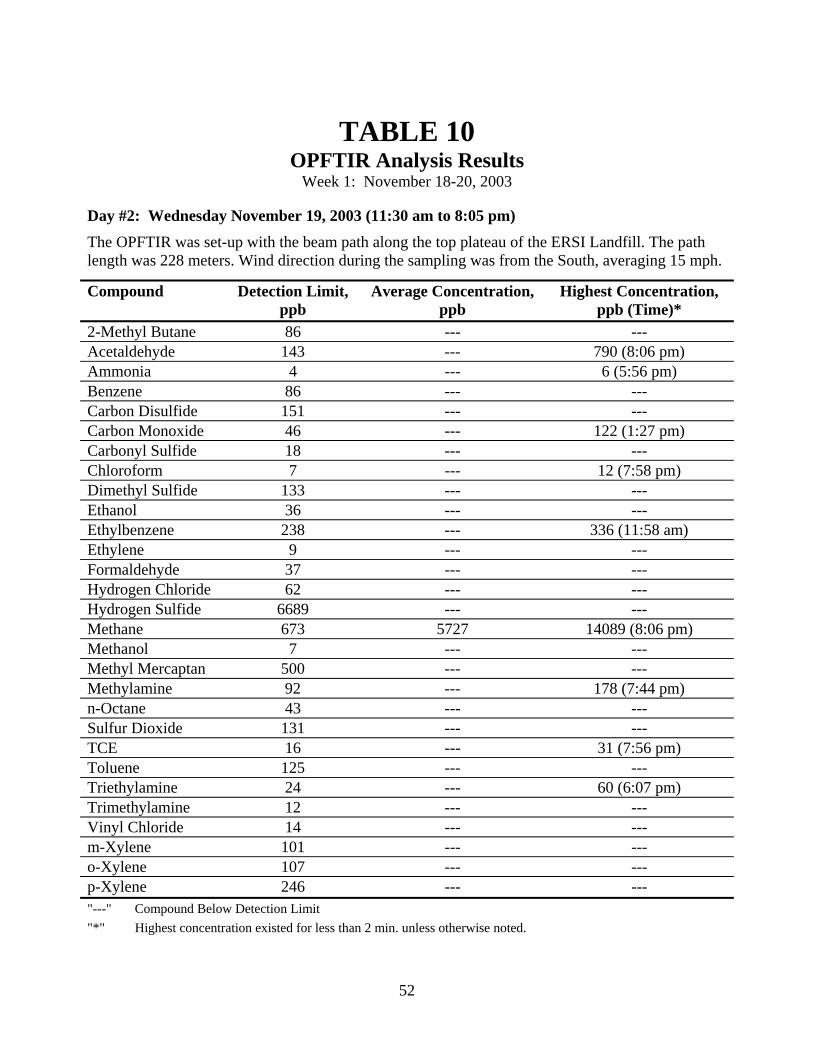
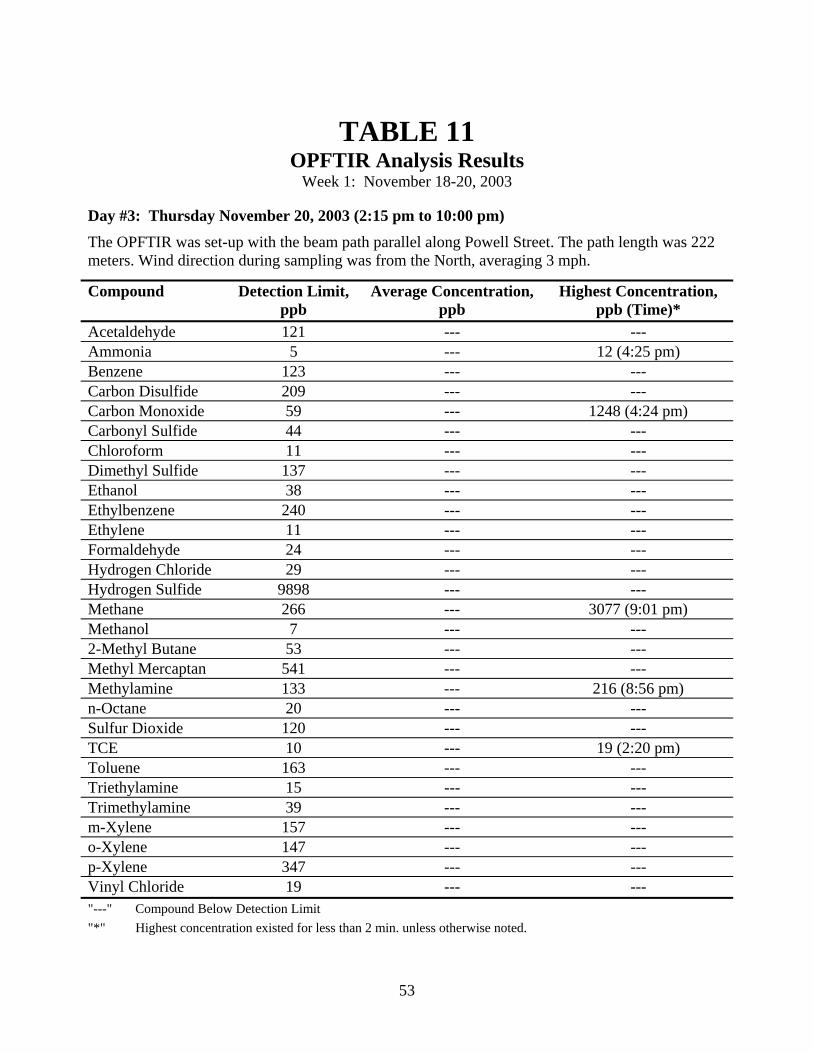
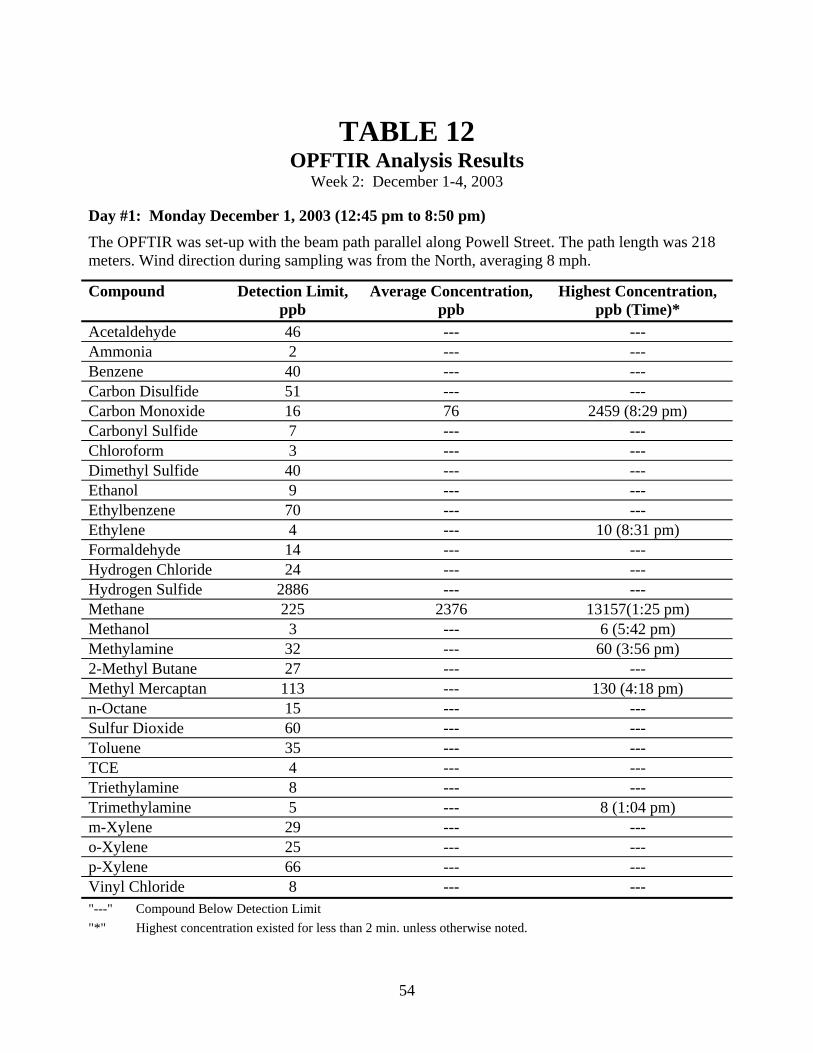
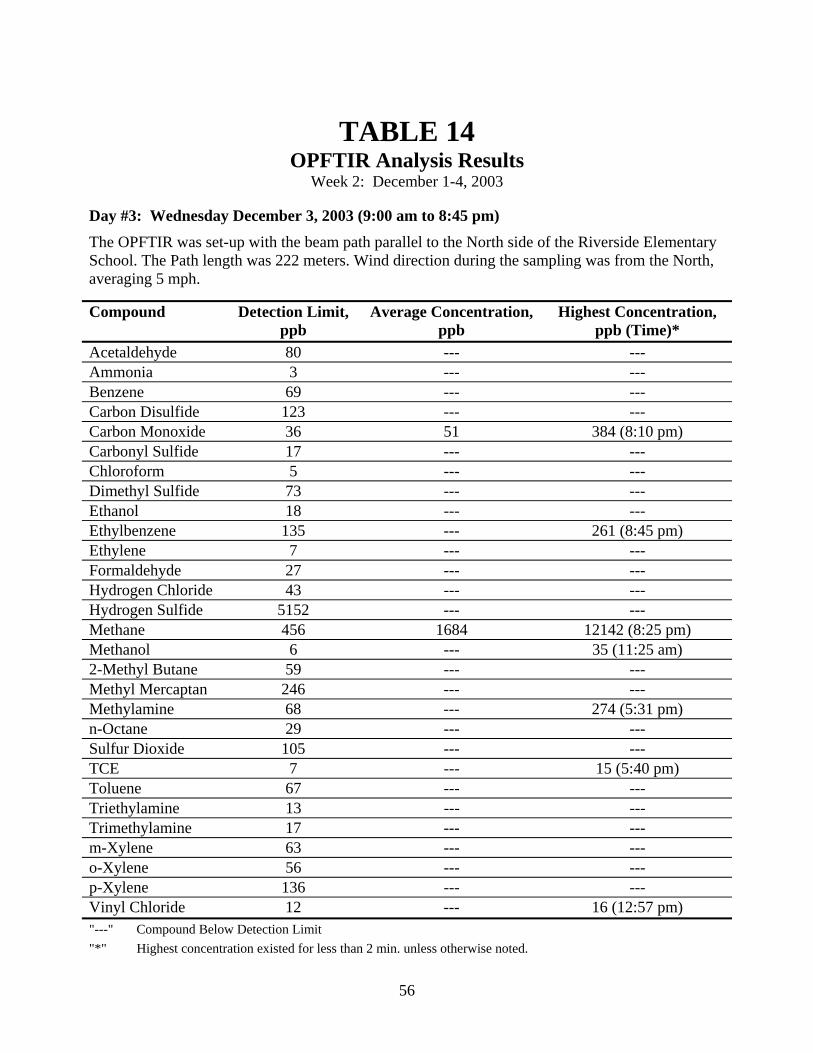
The next two instruments were a Gas ChromatographMass Spectrometer (GCMS) and a TAGA IIE MSMS spectrometer Both are ambient air measuring devicesmdasha complex air sample is introduced into the instruments and an attempt is made to identify tentatively the samplersquos individual components The GCMS and the TAGA IIE are mass spectrometers used in tandem or conjunction with each other The chemical constituents tentatively identified in the odor samples are listed in Tables 1 thru 4 (GCMS) and Tables 5 thru 8 (TAGA IIE) all in Appendix B As noted earlier the results are qualitative and no exact concentrations were approximated or estimated
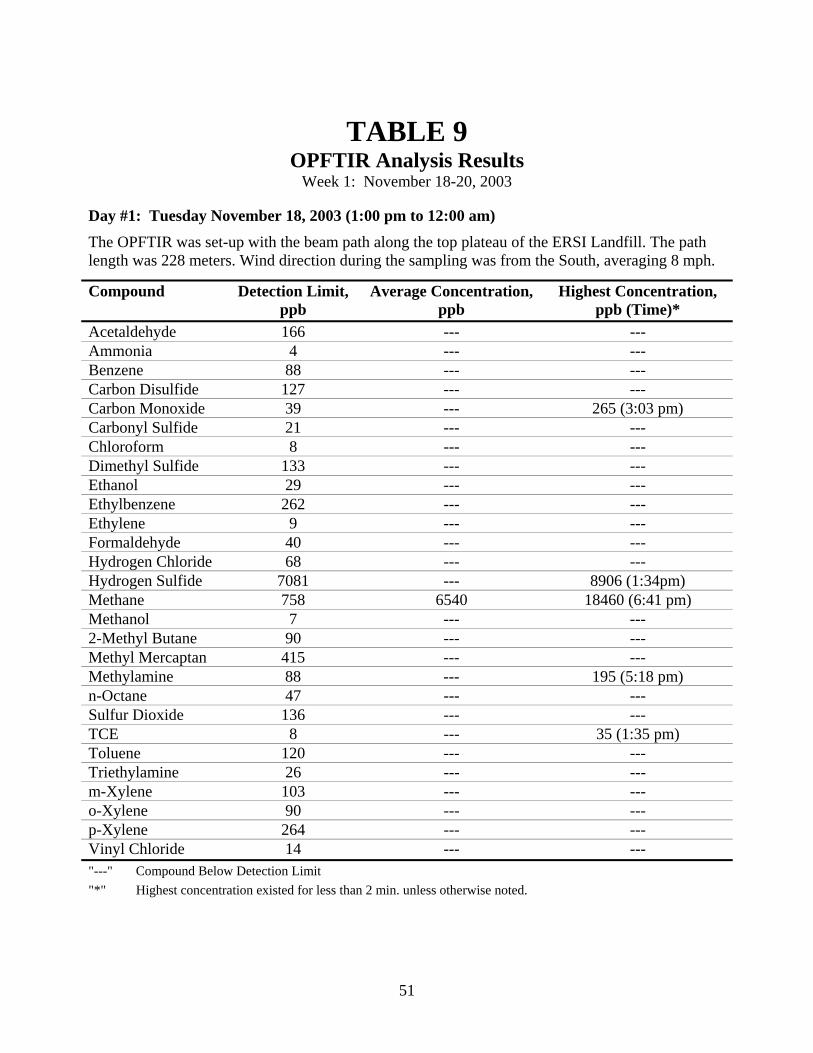
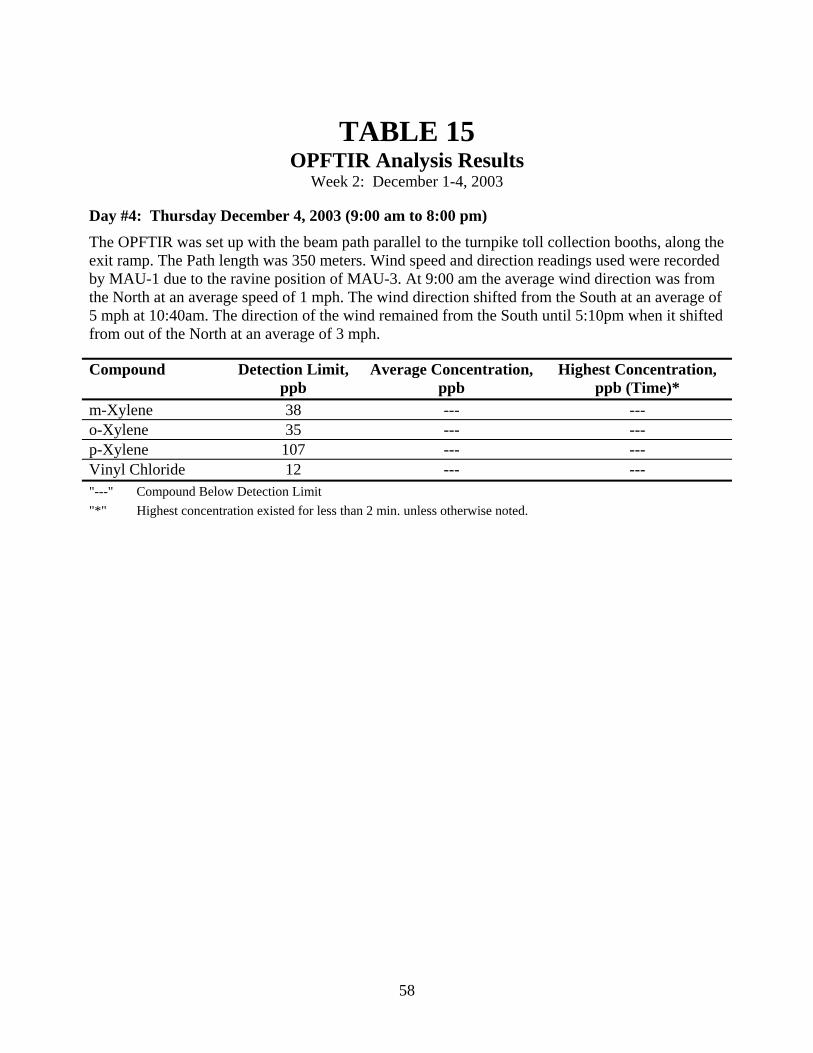
The fourth instrument used in the investigations was the Open Path Fourier Transform InfraRed spectrometer (OPFTIR) The OPFTIR measures substances in the air by directing a beam of modulated infrared energy from the OPFTIR telescope The beam contacts targets that can reflect (mirrored retro-reflector) the energy back along the same beam path into the OPFTIR The approximate beam paths for the investigation are displayed in Figure 1 Molecules of each of the chemicals intercepted in this infrared beam path uniquely absorb energy From the analysis of the resulting absorption spectrum the OPFTIR identifies and quantifies the chemical compound molecules present Together with their approximated air concentrations the chemical substances identified are listed within Tables 9 thru 15 The data are summarized in Tables 16 and 17 together with health comparison values The health comparison values selectively screen
6
for substances that potentially pose a health concern to exposed populations and that therefore require further public health analysis
2004 Post Ambient Air Monitoring of Hydrogen Sulfide
After ERSI Landfill operators installed gas collection wells and a John Zink Flare PA DEP placed two continuous ambient air monitoring stations in close proximity to the landfill The gas collection wells and flare collected and destroyed gases generated and created in the landfill including those considered malodorous
One of the ambient air monitoring stations was placed at the Taylor Pennsylvania Riverside Elementary School (Taylor H2S Station in Figure 1) The other ambient air monitoring station was placed along the Pennsylvania Turnpike (Taylor Turnpike Station in Figure 1) adjacent to the ERSI Landfill The stations only measured hydrogen sulfide levels within the air Monitoring began at the Riverside station on February 1 2004 and continued until June 14 2004 (PA DEP 2008b) Monitoring began at the Turnpike station on March 29 2004 and continued until September 23 2004 (PA DEP 2008b) Between the months of February and September 2004 odor complaints by residents living adjacent to the ERSI Landfill substantially decreased thus PA DEP ceased air monitoring at the two stations (see Figure 3) Moreover most of the hydrogen sulfide levels recorded each month as time-weighted averages of 1 hour 996ndash100 for the Riverside Station and 83ndash99 for the Turnpike station were not detected (ie approaching a measured level of zero or below 1 part per billion (ppb)) The results of both monitoring stations are summarized in Table 18
The detected hydrogen sulfide levels for a time-weighted average of 1 hour were below ATSDRrsquos air comparison values (CVs) for acute exposures to hydrogen sulfide ATSDRrsquos air CVs are denoted as Environmental Media Evaluation Guides (EMEGs) air concentration levels in micrograms per cubic meter (microgm3) or ppb ATSDRrsquos air CVs are further discussed in Appendix A Air concentration levels for hydrogen sulfide below their respective air CVs (eg EMEGs) present no appreciable risk of affecting public health (ie no adverse health effects are expected to occur in an exposed population) (See the ldquoIn-depth Public Health Analysisrdquo below for discussion)
Taylor Ambient Air Monitoring Station
Residents living in Taylor and in Old Forge PA have also expressed concerns about the Alliance Landfill directly across the street from the ERSI Landfill
ATSDR recommended that the PA DEP conduct ambient air monitoring in Taylor Borough (ATSDR 2004) PA DEP installed an ambient monitoring station located off Keyser Ave in Taylor (see Figure 1) The air monitoring station was centrally located approximately between the Alliance Landfill ERSI Landfill the Pennsylvania Turnpike and other commercial properties adjacent to Keyser Avenue and Union Street
Air monitoring station equipment collected meteorological data and continuously monitored levels of hydrogen sulfide (H2S) and sulfur dioxide (SO2) The air monitoring station included a high-volume air sampling unit to detect total suspended particulates and various metals
PA DEP staff installed calibrated and maintained the sampling equipment and meteorological equipment at the air monitoring station and was also responsible for the compilation of the
7
monitoring data Data collection is completed for this station PA DOH has reviewed the data and has made an assessment of the public health implications Findings from this public health evaluation were released by ATSDR in a public health document on February 28 2008 per its state cooperative agreement with PA DOH (ATSDR 2008)
Exposure Pathways
An exposure pathway is defined as the process by which people are exposed to or come into contact with chemical substances An exposure pathway has five parts
1 A source of contamination
2 An environmental medium and transport mechanism
3 A point of exposure
4 A route of exposure and
5 A receptor population
When all five parts are present the exposure pathway is a completed exposure pathway But a completed exposure pathway does not necessarily mean the presence of a public health hazard To determine the implications of any exposure specific exposure conditions and exposure doses must be more closely evaluated The only exposure pathway examined in this public health consultation is the inhalation of landfill gases from the ERSI Landfillmdashthis pathway probably poses the most significant and greatest concern to public health
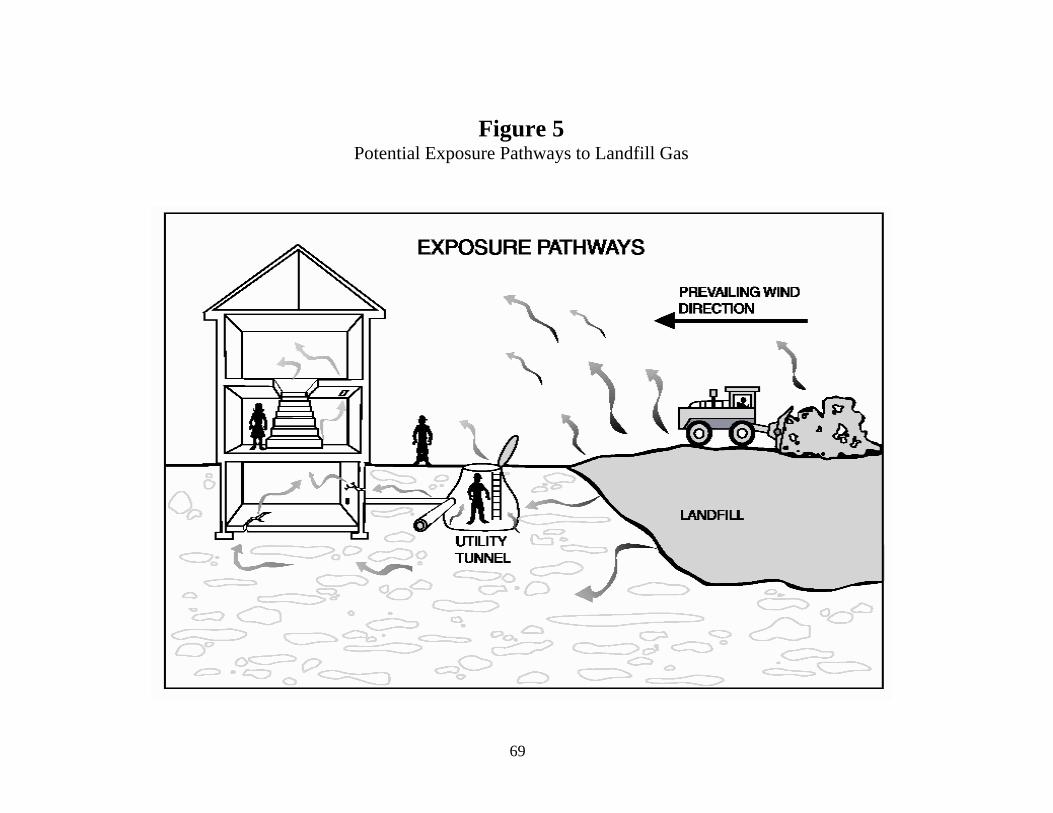
Because community residents often complain about odors emanating from landfills inhalation of landfill gases is usually the predominant landfill-related exposure pathway Landfills odors are mainly due to landfill gases migrating either above or below ground Such gases can move through the landfill surface to the ambient air Once in the air winds can carry landfill gases to the community Landfill gases may also move underground through subsurface soils and enter homes or utility corridors on or adjacent to the landfill Figure 5 illustrates the movement of landfill gases and potential locations for exposure The levels of gases that migrate from a landfill and to which people can be exposed are dependent on many factors that can affect the direction speed and distance of landfill gas migration Some of these factors include but are not limited to
Landfill cover type
Natural and man-made pathways
Wind speed and direction
Moisture
Groundwater levels
Temperature and
Barometric and soil gas pressure
8
Landfill gas collection and control systems probably have the greatest effect on gas migration and exposures If a gas collection and control system is in place and operating properly migration of and exposures to landfill gases should be minimal
Public Health Analysis
Chemicals Selected for Further Public Health Analysis
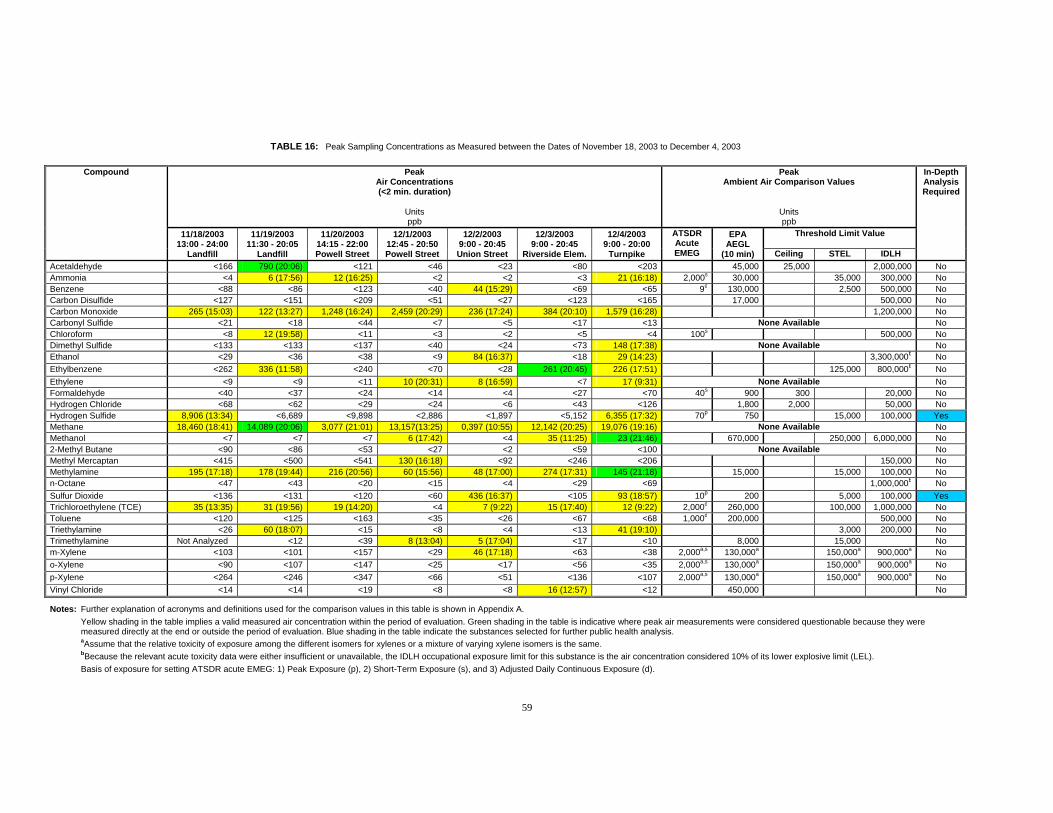
Tables 16 and 17 summarize ATSDRrsquos review of the ambient air monitoring data collected during the 2003 malodorous releases (Note detection limits for all substances are displayed in Tables 9ndash15) ATSDR environmental health scientists first applied a screening process to select specific substances detected in the air these substances were then subjected to further analyses for peak inhalation exposures Table 16 summarizes measurements for 29 substances Of these substances 18 had what are termed acute exposure guideline levels (eg Acute EMEGs or AEGLs) for making health screening comparisons (Refer to Appendix A for further explanation of the acute exposure guidelines and the selective screening rationale used in this evaluation) And of these 18 substances three had detected peak air levels (ie air monitoring measurement of no more than a 2 minute duration refer to Table 16) during the malodorous releases of 2003 that exceeded at least one of their respective acute exposure guidelines The detected peak air levels of the other 15 substances never at any time exceeded their respective acute exposure guidelines and were therefore not selected for in-depth public health analysis
Two of the substances selected for public health analysis were hydrogen sulfide (H2S) and sulfur dioxide (SO2) Benzene the third substance exceeded ATSDRrsquos acute inhalation EMEG an acute exposure guideline for daily exposure Because however the detected air level for benzene is a measured peak air concentration it is more appropriate to screen the detected level against US EPArsquos AEGL for peak air exposures (10 minutes or less) Thus because benzenersquos detected peak air level was far below its AEGL for peak air exposures it was not selected for in-depth public health analysis
The remaining 11 substances summarized in Table 16 did not have Acute EMEGs or AEGLs Two of the substances ethylbenzene and triethylamine had a threshold limit value (TLV) for peak exposures TLVs are health-based guidelines set by the American Conference of Governmental Industrial Hygienists (ACGIHreg) to promote workplace health and safety The Occupational Safety and Health Administration (OSHA) have adopted many TLVs for use as permissible exposure limits (PELs) TLVs are normally designed to protect healthy adult workers and are usually much higher than the health-based values of ATSDR and US EPA which are designed to protect the health of the general population including the very young and the elderly Keeping this in mind and when making health screening comparisons ATSDR focused on selecting health-based guidelines or standards that appropriately adjust the TLVs to be protective of the general population
The American Industrial Hygiene Association (AIHA) is another scientific organization also concerned with environmental exposures to toxic airborne substances within the workplace Accordingly AIHA developed an emergency response exposure limit known as the Emergency Response Planning Guidelines (EPRG) which is similar to US EPArsquos AEGLs ERPG values are based on occupational exposure limits (OELs) (eg PELs RELs TLVs) rationally lowered
9
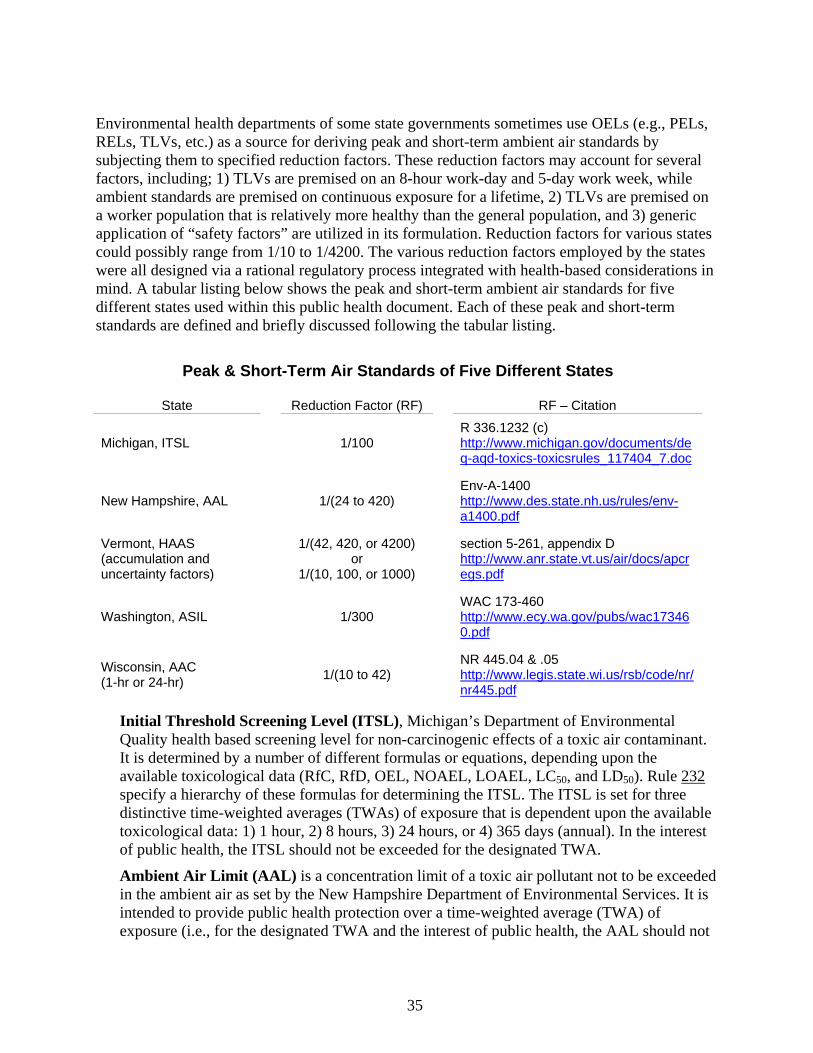
to general exposure limits considered protective of nearly all persons within certain domestic settings subjected to a specific emergency response situation Two states (Michigan and Wisconsin) also use OELs to establish their health-based air standards for peak air exposures Michiganrsquos health-based air standard is called the Initial Threshold Screening Level (ITSL) and Wisconsinrsquos is called the Acceptable Ambient Concentration (AAC) (MI DEQ 2008 WI DNR 2000)
ATSDR made health screening comparisons using the guidelines in the above paragraph If none of the above guidelines applied to a specific substance a health screening comparison was made with a rationally reduced TLV (ie TLV value multiplied with a reduction factor of either 110 for peak inhalation exposures or 142 for short-term inhalation exposures refer to Appendix A) The reduced TLV factor of 142 makes considerations for longer domestic exposures (80 of the time spent at home) and for human variability however the reduced TLV factor of 110 only makes the consideration for human variability (WI DNR 2000 Thrasher 2006) Applying the above screening rationale ATSDR found that the peak air levels for ethylbenzene and triethylamine did not meet the criteria for in-depth analysis
Four of the remaining 11 substances without Acute EMEGs or AEGLs (carbon monoxide ethanol methyl mercaptan and n-octane) did not have a TLV for peak exposures but did have health-based exposure limits known as Immediately Dangerous to Life and Health (IDLH) An IDLH is an airborne concentration established by the National Institute for Occupational Safety and Health (NIOSH) from which a worker in the event of respiratory protection equipment failure could escape without injury or irreversible health effects Again applying the rationale wherein health screenings are compared to guidelines based on OELs (refer to Appendix A) ATSDR found that the peak air levels for the five substances also did not meet the criteria for in-depth analysis
The last five substances of the 11 without Acute EMEGs or AEGLs (carbonyl sulfide dimethyl sulfide ethylene methane and 2-methyl butane) had neither listed appropriate comparison values nor Acute EMEGs AEGLs or TLVs ATSDR first reviewed additional sources (eg AIHA NIOSH MI ITSLs WI AACs) to identify environmental guidelines for accessing any detected peak concentration levels Michigan for example set an annual air standard for carbonyl sulfide at 9 microgm3 (37 ppb) During the peak air measurements carbonyl sulfide was not detected the detection limits (5 ndash 44 ppb) however exceeded the Michigan air standard Considering that this Michigan air standard is relevant to intermediatechronic exposures and that potential detectable levels could be lower than this standard ATSDR determined that any measurable peak air levels if detected were unlikely to cause any adverse effects (Only transient health effects have been observed from continuous inhalation exposures to carbonyl sulfide ranging from 15000 ppb to 30000 ppb (BOC 1996) Thus if detected at the detection limit of 44 ppb it is still 340 times lower than levels associated with adverse health effects)
2-Methyl Butane was also not detected during peak air measurements detection limits range from 2 to 100 ppb Yet even if 2-methyl butane were present at levels below detection limits those levels would be far below the 8-hour Michigan air standard for 2-methyl butane which is 17700 microgm3 (6000 ppb)
Only one peak concentration level (148 ppb) of dimethyl sulfide was detected and it was below the ERPG-1 air standard for dimethyl sulfide (500 ppb) set by AIHA ERPG-1 is a maximum
10
airborne concentration from which persons may notice an odor or slight irritation but that is still below any concentration that could cause adverse health effects
Ethylene had measurable peak concentration levels ranging from 8 to 17 ppb These levels are also far below a 24-hour Michigan air standard for ethylene which is 6240 microgm3 (5440 ppb) implying that ill-health outcomes are unlikely Methane also had measurable peak concentration levels ranging from 397 to 19076 ppb (0397ndash19076 ppm) well below the ACGIH 8-hr TWA TLV of 1000 ppm or 1000000 ppb also implying unlikely ill-health outcomes (ACGIH 2008)
To select for further analysis specific substances detected in air ATSDR also applied another screening rationale for short-term inhalation exposures Table 17 summarizes the air level measurements for 29 substances (refer to Tables 9ndash15 for detection limits) These air level measurements represent averages for continuous time periods below 24 hours thus any exposure at a detectable level would be considered short term Of the 29 substances only two (carbon monoxide and methane) had levels above measurable detection limits where averages could be calculated
Using the screening rationale for short-term inhalation exposures ATSDR found that the detectable levels of carbon monoxide considered as short-term averages (51ndash632 ppb) did not meet the selection criteria for in-depth analysis ATSDR based this decision on detectable levels that were lower than three air standards 1) ERPG-1 of 200000 ppb 2) MI ITSL of 8730 ppb and 3) VT HAAS of 8730 ppb ATSDR also found that the detectable levels for methane considered as short-term averages (43ndash6540 ppb) did not meet the selection criteria for in-depth analysis ATSDR based this decision on the fact that detectable levels were far lower than the ACGIH 8-hr TWA TLV of 1000 ppm or 1000000 ppb None of the other remaining 27 substances were at levels substantially above their detection limits Consequently ATSDR could not derive representative short-term averages for these substances and therefore did not apply the screening rationale for short-term exposures to them
Public Health Implications
Public health analysis is an integrated process that studies site-specific exposures in conjunction with substance-specific toxicological medical and epidemiologic data (ATSDR 2005) As stated hydrogen sulfide and sulfur dioxide were selected for further analysis because their detected levels in air exceeded the screening criteria applicable to peak exposures
While none of the detection limits for H2S and SO2 listed in Tables 9ndash15 (Peak amp Short-Term Concentrations Nov 18 to Dec 4 2003) exceeded occupational exposure limits (ie TLVs) they both exceededmdashoften by several orders of magnitudemdashATSDRrsquos screening values for daily acute (le14 days) exposures In addition the detection limits varied markedly from place to place probably reflective of several factors affecting the measurements of the OPFTIR instrument Such factors may include but are not limited to
1 Instrument calibration
2 Distanceangle the electromagnetic beam traverses (beam path)
3 Deployment of beam transmission and reception (mono-static bi-static or passive)
4 Ambient air temperature and
11
5 Relative humidity of the air
Peak Exposures to Hydrogen Sulfide
The available data suggest that the ERSI-related intermittent acute exposures to hydrogen sulfide that occurred in the final quarter of calendar year 2003 though unpleasant to most and uncomfortable to some might have caused only temporary non-serious effects even in sensitive human subpopulations
The detection limits reported for hydrogen sulfide in Tables 9ndash15 range from lt1897 ppb to lt9898 ppb Assuming as cited above that the actual peak concentrations for non-detected measurements were essentially the same as the reported detection limits and noting the two measured air levels of 6355 and 8906 ppb the peak concentrations for hydrogen sulfide between November 8 thru December 4 of 2003 (ie during the ldquoincidentrdquo) may well have been high enough to cause temporary respiratory discomfort to those with asthma and perhaps even in some without asthma who suffered from other preexisting respiratory conditions
The actual air levels however may have been an annoyance for nearly all residents The recognition threshold (ie the level at which 50 of people can recognize the chemicalrsquos characteristic odor) is only 5 ppb (0005 ppm) for hydrogen sulfidersquos characteristic ldquorotten eggrdquo odor
ATSDRrsquos 70-ppb acute Minimum Risk Level (MRL) for hydrogen sulfide is based on a 2000shyppb (2 ppm) human LOAEL for increased airway resistance and decreased specific airway conductance in 2 of 10 asthmatic subjects exposed for 30 minutes (Jappinen et al 1990) In this study no significant alterations in lung function (eg forced lung vital capacity forced expiratory volume bronchial responsiveness to a histamine challenge airway resistance and specific airway conductance) were observed in those with asthma exposed to 2 ppm for 30 minutes But 2 of the 10 subjects had gt30 changes in airway resistance and specific airway conductance implying bronchial obstruction Three of the subjects also reported headaches Therefore this LOAEL of 2000 ppb represents an approximate threshold for less serious effects in the most sensitive members of the most sensitive human subpopulation (ie those with asthma)
In another human study no respiratory effects were experienced by men and women exposed to 10 ppm hydrogen sulfide for 15 minutes (Bhambhani et al 1996) This human NOAEL is higher than any of the purported concentrations listed in Tables 16 and 17 and is based on exposures of comparable duration The duration of the measured peak air concentrations listed in Table 16 was less than 2 minutes The duration of the measured concentrations listed in Table 17 ranged from roughly one-third to one-half of a day (8ndash12 hours) ((Note hydrogen sulfide levels could not be quantified as short-term averages (ie not detected at the detection limits used) In Table 17 therefore the short-term air concentrations listed in the table represent upper limits (eg ldquolt9898rdquo ppb) instead of actual concentrations))
The current ACGIH 8-hr TWA TLV for hydrogen sulfide is also 10 ppm (ACGIH 2008) An ACGIH TLV represents a level to which nearly all workers (ie healthy adults) may be repeatedly exposed 8 hours a day 40 hours a week without adverse effects Moreover ACGIH TLVs are based solely on health factors and do not consider economic or technical feasibility
12
That said ACGIH TLVs are designed for application to healthy worker populations which do not include children the elderly infirm and other sensitive subpopulations
Within the context of the human effect levels and assumptions described above ATSDRrsquos interpretation of the available monitoring data supports the conclusion that hydrogen sulfide exposures during the ERSI landfill malodorous incident of late 2003 may have constituted a Past Public Health Hazard No serious or irreversible adverse effects are likely in either people with asthma or without asthma But mild reversible respiratory effects would have been likely in some with asthma and perhaps even in some without asthma who suffered from other preexisting respiratory conditions
Post Exposures to Hydrogen Sulfide
The data summarized in Table 18 show that the levels of hydrogen sulfide (1-hr 24-hr and monthly averages) after the implementation of corrective actions at the ERSI Landfill in 2004 Levels ranged in the very low parts per billion (immeasurable or lt1 ppb) that is (mostly) immeasurable to 7 ppb at Riverside Elementary School and (mostly) immeasurable to 3 ppb at the Pennsylvania Turnpike As noted in the previous section the lowest human LOAEL for less serious effects in more sensitive members of the most sensitive human subpopulation (ie persons with asthma) is 2000 ppb
These post-incident air monitoring data are comparable to US EPArsquos reference concentration (RfC) of 0002 mgm3 or 14 ppb The RfC is a level of a substance in air considered safe for continuous lifetime exposure The RfC for hydrogen sulfide contains a 1000-fold safety factor (USEPA-IRIS 2008) Therefore post-incident hydrogen sulfide levels in areas near the ERSI Landfill were too low to produce adverse effects of any kind even in the most sensitive persons
Accordingly after operators of the ERSI Landfill ensured that the landfill gas collection and capture system was fully functional and operational and would prevent further releases and migration of landfill gases such exposures posed No Apparent Public Health Hazard
Peak Exposures to Sulfur Dioxide
Measured peak concentrations (duration lt 2 minutes) of sulfur dioxide (SO2) were 436 ppb at Union St (437 pm December 2 2003) and 93 ppb at the Pennsylvania Turnpike (657 pm December 4 2003) At all other locations monitored during NovemberndashDecember 2003 no measurable levels were reported (ie concentrations either below 136 ppb or less) and were therefore below US EPArsquos 24-hr NAAQS (National Ambient Air Quality Standard) of 140 ppb
About the only concentration that could have produced clinically significant symptoms in at least some persons with asthma was the 436-ppb measured peak concentration at Union St Perhaps 20ndash35 of persons with asthma may be sensitive to exposures between 400 and 500 ppb (USEPA 2008) The resulting physiological effects are however usually not sufficiently serious to require persons either to cease activity take medication or seek medical attention
The lowest human LOAEL for sulfur dioxide effectsmdashwhich serves as the basis of ATSDRrsquos 10 ppb acute MRLmdash is 100 ppb And this is for a ldquoslightrdquo increase in specific airway resistance (SRAW) in ldquothe two most sensitiverdquo persons with asthma who were administered 100 ppb sulfur dioxide through a response-maximizing mouthpiece during 10 minutes of moderate exercise
13
(ATSDR 1998) But while statistically significant changes in specific airway resistance can be measured by special techniques in a laboratory or doctorrsquos office they do not necessarily correspond with clinically significant levels of broncho-constriction which the exposed person with asthma will experience when having difficulty in breathing or dyspnea Even in those with asthma symptoms of coughing wheezing and dyspnea typically do not appear until levels of sulfur dioxide reach or exceed 400 ppb In addition during the same 24-hr period those with asthma tend to respond less intensely to subsequent exposures than to the original exposure which is to say that repeated exposure actually reduces sulfur dioxide sensitivity in those with asthma (ATSDR 1998)
Finally in healthy persons without asthma clinically significant lung changes are uncommon below 1000 ppb For example ACGIHrsquos recommended 8-hr TWA-TLV is 2000 ppb Most epidemiologic evidence is mixed (ie limited to none) or insufficient with respect to the assumption that children and elderly adults (65+ years) are more sensitive (ie susceptible) to the effects of sulfur dioxide exposure (USEPA 2008) However evidence (mostly clinical chamber studies) does exist which suggests that pulmonary health status rather than age is the primary determinant of susceptibility to the effects of this gas (Rondinelli et al 1987 Koenig et al 1982)
The brief duration of the single measureable sulfur dioxide concentration of potential clinical significance and the minimal severity of the reversible potential effects of that peak exposure suggest that sulfur dioxide exposures during the malodorous air releases at the ERSI Landfill (final quarter of 2003) were not likely to have posed any serious public health concerns Two facts however provide sufficient reason to err on the side of caution 1) the exposures took place during November and December and cold air exacerbates a person with asthmarsquos response to sulfur dioxide and 2) the available data cannot entirely exclude the possibility that during those 2 months equal or higher exposures may have occurred but were not measured
Thus given the available data ATSDR concludes that the highest peak sulfur dioxide exposures during NovemberndashDecember 2003 may have posed a Past Public Health Hazard especially to more sensitive persons with asthma and perhaps to some non-asthmatics who suffer from other preexisting respiratory conditions
Community Health Concerns and Related Public Health Implications
ATSDR provides an initial response to three community health concerns posed by the petitioner and discusses any related public health implications that may exist in the paragraphs below At least two of these concerns cancer and odors are similar to those posed by the community as a whole (ATSDR 2004)
Multiple Sclerosis
Multiple sclerosis (MS) is a slowly progressive central nervous system (CNS) disease characterized by demyelination of nerve fibers in the brain and spinal cord that results in a variety of neurological symptoms with spontaneous remissions and exacerbations (Merck Manual 1992) The cause of MS is unknown but an immunological abnormality is suspected Viral infection genetic susceptibility and environmental factors associated with the location of early residence (up to 15 years of age) may also be involved Specific chemical exposures however have not been implicated (Williamson 2006) In particular none of the VOCs
14
associated with the malodorous air releases that occurred in the last quarter of 2003 have been associated with MS
Cancer Rates
Because of the number of area landfills and Superfund sites located within the county community residents petitioned ATSDR in 1992 to conduct a health assessment for Lackawanna County The Pennsylvania Department of Health (PADOH) under a cooperative agreement with ATSDR reviewed relevant health data for Taylor Borough PA DOH reviewed cancer mortality data for the years of 1980ndash1991 and cancer incidence data for the years of 1985ndash1989 Statistics for total cancers and for eight cancer sites were analyzed Taylor Borough showed a higher number of anus rectum and rectosigmoid cancers than were reflected in Pennsylvania statewide cancer numbers The report suggested however that nonenvironmental factors such as heredity occupation and diet could increase a persons risk for such cancers PADOH continues to monitor cancer mortality and incidence data for Lackawanna County (ATSDR 1993 PADOH 1999 PADOH 2000 PADOH 2001 PADOH 2002 PADOH 2003 PADOH 2004 PADOH 2005 PADOH 2006 PADOH 2007 PADOH 2008 PADOH 2009)
Only two of the VOCs benzene and vinyl chloride (VC) detected during the ERSI Landfill incident during the last quarter of 2003 are known to be carcinogenic in humans and such carcinogenicity requires exposures that are higher and of longer duration than those experienced at ERSI during the malodorous air releases in 2003 (Raabe amp Wong 1996 Falk amp Steenland 1998) The exposures assessed during the malodorous air releases were not of sufficient duration (lt2 min) to pose any hypothetically increased cancer risk to exposed residents or workers ATSDRrsquos inhalation CREGs are 004 ppb for both benzene and VC (ATSDR 2007 ATSDR 2006a) These concentrations are health guidelines that assume chronic life-long exposure The CREGs are based on a risk of developing cancer within ones lifetime of 1 x 10e-6 Or in other words a lifetime exposure of 1000000 people to 004 ppb benzene or VC would hypothetically result in 1 excess cancer
Odors
Landfills emit gases comprised of a wide range of chemicals Some of these chemicals are strong odorants The VOCs and sulfur compounds measured near the ERSI Amity and Alliance Landfills may only constitute a portion of the chemicals responsible for landfill odor Chemicals associated with landfill odors include trace quantities of 1) sulfur compounds including hydrogen sulfide and organosulfurs (eg mercaptans) 2) volatile acids (eg butyric acid) 3) hydrocarbons (eg limonene) 4) esters (eg methyl butyrate) and 5) alcohols (eg 2-butanol) (Brosseau and Heitz 1994) Many of these compounds have odor thresholds well below levels measured by standard US EPA analytic methods
The relationship between odor and health is not fully understood because odors are complex quantifying them is difficult and the human response to odors is highly variable Schiffman et al (2000) describe three paradigms for producing health symptoms In the first paradigm symptoms are induced by exposure to an odorant at levels that also cause irritation or other toxicological effects Thus the irritation rather than the odor causes symptoms with the odor serving as an exposure marker Indeed for individual VOCs that occur in a mixture laboratory
15
evidence suggests that perceived sensory irritation may occur from exposure to levels below odor thresholds (Cometto Muntildeiz et al 1999)
In the second paradigm exposure to odorous compounds produces health-related symptoms below irritant levels but at levels of odor thresholds This typically occurs with exposure to certain types of sulfur-containing compounds or organic amines These compounds also have odor thresholds well below levels that cause irritation The mechanism by which health complaints result from these types of exposures is not understood but it may include psychological and genetic factors In the third paradigm an odor is associated with a symptom when the odorant is part of a mixture containing a co-pollutant (eg dust or allergen) responsible for the health symptom As in paradigm one the odor acts as an exposure marker
Exposure to landfill gas odor can cause transient effects such as headaches and nausea (ATSDR 2001) The effect of landfill gas odors on sensitive populations such as persons with preexisting respiratory illnesses is not well understood A study conducted in Staten Island New York showed on days of reported odors persons living near a landfill who had asthma also had an increase in self-reported wheezing (ATSDR 1999) Ambient air measurements however showed levels of hydrogen sulfide and other emissions much lower than levels known to be associated with adverse health effects The study nonetheless suggested that odors may trigger respiratory effects among persons who have asthma But this finding in persons with asthma living near a landfill may be confounded by other environmental triggers that can prompt a respiratory response such as dust mites animal dander tobacco smoke and other types of outdoor air pollution
Child Health Considerations
ATSDRrsquos Child Health Initiative recognizes that the unique vulnerabilities of infants and children demand special emphasis in communities concerned about air contamination Children are at greater risk than are adults from certain kinds of exposures to hazardous substances released into their environment Children play outdoors frequently and will more likely be exposed to outdoor air pollution Because children are smaller than adults exposure may result in higher doses per body weight Also childrens developing body systems can sustain damage if toxic exposures occur during critical growth stages Near the ERSI Amity and Alliance Landfills children are potentially exposed to air contaminants due to the off-site migration of landfill gases via fugitive air emissions or from accidental releases due to a failure in the landfill gas collection system ATSDR evaluated the limited offsite air-sampling data to assess the potential health effects on children in the community One concern is the potential exacerbation of childhood asthma from landfill gases (IM 2000)
Limitations and Uncertainties
In preparing this health consultation ATSDR relied on the information or data provided in referenced documents and in PA DEPrsquos web site (Conrad 2003) ATSDR did identify some concerns with this information and will discuss these concerns below ATSDR assumed however that adequate quality assurance and quality control measures were followed with regard to chain-of-custody laboratory procedures and data reporting The validity of the
16
analyses and conclusions drawn in this health consultation is solely determined by the completeness and reliability of the referenced information
As cited earlier the environmental data presented in this health consultation are chiefly from site investigations conducted by PA DEPrsquos Bureau of Laboratories where ambient air monitoring near the ERSI Landfill occurred in November and December 2003 This includes continuous hydrogen sulfide monitoring at two air monitoring stations after the 2003 malodorous air releases This post air monitoring occurred from February through September 2004
ATSDR initially recognized that some of the peak air measurements by the Bureau of Laboratories may have been questionable (refer to Table 16) Those that were considered questionable in Table 16 are highlighted or shaded in green the measured or detected concentration either appeared at the end or outside of the monitoring period Still for the detected substances some of the questionable measurements were within the range of measured peak air concentrations ATSDR considered valid (highlighted or shaded in yellow) ATSDR considered these questionable peak air measurements useable for this public health evaluation though they were measured at the end or outside of the monitoring period
The first concern ATSDR had with the referenced information was the methodology used to measure hydrogen sulfide levels PA DEPrsquos Bureau of Laboratories selected an analytical method in which the reporting limits were relatively fine for most of the targeted substances that is the reporting limits (limits of quantification) were either in line with or marginally above the substancersquos regulatory limits
This was not however the case for hydrogen sulfide For the air measurements made the analytical methodrsquos reporting limit for hydrogen sulfide ranged from 1897 ppb to 9898 ppb Moreover PA DEPrsquos regulatory limit for hydrogen sulfide is an average air concentration of 100 ppb over a period of 1 hour (peak or brief exposures) and an average air concentration of 5 ppb over a period of 24 hours (daily exposure) implying these are maximum values that may not be exceeded (PA DEP 2008c) Assuming a method detection limit (MDL) of 1000 ppb the reporting limits are more than one order of magnitude (10 times) higher than the 1-hour regulatory limit of 100 ppb and two orders (200 times) higher than the 24-hour regulatory limit of 5 ppb
As evidenced by the number of odor complaints the public health effect of exposures at 100 ppb or more can be significant especially if levels exceed 2000 ppb (ie a level that could trigger transient health effects in those with asthma or in those with respiratory conditions) Peak levels of hyrdogen sulfide were detected twice (Table 16) at levels exceeding 2000 ppb 6 355 ppb and 8906 ppb No hourly averages of hydrogen sulfide are reported in Table 17 given that for each individual air measurement average reporting levels are below the reported detection limit (Note for hydrogen sulfide the H2S detection limits are greater than PA DEPrsquos 1-hr regulatory limit of 100 ppb) Whether the average H2S concentration could have been lower than 100 ppb (PA DEP 1-hr regulatory limit for hydrogen sulfide) is unknown however if H2S levels approach 100 ppb or lower the levels probably would not cause any adverse health effects in ATSDRrsquos judgment other than an unbearable odor that most residents would complain about
The latter sentences in the above paragraph are indicative of how governmental agencies may define the objective of an ambient air monitoring effort differently A monitoring effort conducted by a regulatory government agency such as PA DEP usually place emphasis on
17
identifying the odor source This objective helps the regulatory agency to cite who may be responsible if any violations were committed and how to remedy the situation PA DEP validated that the objective of the monitoring effort was limited to determining if the landfill was the source of the odors and to confirm that decomposition gasses from the landfill was also an additional source of odors (Tomayko 2009) Following such an objective would provide PA DEP and ERSI operators with the knowledge that implementing a gas management plan would achieve the goal of eliminating the source of the odors and properly managing landfill gases ATSDR (a public health agency) on the other hand is more concerned with health impacts and feels that the primary objective is to determine whether a toxic substance is released Moreover ATSDR is also concerned whether air levels may pose a fire or explosion hazard and whether the attained concentrations are of serious health concern The latter is important because in its review of operational data for the newly installed and repaired gas collection system ATSDR found out that hydrogen sulfide levels within the system (ie gas flow lines) ranged from 1500 ppm (1500000 ppb) to 2000 ppm (2000000 ppb) Scientific studies and observations have shown that H2S exposures presumably at and above 500 ppm (500000 ppb) can cause serious and irreversible health effects (ATSDR 2006b) No gas collection system was in place at the ERSI Landfill before December 2003 and portions of the original gas collection system at the Amity Landfill were in bad repair Because of dilution with ambient air whether unconfined levels of hydrogen sulfide reached or approached concentrations of serious health concern (ie the level of 500 ppm or greater) is unknown
Another unknown was the selection of sampling locations ATSDR feels that the selection should be based on fireexplosion hazard toxicity odor source landfill history landfill construction location of receptor populations and other area sources of contamination (For more information pertaining to sampling strategy and locations refer to Appendix E for ATSDRrsquos proposed guidelines on evaluating gases migrating from landfills) Noting the above objective PA DEP felt the sampling effort met the overall goal of identifying the problem taking immediate steps to correct the problem and providing post monitoring to confirm that the gas management controls were effective
PA DEP felt the sampling strategy used to make air measurements during the malodorous air releases in 2003 provided information that allowed them to support enforcement and get a gas management system installed to correct the odor problem ATSDR however felt the sampling effort provided limited information indicating that the highest or peak exposures probably approached levels near 9 ppm (9000 ppb) where studies have shown transientreversible health effects to occur
Landfill Emergency ResponseContingency Plan
ATSDR believes that during the malodorous air releases of 2003 when ERSI landfill operators experienced problems with uncontrollable and unbearable odors the necessary emergency response and contingency actions were not taken to alert and perhaps even evacuate the public A landfill emergency response and contingency plan was not in place for the landfill The belief was that the landfill would not generate a substantial amount of odors (ie only construction and demolition waste was collected) After the malodorous air releases operators installed a gas collection system to control and prevent landfill gases from migrating into the outlying residential communities PA DEP thus decided to revise the original landfill permit to include a
18
Nuisance Minimization and Control Plan This plan was finalized via a permit modification in February 22 2006 as imposed by PA DEPrsquos Waste Management Program (Tomayko 2006) The plan requires the landfill operators to comply with the prime directive of controlling odors and preventing the off-site migration of landfill gases while managing and maintaining the gas collection system The plan does not however list the emergency response contingency and community health actionsmdashif a substantial failure to the gas collection system were to occurmdashto mitigate or prevent likely exposures (eg residentialretail areas) to elevated levels of landfill gases The revised Nuisance Minimization and Control Plan may be adequate for odor control and minimizing minor odor effects but it should in no way be considered a substitute for an Emergency ResponseContingency Plan PA DEP regulations do require landfills to have emergency responsecontingency plans and such a plan exists for the ERSI Landfill (PA DEP 2009b Tomayko 1995) This plan is separate from the nuisance minimization plan referenced above (Tomayko 2009) Moreover ERSI operators have also submitted such a plan as part of its expansion application which is under review
When developing an Emergency Response Contingency Plan for a landfill ATSDR feels the plan should at least consider and include the following
List of target compounds monitored and whether these compounds present a fire or explosion hazard are toxic or can attain concentrations of health concern
List of corrective contingency and safetyhealth actions taken in the event an emergency or accident occurs at the landfill (eg fire explosion or substantial failure of the gas collection system)
Description of how first responders and other healthsafety authorities (eg PA DEP PA DOH county health department fire department police department) are notified and their collaborative response to address an emergency or accident at the landfill
Description of the tiered procedure of alerting and perhaps evacuating residents who live near the landfill
Conclusions
During the 2003 malodorous air releases spanning between September and December ATSDR classified the releases of landfill gases from the ERSI Landfill as a Past Public Health Hazard Peak exposures to hydrogen sulfide and sulfur dioxide could have made some residents of the surrounding community experience transient health effects (eg headaches nausea choking cough tearing of eyes aggravation of asthma) ATSDR considered however whether insofar as the public was concerned these health effects were considered reversible (ie whether the peak exposures could cause significant harm to health then or possibly in the future) Moreover post sampling after the malodorous air releases and upon completion of remediation efforts suggested that the exposures to landfill gases from the ERSI Landfill were significantly reduced and were considered No Apparent Public Health Hazard
19
During the Malodorous Period of 2003 Spanning between September and December
The peak levels of hydrogen sulfide (H2S) and sulfur dioxide (SO2) measured in the community adjacent to the ERSI Landfill presented a Past Public Health Hazard to exposed residents for short duration exposures
The levels of the remaining landfill gases notably methane (CH4) measured in the community adjacent to the ERSI Landfill were below levels expected to cause adverse health effects for short duration exposures Therefore ATSDR classified exposures to the remaining landfill gases from the ERSI Landfill as a No Apparent Public Health Hazard
Post Sampling after the 2003 Malodorous Air Releases
The levels of hydrogen sulfide measured in the community adjacent to the ERSI Landfill facility were below levels expected to cause adverse health effects thus ATSDR classified such exposures as No Apparent Public Health Hazard for short or long duration exposures
Recommendations
Environmental and Recycling Services Inc (ERSI) should
Initiate and implement a landfill emergency responsecontingency plan especially if granted a landfill expansion permit The contingencyemergency response plan should be a collaborative effort with the Commonwealth of Pennsylvania Department of Environmental Protection (PA DEP) the Pennsylvania Department of Health (PADOH) and other healthsafety authorities within the countycity while prompting community health actions to protect nearby residents from likely exposures (eg residentialretail areas) to elevated levels of landfill gases notably hydrogen sulfide (H2S) generated particularly from an uncontrolled or accidental release of gases at the landfill
Initiate and continue to maintain proper odor-management practices particularly when excavating and when altering landfill cover
Notify the PA DEP before commencing any work that will uncover large volumes of materials used for landfill cover or immediately following any substantial failure of the landfill gas-collection system
20
Authors
Primary Author
David S Sutton PhD PE Environmental Engineer Environmental Health Scientist Site Assessment Team Exposure Investigations and Site Assessment Branch Division of Health Assessment and Consultation Agency for Toxic Substances and Disease Registry
Secondary AuthorsTechnical Assists
Frank C Schnell PhD DABT Senior Toxicologist Exposure Investigations Team Exposure Investigations and Site Assessment Branch Division of Health Assessment and Consultation Agency for Toxic Substances and Disease Registry
Lourdes Guevara-Rosales MD Medical Officer Exposure Investigations Team Exposure Investigations and Site Assessment Branch Division of Health Assessment and Consultation Agency for Toxic Substances and Disease Registry
Reviewers
Susan Moore Chief Exposure Investigations and Site Assessment Branch Division of Health Assessment and Consultation Agency for Toxic Substances and Disease Registry
Peter Kowalski MPH CIH Lead Environmental Health Specialist Site Assessment Team Exposure Investigations and Site Assessment Branch Division of Health Assessment and Consultation Agency for Toxic Substances and Disease Registry
Ana Pomales Regional Representative Region III Division of Regional Operations Agency for Toxic Substances and Disease Registry
21
Wallace K Sagendorph JD Writer Editor National Center for Environmental Health
and Agency for Toxic Substances and Disease Registry
22
References
Agency for Toxic Substances and Disease Registry Site Review and Update Taylor Borough Dump Lackawanna County PA Atlanta US Department of Health and Human Services 1993 September 29
Agency for Toxic Substances and Disease Registry 1998 Toxicological profile for sulfur dioxide Atlanta US Department of Health and Human Services December
Agency for Toxic Substances and Disease Registry 1999 A panel study of acute respiratory outcomes Staten Island New York Atlanta US Department of Health and Human Services
Agency for Toxic Substances and Disease Registry 2001 Landfill gas primer an overview for environmental health professionals Atlanta US Department of Health and Human Services November
Agency for Toxic Substances and Disease Registry 2003 Empire Sanitary Landfill (aka Alliance Landfill) Health Consultation minus Public Comment Release Atlanta US Department of Health and Human Services August
Agency for Toxic Substances and Disease Registry 2004 Empire Sanitary Landfill (aka Alliance Landfill) Health consultation minus Final Release Atlanta US Department of Health and Human Services August
Agency for Toxic Substances and Disease Registry 2005 Public health assessment guidance manual Atlanta US Department of Health and Human Services
Agency for Toxic Substances and Disease Registry 2006a Toxicological profile for vinyl chloride Atlanta US Department of Health and Human Services July
Agency for Toxic Substances and Disease Registry 2006b Toxicological profile for hydrogen sulfide Atlanta US Department of Health and Human Services July
Agency for Toxic Substances and Disease Registry 2007 Toxicological profile for benzene Atlanta US Department of Health and Human Services August
Agency for Toxic Substances and Disease Registry 2008 Keyser Avenue Air Monitoring Station (aka Alliance Landfill) Health Consultation Atlanta US Department of Health and Human Services February
[ACGIHreg] American Conference of Governmental Industrial Hygienists 2008 TLVsreg and BEIsreg Cincinnati Ohio Publication 0108 ISBN 978-1-882417-79-7 Copyright copy 2008
Bellas R 2008 Operations Chief Northeast Regional Office PA DEP December 30 26 email to Tammi McCrae ATSDR Ana Pomales ATSDR William Tomayko PA DEP Debra Gable ATSDR Lora Werner ATSDR and Mark White PA DOH Subject Alliance Data
Bhambhani Y Burnham R Snydmiller G et al 1996 Effects of 10-ppm hydrogen sulfide inhalation on pulmonary function in health men and women J Occup Environ Med 381012shy1017
BOC Gases Material Safety Data Sheet ndash Carbonyl Sulfide Revised June 7 1996 Available at httpwwwvngascompdfg21pdf [accessed 2009 Aug 17]
23
Brosseau J Heitz M 1994 Trace gas compounds from municipal landfill sanitary sites Atmos Environ 28285ndash93
Cometto-Muntildeiz JE Cain WS Abraham MH Gola JMR 1999 Chemosensory detectability of 1shybutanol and 2-heptanone singly and in binary mixtures Physiol Behav 67(2)269ndash76
Conrad RE 2003 Chief Bureau of Laboratories ndash Mobile Laboratory Group PA DEP December 17 memorandum to Leonard Insalaco Emergency Response Program Manager North East Regional Office PA DEP
Falk H Steenland NK 1998 Vinyl chloride and polyvinyl chloride In Environmental and Occupational Medicine 3rd Ed edited by William N Rom Lippincott-Raven Publishers Philadelphia PA Chapter 93 pp 1251-59
[IM] Institute of Medicine 2000 Committee on the Assessment of Asthma and Indoor Air Clearing the air asthma and indoor air exposures Washington DC Division of Health Promotion and Disease Prevention
Jaumlppinen P Vikka V Marttila O et al 1990 Exposure to hydrogen sulphide and respiratory function Br J Intern Med 47824ndash28
Koenig JQ Pierson WE Horike M et al 1982 Effects of inhaled sulfur dioxide (SO2) on pulmonary function in healthy adolescents Exposure to SO2 + sodium chloride droplet aerosol during rest and exercise Arch Environ Health 375ndash9
The Merck Manual of Diagnosis amp Therapy 1992 Volume 1 General medicine Rahway NJ Merck Research Laboratories Division of Merck amp Co Inc p 1287ndash89
[MI DEQ] Michigan Department of Environmental Quality 2008 Air Pollution Control Rules - Part 2 Air Use Approvals (As Amended June 20 2008) R 3361232-Methodology for Determining Initial Threshold Screening Level (ITSL) Lansing MI Michigan Department of Environmental Protection Air Quality Division Available at httpwwwdeqstatemiusapcratsdeq-aqd-air-rules-apc-PART2htmR232 [accessed 2009 Jul 14]
[PA DEP] Pennsylvania Department of Environmental Protection 2008a Permits Licensing and Certification ndash Environment Facility Application Compliance Tracking System Harrisburg PA Commonwealth of Pennsylvania ndash Department of Environmental Protection Bureau of Air Quality Available at httpwwwahs2depstatepauseFactsWebdefaultaspx [accessed 2008 Dec 4]
[PA DEP] Pennsylvania Department of Environmental Protection 2008b Ambient Air Monitoring Data Reports Harrisburg PA Commonwealth of Pennsylvania ndash Department of Environmental Protection Bureau of Air Quality Available at httpwwwdepstatepausaq_appsaadata [accessed 2008 Sep 15]
[PA DEP] Pennsylvania Department of Environmental Protection 2008c Title 25 Environmental ProtectionndashChapter 131Ambient Air Quality Standards Section 1313 Harrisburg PA Available at httpwwwpacodecomsecuredata025chapter131chap131tochtml [accessed 2008 Sep 22]
24
[PA DEP] Pennsylvania Department of Environmental Protection 2009a News Release Commonwealth of Pennsylvania (for immediate release on 212006) DEP Denies ERSI Landfill Expansion Harrisburg PA Commonwealth of Pennsylvania ndash Department of Environmental Protection Bureau of Air Quality Available at httpwwwahs2depstatepausnewsreleasesdefaultaspID=3796ampvarQueryType=Detail [accessed 2009 Jul 1]
[PA DEP] Pennsylvania Department of Environmental Protection 2009b Title 25 Environmental ProtectionndashChapter 277ConstructionDemolition Waste Landfills Sections 277181 and 277301ndash277303 Harrisburg PA Available at httpwwwpacodecomsecuredata025chapter277chap277tochtml [accessed 2009 November 17]
[PADOH] Pennsylvania Department of Health October 1999 An Analysis of Cancer Incidence in Pennsylvania Counties 1992-1996 Harrisburg PA Available at httpwwwportalstatepausportalserverptopen=514ampobjID=596023ampmode=2 [accessed 2010 March 3]
[PADOH] Pennsylvania Department of Health June 2000 An Analysis of Cancer Incidence in Pennsylvania Counties 1993-1997 Harrisburg PA Available at httpwwwportalstatepausportalserverptopen=514ampobjID=596023ampmode=2 [accessed 2010 March 3]
[PADOH] Pennsylvania Department of Health August 2001 An Analysis of Cancer Incidence in Pennsylvania Counties 1994-1998 Harrisburg PA Available at httpwwwportalstatepausportalserverptopen=514ampobjID=596023ampmode=2 [accessed 2010 March 3]
[PADOH] Pennsylvania Department of Health July 2002 An Analysis of Cancer Incidence in Pennsylvania Counties 1995-1999 Harrisburg PA Available at httpwwwportalstatepausportalserverptopen=514ampobjID=596023ampmode=2 [accessed 2010 March 3]
[PADOH] Pennsylvania Department of Health August 2003 An Analysis of Cancer Incidence in Pennsylvania Counties 1996-2000 Harrisburg PA Available at httpwwwportalstatepausportalserverptopen=514ampobjID=596023ampmode=2 [accessed 2010 March 3]
[PADOH] Pennsylvania Department of Health July 2004 An Analysis of Cancer Incidence in Pennsylvania Counties 1997-2001 Harrisburg PA Available at httpwwwportalstatepausportalserverptopen=514ampobjID=596023ampmode=2 [accessed 2010 March 3]
[PADOH] Pennsylvania Department of Health August 2005 An Analysis of Cancer Incidence in Pennsylvania Counties 1998-2002 Harrisburg PA Available at httpwwwportalstatepausportalserverptopen=514ampobjID=596023ampmode=2 [accessed 2010 March 3]
25
[PADOH] Pennsylvania Department of Health September 2006 An Analysis of Cancer Incidence in Pennsylvania Counties 1999-2003 Harrisburg PA Available at httpwwwportalstatepausportalserverptopen=514ampobjID=596023ampmode=2 [accessed 2010 March 3]
[PADOH] Pennsylvania Department of Health July 2007 An Analysis of Cancer Incidence in Pennsylvania Counties 2000-2004 Harrisburg PA Available at httpwwwportalstatepausportalserverptopen=514ampobjID=596023ampmode=2 [accessed 2010 March 3]
[PADOH] Pennsylvania Department of Health November 2008 An Analysis of Cancer Incidence in Pennsylvania Counties 2001-2005 Harrisburg PA Available at httpwwwportalstatepausportalserverptopen=514ampobjID=596023ampmode=2 [accessed 2010 March 3]
[PADOH] Pennsylvania Department of Health November 2009 An Analysis of Cancer Incidence in Pennsylvania Counties 2002-2006 Harrisburg PA Available at httpwwwportalstatepausportalserverptopen=514ampobjID=596023ampmode=2 [accessed 2010 March 3]
Raabe GK Wong O 1996 Leukemia Mortality by Cell Type in Petroleum Workers with Potential Exposure to Benzene Environmental Health Perspectives (supl) 104(6) 1381-92
Rondinelli RCA Koenig L Marshall SG (1987) The effects of sulfur dioxide on pulmonary function in healthy nonsmoking male subjects aged 55 years and older Am Ind Hyg Assoc J 48 299-303
Schiffman SS Walker JM Dalton P Lorig TS Raymer JH Shusterman D Potential health effects of odor from animal operations waste water treatment and recycling of byproducts J Agromed 20007(1)7-81
Thrasher JD [first accessed 2006 Aug 28] Poison of the Month ndash Toxicology of Hydrogen Sulfide Available at httpwwwdrthrasherorgToxicology_of_Hydrogen_Sulfidehtml [last accessed 2009 Aug 17]
Tomayko W 1995 Acting Program Manager Waste Management Program PA DEP October 6 letter to Joseph Amity Environmental and Recycling Services Inc Re Issuance of Permit ndash Environmental and Recycling Services Inc ndash ID 100932 Taylor Borough Lackawanna County Pennsylvania
Tomayko W 2006 Program Manager Waste Management Program PA DEP February 22 letter to Patrice E Amity-Haan Environmental and Recycling Services Inc Re Major Permit Modification ndash ERSI Landfill Gas System Improvements amp Amity Landfill Gas SystemCap Improvements ndash ID 100932-A042 Taylor Borough Lackawanna County Pennsylvania
Tomayko W 2008 Program Manager Waste Management Program PA DEP February 26 email to Ana Pomales ATSDR Division of Regional Operations
Tomayko W 2009 Program Manager Waste Management Program PA DEP November 12 email to Ana Pomales ATSDR Division of Regional Operations Subject ERSI Landfill hellip
26
[USEPA] US Environmental Protection Agency 2008 Integrated Science Assessment (ISA) for Sulfur Oxides ndash Health Criteria (Final Report) Washington DC Office EPA600R-08047F
[USEPA-IRIS] US Environmental Protection Agency Integrated risk information system Cincinnati Office of Health and Environmental Assessment Environmental Criteria and Assessment Office Available at httpwwwepagoviriswebpirissubst0061htm [accessed 2008 Jul 16]
Williamson DM 2006 Studies of multiple sclerosis in communities concerned about environmental exposures J Womenrsquos Health 15(7)810ndash14
[WI DNR] Michigan Department of Natural Resources 2000 Understanding Wisconsins Hazardous Air Pollutant Rules amp Requirements Madison WI Wisconsin Department of Natural Resources Air Management Program Available at httpdnrwigovairpdfunderstandingHAPspdf [accessed 2009 Jul 14]
27
APPENDIX A
Comparison Values
ATSDR comparison values (CVs) are media-specific concentrations considered safe under default conditions of exposure They are used as screening values in selecting site-specific chemicals or substances for further evaluation of their public health implications Generally a substance is selected for further public health evaluation because its maximum concentration in air water or soil at the site exceeds at least one of ATSDRs CVs This approach is conservative by design ATSDR may also select detected chemicals or substances for further public health evaluation and discussion because ATSDR has no CVs or because the community has expressed special concern about the substance whether it exceeds CVs or not
CVs are not thresholds of toxicity While concentrations at or below the relevant CV are generally considered to be safe it does not automatically follow that any environmental concentration that exceeds a CV would be expected to produce adverse health effects In fact the whole purpose behind highly conservative health-based standards and guidelines is to enable health professionals to recognize and resolve potential public health problems before they become actual health hazards For that reason ATSDRrsquos CVs are typically designed to be 1 to 3 orders of magnitude lower (ie 10 to 1000 times lower) than the corresponding noshyobserved-adverse-effect levels (NOAEL) or lowest-observed-adverse-effect levels (LOAEL) on which they are based The probability that adverse health outcomes will actually occur depends not on environmental concentrations alone but on several additional factors including site-specific conditions of exposure and individual lifestyle and genetic factors that affect the route magnitude and duration of actual exposures
Listed below are the abbreviations for selected CVs and units of measure used within this public health document for peak and short-term exposures to substances in the air Following this list of abbreviations are more complete descriptions of the various comparison values used within this public health document
AAC = Acceptable Ambient Concentration
AAL = Ambient Air Limit
ASIL = Acceptable Source Impact Level
AEGL = Acute Exposure Guideline Level
EMEG = Environmental Media Evaluation Guide
EPRG = Emergency Response Planning Guideline
HAAS = Hazardous Ambient Air Standard
IDLH = Immediately Dangerous to Life and Health
ITSL = Initial Threshold Screening Level
LC50 = Lethal Concentration(50)
LD50 = Lethal Dose(50)
LOAEL = Lowest-Observed-Adverse-Effect Level
MRL = Minimal Risk Level
NOAEL = No-Observed-Adverse-Effect Level
29
OEL = Occupational Exposure Limit
PEL = Permissible Exposure Limit
REL = Recommended Exposure Limit
RfC = Reference Concentration
RfD = Reference Dose
TLV-C = Threshold Limit ValuendashCeiling
TLV-STEL = Threshold Limit ValuendashShort-Term Exposure Limit
TLV-TWA = Threshold Limit ValuendashTime Weighted Average
Units of Measure
ppm = parts per million [eg mgL (water) mgkg (soil)]
ppb = parts per billion [eg microgL (water) microgkg (soil)]
kg = kilogram (1000 grams)
mg = milligram (0001 gram)
microg = microgram (0000001 gram)
L = liter (1000 mL or 1057 quarts of liquid or 0001 m3 of air)
m3 = cubic meter (a volume of air equal to 1000 liters)
Two CVs or exposure limits commonly used by ATSDR for assessing the public health implications due to acute (short-term) domestic (residential) exposures from substances within the air are listed below
Environmental Media Evaluation Guides (EMEGs) are media-specific concentrations that are calculated from ATSDRs Minimal Risk Levels by factoring in default body weights and ingestion rates Different EMEGs are calculated for adults and children as well as for acute (lt14 days) intermediate (15-364 days) and chronic (gt 365 days) exposures
Minimal Risk Levels (MRLs) are ATSDR estimates of daily human exposures to a chemical that are unlikely to be associated with any appreciable risk of deleterious noncancer effects over a specified duration of exposure MRLs are calculated using data from human and animal studies and are reported for acute (lt 14 days) intermediate (15-364 days) and chronic (gt 365 days) exposures MRLs for oral exposure (ie ingestion) are doses and are typically expressed in mgkgday Inhalation MRLs are concentrations and are typically expressed in either parts per billion (ppb) or microgm3 The latter are identical to ATSDRrsquos EMEGs for airborne contaminants ATSDRrsquos MRLs are published in ATSDR Toxicological Profiles for specific chemicals
More and more governmental departments (local state and federal) businesses corporations health offices hospitals and professionalnon-profit organizations are becoming involved with emergency preparedness and response activities Thus some of these entities started developing guidelines or exposure limits for responding to potential releases of airborne substances for use in emergency response planning One such exposure limit has been developed by the Environmental Protection Agency (EPA) and is called the Acute Exposure Guideline Level (AEGL) which is described below Another emergency response exposure limit is termed the Emergency Response Planning Guideline (ERPG) This emergency response exposure limit was
30
developed by the American Industrial Hygiene Association (AIHA) and will be described later on within Appendix A
Acute Exposure Guideline Level (AEGL) represents a threshold exposure limit for the general public and is applicable to emergency exposure periods ranging from 10 minutes to 8 hours (ie peak and short-term exposures) AEGL-1 AEGL-2 and AEGL-3 values will be developed for each of five exposure periods (10 and 30 min 1 hr 4 hr and 8 hr) and will be distinguished by varying degrees of severity of toxic effects It is believed that the recommended exposure levels are applicable to the general population including infants and children and other individuals who may be susceptible The three AEGL values are defined as follows
AEGL-1 is the airborne concentration (expressed as parts per million or milligrams per cubic meter (ppm or mgm3)) of a substance above which it is predicted that the general population including susceptible individuals could experience notable discomfort irritation or certain asymptomatic non-sensory effects However the effects are not disabling and are transient and reversible upon cessation of exposure
AEGL-2 is the airborne concentration (expressed as ppm or mgm3) of a substance above which it is predicted that the general population including susceptible individuals could experience irreversible or other serious long-lasting adverse health effects or an impaired ability to escape
AEGL-3 is the airborne concentration (expressed as ppm or mgm3) of a substance above which it is predicted that the general population including susceptible individuals could experience life-threatening health effects or death
Airborne concentrations below the AEGL-1 represent exposure levels that can produce mild and progressively increasing but transient and non-disabling odor taste and sensory irritation or certain asymptomatic non-sensory effects With increasing airborne concentrations above each AEGL there is a progressive increase in the likelihood of occurrence and the severity of effects described for each corresponding AEGL Although the AEGL values represent threshold levels for the general public including susceptible subpopulations such as infants children the elderly persons with asthma and those with other illnesses it is recognized that individuals subject to unique or idiosyncratic responses could experience the effects described at concentrations below the corresponding AEGL
The following CVs or exposure limits are used at the workplace to protect workers from potential harmful exposures that may impair their health or functional capacity throughout their entire career or work life In keeping a proper perspective ambient air levels measured in domestic settings outside of the workplace are sometimes compared to these occupational exposure limits (OELs) If such domestic air levels exceed these OELs this may require that appropriate health actions be implemented or taken
Permissible Exposure Limit (PEL) is an 8-hour time-weighted average concentration or occupational exposure limit (OEL) of a substance in workplace air designed by the Occupational Safety and Health Administration (OSHA) to assure to the extent feasible that chemical exposures in the workplace do not impair the health or functional capacity of
31
workers throughout their working life The PEL may be exceeded for brief periods but the sum of the exposure levels averaged over 8 hours must not exceed the PEL
Recommended Exposure Limit (REL) is similar to a PEL since it is developed for the workplace air exposures however the REL is designed by the National Institute for Occupational Safety and Health (NIOSH) and based on a time-weighted average (TWA) for up to a 10 hour workday during a 40-hour work week Moreover a PEL is regulatory and legally enforceable while a REL is not RELs are also grouped into two subclasses similar to Threshold Limit Values (TLVs) as established by the American Conference of Governmental Industrial Hygienists (ACGIHreg) to consider short-term and peak exposures These REL subclasses are Short-Term Exposure Limit (STEL) and Ceiling (C)
Immediately Dangerous to Life and Health (IDLH) is an airborne concentration as established by the National Institute for Occupational Safety and Health (NIOSH) from which a worker could escape without injury or irreversible health effects from an IDLH exposure in the event of the failure of respiratory protection equipment The IDLH was considered a maximum concentration above which only a highly reliable breathing apparatus providing maximum worker protection should be permitted In determining IDLH values NIOSH considered the ability of a worker to escape without loss of life or irreversible health effects along with certain transient effects such as severe eye or respiratory irritation disorientation and in-coordination which could prevent escape As a safety margin IDLH values are based on effects that might occur as a consequence of a 30-minute exposure However the 30-minute period was not meant to imply that workers should stay in the work environment any longer than necessary in fact every effort should be made to exit immediately
Threshold Limit ValuendashTime Weighted Average (TLV-TWA) according to the American Conference of Governmental Industrial Hygienists (ACGIHreg) is the time-weighted average (TWA) concentration or occupational exposure limit (OEL) of a substance for a normal 8shyhour workday and a 40-hour workweek to which nearly all workers may be repeatedly exposed day after day without adverse effect Many of ACGIHs TLVs were adopted by OSHA for use as PELs
Threshold Limit ValuendashShort-Term Exposure Limit (TLV-STEL) according to the American Conference of Governmental Industrial Hygienists (ACGIHreg) is a 15-minute time weighted average (TWA) exposure limit of a substance that should not be exceeded at any time during a workday even if the 8-hour TWA is within the Threshold Limit ValuendashTime-Weighted Average (TLV-TWA) Exposure Limit The TLV-STEL is the concentration or occupational exposure limit (OEL) to which it is believed that workers can be exposed continuously for a short period of time without suffering from 1) irritation 2) chronic or irreversible tissue damage 3) dose-rate-dependent toxic effects or 4) narcosis of sufficient degree to increase the likelihood of accidental injury impaired self-rescue or materially reduced work efficiency The TLV-STEL will not necessarily protect against these effects if the daily TLV-TWA is exceeded The TLV-STEL is not a separate independent exposure guideline rather it supplements the TLV-TWA where there are recognized acute effects from a substance whose toxic effects are primarily of a chronic nature Exposures above the TLV-TWA up to the TLV-STEL should be less than 15 minutes should occur not more than four times per day and there should be at least 60 minutes between successive exposures in
32
this range An averaging period other than 15 minutes may be recommended when this is warranted by observed biological effects
Threshold Limit ValuendashCeiling (TLV-C) according to the American Conference of Governmental Industrial Hygienists (ACGIHreg) is the concentration or occupational exposure limit (OEL) of a substance that should not be exceeded during any part of the working exposure If instantaneous measurements are not available sampling should be conducted for the minimum period of time sufficient to detect exposures at or above the ceiling value ACGIHreg believes that TLVsreg based on physical irritation should be considered no less binding than those based on physical impairment There is increasing evidence that physical irritation may initiate promote or accelerate adverse health effects through interaction with other chemical or biologic agents or through other mechanisms
TLVs and PELs which were designed to protect healthy workers are usually much higher than the health-based values of ATSDR and EPA which were designed to protect the health of the general population including the very young and the elderly ATSDR does not base any of its community health decisions solely or primarily on TLVs or PELs but these and other non-ATSDR values may be referred to in Public Health Assessments or consultations as a means of providing the reader with an expanded and perhaps more meaningful perspective on the concentrations of chemicals or substances detected at a site
The American Industrial Hygiene Association (AIHA) is a scientific organization concerned with environmental exposures to toxic airborne substances within the workplace AIHA also has developed an emergency response exposure limit Emergency Response Planning Guideline (EPRG) similar to the AEGL as derived by EPA ERPG values are intended to provide estimates of concentration ranges in air where one reasonably might anticipate observing adverse effects as a consequence of exposure to a specific substance ERPG values are based on OELs (eg PELs RELs TLVs etc) being rationally lowered upon internal review of appropriate scientific studies to exposure limits considered protective of nearly all individuals within certain domestic settings subjected to a specific emergency response situation The AIHA has provided guidance on the utilization of three exposure limits each defined and briefly discussed below
ERPG-1 The maximum airborne concentration below which it is believed that nearly all individuals could be exposed for up to one hour without experiencing other than mild transient adverse health effects or without perceiving a clearly defined objectionable odor The ERPG-1 identifies a level which does not pose a health risk to the community but which may be noticeable due to slight odor or mild irritation In the event that a small non-threatening release has occurred the community could be notified that they may notice an odor or slight irritation but that concentrations are below those which could cause unacceptable health effects
ERPG-2 The maximum airborne concentration below which it is believed that nearly all individuals could be exposed for up to one hour without experiencing or developing irreversible or other serious health effects or symptoms which could impair an individuals ability to take protective action Above the ERPG-2 there may be significant adverse health effects signs or symptoms for some members of the community which could impair an individuals ability to take protective action These effects might include severe eye or
33
respiratory irritation muscular weakness CNS impairments or serious adverse health effects
ERPG-3 The maximum airborne concentration below which it is believed that nearly all individuals could be exposed for up to one hour without experiencing or developing life-threatening health effects The ERPG-3 level is a worst-case planning level above which there is the possibility that some members of the community may develop life threatening health effects This guidance level could be used to determine the airborne concentration of a chemical that could pose life threatening consequences should an accident occur This concentration could be used in planning stages to project possible levels in the community Once the distance from the release to the ERPG-3 level is known the steps to mitigate the potential for such a release can be established
AIHA recognizes (and should be remembered by all who make use of these values) that human responses do not occur at precise exposure levels but can extend over a wide range of concentrations The values derived for ERPGs should not be expected to protect everyone but should be applicable to most individuals in the general population In all populations there are hypersensitive individuals who will show adverse responses at exposure concentrations far below levels where most individuals normally would respond Furthermore since these values have been derived as planning and emergency response guidelines not exposure guidelines they do not contain the safety factors normally incorporated into exposure guidelines Instead they are estimates by the AIHA of the thresholds above which there would be an unacceptable likelihood of observing the defined effects The estimates are based on the available data that are summarized in the documentation In some cases where the data are limited the uncertainty of these estimates is large Users of the ERPG values are encouraged strongly to review carefully the documentation before applying these values
In developing these ERPGs human experience has been emphasized to the extent data are available Because however this type of information is rarely available and when available is only for low level exposures animal exposure data most frequently forms the basis for these values The most pertinent information is derived from acute inhalation toxicity studies that have included clinical observations and histopathology The focus is on the highest levels not showing the effects described by the definitions of the ERPG levels Next data from repeat inhalation exposure studies with clinical observations and histopathology are considered Following these in importance are the basic typically acute studies where mortality is the major focus When inhalation toxicity data are either unavailable or limited data from studies involving other routes of exposure will be considered More value is given to the more rigorously conducted studies and data from short-term studies are considered to be more useful in estimating possible effects from a single 1-hr exposure Finally if mechanistic or dose-response data are available these are applied on a case by case basis as appears appropriate
It is recognized that there is a range of times that one might consider these guidelines however it was AIHAs decision to focus its efforts on only one time period This decision was based on the availability to toxicology information and a reasonable estimate for an exposure scenario Users who may choose to extrapolate these values to other time periods are cautioned to review the documentation fully since such extrapolations tend to hold only over very limited time frames it at all
34
Environmental health departments of some state governments sometimes use OELs (eg PELs RELs TLVs etc) as a source for deriving peak and short-term ambient air standards by subjecting them to specified reduction factors These reduction factors may account for several factors including 1) TLVs are premised on an 8-hour work-day and 5-day work week while ambient standards are premised on continuous exposure for a lifetime 2) TLVs are premised on a worker population that is relatively more healthy than the general population and 3) generic application of ldquosafety factorsrdquo are utilized in its formulation Reduction factors for various states could possibly range from 110 to 14200 The various reduction factors employed by the states were all designed via a rational regulatory process integrated with health-based considerations in mind A tabular listing below shows the peak and short-term ambient air standards for five different states used within this public health document Each of these peak and short-term standards are defined and briefly discussed following the tabular listing
Peak amp Short-Term Air Standards of Five Different States
State Reduction Factor (RF) RF ndash Citation
R 3361232 (c) Michigan ITSL 1100 httpwwwmichigangovdocumentsde
q-aqd-toxics-toxicsrules_117404_7doc
Env-A-1400 New Hampshire AAL 1(24 to 420) httpwwwdesstatenhusrulesenv-
a1400pdf
Vermont HAAS 1(42 420 or 4200) section 5-261 appendix D (accumulation and or httpwwwanrstatevtusairdocsapcr uncertainty factors) 1(10 100 or 1000) egspdf
WAC 173-460 Washington ASIL 1300 httpwwwecywagovpubswac17346
0pdf
Wisconsin AAC (1-hr or 24-hr)
1(10 to 42) NR 44504 amp 05 httpwwwlegisstatewiusrsbcodenr nr445pdf
Initial Threshold Screening Level (ITSL) Michiganrsquos Department of Environmental Quality health based screening level for non-carcinogenic effects of a toxic air contaminant It is determined by a number of different formulas or equations depending upon the available toxicological data (RfC RfD OEL NOAEL LOAEL LC50 and LD50) Rule 232 specify a hierarchy of these formulas for determining the ITSL The ITSL is set for three distinctive time-weighted averages (TWAs) of exposure that is dependent upon the available toxicological data 1) 1 hour 2) 8 hours 3) 24 hours or 4) 365 days (annual) In the interest of public health the ITSL should not be exceeded for the designated TWA
Ambient Air Limit (AAL) is a concentration limit of a toxic air pollutant not to be exceeded in the ambient air as set by the New Hampshire Department of Environmental Services It is intended to provide public health protection over a time-weighted average (TWA) of exposure (ie for the designated TWA and the interest of public health the AAL should not
35
be exceeded) Depending upon the substance available toxicological data and the method used to calculate the AAL the time-weighted average of exposure can be for a twenty-four (24) hour exposure or exposures up to 365 days in one year (annual)
Hazardous Ambient Air Standard (HAAS) means the highest acceptable concentration in the ambient air of a hazardous air contaminant as set by the Vermont Department of Environmental Conservation The HAASs are designed to be protective of public health for an assumed time-weighted average (TWA) of exposure (ie for the designated TWA and the interest of public health the HAAS should not be exceeded) Depending upon the substance available toxicological data and the method used to calculate the HAAS the time-weighted average of exposure can be for a twenty-four (24) hour exposure or exposures up to 365 days in one year (annual)
Acceptable Source Impact Level (ASIL) means the highest acceptable concentration of a toxic air pollutant in the outdoor atmosphere in any area which does not have restricted or controlled public access that is used to evaluate the air quality impacts of a single source There are three types of acceptable source impact levels risk-based threshold-based and special Concentrations for these three types of ASILs are determined by several methods as approved by the Washington Department of Ecology The ASILs are designed to be protective of public health for an assumed time-weighted average (TWA) of exposure (ie for the designated TWA and the interest of public health the ASIL should not be exceeded) Depending upon the substance available toxicological data and the method used to calculate the ASIL the time-weighted average of exposure can be for a twenty-four (24) hour exposure or exposures up to 365 days in one year (annual)
Acceptable Ambient Concentration (AAC) means the highest acceptable concentration of a toxic air pollutant in the outdoor atmosphere that is used to evaluate the air quality impacts of an emission source(s) AACs are health-based air standards and are described in Chapter NR 445 of the Wisconsinrsquos Department of Natural Resources regulatory code The AACs are set at levels designed to be protective of public health for an assumed time-weighted average (TWA) of exposure (ie for the designated TWA and the interest of public health the AAC should not be exceeded) Depending upon the substance available toxicological data and the method used to calculate the AAC the time-weighted average of exposure can be for a one (1) hour exposure twenty-four (24) hour exposure or exposures up to 365 days in one year (annual)
Listed below are some health-based guidelines commonly referenced in dose-response studies (eg toxicological epidemiological etc) that were used in the derivation of some of the above health-based standards
Lethal Concentration(50) (LC50) is a calculated concentration of a chemical in air to which exposure for a specific length of time is expected to cause death in 50 of a defined experimental animal population
Lethal Dose(50) (LD50) is the dose (intake per body weight) of a chemical which has been calculated to cause death in 50 of a defined experimental animal population
Lowest-Observed-Adverse-Effect Level (LOAEL) is the lowest exposure level of a chemical in a study or group of studies that produces statistically or biologically significant
36
increases in frequency or severity of adverse effects between the exposed population and its appropriate control
No-Observed-Adverse-Effect Level (NOAEL) is the dose of a chemical at which there were no statistically or biologically significant increases in frequency or severity of adverse effects seen between the exposed population and its appropriate control Effects may be produced at this dose but they are not considered to be adverse
Reference Concentration (RfC) is an estimate (with uncertainty spanning perhaps an order of magnitude or more) of a continuous inhalation exposure to the human population (including sensitive subgroups) that is likely to be without an appreciable risk of deleterious non-cancer health effects during a lifetime The inhalation reference concentration is for continuous inhalation exposures and is appropriately expressed in units of mgm3 or ppm
Reference Dose (RfD) is an estimate (with uncertainty spanning perhaps an order of magnitude or more) of the daily exposure of the human population to a potential hazard that is likely to be without risk of deleterious non-cancer health effects during a lifetime The RfD is operationally derived from the no-observed-adverse-effect level (NOAEL-from animal and human studies) by a consistent application of uncertainty factors that reflect various types of data used to estimate RfDs and an additional modifying factor which is based on a professional judgment of the entire database on the chemical The RfDs are for continuous daily exposures and are appropriately expressed in units of mgkgday
Screening Rationale Used to Select Substances for Further Public Health Analysis
After potential exposure pathways are considered the next step in any environmental health analysis or assessment process is the application of conservative screening values (ie comparison values) to the available sampling data (ATSDR 2005) This phase of the process helps to rule out any site-specific substances that would not pose a public health hazard under almost any plausible exposure scenario The substances remaining after the preliminary screen would require in-depth public health analyses to evaluate their potential for causing adverse health effects under site-specific exposure conditions (ATSDR 2005) During this final phase or step (ie in-depth public health analysis) of the environmental health assessment process potential public health implications are identified Toxic exposures are not identified under the preliminary screening phase it merely eliminates obviously nontoxic exposures This allows environmental health scientists when assessing public health implications to focus on a reduced list of substances
When selecting an environmental guideline for use in environmental health assessments ATSDR environmental health scientists normally follow ATSDRs general hierarchy as shown in Figure 6 Environmental guidelines listed under Hierarchy 1 are usually chosen first given that the guidelines are based on ATSDR analyses of substance-specific toxicity data
In the absence of these values Hierarchy 2 environmental guidelines may be chosen These are either based on ATSDR analyses of substance-specific toxicity data not used in Hierarchy 1 (eg intermediate exposures of 15ndash365 days) or on US EPA analyses of the substance-specific toxicity data If substance-specific guidelines are absent for Hierarchies 1 and 2 environmental guidelines in Hierarchy 3 may be chosen
37
Finally in some cases the environmental guidelines listed in the ATSDR hierarchy are simply unavailable Other sources are then considered in choosing environmental guidelines to conduct the environmental health assessment For example other governmental agencies (federal state and tribal agencies) may require that their environmenthealth departments meet specified public health mandates by developing their own guidelines These environmental guidelines may address hazardous substances in water soil air fish or other biota
For screening purposes typically the environmental guideline with the lowest concentration level and that is most consistent with conditions at or near the site is selected ATSDR environmental health scientists must sometimes select the environmental guideline that best applies to site conditions in terms of time frames and potentially exposed populations The following exposure elements may sometimes lead environmental health scientists to move away from the hierarchy listed in Figure 6 nevertheless consideration of these exposure elements tends to help select the most appropriate CVs for screening
Exposure duration When selecting the most appropriate environmental guideline exposure duration is an essential consideration A one-time exposure to a high contaminant concentration may result in different health effects than would a repeated exposure to a lower contaminant concentration As noted ATSDR has developed EMEGs that apply to acute (14 days or less) intermediate (15ndash365 days) and chronic (365 days or more) exposures Comparison values developed by other organizations may apply to acute intermediate or chronic exposures or to all three
Site-specific exposure conditions In some instances the most conservative environmental guideline may not be the most appropriate screening value Of critical importance in conducting environmental health assessments is selecting environmental guidelines most appropriate and applicable to site-specific conditions Exposures identified at the site should closely approximate the exposure assumptions used to derive the environmental guideline For example including a soil contaminant for further evaluation based on a comparison value for a child would be inappropriate if the contaminant is found in a restricted industrial site where children are prohibited Also past current and potential future exposure conditions must be borne in mind
For this environmental health analysis or evaluation a substance was initially selected for in-depth public health analysis if its maximum detected level in air exceeded its most relevant air comparison value (CV) (See Appendix A for a description of the air comparison values used in this environmental health analysis and their interpretation) Using all of the CVs or environmental guidelines established for air exposures that ATSDR considers protective of public health the most relevant air CV is chosen through a hierarchical or ranked arrangement similar to that in Figure 6 (in Appendix C) ATSDR environmental health scientists then developed a hierarchical screening process for selectingmdashin terms of time frames and populations that might be exposedmdashthe most appropriate environmental guideline that best applies to conditions at the ERSI Landfill (see Figures 7 and 8 in Appendix C) Even if through this screening process no relevant air CV exists for a particular substance the substance is still selected for in-depth public health analysis
38
Following the initial screening the detected air concentration(s) is further utilized to interpret whether site-specific exposures to the selected substance(s) pose any potential concern to public health Conducting an in-depth analysis of chemicals or substances selected for further public health analysis is the final step of the environmental health assessment process
39
APPENDIX B Tables
41
TABLE 1 GCMS Sampling Results
Tuesday - November 18 2003
Sample Time Compounds Identified LOC 2 1255 PM Dichlorofluoromethane Trichloromonofluoromethane 11-Dichloro-1shy
fluoroethane Dimethyl Sulfide Toluene Ethylbenzene one Xylene isomer -Pinene Camphene two C4-Substituted benzenes and eighteen Hydrocarbons in the range of C5 to C10
LOC 1 200 PM Dichlorofluoromethane Trichloromonofluoromethane 11-Dichloro-1shyfluoroethane -pinene one C4-Substituted benzene Limonene and four Hydrocarbons in the range of C5 to C6
LOC 4 245 PM Five Hydrocarbons in the range of C5 to C9
LOC 3 340 PM None LOC 1 437 PM Trichloromonofluoromethane 11-Dichloro-1-fluoroethane -Pinene
one C4-Substituted benzene and seven Hydrocarbons in the range of C5 to C6
LOC 2 524 PM Dichlorofluoromethane Trichloromonofluoromethane 11-Dichloro-1shyfluoroethane Toluene one Xylene isomer -Pinene Camphene two C4-Substituted benzenes Limonene and nine Hydrocarbons in the range of C5 to C7
LOC 4 605 PM Five Hydrocarbons in the range of C5 to C6 and one C10 Hydrocarbon
LOC 3 740 PM 11-Dichloro-1-fluoroethane and one Xylene isomer LOC 1 850 PM Dichlorofluoromethane Trichloromonofluoromethane 11-Dichloro-1shy
fluoroethane -Pinene Camphene and seven Hydrocarbons in the range of C5 to C6
LOC 2 1015 PM Dichlorofluoromethane Trichloromonofluoromethane 11-Dichloro-1shyfluoroethane Toluene -Pinene one C4-Substituted benzene and four Hydrocarbons in the range of C5 to C7
LOC 3 1120 PM Three Hydrocarbons in the range of C5 to C7
Landfill Ambient
511 PM None
Landfill Ambient
634 PM None
Landfill Ambient
920 PM Trichloromonofluoromethane and Dipropyl 12-benzenedicarboxylate
Tentative identification was made of the listed compound As a result of the environmental interference surrounding the target compound peak a true and accurate conclusion could not be ascertained hence the compound is listed with a cautionary identification
43
TABLE 2 GCMS Sampling Results
LOC 2
LOC 3 18 ROS Landfill Ambient Landfill Ambient Landfill Ambient Landfill Ambient
Sample LOC 2 LOC 3
Landfill Ambient
1218 PM None
Landfill Ambient
1922 PM None
Wednesday - November 19 2003
Sample Time LOC 1 1258 PM
510 PM None 845 PM None 1216 PM None
LOC 4 430 PM None LOC 2 600 PM None LOC 3 810 PM Ethylbenzene and one Xylene isomer LOC 2 945 PM Dichlorofluoromethane one C4-Substituted benzene and Limonene
Compounds Identified Dichlorofluoromethane Trichloromonofluoromethane 11-Dichloro-1shyfluoroethane -pinene and four Hydrocarbons in the range of C5 to C6
Compounds Identified
210 PM
137 PM None
359 PM None
738 PM None
Thursday - November 20 2003
Time 235 PM Diphenylamine 320 PM Ethylbenzene one Xylene isomer and one C7 Hydrocarbon
Dichlorofluoromethane Trichloromonofluoromethane 11-Dichloro-1shyfluoroethane Toluene -Pinene Camphene one C4-Substituted benzene Limonene and thirteen Hydrocarbons in the range of C5 to C8
Tentative identification was made of the listed compound As a result of the environmental interference surrounding the target compound peak a true and accurate conclusion could not be ascertained hence the compound is listed with a cautionary identification
44
TABLE 3 GCMS Sampling Results
Monday - December 1 2003
Sample Time Compounds Identified LOC 5 100 PM Trichloromonofluoromethane and one C5 Hydrocarbon
LOC 2 200 PM None 426 Powell 235 PM None LOC 3 435 PM One Xylene isomer LOC 4 535 PM One Xylene isomer and sixteen Hydrocarbons in the range of C5 to C11
LOC 2 700 PM Trichloromonofluoromethane 11-Dichloro-1-fluoroethane Trichloroethylene Toluene two Xylene isomers -Pinene one C4-Substituted benzene Limonene and nine Hydrocarbons in the range of C5 to C7
LOC 5 750 PM None Landfill Ambient
410 PM None
Landfill Ambient
619 PM None
Tuesday - December 2 2003
Sample Time Compounds Identified LOC 5 1055 AM Two Hydrocarbons in the range of C5 to C6
505 Powell 1150 AM One C4-Substituted benzene Limonene and Diphenylamine
752 S Main
105 PM None
LOC 2 235 PM None 508 Powell 400 PM None LOC 3 513 PM None 508 Powell 630 PM None LOC 5 750 PM None Landfill Ambient
935 PM None
Landfill Ambient
225 PM Toluene
Landfill Ambient
704 PM Trichloromonofluoromethane
Tentative identification was made of the listed compound As a result of the environmental interference surrounding the target compound peak a true and accurate conclusion could not be ascertained hence the compound is listed with a cautionary identification
45
TABLE 4 GCMS Sampling Results
Wednesday - December 3 2003
Sample Time Compounds Identified LOC 2 1025 PM None 501 Powell 1110 PM None LOC 5 1210 PM One C5 Hydrocarbon and one C4-Substituted benzene
LOC 4 100 PM Three Hydrocarbons in the range of C5 to C7 and one C10 Hydrocarbon
ELEMSCH 245 PM None 752 Main 315 PM None 505 Powell 430 PM None Turnpike 600 PM None LOC 3 720 PM None Turnpike 820 PM None Landfill Ambient
902 AM None
Landfill Ambient
1020 AM None
Thursday - December 4 2003
Sample Time Compounds Identified 511 Hicko 945 AM None LOC 5 1040 AM Limonene LOC 2 1215 PM Limonene LOC 3 110 PM None Union 145 PM None LOC 5 315 PM Trichloromonofluoromethane Toluene one C4-Substituted benzene
Limonene and three Hydrocarbons in the range of C5 to C7 Union 353 PM Limonene LOC 4 455 PM Ethylbenzene one Xylene isomer and ten Hydrocarbons in the range of C5
to C8 and one C11 Hydrocarbon 2 ROSEV 605 PM Toluene and one Xylene isomer I 476 708 PM None Landfill Ambient
913 AM None
Landfill Ambient
139 PM None
Tentative identification was made of the listed compound As a result of the environmental interference surrounding the target compound peak a true and accurate conclusion could not be ascertained hence the compound is listed with a cautionary identification
46
TABLE 5 TAGA IIE Sampling Results
Tuesday - November 18 2003
Sample Time Compounds Tentatively Identified LOC2 1255pm Butanol Propyleneglycol Pyrocatechol LOC1 200pm Butanol 15-Pentanediol LOC4 245pm Propylene glycol 23-Butanedione LOC3 340pm 2-Methyl-1-butanol LOC1 437pm 2-Methyl-3-butyne-2-ol 15-Pentanediol LOC2 524pm 2-Methyl-3-butyne-2-ol Pentanal LOC4 605pm None LOC3 740pm None LOC1 850pm None LOC2 1055pm None LOC3 1120pm Acetol Landfill Ambient
1220pm None
Landfill Ambient
230pm None
Wind direction was from the South averaging 5 mph At 420 pm the winds shifted to the east averaging 5 mph and then shifted back to the south at 900 pm averaging 8 mph for the remainder of the sampling session
No compounds could be identified from the spectra for the Landfill Ambient samples collected at 130 pm 330 pm 430 pm 530 pm 630 pm 730 pm 830 pm 930 pm 1030 pm and 1130 pm
Wednesday shy November 19 2003
Sample Time Compounds Tentatively Identified LOC1 1258pm None LOC2 210pm Acetol LOC3 510pm None 18 ROS 845 PM None Landfill Ambient
1200pm None
Landfill Ambient
400pm None
Landfill Ambient
800pm None
Wind direction was from the South averaging 17 mph from 1200 pm until 400 pm when the Met tower was put down due to bad weather
No compounds could be identified from the spectra for the Landfill Ambient samples collected at 100pm 200pm 300pm 500pm 600pm 700pm 1000pm and 1100pm
47
TABLE 6 TAGA IIE Sampling Results
Thursday - November 20 2003
Sample Time Compounds Tentatively Identified LOC2 235pm None LOC3 320pm 23-Butanedione LOC4 430pm None LOC2 600pm None LOC3 810pm None LOC2 945pm None Landfill Ambient
1200pm None
Landfill Ambient
200pm None
Landfill Ambient
800pm None
Landfill Ambient
1000pm None
Wind direction was from North from 1200 pm until 300 pm when the direction changed to the West-Northwest and averaged 4 mph for the remainder of the sampling session
No compounds could be identified from the spectra for the Landfill Ambient samples collected at 100pm 300pm 400pm 500pm 600pm 700pm and 900pm
Monday - December 1 2003
Sample Time Compounds Tentatively Identified LOC5 100pm None LOC2 200pm None
426 POWEL 235pm None LOC3 435pm None LOC4 535pm Pentanal LOC2 700pm None LOC5 750pm None LOC3 850pm None Landfill Ambient
1215pm None
Winds were from the West-Northwest averaging 7 mph from 1200 pm until 615 pm The winds then shifted to the Southwest averaging 5 mph for the remainder of the sampling session
No compounds could be identified from the spectra for the Landfill Ambient samples collected at 115 pm 215 pm 315 pm 415 pm 515 pm 615 pm 715 pm and 815 pm
48
TABLE 7 TAGA IIE Sampling Results
Tuesday - December 2 2003
Sample Time Compounds Tentatively Identified LOC5 1055am None
505 POWEL 1150am None 752 S MAIN 105pm None
LOC2 235pm None 508 POWEL 400pm None
LOC3 513pm None 508 POWEL 630PM None
LOC5 750pm None
Winds were from the West-Northwest averaging 7 mph for the sampling session
No compounds could be identified from the spectra for the Landfill Ambient samples collected at 115 pm 215 pm 315 pm 415 pm 515 pm 615 pm 715 pm and 815 pm
Wednesday - December 3 2003
Sample Time Compounds Tentatively Identified LOC2 1025am None
501 POW 1110am None LOC5 1210pm None LOC4 100pm None
ELEMSCH 245pm None 752 MAIN 315pm None
505 POWEL 430pm None TURNPIKE 600pm None
LOC3 720pm None TURNPIKE 820 PM None
Winds were from the North from 900 am averaging 1 mph until 1040 am The winds then shifted to the South and averaged 4 mph until 510 pm when the winds shifted to the Northwest at 1 mph for the remainder of the sampling session
No compounds could be identified from the spectra for the Landfill Ambient samples collected at 900am 1000am 1100am 1200 pm 100 pm 200 pm 300 pm 400 pm 500 pm 600 pm 700 pm and 800 pm
49
TABLE 8 TAGA IIE Sampling Results
Thursday - December 4 2003
Sample Time Compounds Tentatively Identified 511 HICKO 945am None
LOC5 1040pm None LOC2 1215pm None LOC3 110pm None UNION 145pm None LOC5 315pm None UNION 353pm None LOC4 455pm None
2 ROSEV 605pm None I 476 708pm None
At 900 am the average wind direction was from the North at an average speed of 1 mph The wind direction shifted from the South averaging 5 mph at 1040 am The direction of the wind remained from the South until 510pm when it shifted from out of the North at an average of 3 mph for the remainder of the sampling session
No compounds could be identified from the spectra for the Landfill Ambient samples collected at 900am 1000am 1100am 1200 pm 100 pm 200 pm 300 pm 400 pm 500 pm 600 pm and 700 pm
50
Compound Detection Limit ppb
Average Concentration ppb
Highest Concentration ppb (Time)
Acetaldehyde 166 --shy --shyAmmonia 4 --shy --shyBenzene 88 --shy --shyCarbon Disulfide 127 --shy --shyCarbon Monoxide 39 --shy 265 (303 pm) Carbonyl Sulfide 21 --shy --shyChloroform 8 --shy ---Dimethyl Sulfide 133 --shy --shyEthanol 29 --shy ---Ethylbenzene 262 --- --shyEthylene 9 --- --shyFormaldehyde 40 --- --shyHydrogen Chloride 68 --- --shyHydrogen Sulfide 7081 --- 8906 (134pm) Methane 758 6540 18460 (641 pm)Methanol 7 --- --shy2-Methyl Butane 90 --shy --shyMethyl Mercaptan 415 --shy ---Methylamine 88 --shy 195 (518 pm) n-Octane 47 --shy --shySulfur Dioxide 136 --shy --shyTCE 8 --shy 35 (135 pm) Toluene 120 --shy ---Triethylamine 26 --- --shy m-Xylene 103 --- --shyo-Xylene 90 --- --shyp-Xylene 264 --- --shyVinyl Chloride 14 --- --shy
--- Compound Below Detection Limit
Highest concentration existed for less than 2 min unless otherwise noted
TABLE 9 OPFTIR Analysis Results
Week 1 November 18-20 2003
Day 1 Tuesday November 18 2003 (100 pm to 1200 am)
The OPFTIR was set-up with the beam path along the top plateau of the ERSI Landfill The path length was 228 meters Wind direction during the sampling was from the South averaging 8 mph
51
Compound Detection Limit ppb
Average Concentration ppb
Highest Concentration ppb (Time)
2-Methyl Butane 86 --shy --shyAcetaldehyde 143 --shy 790 (806 pm) Ammonia 4 --shy 6 (556 pm) Benzene 86 --shy --shyCarbon Disulfide 151 --shy --shyCarbon Monoxide 46 --shy 122 (127 pm) Carbonyl Sulfide 18 --shy --shyChloroform 7 --shy 12 (758 pm) Dimethyl Sulfide 133 --shy --shyEthanol 36 --shy ---Ethylbenzene 238 --- 336 (1158 am) Ethylene 9 --- --shyFormaldehyde 37 --- --shyHydrogen Chloride 62 --- --shyHydrogen Sulfide 6689 --- --shyMethane 673 5727 14089 (806 pm)Methanol 7 --- --shyMethyl Mercaptan 500 --shy ---Methylamine 92 --shy 178 (744 pm) n-Octane 43 --shy --shySulfur Dioxide 131 --shy --shyTCE 16 --shy 31 (756 pm) Toluene 125 --shy ---Triethylamine 24 --- 60 (607 pm) Trimethylamine 12 --- --shyVinyl Chloride 14 --- --shym-Xylene 101 --- --shyo-Xylene 107 --- --shyp-Xylene 246 --- --shy
--- Compound Below Detection Limit
Highest concentration existed for less than 2 min unless otherwise noted
TABLE 10 OPFTIR Analysis Results
Week 1 November 18-20 2003
Day 2 Wednesday November 19 2003 (1130 am to 805 pm)
The OPFTIR was set-up with the beam path along the top plateau of the ERSI Landfill The path length was 228 meters Wind direction during the sampling was from the South averaging 15 mph
52
Compound Detection Limit ppb
Average Concentration ppb
Highest Concentration ppb (Time)
Acetaldehyde 121 --- --shyAmmonia 5 --- 12 (425 pm) Benzene 123 --- --shyCarbon Disulfide 209 --shy --shyCarbon Monoxide 59 --shy 1248 (424 pm) Carbonyl Sulfide 44 --shy --shyChloroform 11 --shy ---Dimethyl Sulfide 137 --shy --shyEthanol 38 --shy ---Ethylbenzene 240 --- --shyEthylene 11 --- --shyFormaldehyde 24 --- --shyHydrogen Chloride 29 --- --shyHydrogen Sulfide 9898 --- --shyMethane 266 --- 3077 (901 pm) Methanol 7 --- --shy2-Methyl Butane 53 --shy --shyMethyl Mercaptan 541 --shy ---Methylamine 133 --shy 216 (856 pm) n-Octane 20 --shy --shySulfur Dioxide 120 --shy --shyTCE 10 --shy 19 (220 pm) Toluene 163 --shy ---Triethylamine 15 --- ---Trimethylamine 39 --- --shym-Xylene 157 --- --shyo-Xylene 147 --- --shyp-Xylene 347 --- --shyVinyl Chloride 19 --- --shy
--- Compound Below Detection Limit
Highest concentration existed for less than 2 min unless otherwise noted
TABLE 11 OPFTIR Analysis Results
Week 1 November 18-20 2003
Day 3 Thursday November 20 2003 (215 pm to 1000 pm)
The OPFTIR was set-up with the beam path parallel along Powell Street The path length was 222 meters Wind direction during sampling was from the North averaging 3 mph
53
TABLE 12 OPFTIR Analysis Results
Week 2 December 1-4 2003
Day 1 Monday December 1 2003 (1245 pm to 850 pm)
The OPFTIR was set-up with the beam path parallel along Powell Street The path length was 218 meters Wind direction during sampling was from the North averaging 8 mph
Compound Detection Limit ppb
Average Concentration ppb
Highest Concentration ppb (Time)
Acetaldehyde Ammonia
46 2
--shy--shy
--shy--shy
Benzene 40 --shy --shyCarbon Disulfide 51 --shy --shyCarbon Monoxide Carbonyl Sulfide Chloroform
16 7 3
76 --shy--shy
2459 (829 pm) --shy---
Dimethyl Sulfide Ethanol
40 9
--shy--shy
--shy---
Ethylbenzene Ethylene Formaldehyde Hydrogen Chloride Hydrogen Sulfide Methane Methanol Methylamine 2-Methyl Butane Methyl Mercaptan n-Octane
70 4
14 24
2886 225
3 32 27
113 15
--shy--shy--shy--shy--shy
2376 --shy--shy--shy--shy--shy
--shy10 (831 pm)
--shy--shy--shy
13157(125 pm) 6 (542 pm)
60 (356 pm) --shy
130 (418 pm) --shy
Sulfur Dioxide 60 --shy --shyToluene 35 --shy --shyTCE 4 --shy ---Triethylamine Trimethylamine m-Xylene o-Xylene p-Xylene Vinyl Chloride
8 5 29 25 66 8
--shy--shy--shy--shy--shy--shy
--shy8 (104 pm)
--shy--shy--shy--shy
--- Compound Below Detection Limit
Highest concentration existed for less than 2 min unless otherwise noted
54
TABLE 13 OPFTIR Analysis Results
Week 2 December 1-4 2003
Day 2 Tuesday December 2 2003 (900 am to 845 pm)
The OPFTIR was set-up with the beam path parallel along Union Street The path length was 276 meters Wind direction during the sampling was from the West averaging 5 mph
Compound Detection Limit ppb
Average Concentration ppb
Highest Concentration ppb (Time)
Acetaldehyde Ammonia
23 2
--shy--shy
--shy--shy
Benzene Carbon Disulfide
36 27
--shy--shy
44 (329 pm) --shy
Carbon Monoxide Carbonyl Sulfide Chloroform
11 5 2
--shy--shy--shy
236 (524 pm) --shy---
Dimethyl Sulfide Ethanol Ethylbenzene Ethylene Formaldehyde Hydrogen Chloride Hydrogen Sulfide Methane Methanol
24 8
28 5 4 6
1897 32 4
--shy--shy--shy--shy--shy--shy--shy43 --shy
--shy84 (437 pm)
--shy8 (459 pm)
--shy--shy--shy
397 (1055 am) --shy
2-Methyl Butane Methyl Mercaptan Methylamine n-Octane
2 92 26 4
--shy--shy--shy--shy
--shy--shy
48 (500 pm) --shy
Sulfur Dioxide TCE Toluene
43 4
26
--shy--shy--shy
436 (437 pm) 7 (922 am)
---Triethylamine Trimethylamine m-Xylene o-Xylene p-Xylene Vinyl Chloride
4 3 23 17 51 8
--shy--shy--shy--shy--shy--shy
--shy5 (504 pm)
46 (518 pm) --shy--shy--shy
--- Compound Below Detection Limit
Highest concentration existed for less than 2 min unless otherwise noted
55
Compound Detection Limit ppb
Average Concentration ppb
Highest Concentration ppb (Time)
Acetaldehyde 80 --shy --shyAmmonia 3 --shy --shyBenzene 69 --shy --shyCarbon Disulfide 123 --shy --shyCarbon Monoxide 36 51 384 (810 pm) Carbonyl Sulfide 17 --shy --shyChloroform 5 --shy ---Dimethyl Sulfide 73 --shy --shyEthanol 18 --shy ---Ethylbenzene 135 --- 261 (845 pm) Ethylene 7 --- --shyFormaldehyde 27 --- --shyHydrogen Chloride 43 --- --shyHydrogen Sulfide 5152 --- --shyMethane 456 1684 12142 (825 pm)Methanol 6 --- 35 (1125 am) 2-Methyl Butane 59 --- --shyMethyl Mercaptan 246 --- ---Methylamine 68 --- 274 (531 pm) n-Octane 29 --- --shySulfur Dioxide 105 --shy --shyTCE 7 --shy 15 (540 pm) Toluene 67 --shy ---Triethylamine 13 --shy ---Trimethylamine 17 --shy --shym-Xylene 63 --shy --shyo-Xylene 56 --shy --shyp-Xylene 136 --shy --shyVinyl Chloride 12 --shy 16 (1257 pm)
TABLE 14 OPFTIR Analysis Results
Week 2 December 1-4 2003
Day 3 Wednesday December 3 2003 (900 am to 845 pm)
The OPFTIR was set-up with the beam path parallel to the North side of the Riverside Elementary School The Path length was 222 meters Wind direction during the sampling was from the North averaging 5 mph
--- Compound Below Detection Limit
Highest concentration existed for less than 2 min unless otherwise noted
56
TABLE 15 OPFTIR Analysis Results
Week 2 December 1-4 2003
Day 4 Thursday December 4 2003 (900 am to 800 pm)
The OPFTIR was set up with the beam path parallel to the turnpike toll collection booths along the exit ramp The Path length was 350 meters Wind speed and direction readings used were recorded by MAU-1 due to the ravine position of MAU-3 At 900 am the average wind direction was from the North at an average speed of 1 mph The wind direction shifted from the South at an average of 5 mph at 1040am The direction of the wind remained from the South until 510pm when it shifted from out of the North at an average of 3 mph
Compound Detection Limit Average Concentration Highest Concentration ppb ppb ppb (Time)
Acetaldehyde 203 --shy --shyAmmonia 4 --shy 21 (418 pm) Benzene 65 --shy --shyCarbon Disulfide 165 --shy --shyCarbon Monoxide 55 632 1579 (428 pm) Carbonyl Sulfide 13 --shy --shyChloroform 4 --shy ---Dimethyl Sulfide 76 --shy 148 (538 pm) Ethanol 15 --shy 29 (223 pm) Ethylbenzene 123 --shy 226 (551 pm) Ethylene 8 --shy 17 (931 am) Formaldehyde 70 --shy --shyHydrogen Chloride 126 --shy --shyHydrogen Sulfide 4416 --shy 6355 (532 pm) Methane 995 4961 19076 (716 pm) Methanol 6 --shy 23 (946 pm) Methylamine 62 --shy 145 (918 pm) 2-Methyl Butane 100 --shy --shyMethyl Mercaptan 206 --shy --shyn-Octane 69 --shy --shySulfur Dioxide 86 --shy 93 (657 pm) Toluene 68 --shy --shyTCE 5 --shy 12 (922 am) Triethylamine 13 --shy 41 (710 pm) Trimethylamine 10 --shy --shy
57
TABLE 15 OPFTIR Analysis Results
Week 2 December 1-4 2003
Day 4 Thursday December 4 2003 (900 am to 800 pm)
The OPFTIR was set up with the beam path parallel to the turnpike toll collection booths along the exit ramp The Path length was 350 meters Wind speed and direction readings used were recorded by MAU-1 due to the ravine position of MAU-3 At 900 am the average wind direction was from the North at an average speed of 1 mph The wind direction shifted from the South at an average of 5 mph at 1040am The direction of the wind remained from the South until 510pm when it shifted from out of the North at an average of 3 mph
Compound Detection Limit Average Concentration Highest Concentration ppb ppb ppb (Time)
m-Xylene 38 --shy --shyo-Xylene 35 --shy --shyp-Xylene 107 --shy --shyVinyl Chloride 12 --shy --shy--- Compound Below Detection Limit
Highest concentration existed for less than 2 min unless otherwise noted
58
TABLE 16 Peak Sampling Concentrations as Measured between the Dates of November 18 2003 to December 4 2003
Compound Peak Air Concentrations (lt2 min duration)
Units ppb
Peak Ambient Air Comparison Values
Units ppb
In-Depth Analysis Required
11182003 1300 - 2400
Landfill
11192003 1130 - 2005
Landfill
11202003 1415 - 2200 Powell Street
1212003 1245 - 2050 Powell Street
1222003 900 - 2045 Union Street
1232003 900 - 2045
Riverside Elem
1242003 900 - 2000
Turnpike
ATSDR Acute EMEG
EPA AEGL
(10 min)
Threshold Limit Value
Ceiling STEL IDLH
Acetaldehyde lt166 790 (2006) lt121 lt46 lt23 lt80 lt203 45000 25000 2000000 No Ammonia lt4 6 (1756) 12 (1625) lt2 lt2 lt3 21 (1618) 2000s 30000 35000 300000 No Benzene lt88 lt86 lt123 lt40 44 (1529) lt69 lt65 9d 130000 2500 500000 No Carbon Disulfide lt127 lt151 lt209 lt51 lt27 lt123 lt165 17000 500000 No Carbon Monoxide 265 (1503) 122 (1327) 1248 (1624) 2459 (2029) 236 (1724) 384 (2010) 1579 (1628) 1200000 No Carbonyl Sulfide lt21 lt18 lt44 lt7 lt5 lt17 lt13 None Available No Chloroform lt8 12 (1958) lt11 lt3 lt2 lt5 lt4 100s 500000 No Dimethyl Sulfide lt133 lt133 lt137 lt40 lt24 lt73 148 (1738) None Available No Ethanol lt29 lt36 lt38 lt9 84 (1637) lt18 29 (1423) 3300000b No
Ethylbenzene lt262 336 (1158) lt240 lt70 lt28 261 (2045) 226 (1751) 125000 800000b No
Ethylene lt9 lt9 lt11 10 (2031) 8 (1659) lt7 17 (931) None Available No Formaldehyde lt40 lt37 lt24 lt14 lt4 lt27 lt70 40s 900 300 20000 No Hydrogen Chloride lt68 lt62 lt29 lt24 lt6 lt43 lt126 1800 2000 50000 No Hydrogen Sulfide 8906 (1334) lt6689 lt9898 lt2886 lt1897 lt5152 6355 (1732) 70p 750 15000 100000 Yes Methane 18460 (1841) 14089 (2006) 3077 (2101) 13157(1325) 0397 (1055) 12142 (2025) 19076 (1916) None Available No Methanol lt7 lt7 lt7 6 (1742) lt4 35 (1125) 23 (2146) 670000 250000 6000000 No 2-Methyl Butane lt90 lt86 lt53 lt27 lt2 lt59 lt100 None Available No Methyl Mercaptan lt415 lt500 lt541 130 (1618) lt92 lt246 lt206 150000 No Methylamine 195 (1718) 178 (1944) 216 (2056) 60 (1556) 48 (1700) 274 (1731) 145 (2118) 15000 15000 100000 No n-Octane lt47 lt43 lt20 lt15 lt4 lt29 lt69 1000000b No
Sulfur Dioxide lt136 lt131 lt120 lt60 436 (1637) lt105 93 (1857) 10p 200 5000 100000 Yes Trichloroethylene (TCE) 35 (1335) 31 (1956) 19 (1420) lt4 7 (922) 15 (1740) 12 (922) 2000d 260000 100000 1000000 No Toluene lt120 lt125 lt163 lt35 lt26 lt67 lt68 1000d 200000 500000 No Triethylamine lt26 60 (1807) lt15 lt8 lt4 lt13 41 (1910) 3000 200000 No Trimethylamine Not Analyzed lt12 lt39 8 (1304) 5 (1704) lt17 lt10 8000 15000 No m-Xylene lt103 lt101 lt157 lt29 46 (1718) lt63 lt38 2000as 130000a 150000a 900000a No
o-Xylene lt90 lt107 lt147 lt25 lt17 lt56 lt35 2000as 130000a 150000a 900000a No
p-Xylene lt264 lt246 lt347 lt66 lt51 lt136 lt107 2000as 130000a 150000a 900000a No
Vinyl Chloride lt14 lt14 lt19 lt8 lt8 16 (1257) lt12 450000 No
Notes Further explanation of acronyms and definitions used for the comparison values in this table is shown in Appendix A
Yellow shading in the table implies a valid measured air concentration within the period of evaluation Green shading in the table is indicative where peak air measurements were considered questionable because they were measured directly at the end or outside the period of evaluation Blue shading in the table indicate the substances selected for further public health analysis aAssume that the relative toxicity of exposure among the different isomers for xylenes or a mixture of varying xylene isomers is the same bBecause the relevant acute toxicity data were either insufficient or unavailable the IDLH occupational exposure limit for this substance is the air concentration considered 10 of its lower explosive limit (LEL)
Basis of exposure for setting ATSDR acute EMEG 1) Peak Exposure (p) 2) Short-Term Exposure (s) and 3) Adjusted Daily Continuous Exposure (d)
59
TABLE 17 Short Term Sampling Concentrations as Measured between the Dates of November 18 2003 to December 4 2003
Compound Short Term Air Concentrations
(time-weighted average of duration period)
Units ppb
Short Term Ambient Air Comparison Values
Units ppb
In-Depth Analysis Required
11182003 1300 - 2400 (11 hr 0 min)
Landfill
11192003 1130 - 2005 (8 hr 35 min)
Landfill
11202003 1415 - 2200 (7 hr 45 min) Powell Street
1212003 1245 - 2050 (8 hr 5 min) Powell Street
1222003 900 - 2045
(11 hr 45 min) Union Street
1232003 900 - 2045
(11 hr 45 min) Riverside Elem
1242003 900 - 2000
(11 hr 0 min) Turnpike
ATSDR Acute EMEG
EPA AEGL (8 hr)
Threshold Limit Value (TWA)
Acetaldehyde lt166 lt143 lt121 lt46 lt23 lt80 lt203 45000 No Ammonia lt4 lt4 lt5 lt2 lt2 lt3 lt4 2000s 30000 25000 No Benzene lt88 lt86 lt123 lt40 lt36 lt69 lt65 9d 9000 1000 No Carbon Disulfide lt127 lt151 lt209 lt51 lt27 lt123 lt165 6700 1000 No Carbon Monoxide lt39 lt46 lt59 76 lt11 51 632 25000 No Carbonyl Sulfide lt21 lt18 lt44 lt7 lt5 lt17 lt13 None Available No Chloroform lt8 lt7 lt11 lt3 lt2 lt5 lt4 100s 10000 No Dimethyl Sulfide lt133 lt133 lt137 lt40 lt24 lt73 lt76 10000 No Ethanol lt29 lt36 lt38 lt9 lt8 lt18 lt15 1000000 No Ethylbenzene lt262 lt238 lt240 lt70 lt28 lt135 lt123 100000 No Ethylene lt9 lt9 lt11 lt4 lt5 lt7 lt8 200000 No Formaldehyde lt40 lt37 lt24 lt14 lt4 lt27 lt70 40s 900 No Hydrogen Chloride lt68 lt62 lt29 lt24 lt6 lt43 lt126 1800 No Hydrogen Sulfide lt7081 lt6689 lt9898 lt2886 lt1897 lt5152 lt4416 70p 330 10000 Yes Methane 6540 5727 lt266 2376 43 1684 4961 1000000 No Methanol lt7 lt7 lt7 lt3 lt4 lt6 lt6 270000 200000 No 2-Methyl Butane lt90 lt86 lt53 lt27 lt2 lt59 lt100 600000 No Methyl Mercaptan lt415 lt500 lt541 lt113 lt92 lt246 lt206 500 No Methylamine lt88 lt92 lt133 lt32 lt26 lt68 lt62 15000 5000 No n-Octane lt47 lt43 lt20 lt15 lt4 lt29 lt69 300000 No Sulfur Dioxide lt136 lt131 lt120 lt60 lt43 lt105 lt86 10p 200 2000 Yes Trichloroethylene (TCE) lt8 lt16 lt10 lt4 lt4 lt7 lt5 2000d 77000 50000 No Toluene lt120 lt125 lt163 lt35 lt26 lt67 lt68 1000d 200000 50000 No Triethylamine lt26 lt24 lt15 lt8 lt4 lt13 lt13 1000 No Trimethylamine Not Analyzed lt12 lt39 lt5 lt3 lt17 lt10 8000 5000 No m-Xylene lt103 lt101 lt157 lt29 lt23 lt63 lt38 2000as 130000a 100000a No
o-Xylene lt90 lt107 lt147 lt25 lt17 lt56 lt35 2000as 130000a 100000a No
p-Xylene lt264 lt246 lt347 lt66 lt51 lt136 lt107 2000as 130000a 100000a No
Vinyl Chloride lt14 lt14 lt19 lt8 lt8 lt12 lt12 70000 1000 No
Notes Further explanation of acronyms and definitions used for the comparison values in this table is shown in Appendix A
Yellow shading in the table implies a valid measured air concentration within the period of evaluation Green shading in the table is indicative where peak air measurements were considered questionable because they were measured directly at the end or outside the period of evaluation Blue shading in the table indicate the substances selected for further public health analysis H2S and SO2 were selected based on peak air levels exceeding appropriate comparison values as denoted in the previous table (Table 16) aAssume that the relative toxicity of exposure among the different isomers for xylenes or a mixture of varying xylene isomers is the same
Basis of exposure for setting ATSDR acute EMEG 1) Peak Exposure (p) 2) Short-Term Exposure (s) and 3) Adjusted Daily Continuous Exposure (d)
60
TABLE 18 ERSI LANDFILL POST AIR MONITORING Monthly Data Summary
Monitoring Location Riverside Elementary School Parameter Hydrogen Sulfide (units ppb)
Month amp Year 1-Hr Averages 24-Hr Averages Monthly Average Total Total Minimum Maximum Minimum Maximum
Samples Detects Detection Detection Detection Average Average
February 2004 694 3 043 1 7 0 1 0 March 2004 732 3 041 1 4 0 0 0 April 2004 718 0 000 0 0 0 0 0 May 2004 742 0 000 0 0 0 0 0 June 2004 321 0 000 0 0 0 0 0
Monitoring Location Pennsylvania Turnpike Parameter Hydrogen Sulfide (units ppb)
Month amp Year 1-Hr Averages 24-Hr Averages Monthly Average Total
Samples Total
Detects
Detection Minimum Detection
Maximum Detection
Minimum Average
Maximum Average
March 2004 66 11 1667 1 3 0 0 0 April 2004 718 85 1184 1 3 0 0 0 May 2004 743 81 1090 1 2 0 0 0 June 2004 720 7 097 1 1 0 0 0 July 2004 744 28 376 1 1 0 0 0 August 2004 743 32 431 1 3 0 0 0 September 2004 536 61 1138 1 2 0 1 0
Values listed as zero in the above tables indicate that the level of hydrogen sulfide in the air was immeasurable or could not be detected and was less than 1 ppb All of the quantitative data was acquired from the following PA DEP website httpwwwdepstatepausaq_appsaadata [accessed 09152008]
61
APPENDIX C Figures
63
Figure 1 Site Map
65
Figure 2 Site Demographic Maps
66
Figure 3 Total Count of Inspections Conducted at ERSI Landfill
TOTAL COUNT INFORMATION Complaint
Inspections Non-Complaint
Inspections Complaint Violations
Non-Complaint Violations
1st Qtr 2003 0 1 0 0 2nd Qtr 2003 0 5 0 0 3rd Qtr 2003 1 1 1 0 4th Qtr 2003 36 13 17 9 1st Qtr 2004 8 4 3 0 2nd Qtr 2004 3 2 0 2 3rd Qtr 2004 0 0 0 0 4th Qtr 2004 0 2 0 0
ERSI LANDFILL INSPECTION SUMMARY
0 5
10 15 20 25
30 35 40
1st Qtr 2003
2nd Qtr 2003
3rd Qtr 2003
4th Qtr 2003
1st Qtr 2004
2nd Qtr 2004
3rd Qtr 2004
4th Qtr 2004
Complaint Inspections Non-Complaint Inspections Complaint Violations Non-Complaint Violations
1st Qtr 2003 89 days (covers time span from January 1 2003 to March 31 2003) 2nd Qtr 2003 90 days (covers time span from April 1 2003 to June 30 2003) 3rd Qtr 2003 91 days (covers time span from July 1 2003 to September 30 2003) 4th Qtr 2003 91 days (covers time span from October 1 2003 to December 31 2003) 1st Qtr 2004 90 days (covers time span from Janaury 1 2004 to March 31 2004) 2nd Qtr 2004 90 days (covers time span from April 1 2004 to June 30 2004) 3rd Qtr 2004 91 days (covers time span from July 1 2004 to September 30 2004) 4th Qtr 2004 91 days (covers time span from October 1 2004 to December 31 2004)
Note Other quarters before the 1st quarter in 2003 have similar inspection counts to the 1st and 2nd quarters in 2003 (ie low inspection counts approaching zero) Moreover other quarters after 4th Otr 2004 also have similar inspection counts
Data Source PA Department of Environmental Protection (PADEP) eFACTS (Environmental Facility Application Compliance and Tracking System) httpwwwdepstatepausefacts
67
Figure 4 Odor Points of Electronic Nose
68
Figure 5 Potential Exposure Pathways to Landfill Gas
69
Figure 6 ATSDR Environmental Guideline Hierarchy
70
Hierarchy 1
Is one of the following available YES
bull ATSDR Acute EMEG (air) bull EPA AEGL ndash 10 minute exposure
Make Comparison
NO
Hierarchy 2 (OEL Required) Hierarchy 3 (OEL Reduction)
Is one of the following available Does a bull MI-DEQ ITSL (1 or 8 hour TWA) Peak YES bull WI-DNR AAC (1 hour TWA) YES
Exposure TLV bull AIHA ERPG-1 Exists bull AIHA ERPG-2
bull AIHA ERPG-3
NO Make Comparison
Make comparison with the following NO
bull Reduced TLV = (110) Peak Exposure TLV
Additional Source
Review additional sources to identify environmental guidelines
or Carry substance forward to
public health analysis
Figure 7 Environmental Guideline Hierarchy for Peak Inhalation Exposures
71
Hierarchy 1
Is one of the following available YES
bull ATSDR Acute EMEG (air) bull EPA AEGL ndash 10 minute exposure
Make Comparison
NO
Hierarchy 2 (OEL Required) Hierarchy 3 (OEL Reduction)
Is one of the following available Does a
Short-Term YES Exposure TLV
Exists
NO
Review additional sources to identify environmental guidelines
or Carry substance forward to
public health analysis
YESbull MI-DEQ ITSL (8 hour TWA) bull VT-DEC HAAS (8 hour TWA)
Make NO
Comparison
Is one of the following available bull MI-DEQ ITSL (24 hour TWA) bull NH-DES AAL (24 hour TWA) YES bull VT-DEC HAAS (24 hour TWA) bull WA-DE ASIL (24 hour TWA) bull WI-DNR AAC (24 hour TWA)
NO
Make comparison with the following bull Reduced TLV = (142) Short-Term Exposure TLV
Additional Source
Figure 8 Environmental Guideline Hierarchy for Short-Term Inhalation Exposures
72
APPENDIX D Chronological Summary of ERSIrsquos Malodorous Period
Below are excerpts from a Consent Order and Agreement entered on the 29th day of August 2005 by and between the Commonwealth of Pennsylvania Department of Environmental Protection (PA DEP) and Environmental amp Recycling Services Inc (ERSI) The listed information is only a portion of the findings founded by PA DEP related to malodorous releases (denoted or highlighted in yellow) from the ERSI Landfill occurring between September and December 2003
Date Event Summary
982003 ndash 11112003 At various times during this period (including on at least 10 days) PA DEP responded to odor complaints and verified sulfur-like odors emanating from the ERSI Landfill and migrating into residential neighborhoods and public roadways adjacent to the landfill The strength of the odors varied from slight to very strong over the course of this period and the odors lasted from several minutes to several hours PA DEP determined that the odors were the result of uncontrolled gas releases from various portions of the ERSI Landfill During this period PA DEP also verified off-site odors from a chemical neutralizermasking agent along a public road emanating from the landfill
9232003 PA DEP issued to ERSI a Notice of Violation (ldquoNOVrdquo) for the odors detected offsite on September 8 2003 The NOV requested ERSI to submit a plan and schedule to correct the violation within 15 days
10102003 PA DEP received ERSIrsquos response to the September 23 2003 NOV The response from ERSI indicated that bacterial degradation of gypsum (ie sheetrock wallboard) within the landfill was the suspected source of the sulfur-like odors The response indicated that ERSI planned to control odors through limitations on disposal of gypsum at the landfill the addition of final cover soil to certain portions of the landfill and the use of odor masking agents and odor neutralizers The response indicated that the first phase of final cover installation would be completed by the end of October 2003 and the entire final cover project for those portions of the landfill where filling was finalized would be completed by the spring of 2004
11112003 ndash 11122003
11132003
PA DEP representatives responded to a number of odor complaints and verified an off-site sulfur-like odor at some of the complainantsrsquo properties PA DEP representatives conducted an on-site inspection and determined the source of the odor to be the ERSI Landfill PA DEP representatives also determined that uncontrolled odors were present at and emanating off-site from multiple locations along the landfill Moreover PA DEP representatives documented that the Amity Gas System was in a state of disrepair at multiple locations and was causing uncontrolled releases of gas
PA DEP issued to ERSI an Administrative Order requiring certain corrective action at the ERSI Landfill and Amity Landfill The Administrative Order required among other things that ERSI complete all capping activities started in October 2003 complete a landfill gas characterization and assessment evaluate the need for a gas collection and control system install twenty-four (24) landfill gas sample probes conduct 24-hour odor monitoring and submit a permit modification with changes to its nuisance minimization and control plan
73
Date Event Summary
11132003 ndash 12112003 At various times during this period (including on at least 9 days) PA DEP verified sulfur-like odors emanating from the ERSI Landfill and migrating into residential neighborhoods and public roads adjacent to the landfill The strength of the odors varied from slight to very strong over the course of this period and the odors lasted from several minutes to several hours PA DEP determined that the odors were the result of uncontrolled gas releases from various portions of the ERSI Landfill
11172003 PA DEPrsquos mobile analytical laboratory 1 (ldquoMAU 1rdquo) and mobile analytical laboratory 2 (ldquoMAU 2rdquo) arrived on site at the landfill to begin ambient air monitoring and individual location air sampling
11212003 At the request of ERSI PA DEP conducted a meeting with them to discuss the Administrative Order and corrective action timetable During the meeting ERSI suggested and agreed to install twelve (12) gas collection wells into the active portion of the ERSI Landfill in lieu of the 24 test probes required by the Administrative Order The gas collection wells would then be connected to a passive flare the existing gas system at the Amity Landfill andor a new landfill gas flare
1212003 PA DEPrsquos mobile analytical laboratory 1 (ldquoMAU 1rdquo) and mobile analytical laboratory 2 (ldquoMAU 2rdquo) returned to begin ambient air monitoring and individual location air sampling
A PA DEP representative responded to a number of odor complaints and verified an off-site sulfur-like odor at most of the complainantsrsquo properties emanating from the ERSI Landfill The PA DEP representative also confirmed moderate to strong sulfur-like odors at the Riverside Area School District
1222003
1232003
1212003 ndash 12102003 Pursuant to the Administrative Order and the subsequent meeting with PA DEP representatives ERSI installed twelve (12) gas collection wells into the active portion of the ERSI Landfill ERSI gave advance notification of the dates of drilling and the likelihood of strong odors to PA DEP Taylor Borough Old Forge Borough and Riverside School District
A PA DEP representative responded to a number of odor complaints and verified an off-site sulfur-like odor at most of the complainantsrsquo properties The PA DEP representative conducted an onsite inspection and determined the source of the odor to be the ERSI Landfill PA DEP was also informed by the Riverside Area School District that due to the landfill odor entering the building four students became ill and were sent home
74
Date
12102003
12102003
12102003 ndash 12112003
1212003 ndash 12102003
1212003 ndash 12102003
Event Summary
PA DEP received upwards of thirty (30) complaints of strong sulfur-like odors from citizens who live andor work in the area surrounding the ERSI Landfill Complaints were received from the Riverside Elementary School the Riverside High School the Old Forge School District the Taylor Nursing Home the Pennsylvania Turnpike Commission and residents living on Powell Davis Hospital Main Union and Lincoln Streets Some citizens alleged that the odors made them sick andor forced them to leave their homes Two schools in the area were evacuated as a result of the odors PA DEP investigated these complaints and verified an offsite sulfur-like odor at many of the complainantsrsquo properties and along public roadways The off-site odors entered the Riverside Area School District school buildings and prompted school officials to dismiss students A PA DEP representative confirmed that hydrogen sulfide odors were present in the school buildings The PA DEP representative also conducted an on-site inspection and determined the source of the odors to be the ERSI Landfill
PA DEP filed a Complaint in Equity and a Motion for Special Injunction against ERSI in the Court of Common Pleas for Lackawanna County relating to the December 10 2003 odors That case was docketed at Lackawanna County CP No 2000-EQ-60080 The Complaint and Motion sought the imposition of deadlines for the implementation of certain corrective action including completion and construction of the twelve wells installation and operation of the 400 cfm flare and connection of the wells to the flare At the time that the Complaint and Motion were filed ERSI was in the process of completing the work requested and ERSI voluntarily agreed to the court imposition of the deadlines by Court Order
ERSI initially connected the twelve (12) installed gas collection wells to a temporary passive flare and then to the turbines operated by Taylor Energy and related to the Amity Gas System ERSI ordered a temporary 400 cfm flare on December 10 2003 to be delivered that day however it was not delivered until the early morning of the next day ERSI installed and connected all twelve wells to the 400 cfm flare
Within this timeframe as required under the Administrative Order ERSI commenced removal of all vegetation with the exception of necessary ground cover within 10 or more feet of all gas piping and gas wells as required by PA DEP over most of the site
Within this timeframe as required under the Administrative Order ERSI commenced (a) labeling of the wells on the Amity Gas System (b) a detailed evaluation of the condition of the Amity Gas System and (c) performing any necessary repairs on the system including the repairs directed by PA DEP personnel during inspections ERSI engaged Blazosky Associates to perform the evaluation of the Amity Gas System In December 2003 Blazosky Associates submitted to PA DEP on behalf of ERSI a Landfill Gas Investigation Report the receipt and adequacy of which are acknowledged by PA DEP Certain repairs were made to the Amity Gas System ERSI engaged Russ Mercer and SCS to perform additional repairs to the Amity Gas System In addition Mr Mercer was hired to operate and monitor the ERSI gas system As part of the work on the site ERSI reconnected gas wells that had been disconnected ERSI completed all of the repairs to the Amity Gas System recommended under the Blazosky Landfill Gas Investigation Report
75
Date
1212003 ndash 12102003
1212003 ndash 12102003
1212003 ndash 12102003
12112003
12282003
2132004
2142004 ndash 2162004
342004
12142004
Event Summary
Within this timeframe as required under the Administrative Order ERSI commenced hourly off-site and on-site perimeter odor monitoring 24 hours a day and such monitoring continues to the present ERSI documented any odors confirmed as part of those inspections and kept the odor inspection logs as part of its daily operational record
During the first occurrence of the gas odors around September 8 2003 ERSI evaluated the use of chemical neutralizermasking agents however within this timeframe as required under the Administrative Order ERSI has substantially reduced use of such agents as a result of the effectiveness of the gas collection and destruction system installed at the ERSI Landfill ERSI has available for use chemical neutralizers as necessary
Within this timeframe as required under the Administrative Order ERSI completed all scheduled final capping activities for the area of the landfill on which capping activities had begun in October 2003
ERSI informed PA DEP that all the work required by the Court Order (court case docketed at Lackawanna County CP No 2000-EQ-60080) had been completed and that the flare was operational
ERSI engaged a cartographer to fly the site and prepare a map of the current contours ERSI forwarded the drawn map and it was received by PA DEP in February 2004 Since that time at the request of PA DEP ERSI has developed and submitted to the PA DEP a phasing plan for filling of the landfill through closure the receipt and adequacy of which is hereby acknowledged by PA DEP
ERSI installed a 450 cfm John Zink flare (the ldquoJohn Zink Flarerdquo) to replace the 400 cfin flare installed on December 10 2003 as the primary means of gas destruction PA DEP issued RFDs for the John Zink flare permitting its installation and temporary operation without the necessity for a plan approval or operating permit ERSI maintained the 400 cfm flare installed on December 10 2003 as a backup to the John Zink Flare
With the approval of PA DEP ERSI installed an additional nine (9) gas collection wells into the ERSI Landfill and connected those nine wells and the original twelve wells to the John Zinc Flare At the suggestion of PA DEP the wells were installed utilizing a ldquoboxrdquo over the drilling area to minimize the escape of odors and each well was immediately attached to the ERSI Landfill gas system upon completion ERSI gave advance notification of the dates of drilling and the likelihood of strong odors to PA DEP Taylor Borough Old Forge Borough and the Riverside School District PA DEP placed representatives on-site and in the surrounding community on the dates in question and PA DEP collected air samples from neighborhoods individual residences schools and various other locations
PA DEP moved to discontinue the matter of court case docketed at Lackawanna County CP No 2000-EQ-60080 and that the past action has been closed
PA DEP issued ERSI an Air Quality Program Plan Approval Permit No 35-322-008 (the ldquoAir Quality Permitrsquo) ERSI appealed certain provisions of the Air Quality Permit to the Pennsylvania Environmental Hearing Board
76
Date Event Summary
2162005 ndash 2182005 ERSI completed the installation of an enclosed flare for the destruction of landfill gases from the ERSI Landfill The enclosed flare was tested on February 16 17 and 18 2005 and thereafter was placed into service
77
APPENDIX E ATSDR Guidelines for Evaluating Gases Migrating from Landfills
I Background
Landfills especially those that were operating before the stringent requirements of the Resource Conservation and Recovery Act (RCRA) became effective may pose a health problem as they age The problems center on the gases generated by the decomposition of the waste in the landfill Most of the health concerns of landfill gases typically focus on the gases other than methane that may be part of the landfill gas ldquostreamrdquo and that can produce health effects at much lower concentrations than the fire and explosion hazard of methane
This document is intended to provide guidance only it should not be interpreted as mandatory Deviation from the procedures by environmental health professionals is expected and desired when the situation does not conform to the constraints and assumptions made in this document
II Assumptions
Unless there is reasonable evidence otherwise environmental health professionals should assume that hazardous substances were disposed of in any landfill that operated near an industrial area before the effective date of RCRA (~1977) If portable instruments indicate combustible gas readings the combustible constituents of the landfill gas should be considered to be largely methane (~75) with the remainder being other flammable or combustible vapors or gases such as benzene
III Migration Patterns
In general there are two pathways by which landfill gases may migrate offsite The first of these is vertically through the cover the second is horizontally through the soil The two pathways are not mutually exclusive the landfill gases will follow the path of least resistance Consequently construction details of the landfill and the geologyhydrogeology of the site will have a bearing on this migration pattern
Typically vertical migration is not a concern unless structures have been built on the cover or public access is unrestricted The gases tend to dissipate in the open environment However for people living or working on or adjacent to the landfill the concentration of landfill gases in the ambient air may pose a concern and may contribute to local air quality problems odor problems greenhouse effects and ozone depletion If the gases enter a structure built on the landfill cover the contaminants can collect in the structure and the resulting concentrations can reach a level of potential health concern Depending on the size of the structure and the volume of confined space in relation to the volume of landfill gas entering the structure a fire or explosion hazard could develop
Horizontal migration is usually a concern primarily for off-site structures The landfill gases will follow the horizontal path of least resistance until they find an avenue to the surface Because a major constituent of landfill gas is methane that gas will usually be detected first If the avenue to the surface accesses the open environment the gases will dissipate as they do in the vertical
79
migration pathway If the avenue intercepts a structure the gases can build up in the structure as described According to the data collected by EPA this horizontal migration is usually limited to about 300 meters from the landfill boundary [1]
IV Target Compounds
At any disposal site that accepted industrial waste in its lifetime the list of analytes should be targeted at the industrial wastes and their environmental degradation products If leachate or groundwater data are available the results of this analysis should be considered in determining the target compounds of the landfill gas analysis Whenever an environmental investigation of a landfill has been prompted by odorous compounds andor explosive gases the possible presence of toxic substances should be evaluated as well With all landfills alkyl benzenes sulfur compounds (both organosulfides and acid gases) benzene vinyl chloride and methane should be included in an analysis These are common gases that may be associated with industrial wastes construction and debris waste consumer products normal organic wastes andor their degradation products
V Sampling Strategy and Locations
As with any form of sampling the objectives of the sampling effort have to be understood prior to a determination of the sampling strategy For landfill gases common objectives may be to
determine if an fire or explosion hazard exists
identify the source of odors
determine if a toxic substance is being released
determine if a toxic substance is attaining concentrations of health concern
Depending on the issues arising from any given landfill other objectives not considered here could arise as well
Sampling locations are selected based on these objectives and the history and construction of the landfill the location of receptor populations and other sources of contamination in the area (ie control samples or background concentrations) Fire and explosion hazards are usually a concern only when the gases collect in a confined space such as a building or a basement Odor concerns arise most commonly in ambient outdoor air Toxic substances may be a concern in both confined spaces and in ambient air depending on the human exposure pathway and scenario
Expected migration patterns are commonly used to determine the orientation of the sampling locations For instance ldquodowngradientrdquo locations are usually more numerous and the primary focus of the screening effort However ldquoupgradientrdquo samples should also be collected for use as a verification of the migration pattern to determine if ldquoupstreamrdquo diffusion is occurring or for use as a control or background sample in the event that the migration pattern is well known
Ambient air sampling locations should be designed through use of predicted prevailing weather conditions However the air sampling network should be flexible enough to allow sampling stations in any individual sampling effort to be established according to the actual weather conditions encountered on the day of sampling
80
VI Screening Sampling Techniques
A screening effort is usually the first step Locations for sampling for a screening effort typically should include vents from the landfill adjacent structures and simplistic soil gas sampling between the landfill and the structures Fourier-transformed infrared-red (FTIR) or Ultra-Violet (UVS) sampling (see below) along the boundary of the landfill should also be considered In addition to monitoring wells and pre-existing source control (ie ventilation andor ldquoflarerdquo) systems landfill gases may be sampled from cracks in the landfill cover from leachate ldquospringsrdquo and from cracks in adjacent structures and paved parking areas
Several broad spectrum real-time monitors are useful in landfill screening investigations These monitors include combustible gas indicators (CGI) ionization detectors and compound-specific monitors (eg hydrogen sulfide or sulfur dioxide meters methane meters carbon monoxide meters etc) These meters are important for detecting changes in the work environment of site investigators and for identifying sampling locations with good prospects of detecting landfill gases However the limitations of these monitors need to be clearly understood in any evaluation of the data obtained through their use For instance some ionization detectors suffer significant degradation under some conditions common in landfill gases Methane can reduce the sensitivity of the photoionization detector (PID) by up to 90[2] The flame ionization detector (FID) requires enough oxygen in the sampled gas to maintain combustion (oxygen levels gt ~ 12by volume)
For screening efforts sweep surveys of the landfill surface and adjacent areas by use of FIDs and CGIs to identify areas where fissures and cracks permit landfill gas to escape naturally may be advantageous for locating a well During the survey the team must give attention to identifying ldquoflame outrdquo the emission of methane at such a rate that no oxygen gets to the flame to permit ionization of the methane
Grab samples are also useful as indicators of potential trouble spots Grab samples may be collected in Tedlarreg bags or in SUMMAreg or other evacuated canisters Using real-time monitors to coordinate the timing team members may find grab samples useful in evaluating peaks in the emissions The results of the grab sampling can also be useful in modifying the target analytes of future sampling efforts
Soil gas sampling both on the landfill and off-site can be extremely useful In a screening effort this type of sampling is normally accomplished with punchbars to varying depths usually no more than 10 feet and often no more than 3ndash5 feet in depth The punchbars should be deep enough to permit obtaining data below any cap on the landfill After the sampling the hole should be resealed to prevent inadvertent creation of a new vent for the landfill gases Because pressure within the landfill is critical to predicting landfill gas migration pressure measurements at these locations should also be considered
FTIR and UVS sampling are spectroscopic sampling techniques that detect and identify contaminants in the air along a straight line (eg the boundary of a landfill) UVS is typically set up for specific compounds (usually inorganic gases) but FTIR can be used for multiple compounds (usually organic gases) The principle is that the infrared or UV light is generated and then passed to a receptor in a line-of-sight position along a boundary of concern The receptor either analyzes the spectrography of the light or reflects it to another receptor which
81
then does the analysis This second receptor may be part of the source instrument The spectroanalysis can identify specific compounds and concentrations in the space between the source and the receptor However the units are usually given in a concentration of volume per unit distance (eg ppm-m) or mass per area of the beam (eg mgm2) The identified constituents can be added to the list of target analytes [3]
VII Landfill Gas Characterization
According to the results of the screening effort a more comprehensive sampling effort can be planned Sample locations in this expanded sampling would be designed to better characterize the gas streams at those locations identified in the screening effort in similar locations and near sensitive receptors (eg adjacent structures)
Any of the standard methods for ambient air indoor air andor soil gas that attain the desired level of detection for the target analytes are appropriate for use in characterizing landfill gases over time The detection limits should be lower than the concentration of health concern Use of these limits makes protective allowance for the unavoidable errors of any chemical analysis
Soil gas wells on the landfill between the landfill and adjacent structures and near the structures should be considered in any comprehensive sampling program These wells should include pressure gauges to determine the gas pressure at their locations This pressure may be used to predict the migration patterns of landfill gases
VIII Evaluation of Sampling Data
The health-based interpretation of any sampling data is dependent on the quality of the data obtained the method of sample collection the location of the sample the media of the sample and the demographics of the surrounding area Many of the sampling methods preferably used in conjunction with grab sampling at times most likely identify peak (or worst-case) emissions will provide adequate data to characterize the health implications of landfill gases under the conditions of the sample
As a landfill ages the constituents and the relative concentration of the constituents in the gas stream will change over time As environmental conditions change (eg the height of groundwater levels) the migration patterns and possibly the constituents of the gas stream may change Any evaluation of environmental data is valid only for the information reviewed and the conditions during the sample collection Therefore once a potential threat is identified at a landfill continued monitoring or additional sampling may be necessary If the threat continues source controls may be required
Negative results during a screening effort may not mean the characterization effort can stop More than one screening effort may be required to permit obtaining adequate data to indicate that the landfill does not pose a threat Multiple screening efforts are particularly appropriate when a screeningrsquos results indicate variations in the gas stream so that certain constituents of the stream may pose a threat in the near future
Conclusions based on sample results should be limited to the capabilities of the sample methodology and the knowledge available about the landfill other possible impacts should be
82
explored when they could be a concern For instance if explosive gases are the original concern prompting an environmental investigation the bulk of the explosive gases from most landfills will be methane If the choice is made to investigate combustible gases by use of a CGI only any assumption as to the constituents of the gas stream and the relative hazard are not warranted For example if the explosive level measured by the CGI was 60 of the lower explosive limit (LEL) for methane (3 by volume) technically no fire or explosion hazard exists according to that data However there is also a need to consider the possible presence of other explosive gases if only 1 of the combustible gas is a flammable vapor other than methanemdashfor example benzenemdashthe landfill gas may contain approximately 300 ppm benzene (3 = 30000 ppm X 1 = 300 ppm) This value for benzene is well above the OSHA PEL of 1 ppm (8-hour TWA) [4] and the ATSDR acute minimal risk level of 0002 ppm [5]
Many of the typical landfill gases notably the alkyl benzenes and the sulfur compounds (both organosulfides and acid gases) may present an odor problem that can cause health effects such as mucous membrane irritation respiratory irritation nausea and stress These health effects posed by an odor problem can be significant for individuals with pre-existing health conditions (eg allergies respiratory illness)
Line-of-sight remote sensor sampling (ie FTIRUVS) yields results that are given in units of volume per distance or mass per area of the beam A value of 3 ppm-m may mean that the plume attained 3 ppm spread over 1 meter 300 ppb over 10 meters or 300 ppm over a centimeter There are models that can predict based on the reported values the emission rate as well as the concentration that may impact downwind receptors
Given some information in the form of environmental sample results the environmental health professional should compare the concentrations in the samples to our current state of knowledge about those compounds detected while considering the plausible human exposure scenarios at the site Whenever possible the sample results should correspond to the media under consideration in the exposure scenario (eg air samples for inhalation exposures) Good quality empirical data should always supersede theoretical predictions (ie models) no matter how accurate the theory may be The exception to that principle is a situation in which an interference or additional source of contamination exists and affects the empirical data If the empirical data validates a model at a particular location then that model can be used with confidence as long as the modelrsquos conclusions are periodically verified with environmental data If the model is valid at one site it does not necessarily mean the model is valid at all sites
Sampling of two different media at approximately the same time also has inaccuracies unless the migration rate from the one media to the other is known to approximate the sample collection time In the example of soil gas to indoor air the migration rate would be dependent on such factors as the permeability of the gas through the soil and then through the structure the pressure of the gas in the soil possible variations in the migration patterns and other factors unique to the specific type of soil and the environmental conditions at the time of the sampling (eg depth to water ambient temperature etc)
83
IX References
[1] US Environmental Protection Agency 1991 Air Emission from Municipal Solid Waste Landfills - Background Information for Proposed Standards and Guidelines Office of Air and Radiation Office of Air Quality Planning and Standards Emission Standards Division Research Triangle Park NC
[2] Nyquist JE Wilson DL Norman LA and Gammage RB 1990 Decreased sensitivity of photoionization detector total organic vapor detectors in the presence of methane Oak Ridge National Laboratory Journal of the American Industrial Hygiene Assoc Vol 51 pp 326ndash 30
[3] Scotto RL Minnich TR and Leo MR 1991 A method for estimating VOC emission rates from area sources using remote optical sensing IN The Proceedings of the AWMAEPA International Symposium on the Measurement of Toxic and Related Air Pollutants Durham NC May 1991
[4] Code of Federal Regulations Title 29 Part 19101028
[5] ATSDR 1991 Agency for Toxic Substances and Disease Registry Toxicological profile for benzene Atlanta US Department of Health and Human Services
84
Health Consultation A Note of Explanation
A health consultation is a verbal or written response from ATSDR or ATSDRrsquos Cooperative Agreement Partners to a specific request for information about health risks related to a specific site a chemical release or the presence of hazardous material In order to prevent or mitigate exposures a consultation may lead to specific actions such as restricting use of or replacing water supplies intensifying environmental sampling restricting site access or removing the contaminated material
In addition consultations may recommend additional public health actions such as conducting health surveillance activities to evaluate exposure or trends in adverse health outcomes conducting biological indicators of exposure studies to assess exposure and providing health education for health care providers and community members This concludes the health consultation process for this site unless additional information is obtained by ATSDR or ATSDRrsquos Cooperative Agreement Partner which in the Agencyrsquos opinion indicates a need to revise or append the conclusions previously issued
You May Contact ATSDR Toll Free at 1-800-CDC-INFO
or Visit our Home Page at httpwwwatsdrcdcgov
HEALTH CONSULTATION
ERSI LANDFILL
TAYLOR LACKAWANNA COUNTY PENNSYLVANIA
EPA FACILITY ID PAD069601763
COST RECOVERY NO A903
Prepared By
US Department of Health and Human Services Agency for Toxic Substances and Disease Registry
Division of Health Assessment and Consultation
Table of Contents
Summary and Statement of Issues 1
Background 2
Site Description and History 2
DemographicsLand amp Natural Resource Use 3
Community Concerns and Odor Complaints 3 Other Community Concerns 4 Odor Complaints 4
Environmental Sampling and Chemical Analyses 5 2003 Ambient Air Investigations 5 2004 Post Ambient Air Monitoring of Hydrogen Sulfide 7 Taylor Ambient Air Monitoring Station 7
Exposure Pathways 8
Public Health Analysis9
Chemicals Selected for Further Public Health Analysis 9
Public Health Implications 11 Peak Exposures to Hydrogen Sulfide 12 Post Exposures to Hydrogen Sulfide 13 Peak Exposures to Sulfur Dioxide 13
Community Health Concerns and Related Public Health Implications 14 Multiple Sclerosis 14 Cancer Rates 15 Odors 15
Child Health Considerations16
Limitations and Uncertainties 16
Landfill Emergency ResponseContingency Plan 18
Conclusions 19
Recommendations 20
Authors21
References 23
APPENDIX A mdash Comparison Values 29
APPENDIX B mdash Tables 41
i
APPENDIX C mdash Figures 63
APPENDIX D mdash Chronological Summary of ERSIrsquos Malodorous Period 73
APPENDIX E mdash ATSDR Guidelines for Evaluating Gases Migrating from Landfills 79
ii
Summary and Statement of Issues
In December 2003 a citizen petitioned the Agency for Toxic Substances and Disease Registry (ATSDR) for assistance in evaluating the public impact of releases of airborne pollutants most notably hydrogen sulfide emanating from the Environmental and Recycling Services Inc (ERSI) Landfill in Taylor PA In response to the petition ATSDR investigated exposures to substances accidentally released from the landfill in 2003 and assessed the potential public health implications associated with those releases ATSDR conducted its investigation by reviewing ambient air monitoring data measured in 2003 and 2004
Between September 2003 and December 2003 the Commonwealth of Pennsylvania Department of Environmental Protection (PA DEP) responded to odor complaints and confirmed the ERSI Landfill as the source of sulfur-like odors These odors migrated into residential neighborhoods and along public roadways adjacent to the landfill Their strength varied from slight to very strong and lasted from several minutes to several hours PA DEP determined that the odors were the result of uncontrolled gas releases from various portions of the ERSI Landfill and the nearby Amity Landfill During that SeptemberndashDecember period PA DEP also confirmed off-site odors along a public roadway that emanated from a chemical neutralizermasking agent used to diminish the smell of the landfill odors
To conduct ambient air monitoring and individual location air sampling during the weeks of November 17 2003 and December 1 2003 PA DEP used two mobile analytical laboratories ldquoMAU 1rdquo and ldquoMAU 2rdquo After a review of the PA DEP air data and other pertinent information ATSDR concluded that residents living near the landfill may have experienced transient health effects (eg headaches nausea choking cough tearing of eyes aggravation of asthma) detectable peak levels of hydrogen sulfide measured in the air have been associated with such effects ATSDR also concluded that these peak air exposures to hydrogen sulfide and sulfur dioxide during SeptemberndashDecember 2003 posed a Past Public Health Hazard but further concluded that any public health effect was reversible (ie the peak exposures did not cause significant harm then nor would they cause harm in the future to onersquos health) Also in its review of the air monitoring data ATSDR concluded that the detectable levels of other landfill gases in the air posed No Apparent Public Health Hazard to area residents
Primarily during 2004 PA DEP conducted post-ambient air monitoring to assess whether the ERSI remediation of the malodorous air releases significantly reduced hydrogen sulfide levels in the ambient air ATSDR reviewed the 2004 post-ambient air monitoring data and concluded that post-air exposures to hydrogen sulfide emanating from the ERSI Landfill during 2004 posed No Apparent Public Health Hazard
ATSDR remains concerned however about landfill gases accidentally migrating offsite since the emergency responsecontingency plan on record may not have been activated for a severe malodorous incident that occurred on December 10 2003 (Appendix D) After the malodorous air releases landfill operators installed a gas collection system to control and prevent migration of landfill gases into nearby residential communities PA DEP also revised the original landfill permit to include a Nuisance Minimization and Control Plan The revised plan does require the landfill operators to control odors to prevent offsite migration of landfill gases and to manage and maintain the gas collection system But the plan does not cover the possibility of a
1
substantial failure to the gas collection system For example the plan does not list the emergency response contingency and community health actions necessary to mitigate or prevent likely exposures (eg residentialretail areas) to elevated levels of landfill gases
Background
Site Description and History
The ERSI Landfill is in Taylor Pennsylvania close to the town of Old Forge In or about October 1995 PA DEP issued to ERSI a Waste Disposal Operating Permit for a construction and demolition (CD) waste landfill where the landfill began operations in OctoberNovember 1996 (Tomayko 1995)
The landfill is within the permitted boundary of the former Amity Sanitary Landfill (Amity Landfill) (see Figure 1 in Appendix C) In fact ERSI used a small portion of the Amity Landfill for minor dumping The shared property of these landfills is directly across the street from Alliance Landfill an active sanitary waste landfill owned and operated by Waste Management Inc (Figure 1) After approximately 10 years of operation ERSI operators applied to PA DEP for a landfill expansion permit proposing to add some 60 acres of new disposal area within the AmityERSI Landfill property On February 1 2006 PA DEP denied the expansion proposal citing the lack of adequate safeguards against subsidence and groundwater pollution (PA DEP 2009a)
PA DEP did however renew ERSIrsquos existing Waste Disposal Operating Permit and set landfill closure for March 2007 ERSI began formal closure procedures as prescribed by the statersquos Solid Waste Management Act The procedure requires final cover of the landfill area establishes final slopes and elevations according to regulation and ensures post-closure monitoring for a specified period of years to be determined by PA DEP
In 2008 PA DEP confirmed that the ERSI landfill was closed and final cover was applied (Tomayko 2008) Currently ERSI operators have only one landfill gas control in place for the destruction of collected landfill gases a flare In the past some of the collected landfill gases were diverted to electricity producing diesel turbines however these turbines have since been decommissioned and this activity no longer takes place The landfill expansion application however remains pending The Environmental Hearing Board reversed PA DEPrsquos denial of the original expansion request and remanded the application to PA DEP for further review The review of the remanded application began in January 2008 As of the date of this health consultation the applicationrsquos public comment period has commenced and it is believed that PA DEP is continuing with its review of the remanded expansion application
Between the years of 1973 and 1990 Amity Landfill operated principally as a municipal waste landfill but received other mostly constructiondemolition waste as well In August 1987 PA DEP approved a closure plan submitted by the Amity operators The plan obligated the operators to install and maintain a gas collection system for controlling landfill gas and to implement a gas monitoring plan for the release of any landfill gases The collection conveyance and destruction system for Amity Landfill (Amity Gas System) was designed and installed and operators began to collect methane gas from Amity and process it for sale Methane gas was sold until 2006 when
2
it was diverted to a flare and burned off This operation was ongoing as of the date of this health consultation
Current regulations require that landfill dumping areas must be at least 500 feet from the nearest residential property Landfill operators stated that their dumping areas for the ERSI Landfill are approximately 700 to 800 feet from the nearest residential property and the dumping areas for the Amity Landfill are at least 1000 feet from the nearest residential property
On July 22 2004 an ATSDR Regional Representative met with the operators of the ERSI Landfill to discuss the SeptemberndashDecember 2003 landfill releases The operators readily admitted to the hydrogen sulfide releases but said that their full cooperation with PA DEP had the effect of mitigating those releases In that regard the operators noted that they had installed 24 gas collection wells throughout the landfill to collect gas and route it to an open flare where the collected gas was burned Moreover the operators stated that sometime in the then-near future the open flare would be replaced with an enclosed flare and an enclosed flare was in fact installed on February 16 2005 (Appendix D) With the installation of the gas collection system hydrogen sulfide releases have greatly diminished Operators said some evidence suggested that gypsum wallboard might have been the primary source of the problematic releases
A chronological summary in Appendix D lists all actions performed by both PA DEP and ERSI Landfill operators during and after the SeptemberndashDecember 2003 hydrogen sulfide releases
DemographicsLand amp Natural Resource Use
US Census data for 2000 show a total of 9468 people living within 1 mile of the site (see Figure 2) Whites comprised almost the entire population with a census count of 9347 or 987 As a group American IndiansAlaska Natives Asians and African Americans comprised 08 of the population with a census count of 79 and 05 of the population was of Hispanic origin Children 6 years and younger comprised 76 of the local population with a census count of 719 and adults older than 64 years of age comprised 209 with a census count of 1982 Females considered to be of childbearing agemdash15 to 44 yearsmdashcomprised 186 of the population with a census count of 1762 Most of the population occupied residential units adjacent to the property line of the ERSI Landfill toward the northeast east southeast south and southwest Alliance Landfill is toward the north northwest and west adjacent to the ERSI Landfill property line
The three landfills Amity ERSI and Alliance are in a mixed industrial and residential area of the Boroughs of Taylor and Old Forge PA The landfills are the dominant industrial facilities within the area other industrial activity is considered light industry and includes such businesses as auto repair auto salvage dry cleaners metal works and printing shops The area is served by public sewer and water natural gas and electricity
Community Concerns and Odor Complaints
In a December 2003 email a concerned citizen (petitioner) requested ATSDRrsquos assistance regarding malodorous releases from the ERSI Landfill In July 2004 a representative from ATSDRrsquos Region 3 Office spoke with the petitioner by telephone to discuss community health concerns The petitioner suggested referencing conversations with the PA DEP that the ERSI Landfill was a likely source of the odors about which the petitioner had several health concerns
3
High cancer rate on streets next to the dumpmdash7 persons in 29 years
Multiple sclerosis (MS) diagnoses without the presence of any real clinical evidence of the disease (ie no indication of brain lesions as detected by conducting magnetic resonance imaging MRI)
Burning eyes lips and skin
High prevalence of upper respiratory infection rates
Headachesmdashsome so severe they are considered migraines
The petitioner believed the SeptemberndashDecember 2003 releases were a continuation of years of landfill exposures that residents had endured The petitioner stated the earlier landfill (Amity Landfill) on the same property accepted all types of hazardous waste even though it was supposedly a household waste landfill permitted to accept only sanitation waste
Other Community Concerns
In March 2002 another citizen had petitioned ATSDR to conduct a public health assessment for the Alliance Landfill As stated the Alliance Landfill is directly across the street from the ERSI Landfill This petitioner also expressed concerns about ldquoair and particulate emissionsrdquo and cancer incidence rates in the community ATSDR released a health consultation in August 2003 for public comment (ie a comment period of approximately 30 days after document release) (ATSDR 2003) A final release version of the health consultation was completed in August 2004 (ATSDR 2004) Because the 2004 document recommended additional ambient air monitoring PA DEP installed an ambient air monitoring station off Keyser Ave in Taylor PA (see Figure 1) After data collection was complete PA DOH assessed the public health implications and on February 28 2008 ATSDR (per state cooperative agreement) released the findings of that public health evaluation (ATSDR 2008) As recommended in the public health evaluation additional monitoring near the Alliance Landfill has been completed (Bellas 2008) ATSDR (per a state cooperative agreement) hopes to release the findings from these efforts in the near future documented within another health consultation
Odor Complaints
As stated between the months of September and December 2003 area residents complained to the PA DEP that they had smelled foul odors and PA DEP confirmed that the odors emanated from the ERSI Landfill Appendix D lists a chronological summary of these malodorous releases that occurred between September 2003 and December 2003 Appendix D also lists the summarized descriptions of six malodorous releases highlighted in yellow as reported to the PA DEP
Residents also stated in newspapers and in televised news segments that the odors were so bad they virtually became ill (Appendix D) Residents stated the odors were intermittent (ie a noticeable smell that dissipates after a few minutes to several hours) but that the strongest odors reportedly occurred mostly at night or in the early morning On December 10 2003 due to excessive hydrogen sulfide odors school officials evacuated over 1000 students from two schools and Pennsylvania Turnpike toll collectors closed their booths This particular malodorous release resulted in an Emergency Court Order issued by Lackawanna County Court
4
Judge Robert Mazzoni on that same day PA DEP officials also reported that during the several malodorous releases between September and December 2003 residents complained of headaches feelings of nausea and eye throat and respiratory tract irritations
As part of its investigation ATSDR retrieved and reviewed compliance and inspection data from PA DEPrsquos Environment Facility Application Compliance and Tracking System (eFACTS) for the ERSI Landfill (PA DEP 2008a) ATSDR used this data to create Figure 3 which shows the number of inspections conducted per quarter by PA DEP at the ERSI Landfill for calendar years 2003 and 2004 Most inspections and violations occurred in the 4th quarter of 2003 (time span of 91 days between 10012003 to 12312003) This corresponds with the period of malodorous releases for the ERSI Landfill that occurred between the months of September and December 2003 Figure 3 also shows that the 4th quarter of 2003 had the most complaint inspections (ie an inspection prompted by an odor complaint from a nearby resident)
Because of odor complaints that occurred during the 4th quarter of 2003 PA DEP conducted inspections at the ERSI Landfill about every 2 to 3 days and wrote odor complaint violations about every 5 days (ie approximately 1 complaint violation for every 2 complaint inspections) During the 1st quarter of 2004 corrective actions at the ERSI Landfill mitigated and eventually prevented malodorous releases Complaint inspections and violations together with public anxiety also began to diminish Eventually complaint inspections and violations diminished to a level considered a norm (ie no more than 1 to 2 complaint inspections per quarter) This is evident for the early quarters (1 and 2) of 2003 and the latter quarters (3 and 4) of 2004 The level of complaint inspections also holds true for other quarters not shown (before 2003 and after 2004) in Figure 3 Moreover for the quarters considered a norm in which PA DEP actually conducted inspections for the one or two reported odor complaints many instances PA DEP did not issue violations when departmental inspectors arrived at the designated location the odors had subsided
Environmental Sampling and Chemical Analyses
2003 Ambient Air Investigations
In late 2003 to ascertain the substances present in the air and to identify those causing odor complaints PA DEP dispatched two mobile analytical laboratories 1 (ldquoMAU 1rdquo) and 2 (ldquoMAU 2rdquo) on November 18ndash20 2003 and December 1ndash4 2003 (Conrad 2003) Mobile laboratory personnel also made ambient air measurements to detect substances in the atmosphere and to estimate the levels or concentrations of detected substances
For the air analyses conducted during these investigations the mobile laboratories used four instruments
1 Multi-Polymer Array Response Network (Electronic Nose)
2 Gas ChromatographMass Spectrometer (GCMS)
3 TAGA IIE MSMS spectrometer
4 Open Path Fourier Transform InfraRed spectrometer (OPFTIR)
The first three instruments provided qualitative results meaning ambient air levels or concentrations of the substances could not be approximated These three instruments employed
5
methods of gathering data instantaneously implying the spectral scans (measured data) are representative of the time a sample is collected not a time-weighted average for a series of collected samples The fourth instrument also gathers data instantaneously but quantitative measures are approximated ATSDR primarily used the results of the fourth instrument in its assessment of potential public health implications the other three instruments did however provide supporting weight of evidence that odorous substances were present in the atmosphere and most were volatile in nature similar to those detected by the fourth instrument
The first instrument used in the investigations was the Multi-Polymer Array Response Network (Electronic Nose) This instrument uses an array of polymer sensors to mimic the human nose The sensors change their electrical resistance in the presence of differing chemicals Each sensor has a different characteristic response which is logged and mapped to provide a visualqualitative representation of a specific odor
Results from the electronic nose are shown as a composite graph in Figure 4 Odor samples were collected for the 7 days of sampling that resulted in odor points residing in a common area within the neural-net (3-dimensional mapping space of odor points in Figure 4 defined by the intensity level of electrical signals from device sensors) The formation of the odor points in this specific arrangement formed a unique reference profile for the overall investigation
Of the odor samples gathered all were plotted within the neutral-net and displayed in Figure 4 In two distinct groups of odor samples the instrument deemed to have similar odor characteristics otherwise the remaining odor points were distinct and dissimilar to each other and to the cluster groups Each cluster group consisted of three odor points and was labeled as Cluster 1 and Cluster 2 consisting of the following sampling locations
Cluster 1 Location 5 508 Powell and 752 Main Cluster 2 Location 2 Location 3 Location 4
The next two instruments were a Gas ChromatographMass Spectrometer (GCMS) and a TAGA IIE MSMS spectrometer Both are ambient air measuring devicesmdasha complex air sample is introduced into the instruments and an attempt is made to identify tentatively the samplersquos individual components The GCMS and the TAGA IIE are mass spectrometers used in tandem or conjunction with each other The chemical constituents tentatively identified in the odor samples are listed in Tables 1 thru 4 (GCMS) and Tables 5 thru 8 (TAGA IIE) all in Appendix B As noted earlier the results are qualitative and no exact concentrations were approximated or estimated
The fourth instrument used in the investigations was the Open Path Fourier Transform InfraRed spectrometer (OPFTIR) The OPFTIR measures substances in the air by directing a beam of modulated infrared energy from the OPFTIR telescope The beam contacts targets that can reflect (mirrored retro-reflector) the energy back along the same beam path into the OPFTIR The approximate beam paths for the investigation are displayed in Figure 1 Molecules of each of the chemicals intercepted in this infrared beam path uniquely absorb energy From the analysis of the resulting absorption spectrum the OPFTIR identifies and quantifies the chemical compound molecules present Together with their approximated air concentrations the chemical substances identified are listed within Tables 9 thru 15 The data are summarized in Tables 16 and 17 together with health comparison values The health comparison values selectively screen
6
for substances that potentially pose a health concern to exposed populations and that therefore require further public health analysis
2004 Post Ambient Air Monitoring of Hydrogen Sulfide
After ERSI Landfill operators installed gas collection wells and a John Zink Flare PA DEP placed two continuous ambient air monitoring stations in close proximity to the landfill The gas collection wells and flare collected and destroyed gases generated and created in the landfill including those considered malodorous
One of the ambient air monitoring stations was placed at the Taylor Pennsylvania Riverside Elementary School (Taylor H2S Station in Figure 1) The other ambient air monitoring station was placed along the Pennsylvania Turnpike (Taylor Turnpike Station in Figure 1) adjacent to the ERSI Landfill The stations only measured hydrogen sulfide levels within the air Monitoring began at the Riverside station on February 1 2004 and continued until June 14 2004 (PA DEP 2008b) Monitoring began at the Turnpike station on March 29 2004 and continued until September 23 2004 (PA DEP 2008b) Between the months of February and September 2004 odor complaints by residents living adjacent to the ERSI Landfill substantially decreased thus PA DEP ceased air monitoring at the two stations (see Figure 3) Moreover most of the hydrogen sulfide levels recorded each month as time-weighted averages of 1 hour 996ndash100 for the Riverside Station and 83ndash99 for the Turnpike station were not detected (ie approaching a measured level of zero or below 1 part per billion (ppb)) The results of both monitoring stations are summarized in Table 18
The detected hydrogen sulfide levels for a time-weighted average of 1 hour were below ATSDRrsquos air comparison values (CVs) for acute exposures to hydrogen sulfide ATSDRrsquos air CVs are denoted as Environmental Media Evaluation Guides (EMEGs) air concentration levels in micrograms per cubic meter (microgm3) or ppb ATSDRrsquos air CVs are further discussed in Appendix A Air concentration levels for hydrogen sulfide below their respective air CVs (eg EMEGs) present no appreciable risk of affecting public health (ie no adverse health effects are expected to occur in an exposed population) (See the ldquoIn-depth Public Health Analysisrdquo below for discussion)
Taylor Ambient Air Monitoring Station
Residents living in Taylor and in Old Forge PA have also expressed concerns about the Alliance Landfill directly across the street from the ERSI Landfill
ATSDR recommended that the PA DEP conduct ambient air monitoring in Taylor Borough (ATSDR 2004) PA DEP installed an ambient monitoring station located off Keyser Ave in Taylor (see Figure 1) The air monitoring station was centrally located approximately between the Alliance Landfill ERSI Landfill the Pennsylvania Turnpike and other commercial properties adjacent to Keyser Avenue and Union Street
Air monitoring station equipment collected meteorological data and continuously monitored levels of hydrogen sulfide (H2S) and sulfur dioxide (SO2) The air monitoring station included a high-volume air sampling unit to detect total suspended particulates and various metals
PA DEP staff installed calibrated and maintained the sampling equipment and meteorological equipment at the air monitoring station and was also responsible for the compilation of the
7
monitoring data Data collection is completed for this station PA DOH has reviewed the data and has made an assessment of the public health implications Findings from this public health evaluation were released by ATSDR in a public health document on February 28 2008 per its state cooperative agreement with PA DOH (ATSDR 2008)
Exposure Pathways
An exposure pathway is defined as the process by which people are exposed to or come into contact with chemical substances An exposure pathway has five parts
1 A source of contamination
2 An environmental medium and transport mechanism
3 A point of exposure
4 A route of exposure and
5 A receptor population
When all five parts are present the exposure pathway is a completed exposure pathway But a completed exposure pathway does not necessarily mean the presence of a public health hazard To determine the implications of any exposure specific exposure conditions and exposure doses must be more closely evaluated The only exposure pathway examined in this public health consultation is the inhalation of landfill gases from the ERSI Landfillmdashthis pathway probably poses the most significant and greatest concern to public health
Because community residents often complain about odors emanating from landfills inhalation of landfill gases is usually the predominant landfill-related exposure pathway Landfills odors are mainly due to landfill gases migrating either above or below ground Such gases can move through the landfill surface to the ambient air Once in the air winds can carry landfill gases to the community Landfill gases may also move underground through subsurface soils and enter homes or utility corridors on or adjacent to the landfill Figure 5 illustrates the movement of landfill gases and potential locations for exposure The levels of gases that migrate from a landfill and to which people can be exposed are dependent on many factors that can affect the direction speed and distance of landfill gas migration Some of these factors include but are not limited to
Landfill cover type
Natural and man-made pathways
Wind speed and direction
Moisture
Groundwater levels
Temperature and
Barometric and soil gas pressure
8
Landfill gas collection and control systems probably have the greatest effect on gas migration and exposures If a gas collection and control system is in place and operating properly migration of and exposures to landfill gases should be minimal
Public Health Analysis
Chemicals Selected for Further Public Health Analysis
Tables 16 and 17 summarize ATSDRrsquos review of the ambient air monitoring data collected during the 2003 malodorous releases (Note detection limits for all substances are displayed in Tables 9ndash15) ATSDR environmental health scientists first applied a screening process to select specific substances detected in the air these substances were then subjected to further analyses for peak inhalation exposures Table 16 summarizes measurements for 29 substances Of these substances 18 had what are termed acute exposure guideline levels (eg Acute EMEGs or AEGLs) for making health screening comparisons (Refer to Appendix A for further explanation of the acute exposure guidelines and the selective screening rationale used in this evaluation) And of these 18 substances three had detected peak air levels (ie air monitoring measurement of no more than a 2 minute duration refer to Table 16) during the malodorous releases of 2003 that exceeded at least one of their respective acute exposure guidelines The detected peak air levels of the other 15 substances never at any time exceeded their respective acute exposure guidelines and were therefore not selected for in-depth public health analysis
Two of the substances selected for public health analysis were hydrogen sulfide (H2S) and sulfur dioxide (SO2) Benzene the third substance exceeded ATSDRrsquos acute inhalation EMEG an acute exposure guideline for daily exposure Because however the detected air level for benzene is a measured peak air concentration it is more appropriate to screen the detected level against US EPArsquos AEGL for peak air exposures (10 minutes or less) Thus because benzenersquos detected peak air level was far below its AEGL for peak air exposures it was not selected for in-depth public health analysis
The remaining 11 substances summarized in Table 16 did not have Acute EMEGs or AEGLs Two of the substances ethylbenzene and triethylamine had a threshold limit value (TLV) for peak exposures TLVs are health-based guidelines set by the American Conference of Governmental Industrial Hygienists (ACGIHreg) to promote workplace health and safety The Occupational Safety and Health Administration (OSHA) have adopted many TLVs for use as permissible exposure limits (PELs) TLVs are normally designed to protect healthy adult workers and are usually much higher than the health-based values of ATSDR and US EPA which are designed to protect the health of the general population including the very young and the elderly Keeping this in mind and when making health screening comparisons ATSDR focused on selecting health-based guidelines or standards that appropriately adjust the TLVs to be protective of the general population
The American Industrial Hygiene Association (AIHA) is another scientific organization also concerned with environmental exposures to toxic airborne substances within the workplace Accordingly AIHA developed an emergency response exposure limit known as the Emergency Response Planning Guidelines (EPRG) which is similar to US EPArsquos AEGLs ERPG values are based on occupational exposure limits (OELs) (eg PELs RELs TLVs) rationally lowered
9
to general exposure limits considered protective of nearly all persons within certain domestic settings subjected to a specific emergency response situation Two states (Michigan and Wisconsin) also use OELs to establish their health-based air standards for peak air exposures Michiganrsquos health-based air standard is called the Initial Threshold Screening Level (ITSL) and Wisconsinrsquos is called the Acceptable Ambient Concentration (AAC) (MI DEQ 2008 WI DNR 2000)
ATSDR made health screening comparisons using the guidelines in the above paragraph If none of the above guidelines applied to a specific substance a health screening comparison was made with a rationally reduced TLV (ie TLV value multiplied with a reduction factor of either 110 for peak inhalation exposures or 142 for short-term inhalation exposures refer to Appendix A) The reduced TLV factor of 142 makes considerations for longer domestic exposures (80 of the time spent at home) and for human variability however the reduced TLV factor of 110 only makes the consideration for human variability (WI DNR 2000 Thrasher 2006) Applying the above screening rationale ATSDR found that the peak air levels for ethylbenzene and triethylamine did not meet the criteria for in-depth analysis
Four of the remaining 11 substances without Acute EMEGs or AEGLs (carbon monoxide ethanol methyl mercaptan and n-octane) did not have a TLV for peak exposures but did have health-based exposure limits known as Immediately Dangerous to Life and Health (IDLH) An IDLH is an airborne concentration established by the National Institute for Occupational Safety and Health (NIOSH) from which a worker in the event of respiratory protection equipment failure could escape without injury or irreversible health effects Again applying the rationale wherein health screenings are compared to guidelines based on OELs (refer to Appendix A) ATSDR found that the peak air levels for the five substances also did not meet the criteria for in-depth analysis
The last five substances of the 11 without Acute EMEGs or AEGLs (carbonyl sulfide dimethyl sulfide ethylene methane and 2-methyl butane) had neither listed appropriate comparison values nor Acute EMEGs AEGLs or TLVs ATSDR first reviewed additional sources (eg AIHA NIOSH MI ITSLs WI AACs) to identify environmental guidelines for accessing any detected peak concentration levels Michigan for example set an annual air standard for carbonyl sulfide at 9 microgm3 (37 ppb) During the peak air measurements carbonyl sulfide was not detected the detection limits (5 ndash 44 ppb) however exceeded the Michigan air standard Considering that this Michigan air standard is relevant to intermediatechronic exposures and that potential detectable levels could be lower than this standard ATSDR determined that any measurable peak air levels if detected were unlikely to cause any adverse effects (Only transient health effects have been observed from continuous inhalation exposures to carbonyl sulfide ranging from 15000 ppb to 30000 ppb (BOC 1996) Thus if detected at the detection limit of 44 ppb it is still 340 times lower than levels associated with adverse health effects)
2-Methyl Butane was also not detected during peak air measurements detection limits range from 2 to 100 ppb Yet even if 2-methyl butane were present at levels below detection limits those levels would be far below the 8-hour Michigan air standard for 2-methyl butane which is 17700 microgm3 (6000 ppb)
Only one peak concentration level (148 ppb) of dimethyl sulfide was detected and it was below the ERPG-1 air standard for dimethyl sulfide (500 ppb) set by AIHA ERPG-1 is a maximum
10
airborne concentration from which persons may notice an odor or slight irritation but that is still below any concentration that could cause adverse health effects
Ethylene had measurable peak concentration levels ranging from 8 to 17 ppb These levels are also far below a 24-hour Michigan air standard for ethylene which is 6240 microgm3 (5440 ppb) implying that ill-health outcomes are unlikely Methane also had measurable peak concentration levels ranging from 397 to 19076 ppb (0397ndash19076 ppm) well below the ACGIH 8-hr TWA TLV of 1000 ppm or 1000000 ppb also implying unlikely ill-health outcomes (ACGIH 2008)
To select for further analysis specific substances detected in air ATSDR also applied another screening rationale for short-term inhalation exposures Table 17 summarizes the air level measurements for 29 substances (refer to Tables 9ndash15 for detection limits) These air level measurements represent averages for continuous time periods below 24 hours thus any exposure at a detectable level would be considered short term Of the 29 substances only two (carbon monoxide and methane) had levels above measurable detection limits where averages could be calculated
Using the screening rationale for short-term inhalation exposures ATSDR found that the detectable levels of carbon monoxide considered as short-term averages (51ndash632 ppb) did not meet the selection criteria for in-depth analysis ATSDR based this decision on detectable levels that were lower than three air standards 1) ERPG-1 of 200000 ppb 2) MI ITSL of 8730 ppb and 3) VT HAAS of 8730 ppb ATSDR also found that the detectable levels for methane considered as short-term averages (43ndash6540 ppb) did not meet the selection criteria for in-depth analysis ATSDR based this decision on the fact that detectable levels were far lower than the ACGIH 8-hr TWA TLV of 1000 ppm or 1000000 ppb None of the other remaining 27 substances were at levels substantially above their detection limits Consequently ATSDR could not derive representative short-term averages for these substances and therefore did not apply the screening rationale for short-term exposures to them
Public Health Implications
Public health analysis is an integrated process that studies site-specific exposures in conjunction with substance-specific toxicological medical and epidemiologic data (ATSDR 2005) As stated hydrogen sulfide and sulfur dioxide were selected for further analysis because their detected levels in air exceeded the screening criteria applicable to peak exposures
While none of the detection limits for H2S and SO2 listed in Tables 9ndash15 (Peak amp Short-Term Concentrations Nov 18 to Dec 4 2003) exceeded occupational exposure limits (ie TLVs) they both exceededmdashoften by several orders of magnitudemdashATSDRrsquos screening values for daily acute (le14 days) exposures In addition the detection limits varied markedly from place to place probably reflective of several factors affecting the measurements of the OPFTIR instrument Such factors may include but are not limited to
1 Instrument calibration
2 Distanceangle the electromagnetic beam traverses (beam path)
3 Deployment of beam transmission and reception (mono-static bi-static or passive)
4 Ambient air temperature and
11
5 Relative humidity of the air
Peak Exposures to Hydrogen Sulfide
The available data suggest that the ERSI-related intermittent acute exposures to hydrogen sulfide that occurred in the final quarter of calendar year 2003 though unpleasant to most and uncomfortable to some might have caused only temporary non-serious effects even in sensitive human subpopulations
The detection limits reported for hydrogen sulfide in Tables 9ndash15 range from lt1897 ppb to lt9898 ppb Assuming as cited above that the actual peak concentrations for non-detected measurements were essentially the same as the reported detection limits and noting the two measured air levels of 6355 and 8906 ppb the peak concentrations for hydrogen sulfide between November 8 thru December 4 of 2003 (ie during the ldquoincidentrdquo) may well have been high enough to cause temporary respiratory discomfort to those with asthma and perhaps even in some without asthma who suffered from other preexisting respiratory conditions
The actual air levels however may have been an annoyance for nearly all residents The recognition threshold (ie the level at which 50 of people can recognize the chemicalrsquos characteristic odor) is only 5 ppb (0005 ppm) for hydrogen sulfidersquos characteristic ldquorotten eggrdquo odor
ATSDRrsquos 70-ppb acute Minimum Risk Level (MRL) for hydrogen sulfide is based on a 2000shyppb (2 ppm) human LOAEL for increased airway resistance and decreased specific airway conductance in 2 of 10 asthmatic subjects exposed for 30 minutes (Jappinen et al 1990) In this study no significant alterations in lung function (eg forced lung vital capacity forced expiratory volume bronchial responsiveness to a histamine challenge airway resistance and specific airway conductance) were observed in those with asthma exposed to 2 ppm for 30 minutes But 2 of the 10 subjects had gt30 changes in airway resistance and specific airway conductance implying bronchial obstruction Three of the subjects also reported headaches Therefore this LOAEL of 2000 ppb represents an approximate threshold for less serious effects in the most sensitive members of the most sensitive human subpopulation (ie those with asthma)
In another human study no respiratory effects were experienced by men and women exposed to 10 ppm hydrogen sulfide for 15 minutes (Bhambhani et al 1996) This human NOAEL is higher than any of the purported concentrations listed in Tables 16 and 17 and is based on exposures of comparable duration The duration of the measured peak air concentrations listed in Table 16 was less than 2 minutes The duration of the measured concentrations listed in Table 17 ranged from roughly one-third to one-half of a day (8ndash12 hours) ((Note hydrogen sulfide levels could not be quantified as short-term averages (ie not detected at the detection limits used) In Table 17 therefore the short-term air concentrations listed in the table represent upper limits (eg ldquolt9898rdquo ppb) instead of actual concentrations))
The current ACGIH 8-hr TWA TLV for hydrogen sulfide is also 10 ppm (ACGIH 2008) An ACGIH TLV represents a level to which nearly all workers (ie healthy adults) may be repeatedly exposed 8 hours a day 40 hours a week without adverse effects Moreover ACGIH TLVs are based solely on health factors and do not consider economic or technical feasibility
12
That said ACGIH TLVs are designed for application to healthy worker populations which do not include children the elderly infirm and other sensitive subpopulations
Within the context of the human effect levels and assumptions described above ATSDRrsquos interpretation of the available monitoring data supports the conclusion that hydrogen sulfide exposures during the ERSI landfill malodorous incident of late 2003 may have constituted a Past Public Health Hazard No serious or irreversible adverse effects are likely in either people with asthma or without asthma But mild reversible respiratory effects would have been likely in some with asthma and perhaps even in some without asthma who suffered from other preexisting respiratory conditions
Post Exposures to Hydrogen Sulfide
The data summarized in Table 18 show that the levels of hydrogen sulfide (1-hr 24-hr and monthly averages) after the implementation of corrective actions at the ERSI Landfill in 2004 Levels ranged in the very low parts per billion (immeasurable or lt1 ppb) that is (mostly) immeasurable to 7 ppb at Riverside Elementary School and (mostly) immeasurable to 3 ppb at the Pennsylvania Turnpike As noted in the previous section the lowest human LOAEL for less serious effects in more sensitive members of the most sensitive human subpopulation (ie persons with asthma) is 2000 ppb
These post-incident air monitoring data are comparable to US EPArsquos reference concentration (RfC) of 0002 mgm3 or 14 ppb The RfC is a level of a substance in air considered safe for continuous lifetime exposure The RfC for hydrogen sulfide contains a 1000-fold safety factor (USEPA-IRIS 2008) Therefore post-incident hydrogen sulfide levels in areas near the ERSI Landfill were too low to produce adverse effects of any kind even in the most sensitive persons
Accordingly after operators of the ERSI Landfill ensured that the landfill gas collection and capture system was fully functional and operational and would prevent further releases and migration of landfill gases such exposures posed No Apparent Public Health Hazard
Peak Exposures to Sulfur Dioxide
Measured peak concentrations (duration lt 2 minutes) of sulfur dioxide (SO2) were 436 ppb at Union St (437 pm December 2 2003) and 93 ppb at the Pennsylvania Turnpike (657 pm December 4 2003) At all other locations monitored during NovemberndashDecember 2003 no measurable levels were reported (ie concentrations either below 136 ppb or less) and were therefore below US EPArsquos 24-hr NAAQS (National Ambient Air Quality Standard) of 140 ppb
About the only concentration that could have produced clinically significant symptoms in at least some persons with asthma was the 436-ppb measured peak concentration at Union St Perhaps 20ndash35 of persons with asthma may be sensitive to exposures between 400 and 500 ppb (USEPA 2008) The resulting physiological effects are however usually not sufficiently serious to require persons either to cease activity take medication or seek medical attention
The lowest human LOAEL for sulfur dioxide effectsmdashwhich serves as the basis of ATSDRrsquos 10 ppb acute MRLmdash is 100 ppb And this is for a ldquoslightrdquo increase in specific airway resistance (SRAW) in ldquothe two most sensitiverdquo persons with asthma who were administered 100 ppb sulfur dioxide through a response-maximizing mouthpiece during 10 minutes of moderate exercise
13
(ATSDR 1998) But while statistically significant changes in specific airway resistance can be measured by special techniques in a laboratory or doctorrsquos office they do not necessarily correspond with clinically significant levels of broncho-constriction which the exposed person with asthma will experience when having difficulty in breathing or dyspnea Even in those with asthma symptoms of coughing wheezing and dyspnea typically do not appear until levels of sulfur dioxide reach or exceed 400 ppb In addition during the same 24-hr period those with asthma tend to respond less intensely to subsequent exposures than to the original exposure which is to say that repeated exposure actually reduces sulfur dioxide sensitivity in those with asthma (ATSDR 1998)
Finally in healthy persons without asthma clinically significant lung changes are uncommon below 1000 ppb For example ACGIHrsquos recommended 8-hr TWA-TLV is 2000 ppb Most epidemiologic evidence is mixed (ie limited to none) or insufficient with respect to the assumption that children and elderly adults (65+ years) are more sensitive (ie susceptible) to the effects of sulfur dioxide exposure (USEPA 2008) However evidence (mostly clinical chamber studies) does exist which suggests that pulmonary health status rather than age is the primary determinant of susceptibility to the effects of this gas (Rondinelli et al 1987 Koenig et al 1982)
The brief duration of the single measureable sulfur dioxide concentration of potential clinical significance and the minimal severity of the reversible potential effects of that peak exposure suggest that sulfur dioxide exposures during the malodorous air releases at the ERSI Landfill (final quarter of 2003) were not likely to have posed any serious public health concerns Two facts however provide sufficient reason to err on the side of caution 1) the exposures took place during November and December and cold air exacerbates a person with asthmarsquos response to sulfur dioxide and 2) the available data cannot entirely exclude the possibility that during those 2 months equal or higher exposures may have occurred but were not measured
Thus given the available data ATSDR concludes that the highest peak sulfur dioxide exposures during NovemberndashDecember 2003 may have posed a Past Public Health Hazard especially to more sensitive persons with asthma and perhaps to some non-asthmatics who suffer from other preexisting respiratory conditions
Community Health Concerns and Related Public Health Implications
ATSDR provides an initial response to three community health concerns posed by the petitioner and discusses any related public health implications that may exist in the paragraphs below At least two of these concerns cancer and odors are similar to those posed by the community as a whole (ATSDR 2004)
Multiple Sclerosis
Multiple sclerosis (MS) is a slowly progressive central nervous system (CNS) disease characterized by demyelination of nerve fibers in the brain and spinal cord that results in a variety of neurological symptoms with spontaneous remissions and exacerbations (Merck Manual 1992) The cause of MS is unknown but an immunological abnormality is suspected Viral infection genetic susceptibility and environmental factors associated with the location of early residence (up to 15 years of age) may also be involved Specific chemical exposures however have not been implicated (Williamson 2006) In particular none of the VOCs
14
associated with the malodorous air releases that occurred in the last quarter of 2003 have been associated with MS
Cancer Rates
Because of the number of area landfills and Superfund sites located within the county community residents petitioned ATSDR in 1992 to conduct a health assessment for Lackawanna County The Pennsylvania Department of Health (PADOH) under a cooperative agreement with ATSDR reviewed relevant health data for Taylor Borough PA DOH reviewed cancer mortality data for the years of 1980ndash1991 and cancer incidence data for the years of 1985ndash1989 Statistics for total cancers and for eight cancer sites were analyzed Taylor Borough showed a higher number of anus rectum and rectosigmoid cancers than were reflected in Pennsylvania statewide cancer numbers The report suggested however that nonenvironmental factors such as heredity occupation and diet could increase a persons risk for such cancers PADOH continues to monitor cancer mortality and incidence data for Lackawanna County (ATSDR 1993 PADOH 1999 PADOH 2000 PADOH 2001 PADOH 2002 PADOH 2003 PADOH 2004 PADOH 2005 PADOH 2006 PADOH 2007 PADOH 2008 PADOH 2009)
Only two of the VOCs benzene and vinyl chloride (VC) detected during the ERSI Landfill incident during the last quarter of 2003 are known to be carcinogenic in humans and such carcinogenicity requires exposures that are higher and of longer duration than those experienced at ERSI during the malodorous air releases in 2003 (Raabe amp Wong 1996 Falk amp Steenland 1998) The exposures assessed during the malodorous air releases were not of sufficient duration (lt2 min) to pose any hypothetically increased cancer risk to exposed residents or workers ATSDRrsquos inhalation CREGs are 004 ppb for both benzene and VC (ATSDR 2007 ATSDR 2006a) These concentrations are health guidelines that assume chronic life-long exposure The CREGs are based on a risk of developing cancer within ones lifetime of 1 x 10e-6 Or in other words a lifetime exposure of 1000000 people to 004 ppb benzene or VC would hypothetically result in 1 excess cancer
Odors
Landfills emit gases comprised of a wide range of chemicals Some of these chemicals are strong odorants The VOCs and sulfur compounds measured near the ERSI Amity and Alliance Landfills may only constitute a portion of the chemicals responsible for landfill odor Chemicals associated with landfill odors include trace quantities of 1) sulfur compounds including hydrogen sulfide and organosulfurs (eg mercaptans) 2) volatile acids (eg butyric acid) 3) hydrocarbons (eg limonene) 4) esters (eg methyl butyrate) and 5) alcohols (eg 2-butanol) (Brosseau and Heitz 1994) Many of these compounds have odor thresholds well below levels measured by standard US EPA analytic methods
The relationship between odor and health is not fully understood because odors are complex quantifying them is difficult and the human response to odors is highly variable Schiffman et al (2000) describe three paradigms for producing health symptoms In the first paradigm symptoms are induced by exposure to an odorant at levels that also cause irritation or other toxicological effects Thus the irritation rather than the odor causes symptoms with the odor serving as an exposure marker Indeed for individual VOCs that occur in a mixture laboratory
15
evidence suggests that perceived sensory irritation may occur from exposure to levels below odor thresholds (Cometto Muntildeiz et al 1999)
In the second paradigm exposure to odorous compounds produces health-related symptoms below irritant levels but at levels of odor thresholds This typically occurs with exposure to certain types of sulfur-containing compounds or organic amines These compounds also have odor thresholds well below levels that cause irritation The mechanism by which health complaints result from these types of exposures is not understood but it may include psychological and genetic factors In the third paradigm an odor is associated with a symptom when the odorant is part of a mixture containing a co-pollutant (eg dust or allergen) responsible for the health symptom As in paradigm one the odor acts as an exposure marker
Exposure to landfill gas odor can cause transient effects such as headaches and nausea (ATSDR 2001) The effect of landfill gas odors on sensitive populations such as persons with preexisting respiratory illnesses is not well understood A study conducted in Staten Island New York showed on days of reported odors persons living near a landfill who had asthma also had an increase in self-reported wheezing (ATSDR 1999) Ambient air measurements however showed levels of hydrogen sulfide and other emissions much lower than levels known to be associated with adverse health effects The study nonetheless suggested that odors may trigger respiratory effects among persons who have asthma But this finding in persons with asthma living near a landfill may be confounded by other environmental triggers that can prompt a respiratory response such as dust mites animal dander tobacco smoke and other types of outdoor air pollution
Child Health Considerations
ATSDRrsquos Child Health Initiative recognizes that the unique vulnerabilities of infants and children demand special emphasis in communities concerned about air contamination Children are at greater risk than are adults from certain kinds of exposures to hazardous substances released into their environment Children play outdoors frequently and will more likely be exposed to outdoor air pollution Because children are smaller than adults exposure may result in higher doses per body weight Also childrens developing body systems can sustain damage if toxic exposures occur during critical growth stages Near the ERSI Amity and Alliance Landfills children are potentially exposed to air contaminants due to the off-site migration of landfill gases via fugitive air emissions or from accidental releases due to a failure in the landfill gas collection system ATSDR evaluated the limited offsite air-sampling data to assess the potential health effects on children in the community One concern is the potential exacerbation of childhood asthma from landfill gases (IM 2000)
Limitations and Uncertainties
In preparing this health consultation ATSDR relied on the information or data provided in referenced documents and in PA DEPrsquos web site (Conrad 2003) ATSDR did identify some concerns with this information and will discuss these concerns below ATSDR assumed however that adequate quality assurance and quality control measures were followed with regard to chain-of-custody laboratory procedures and data reporting The validity of the
16
analyses and conclusions drawn in this health consultation is solely determined by the completeness and reliability of the referenced information
As cited earlier the environmental data presented in this health consultation are chiefly from site investigations conducted by PA DEPrsquos Bureau of Laboratories where ambient air monitoring near the ERSI Landfill occurred in November and December 2003 This includes continuous hydrogen sulfide monitoring at two air monitoring stations after the 2003 malodorous air releases This post air monitoring occurred from February through September 2004
ATSDR initially recognized that some of the peak air measurements by the Bureau of Laboratories may have been questionable (refer to Table 16) Those that were considered questionable in Table 16 are highlighted or shaded in green the measured or detected concentration either appeared at the end or outside of the monitoring period Still for the detected substances some of the questionable measurements were within the range of measured peak air concentrations ATSDR considered valid (highlighted or shaded in yellow) ATSDR considered these questionable peak air measurements useable for this public health evaluation though they were measured at the end or outside of the monitoring period
The first concern ATSDR had with the referenced information was the methodology used to measure hydrogen sulfide levels PA DEPrsquos Bureau of Laboratories selected an analytical method in which the reporting limits were relatively fine for most of the targeted substances that is the reporting limits (limits of quantification) were either in line with or marginally above the substancersquos regulatory limits
This was not however the case for hydrogen sulfide For the air measurements made the analytical methodrsquos reporting limit for hydrogen sulfide ranged from 1897 ppb to 9898 ppb Moreover PA DEPrsquos regulatory limit for hydrogen sulfide is an average air concentration of 100 ppb over a period of 1 hour (peak or brief exposures) and an average air concentration of 5 ppb over a period of 24 hours (daily exposure) implying these are maximum values that may not be exceeded (PA DEP 2008c) Assuming a method detection limit (MDL) of 1000 ppb the reporting limits are more than one order of magnitude (10 times) higher than the 1-hour regulatory limit of 100 ppb and two orders (200 times) higher than the 24-hour regulatory limit of 5 ppb
As evidenced by the number of odor complaints the public health effect of exposures at 100 ppb or more can be significant especially if levels exceed 2000 ppb (ie a level that could trigger transient health effects in those with asthma or in those with respiratory conditions) Peak levels of hyrdogen sulfide were detected twice (Table 16) at levels exceeding 2000 ppb 6 355 ppb and 8906 ppb No hourly averages of hydrogen sulfide are reported in Table 17 given that for each individual air measurement average reporting levels are below the reported detection limit (Note for hydrogen sulfide the H2S detection limits are greater than PA DEPrsquos 1-hr regulatory limit of 100 ppb) Whether the average H2S concentration could have been lower than 100 ppb (PA DEP 1-hr regulatory limit for hydrogen sulfide) is unknown however if H2S levels approach 100 ppb or lower the levels probably would not cause any adverse health effects in ATSDRrsquos judgment other than an unbearable odor that most residents would complain about
The latter sentences in the above paragraph are indicative of how governmental agencies may define the objective of an ambient air monitoring effort differently A monitoring effort conducted by a regulatory government agency such as PA DEP usually place emphasis on
17
identifying the odor source This objective helps the regulatory agency to cite who may be responsible if any violations were committed and how to remedy the situation PA DEP validated that the objective of the monitoring effort was limited to determining if the landfill was the source of the odors and to confirm that decomposition gasses from the landfill was also an additional source of odors (Tomayko 2009) Following such an objective would provide PA DEP and ERSI operators with the knowledge that implementing a gas management plan would achieve the goal of eliminating the source of the odors and properly managing landfill gases ATSDR (a public health agency) on the other hand is more concerned with health impacts and feels that the primary objective is to determine whether a toxic substance is released Moreover ATSDR is also concerned whether air levels may pose a fire or explosion hazard and whether the attained concentrations are of serious health concern The latter is important because in its review of operational data for the newly installed and repaired gas collection system ATSDR found out that hydrogen sulfide levels within the system (ie gas flow lines) ranged from 1500 ppm (1500000 ppb) to 2000 ppm (2000000 ppb) Scientific studies and observations have shown that H2S exposures presumably at and above 500 ppm (500000 ppb) can cause serious and irreversible health effects (ATSDR 2006b) No gas collection system was in place at the ERSI Landfill before December 2003 and portions of the original gas collection system at the Amity Landfill were in bad repair Because of dilution with ambient air whether unconfined levels of hydrogen sulfide reached or approached concentrations of serious health concern (ie the level of 500 ppm or greater) is unknown
Another unknown was the selection of sampling locations ATSDR feels that the selection should be based on fireexplosion hazard toxicity odor source landfill history landfill construction location of receptor populations and other area sources of contamination (For more information pertaining to sampling strategy and locations refer to Appendix E for ATSDRrsquos proposed guidelines on evaluating gases migrating from landfills) Noting the above objective PA DEP felt the sampling effort met the overall goal of identifying the problem taking immediate steps to correct the problem and providing post monitoring to confirm that the gas management controls were effective
PA DEP felt the sampling strategy used to make air measurements during the malodorous air releases in 2003 provided information that allowed them to support enforcement and get a gas management system installed to correct the odor problem ATSDR however felt the sampling effort provided limited information indicating that the highest or peak exposures probably approached levels near 9 ppm (9000 ppb) where studies have shown transientreversible health effects to occur
Landfill Emergency ResponseContingency Plan
ATSDR believes that during the malodorous air releases of 2003 when ERSI landfill operators experienced problems with uncontrollable and unbearable odors the necessary emergency response and contingency actions were not taken to alert and perhaps even evacuate the public A landfill emergency response and contingency plan was not in place for the landfill The belief was that the landfill would not generate a substantial amount of odors (ie only construction and demolition waste was collected) After the malodorous air releases operators installed a gas collection system to control and prevent landfill gases from migrating into the outlying residential communities PA DEP thus decided to revise the original landfill permit to include a
18
Nuisance Minimization and Control Plan This plan was finalized via a permit modification in February 22 2006 as imposed by PA DEPrsquos Waste Management Program (Tomayko 2006) The plan requires the landfill operators to comply with the prime directive of controlling odors and preventing the off-site migration of landfill gases while managing and maintaining the gas collection system The plan does not however list the emergency response contingency and community health actionsmdashif a substantial failure to the gas collection system were to occurmdashto mitigate or prevent likely exposures (eg residentialretail areas) to elevated levels of landfill gases The revised Nuisance Minimization and Control Plan may be adequate for odor control and minimizing minor odor effects but it should in no way be considered a substitute for an Emergency ResponseContingency Plan PA DEP regulations do require landfills to have emergency responsecontingency plans and such a plan exists for the ERSI Landfill (PA DEP 2009b Tomayko 1995) This plan is separate from the nuisance minimization plan referenced above (Tomayko 2009) Moreover ERSI operators have also submitted such a plan as part of its expansion application which is under review
When developing an Emergency Response Contingency Plan for a landfill ATSDR feels the plan should at least consider and include the following
List of target compounds monitored and whether these compounds present a fire or explosion hazard are toxic or can attain concentrations of health concern
List of corrective contingency and safetyhealth actions taken in the event an emergency or accident occurs at the landfill (eg fire explosion or substantial failure of the gas collection system)
Description of how first responders and other healthsafety authorities (eg PA DEP PA DOH county health department fire department police department) are notified and their collaborative response to address an emergency or accident at the landfill
Description of the tiered procedure of alerting and perhaps evacuating residents who live near the landfill
Conclusions
During the 2003 malodorous air releases spanning between September and December ATSDR classified the releases of landfill gases from the ERSI Landfill as a Past Public Health Hazard Peak exposures to hydrogen sulfide and sulfur dioxide could have made some residents of the surrounding community experience transient health effects (eg headaches nausea choking cough tearing of eyes aggravation of asthma) ATSDR considered however whether insofar as the public was concerned these health effects were considered reversible (ie whether the peak exposures could cause significant harm to health then or possibly in the future) Moreover post sampling after the malodorous air releases and upon completion of remediation efforts suggested that the exposures to landfill gases from the ERSI Landfill were significantly reduced and were considered No Apparent Public Health Hazard
19
During the Malodorous Period of 2003 Spanning between September and December
The peak levels of hydrogen sulfide (H2S) and sulfur dioxide (SO2) measured in the community adjacent to the ERSI Landfill presented a Past Public Health Hazard to exposed residents for short duration exposures
The levels of the remaining landfill gases notably methane (CH4) measured in the community adjacent to the ERSI Landfill were below levels expected to cause adverse health effects for short duration exposures Therefore ATSDR classified exposures to the remaining landfill gases from the ERSI Landfill as a No Apparent Public Health Hazard
Post Sampling after the 2003 Malodorous Air Releases
The levels of hydrogen sulfide measured in the community adjacent to the ERSI Landfill facility were below levels expected to cause adverse health effects thus ATSDR classified such exposures as No Apparent Public Health Hazard for short or long duration exposures
Recommendations
Environmental and Recycling Services Inc (ERSI) should
Initiate and implement a landfill emergency responsecontingency plan especially if granted a landfill expansion permit The contingencyemergency response plan should be a collaborative effort with the Commonwealth of Pennsylvania Department of Environmental Protection (PA DEP) the Pennsylvania Department of Health (PADOH) and other healthsafety authorities within the countycity while prompting community health actions to protect nearby residents from likely exposures (eg residentialretail areas) to elevated levels of landfill gases notably hydrogen sulfide (H2S) generated particularly from an uncontrolled or accidental release of gases at the landfill
Initiate and continue to maintain proper odor-management practices particularly when excavating and when altering landfill cover
Notify the PA DEP before commencing any work that will uncover large volumes of materials used for landfill cover or immediately following any substantial failure of the landfill gas-collection system
20
Authors
Primary Author
David S Sutton PhD PE Environmental Engineer Environmental Health Scientist Site Assessment Team Exposure Investigations and Site Assessment Branch Division of Health Assessment and Consultation Agency for Toxic Substances and Disease Registry
Secondary AuthorsTechnical Assists
Frank C Schnell PhD DABT Senior Toxicologist Exposure Investigations Team Exposure Investigations and Site Assessment Branch Division of Health Assessment and Consultation Agency for Toxic Substances and Disease Registry
Lourdes Guevara-Rosales MD Medical Officer Exposure Investigations Team Exposure Investigations and Site Assessment Branch Division of Health Assessment and Consultation Agency for Toxic Substances and Disease Registry
Reviewers
Susan Moore Chief Exposure Investigations and Site Assessment Branch Division of Health Assessment and Consultation Agency for Toxic Substances and Disease Registry
Peter Kowalski MPH CIH Lead Environmental Health Specialist Site Assessment Team Exposure Investigations and Site Assessment Branch Division of Health Assessment and Consultation Agency for Toxic Substances and Disease Registry
Ana Pomales Regional Representative Region III Division of Regional Operations Agency for Toxic Substances and Disease Registry
21
Wallace K Sagendorph JD Writer Editor National Center for Environmental Health
and Agency for Toxic Substances and Disease Registry
22
References
Agency for Toxic Substances and Disease Registry Site Review and Update Taylor Borough Dump Lackawanna County PA Atlanta US Department of Health and Human Services 1993 September 29
Agency for Toxic Substances and Disease Registry 1998 Toxicological profile for sulfur dioxide Atlanta US Department of Health and Human Services December
Agency for Toxic Substances and Disease Registry 1999 A panel study of acute respiratory outcomes Staten Island New York Atlanta US Department of Health and Human Services
Agency for Toxic Substances and Disease Registry 2001 Landfill gas primer an overview for environmental health professionals Atlanta US Department of Health and Human Services November
Agency for Toxic Substances and Disease Registry 2003 Empire Sanitary Landfill (aka Alliance Landfill) Health Consultation minus Public Comment Release Atlanta US Department of Health and Human Services August
Agency for Toxic Substances and Disease Registry 2004 Empire Sanitary Landfill (aka Alliance Landfill) Health consultation minus Final Release Atlanta US Department of Health and Human Services August
Agency for Toxic Substances and Disease Registry 2005 Public health assessment guidance manual Atlanta US Department of Health and Human Services
Agency for Toxic Substances and Disease Registry 2006a Toxicological profile for vinyl chloride Atlanta US Department of Health and Human Services July
Agency for Toxic Substances and Disease Registry 2006b Toxicological profile for hydrogen sulfide Atlanta US Department of Health and Human Services July
Agency for Toxic Substances and Disease Registry 2007 Toxicological profile for benzene Atlanta US Department of Health and Human Services August
Agency for Toxic Substances and Disease Registry 2008 Keyser Avenue Air Monitoring Station (aka Alliance Landfill) Health Consultation Atlanta US Department of Health and Human Services February
[ACGIHreg] American Conference of Governmental Industrial Hygienists 2008 TLVsreg and BEIsreg Cincinnati Ohio Publication 0108 ISBN 978-1-882417-79-7 Copyright copy 2008
Bellas R 2008 Operations Chief Northeast Regional Office PA DEP December 30 26 email to Tammi McCrae ATSDR Ana Pomales ATSDR William Tomayko PA DEP Debra Gable ATSDR Lora Werner ATSDR and Mark White PA DOH Subject Alliance Data
Bhambhani Y Burnham R Snydmiller G et al 1996 Effects of 10-ppm hydrogen sulfide inhalation on pulmonary function in health men and women J Occup Environ Med 381012shy1017
BOC Gases Material Safety Data Sheet ndash Carbonyl Sulfide Revised June 7 1996 Available at httpwwwvngascompdfg21pdf [accessed 2009 Aug 17]
23
Brosseau J Heitz M 1994 Trace gas compounds from municipal landfill sanitary sites Atmos Environ 28285ndash93
Cometto-Muntildeiz JE Cain WS Abraham MH Gola JMR 1999 Chemosensory detectability of 1shybutanol and 2-heptanone singly and in binary mixtures Physiol Behav 67(2)269ndash76
Conrad RE 2003 Chief Bureau of Laboratories ndash Mobile Laboratory Group PA DEP December 17 memorandum to Leonard Insalaco Emergency Response Program Manager North East Regional Office PA DEP
Falk H Steenland NK 1998 Vinyl chloride and polyvinyl chloride In Environmental and Occupational Medicine 3rd Ed edited by William N Rom Lippincott-Raven Publishers Philadelphia PA Chapter 93 pp 1251-59
[IM] Institute of Medicine 2000 Committee on the Assessment of Asthma and Indoor Air Clearing the air asthma and indoor air exposures Washington DC Division of Health Promotion and Disease Prevention
Jaumlppinen P Vikka V Marttila O et al 1990 Exposure to hydrogen sulphide and respiratory function Br J Intern Med 47824ndash28
Koenig JQ Pierson WE Horike M et al 1982 Effects of inhaled sulfur dioxide (SO2) on pulmonary function in healthy adolescents Exposure to SO2 + sodium chloride droplet aerosol during rest and exercise Arch Environ Health 375ndash9
The Merck Manual of Diagnosis amp Therapy 1992 Volume 1 General medicine Rahway NJ Merck Research Laboratories Division of Merck amp Co Inc p 1287ndash89
[MI DEQ] Michigan Department of Environmental Quality 2008 Air Pollution Control Rules - Part 2 Air Use Approvals (As Amended June 20 2008) R 3361232-Methodology for Determining Initial Threshold Screening Level (ITSL) Lansing MI Michigan Department of Environmental Protection Air Quality Division Available at httpwwwdeqstatemiusapcratsdeq-aqd-air-rules-apc-PART2htmR232 [accessed 2009 Jul 14]
[PA DEP] Pennsylvania Department of Environmental Protection 2008a Permits Licensing and Certification ndash Environment Facility Application Compliance Tracking System Harrisburg PA Commonwealth of Pennsylvania ndash Department of Environmental Protection Bureau of Air Quality Available at httpwwwahs2depstatepauseFactsWebdefaultaspx [accessed 2008 Dec 4]
[PA DEP] Pennsylvania Department of Environmental Protection 2008b Ambient Air Monitoring Data Reports Harrisburg PA Commonwealth of Pennsylvania ndash Department of Environmental Protection Bureau of Air Quality Available at httpwwwdepstatepausaq_appsaadata [accessed 2008 Sep 15]
[PA DEP] Pennsylvania Department of Environmental Protection 2008c Title 25 Environmental ProtectionndashChapter 131Ambient Air Quality Standards Section 1313 Harrisburg PA Available at httpwwwpacodecomsecuredata025chapter131chap131tochtml [accessed 2008 Sep 22]
24
[PA DEP] Pennsylvania Department of Environmental Protection 2009a News Release Commonwealth of Pennsylvania (for immediate release on 212006) DEP Denies ERSI Landfill Expansion Harrisburg PA Commonwealth of Pennsylvania ndash Department of Environmental Protection Bureau of Air Quality Available at httpwwwahs2depstatepausnewsreleasesdefaultaspID=3796ampvarQueryType=Detail [accessed 2009 Jul 1]
[PA DEP] Pennsylvania Department of Environmental Protection 2009b Title 25 Environmental ProtectionndashChapter 277ConstructionDemolition Waste Landfills Sections 277181 and 277301ndash277303 Harrisburg PA Available at httpwwwpacodecomsecuredata025chapter277chap277tochtml [accessed 2009 November 17]
[PADOH] Pennsylvania Department of Health October 1999 An Analysis of Cancer Incidence in Pennsylvania Counties 1992-1996 Harrisburg PA Available at httpwwwportalstatepausportalserverptopen=514ampobjID=596023ampmode=2 [accessed 2010 March 3]
[PADOH] Pennsylvania Department of Health June 2000 An Analysis of Cancer Incidence in Pennsylvania Counties 1993-1997 Harrisburg PA Available at httpwwwportalstatepausportalserverptopen=514ampobjID=596023ampmode=2 [accessed 2010 March 3]
[PADOH] Pennsylvania Department of Health August 2001 An Analysis of Cancer Incidence in Pennsylvania Counties 1994-1998 Harrisburg PA Available at httpwwwportalstatepausportalserverptopen=514ampobjID=596023ampmode=2 [accessed 2010 March 3]
[PADOH] Pennsylvania Department of Health July 2002 An Analysis of Cancer Incidence in Pennsylvania Counties 1995-1999 Harrisburg PA Available at httpwwwportalstatepausportalserverptopen=514ampobjID=596023ampmode=2 [accessed 2010 March 3]
[PADOH] Pennsylvania Department of Health August 2003 An Analysis of Cancer Incidence in Pennsylvania Counties 1996-2000 Harrisburg PA Available at httpwwwportalstatepausportalserverptopen=514ampobjID=596023ampmode=2 [accessed 2010 March 3]
[PADOH] Pennsylvania Department of Health July 2004 An Analysis of Cancer Incidence in Pennsylvania Counties 1997-2001 Harrisburg PA Available at httpwwwportalstatepausportalserverptopen=514ampobjID=596023ampmode=2 [accessed 2010 March 3]
[PADOH] Pennsylvania Department of Health August 2005 An Analysis of Cancer Incidence in Pennsylvania Counties 1998-2002 Harrisburg PA Available at httpwwwportalstatepausportalserverptopen=514ampobjID=596023ampmode=2 [accessed 2010 March 3]
25
[PADOH] Pennsylvania Department of Health September 2006 An Analysis of Cancer Incidence in Pennsylvania Counties 1999-2003 Harrisburg PA Available at httpwwwportalstatepausportalserverptopen=514ampobjID=596023ampmode=2 [accessed 2010 March 3]
[PADOH] Pennsylvania Department of Health July 2007 An Analysis of Cancer Incidence in Pennsylvania Counties 2000-2004 Harrisburg PA Available at httpwwwportalstatepausportalserverptopen=514ampobjID=596023ampmode=2 [accessed 2010 March 3]
[PADOH] Pennsylvania Department of Health November 2008 An Analysis of Cancer Incidence in Pennsylvania Counties 2001-2005 Harrisburg PA Available at httpwwwportalstatepausportalserverptopen=514ampobjID=596023ampmode=2 [accessed 2010 March 3]
[PADOH] Pennsylvania Department of Health November 2009 An Analysis of Cancer Incidence in Pennsylvania Counties 2002-2006 Harrisburg PA Available at httpwwwportalstatepausportalserverptopen=514ampobjID=596023ampmode=2 [accessed 2010 March 3]
Raabe GK Wong O 1996 Leukemia Mortality by Cell Type in Petroleum Workers with Potential Exposure to Benzene Environmental Health Perspectives (supl) 104(6) 1381-92
Rondinelli RCA Koenig L Marshall SG (1987) The effects of sulfur dioxide on pulmonary function in healthy nonsmoking male subjects aged 55 years and older Am Ind Hyg Assoc J 48 299-303
Schiffman SS Walker JM Dalton P Lorig TS Raymer JH Shusterman D Potential health effects of odor from animal operations waste water treatment and recycling of byproducts J Agromed 20007(1)7-81
Thrasher JD [first accessed 2006 Aug 28] Poison of the Month ndash Toxicology of Hydrogen Sulfide Available at httpwwwdrthrasherorgToxicology_of_Hydrogen_Sulfidehtml [last accessed 2009 Aug 17]
Tomayko W 1995 Acting Program Manager Waste Management Program PA DEP October 6 letter to Joseph Amity Environmental and Recycling Services Inc Re Issuance of Permit ndash Environmental and Recycling Services Inc ndash ID 100932 Taylor Borough Lackawanna County Pennsylvania
Tomayko W 2006 Program Manager Waste Management Program PA DEP February 22 letter to Patrice E Amity-Haan Environmental and Recycling Services Inc Re Major Permit Modification ndash ERSI Landfill Gas System Improvements amp Amity Landfill Gas SystemCap Improvements ndash ID 100932-A042 Taylor Borough Lackawanna County Pennsylvania
Tomayko W 2008 Program Manager Waste Management Program PA DEP February 26 email to Ana Pomales ATSDR Division of Regional Operations
Tomayko W 2009 Program Manager Waste Management Program PA DEP November 12 email to Ana Pomales ATSDR Division of Regional Operations Subject ERSI Landfill hellip
26
[USEPA] US Environmental Protection Agency 2008 Integrated Science Assessment (ISA) for Sulfur Oxides ndash Health Criteria (Final Report) Washington DC Office EPA600R-08047F
[USEPA-IRIS] US Environmental Protection Agency Integrated risk information system Cincinnati Office of Health and Environmental Assessment Environmental Criteria and Assessment Office Available at httpwwwepagoviriswebpirissubst0061htm [accessed 2008 Jul 16]
Williamson DM 2006 Studies of multiple sclerosis in communities concerned about environmental exposures J Womenrsquos Health 15(7)810ndash14
[WI DNR] Michigan Department of Natural Resources 2000 Understanding Wisconsins Hazardous Air Pollutant Rules amp Requirements Madison WI Wisconsin Department of Natural Resources Air Management Program Available at httpdnrwigovairpdfunderstandingHAPspdf [accessed 2009 Jul 14]
27
APPENDIX A
Comparison Values
ATSDR comparison values (CVs) are media-specific concentrations considered safe under default conditions of exposure They are used as screening values in selecting site-specific chemicals or substances for further evaluation of their public health implications Generally a substance is selected for further public health evaluation because its maximum concentration in air water or soil at the site exceeds at least one of ATSDRs CVs This approach is conservative by design ATSDR may also select detected chemicals or substances for further public health evaluation and discussion because ATSDR has no CVs or because the community has expressed special concern about the substance whether it exceeds CVs or not
CVs are not thresholds of toxicity While concentrations at or below the relevant CV are generally considered to be safe it does not automatically follow that any environmental concentration that exceeds a CV would be expected to produce adverse health effects In fact the whole purpose behind highly conservative health-based standards and guidelines is to enable health professionals to recognize and resolve potential public health problems before they become actual health hazards For that reason ATSDRrsquos CVs are typically designed to be 1 to 3 orders of magnitude lower (ie 10 to 1000 times lower) than the corresponding noshyobserved-adverse-effect levels (NOAEL) or lowest-observed-adverse-effect levels (LOAEL) on which they are based The probability that adverse health outcomes will actually occur depends not on environmental concentrations alone but on several additional factors including site-specific conditions of exposure and individual lifestyle and genetic factors that affect the route magnitude and duration of actual exposures
Listed below are the abbreviations for selected CVs and units of measure used within this public health document for peak and short-term exposures to substances in the air Following this list of abbreviations are more complete descriptions of the various comparison values used within this public health document
AAC = Acceptable Ambient Concentration
AAL = Ambient Air Limit
ASIL = Acceptable Source Impact Level
AEGL = Acute Exposure Guideline Level
EMEG = Environmental Media Evaluation Guide
EPRG = Emergency Response Planning Guideline
HAAS = Hazardous Ambient Air Standard
IDLH = Immediately Dangerous to Life and Health
ITSL = Initial Threshold Screening Level
LC50 = Lethal Concentration(50)
LD50 = Lethal Dose(50)
LOAEL = Lowest-Observed-Adverse-Effect Level
MRL = Minimal Risk Level
NOAEL = No-Observed-Adverse-Effect Level
29
OEL = Occupational Exposure Limit
PEL = Permissible Exposure Limit
REL = Recommended Exposure Limit
RfC = Reference Concentration
RfD = Reference Dose
TLV-C = Threshold Limit ValuendashCeiling
TLV-STEL = Threshold Limit ValuendashShort-Term Exposure Limit
TLV-TWA = Threshold Limit ValuendashTime Weighted Average
Units of Measure
ppm = parts per million [eg mgL (water) mgkg (soil)]
ppb = parts per billion [eg microgL (water) microgkg (soil)]
kg = kilogram (1000 grams)
mg = milligram (0001 gram)
microg = microgram (0000001 gram)
L = liter (1000 mL or 1057 quarts of liquid or 0001 m3 of air)
m3 = cubic meter (a volume of air equal to 1000 liters)
Two CVs or exposure limits commonly used by ATSDR for assessing the public health implications due to acute (short-term) domestic (residential) exposures from substances within the air are listed below
Environmental Media Evaluation Guides (EMEGs) are media-specific concentrations that are calculated from ATSDRs Minimal Risk Levels by factoring in default body weights and ingestion rates Different EMEGs are calculated for adults and children as well as for acute (lt14 days) intermediate (15-364 days) and chronic (gt 365 days) exposures
Minimal Risk Levels (MRLs) are ATSDR estimates of daily human exposures to a chemical that are unlikely to be associated with any appreciable risk of deleterious noncancer effects over a specified duration of exposure MRLs are calculated using data from human and animal studies and are reported for acute (lt 14 days) intermediate (15-364 days) and chronic (gt 365 days) exposures MRLs for oral exposure (ie ingestion) are doses and are typically expressed in mgkgday Inhalation MRLs are concentrations and are typically expressed in either parts per billion (ppb) or microgm3 The latter are identical to ATSDRrsquos EMEGs for airborne contaminants ATSDRrsquos MRLs are published in ATSDR Toxicological Profiles for specific chemicals
More and more governmental departments (local state and federal) businesses corporations health offices hospitals and professionalnon-profit organizations are becoming involved with emergency preparedness and response activities Thus some of these entities started developing guidelines or exposure limits for responding to potential releases of airborne substances for use in emergency response planning One such exposure limit has been developed by the Environmental Protection Agency (EPA) and is called the Acute Exposure Guideline Level (AEGL) which is described below Another emergency response exposure limit is termed the Emergency Response Planning Guideline (ERPG) This emergency response exposure limit was
30
developed by the American Industrial Hygiene Association (AIHA) and will be described later on within Appendix A
Acute Exposure Guideline Level (AEGL) represents a threshold exposure limit for the general public and is applicable to emergency exposure periods ranging from 10 minutes to 8 hours (ie peak and short-term exposures) AEGL-1 AEGL-2 and AEGL-3 values will be developed for each of five exposure periods (10 and 30 min 1 hr 4 hr and 8 hr) and will be distinguished by varying degrees of severity of toxic effects It is believed that the recommended exposure levels are applicable to the general population including infants and children and other individuals who may be susceptible The three AEGL values are defined as follows
AEGL-1 is the airborne concentration (expressed as parts per million or milligrams per cubic meter (ppm or mgm3)) of a substance above which it is predicted that the general population including susceptible individuals could experience notable discomfort irritation or certain asymptomatic non-sensory effects However the effects are not disabling and are transient and reversible upon cessation of exposure
AEGL-2 is the airborne concentration (expressed as ppm or mgm3) of a substance above which it is predicted that the general population including susceptible individuals could experience irreversible or other serious long-lasting adverse health effects or an impaired ability to escape
AEGL-3 is the airborne concentration (expressed as ppm or mgm3) of a substance above which it is predicted that the general population including susceptible individuals could experience life-threatening health effects or death
Airborne concentrations below the AEGL-1 represent exposure levels that can produce mild and progressively increasing but transient and non-disabling odor taste and sensory irritation or certain asymptomatic non-sensory effects With increasing airborne concentrations above each AEGL there is a progressive increase in the likelihood of occurrence and the severity of effects described for each corresponding AEGL Although the AEGL values represent threshold levels for the general public including susceptible subpopulations such as infants children the elderly persons with asthma and those with other illnesses it is recognized that individuals subject to unique or idiosyncratic responses could experience the effects described at concentrations below the corresponding AEGL
The following CVs or exposure limits are used at the workplace to protect workers from potential harmful exposures that may impair their health or functional capacity throughout their entire career or work life In keeping a proper perspective ambient air levels measured in domestic settings outside of the workplace are sometimes compared to these occupational exposure limits (OELs) If such domestic air levels exceed these OELs this may require that appropriate health actions be implemented or taken
Permissible Exposure Limit (PEL) is an 8-hour time-weighted average concentration or occupational exposure limit (OEL) of a substance in workplace air designed by the Occupational Safety and Health Administration (OSHA) to assure to the extent feasible that chemical exposures in the workplace do not impair the health or functional capacity of
31
workers throughout their working life The PEL may be exceeded for brief periods but the sum of the exposure levels averaged over 8 hours must not exceed the PEL
Recommended Exposure Limit (REL) is similar to a PEL since it is developed for the workplace air exposures however the REL is designed by the National Institute for Occupational Safety and Health (NIOSH) and based on a time-weighted average (TWA) for up to a 10 hour workday during a 40-hour work week Moreover a PEL is regulatory and legally enforceable while a REL is not RELs are also grouped into two subclasses similar to Threshold Limit Values (TLVs) as established by the American Conference of Governmental Industrial Hygienists (ACGIHreg) to consider short-term and peak exposures These REL subclasses are Short-Term Exposure Limit (STEL) and Ceiling (C)
Immediately Dangerous to Life and Health (IDLH) is an airborne concentration as established by the National Institute for Occupational Safety and Health (NIOSH) from which a worker could escape without injury or irreversible health effects from an IDLH exposure in the event of the failure of respiratory protection equipment The IDLH was considered a maximum concentration above which only a highly reliable breathing apparatus providing maximum worker protection should be permitted In determining IDLH values NIOSH considered the ability of a worker to escape without loss of life or irreversible health effects along with certain transient effects such as severe eye or respiratory irritation disorientation and in-coordination which could prevent escape As a safety margin IDLH values are based on effects that might occur as a consequence of a 30-minute exposure However the 30-minute period was not meant to imply that workers should stay in the work environment any longer than necessary in fact every effort should be made to exit immediately
Threshold Limit ValuendashTime Weighted Average (TLV-TWA) according to the American Conference of Governmental Industrial Hygienists (ACGIHreg) is the time-weighted average (TWA) concentration or occupational exposure limit (OEL) of a substance for a normal 8shyhour workday and a 40-hour workweek to which nearly all workers may be repeatedly exposed day after day without adverse effect Many of ACGIHs TLVs were adopted by OSHA for use as PELs
Threshold Limit ValuendashShort-Term Exposure Limit (TLV-STEL) according to the American Conference of Governmental Industrial Hygienists (ACGIHreg) is a 15-minute time weighted average (TWA) exposure limit of a substance that should not be exceeded at any time during a workday even if the 8-hour TWA is within the Threshold Limit ValuendashTime-Weighted Average (TLV-TWA) Exposure Limit The TLV-STEL is the concentration or occupational exposure limit (OEL) to which it is believed that workers can be exposed continuously for a short period of time without suffering from 1) irritation 2) chronic or irreversible tissue damage 3) dose-rate-dependent toxic effects or 4) narcosis of sufficient degree to increase the likelihood of accidental injury impaired self-rescue or materially reduced work efficiency The TLV-STEL will not necessarily protect against these effects if the daily TLV-TWA is exceeded The TLV-STEL is not a separate independent exposure guideline rather it supplements the TLV-TWA where there are recognized acute effects from a substance whose toxic effects are primarily of a chronic nature Exposures above the TLV-TWA up to the TLV-STEL should be less than 15 minutes should occur not more than four times per day and there should be at least 60 minutes between successive exposures in
32
this range An averaging period other than 15 minutes may be recommended when this is warranted by observed biological effects
Threshold Limit ValuendashCeiling (TLV-C) according to the American Conference of Governmental Industrial Hygienists (ACGIHreg) is the concentration or occupational exposure limit (OEL) of a substance that should not be exceeded during any part of the working exposure If instantaneous measurements are not available sampling should be conducted for the minimum period of time sufficient to detect exposures at or above the ceiling value ACGIHreg believes that TLVsreg based on physical irritation should be considered no less binding than those based on physical impairment There is increasing evidence that physical irritation may initiate promote or accelerate adverse health effects through interaction with other chemical or biologic agents or through other mechanisms
TLVs and PELs which were designed to protect healthy workers are usually much higher than the health-based values of ATSDR and EPA which were designed to protect the health of the general population including the very young and the elderly ATSDR does not base any of its community health decisions solely or primarily on TLVs or PELs but these and other non-ATSDR values may be referred to in Public Health Assessments or consultations as a means of providing the reader with an expanded and perhaps more meaningful perspective on the concentrations of chemicals or substances detected at a site
The American Industrial Hygiene Association (AIHA) is a scientific organization concerned with environmental exposures to toxic airborne substances within the workplace AIHA also has developed an emergency response exposure limit Emergency Response Planning Guideline (EPRG) similar to the AEGL as derived by EPA ERPG values are intended to provide estimates of concentration ranges in air where one reasonably might anticipate observing adverse effects as a consequence of exposure to a specific substance ERPG values are based on OELs (eg PELs RELs TLVs etc) being rationally lowered upon internal review of appropriate scientific studies to exposure limits considered protective of nearly all individuals within certain domestic settings subjected to a specific emergency response situation The AIHA has provided guidance on the utilization of three exposure limits each defined and briefly discussed below
ERPG-1 The maximum airborne concentration below which it is believed that nearly all individuals could be exposed for up to one hour without experiencing other than mild transient adverse health effects or without perceiving a clearly defined objectionable odor The ERPG-1 identifies a level which does not pose a health risk to the community but which may be noticeable due to slight odor or mild irritation In the event that a small non-threatening release has occurred the community could be notified that they may notice an odor or slight irritation but that concentrations are below those which could cause unacceptable health effects
ERPG-2 The maximum airborne concentration below which it is believed that nearly all individuals could be exposed for up to one hour without experiencing or developing irreversible or other serious health effects or symptoms which could impair an individuals ability to take protective action Above the ERPG-2 there may be significant adverse health effects signs or symptoms for some members of the community which could impair an individuals ability to take protective action These effects might include severe eye or
33
respiratory irritation muscular weakness CNS impairments or serious adverse health effects
ERPG-3 The maximum airborne concentration below which it is believed that nearly all individuals could be exposed for up to one hour without experiencing or developing life-threatening health effects The ERPG-3 level is a worst-case planning level above which there is the possibility that some members of the community may develop life threatening health effects This guidance level could be used to determine the airborne concentration of a chemical that could pose life threatening consequences should an accident occur This concentration could be used in planning stages to project possible levels in the community Once the distance from the release to the ERPG-3 level is known the steps to mitigate the potential for such a release can be established
AIHA recognizes (and should be remembered by all who make use of these values) that human responses do not occur at precise exposure levels but can extend over a wide range of concentrations The values derived for ERPGs should not be expected to protect everyone but should be applicable to most individuals in the general population In all populations there are hypersensitive individuals who will show adverse responses at exposure concentrations far below levels where most individuals normally would respond Furthermore since these values have been derived as planning and emergency response guidelines not exposure guidelines they do not contain the safety factors normally incorporated into exposure guidelines Instead they are estimates by the AIHA of the thresholds above which there would be an unacceptable likelihood of observing the defined effects The estimates are based on the available data that are summarized in the documentation In some cases where the data are limited the uncertainty of these estimates is large Users of the ERPG values are encouraged strongly to review carefully the documentation before applying these values
In developing these ERPGs human experience has been emphasized to the extent data are available Because however this type of information is rarely available and when available is only for low level exposures animal exposure data most frequently forms the basis for these values The most pertinent information is derived from acute inhalation toxicity studies that have included clinical observations and histopathology The focus is on the highest levels not showing the effects described by the definitions of the ERPG levels Next data from repeat inhalation exposure studies with clinical observations and histopathology are considered Following these in importance are the basic typically acute studies where mortality is the major focus When inhalation toxicity data are either unavailable or limited data from studies involving other routes of exposure will be considered More value is given to the more rigorously conducted studies and data from short-term studies are considered to be more useful in estimating possible effects from a single 1-hr exposure Finally if mechanistic or dose-response data are available these are applied on a case by case basis as appears appropriate
It is recognized that there is a range of times that one might consider these guidelines however it was AIHAs decision to focus its efforts on only one time period This decision was based on the availability to toxicology information and a reasonable estimate for an exposure scenario Users who may choose to extrapolate these values to other time periods are cautioned to review the documentation fully since such extrapolations tend to hold only over very limited time frames it at all
34
Environmental health departments of some state governments sometimes use OELs (eg PELs RELs TLVs etc) as a source for deriving peak and short-term ambient air standards by subjecting them to specified reduction factors These reduction factors may account for several factors including 1) TLVs are premised on an 8-hour work-day and 5-day work week while ambient standards are premised on continuous exposure for a lifetime 2) TLVs are premised on a worker population that is relatively more healthy than the general population and 3) generic application of ldquosafety factorsrdquo are utilized in its formulation Reduction factors for various states could possibly range from 110 to 14200 The various reduction factors employed by the states were all designed via a rational regulatory process integrated with health-based considerations in mind A tabular listing below shows the peak and short-term ambient air standards for five different states used within this public health document Each of these peak and short-term standards are defined and briefly discussed following the tabular listing
Peak amp Short-Term Air Standards of Five Different States
State Reduction Factor (RF) RF ndash Citation
R 3361232 (c) Michigan ITSL 1100 httpwwwmichigangovdocumentsde
q-aqd-toxics-toxicsrules_117404_7doc
Env-A-1400 New Hampshire AAL 1(24 to 420) httpwwwdesstatenhusrulesenv-
a1400pdf
Vermont HAAS 1(42 420 or 4200) section 5-261 appendix D (accumulation and or httpwwwanrstatevtusairdocsapcr uncertainty factors) 1(10 100 or 1000) egspdf
WAC 173-460 Washington ASIL 1300 httpwwwecywagovpubswac17346
0pdf
Wisconsin AAC (1-hr or 24-hr)
1(10 to 42) NR 44504 amp 05 httpwwwlegisstatewiusrsbcodenr nr445pdf
Initial Threshold Screening Level (ITSL) Michiganrsquos Department of Environmental Quality health based screening level for non-carcinogenic effects of a toxic air contaminant It is determined by a number of different formulas or equations depending upon the available toxicological data (RfC RfD OEL NOAEL LOAEL LC50 and LD50) Rule 232 specify a hierarchy of these formulas for determining the ITSL The ITSL is set for three distinctive time-weighted averages (TWAs) of exposure that is dependent upon the available toxicological data 1) 1 hour 2) 8 hours 3) 24 hours or 4) 365 days (annual) In the interest of public health the ITSL should not be exceeded for the designated TWA
Ambient Air Limit (AAL) is a concentration limit of a toxic air pollutant not to be exceeded in the ambient air as set by the New Hampshire Department of Environmental Services It is intended to provide public health protection over a time-weighted average (TWA) of exposure (ie for the designated TWA and the interest of public health the AAL should not
35
be exceeded) Depending upon the substance available toxicological data and the method used to calculate the AAL the time-weighted average of exposure can be for a twenty-four (24) hour exposure or exposures up to 365 days in one year (annual)
Hazardous Ambient Air Standard (HAAS) means the highest acceptable concentration in the ambient air of a hazardous air contaminant as set by the Vermont Department of Environmental Conservation The HAASs are designed to be protective of public health for an assumed time-weighted average (TWA) of exposure (ie for the designated TWA and the interest of public health the HAAS should not be exceeded) Depending upon the substance available toxicological data and the method used to calculate the HAAS the time-weighted average of exposure can be for a twenty-four (24) hour exposure or exposures up to 365 days in one year (annual)
Acceptable Source Impact Level (ASIL) means the highest acceptable concentration of a toxic air pollutant in the outdoor atmosphere in any area which does not have restricted or controlled public access that is used to evaluate the air quality impacts of a single source There are three types of acceptable source impact levels risk-based threshold-based and special Concentrations for these three types of ASILs are determined by several methods as approved by the Washington Department of Ecology The ASILs are designed to be protective of public health for an assumed time-weighted average (TWA) of exposure (ie for the designated TWA and the interest of public health the ASIL should not be exceeded) Depending upon the substance available toxicological data and the method used to calculate the ASIL the time-weighted average of exposure can be for a twenty-four (24) hour exposure or exposures up to 365 days in one year (annual)
Acceptable Ambient Concentration (AAC) means the highest acceptable concentration of a toxic air pollutant in the outdoor atmosphere that is used to evaluate the air quality impacts of an emission source(s) AACs are health-based air standards and are described in Chapter NR 445 of the Wisconsinrsquos Department of Natural Resources regulatory code The AACs are set at levels designed to be protective of public health for an assumed time-weighted average (TWA) of exposure (ie for the designated TWA and the interest of public health the AAC should not be exceeded) Depending upon the substance available toxicological data and the method used to calculate the AAC the time-weighted average of exposure can be for a one (1) hour exposure twenty-four (24) hour exposure or exposures up to 365 days in one year (annual)
Listed below are some health-based guidelines commonly referenced in dose-response studies (eg toxicological epidemiological etc) that were used in the derivation of some of the above health-based standards
Lethal Concentration(50) (LC50) is a calculated concentration of a chemical in air to which exposure for a specific length of time is expected to cause death in 50 of a defined experimental animal population
Lethal Dose(50) (LD50) is the dose (intake per body weight) of a chemical which has been calculated to cause death in 50 of a defined experimental animal population
Lowest-Observed-Adverse-Effect Level (LOAEL) is the lowest exposure level of a chemical in a study or group of studies that produces statistically or biologically significant
36
increases in frequency or severity of adverse effects between the exposed population and its appropriate control
No-Observed-Adverse-Effect Level (NOAEL) is the dose of a chemical at which there were no statistically or biologically significant increases in frequency or severity of adverse effects seen between the exposed population and its appropriate control Effects may be produced at this dose but they are not considered to be adverse
Reference Concentration (RfC) is an estimate (with uncertainty spanning perhaps an order of magnitude or more) of a continuous inhalation exposure to the human population (including sensitive subgroups) that is likely to be without an appreciable risk of deleterious non-cancer health effects during a lifetime The inhalation reference concentration is for continuous inhalation exposures and is appropriately expressed in units of mgm3 or ppm
Reference Dose (RfD) is an estimate (with uncertainty spanning perhaps an order of magnitude or more) of the daily exposure of the human population to a potential hazard that is likely to be without risk of deleterious non-cancer health effects during a lifetime The RfD is operationally derived from the no-observed-adverse-effect level (NOAEL-from animal and human studies) by a consistent application of uncertainty factors that reflect various types of data used to estimate RfDs and an additional modifying factor which is based on a professional judgment of the entire database on the chemical The RfDs are for continuous daily exposures and are appropriately expressed in units of mgkgday
Screening Rationale Used to Select Substances for Further Public Health Analysis
After potential exposure pathways are considered the next step in any environmental health analysis or assessment process is the application of conservative screening values (ie comparison values) to the available sampling data (ATSDR 2005) This phase of the process helps to rule out any site-specific substances that would not pose a public health hazard under almost any plausible exposure scenario The substances remaining after the preliminary screen would require in-depth public health analyses to evaluate their potential for causing adverse health effects under site-specific exposure conditions (ATSDR 2005) During this final phase or step (ie in-depth public health analysis) of the environmental health assessment process potential public health implications are identified Toxic exposures are not identified under the preliminary screening phase it merely eliminates obviously nontoxic exposures This allows environmental health scientists when assessing public health implications to focus on a reduced list of substances
When selecting an environmental guideline for use in environmental health assessments ATSDR environmental health scientists normally follow ATSDRs general hierarchy as shown in Figure 6 Environmental guidelines listed under Hierarchy 1 are usually chosen first given that the guidelines are based on ATSDR analyses of substance-specific toxicity data
In the absence of these values Hierarchy 2 environmental guidelines may be chosen These are either based on ATSDR analyses of substance-specific toxicity data not used in Hierarchy 1 (eg intermediate exposures of 15ndash365 days) or on US EPA analyses of the substance-specific toxicity data If substance-specific guidelines are absent for Hierarchies 1 and 2 environmental guidelines in Hierarchy 3 may be chosen
37
Finally in some cases the environmental guidelines listed in the ATSDR hierarchy are simply unavailable Other sources are then considered in choosing environmental guidelines to conduct the environmental health assessment For example other governmental agencies (federal state and tribal agencies) may require that their environmenthealth departments meet specified public health mandates by developing their own guidelines These environmental guidelines may address hazardous substances in water soil air fish or other biota
For screening purposes typically the environmental guideline with the lowest concentration level and that is most consistent with conditions at or near the site is selected ATSDR environmental health scientists must sometimes select the environmental guideline that best applies to site conditions in terms of time frames and potentially exposed populations The following exposure elements may sometimes lead environmental health scientists to move away from the hierarchy listed in Figure 6 nevertheless consideration of these exposure elements tends to help select the most appropriate CVs for screening
Exposure duration When selecting the most appropriate environmental guideline exposure duration is an essential consideration A one-time exposure to a high contaminant concentration may result in different health effects than would a repeated exposure to a lower contaminant concentration As noted ATSDR has developed EMEGs that apply to acute (14 days or less) intermediate (15ndash365 days) and chronic (365 days or more) exposures Comparison values developed by other organizations may apply to acute intermediate or chronic exposures or to all three
Site-specific exposure conditions In some instances the most conservative environmental guideline may not be the most appropriate screening value Of critical importance in conducting environmental health assessments is selecting environmental guidelines most appropriate and applicable to site-specific conditions Exposures identified at the site should closely approximate the exposure assumptions used to derive the environmental guideline For example including a soil contaminant for further evaluation based on a comparison value for a child would be inappropriate if the contaminant is found in a restricted industrial site where children are prohibited Also past current and potential future exposure conditions must be borne in mind
For this environmental health analysis or evaluation a substance was initially selected for in-depth public health analysis if its maximum detected level in air exceeded its most relevant air comparison value (CV) (See Appendix A for a description of the air comparison values used in this environmental health analysis and their interpretation) Using all of the CVs or environmental guidelines established for air exposures that ATSDR considers protective of public health the most relevant air CV is chosen through a hierarchical or ranked arrangement similar to that in Figure 6 (in Appendix C) ATSDR environmental health scientists then developed a hierarchical screening process for selectingmdashin terms of time frames and populations that might be exposedmdashthe most appropriate environmental guideline that best applies to conditions at the ERSI Landfill (see Figures 7 and 8 in Appendix C) Even if through this screening process no relevant air CV exists for a particular substance the substance is still selected for in-depth public health analysis
38
Following the initial screening the detected air concentration(s) is further utilized to interpret whether site-specific exposures to the selected substance(s) pose any potential concern to public health Conducting an in-depth analysis of chemicals or substances selected for further public health analysis is the final step of the environmental health assessment process
39
APPENDIX B Tables
41
TABLE 1 GCMS Sampling Results
Tuesday - November 18 2003
Sample Time Compounds Identified LOC 2 1255 PM Dichlorofluoromethane Trichloromonofluoromethane 11-Dichloro-1shy
fluoroethane Dimethyl Sulfide Toluene Ethylbenzene one Xylene isomer -Pinene Camphene two C4-Substituted benzenes and eighteen Hydrocarbons in the range of C5 to C10
LOC 1 200 PM Dichlorofluoromethane Trichloromonofluoromethane 11-Dichloro-1shyfluoroethane -pinene one C4-Substituted benzene Limonene and four Hydrocarbons in the range of C5 to C6
LOC 4 245 PM Five Hydrocarbons in the range of C5 to C9
LOC 3 340 PM None LOC 1 437 PM Trichloromonofluoromethane 11-Dichloro-1-fluoroethane -Pinene
one C4-Substituted benzene and seven Hydrocarbons in the range of C5 to C6
LOC 2 524 PM Dichlorofluoromethane Trichloromonofluoromethane 11-Dichloro-1shyfluoroethane Toluene one Xylene isomer -Pinene Camphene two C4-Substituted benzenes Limonene and nine Hydrocarbons in the range of C5 to C7
LOC 4 605 PM Five Hydrocarbons in the range of C5 to C6 and one C10 Hydrocarbon
LOC 3 740 PM 11-Dichloro-1-fluoroethane and one Xylene isomer LOC 1 850 PM Dichlorofluoromethane Trichloromonofluoromethane 11-Dichloro-1shy
fluoroethane -Pinene Camphene and seven Hydrocarbons in the range of C5 to C6
LOC 2 1015 PM Dichlorofluoromethane Trichloromonofluoromethane 11-Dichloro-1shyfluoroethane Toluene -Pinene one C4-Substituted benzene and four Hydrocarbons in the range of C5 to C7
LOC 3 1120 PM Three Hydrocarbons in the range of C5 to C7
Landfill Ambient
511 PM None
Landfill Ambient
634 PM None
Landfill Ambient
920 PM Trichloromonofluoromethane and Dipropyl 12-benzenedicarboxylate
Tentative identification was made of the listed compound As a result of the environmental interference surrounding the target compound peak a true and accurate conclusion could not be ascertained hence the compound is listed with a cautionary identification
43
TABLE 2 GCMS Sampling Results
LOC 2
LOC 3 18 ROS Landfill Ambient Landfill Ambient Landfill Ambient Landfill Ambient
Sample LOC 2 LOC 3
Landfill Ambient
1218 PM None
Landfill Ambient
1922 PM None
Wednesday - November 19 2003
Sample Time LOC 1 1258 PM
510 PM None 845 PM None 1216 PM None
LOC 4 430 PM None LOC 2 600 PM None LOC 3 810 PM Ethylbenzene and one Xylene isomer LOC 2 945 PM Dichlorofluoromethane one C4-Substituted benzene and Limonene
Compounds Identified Dichlorofluoromethane Trichloromonofluoromethane 11-Dichloro-1shyfluoroethane -pinene and four Hydrocarbons in the range of C5 to C6
Compounds Identified
210 PM
137 PM None
359 PM None
738 PM None
Thursday - November 20 2003
Time 235 PM Diphenylamine 320 PM Ethylbenzene one Xylene isomer and one C7 Hydrocarbon
Dichlorofluoromethane Trichloromonofluoromethane 11-Dichloro-1shyfluoroethane Toluene -Pinene Camphene one C4-Substituted benzene Limonene and thirteen Hydrocarbons in the range of C5 to C8
Tentative identification was made of the listed compound As a result of the environmental interference surrounding the target compound peak a true and accurate conclusion could not be ascertained hence the compound is listed with a cautionary identification
44
TABLE 3 GCMS Sampling Results
Monday - December 1 2003
Sample Time Compounds Identified LOC 5 100 PM Trichloromonofluoromethane and one C5 Hydrocarbon
LOC 2 200 PM None 426 Powell 235 PM None LOC 3 435 PM One Xylene isomer LOC 4 535 PM One Xylene isomer and sixteen Hydrocarbons in the range of C5 to C11
LOC 2 700 PM Trichloromonofluoromethane 11-Dichloro-1-fluoroethane Trichloroethylene Toluene two Xylene isomers -Pinene one C4-Substituted benzene Limonene and nine Hydrocarbons in the range of C5 to C7
LOC 5 750 PM None Landfill Ambient
410 PM None
Landfill Ambient
619 PM None
Tuesday - December 2 2003
Sample Time Compounds Identified LOC 5 1055 AM Two Hydrocarbons in the range of C5 to C6
505 Powell 1150 AM One C4-Substituted benzene Limonene and Diphenylamine
752 S Main
105 PM None
LOC 2 235 PM None 508 Powell 400 PM None LOC 3 513 PM None 508 Powell 630 PM None LOC 5 750 PM None Landfill Ambient
935 PM None
Landfill Ambient
225 PM Toluene
Landfill Ambient
704 PM Trichloromonofluoromethane
Tentative identification was made of the listed compound As a result of the environmental interference surrounding the target compound peak a true and accurate conclusion could not be ascertained hence the compound is listed with a cautionary identification
45
TABLE 4 GCMS Sampling Results
Wednesday - December 3 2003
Sample Time Compounds Identified LOC 2 1025 PM None 501 Powell 1110 PM None LOC 5 1210 PM One C5 Hydrocarbon and one C4-Substituted benzene
LOC 4 100 PM Three Hydrocarbons in the range of C5 to C7 and one C10 Hydrocarbon
ELEMSCH 245 PM None 752 Main 315 PM None 505 Powell 430 PM None Turnpike 600 PM None LOC 3 720 PM None Turnpike 820 PM None Landfill Ambient
902 AM None
Landfill Ambient
1020 AM None
Thursday - December 4 2003
Sample Time Compounds Identified 511 Hicko 945 AM None LOC 5 1040 AM Limonene LOC 2 1215 PM Limonene LOC 3 110 PM None Union 145 PM None LOC 5 315 PM Trichloromonofluoromethane Toluene one C4-Substituted benzene
Limonene and three Hydrocarbons in the range of C5 to C7 Union 353 PM Limonene LOC 4 455 PM Ethylbenzene one Xylene isomer and ten Hydrocarbons in the range of C5
to C8 and one C11 Hydrocarbon 2 ROSEV 605 PM Toluene and one Xylene isomer I 476 708 PM None Landfill Ambient
913 AM None
Landfill Ambient
139 PM None
Tentative identification was made of the listed compound As a result of the environmental interference surrounding the target compound peak a true and accurate conclusion could not be ascertained hence the compound is listed with a cautionary identification
46
TABLE 5 TAGA IIE Sampling Results
Tuesday - November 18 2003
Sample Time Compounds Tentatively Identified LOC2 1255pm Butanol Propyleneglycol Pyrocatechol LOC1 200pm Butanol 15-Pentanediol LOC4 245pm Propylene glycol 23-Butanedione LOC3 340pm 2-Methyl-1-butanol LOC1 437pm 2-Methyl-3-butyne-2-ol 15-Pentanediol LOC2 524pm 2-Methyl-3-butyne-2-ol Pentanal LOC4 605pm None LOC3 740pm None LOC1 850pm None LOC2 1055pm None LOC3 1120pm Acetol Landfill Ambient
1220pm None
Landfill Ambient
230pm None
Wind direction was from the South averaging 5 mph At 420 pm the winds shifted to the east averaging 5 mph and then shifted back to the south at 900 pm averaging 8 mph for the remainder of the sampling session
No compounds could be identified from the spectra for the Landfill Ambient samples collected at 130 pm 330 pm 430 pm 530 pm 630 pm 730 pm 830 pm 930 pm 1030 pm and 1130 pm
Wednesday shy November 19 2003
Sample Time Compounds Tentatively Identified LOC1 1258pm None LOC2 210pm Acetol LOC3 510pm None 18 ROS 845 PM None Landfill Ambient
1200pm None
Landfill Ambient
400pm None
Landfill Ambient
800pm None
Wind direction was from the South averaging 17 mph from 1200 pm until 400 pm when the Met tower was put down due to bad weather
No compounds could be identified from the spectra for the Landfill Ambient samples collected at 100pm 200pm 300pm 500pm 600pm 700pm 1000pm and 1100pm
47
TABLE 6 TAGA IIE Sampling Results
Thursday - November 20 2003
Sample Time Compounds Tentatively Identified LOC2 235pm None LOC3 320pm 23-Butanedione LOC4 430pm None LOC2 600pm None LOC3 810pm None LOC2 945pm None Landfill Ambient
1200pm None
Landfill Ambient
200pm None
Landfill Ambient
800pm None
Landfill Ambient
1000pm None
Wind direction was from North from 1200 pm until 300 pm when the direction changed to the West-Northwest and averaged 4 mph for the remainder of the sampling session
No compounds could be identified from the spectra for the Landfill Ambient samples collected at 100pm 300pm 400pm 500pm 600pm 700pm and 900pm
Monday - December 1 2003
Sample Time Compounds Tentatively Identified LOC5 100pm None LOC2 200pm None
426 POWEL 235pm None LOC3 435pm None LOC4 535pm Pentanal LOC2 700pm None LOC5 750pm None LOC3 850pm None Landfill Ambient
1215pm None
Winds were from the West-Northwest averaging 7 mph from 1200 pm until 615 pm The winds then shifted to the Southwest averaging 5 mph for the remainder of the sampling session
No compounds could be identified from the spectra for the Landfill Ambient samples collected at 115 pm 215 pm 315 pm 415 pm 515 pm 615 pm 715 pm and 815 pm
48
TABLE 7 TAGA IIE Sampling Results
Tuesday - December 2 2003
Sample Time Compounds Tentatively Identified LOC5 1055am None
505 POWEL 1150am None 752 S MAIN 105pm None
LOC2 235pm None 508 POWEL 400pm None
LOC3 513pm None 508 POWEL 630PM None
LOC5 750pm None
Winds were from the West-Northwest averaging 7 mph for the sampling session
No compounds could be identified from the spectra for the Landfill Ambient samples collected at 115 pm 215 pm 315 pm 415 pm 515 pm 615 pm 715 pm and 815 pm
Wednesday - December 3 2003
Sample Time Compounds Tentatively Identified LOC2 1025am None
501 POW 1110am None LOC5 1210pm None LOC4 100pm None
ELEMSCH 245pm None 752 MAIN 315pm None
505 POWEL 430pm None TURNPIKE 600pm None
LOC3 720pm None TURNPIKE 820 PM None
Winds were from the North from 900 am averaging 1 mph until 1040 am The winds then shifted to the South and averaged 4 mph until 510 pm when the winds shifted to the Northwest at 1 mph for the remainder of the sampling session
No compounds could be identified from the spectra for the Landfill Ambient samples collected at 900am 1000am 1100am 1200 pm 100 pm 200 pm 300 pm 400 pm 500 pm 600 pm 700 pm and 800 pm
49
TABLE 8 TAGA IIE Sampling Results
Thursday - December 4 2003
Sample Time Compounds Tentatively Identified 511 HICKO 945am None
LOC5 1040pm None LOC2 1215pm None LOC3 110pm None UNION 145pm None LOC5 315pm None UNION 353pm None LOC4 455pm None
2 ROSEV 605pm None I 476 708pm None
At 900 am the average wind direction was from the North at an average speed of 1 mph The wind direction shifted from the South averaging 5 mph at 1040 am The direction of the wind remained from the South until 510pm when it shifted from out of the North at an average of 3 mph for the remainder of the sampling session
No compounds could be identified from the spectra for the Landfill Ambient samples collected at 900am 1000am 1100am 1200 pm 100 pm 200 pm 300 pm 400 pm 500 pm 600 pm and 700 pm
50
Compound Detection Limit ppb
Average Concentration ppb
Highest Concentration ppb (Time)
Acetaldehyde 166 --shy --shyAmmonia 4 --shy --shyBenzene 88 --shy --shyCarbon Disulfide 127 --shy --shyCarbon Monoxide 39 --shy 265 (303 pm) Carbonyl Sulfide 21 --shy --shyChloroform 8 --shy ---Dimethyl Sulfide 133 --shy --shyEthanol 29 --shy ---Ethylbenzene 262 --- --shyEthylene 9 --- --shyFormaldehyde 40 --- --shyHydrogen Chloride 68 --- --shyHydrogen Sulfide 7081 --- 8906 (134pm) Methane 758 6540 18460 (641 pm)Methanol 7 --- --shy2-Methyl Butane 90 --shy --shyMethyl Mercaptan 415 --shy ---Methylamine 88 --shy 195 (518 pm) n-Octane 47 --shy --shySulfur Dioxide 136 --shy --shyTCE 8 --shy 35 (135 pm) Toluene 120 --shy ---Triethylamine 26 --- --shy m-Xylene 103 --- --shyo-Xylene 90 --- --shyp-Xylene 264 --- --shyVinyl Chloride 14 --- --shy
--- Compound Below Detection Limit
Highest concentration existed for less than 2 min unless otherwise noted
TABLE 9 OPFTIR Analysis Results
Week 1 November 18-20 2003
Day 1 Tuesday November 18 2003 (100 pm to 1200 am)
The OPFTIR was set-up with the beam path along the top plateau of the ERSI Landfill The path length was 228 meters Wind direction during the sampling was from the South averaging 8 mph
51
Compound Detection Limit ppb
Average Concentration ppb
Highest Concentration ppb (Time)
2-Methyl Butane 86 --shy --shyAcetaldehyde 143 --shy 790 (806 pm) Ammonia 4 --shy 6 (556 pm) Benzene 86 --shy --shyCarbon Disulfide 151 --shy --shyCarbon Monoxide 46 --shy 122 (127 pm) Carbonyl Sulfide 18 --shy --shyChloroform 7 --shy 12 (758 pm) Dimethyl Sulfide 133 --shy --shyEthanol 36 --shy ---Ethylbenzene 238 --- 336 (1158 am) Ethylene 9 --- --shyFormaldehyde 37 --- --shyHydrogen Chloride 62 --- --shyHydrogen Sulfide 6689 --- --shyMethane 673 5727 14089 (806 pm)Methanol 7 --- --shyMethyl Mercaptan 500 --shy ---Methylamine 92 --shy 178 (744 pm) n-Octane 43 --shy --shySulfur Dioxide 131 --shy --shyTCE 16 --shy 31 (756 pm) Toluene 125 --shy ---Triethylamine 24 --- 60 (607 pm) Trimethylamine 12 --- --shyVinyl Chloride 14 --- --shym-Xylene 101 --- --shyo-Xylene 107 --- --shyp-Xylene 246 --- --shy
--- Compound Below Detection Limit
Highest concentration existed for less than 2 min unless otherwise noted
TABLE 10 OPFTIR Analysis Results
Week 1 November 18-20 2003
Day 2 Wednesday November 19 2003 (1130 am to 805 pm)
The OPFTIR was set-up with the beam path along the top plateau of the ERSI Landfill The path length was 228 meters Wind direction during the sampling was from the South averaging 15 mph
52
Compound Detection Limit ppb
Average Concentration ppb
Highest Concentration ppb (Time)
Acetaldehyde 121 --- --shyAmmonia 5 --- 12 (425 pm) Benzene 123 --- --shyCarbon Disulfide 209 --shy --shyCarbon Monoxide 59 --shy 1248 (424 pm) Carbonyl Sulfide 44 --shy --shyChloroform 11 --shy ---Dimethyl Sulfide 137 --shy --shyEthanol 38 --shy ---Ethylbenzene 240 --- --shyEthylene 11 --- --shyFormaldehyde 24 --- --shyHydrogen Chloride 29 --- --shyHydrogen Sulfide 9898 --- --shyMethane 266 --- 3077 (901 pm) Methanol 7 --- --shy2-Methyl Butane 53 --shy --shyMethyl Mercaptan 541 --shy ---Methylamine 133 --shy 216 (856 pm) n-Octane 20 --shy --shySulfur Dioxide 120 --shy --shyTCE 10 --shy 19 (220 pm) Toluene 163 --shy ---Triethylamine 15 --- ---Trimethylamine 39 --- --shym-Xylene 157 --- --shyo-Xylene 147 --- --shyp-Xylene 347 --- --shyVinyl Chloride 19 --- --shy
--- Compound Below Detection Limit
Highest concentration existed for less than 2 min unless otherwise noted
TABLE 11 OPFTIR Analysis Results
Week 1 November 18-20 2003
Day 3 Thursday November 20 2003 (215 pm to 1000 pm)
The OPFTIR was set-up with the beam path parallel along Powell Street The path length was 222 meters Wind direction during sampling was from the North averaging 3 mph
53
TABLE 12 OPFTIR Analysis Results
Week 2 December 1-4 2003
Day 1 Monday December 1 2003 (1245 pm to 850 pm)
The OPFTIR was set-up with the beam path parallel along Powell Street The path length was 218 meters Wind direction during sampling was from the North averaging 8 mph
Compound Detection Limit ppb
Average Concentration ppb
Highest Concentration ppb (Time)
Acetaldehyde Ammonia
46 2
--shy--shy
--shy--shy
Benzene 40 --shy --shyCarbon Disulfide 51 --shy --shyCarbon Monoxide Carbonyl Sulfide Chloroform
16 7 3
76 --shy--shy
2459 (829 pm) --shy---
Dimethyl Sulfide Ethanol
40 9
--shy--shy
--shy---
Ethylbenzene Ethylene Formaldehyde Hydrogen Chloride Hydrogen Sulfide Methane Methanol Methylamine 2-Methyl Butane Methyl Mercaptan n-Octane
70 4
14 24
2886 225
3 32 27
113 15
--shy--shy--shy--shy--shy
2376 --shy--shy--shy--shy--shy
--shy10 (831 pm)
--shy--shy--shy
13157(125 pm) 6 (542 pm)
60 (356 pm) --shy
130 (418 pm) --shy
Sulfur Dioxide 60 --shy --shyToluene 35 --shy --shyTCE 4 --shy ---Triethylamine Trimethylamine m-Xylene o-Xylene p-Xylene Vinyl Chloride
8 5 29 25 66 8
--shy--shy--shy--shy--shy--shy
--shy8 (104 pm)
--shy--shy--shy--shy
--- Compound Below Detection Limit
Highest concentration existed for less than 2 min unless otherwise noted
54
TABLE 13 OPFTIR Analysis Results
Week 2 December 1-4 2003
Day 2 Tuesday December 2 2003 (900 am to 845 pm)
The OPFTIR was set-up with the beam path parallel along Union Street The path length was 276 meters Wind direction during the sampling was from the West averaging 5 mph
Compound Detection Limit ppb
Average Concentration ppb
Highest Concentration ppb (Time)
Acetaldehyde Ammonia
23 2
--shy--shy
--shy--shy
Benzene Carbon Disulfide
36 27
--shy--shy
44 (329 pm) --shy
Carbon Monoxide Carbonyl Sulfide Chloroform
11 5 2
--shy--shy--shy
236 (524 pm) --shy---
Dimethyl Sulfide Ethanol Ethylbenzene Ethylene Formaldehyde Hydrogen Chloride Hydrogen Sulfide Methane Methanol
24 8
28 5 4 6
1897 32 4
--shy--shy--shy--shy--shy--shy--shy43 --shy
--shy84 (437 pm)
--shy8 (459 pm)
--shy--shy--shy
397 (1055 am) --shy
2-Methyl Butane Methyl Mercaptan Methylamine n-Octane
2 92 26 4
--shy--shy--shy--shy
--shy--shy
48 (500 pm) --shy
Sulfur Dioxide TCE Toluene
43 4
26
--shy--shy--shy
436 (437 pm) 7 (922 am)
---Triethylamine Trimethylamine m-Xylene o-Xylene p-Xylene Vinyl Chloride
4 3 23 17 51 8
--shy--shy--shy--shy--shy--shy
--shy5 (504 pm)
46 (518 pm) --shy--shy--shy
--- Compound Below Detection Limit
Highest concentration existed for less than 2 min unless otherwise noted
55
Compound Detection Limit ppb
Average Concentration ppb
Highest Concentration ppb (Time)
Acetaldehyde 80 --shy --shyAmmonia 3 --shy --shyBenzene 69 --shy --shyCarbon Disulfide 123 --shy --shyCarbon Monoxide 36 51 384 (810 pm) Carbonyl Sulfide 17 --shy --shyChloroform 5 --shy ---Dimethyl Sulfide 73 --shy --shyEthanol 18 --shy ---Ethylbenzene 135 --- 261 (845 pm) Ethylene 7 --- --shyFormaldehyde 27 --- --shyHydrogen Chloride 43 --- --shyHydrogen Sulfide 5152 --- --shyMethane 456 1684 12142 (825 pm)Methanol 6 --- 35 (1125 am) 2-Methyl Butane 59 --- --shyMethyl Mercaptan 246 --- ---Methylamine 68 --- 274 (531 pm) n-Octane 29 --- --shySulfur Dioxide 105 --shy --shyTCE 7 --shy 15 (540 pm) Toluene 67 --shy ---Triethylamine 13 --shy ---Trimethylamine 17 --shy --shym-Xylene 63 --shy --shyo-Xylene 56 --shy --shyp-Xylene 136 --shy --shyVinyl Chloride 12 --shy 16 (1257 pm)
TABLE 14 OPFTIR Analysis Results
Week 2 December 1-4 2003
Day 3 Wednesday December 3 2003 (900 am to 845 pm)
The OPFTIR was set-up with the beam path parallel to the North side of the Riverside Elementary School The Path length was 222 meters Wind direction during the sampling was from the North averaging 5 mph
--- Compound Below Detection Limit
Highest concentration existed for less than 2 min unless otherwise noted
56
TABLE 15 OPFTIR Analysis Results
Week 2 December 1-4 2003
Day 4 Thursday December 4 2003 (900 am to 800 pm)
The OPFTIR was set up with the beam path parallel to the turnpike toll collection booths along the exit ramp The Path length was 350 meters Wind speed and direction readings used were recorded by MAU-1 due to the ravine position of MAU-3 At 900 am the average wind direction was from the North at an average speed of 1 mph The wind direction shifted from the South at an average of 5 mph at 1040am The direction of the wind remained from the South until 510pm when it shifted from out of the North at an average of 3 mph
Compound Detection Limit Average Concentration Highest Concentration ppb ppb ppb (Time)
Acetaldehyde 203 --shy --shyAmmonia 4 --shy 21 (418 pm) Benzene 65 --shy --shyCarbon Disulfide 165 --shy --shyCarbon Monoxide 55 632 1579 (428 pm) Carbonyl Sulfide 13 --shy --shyChloroform 4 --shy ---Dimethyl Sulfide 76 --shy 148 (538 pm) Ethanol 15 --shy 29 (223 pm) Ethylbenzene 123 --shy 226 (551 pm) Ethylene 8 --shy 17 (931 am) Formaldehyde 70 --shy --shyHydrogen Chloride 126 --shy --shyHydrogen Sulfide 4416 --shy 6355 (532 pm) Methane 995 4961 19076 (716 pm) Methanol 6 --shy 23 (946 pm) Methylamine 62 --shy 145 (918 pm) 2-Methyl Butane 100 --shy --shyMethyl Mercaptan 206 --shy --shyn-Octane 69 --shy --shySulfur Dioxide 86 --shy 93 (657 pm) Toluene 68 --shy --shyTCE 5 --shy 12 (922 am) Triethylamine 13 --shy 41 (710 pm) Trimethylamine 10 --shy --shy
57
TABLE 15 OPFTIR Analysis Results
Week 2 December 1-4 2003
Day 4 Thursday December 4 2003 (900 am to 800 pm)
The OPFTIR was set up with the beam path parallel to the turnpike toll collection booths along the exit ramp The Path length was 350 meters Wind speed and direction readings used were recorded by MAU-1 due to the ravine position of MAU-3 At 900 am the average wind direction was from the North at an average speed of 1 mph The wind direction shifted from the South at an average of 5 mph at 1040am The direction of the wind remained from the South until 510pm when it shifted from out of the North at an average of 3 mph
Compound Detection Limit Average Concentration Highest Concentration ppb ppb ppb (Time)
m-Xylene 38 --shy --shyo-Xylene 35 --shy --shyp-Xylene 107 --shy --shyVinyl Chloride 12 --shy --shy--- Compound Below Detection Limit
Highest concentration existed for less than 2 min unless otherwise noted
58
TABLE 16 Peak Sampling Concentrations as Measured between the Dates of November 18 2003 to December 4 2003
Compound Peak Air Concentrations (lt2 min duration)
Units ppb
Peak Ambient Air Comparison Values
Units ppb
In-Depth Analysis Required
11182003 1300 - 2400
Landfill
11192003 1130 - 2005
Landfill
11202003 1415 - 2200 Powell Street
1212003 1245 - 2050 Powell Street
1222003 900 - 2045 Union Street
1232003 900 - 2045
Riverside Elem
1242003 900 - 2000
Turnpike
ATSDR Acute EMEG
EPA AEGL
(10 min)
Threshold Limit Value
Ceiling STEL IDLH
Acetaldehyde lt166 790 (2006) lt121 lt46 lt23 lt80 lt203 45000 25000 2000000 No Ammonia lt4 6 (1756) 12 (1625) lt2 lt2 lt3 21 (1618) 2000s 30000 35000 300000 No Benzene lt88 lt86 lt123 lt40 44 (1529) lt69 lt65 9d 130000 2500 500000 No Carbon Disulfide lt127 lt151 lt209 lt51 lt27 lt123 lt165 17000 500000 No Carbon Monoxide 265 (1503) 122 (1327) 1248 (1624) 2459 (2029) 236 (1724) 384 (2010) 1579 (1628) 1200000 No Carbonyl Sulfide lt21 lt18 lt44 lt7 lt5 lt17 lt13 None Available No Chloroform lt8 12 (1958) lt11 lt3 lt2 lt5 lt4 100s 500000 No Dimethyl Sulfide lt133 lt133 lt137 lt40 lt24 lt73 148 (1738) None Available No Ethanol lt29 lt36 lt38 lt9 84 (1637) lt18 29 (1423) 3300000b No
Ethylbenzene lt262 336 (1158) lt240 lt70 lt28 261 (2045) 226 (1751) 125000 800000b No
Ethylene lt9 lt9 lt11 10 (2031) 8 (1659) lt7 17 (931) None Available No Formaldehyde lt40 lt37 lt24 lt14 lt4 lt27 lt70 40s 900 300 20000 No Hydrogen Chloride lt68 lt62 lt29 lt24 lt6 lt43 lt126 1800 2000 50000 No Hydrogen Sulfide 8906 (1334) lt6689 lt9898 lt2886 lt1897 lt5152 6355 (1732) 70p 750 15000 100000 Yes Methane 18460 (1841) 14089 (2006) 3077 (2101) 13157(1325) 0397 (1055) 12142 (2025) 19076 (1916) None Available No Methanol lt7 lt7 lt7 6 (1742) lt4 35 (1125) 23 (2146) 670000 250000 6000000 No 2-Methyl Butane lt90 lt86 lt53 lt27 lt2 lt59 lt100 None Available No Methyl Mercaptan lt415 lt500 lt541 130 (1618) lt92 lt246 lt206 150000 No Methylamine 195 (1718) 178 (1944) 216 (2056) 60 (1556) 48 (1700) 274 (1731) 145 (2118) 15000 15000 100000 No n-Octane lt47 lt43 lt20 lt15 lt4 lt29 lt69 1000000b No
Sulfur Dioxide lt136 lt131 lt120 lt60 436 (1637) lt105 93 (1857) 10p 200 5000 100000 Yes Trichloroethylene (TCE) 35 (1335) 31 (1956) 19 (1420) lt4 7 (922) 15 (1740) 12 (922) 2000d 260000 100000 1000000 No Toluene lt120 lt125 lt163 lt35 lt26 lt67 lt68 1000d 200000 500000 No Triethylamine lt26 60 (1807) lt15 lt8 lt4 lt13 41 (1910) 3000 200000 No Trimethylamine Not Analyzed lt12 lt39 8 (1304) 5 (1704) lt17 lt10 8000 15000 No m-Xylene lt103 lt101 lt157 lt29 46 (1718) lt63 lt38 2000as 130000a 150000a 900000a No
o-Xylene lt90 lt107 lt147 lt25 lt17 lt56 lt35 2000as 130000a 150000a 900000a No
p-Xylene lt264 lt246 lt347 lt66 lt51 lt136 lt107 2000as 130000a 150000a 900000a No
Vinyl Chloride lt14 lt14 lt19 lt8 lt8 16 (1257) lt12 450000 No
Notes Further explanation of acronyms and definitions used for the comparison values in this table is shown in Appendix A
Yellow shading in the table implies a valid measured air concentration within the period of evaluation Green shading in the table is indicative where peak air measurements were considered questionable because they were measured directly at the end or outside the period of evaluation Blue shading in the table indicate the substances selected for further public health analysis aAssume that the relative toxicity of exposure among the different isomers for xylenes or a mixture of varying xylene isomers is the same bBecause the relevant acute toxicity data were either insufficient or unavailable the IDLH occupational exposure limit for this substance is the air concentration considered 10 of its lower explosive limit (LEL)
Basis of exposure for setting ATSDR acute EMEG 1) Peak Exposure (p) 2) Short-Term Exposure (s) and 3) Adjusted Daily Continuous Exposure (d)
59
TABLE 17 Short Term Sampling Concentrations as Measured between the Dates of November 18 2003 to December 4 2003
Compound Short Term Air Concentrations
(time-weighted average of duration period)
Units ppb
Short Term Ambient Air Comparison Values
Units ppb
In-Depth Analysis Required
11182003 1300 - 2400 (11 hr 0 min)
Landfill
11192003 1130 - 2005 (8 hr 35 min)
Landfill
11202003 1415 - 2200 (7 hr 45 min) Powell Street
1212003 1245 - 2050 (8 hr 5 min) Powell Street
1222003 900 - 2045
(11 hr 45 min) Union Street
1232003 900 - 2045
(11 hr 45 min) Riverside Elem
1242003 900 - 2000
(11 hr 0 min) Turnpike
ATSDR Acute EMEG
EPA AEGL (8 hr)
Threshold Limit Value (TWA)
Acetaldehyde lt166 lt143 lt121 lt46 lt23 lt80 lt203 45000 No Ammonia lt4 lt4 lt5 lt2 lt2 lt3 lt4 2000s 30000 25000 No Benzene lt88 lt86 lt123 lt40 lt36 lt69 lt65 9d 9000 1000 No Carbon Disulfide lt127 lt151 lt209 lt51 lt27 lt123 lt165 6700 1000 No Carbon Monoxide lt39 lt46 lt59 76 lt11 51 632 25000 No Carbonyl Sulfide lt21 lt18 lt44 lt7 lt5 lt17 lt13 None Available No Chloroform lt8 lt7 lt11 lt3 lt2 lt5 lt4 100s 10000 No Dimethyl Sulfide lt133 lt133 lt137 lt40 lt24 lt73 lt76 10000 No Ethanol lt29 lt36 lt38 lt9 lt8 lt18 lt15 1000000 No Ethylbenzene lt262 lt238 lt240 lt70 lt28 lt135 lt123 100000 No Ethylene lt9 lt9 lt11 lt4 lt5 lt7 lt8 200000 No Formaldehyde lt40 lt37 lt24 lt14 lt4 lt27 lt70 40s 900 No Hydrogen Chloride lt68 lt62 lt29 lt24 lt6 lt43 lt126 1800 No Hydrogen Sulfide lt7081 lt6689 lt9898 lt2886 lt1897 lt5152 lt4416 70p 330 10000 Yes Methane 6540 5727 lt266 2376 43 1684 4961 1000000 No Methanol lt7 lt7 lt7 lt3 lt4 lt6 lt6 270000 200000 No 2-Methyl Butane lt90 lt86 lt53 lt27 lt2 lt59 lt100 600000 No Methyl Mercaptan lt415 lt500 lt541 lt113 lt92 lt246 lt206 500 No Methylamine lt88 lt92 lt133 lt32 lt26 lt68 lt62 15000 5000 No n-Octane lt47 lt43 lt20 lt15 lt4 lt29 lt69 300000 No Sulfur Dioxide lt136 lt131 lt120 lt60 lt43 lt105 lt86 10p 200 2000 Yes Trichloroethylene (TCE) lt8 lt16 lt10 lt4 lt4 lt7 lt5 2000d 77000 50000 No Toluene lt120 lt125 lt163 lt35 lt26 lt67 lt68 1000d 200000 50000 No Triethylamine lt26 lt24 lt15 lt8 lt4 lt13 lt13 1000 No Trimethylamine Not Analyzed lt12 lt39 lt5 lt3 lt17 lt10 8000 5000 No m-Xylene lt103 lt101 lt157 lt29 lt23 lt63 lt38 2000as 130000a 100000a No
o-Xylene lt90 lt107 lt147 lt25 lt17 lt56 lt35 2000as 130000a 100000a No
p-Xylene lt264 lt246 lt347 lt66 lt51 lt136 lt107 2000as 130000a 100000a No
Vinyl Chloride lt14 lt14 lt19 lt8 lt8 lt12 lt12 70000 1000 No
Notes Further explanation of acronyms and definitions used for the comparison values in this table is shown in Appendix A
Yellow shading in the table implies a valid measured air concentration within the period of evaluation Green shading in the table is indicative where peak air measurements were considered questionable because they were measured directly at the end or outside the period of evaluation Blue shading in the table indicate the substances selected for further public health analysis H2S and SO2 were selected based on peak air levels exceeding appropriate comparison values as denoted in the previous table (Table 16) aAssume that the relative toxicity of exposure among the different isomers for xylenes or a mixture of varying xylene isomers is the same
Basis of exposure for setting ATSDR acute EMEG 1) Peak Exposure (p) 2) Short-Term Exposure (s) and 3) Adjusted Daily Continuous Exposure (d)
60
TABLE 18 ERSI LANDFILL POST AIR MONITORING Monthly Data Summary
Monitoring Location Riverside Elementary School Parameter Hydrogen Sulfide (units ppb)
Month amp Year 1-Hr Averages 24-Hr Averages Monthly Average Total Total Minimum Maximum Minimum Maximum
Samples Detects Detection Detection Detection Average Average
February 2004 694 3 043 1 7 0 1 0 March 2004 732 3 041 1 4 0 0 0 April 2004 718 0 000 0 0 0 0 0 May 2004 742 0 000 0 0 0 0 0 June 2004 321 0 000 0 0 0 0 0
Monitoring Location Pennsylvania Turnpike Parameter Hydrogen Sulfide (units ppb)
Month amp Year 1-Hr Averages 24-Hr Averages Monthly Average Total
Samples Total
Detects
Detection Minimum Detection
Maximum Detection
Minimum Average
Maximum Average
March 2004 66 11 1667 1 3 0 0 0 April 2004 718 85 1184 1 3 0 0 0 May 2004 743 81 1090 1 2 0 0 0 June 2004 720 7 097 1 1 0 0 0 July 2004 744 28 376 1 1 0 0 0 August 2004 743 32 431 1 3 0 0 0 September 2004 536 61 1138 1 2 0 1 0
Values listed as zero in the above tables indicate that the level of hydrogen sulfide in the air was immeasurable or could not be detected and was less than 1 ppb All of the quantitative data was acquired from the following PA DEP website httpwwwdepstatepausaq_appsaadata [accessed 09152008]
61
APPENDIX C Figures
63
Figure 1 Site Map
65
Figure 2 Site Demographic Maps
66
Figure 3 Total Count of Inspections Conducted at ERSI Landfill
TOTAL COUNT INFORMATION Complaint
Inspections Non-Complaint
Inspections Complaint Violations
Non-Complaint Violations
1st Qtr 2003 0 1 0 0 2nd Qtr 2003 0 5 0 0 3rd Qtr 2003 1 1 1 0 4th Qtr 2003 36 13 17 9 1st Qtr 2004 8 4 3 0 2nd Qtr 2004 3 2 0 2 3rd Qtr 2004 0 0 0 0 4th Qtr 2004 0 2 0 0
ERSI LANDFILL INSPECTION SUMMARY
0 5
10 15 20 25
30 35 40
1st Qtr 2003
2nd Qtr 2003
3rd Qtr 2003
4th Qtr 2003
1st Qtr 2004
2nd Qtr 2004
3rd Qtr 2004
4th Qtr 2004
Complaint Inspections Non-Complaint Inspections Complaint Violations Non-Complaint Violations
1st Qtr 2003 89 days (covers time span from January 1 2003 to March 31 2003) 2nd Qtr 2003 90 days (covers time span from April 1 2003 to June 30 2003) 3rd Qtr 2003 91 days (covers time span from July 1 2003 to September 30 2003) 4th Qtr 2003 91 days (covers time span from October 1 2003 to December 31 2003) 1st Qtr 2004 90 days (covers time span from Janaury 1 2004 to March 31 2004) 2nd Qtr 2004 90 days (covers time span from April 1 2004 to June 30 2004) 3rd Qtr 2004 91 days (covers time span from July 1 2004 to September 30 2004) 4th Qtr 2004 91 days (covers time span from October 1 2004 to December 31 2004)
Note Other quarters before the 1st quarter in 2003 have similar inspection counts to the 1st and 2nd quarters in 2003 (ie low inspection counts approaching zero) Moreover other quarters after 4th Otr 2004 also have similar inspection counts
Data Source PA Department of Environmental Protection (PADEP) eFACTS (Environmental Facility Application Compliance and Tracking System) httpwwwdepstatepausefacts
67
Figure 4 Odor Points of Electronic Nose
68
Figure 5 Potential Exposure Pathways to Landfill Gas
69
Figure 6 ATSDR Environmental Guideline Hierarchy
70
Hierarchy 1
Is one of the following available YES
bull ATSDR Acute EMEG (air) bull EPA AEGL ndash 10 minute exposure
Make Comparison
NO
Hierarchy 2 (OEL Required) Hierarchy 3 (OEL Reduction)
Is one of the following available Does a bull MI-DEQ ITSL (1 or 8 hour TWA) Peak YES bull WI-DNR AAC (1 hour TWA) YES
Exposure TLV bull AIHA ERPG-1 Exists bull AIHA ERPG-2
bull AIHA ERPG-3
NO Make Comparison
Make comparison with the following NO
bull Reduced TLV = (110) Peak Exposure TLV
Additional Source
Review additional sources to identify environmental guidelines
or Carry substance forward to
public health analysis
Figure 7 Environmental Guideline Hierarchy for Peak Inhalation Exposures
71
Hierarchy 1
Is one of the following available YES
bull ATSDR Acute EMEG (air) bull EPA AEGL ndash 10 minute exposure
Make Comparison
NO
Hierarchy 2 (OEL Required) Hierarchy 3 (OEL Reduction)
Is one of the following available Does a
Short-Term YES Exposure TLV
Exists
NO
Review additional sources to identify environmental guidelines
or Carry substance forward to
public health analysis
YESbull MI-DEQ ITSL (8 hour TWA) bull VT-DEC HAAS (8 hour TWA)
Make NO
Comparison
Is one of the following available bull MI-DEQ ITSL (24 hour TWA) bull NH-DES AAL (24 hour TWA) YES bull VT-DEC HAAS (24 hour TWA) bull WA-DE ASIL (24 hour TWA) bull WI-DNR AAC (24 hour TWA)
NO
Make comparison with the following bull Reduced TLV = (142) Short-Term Exposure TLV
Additional Source
Figure 8 Environmental Guideline Hierarchy for Short-Term Inhalation Exposures
72
APPENDIX D Chronological Summary of ERSIrsquos Malodorous Period
Below are excerpts from a Consent Order and Agreement entered on the 29th day of August 2005 by and between the Commonwealth of Pennsylvania Department of Environmental Protection (PA DEP) and Environmental amp Recycling Services Inc (ERSI) The listed information is only a portion of the findings founded by PA DEP related to malodorous releases (denoted or highlighted in yellow) from the ERSI Landfill occurring between September and December 2003
Date Event Summary
982003 ndash 11112003 At various times during this period (including on at least 10 days) PA DEP responded to odor complaints and verified sulfur-like odors emanating from the ERSI Landfill and migrating into residential neighborhoods and public roadways adjacent to the landfill The strength of the odors varied from slight to very strong over the course of this period and the odors lasted from several minutes to several hours PA DEP determined that the odors were the result of uncontrolled gas releases from various portions of the ERSI Landfill During this period PA DEP also verified off-site odors from a chemical neutralizermasking agent along a public road emanating from the landfill
9232003 PA DEP issued to ERSI a Notice of Violation (ldquoNOVrdquo) for the odors detected offsite on September 8 2003 The NOV requested ERSI to submit a plan and schedule to correct the violation within 15 days
10102003 PA DEP received ERSIrsquos response to the September 23 2003 NOV The response from ERSI indicated that bacterial degradation of gypsum (ie sheetrock wallboard) within the landfill was the suspected source of the sulfur-like odors The response indicated that ERSI planned to control odors through limitations on disposal of gypsum at the landfill the addition of final cover soil to certain portions of the landfill and the use of odor masking agents and odor neutralizers The response indicated that the first phase of final cover installation would be completed by the end of October 2003 and the entire final cover project for those portions of the landfill where filling was finalized would be completed by the spring of 2004
11112003 ndash 11122003
11132003
PA DEP representatives responded to a number of odor complaints and verified an off-site sulfur-like odor at some of the complainantsrsquo properties PA DEP representatives conducted an on-site inspection and determined the source of the odor to be the ERSI Landfill PA DEP representatives also determined that uncontrolled odors were present at and emanating off-site from multiple locations along the landfill Moreover PA DEP representatives documented that the Amity Gas System was in a state of disrepair at multiple locations and was causing uncontrolled releases of gas
PA DEP issued to ERSI an Administrative Order requiring certain corrective action at the ERSI Landfill and Amity Landfill The Administrative Order required among other things that ERSI complete all capping activities started in October 2003 complete a landfill gas characterization and assessment evaluate the need for a gas collection and control system install twenty-four (24) landfill gas sample probes conduct 24-hour odor monitoring and submit a permit modification with changes to its nuisance minimization and control plan
73
Date Event Summary
11132003 ndash 12112003 At various times during this period (including on at least 9 days) PA DEP verified sulfur-like odors emanating from the ERSI Landfill and migrating into residential neighborhoods and public roads adjacent to the landfill The strength of the odors varied from slight to very strong over the course of this period and the odors lasted from several minutes to several hours PA DEP determined that the odors were the result of uncontrolled gas releases from various portions of the ERSI Landfill
11172003 PA DEPrsquos mobile analytical laboratory 1 (ldquoMAU 1rdquo) and mobile analytical laboratory 2 (ldquoMAU 2rdquo) arrived on site at the landfill to begin ambient air monitoring and individual location air sampling
11212003 At the request of ERSI PA DEP conducted a meeting with them to discuss the Administrative Order and corrective action timetable During the meeting ERSI suggested and agreed to install twelve (12) gas collection wells into the active portion of the ERSI Landfill in lieu of the 24 test probes required by the Administrative Order The gas collection wells would then be connected to a passive flare the existing gas system at the Amity Landfill andor a new landfill gas flare
1212003 PA DEPrsquos mobile analytical laboratory 1 (ldquoMAU 1rdquo) and mobile analytical laboratory 2 (ldquoMAU 2rdquo) returned to begin ambient air monitoring and individual location air sampling
A PA DEP representative responded to a number of odor complaints and verified an off-site sulfur-like odor at most of the complainantsrsquo properties emanating from the ERSI Landfill The PA DEP representative also confirmed moderate to strong sulfur-like odors at the Riverside Area School District
1222003
1232003
1212003 ndash 12102003 Pursuant to the Administrative Order and the subsequent meeting with PA DEP representatives ERSI installed twelve (12) gas collection wells into the active portion of the ERSI Landfill ERSI gave advance notification of the dates of drilling and the likelihood of strong odors to PA DEP Taylor Borough Old Forge Borough and Riverside School District
A PA DEP representative responded to a number of odor complaints and verified an off-site sulfur-like odor at most of the complainantsrsquo properties The PA DEP representative conducted an onsite inspection and determined the source of the odor to be the ERSI Landfill PA DEP was also informed by the Riverside Area School District that due to the landfill odor entering the building four students became ill and were sent home
74
Date
12102003
12102003
12102003 ndash 12112003
1212003 ndash 12102003
1212003 ndash 12102003
Event Summary
PA DEP received upwards of thirty (30) complaints of strong sulfur-like odors from citizens who live andor work in the area surrounding the ERSI Landfill Complaints were received from the Riverside Elementary School the Riverside High School the Old Forge School District the Taylor Nursing Home the Pennsylvania Turnpike Commission and residents living on Powell Davis Hospital Main Union and Lincoln Streets Some citizens alleged that the odors made them sick andor forced them to leave their homes Two schools in the area were evacuated as a result of the odors PA DEP investigated these complaints and verified an offsite sulfur-like odor at many of the complainantsrsquo properties and along public roadways The off-site odors entered the Riverside Area School District school buildings and prompted school officials to dismiss students A PA DEP representative confirmed that hydrogen sulfide odors were present in the school buildings The PA DEP representative also conducted an on-site inspection and determined the source of the odors to be the ERSI Landfill
PA DEP filed a Complaint in Equity and a Motion for Special Injunction against ERSI in the Court of Common Pleas for Lackawanna County relating to the December 10 2003 odors That case was docketed at Lackawanna County CP No 2000-EQ-60080 The Complaint and Motion sought the imposition of deadlines for the implementation of certain corrective action including completion and construction of the twelve wells installation and operation of the 400 cfm flare and connection of the wells to the flare At the time that the Complaint and Motion were filed ERSI was in the process of completing the work requested and ERSI voluntarily agreed to the court imposition of the deadlines by Court Order
ERSI initially connected the twelve (12) installed gas collection wells to a temporary passive flare and then to the turbines operated by Taylor Energy and related to the Amity Gas System ERSI ordered a temporary 400 cfm flare on December 10 2003 to be delivered that day however it was not delivered until the early morning of the next day ERSI installed and connected all twelve wells to the 400 cfm flare
Within this timeframe as required under the Administrative Order ERSI commenced removal of all vegetation with the exception of necessary ground cover within 10 or more feet of all gas piping and gas wells as required by PA DEP over most of the site
Within this timeframe as required under the Administrative Order ERSI commenced (a) labeling of the wells on the Amity Gas System (b) a detailed evaluation of the condition of the Amity Gas System and (c) performing any necessary repairs on the system including the repairs directed by PA DEP personnel during inspections ERSI engaged Blazosky Associates to perform the evaluation of the Amity Gas System In December 2003 Blazosky Associates submitted to PA DEP on behalf of ERSI a Landfill Gas Investigation Report the receipt and adequacy of which are acknowledged by PA DEP Certain repairs were made to the Amity Gas System ERSI engaged Russ Mercer and SCS to perform additional repairs to the Amity Gas System In addition Mr Mercer was hired to operate and monitor the ERSI gas system As part of the work on the site ERSI reconnected gas wells that had been disconnected ERSI completed all of the repairs to the Amity Gas System recommended under the Blazosky Landfill Gas Investigation Report
75
Date
1212003 ndash 12102003
1212003 ndash 12102003
1212003 ndash 12102003
12112003
12282003
2132004
2142004 ndash 2162004
342004
12142004
Event Summary
Within this timeframe as required under the Administrative Order ERSI commenced hourly off-site and on-site perimeter odor monitoring 24 hours a day and such monitoring continues to the present ERSI documented any odors confirmed as part of those inspections and kept the odor inspection logs as part of its daily operational record
During the first occurrence of the gas odors around September 8 2003 ERSI evaluated the use of chemical neutralizermasking agents however within this timeframe as required under the Administrative Order ERSI has substantially reduced use of such agents as a result of the effectiveness of the gas collection and destruction system installed at the ERSI Landfill ERSI has available for use chemical neutralizers as necessary
Within this timeframe as required under the Administrative Order ERSI completed all scheduled final capping activities for the area of the landfill on which capping activities had begun in October 2003
ERSI informed PA DEP that all the work required by the Court Order (court case docketed at Lackawanna County CP No 2000-EQ-60080) had been completed and that the flare was operational
ERSI engaged a cartographer to fly the site and prepare a map of the current contours ERSI forwarded the drawn map and it was received by PA DEP in February 2004 Since that time at the request of PA DEP ERSI has developed and submitted to the PA DEP a phasing plan for filling of the landfill through closure the receipt and adequacy of which is hereby acknowledged by PA DEP
ERSI installed a 450 cfm John Zink flare (the ldquoJohn Zink Flarerdquo) to replace the 400 cfin flare installed on December 10 2003 as the primary means of gas destruction PA DEP issued RFDs for the John Zink flare permitting its installation and temporary operation without the necessity for a plan approval or operating permit ERSI maintained the 400 cfm flare installed on December 10 2003 as a backup to the John Zink Flare
With the approval of PA DEP ERSI installed an additional nine (9) gas collection wells into the ERSI Landfill and connected those nine wells and the original twelve wells to the John Zinc Flare At the suggestion of PA DEP the wells were installed utilizing a ldquoboxrdquo over the drilling area to minimize the escape of odors and each well was immediately attached to the ERSI Landfill gas system upon completion ERSI gave advance notification of the dates of drilling and the likelihood of strong odors to PA DEP Taylor Borough Old Forge Borough and the Riverside School District PA DEP placed representatives on-site and in the surrounding community on the dates in question and PA DEP collected air samples from neighborhoods individual residences schools and various other locations
PA DEP moved to discontinue the matter of court case docketed at Lackawanna County CP No 2000-EQ-60080 and that the past action has been closed
PA DEP issued ERSI an Air Quality Program Plan Approval Permit No 35-322-008 (the ldquoAir Quality Permitrsquo) ERSI appealed certain provisions of the Air Quality Permit to the Pennsylvania Environmental Hearing Board
76
Date Event Summary
2162005 ndash 2182005 ERSI completed the installation of an enclosed flare for the destruction of landfill gases from the ERSI Landfill The enclosed flare was tested on February 16 17 and 18 2005 and thereafter was placed into service
77
APPENDIX E ATSDR Guidelines for Evaluating Gases Migrating from Landfills
I Background
Landfills especially those that were operating before the stringent requirements of the Resource Conservation and Recovery Act (RCRA) became effective may pose a health problem as they age The problems center on the gases generated by the decomposition of the waste in the landfill Most of the health concerns of landfill gases typically focus on the gases other than methane that may be part of the landfill gas ldquostreamrdquo and that can produce health effects at much lower concentrations than the fire and explosion hazard of methane
This document is intended to provide guidance only it should not be interpreted as mandatory Deviation from the procedures by environmental health professionals is expected and desired when the situation does not conform to the constraints and assumptions made in this document
II Assumptions
Unless there is reasonable evidence otherwise environmental health professionals should assume that hazardous substances were disposed of in any landfill that operated near an industrial area before the effective date of RCRA (~1977) If portable instruments indicate combustible gas readings the combustible constituents of the landfill gas should be considered to be largely methane (~75) with the remainder being other flammable or combustible vapors or gases such as benzene
III Migration Patterns
In general there are two pathways by which landfill gases may migrate offsite The first of these is vertically through the cover the second is horizontally through the soil The two pathways are not mutually exclusive the landfill gases will follow the path of least resistance Consequently construction details of the landfill and the geologyhydrogeology of the site will have a bearing on this migration pattern
Typically vertical migration is not a concern unless structures have been built on the cover or public access is unrestricted The gases tend to dissipate in the open environment However for people living or working on or adjacent to the landfill the concentration of landfill gases in the ambient air may pose a concern and may contribute to local air quality problems odor problems greenhouse effects and ozone depletion If the gases enter a structure built on the landfill cover the contaminants can collect in the structure and the resulting concentrations can reach a level of potential health concern Depending on the size of the structure and the volume of confined space in relation to the volume of landfill gas entering the structure a fire or explosion hazard could develop
Horizontal migration is usually a concern primarily for off-site structures The landfill gases will follow the horizontal path of least resistance until they find an avenue to the surface Because a major constituent of landfill gas is methane that gas will usually be detected first If the avenue to the surface accesses the open environment the gases will dissipate as they do in the vertical
79
migration pathway If the avenue intercepts a structure the gases can build up in the structure as described According to the data collected by EPA this horizontal migration is usually limited to about 300 meters from the landfill boundary [1]
IV Target Compounds
At any disposal site that accepted industrial waste in its lifetime the list of analytes should be targeted at the industrial wastes and their environmental degradation products If leachate or groundwater data are available the results of this analysis should be considered in determining the target compounds of the landfill gas analysis Whenever an environmental investigation of a landfill has been prompted by odorous compounds andor explosive gases the possible presence of toxic substances should be evaluated as well With all landfills alkyl benzenes sulfur compounds (both organosulfides and acid gases) benzene vinyl chloride and methane should be included in an analysis These are common gases that may be associated with industrial wastes construction and debris waste consumer products normal organic wastes andor their degradation products
V Sampling Strategy and Locations
As with any form of sampling the objectives of the sampling effort have to be understood prior to a determination of the sampling strategy For landfill gases common objectives may be to
determine if an fire or explosion hazard exists
identify the source of odors
determine if a toxic substance is being released
determine if a toxic substance is attaining concentrations of health concern
Depending on the issues arising from any given landfill other objectives not considered here could arise as well
Sampling locations are selected based on these objectives and the history and construction of the landfill the location of receptor populations and other sources of contamination in the area (ie control samples or background concentrations) Fire and explosion hazards are usually a concern only when the gases collect in a confined space such as a building or a basement Odor concerns arise most commonly in ambient outdoor air Toxic substances may be a concern in both confined spaces and in ambient air depending on the human exposure pathway and scenario
Expected migration patterns are commonly used to determine the orientation of the sampling locations For instance ldquodowngradientrdquo locations are usually more numerous and the primary focus of the screening effort However ldquoupgradientrdquo samples should also be collected for use as a verification of the migration pattern to determine if ldquoupstreamrdquo diffusion is occurring or for use as a control or background sample in the event that the migration pattern is well known
Ambient air sampling locations should be designed through use of predicted prevailing weather conditions However the air sampling network should be flexible enough to allow sampling stations in any individual sampling effort to be established according to the actual weather conditions encountered on the day of sampling
80
VI Screening Sampling Techniques
A screening effort is usually the first step Locations for sampling for a screening effort typically should include vents from the landfill adjacent structures and simplistic soil gas sampling between the landfill and the structures Fourier-transformed infrared-red (FTIR) or Ultra-Violet (UVS) sampling (see below) along the boundary of the landfill should also be considered In addition to monitoring wells and pre-existing source control (ie ventilation andor ldquoflarerdquo) systems landfill gases may be sampled from cracks in the landfill cover from leachate ldquospringsrdquo and from cracks in adjacent structures and paved parking areas
Several broad spectrum real-time monitors are useful in landfill screening investigations These monitors include combustible gas indicators (CGI) ionization detectors and compound-specific monitors (eg hydrogen sulfide or sulfur dioxide meters methane meters carbon monoxide meters etc) These meters are important for detecting changes in the work environment of site investigators and for identifying sampling locations with good prospects of detecting landfill gases However the limitations of these monitors need to be clearly understood in any evaluation of the data obtained through their use For instance some ionization detectors suffer significant degradation under some conditions common in landfill gases Methane can reduce the sensitivity of the photoionization detector (PID) by up to 90[2] The flame ionization detector (FID) requires enough oxygen in the sampled gas to maintain combustion (oxygen levels gt ~ 12by volume)
For screening efforts sweep surveys of the landfill surface and adjacent areas by use of FIDs and CGIs to identify areas where fissures and cracks permit landfill gas to escape naturally may be advantageous for locating a well During the survey the team must give attention to identifying ldquoflame outrdquo the emission of methane at such a rate that no oxygen gets to the flame to permit ionization of the methane
Grab samples are also useful as indicators of potential trouble spots Grab samples may be collected in Tedlarreg bags or in SUMMAreg or other evacuated canisters Using real-time monitors to coordinate the timing team members may find grab samples useful in evaluating peaks in the emissions The results of the grab sampling can also be useful in modifying the target analytes of future sampling efforts
Soil gas sampling both on the landfill and off-site can be extremely useful In a screening effort this type of sampling is normally accomplished with punchbars to varying depths usually no more than 10 feet and often no more than 3ndash5 feet in depth The punchbars should be deep enough to permit obtaining data below any cap on the landfill After the sampling the hole should be resealed to prevent inadvertent creation of a new vent for the landfill gases Because pressure within the landfill is critical to predicting landfill gas migration pressure measurements at these locations should also be considered
FTIR and UVS sampling are spectroscopic sampling techniques that detect and identify contaminants in the air along a straight line (eg the boundary of a landfill) UVS is typically set up for specific compounds (usually inorganic gases) but FTIR can be used for multiple compounds (usually organic gases) The principle is that the infrared or UV light is generated and then passed to a receptor in a line-of-sight position along a boundary of concern The receptor either analyzes the spectrography of the light or reflects it to another receptor which
81
then does the analysis This second receptor may be part of the source instrument The spectroanalysis can identify specific compounds and concentrations in the space between the source and the receptor However the units are usually given in a concentration of volume per unit distance (eg ppm-m) or mass per area of the beam (eg mgm2) The identified constituents can be added to the list of target analytes [3]
VII Landfill Gas Characterization
According to the results of the screening effort a more comprehensive sampling effort can be planned Sample locations in this expanded sampling would be designed to better characterize the gas streams at those locations identified in the screening effort in similar locations and near sensitive receptors (eg adjacent structures)
Any of the standard methods for ambient air indoor air andor soil gas that attain the desired level of detection for the target analytes are appropriate for use in characterizing landfill gases over time The detection limits should be lower than the concentration of health concern Use of these limits makes protective allowance for the unavoidable errors of any chemical analysis
Soil gas wells on the landfill between the landfill and adjacent structures and near the structures should be considered in any comprehensive sampling program These wells should include pressure gauges to determine the gas pressure at their locations This pressure may be used to predict the migration patterns of landfill gases
VIII Evaluation of Sampling Data
The health-based interpretation of any sampling data is dependent on the quality of the data obtained the method of sample collection the location of the sample the media of the sample and the demographics of the surrounding area Many of the sampling methods preferably used in conjunction with grab sampling at times most likely identify peak (or worst-case) emissions will provide adequate data to characterize the health implications of landfill gases under the conditions of the sample
As a landfill ages the constituents and the relative concentration of the constituents in the gas stream will change over time As environmental conditions change (eg the height of groundwater levels) the migration patterns and possibly the constituents of the gas stream may change Any evaluation of environmental data is valid only for the information reviewed and the conditions during the sample collection Therefore once a potential threat is identified at a landfill continued monitoring or additional sampling may be necessary If the threat continues source controls may be required
Negative results during a screening effort may not mean the characterization effort can stop More than one screening effort may be required to permit obtaining adequate data to indicate that the landfill does not pose a threat Multiple screening efforts are particularly appropriate when a screeningrsquos results indicate variations in the gas stream so that certain constituents of the stream may pose a threat in the near future
Conclusions based on sample results should be limited to the capabilities of the sample methodology and the knowledge available about the landfill other possible impacts should be
82
explored when they could be a concern For instance if explosive gases are the original concern prompting an environmental investigation the bulk of the explosive gases from most landfills will be methane If the choice is made to investigate combustible gases by use of a CGI only any assumption as to the constituents of the gas stream and the relative hazard are not warranted For example if the explosive level measured by the CGI was 60 of the lower explosive limit (LEL) for methane (3 by volume) technically no fire or explosion hazard exists according to that data However there is also a need to consider the possible presence of other explosive gases if only 1 of the combustible gas is a flammable vapor other than methanemdashfor example benzenemdashthe landfill gas may contain approximately 300 ppm benzene (3 = 30000 ppm X 1 = 300 ppm) This value for benzene is well above the OSHA PEL of 1 ppm (8-hour TWA) [4] and the ATSDR acute minimal risk level of 0002 ppm [5]
Many of the typical landfill gases notably the alkyl benzenes and the sulfur compounds (both organosulfides and acid gases) may present an odor problem that can cause health effects such as mucous membrane irritation respiratory irritation nausea and stress These health effects posed by an odor problem can be significant for individuals with pre-existing health conditions (eg allergies respiratory illness)
Line-of-sight remote sensor sampling (ie FTIRUVS) yields results that are given in units of volume per distance or mass per area of the beam A value of 3 ppm-m may mean that the plume attained 3 ppm spread over 1 meter 300 ppb over 10 meters or 300 ppm over a centimeter There are models that can predict based on the reported values the emission rate as well as the concentration that may impact downwind receptors
Given some information in the form of environmental sample results the environmental health professional should compare the concentrations in the samples to our current state of knowledge about those compounds detected while considering the plausible human exposure scenarios at the site Whenever possible the sample results should correspond to the media under consideration in the exposure scenario (eg air samples for inhalation exposures) Good quality empirical data should always supersede theoretical predictions (ie models) no matter how accurate the theory may be The exception to that principle is a situation in which an interference or additional source of contamination exists and affects the empirical data If the empirical data validates a model at a particular location then that model can be used with confidence as long as the modelrsquos conclusions are periodically verified with environmental data If the model is valid at one site it does not necessarily mean the model is valid at all sites
Sampling of two different media at approximately the same time also has inaccuracies unless the migration rate from the one media to the other is known to approximate the sample collection time In the example of soil gas to indoor air the migration rate would be dependent on such factors as the permeability of the gas through the soil and then through the structure the pressure of the gas in the soil possible variations in the migration patterns and other factors unique to the specific type of soil and the environmental conditions at the time of the sampling (eg depth to water ambient temperature etc)
83
IX References
[1] US Environmental Protection Agency 1991 Air Emission from Municipal Solid Waste Landfills - Background Information for Proposed Standards and Guidelines Office of Air and Radiation Office of Air Quality Planning and Standards Emission Standards Division Research Triangle Park NC
[2] Nyquist JE Wilson DL Norman LA and Gammage RB 1990 Decreased sensitivity of photoionization detector total organic vapor detectors in the presence of methane Oak Ridge National Laboratory Journal of the American Industrial Hygiene Assoc Vol 51 pp 326ndash 30
[3] Scotto RL Minnich TR and Leo MR 1991 A method for estimating VOC emission rates from area sources using remote optical sensing IN The Proceedings of the AWMAEPA International Symposium on the Measurement of Toxic and Related Air Pollutants Durham NC May 1991
[4] Code of Federal Regulations Title 29 Part 19101028
[5] ATSDR 1991 Agency for Toxic Substances and Disease Registry Toxicological profile for benzene Atlanta US Department of Health and Human Services
84
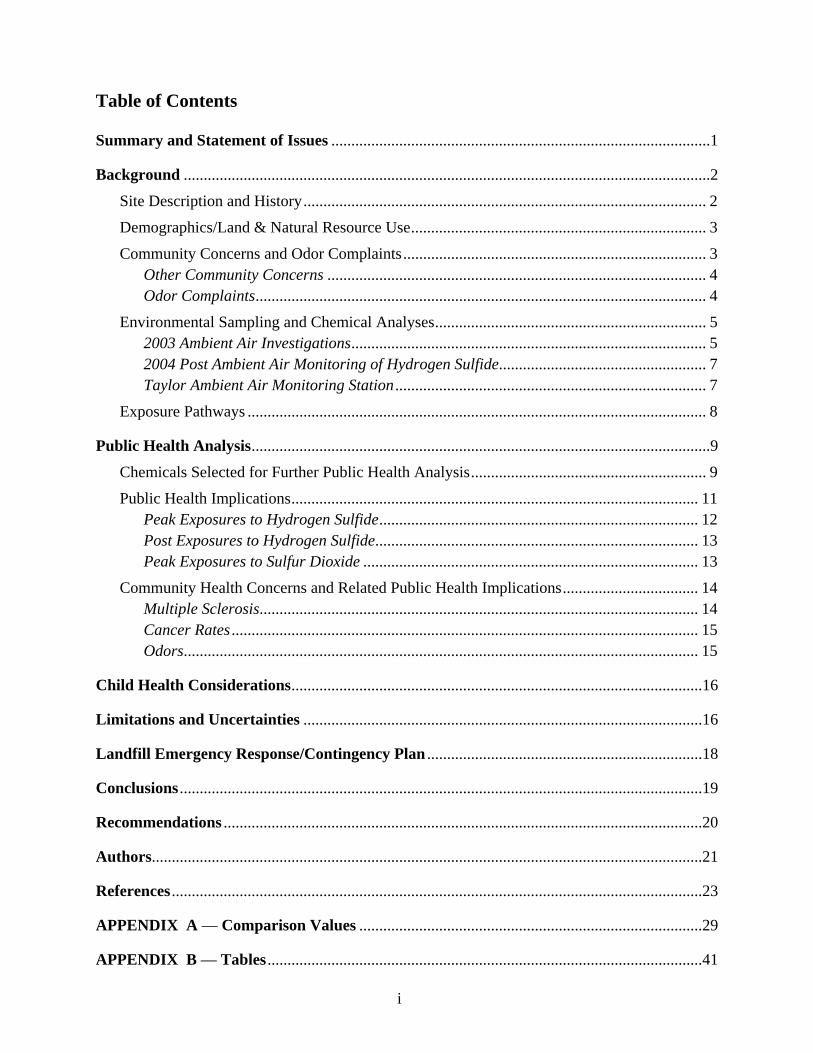