ERPs in Deception, Malingering, and False Memory J. Peter Rosenfeld Psychology Department...
67
ERPs in Deception, Malingering, and False Memory J. Peter Rosenfeld Psychology Department Northwestern University Evanston Illinois,USA
Transcript of ERPs in Deception, Malingering, and False Memory J. Peter Rosenfeld Psychology Department...

ERPs in Deception, Malingering, and False
Memory
J. Peter RosenfeldPsychology DepartmentNorthwestern University
Evanston Illinois,USA

Principal Collaborators to 2008:
• Joel Ellwanger Ming Lui• Tuti Reinhart Miller• Archana Rao• Matt Soskins• Greg Bosh
• Many of the original ideas here were theirs.

A simple neural code

Event-related potentials

P300 Attributes:
• An Endogenous, Event-Related Potential (ERP)
• Positive polarity (down in Illinois).• Latency range: 300-1000 msec
– varies with stimulus complexity/evaluation time
• Typical Scalp Amplitude(Amp) Map – Pz > Cz > Fz
• Amp = f(stim. probability, meaning)

P300 at 3 scalp sites

We are always wanting to compare waves…
• ..that is, group or condition
• averages!

EVENT RELATED POTENTIAL AVERAGING…..

HERE IS WHAT SPONTANEOUS EEG LOOKS LIKE……
…..from 4 sites on the scalp:


HERE IS A SINGLE SWEEP …


HERE ARE 3 TRIALS….


REMINDER FOR PROF TO TAKE
the class to the movie…called, “ERP Averaging”

Since averages are so much cleaner than
single sweeps,…and show the true stimulus-evoked
event that is time-locked to the eliciting event, and are more noise free,….it obviously makes sense to compare averages rather than single sweeps, that is, to do analysis, like t-tests on averages.People did that in comparing group ERPs or grand averages.

For example,• The schizophrenic group average
versus the normal average• or the well-trained group average
P300 vs. that of the untrained group.• Remember, in a group, each subject
has an average ERP.• ….but within a single subject, there
are only single sweeps to compare

In Bootstrapping…
• …..the original set of single sweeps is repeatedly randomly sampled –but with replacement—
…yielding multiple averages in a single subject.
• Let’s say there are 6 repetitions of sampling of 18 single sweeps:

EACH SET OF 18 SINGLE SWEEPS IS AVERAGED YIELDING 6 AVERAGES…
….that look like real average of original set but with variations


P300 amplitude as recognition index
• Autobiographical items (previous slide)
• Guilty Knowledge test items (Rosenfeld et al., 1988)
• Antisocial/illegal acts in employee screening (Rosenfeld et al., 1991).
• Tests of malingered cognitive deficits with oddball paradigm. Do folks recognize personal info? Start with normal models….

3-stimulus protocol
• 1probe
• 2 irrelevant
• 3 target

Normals: autobiog. oddball

CHI patients: autobiog. oddball

Individual detection rates for various stimuli (normal
simulators).

E-Name forgetters(oddball is dark line)

Screening example

Autobiographical paradigm has limitations in detecting malingerers
• Most malingerers are not so unsophisticated as to verbally state that they don’t recall, say, their birthdate, when in fact they may have just filled out a card in which they provided that information.
•

Continuation…
• The behavioral “MDMT” was developed as an entrapment test to catch these people. It’s a simple matching-to-sample test: A sample 3-digit number is presented followed either by a match or mismatch.

Simple MDMT paradigm:
• There is a 5-15 second interval between sample and probe. This is an easy task, yielding 100% performance even in patients with moderate head injury--unless, oddly enough, they happen to be in litigation !
• Where does one set the threshold for diagnosis of malingering? 90%? (Some non-litigating malingerers score well below 90%, as we’ll see.)

Behavioral MDMT not reliable: Some non-
litigating pts. fail

P300-Souped-up MDMT: simple version
• “Simple” means only one probe stimulus per sample.
• P300 is recorded as soon as the probe --match or mismatch-- is presented.
• Match probability is kept low.
• RESULTS------------>

Match-To-Sample example

Computer-plotted data:

What would 75%-HITTING plaintiff’s lawyer say?
• “Sure, my client scores 75% correct and his P300 to matches is bigger than to mismatches. But that’s because he mostly DOES make the correct discrimination--but 75% is still less than normal. Therefore, give us the money (me, one-third).”
•

Continuation…
• We did 2 experiments: 1) If a malingerer aims to score 75% correct, whither P300? 2) What happens to P300 with a really tough discrimination?

Manipulated 75% “hit” rate produces a larger
P300….
100%100%

Experiment 2: Difficult tasks: 7 and 9 digit numbers, match to
sample.

P300 wiped out in difficult task, at 75%, even at
accuracy> 90%

Another View of same effect:

Simple P3-MDMT summary:
• If one fakes 75% hits, one’s P300 gets bigger(or doesn’t change).
• If one has genuine difficulty--honest 75%--then P300 is totally removed.
• These findings should allow discrimination of normals, malingerers, real deficit(pts).
• BUT…diagnostic hit rate only 70% !!

Scalp Distribution
• For P300, Pz > Cz > Fz, usually, but…
• There are many ways that this can be so:

Fz Cz Pz
SITE
AMP

AMP
Fz
CzPz
lie
truth
Fz PzCz
SITES

Match-to-Sample Test: advanced version
• 386 sample• 212 • 457• 386 (*)• 789• 325• 123

Stimulus-Response Types
• Match(R) probe– “Match” (RR--honest/correct)– “Mismatch” (RW--dishonest/error)
• Mismatch(W) probe– “Mismatch” (WW--honest/correct)– “Match” (WR--dishonest/error)

ERPs in Liar Group to R and W

Deception swamps out R/W effect

“Profiles” of Deception

Truth vs Lie Groups

Deception overcomes paradigm effects

Specificity (“Pinnochio”)
• Simple Truth vs. Lie Groups differ in task demands.
• This is not relevant for practical field detection.
• It is relevant for claims pertaining to a specific lie response.
• How do you make a “perfect” control group?

An imperfect(but not bad) control
Two groups run in two trial blocks of autobiog. oddball: [1. Phone #, 2. Bday]
• Lie Group– Block 1 : Respond truthfully, repeat forwards.
– Block 2: Lie 50% of time, repeat forwards.
• Control Group– Block 1: Respond truthfully, repeat forwards.– Block 2: Respond truthfully, repeat
backwards(50%).

Only lying liars stick out.

Same result with simple truth control
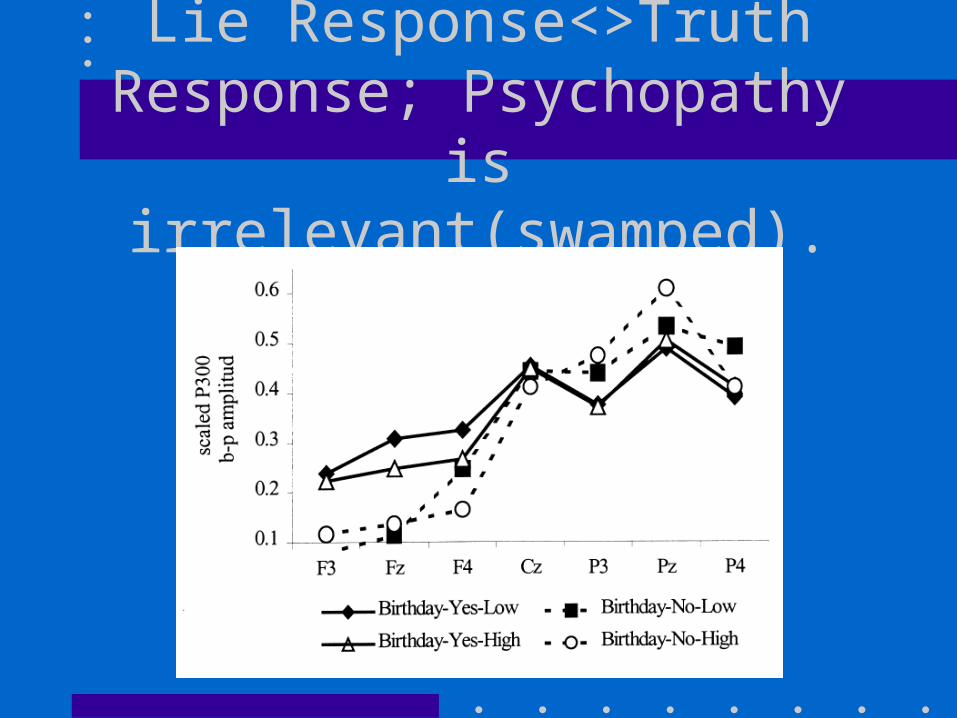
Lie Response<>Truth Response; Psychopathy is
irrelevant(swamped).


Problems with these simple oddball
methods…• (1) All the data I have shown --with
respect to scalp distribution-- were based on group analysis, whereas in deception detection, individual diagnosis is the key and we never did better than 73% accuracy, even with 32 electrodes!
• (2) Countermeasures…more later…

False(honestly believed)memories:
• Deese/Roediger paradigm– Presented words at study: sleep, bed,
dream,blanket,pajamas,dark….– Not presented word: night.
• Test words:– night-- a critical LURE--> possible
responses: “Old” or “New”– bed-- an actual memory word “Old” – table-- a completely new word “New”

Profiles depend on belief:

Replication data: almost ditto

P300 Latency is the unconscious recognizer

Replication data: ditto !

What’s next?
• What does Malingered “false” memory look like?
• Again, what happens as sites are added?
• ________________________________