
ERP1948 Jan Appendixes 1
16
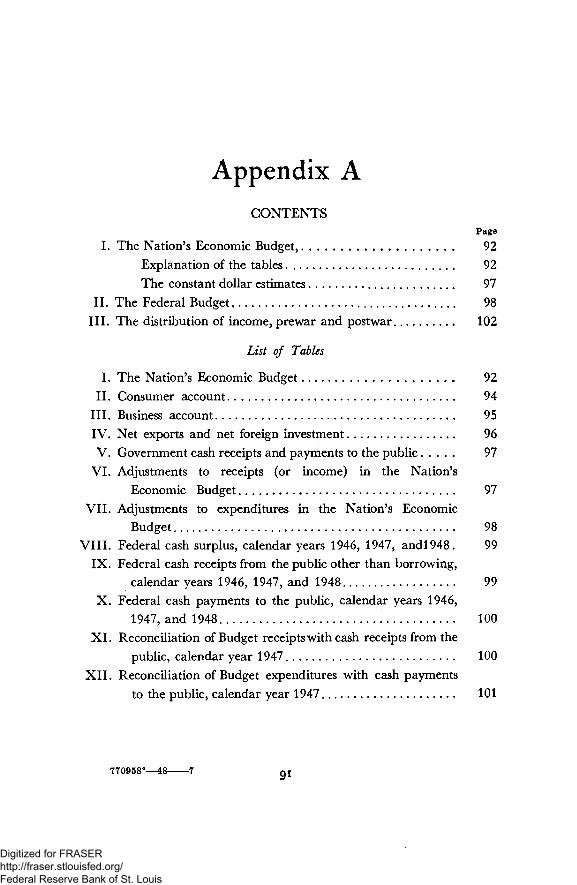
Appendix A CONTENTS Page I. The Nation's Economic Budget, 92 Explanation of the tables 92 The constant dollar estimates 97 II. The Federal Budget 98 III. The distribution of income, prewar and postwar 102 List of Tables I. The Nation's Economic Budget 92 II. Consumer account 94 III. Business account 95 IV. Net exports and net foreign investment 96 V. Government cash receipts and payments to the public 97 VI. Adjustments to receipts (or income) in the Nation's Economic Budget 97 VII. Adjustments to expenditures in the Nation's Economic Budget 98 VIII. Federal cash surplus, calendar years 1946, 1947, andl948. 99 IX. Federal cash receipts from the public other than borrowing, calendar years 1946, 1947, and 1948 99 X. Federal cash payments to the public, calendar years 1946, 1947, and 1948 100 XI. Reconciliation of Budget receipts with cash receipts from the public, calendar year 1947 100 XII. Reconciliation of Budget expenditures with cash payments to the public, calendar year 1947 101 770958°—48 7 Q X Digitized for FRASER http://fraser.stlouisfed.org/ Federal Reserve Bank of St. Louis
-
Upload
fraser-federal-reserve-archive -
Category
Documents
-
view
218 -
download
0
Transcript of ERP1948 Jan Appendixes 1
Appendix ACONTENTS
Page
I. The Nation's Economic Budget, 92Explanation of the tables 92
The constant dollar estimates 97
II. The Federal Budget 98
III. The distribution of income, prewar and postwar 102
List of Tables
I. The Nation's Economic Budget 92
II. Consumer account 94
III. Business account 95
IV. Net exports and net foreign investment 96
V. Government cash receipts and payments to the public 97
VI. Adjustments to receipts (or income) in the Nation's
Economic Budget 97
VII. Adjustments to expenditures in the Nation's EconomicBudget 98
VIII. Federal cash surplus, calendar years 1946, 1947, andl948. 99IX. Federal cash receipts from the public other than borrowing,
calendar years 1946, 1947, and 1948 99X. Federal cash payments to the public, calendar years 1946,
1947, and 1948 100XI. Reconciliation of Budget receipts with cash receipts from the
public, calendar year 1947 100XII. Reconciliation of Budget expenditures with cash payments
to the public, calendar year 1947 101
770958°— 48 7 Q X
Digitized for FRASER http://fraser.stlouisfed.org/ Federal Reserve Bank of St. Louis

I. The Nation's Economic BudgetExplanation of the tables
Table I presents the Nation's Economic Budget for calendar years 1939,1946, and the first and second half of 1947.
T A B L E I.—The Nation's Economic Budget
Calender years 1939,1946; and 1947
[Billions of dollars, current prices]
Economic group
1939
2+1
1946
1947, seasonally adjusted annual rates
First half Second half»
1+1
CONSUMERS
Disposable income —Expenditures
70.267.5
+2.7BUSINESS
Undistributed profits andadditions to reserves
Gross private domestic in-vestment
Excess of receipts (+) orinvestment (—)
158.4
13.3
143.7+14.8
170.3
17.4
160.0+10.3
180.8
17.8
19.0+11.8
9.0 24.6 29.3 31.7
-0.4 -11.3 -11.9 -13.9
I N T E R N A T I O N A L
Net foreign investment. . .Excess of receipts (+) or
investment (—)
G O V E R N M E N T
(Federal, State, and local)
Cash receipts from the
0.9 4.8 9.4 8.2
- 0 . 9 - 4 . 8 - 9 . 4 -8.2
publicCash payments to the
public.Excess of receipts (+) or
payments (—)
15.0 56.5 58.7
17.6 55.2 54.2 52.7
-2.6 +1.3 +5.5A D J U S T M E N T S (To
arrive at gross nationalproduct)
For receipts.,.For payments
Total Gross National Pro-duct
-3.3-4.5
-3.3+4.5
-24.5-24.5
- 2 4 .
+24.-21.4
-26 .8-21.4+26.8
-19.8-24.1
+6.0
-19.8+24.1
90.4 90. 203.7 203.7 226.1 226.1 237.4 237.4
* Based on incomplete data.
NOTE.—Detail will not necessarily add to totals because of rounding.
Sources. The Nation's Economic Budget is based on the estimates ofnational income and product by the Department of Commerce, and of
Digitized for FRASER http://fraser.stlouisfed.org/ Federal Reserve Bank of St. Louis

Government cash receipts and payments by the Bureau of the Budget.Corporate profits before and after taxes in the last half of 1947 are the tenta-tive estimates of the Council of Economic Advisers. All estimates for thesecond half of 1947 are preliminary and subject to revision.
A number of the principal series comprised in the national income andproduct estimates are shown in appendix B, tables I through IV (by calendaryears from 1929 through 1945 and by quarters for 1946 and 1947). Thosedesiring more detailed information are referred to the National IncomeSupplement to the Survey of Current Business, published in July of 1947.Appendix A of the Economic Report of January 1947 contains a generaldescription of the income and product flows depicted in the Nation's Eco-nomic Budget.
Change in treatment. For purposes of statistical simplification aminor change in treatment has been incorporated in the present estimatesof the Nation's Economic Budget from that used in previous reports to theCongress. The Nation's Economic Budget presents Government receiptsand expenditures on a cash basis. In estimating business and personalincome and expenditures the Department of Commerce does not reckonthe transactions of individuals and businesses with the Government on acash basis; e. g., corporate taxes correspond to liabilities rather than pay-ments. Adjustments were formerly made in the income of business andconsumers, as estimated by the Department of Commerce, to place theseaccounts on a cash basis as far as transactions with the Government areinvolved, thus making them consistent with the Government accounts inthe Budget.
It has been decided, however, that the advantage of conceptual consist-ency in the Nation's Economic Budget table is outweighed by the complica-tion of having two sets of estimates of income which are similar in purposeand differ only for technical reasons. Consequently, all adjustments are nowconsolidated in the "adjustment" item at the bottom of the Nation's Eco-nomic Budget table, and the consumers' and business account correspondwith the Department of Commerce concepts.
The simplification is most important in the business income account. Thelatter has formerly included a considerable number of adjustment items,mostly representing transactions with the Government, which made theadjusted total differ markedly from the accounting concept of businessincome. For example, the difference between business tax liabilities andpayments to the Government, as well as receipts from the sale of surplusproperty, were formerly adjustments in business income. The presenttreatment of business income, which corresponds more closely to businessusage, is described below.
93
Digitized for FRASER http://fraser.stlouisfed.org/ Federal Reserve Bank of St. Louis

The Accounts
Consumer account. Table II below shows the principal sources ofpersonal income, personal taxes, and a break-down of expenditures byimportant classifications. Consumer income includes the net profits of unin-corporated business. Expenditures exclude purchases of new homes butinclude imputed rent on owner-occupied dwellings.
TABLE II—Consumer account
Calendar years 1939,1946, and 1947
[Billions of dollars]
Receipts or expenditures 1939 1946
1947seasonally adjust-ed annual rates
Firsthalf
Secondhalf*
Receipts:Personal income
Labor income 2
Proprietors and rental income—.Dividends and interest _Transfer payments8
Veterans*Other
Less: Personal tax and nontax payments-Equals: Disposable income
72.645.714.79.23.0
Expenditures—TotalDurable goods _
Automobiles and partsHousehold equipment and furniture..Other
Nondurable goods -Food*Clothing and shoesOther nondurable goods
ServicesHousingO t h e r . . -
Saving -
2.470.267.56.72.13.41.2
35.319.37.09.0
25.58.9
16.62.7
177.2110.841.813.311.36.94.4
18.8158.4
143.714.93.67.73.6
87.151.718.916.541.712.729.014.8
191.6119.847.114.010.86.24.5
21.3170.3
160.018.95.79.4
58.319.518.844.613.131.610.3
202.9126.249.014.812.97.65.2
22.0180.8
169.020.56.4
10.23.9
101.761.620.419.746.813.932.911.8
i Preliminary estimate based on incomplete data.8 Includes employer disbursements for wages and salaries minus employee contributions for social insur-ance plus other labor income.3 Includes business transfers.
* Includes military pension, disability and retirement payments, mustering-out pay, readjustment, self-employment and subsistence allowances, terminal leave bonds, and other miscellaneous payments.8 Includes alcoholic beverages.
NOTE.—Detail will not necessarily add to totals because of rounding.
Business account. The business income acocunt is shown in table III .Business income includes undistributed corporate profits, and the adjustmentfor corporate inventory valuation, plus capital consumption allowances forall business. Because there is no information on entrepreneurial withdraw-als, it is impossible to include an estimate of retained earnings for unin-corporated business. Thus the true amount of business saving is understatedand personal saving over-estimated by an equal amount. Since investmentincludes the investment of all business, including the investment of indi-viduals in homes, business income and expenditures are not entirelycomparable.
94
Digitized for FRASER http://fraser.stlouisfed.org/ Federal Reserve Bank of St. Louis

TABLE III—Business accountCalendar years 1939, 1946, and 1947
[Billions of dollars]
Receipts or investment 1939 1946
1947seasonally adjust-ed annual rates
First half Secondhalf*
Receipts:Corporate profitsLess:
Corporate profits tax liabilitiesDividends _____
Equals: Corporate undivided profitsPlus: Capital consumption allowanceLess: Corporate inventory valuation adjustment
Equals: Undistributed profits and additions to reserves-
Domestic gross investment:Construction
Residential, nonfarm ___Nonresidential
Producers' durable equipmentChange in business inventories ._
6.5
1.53.81.28.1.7
4.02.11.94.6.4
21.1
5.66.9
11.04.7
13.3
8.53.35.2
12.43.7
28.2
11.26.3
10.712.05.4
17.4
10.04.35.7
17.32.1
27.8
11.16.89.9
12.34.4
17.8
11.25.35.9
18.02.5
Total.
Excess of receipts (+) or investment (—).
9.0
- . 4
24.6
-11.3
29.3
-11.9
31.7
-13.9
i Preliminary estimate based on incomplete data.
The adjustment for inventory valuation arises out of the definition ofgross national product or income. The increase in the physical volume ofinventories, measured in current prices, is included as part of the gross out-put of the economy, and the income derived therefrom as part of the grossnational receipts. When prices are rising, the value of inventories increasesmore than the increase in physical volume, since the value of the existingstock rises as units are sold and replaced at higher costs. Income arises inthe form of "windfall" profits which are not derived from current produc-tion. The inventory valuation adjustment measures this income. Bydeducting this adjustment from retained corporate profits, income and out-put are obtained on a comparable basis. (It should be noted that an adjust-ment for noncorporate inventory valuation is made in business and profes-sional income by the Department of Commerce.)
The investment items shown in the business account cannot be totaledto indicate the amount of funds required for financing. For example,investment includes only that part of an increase in the value of in-ventory arising from an increase in physical volume, while the wholeamount of any increase in the value of inventories must be financed. Needsfor capital also arise in connection with the transfer of fixed assets, thoughsuch transfers are not reflected in the gross national product. In addition,some investment in equipment is financed through depreciation allowancesand some is charged to current expense. Agricultural equipment is fre-
95
Digitized for FRASER http://fraser.stlouisfed.org/ Federal Reserve Bank of St. Louis
quently financed out of farmers' current income and residential constructionby the owner-occupant. Thus these investments do not give rise to financingrequirements in the usual sense.
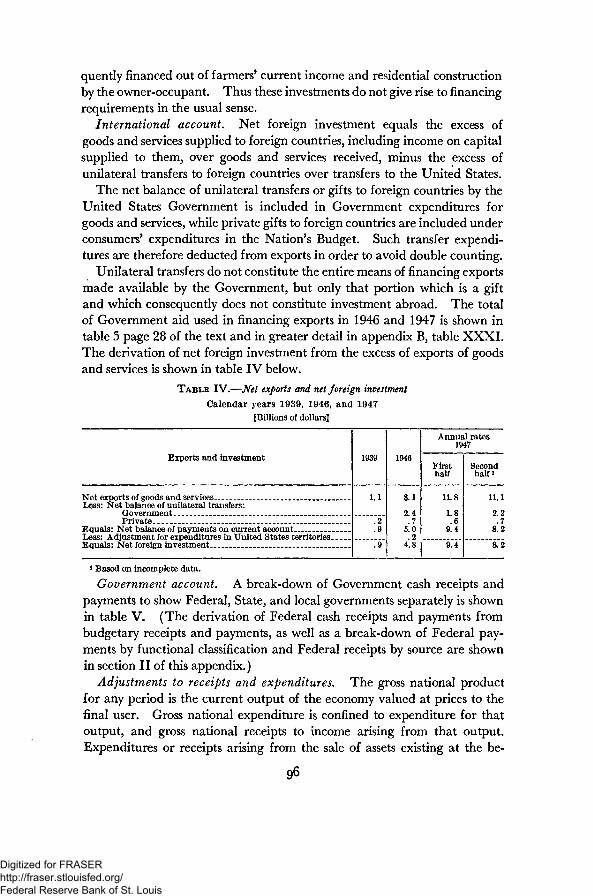
International account. Net foreign investment equals the excess ofgoods and services supplied to foreign countries, including income on capitalsupplied to them, over goods and services received, minus the excess ofunilateral transfers to foreign countries over transfers to the United States.
The net balance of unilateral transfers or gifts to foreign countries by theUnited States Government is included in Government expenditures forgoods and services, while private gifts to foreign countries are included underconsumers' expenditures in the Nation's Budget. Such transfer expendi-tures are therefore deducted from exports in order to avoid double counting.
Unilateral transfers do not constitute the entire means of financing exportsmade available by the Government, but only that portion which is a giftand which consequently does not constitute investment abroad. The totalof Government aid used in financing exports in 1946 and 1947 is shown intable 5 page 28 of the text and in greater detail in appendix B, table XXXI.The derivation of net foreign investment from the excess of exports of goodsand services is shown in table IV below.
TABLE IV.—Net exports and net foreign investment
Calendar years 1939, 1946, and 1947
IBillions of dollars]
Exports and investment
Net exports of goods and services _Less: Net balance of unilateral transfers:
GovernmentPrivate.
Equals: Net balance of payments on current account-Less: Adjustment for expenditures in United States territories.Equals: Net foreign investment
1939
1.1
.2
1946
8.1
2.4.7
5.0.2
4.8
Annual rates1947
Firsthalf
11.8
1.8.6
9.4
9.4
Secondhalf*
11.1
2.2
8! 2
8.2
i Based on incomplete data.
Government account. A break-down of Government cash receipts andpayments to show Federal, State, and local governments separately is shownin table V. (The derivation of Federal cash receipts and payments frombudgetary receipts and payments, as well as a break-down of Federal pay-ments by functional classification and Federal receipts by source are shownin section II of this appendix.)
Adjustments to receipts and expenditures. The gross national productfor any period is the current output of the economy valued at prices to thefinal user. Gross national expenditure is confined to expenditure for thatoutput, and gross national receipts to income arising from that output.Expenditures or receipts arising from the sale of assets existing at the be-
96
Digitized for FRASER http://fraser.stlouisfed.org/ Federal Reserve Bank of St. Louis

T A B L E V.—Government cash receipts and payments to the public
Calendar years 1939, 1946, and 1947
[Billions of dollars]
Receipts or payments
Receipts:Federal.._State and local *
Total receiptsPayments:
FederalState and local * _
Total payments
Surplus (+) or deficit (—)
1939
6.68.4
15.0
9.58.1
17.6
- 2 . 5
1946
45.511.0
56.5
45.39.9
55.2
+1.4
1947 seasonally ad-justed annual rates
Firsthalf
47.712.0
59.7
42.711.5
54.2
+5.5
Secondhalf i
46.112.6
58.7
39.912.8
52.7
+6.0
i Based on incomplete data.3 Excludes Federal grants in aid.
ginning of the period are not included in these concepts, nor are sums trans-ferred in the form of gifts, pensions, annuities, etc.
Tables VI and VII show the deduction which must be made from thesum total of receipts and of expenditures to eliminate capital transactions,transfer payments, and double counting in the estimate of the gross outputor income.
T A B L E VI.—Adjustments to receipts (or income) in the Nation9s Economic Budget
Calendar years 1939, 1946, and 1947[Billions of dollars]
Description 1946
1947 seasonally ad-justed annual rates
Firsthalf
Secondhalf1
Total receipts (or income).-Less: Income not derived from current production of goods and
services:(a) Net interest payments by government(b) Transfer payments to individuals .__(c) Subsidies less current surplus of Government enterprises. __(d) Receipts from sale of surplus propertyAdjustments to Government cash receipts2
Statistical discrepancyEquals: Gross national receipts
1.22.5.5
- . 4- . 590.4
228.2
4.510.8
.81.35.02.1
203.7
247.4
4.510.3
4.10.02.5
226.1
257.3
4.512.4- . 12.1.5.4
237.4
i Based on incomplete data.a Includes excess of Government receipts over liabilities on corporate income taxes, and of Government
receipts over personal tax payments, minus contributions to Government retirement funds, NationalService Life Insurance, and Government Life Insurance. The last 3 items are noneash in nature andconsequently are not included in cash receipts of the Government, ,but must be included in the grossnational income.
NOTE.—Detail will not necessarily add to totals because of rounding.
The constant dollar estimates
Transforming the current dollar estimates in the Nation's EconomicBudget into constant dollar equivalents necessitated the use of special price
97
Digitized for FRASER http://fraser.stlouisfed.org/ Federal Reserve Bank of St. Louis

TABLE VII.—Adjustments to expenditures in the Nation's Economic Budget
Calendar years 1939,1946, and 1947
[Billions of dollars]
Description 1939 1946
1947seasonally adjust-ed annual rates
Firsthalf
Secondhalf*
Total expenditures of consumers, business, and government.Less: Government transfer payments—
To individualsJ
To business3 _Abroad*.. . .
Government cash interest payments.Tax refunds -Other adjustments 8
Equals: Expenditures for gross national product
95.0
2.51.1
- . 21.4.1
- . 590.4
228.3
10.82.63.64.34.0
— 9
252.9
10.3.8
9.04.13.2
- . 7226.1
261.6
12.4.6
5.34.42.0
- . 6237.4
1 Based on incomplete data.2 Includes payments to social insurance beneficiaries, veterans' pensions, and readjustment allowances,
etc. Agrees with the Commerce concept of transfers to individuals.3 Includes Government subsidies, domestic sales of consumer-type surplus property, net receivables, and
capital transactions. (Purchases of consumer-type surplus property are included in consumer expendi-tures. Hence a deduction is made to avoid double-counting.)
* Includes loans to foreign governments and subscriptions to the International Fund and Bank, andsales of surplus property abroad.
«Includes the net expenditures of Government corporations which do not represent capital formation,plus payments from deposit accounts set up by military and civilian personnel overseas, less noncashexpenditures for goods and services.
NOTE.—Detail will not necessarily add to totals because of rounding.
indexes because of the variety of types of incomes and expenditures involved.(See page 55 of text.) These indexes were constructed by breaking expendi-tures down into a large number of components, and deflating each by themost appropriate price index. The implicit index of price change for eachaccount, consumers, business, and Government, could then be determinedfrom the sum of the deflated components. This "implicit" index was usedto adjust the income in each account.
The usefulness of the estimates of National Income and Product wouldbe greatly increased if it were possible to present the key series in terms ofconstant as well as current dollars in all recent years. However, at thepresent time no price indexes adjusted to take account of the differencesin the composition of war output and civilian type output are available.Comparisons between 1947 and 1939 are more satisfactory since the presentcomposition of production is more similar to that of 1939 than to thatof the war years.
II. The Federal BudgetTable VIII shows the Federal cash surplus for calendar years 1946, 1947,
and the anticipated surplus for calendar 1948. The 1948 estimate is basedon the assumption of continued high levels of employment and income, nochanges in tax legislation, and the enactment of the Presidential recom-
Digitized for FRASER http://fraser.stlouisfed.org/ Federal Reserve Bank of St. Louis
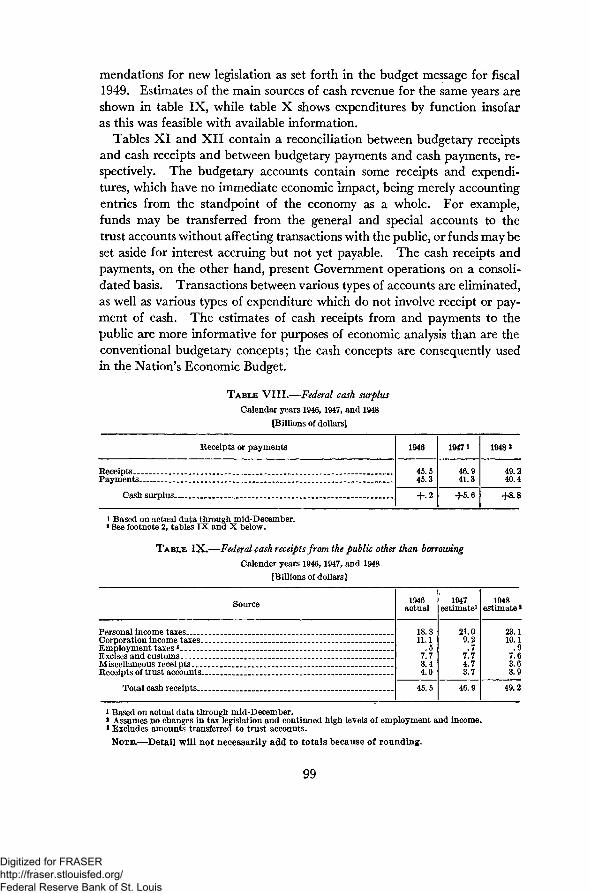
mendations for new legislation as set forth in the budget message for fiscal1949. Estimates of the main sources of cash revenue for the same years areshown in table IX, while table X shows expenditures by function insofaras this was feasible with available information.
Tables XI and XII contain a reconciliation between budgetary receiptsand cash receipts and between budgetary payments and cash payments, re-spectively. The budgetary accounts contain some receipts and expendi-tures, which have no immediate economic impact, being merely accountingentries from the standpoint of the economy as a whole. For example,funds may be transferred from the general and special accounts to thetrust accounts without affecting transactions with the public, or funds may beset aside for interest accruing but not yet payable. The cash receipts andpayments, on the other hand, present Government operations on a consoli-dated basis. Transactions between various types of accounts are eliminated,as well as various types of expenditure which do not involve receipt or pay-ment of cash. The estimates of cash receipts from and payments to thepublic are more informative for purposes of economic analysis than are theconventional budgetary concepts; the cash concepts are consequently usedin the Nation's Economic Budget.
TABLE VIII.—Federal cash surplus
Calendar years 1946,1947, and 1948
[Billions of dollars]
ReceiptsPayments
Cash surplus ...
Receipts or payments 1946
45.545.3
+.2
19471
46.941.3
+5.6
1948 *
49.240.4
+8.8
i Based on actual data through mid-December,a See footnote 2, tables IX and X below.
TABLE IX.—Federal cash receipts from the public other than borrowing
Calender years 1946,1947, and 1948
[Billions of dollars!
Source 1946actual
1947estimate1
1948estimateJ
Personal income taxesCorporation income taxes..Employment taxes3
Excises and customsMiscellaneous receipts
Receipts of trust accounts-
Total cash receipts. _.
18.811.1
.57.73.44.0
21.09.2.7
7.74.73.7
23.110.1
.97.63.63.9
45.5 46.9 49.2
* Based on actual data through mid-December.' Assumes no changes in tax legislation and continued high levels of employment and income.*Excludes amounts transferred to trust accounts.
NOTE.—Detail will not necessarily add to totals because of rounding.
99
Digitized for FRASER http://fraser.stlouisfed.org/ Federal Reserve Bank of St. Louis

TABLE X.—Federal cash payments to the public
Calendar years 1946,1947, and 1948
[Billions of dollars]
Payment 1946actual
1947estimate
1948[estimate >
Budget account:National defenseVeterans' services and benefits _International affairs and finance ___ _.Interest on the public debtEefunds of receiptsOther
Trust accountsExchange Stabilization FundDeductions from Federal employees' salaries for retirementClearing account for outstanding checks and telegraphic reports-Adjustment to daily Treasury statement basis
21.15.23.03.94.04.45.1
- . 3—.4- . 7
12.86.65.93.92.65.62.81.5
- . 2+•2- . 3
11.06.46.93.92.07.13.0
.3- . 2
Total payments to the public. 45.3 41.3 40.4
i Based on actual data through November 1947.* Includes anticipated Presidential recommendations for new legislation.Note:—Detail will not necessarily add to totals because of rounding.
TABLE XL—Reconciliation of Budget receipts with cash receipts from the public
Calendar year 19471
[Billions of dollars]
DescriptionNet budget receipts 44. 0Trust account receipts ^ 6. 7
Total recorded receipts 50. 7
Less: Intragovernmental transactions:Payments to U. S. Treasury (miscellaneous receipts) by Government
enterprises . 7Transfers from general fund to trust accounts 1. 5Interest received by trust funds on investments in United States securities- . 6Receipts from sale of surplus vessels transferred to U. S. Treasury (miscel-
laneous receipts) but also recorded as a trust account receipt andexpenditure . 6
Less: Recorded receipts not paid in cash by the public:Deductions from Federal employees' salaries for retirement funds . 2National Service Life Insurance premiums paid with terminal leave bonds
prior to general redemption date . 1
Equals: Cash receipts from the public2 46. 91 Based on actual data through November.2 Excluding borrowing.NOTE.—Detail will not necessarily add to totals because of rounding.
ioo
Digitized for FRASER http://fraser.stlouisfed.org/ Federal Reserve Bank of St. Louis

TABLE XII.—Reconciliation of Budget expenditures with cash payments to the public
Calendar year 19471
[Billions of dollars]
DescriptionBudget expenditures 41. 5Trust account expenditures 7. 0Exchange Stabilization Fund expenditures 1. 8
Total recorded expenditures 50. 3Clearing account for outstanding checks and telegraphic reports . 2
Adjusted total, recorded expenditures 50. 6
Less: Intragovernmental transactions:Payments to U. S. Treasury (miscellaneous receipts) by Government
enterprises . 7Transfers from general fund to trust accounts 1. 5Interest received by trust funds on investments in United States securities- . 6Investments of trust funds and Government enterprises in United States
securities 3. 5Receipts from sale of surplus vessels transferred to U. S. Treasury (miscel-
laneous receipts) but also recorded as trust account expenditure . 6Less: Recorded expenditures not paid out in cash:
Deduction from employees' salaries for retirement funds • 2Interest on savings bonds (net increase in redemption value of outstand-
ing issues) . • 5Terminal leave bonds issued 1. 4Subscriptions in non-interest-bearing notes to Bretton Woods Organiza-
tion from General and Exchange Stabilization Funds 2. 1Plus: Gash payments not recorded as expenditures:
Redemption of excess profits tax bonds and adjusted service certificates- (a)Terminal leave bonds redeemed for cash 1. 2Redemption of notes by Bretton Woods Organizations . 8Expenditures of Government enterprises from proceeds of sales of obliga-
tions in the market —. 2
Equals: Cash payments to the public 41. 31 Based on actual data through November.2 Less than 50 million dollars.NOTE.—Detail will not necessarily add to totals because of rounding.
I O I
Digitized for FRASER http://fraser.stlouisfed.org/ Federal Reserve Bank of St. Louis

III. The Distribution of Income, Prewar
and Postwar
There has been little opportunity to compare the distribution of incomein the United States over a number of years because the results of varioussurveys are not readily comparable. Sample studies of income, nationalin scope, were made in 1935-36, 1941, 1944, 1945, and 1946. The esti-mates presented in this report are the result of an attempt to revise andarrange the data to make them as nearly comparable as possible. Dis-tributions for the wartime years were not included in the present analysisbecause the pattern of family structure and income was abnormal duringthe war period. The following paragraphs describe the procedure that wasused to compare the income distribution in the years 1935-36, 1941, and1946. The results obtained are still subject to further refinement and re-vision but they are probably reliable enough to indicate the general changesthat have taken place in the distribution of income and are believed to sub-stantiate the conclusions presented in the text.
Income distributions used for prewar and postwar comparisons
The estimates for 1946 used for these comparisons are based on thesecond Survey of Consumer Finances by the Board of Governors of theFederal Reserve System. This survey, covering a national sample of 3,000households, shows the distribution of money income for the civilian popula-tion by income level for the calendar year. The results are presented bothfor spending units and for family units. Family units, including singleindividuals, form the basis of classification used in the present analysis.{Federal Reserve Bulletin, July 1947, pages 791 and 802.)
While the small Federal Reserve survey is sufficient to derive usefulestimates on an over-all basis, larger surveys by the Bureau of the Censusand the Bureau of Agricultural Economics in 1946 include distributionsby family size, occupational group, size of community, and other break-downs, significant both in themselves and for general income analysis.These data have not been utilized in the present report since the results arenot yet available on a national basis. Preliminary tabulations from theCensus sample of urban families, however, appear to substantiate the find-ings of the Federal Reserve study.
For 1941 the distributions shown here are derived from the Study ofFamily Spending and Saving in Wartime, conducted jointly by the Bureauof Labor Statistics and the Bureau of Human Nutrition and Home Eco-nomics. This survey also covered a national sample of about 3,000 house-holds, with distributions for families and single individuals by money-
IO2
Digitized for FRASER http://fraser.stlouisfed.org/ Federal Reserve Bank of St. Louis

income levels. (Bureau of Labor Statistics, Bulletin 822, tables 1 and 3,pp. 68 and 71, and pp. 22-34.)
For 1935-36, use has been made of unpublished distributions preparedby the Research Division of the Office of Price Administration, based onthe National Resources Committee's study, "Consumer Incomes in theUnited States.33 x
Adjustments for comparability of population coverage
In each of these basic studies, the results are presented in terms ofnational coverage, with estimates showing the total number of familyunits in the population. The population weights used in expanding thesample data differ in coverage and are otherwise not on a comparablebasis.2 They were therefore revised to insure comparability, and nowinclude the total number of families and single individuals at the end ofeach year; that is, on June 30, 1936, and December 31, 1941 and 1946.8
1 The revision of the original distributions (which in turn were based on the large-scale sample survey of consumer purchases and on income-tax statistics) involved thefollowing steps: (1) Eliminating imputed items of income to give estimates by levels ofmoney income; (2) Revising the "tail" of the distributions on the basis of Treasuryincome-tax tabulations not available when the NRG report was prepared; (3) Revis-ing the distributions for single individuals on the basis of further analysis of incomesof occupational groups; (4) Adjusting the distributions to cover revised estimates ofthe total number of families and single consumers, based on the 1940 Census; and(5) Adjusting the distributions below the "tail" to bring the total income for all familyunits up to the total derived from the Department of Commerce monthly series onincome payments to individuals. The revisions were carried through separately forfamilies and single individuals.
2 The studies for 1941 and 1946 were limited to families and single individuals inprivate households, excluding those living in rooming houses, hotels, clubs, laborcamps, and other types of quasi households. Both of these reports, moreover, under-represent the number of single individuals in private households. The estimates forall three years differ in the treatment of the time period covered; the 1946 figures applyto the population at the end of the year (or the beginning of 1947), those for 1935-36to the average for the 12-month period, and those for 1941 to the yearly average withpart-year families and individuals converted to a full-year-equivalent basis.
8 These estimates were based on the results of recent sample surveys by the CensusBureau, on the decennial censuses of 1930 and 1940, and on monthly or semiannualestimates of the civilian noninstitutional population and the number of primaryfamilies in private households, issued currently by the Census Bureau.
The definition of the family used in preparing the weights conforms to that usedby the Census Bureau for family units of two or more persons; individuals classifiedby the Census as one-person private families are included with other single indi-viduals—that is, with those living as lodgers or paid help in private and quasi house-holds. The estimates cover all persons in the continental population except inmatesof institutions and Armed Forces personnel in military posts or overseas.
103
Digitized for FRASER http://fraser.stlouisfed.org/ Federal Reserve Bank of St. Louis

The resulting figures for the three years are as follows:
Year
1935-36 — _19411946
Familiesand singleindividuals
38, 410,00041,030,00043,330,000
Families (2or more per-
sons)
30,430,00032,880,00035,860,000
Single in-dividuals
7,980,0008,150,0007,470,000
The basic income distributions for each year were then adjusted to coverthe revised population weights. For 1935-36 the revisions required in theOPA estimates were minor. For the two later years, however, the adjust-ments involved a substantial increase in the number of single consumers,with some reduction in the number of families for 1941 and some increasefor 1946. For lack of evidence to the contrary, the changes were allocatedby income level so as to maintain the original percentage distributions offamily units.4
Adjustments of aggregate income covered
The adjustments for population coverage resulted in some increase in theaggregate amount of income accounted for in the distributions for each yearstudied. Nevertheless, the revised figures still fell short of the national totalsof civilian noninstitutional money income derived from the personal-incomeseries prepared by the Department of Commerce.
A further adjustment of the distributions was therefore required to placethem on a more comparable basis with respect to income coverage. Thisadjustment also was necessarily made on an arbitrary basis, by assuming thatincomes at all levels were under-reported by the same percent. While thereis evidence that some under-reporting is apt to occur at all income levels, itis probable that the proportion tends to be greater at the higher levels.In both the 1941 and the 1946 studies special measures were adoptedto minimize this bias as fully as possible, but with the information now at
4 For 1941 (and 1935-36), it was possible to handle the adjustment for familiesand single consumers separately. This procedure, however, was not possible for 1946,since the Federal Reserve estimates were available only for all family units combined.Thus, while the results for 1941 are probably fairly reliable, the adjustment for 1946involves some upward bias, since the original distribution used to allocate the addi-tional single consumers by income level was heavily weighted by families of two ormore persons.
104
Digitized for FRASER http://fraser.stlouisfed.org/ Federal Reserve Bank of St. Louis

hand it is impossible to evaluate the success of these measures.5 Pending thecompletion of detailed analysis of these survey data and comparison withdata from the 1946 income surveys of the Bureaus of the Census andAgricultural Economics and with income-tax returns and other statisticalseries, it seems inadvisable to attempt differential adjustments by incomelevels.
The percentage expansion of the total amount of income at each incomelevel was made for each year on the basis of the combined distributions forfamilies and single consumers. For 1946, the expansion (after adjustmentfor population coverage) was 16 percent, for 1941 it was 13.5 percent,and for 1935-36, due to the refinements already made in the distributions,it was only about 1.5 percent
Comparison of shares of income
From these adjusted income-level figures, the proportion of the totalincome going to each fifth of families and single individuals ranked in orderof their cash income was estimated for each year. These percentages areshown below.
Families and single individuals grouped from lowest to
Lowest fifth.Second fifthThird fifthFourth fifthHighest fifth
Percentage of total civilian moneyincome
1935-36
4.08.7
13 620.553.2
1941
3.48.7
15 322.050.6
1946
4.410.616.022.146.9
An average income for each fifth of the population may be obtainedfrom these proportionate shares of income for each period. Comparisonsof income among various years require a further adjustment, however,since the purchasing power of income changes from year to year, alteringthe real value of money incomes. This was especially marked over theperiod we are considering. To adjust for changes in purchasing jgower,the aggregates of income were raised in 1935-36 and 1941 to the price
8 For methods of sampling at high income levels in 1946, see pp. 662, 663, FederalReserve Bulletin, June 1947. The adjustments made for refusal rates by income leveland for mean incomes at higher levels in the 1941 study are described in Bureau ofLabor Statistics bulletin 822, pages 22 through 28.
105
Digitized for FRASER http://fraser.stlouisfed.org/ Federal Reserve Bank of St. Louis
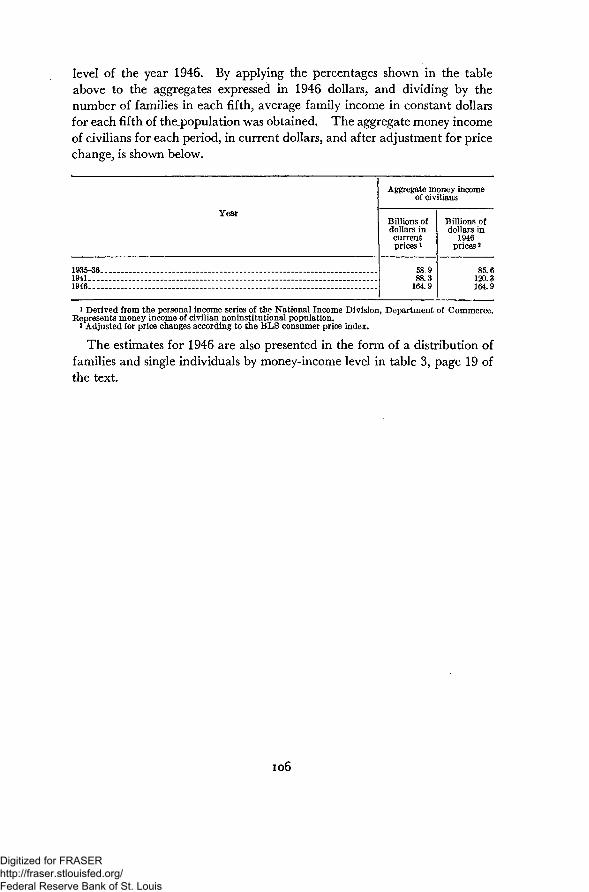
level of the year 1946. By applying the percentages shown in the tableabove to the aggregates expressed in 1946 dollars, and dividing by thenumber of families in each fifth, average family income in constant dollarsfor each fifth of thejpopulation was obtained. The aggregate money incomeof civilians for each period, in current dollars, and after adjustment for pricechange, is shown below.
1935-3619411946
Year
Aggregate money incomeof civilians
Billions ofdollars incurrentprices i
58.988.3
164.9
Billions ofdollars in
1946prices 2
85.6120.3164.9
1 Derived from the personal income series of the National Income Division, Department of Commerce.Eepresents money income of civilian noninstitutional population.
2 Adjusted for price changes according to the BLS consumer price index.
The estimates for 1946 are also presented in the form of a distribution offamilies and single individuals by money-income level in table 3, page 19 ofthe text.
106
Digitized for FRASER http://fraser.stlouisfed.org/ Federal Reserve Bank of St. Louis