EROSION EXPOSURE ASSESSMENT—DILLINGHAM
16
Report of Investigation 2021-3 Dillingham EROSION EXPOSURE ASSESSMENT—DILLINGHAM Richard M. Buzard, Mark M. Turner, Katie Y. Miller, Donald C. Antrobus, and Jacquelyn R. Overbeck Published by STATE OF ALASKA DEPARTMENT OF NATURAL RESOURCES DIVISION OF GEOLOGICAL & GEOPHYSICAL SURVEYS 2021 Dillingham, Alaska in 2004. Photo: Alaska Division of Community and Regional Affairs, www.commerce.alaska.gov/dcra/ dcrarepoext/Pages/PhotoLibrary.aspx.
Transcript of EROSION EXPOSURE ASSESSMENT—DILLINGHAM

Report of Investigation 2021-3 Dillingham
EROSION EXPOSURE ASSESSMENT—DILLINGHAM
Richard M. Buzard, Mark M. Turner, Katie Y. Miller, Donald C. Antrobus, and Jacquelyn R. Overbeck
Published bySTATE OF ALASKA
DEPARTMENT OF NATURAL RESOURCESDIVISION OF GEOLOGICAL & GEOPHYSICAL SURVEYS
2021
Dillingham, Alaska in 2004. Photo: Alaska Division of Community and Regional Affairs, www.commerce.alaska.gov/dcra/dcrarepoext/Pages/PhotoLibrary.aspx.


State of AlaskaDepartment of Natural ResourcesDivision of Geological & Geophysical Surveys
Report of Investigation 2021-3 Dillingham
EROSION EXPOSURE ASSESSMENT—DILLINGHAM
Richard M. Buzard, Mark M. Turner, Katie Y. Miller, Donald C. Antrobus, and Jacquelyn R. Overbeck

STATE OF ALASKAMike Dunleavy, Governor
DEPARTMENT OF NATURAL RESOURCESCorri A. Feige, Commissioner
DIVISION OF GEOLOGICAL & GEOPHYSICAL SURVEYSSteve Masterman, State Geologist and Director
Publications produced by the Division of Geological & Geophysical Surveys (DGGS) are available to download from the DGGS website (dggs.alaska.gov). Publications on hard-copy or digital media can be examined or purchased in the Fairbanks office:
Alaska Division of Geological & Geophysical Surveys3354 College Rd., Fairbanks, Alaska 99709-3707Phone: (907) 451-5010 Fax (907) [email protected] | dggs.alaska.gov
DGGS publications are also available at:Alaska State Library, Historical Collections & Talking Book Center395 Whittier StreetJuneau, Alaska 99811
Alaska Resource Library and Information Services (ARLIS)3150 C Street, Suite 100Anchorage, Alaska 99503
Suggested citation:Buzard, R.M., Turner, M.M., Miller, K.Y., Antrobus, D.C., and Overbeck, J.R., 2021, Erosion Exposure Assessment of Infrastructure in Alaska Coastal Communities: Alaska Division of Geological & Geophysical Surveys Report of Investigation 2021-3.https://doi.org/10.14509/30672

ContentsDillingham Erosion Exposure Assessment ...................................................................................................................1Acknowledgments ................................................................................................................................................................3References ...............................................................................................................................................................................4
FiguresFigure 1. Predicted erosion changes at Dillingham wastewater lagoon ...........................................................2Figure 2. Replacement cost of utilities, transportation infrastructure, and buildings in the erosion forecast area ............................................................................................................................................................3
TablesTable 1. Quantity of infrastructure with estimated erosion exposure .................................................................2Table 2. Replacement cost of infrastructure exposed to erosion..........................................................................2Table 3. Cost estimate of exposed buildings and tank facilities............................................................................3


1 Alaska Division of Geological & Geophysical Surveys, 3354 College Rd., Fairbanks, Alaska 99709-3707 2 Alaska Native Tribal Health Consortium, 4000 Ambassador Drive, Anchorage, Alaska 99508
EROSION EXPOSURE ASSESSMENT—DILLINGHAM
Richard M. Buzard1, Mark M. Turner1, Katie Y. Miller1, Donald C. Antrobus2, and Jacquelyn R. Overbeck1
DILLINGHAM EROSION EXPOSURE ASSESSMENT
This is a summary of erosion forecast results near infrastructure at Dillingham, Alaska. We conduct a shoreline change analysis, forecast 60 years of erosion, and estimate the replacement cost of infrastructure in the forecast area. Buzard and others (2021) describe the method and guidance for interpreting tables and maps.
Source data for this summary include the following:
• Delineated vegetation lines and change assess-ment by Buzard and others (2021) following the methods of Overbeck and others (2020).
• Infrastructure GIS shapefiles and metadata from the City of Dillingham (2021) GIS Pub-lic Works open data site.
• Added infrastructure such as roads and build-ings, delineated if visible in the most up-to-date high resolution (≤ 0.66 ft [20 cm] ground sample distance) aerial orthoimagery (Quantum Spatial, 2019).
• Computed infrastructure cost of replacement based on square or linear footage from Buzard and others (2021).
Dillingham is located in southwest Alaska at the head of Nushagak Bay at the confluence of the Wood and Nushagak Rivers. Erosion at Dill-ingham is caused by tidal fluctuations and severe storm events (City of Dillingham, 2016). Erosion ranges from 3 to 9.8 feet per year along most of the shoreline fronting the City of Dillingham but reaches up to 16.4 feet per year on the shoreline adjacent to the wastewater lagoon (Overbeck and
others, 2020). Efforts to control riverbank erosion began in 1983 with the construction of a seawall east of the city dock to Snag Point (U.S. Army Corps of Engineers, 2009). Shoreline protections also exist along the east bank of the boat harbor and along the shoreline fronting the mooring facil-ities of Bristol Alliance Fuels.
We forecast erosion 60 years from the most recent shoreline (2018) at 20-year intervals to identify the exposure of infrastructure to erosion (tables 1–3). Erosion is not forecast where shore-line protection structures exist. Southwest of the boat harbor, erosion is forecast to reach 17 build-ings between 2038 and 2078 (table 1). These are either identified as residences or unspecified (table 3). East of Snag Point, rapid and consis-tent erosion of a peat meadow is encroaching on the wastewater lagoon and nearby water and sewer lines. The City of Dillingham (2018) reports the sewage outfall pipe is currently expe-riencing erosion impacts. Erosion is forecast to undermine the entire pipe and reach the waste-water lagoon by 2058. However, the peat meadow fronting the lagoon infrastructure transitions into a vegetated hill covered with fill from the lagoon’s construction (fig. 1). This topographic variation

2 Report of Investigation 2021-3
Figure 1. Predicted erosion changes at Dillingham wastewater lagoon. (Left) The color-infrared image of the 1980 Dillingham coast shows the base of the hill. (Right) 2018 image of the same area. The wastewater lagoon is built into the hill, and fill from the construction is deposited seaward. Erosion continues at a linear rate toward the hill’s base and fill area, suggesting exposure by 2058. However, the fill area has different lithology and vegetation cover that can significantly change erosion rates.
Table 1. Quantity of infrastructure with estimated erosion exposure by linear footage (LF), square foot-age (SF), or count (n).
Table 2. Replacement cost of infrastructure exposed to erosion per 20-year interval.
Quantity of Exposed InfrastructureErosion Forecast
Date RangeBuildings & Tank
Facilities (n) Water Lines (LF) Roads (LF) Wastewater Lagoon (SF)
2018 to 2038 0 610 0 0
2038 to 2058 9 981 0 2,006
2058 to 2078 8 1,258 856 97,854
Combined Total 17 2,849 856 99,860
Cost to Replace Exposed InfrastructureErosion Forecast
Date RangeBuildings & Tank
Facilities Water Lines Roads Wastewater Lagoon Sum
2018 to 2038 $0 $244,100 $0 $0 $244,100
2038 to 2058 $4,506,200 $392,500 $0 $6,000,000 $10,898,700
2058 to 2078 $2,480,100 $503,100 $342,300 $0 $3,325,500
Combined Total $6,986,300 $1,139,700 $342,300 $6,000,000 $14,468,300

3Erosion exposure assessment—Dillingham
can significantly alter the rate of erosion, so a site investigation is appropriate to assess exposure of the lagoon and nearby infrastructure more accu-rately. The total estimated replacement cost of infrastructure exposed to erosion is $14.5 million (± $4.3 million) by 2078 (table 2; fig. 2). We do not estimate erosion exposure for power and fuel infrastructure because the data were not available.
ACKNOWLEDGMENTSThis work was funded by the Denali Commis-
sion Village Infrastructure Protection Program through the project “Systematic Approach to Assessing the Vulnerability of Alaska’s Coastal Infrastructure to Erosion.” The community of Dill-ingham was not consulted for this report.
Figure 2. This figure shows the replacement cost of utilities, transportation infrastructure, and buildings in the erosion fore-cast area. Twenty-year intervals are symbolized by color: purple represents the time interval 2018 to 2038, orange represents 2038 to 2058, and yellow represents 2058 to 2078. The greatest single cost is the wastewater lagoon that is forecast to begin experiencing erosion by 2058. The total cost of buildings exceeds this, reaching over $7.0 million.
Table 3. Cost estimate of exposed buildings and tank facilities by 20-year interval. The count of exposed residential or unspecified buildings is de-noted in parentheses.
Cost to Replace Exposed Buildings and Tank FacilitiesErosion Forecast
Date Range Building Type Cost of Replacement
2018 to 2038 none 0
2038 to 2058Residential (4) $ 2,808,500
Unspecified (5) $ 1,697,700
2058 to 2078Residential (2) $ 1,180,100
Unspecified (6) $ 1,300,000

4 Report of Investigation 2021-3
REFERENCESBuzard, R.M., Turner, M.M., Miller, K.Y., Antro-
bus, D.C., and Overbeck, J.R., 2021, Erosion exposure assessment of infrastructure in Alaska coastal communities: Alaska Division of Geo-logical & Geophysical Surveys Report of Investi-gation 2021-3. https://doi.org/10.14509/30672
City of Dillingham, 2016, City of Dillingham 2016 hazard mitigation plan: Federal Emergency Management Agency, 190 p.
———2018, Capital improvement project—Ero-sion mitigation for sewage outfall pipe: City of Dillingham, 9 p.
———2021, City of Dillingham GIS public works open data site: City of Dillingham [website]:
found at https://city-of-dillingham-dillingham.hub.arcgis.com/
Overbeck, J.R., Buzard, R.M., Turner, M.M., Mill-er, K.Y., and Glenn, R.J., 2020, Shoreline change at Alaska coastal communities: Alaska Division of Geological & Geophysical Surveys Report of In-vestigation 2020-10, 29 p., 45 sheets. https://doi.org/10.14509/30552
Quantum Spatial, 2019, Bristol Bay shoreline 2018 imagery—Technical data report: Quantum Spa-tial, 10 p.
U.S. Army Corps of Engineers, 2009, City shore-line emergency bank stabilization, Dillingham, Alaska: U.S. Army Corps of Engineers Alaska District, 37 p.
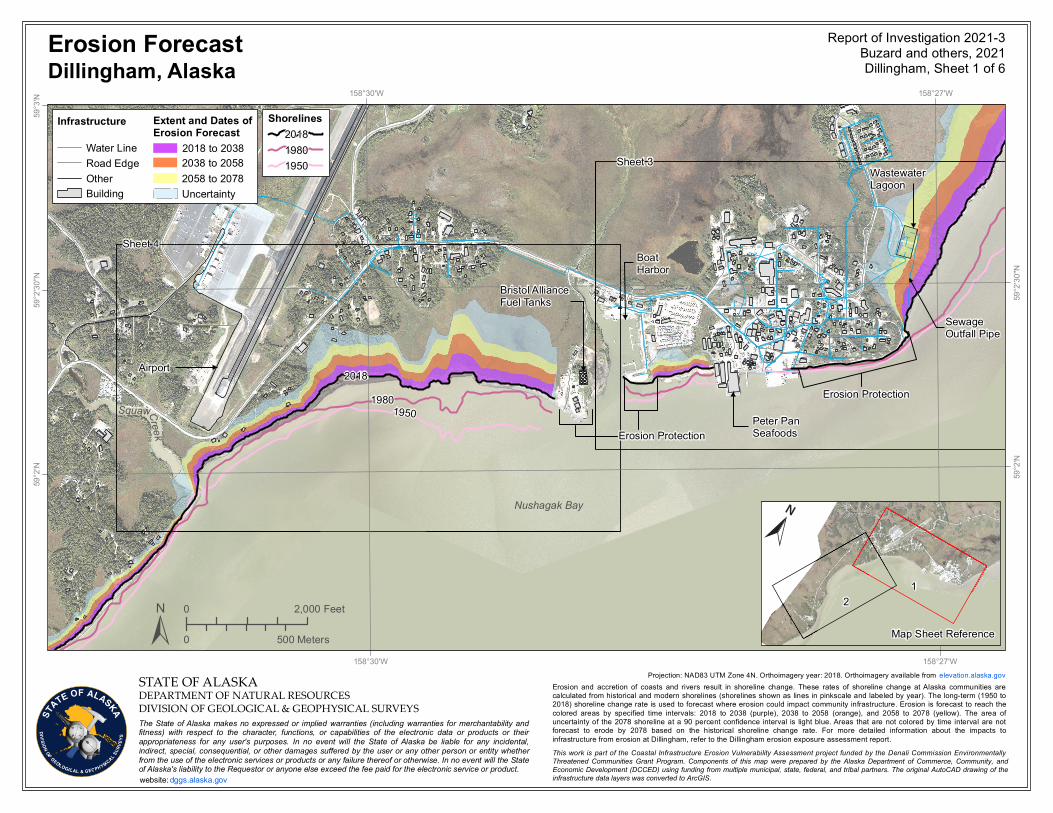
Report of Investigation 2021-3Buzard and others, 2021Dillingham, Sheet 1 of 6
158°27'W
158°27'W
158°30'W
158°30'W
59°3
'N59
°2'3
0"N
59°2
'30"
N
59°2
'N
59°2
'N
Dillingham, AlaskaErosion Forecast
±
dggs.alaska.govwebsite:
The State of Alaska makes no expressed or implied warranties (including warranties for merchantability andfitness) with respect to the character, functions, or capabilities of the electronic data or products or theirappropriateness for any user's purposes. In no event will the State of Alaska be liable for any incidental,indirect, special, consequential, or other damages suffered by the user or any other person or entity whetherfrom the use of the electronic services or products or any failure thereof or otherwise. In no event will the Stateof Alaska's liability to the Requestor or anyone else exceed the fee paid for the electronic service or product.
DEPARTMENT OF NATURAL RESOURCESDIVISION OF GEOLOGICAL & GEOPHYSICAL SURVEYS
STATE OF ALASKA
This work is part of the Coastal Infrastructure Erosion Vulnerability Assessment project funded by the Denali Commission EnvironmentallyThreatened Communities Grant Program. Components of this map were prepared by the Alaska Department of Commerce, Community, andEconomic Development (DCCED) using funding from multiple municipal, state, federal and tribal partners. The original AutoCAD drawing of theinfrastructure data layers converted to ArcGIS.
Erosion and accretion of coasts and rivers result in shoreline change. These rates of shoreline change at Alaska communities arecalculated from historical and modern shorelines (shorelines shown as lines in pinkscale and labeled by year). The long-term (1950 to2018) shoreline change rate is used to forecast where erosion could impact community infrastructure. Erosion is forecast to reach thecolored areas by specified time intervals: 2018 to 2038 (purple), 2038 to 2058 (orange), and 2058 to 2078 (yellow). The area ofuncertainty of the 2078 shoreline at a 90 percent confidence interval is light blue. Areas that are not colored by time interval are notforecast to erode by 2078 based on the historical shoreline change rate. For more detailed information about the impacts toinfrastructure from erosion at Dillingham, refer to the Dillingham erosion exposure assessment report.
Nushagak Bay
Airport
Bristol AllianceFuel Tanks
BoatHarbor
Peter Pan SeafoodsErosion Protection
WastewaterLagoon
Sewage Outfall Pipe
2018
Sheet 3
Extent and Dates ofErosion Forecast
Road EdgeWater Line
BuildingOther
2018 to 20382038 to 20582058 to 2078Uncertainty
Infrastructure
Projection: NAD83 UTM Zone 4N. Orthoimagery year: 2018. Orthoimagery available from elevation.alaska.gov
Sheet 4
19801950
Erosion Protection
Shorelines201819801950
Map Sheet Reference
12
SquawCreek
0 500 Meters
0 2,000 Feet
N

Report of Investigation 2021-3Buzard and others, 2021Dillingham, Sheet 2 of 6
158°32'W
158°32'W158°33'W158°34'W
158°31'W 158°30'W
59°2
'N
59°N
158°
33'W
158°
34'W
158°
30'W
59°2'N59°1'N
59°1'N59°N
Dillingham, AlaskaErosion Forecast
±dggs.alaska.govwebsite:
The State of Alaska makes no expressed or implied warranties (including warranties for merchantability andfitness) with respect to the character, functions, or capabilities of the electronic data or products or theirappropriateness for any user's purposes. In no event will the State of Alaska be liable for any incidental,indirect, special, consequential, or other damages suffered by the user or any other person or entity whetherfrom the use of the electronic services or products or any failure thereof or otherwise. In no event will the Stateof Alaska's liability to the Requestor or anyone else exceed the fee paid for the electronic service or product.
DEPARTMENT OF NATURAL RESOURCESDIVISION OF GEOLOGICAL & GEOPHYSICAL SURVEYS
STATE OF ALASKA
This work is part of the Coastal Infrastructure Erosion Vulnerability Assessment project funded by the Denali Commission EnvironmentallyThreatened Communities Grant Program. Components of this map were prepared by the Alaska Department of Commerce, Community, andEconomic Development (DCCED) using funding from multiple municipal, state, federal and tribal partners. The original AutoCAD drawing of theinfrastructure data layers converted to ArcGIS.
Nushagak Bay
1950
1980
2018
Sheet 5
Kanakanak Hospital
KanakanakRoad
Church
Projection: NAD83 UTM Zone 4N. Orthoimagery year: 2018. Orthoimagery available from elevation.alaska.gov
Extent and Dates ofErosion Forecast
Road EdgeWater Line
BuildingOther
2018 to 20382038 to 20582058 to 2078Uncertainty
Infrastructure
Shorelines201819801950
Sheet 6
Erosion and accretion of coasts and rivers result in shoreline change. These rates of shoreline change at Alaska communities arecalculated from historical and modern shorelines (shorelines shown as lines in pinkscale and labeled by year). The long-term (1950 to2018) shoreline change rate is used to forecast where erosion could impact community infrastructure. Erosion is forecast to reach thecolored areas by specified time intervals: 2018 to 2038 (purple), 2038 to 2058 (orange), and 2058 to 2078 (yellow). The area ofuncertainty of the 2078 shoreline at a 90 percent confidence interval is light blue. Areas that are not colored by time interval are notforecast to erode by 2078 based on the historical shoreline change rate. For more detailed information about the impacts toinfrastructure from erosion at Dillingham, refer to the Dillingham erosion exposure assessment report.
Map Reference Sheet
12
0 500 Meters
0 2,000 Feet
158°
31'W
N

Report of Investigation 2021-3Buzard and others, 2021Dillingham, Sheet 3 of 6
158°27'W
158°27'W
158°28'W
158°28'W
59°2
'45"
N
59°2
'45"
N
59°2
'30"
N
59°2
'30"
N
59°2
'15"
N
59°2
'15"
N
Dillingham, AlaskaErosion Exposure
±
dggs.alaska.govwebsite:
The State of Alaska makes no expressed or implied warranties (including warranties for merchantability andfitness) with respect to the character, functions, or capabilities of the electronic data or products or theirappropriateness for any user's purposes. In no event will the State of Alaska be liable for any incidental,indirect, special, consequential, or other damages suffered by the user or any other person or entity whetherfrom the use of the electronic services or products or any failure thereof or otherwise. In no event will the Stateof Alaska's liability to the Requestor or anyone else exceed the fee paid for the electronic service or product.
DEPARTMENT OF NATURAL RESOURCESDIVISION OF GEOLOGICAL & GEOPHYSICAL SURVEYS
STATE OF ALASKA
This work is part of the Coastal Infrastructure Erosion Vulnerability Assessment project funded by the Denali Commission EnvironmentallyThreatened Communities Grant Program. Components of this map were prepared by the Alaska Department of Commerce, Community, andEconomic Development (DCCED) using funding from multiple municipal, state, federal and tribal partners. The original AutoCAD drawing of theinfrastructure data layers converted to ArcGIS.
elevation.alaska.gov
Erosion Protection
WastewaterLagoon
Sewage Outfall Pipe
Boat Harbor
Peter PanSeafoods
Nushagak Bay
Buildings and Datesin Erosion Forecast
Road EdgeWater Line
Other
Infrastructure Extent and Date ofErosion Forecast
> 2078Uncertainty2078
Erosion Protection
2018
1980
1950
2078
Erosion and accretion of coasts and rivers result in shoreline change. These rates of shoreline change at Alaska communities arecalculated from historical and modern shorelines (shorelines shown as lines in pinkscale and labeled by year). The long-term (1950 to2018) shoreline change rate is used to forecast where erosion could impact community infrastructure. Erosion is forecast to year 2078(dark blue) with a 90 percent confidence interval area of uncertainty (light blue). Buildings forecast to be impacted by erosion arecolored by the range of years when the impact is forecast to occur: 2018 to 2038 (purple), 2038 to 2058 (orange), 2058 to 2078(yellow), and no impacts expected by 2078 (gray). For more detailed information about the impacts to infrastructure from erosion atDillingham, refer to the Dillingham erosion exposure assessment report.
Map Sheet Reference
3
45
6
Projection: NAD83 UTM Zone 4N. Orthoimagery year: 2018. Orthoimagery available from
Shorelines201819801950
0 250 Meters
0 1,000 Feet
N
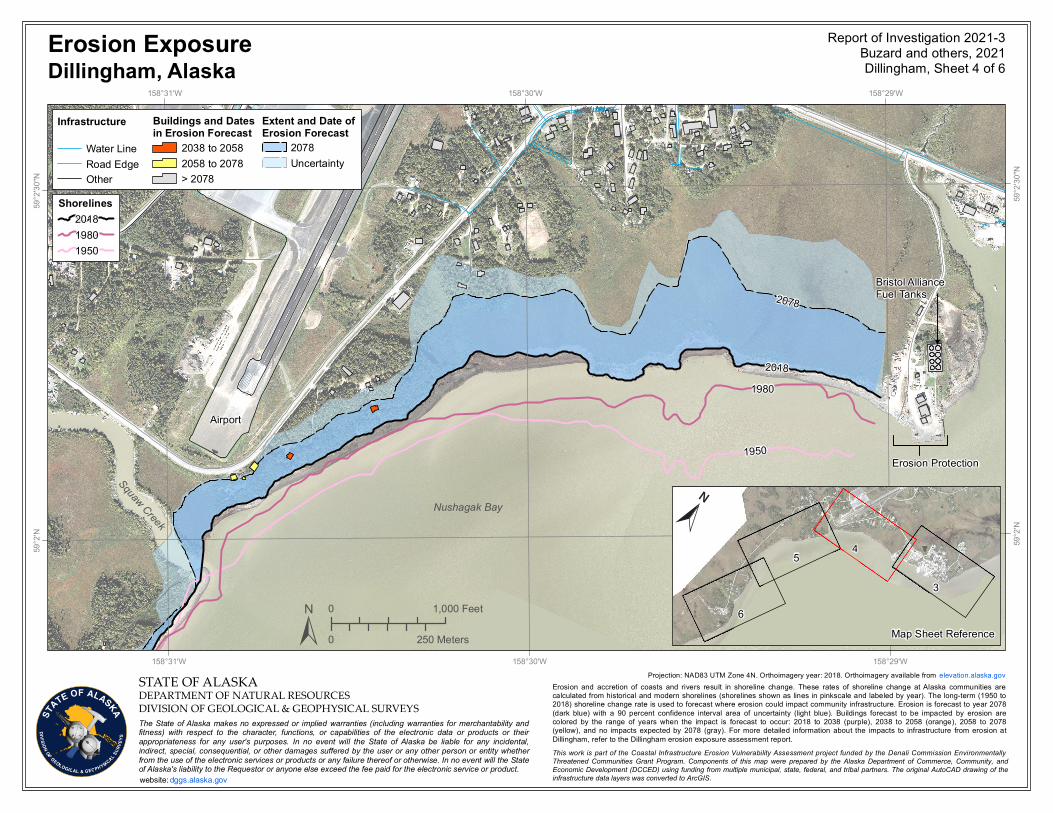
Report of Investigation 2021-3Buzard and others, 2021Dillingham, Sheet 4 of 6
158°29'W
158°29'W
158°30'W
158°30'W
158°31'W
158°31'W
59°2
'30"
N
59°2
'30"
N
59°2
'N
59°2
'N
Dillingham, AlaskaErosion Exposure
±
dggs.alaska.govwebsite:
The State of Alaska makes no expressed or implied warranties (including warranties for merchantability andfitness) with respect to the character, functions, or capabilities of the electronic data or products or theirappropriateness for any user's purposes. In no event will the State of Alaska be liable for any incidental,indirect, special, consequential, or other damages suffered by the user or any other person or entity whetherfrom the use of the electronic services or products or any failure thereof or otherwise. In no event will the Stateof Alaska's liability to the Requestor or anyone else exceed the fee paid for the electronic service or product.
DEPARTMENT OF NATURAL RESOURCESDIVISION OF GEOLOGICAL & GEOPHYSICAL SURVEYS
STATE OF ALASKA
This work is part of the Coastal Infrastructure Erosion Vulnerability Assessment project funded by the Denali Commission EnvironmentallyThreatened Communities Grant Program. Components of this map were prepared by the Alaska Department of Commerce, Community, andEconomic Development (DCCED) using funding from multiple municipal, state, federal and tribal partners. The original AutoCAD drawing of theinfrastructure data layers converted to ArcGIS.
elevation.alaska.gov
Nushagak Bay
Airport
Projection: NAD83 UTM Zone 4N. Orthoimagery year: 2018. Orthoimagery available from
Bristol AllianceFuel Tanks
1950
1980
2018
Shorelines201819801950
Erosion and accretion of coasts and rivers result in shoreline change. These rates of shoreline change at Alaska communities arecalculated from historical and modern shorelines (shorelines shown as lines in pinkscale and labeled by year). The long-term (1950 to2018) shoreline change rate is used to forecast where erosion could impact community infrastructure. Erosion is forecast to year 2078(dark blue) with a 90 percent confidence interval area of uncertainty (light blue). Buildings forecast to be impacted by erosion arecolored by the range of years when the impact is forecast to occur: 2018 to 2038 (purple), 2038 to 2058 (orange), 2058 to 2078(yellow), and no impacts expected by 2078 (gray). For more detailed information about the impacts to infrastructure from erosion atDillingham, refer to the Dillingham erosion exposure assessment report.
Erosion Protection
Map Sheet Reference
3
45
6
2078
Squaw Creek
Buildings and Datesin Erosion Forecast
Road EdgeWater Line
Other
2038 to 20582058 to 2078
Infrastructure Extent and Date ofErosion Forecast
> 2078Uncertainty2078
0 250 Meters
0 1,000 Feet
N

Report of Investigation 2021-3Buzard and others, 2021Dillingham, Sheet 5 of 6
158°33'W
158°31'30"W
59°2
'N
59°1
'N15
8°33
'W
158°
31'3
0"W
59°2'N
59°1'N
Dillingham, AlaskaErosion Exposure
±
dggs.alaska.govwebsite:
The State of Alaska makes no expressed or implied warranties (including warranties for merchantability andfitness) with respect to the character, functions, or capabilities of the electronic data or products or theirappropriateness for any user's purposes. In no event will the State of Alaska be liable for any incidental,indirect, special, consequential, or other damages suffered by the user or any other person or entity whetherfrom the use of the electronic services or products or any failure thereof or otherwise. In no event will the Stateof Alaska's liability to the Requestor or anyone else exceed the fee paid for the electronic service or product.
DEPARTMENT OF NATURAL RESOURCESDIVISION OF GEOLOGICAL & GEOPHYSICAL SURVEYS
STATE OF ALASKA
This work is part of the Coastal Infrastructure Erosion Vulnerability Assessment project funded by the Denali Commission EnvironmentallyThreatened Communities Grant Program. Components of this map were prepared by the Alaska Department of Commerce, Community, andEconomic Development (DCCED) using funding from multiple municipal, state, federal and tribal partners. The original AutoCAD drawing of theinfrastructure data layers converted to ArcGIS.
elevation.alaska.gov
Nushagak Bay
KanakanakRoad
Projection: NAD83 UTM Zone 4N. Orthoimagery year: 2018. Orthoimagery available from
Shorelines201819801950
Erosion and accretion of coasts and rivers result in shoreline change. These rates of shoreline change at Alaska communities arecalculated from historical and modern shorelines (shorelines shown as lines in pinkscale and labeled by year). The long-term (1950 to2018) shoreline change rate is used to forecast where erosion could impact community infrastructure. Erosion is forecast to year 2078(dark blue) with a 90 percent confidence interval area of uncertainty (light blue). Buildings forecast to be impacted by erosion arecolored by the range of years when the impact is forecast to occur: 2018 to 2038 (purple), 2038 to 2058 (orange), 2058 to 2078(yellow), and no impacts expected by 2078 (gray). For more detailed information about the impacts to infrastructure from erosion atDillingham, refer to the Dillingham erosion exposure assessment report.
Map Sheet Reference
3
45
6
1950
19802018
2078
Church
Squa
w Cr
eek
Buildings and Datesin Erosion Forecast
Road EdgeWater Line
Other
2038 to 20582058 to 2078
Infrastructure Extent and Date ofErosion Forecast
> 2078Uncertainty2078
0 250 Meters
0 1,000 Feet
N

Report of Investigation 2021-3Buzard and others, 2021Dillingham, Sheet 6 of 6
158°33'W
158°32'W 158°31'W
59°1
'N
158°
33'W
158°
32'W
158°
31'W
59°1'N59°N
59°N
Dillingham, AlaskaErosion Exposure
dggs.alaska.govwebsite:
The State of Alaska makes no expressed or implied warranties (including warranties for merchantability andfitness) with respect to the character, functions, or capabilities of the electronic data or products or theirappropriateness for any user's purposes. In no event will the State of Alaska be liable for any incidental,indirect, special, consequential, or other damages suffered by the user or any other person or entity whetherfrom the use of the electronic services or products or any failure thereof or otherwise. In no event will the Stateof Alaska's liability to the Requestor or anyone else exceed the fee paid for the electronic service or product.
DEPARTMENT OF NATURAL RESOURCESDIVISION OF GEOLOGICAL & GEOPHYSICAL SURVEYS
STATE OF ALASKA
This work is part of the Coastal Infrastructure Erosion Vulnerability Assessment project funded by the Denali Commission EnvironmentallyThreatened Communities Grant Program. Components of this map were prepared by the Alaska Department of Commerce, Community, andEconomic Development (DCCED) using funding from multiple municipal, state, federal and tribal partners. The original AutoCAD drawing of theinfrastructure data layers converted to ArcGIS.
elevation.alaska.gov
Nushagak Bay
Projection: NAD83 UTM Zone 4N. Orthoimagery year: 2018. Orthoimagery available from Erosion and accretion of coasts and rivers result in shoreline change. These rates of shoreline change at Alaska communities arecalculated from historical and modern shorelines (shorelines shown as lines in pinkscale and labeled by year). The long-term (1950 to2018) shoreline change rate is used to forecast where erosion could impact community infrastructure. Erosion is forecast to year 2078(dark blue) with a 90 percent confidence interval area of uncertainty (light blue). Buildings forecast to be impacted by erosion arecolored by the range of years when the impact is forecast to occur: 2018 to 2038 (purple), 2038 to 2058 (orange), 2058 to 2078(yellow), and no impacts expected by 2078 (gray). For more detailed information about the impacts to infrastructure from erosion atDillingham, refer to the Dillingham erosion exposure assessment report.
19501980
2018
2078
Buildings and Datesin Erosion Forecast
Road EdgeWater Line
Other2038 to 20582058 to 2078
Infrastructure Extent and Date ofErosion Forecast
> 2078
2018 to 2038Uncertainty2078
Shorelines201819801950
Kanakanak Hospital
KanakanakRoad
Map Sheet Reference
4
3
5
6±
0 250 Meters
0 1,000 Feet
N


![Rick Dillingham Collection - New Mexico Museum of Artnmartmuseum.org/assets/files/Finding Aids/Rick Dillingh… · · 2018-01-11Rick Dillingham [hereinafter RD], ... He was best](https://static.fdocuments.in/doc/165x107/5afe52467f8b9a256b8ce246/rick-dillingham-collection-new-mexico-museum-of-aidsrick-dillingh2018-01-11rick.jpg)