Eros International Plc Reports First Quarter Fiscal Year ...
20
1 Eros International Plc Reports First Quarter Fiscal Year 2020 Results Reports Revenue of $43.5 Million and Adjusted EBITDA (1) of $18.6 Million Eros Now Paying Subscribers Reach 21.1 Million as of June 30, 2019 $60 Million reduction in Gross Debt Douglas, ISLE OF MAN – Oct. 8, 2019: Eros International PLC (NYSE:EROS) (“Eros” or the “Company”), a global Indian entertainment company, today announced unaudited financial results for the first quarter fiscal year 2020. (USD in millions) Q1 FY20 Q4FY19 Q3FY19 Q2 FY19 Q1 FY19 Gross Revenue (1) $43.5 $79.0 $86.7 $72.3 $66.6 Reported Revenue 43.5 69.7 76.7 63.4 60.2 Y/Y % Growth -27.7% -3.1% 17.6% 0.2% -1.0% Q/Q % Growth -37.6% -9.1% 21.0% 5.3% -16.3% Operating Profit 1.0 -4.4 13.2 8.4 10.4 Operating Profit Margin 2.3% -6.3% 17.2% 13.2% 17.3% Adjusted EBITDA (1) 18.6 13.1 35.8 27.5 27.5 Adjusted EBITDA Margin 42.8% 18.8% 46.7% 43.4% 45.7% Global Paid EN Memberships 21.1 18.8 15.9 13.0 10.1 Y/Y Growth 108.9% 138.0% 218.0% 251.4% 248.3% Q/Q Growth 12.2% 18.2% 22.3% 28.7% 27.8% Global EN Registered Users 166 154.7 142 128 113 Paid / Registered Users 12.7% 12.2% 11.2% 10.2% 8.9% Films Released 12 16 25 17 14 Cash $80.8 $135.8 $134.9 $134.9 $86.1 Gross Debt 220.9 280.8 294.0 297.0 272.9 Net Debt 140.1 145.0 159.1 162.1 186.8 (1) A reconciliation of the non-GAAP financial measures discussed within this release to the Company’s IFRS revenue and net income is included at the end of this release. See also “Non-GAAP Financial Measures”. The Company made the following statement: “We are pleased to announce a positive set of results this quarter, with $43.5 million of revenue and $18.6 million in adjusted EBITDA. The hard work and investment we have made in the Eros Now platform continues to pay off. Our Eros Now business offers users worldwide the promise of endless entertainment with one of the largest libraries of Indian movies, as well as premium television programmes, music videos and audio tracks, which are unmatched in quantity and quality. As of June 30, 2019 the platform reached 21.1 million paid monthly subscribers, a 109% increase over the same
Transcript of Eros International Plc Reports First Quarter Fiscal Year ...

1
Eros International Plc Reports First Quarter Fiscal
Year 2020 Results
Reports Revenue of $43.5 Million and Adjusted EBITDA(1) of $18.6 Million
Eros Now Paying Subscribers Reach 21.1 Million as of June 30, 2019
$60 Million reduction in Gross Debt
Douglas, ISLE OF MAN – Oct. 8, 2019: Eros International PLC (NYSE:EROS) (“Eros” or the
“Company”), a global Indian entertainment company, today announced unaudited financial results
for the first quarter fiscal year 2020.
(USD in millions) Q1 FY20 Q4FY19 Q3FY19 Q2 FY19 Q1 FY19
Gross Revenue (1) $43.5 $79.0 $86.7 $72.3 $66.6
Reported Revenue 43.5 69.7 76.7 63.4 60.2
Y/Y % Growth -27.7% -3.1% 17.6% 0.2% -1.0%
Q/Q % Growth -37.6% -9.1% 21.0% 5.3% -16.3%
Operating Profit 1.0 -4.4 13.2 8.4 10.4
Operating Profit Margin 2.3% -6.3% 17.2% 13.2% 17.3%
Adjusted EBITDA (1) 18.6 13.1 35.8 27.5 27.5
Adjusted EBITDA Margin 42.8% 18.8% 46.7% 43.4% 45.7%
Global Paid EN Memberships 21.1 18.8 15.9 13.0 10.1
Y/Y Growth 108.9% 138.0% 218.0% 251.4% 248.3%
Q/Q Growth 12.2% 18.2% 22.3% 28.7% 27.8%
Global EN Registered Users 166 154.7 142 128 113
Paid / Registered Users 12.7% 12.2% 11.2% 10.2% 8.9%
Films Released 12 16 25 17 14
Cash $80.8 $135.8 $134.9 $134.9 $86.1
Gross Debt 220.9 280.8 294.0 297.0 272.9
Net Debt 140.1 145.0 159.1 162.1 186.8
(1) A reconciliation of the non-GAAP financial measures discussed within this release to the Company’s IFRS revenue and net
income is included at the end of this release. See also “Non-GAAP Financial Measures”.
The Company made the following statement:
“We are pleased to announce a positive set of results this quarter, with $43.5 million of revenue and
$18.6 million in adjusted EBITDA. The hard work and investment we have made in the Eros Now
platform continues to pay off. Our Eros Now business offers users worldwide the promise of endless
entertainment with one of the largest libraries of Indian movies, as well as premium television
programmes, music videos and audio tracks, which are unmatched in quantity and quality. As of June
30, 2019 the platform reached 21.1 million paid monthly subscribers, a 109% increase over the same

2
period last year. We are planning to achieve at least 50 million paid monthly subscribers within the
next three years. We anticipate our registered user base to reach at least 200 million by the end of the
2020 Fiscal Year. We have a very strong slate of films and compelling original digital series scheduled
for release over the coming quarters, which we expect to help drive growth in our Eros Now business.
Our strategy going forwards will pivot towards focusing on the direct to consumer user base of our
Eros Now business – through increased marketing, technology advancements, innovative windowing
and most importantly through best-in-class, compelling Digital content. The recent Microsoft
announcement is a key part of this strategy – we will be working with one of the world’s largest and
most cutting-edge technology companies to develop a digital platform that will deliver an unparalleled
user experience. In parallel with the B2C focus, we will be scaling back on non-digital windowing in
many overseas markets in order to help drive consumers to our Eros Now platform. Our goal has
always been for Eros Now to be the ultimate destination for consumers looking for high-quality Indian
entertainment anywhere in the world – this will help us get there.
We are on the cusp of completing our transformation from the Film Studio model into a Digital-led
OTT business with traditional Studio offerings and capabilities. While this will have an impact on
near-term revenues, principally to our syndication business in the overseas markets, this will increase
the premium nature of our content and ultimately increase ARPUs and loyalty of our customers. For
the full fiscal year 2020, we are forecasting consolidated revenue in the range of $200 million-220
million, Adjusted EBITDA of $80 million – 95 million and net debt in the range of $100 million – 110
million.
We have also made some management changes which we believe demonstrate the depths of our
management talent pool and also put us in a stronger position to execute on our long-term plan.
Firstly, Kumar Ahuja will become the Chief Operating Officer of our Indian subsidiary, Eros
International Media Limited, effective immediately, and will report directly to the Chairman and
Chief Executive Officer. Mr. Ahuja has been with Eros for over 20 years and has most recently been
head of Business Development for New Initiativies. Mr. Ahuja has been instrumental in negotiating
and securing our China distribution partnerships and this will remain a key focus area for him.
Rishika Lulla Singh will become Chairman of Eros Digital while continuing to oversee all digital
activities of the group with a focus on long-term strategy and deepening our relationships with
technology and content partners around the world. Ali Hussein will become CEO of Eros Now. Mr.
Hussein has been with Eros since 2017 and has been driving technology and distribution growth
worldwide. His previous experiences with media and tech companies adjacent to our business,
including Google, Viacom 18 and Discovery board advisory as well as growing multiple startups in
the ecosystem will help him lead the Eros Now business. These management changes underscore the
strength of our broader management team, which has deep experience in digital media, advertising,
finance and accounting.
As announced on June 19, 2019, Eros is currently assessing strategic alternatives for the Company
with a view to maximizing shareholder value and have engaged Citigroup to assist with that review.
The process is ongoing and the Company will update the market accordingly, as and when there are
any material developments.
Eros’ balance sheet remains conservative and the Company is well-capitalized, with net debt of $140.1
million and $80.8 million of cash and cash equivalents. The Company has no meaningful near-term
debt maturities payable in cash over the next twelve months. We recently completed a $25 million
equity-linked financing which gives us increased balance sheet flexibility and incremental capital to

3
go after the digital opportunity in India and continue to create and acquire more compelling digital
content.”
Results Overview
Eros Now reached 21.1 million paid subscribers as of June 30, 2019, which represents growth of
108.9% year-over-year, and registered users grew to approximately 166 million, a 46.9% increase
versus the prior year period. Eros Now’s registered user base of approximately 166 million grew by
11.34 million users in the last quarter alone.
Eros Now is currently prioritizing developments on its the technology stack, with several innovations
and global “firsts” to be launched later this year. The business is tailoring its technology to serve both
English speaking audiences around the world and regional Indian languages to appeal to both the
diaspora and growing regional populations in India. Eros Now announced a number of alliances and
distribution partnerships recently, most notably with Apple +, Paytm, Vodafone Qatar, Veriown, Tata
Sky Binge and WASU Media in China. This quarter Eros Now increased its focus on digital marketing,
in India and globally, which helped grow our user base and engagement – the platform saw a fourfold
increase in app installations in May as compared to June 2019.
Eros Now user metrics continue to show a positive trend in engagement, stickiness and loyalty among
consumers. A few key highlights:
• Over 18% of our paid subscribers are accessing Eros Now through TV or Smart TV
applications, in the US this figure is over 24%
• As per the Counter Point Research Report Released in June 2019
o Eros Now is the most popular OTT Brand in the M/F Segment of 25-24
o 68% of Eros Now users Indicate they watch content daily compared to 58% as the
average for other incumbent services
o Eros Now is the most popular VOD service across rural Tier 2,3 cities in India with
over 50% market share
Content & Programming
Our major Eros Now original series this quarter was a biopic on Narendra Modi, the Indian Prime
Minister – Modi – The Journey of a Common Man – which was released in 4 regional languages
(Gujarati, Tamil, Telugu, Kannada) to cater to regional audiences. The series was also released in
Hindi. The series garnered strong viewership in Gujarat, Tamil Nadu, Andhra Pradesh among others.
Ahmedabad, a rural city in India, had the largest viewership of any city in India for the Modi series.
In June we released an Eros Now Quickie ‘My name is Sheela,’ a story of a domestic worker who
overcomes many hurdles in life to become a social media star. It is a slice of life story that is full of
irreverent dialogues and funny performances by Sheela as a standup comedian. In June we also
celebrated Short Films with the launch of three Eros Now Original Short Films: ‘A Monsoon Date’ –
about an eventful, rainy evening when a young woman is on her way to see a young man she is dating;
‘That Man in the picture’ - guilt weighs heavy on a man after he witnesses a murder of a young girl;
and ‘Maunn’ – about rift between two families when a shocking revelation compels a couple to face a
truth but are unable to confront the perpetrator. All the short films have been very well received among
the respective audiences and have registered some of the highest engagement we’ve received to date.
Our short films have also received accolades and awards at leading film festivals. Maunn was the
Winner of the Asia Pacific Film Festival in Los Angeles, and was nominated at the Vancouver
International Film Festival amongst others. ‘The Monsoon Date’ was also the Official Selection at the

4
20th MAMI Mumbai Film Festival. This quarter we continued our strategy of weekly movie premieres
and launching new short form assets on the platform, and delivered a very strong and diverse portfolio
of content and programming across the platform.
Marketing and Promotion
The beginning of this quarter saw the launch of a 360 degree campaign for Modi across 24 markets in
India. It was one of our largest and most extensive marketing campaigns for an Original Series on Eros
Now. It was also the first time in the last year that we targeted a mainstram advertising campaign
beyond the larger Indian cities and went into “mini-Metros” such as Chandigarh, Ahmedabad and
others. Our marketing efforts were successful, with the Modi campaign ultimately generating over 100
million impressions across TV, print, online and all other platforms in India and globally. Eros Now
expanded its financial sector marketing and promotion partnerships with launch of partners such as
Axis Bank, American Express, Paytm and others. In particular, Paytm First was big win for Eros Now,
which is one of only two Video OTT brands to partner with of Paytm.
Release Slate
As we progress through Fiscal Year 2020, we have a strong film slate, which includes ‘Kaptan’
starring Saif Ali Khan, the trilingual remake of ‘Haathi mere Saathi’ and ‘Kaamiyab’as well as a
host of regional releases. In addition, Eros has a series of originals coming up on Eros Now that it
expects to release in the coming quarters, including:
• Flesh by Siddharth Anand (target release Q2 FY20)
• Brahmm by Gaurav Sharma (target release Q2 FY20)
• Halahal, a digital film, by Zeishan Qadri (target release Q3 FY20)
• Avatar: The Legend of Vishnu by Anirudh Pathak and Sree Narayan Singh (target release
Q4 FY20)
• Metro Park 2 by Abi Varghese and Ajayan Venugopalan (target release Q4 FY20)
• Crisis by Gaurav Chawla and Nikhil Advani (target release Q4 FY20)
• Ponnyein Selvin (target release FY Y21)
• Smoke 2 by Neel Guha (target release FY Y21)
• Bhumi by Pavan Kripalani (target release FY Y21)
Eros International Plc Financial Highlights:
Three Months Ended
June 30
(dollars in millions) 2019 2018 % change
Revenue $ 43.5 $ 60.2 (27.7)%
Gross profit 27.0 23.6 14.4%
Operating profit 1.0 10.4 (90.4)%
Adjusted EBITDA(1) $ 18.6 $ 27.5 (32.4) %
(1) A reconciliation of the non-GAAP financial measures discussed within this release to the
Company’s IFRS revenue and net income is included at the end of this release. See also “Non-
GAAP Financial Measures”.

5
Financial Results for the Three Months Ended June 30, 2019
Revenue
In the three months ended June 30, 2019, the Eros film slate comprised of 12 low budget films, as
compared to 14 films in the three months ended June 30, 2018, of which one was medium budget and
13 were low budget films. In addition, Eros Now released five original series titled Modi: Journey of
a Common Man, My name is Sheela, A Monsoon Date, That Man In The Picture and Maunn during
the three months ended June 30, 2019.
In the three months ended June 30, 2019, the Company’s slate of 12 films comprised of one Hindi film
and 11 regional films as compared to the same period last year where its slate of 14 films comprised
three Hindi films, two Tamil films and nine regional language films.
Three months ended High Medium Low Total
June 30, 2019 - - 12 12
June 30, 2018 - 1 13 14
For the three months ended June 30, 2019, reported revenue was $43.5 million compared to $60.2
million for the three months ended June 30, 2018. After making adjustment towards significant
financing component under IFRS 15 as per details hereunder, gross revenue for the three months ended
June 30, 2019 is $43.5 million compared to $66.6 million for the three months ended June 30, 2018.
There was no adjustment towards significant financing component under IFRS 15 in the three months
ended June 30, 2019 because there was no revenue accounted with credit period more than 365 days.
Three months ended June 30,
2019 2018
(dollars in millions)
Revenue (GAAP) $ 43.5 $ 60.2
Adjustment towards significant financing component under IFRS
15 - 6.4
Gross Revenue (Non-GAAP) $ 43.5 $ 66.6
For the three months ended June 30, 2019, aggregate revenues from decreased by 27.7% to $43.5
million from $60.2 million for the three months ended June 30, 2018 mainly due to lower syndication
revenue for the three months ended June 30, 2019, partially offset by increase in revenues largely from
the ErosNow business for the three months ended June 30, 2018
Cost of sales
For the three months ended June 30, 2019, cost of sales decreased by 54.9% to $16.5 million compared
to $36.6 million in the three months ended June 30, 2018. The decrease was mainly due to lower
amortization costs.
Administrative cost

6
For the three months ended June 30, 2019, administrative cost increased by 97% to $26.0 million
compared to $13.2 million in the three months ended June 30, 2018. The increase was mainly due to
increase in expected credit loss accounted as per default method under IFRS 9.
Gross profit
For the three months ended June 30, 2019, gross profit increased by 14.4% to $27.0 million, compared
to $23.6 million in the three months ended June 30, 2018. The increase was mainly due to a decrease
in amortization, marketing, advertising and distribution costs, which was partially offset by an increase
in administrative cost.
Adjusted EBITDA (Non- GAAP)
For the three months ended June 30, 2019, Adjusted EBITDA was $18.6 million compared to $27.5
million in the three months ended June 30, 2018. The Adjusted EBITDA margin based on Gross
Revenue was 42.8% in the three months ended June 30, 2019 compared to 41.3% in the three months
ended June 30, 2018. The improvement in margins was largely due to an decrease in amortization
charge over the same period.
Net finance costs
For the three months ended June 30, 2019, net finance costs decreased by 8.7% to $2.1 million,
compared to $2.3 million in the three months ended June 30, 2018 mainly due to an increase in finance
cost which was partially offsetted by interest income on account of unwinding of credit impairment
loss.
Income tax expense
For the three months ended June 30, 2019, income tax expenses decreased by 37.9% to $1.8 million,
compared to $2.9 million in the three months ended June 30, 2018. Effective income tax rates were
32.8% and 15.0% for June 30, 2019 and June 30, 2018, respectively excluding non-deductible share-
based payment charges, impairment loss and gain/loss on fair valuation of derivative liabilities. The
change in effective rate principally reflects a change in the mix of the profits earned from taxable and
non- taxable jurisdictions.
Trade receivables
As of June 30, 2019, Trade Receivables increased to $200.3 million from $196.4 million as of March
31, 2019. The increase in receivables is on account of unwinding of expected credit loss (included in
finance income) as per IFRS 15 amounting to $2.9 million in the three months ended June 30, 2019.
Net debt
As of June 30, 2019, net debt decreased by 3.4% to $140.1 million from $145.0 million as of March
31, 2019 primarily on account of repayment of loans.
Conference Call
The Company will host a conference call on Tuesday October 8th, 2019, at 8:30 AM Eastern Standard
Time.

7
To access the call please dial (888) 753-4238 from the United States, or +1 (706) 643-3355
from outside the U.S. The conference call I.D. number is 2697233. Participants should dial in 5 to 10
minutes before the scheduled time.
A replay of the call can be accessed through October 22, 2019 by dialling (800) 585-8367
from the U.S., or +1 (404) 537-3406 from outside the U.S. The conference call I.D. number is
2697233. The call will be available as a live webcast, which can be accessed at Eros’ Investor
Relations website.
About Eros International Plc
Eros International Plc (NYSE: EROS) is a leading global company in the Indian film entertainment
industry that acquires, co-produces and distributes Indian films across all available formats such as
cinema, television and digital new media. Eros International Plc was the first Indian media company
to list on the New York Stock Exchange. Eros International has experience of over three decades in
establishing a global platform for Indian cinema. The Company has an extensive and growing movie
library comprising of over 3,000 films, which include Hindi, Tamil, and other regional language films.
The Company also owns the rapidly growing OTT platform Eros Now which has rights to over 12,000
films across Hindi and regional languages. For further information, please visit: www.erosplc.com.
This release contains “forward-looking statements.” These statements include, among other things,
the discussions of our business strategy and expectations concerning our market position, future
operations, margins, profitability, liquidity and capital resources, tax assessment orders and future
capital expenditures. All of our forward-looking statements are subject to risks and uncertainties that
may cause actual results to differ materially from those that we are expecting, including, without
limitation, the factors discussed in our most recent Form 20-F filed with the U.S. Securities and
Exchange Commission on August 14th, 2019 (the “20-F”), including under the sections captioned
“Risk Factors.” The forward-looking statements contained in this presentation are based on historical
performance and management’s current plans, estimates and expectations in light of information
currently available to us and are subject to uncertainty and changes in circumstances. There can be
no assurance that future developments affecting us will be those that we have anticipated. Actual
results may differ materially from these expectations due to changes in global, regional or local
political, economic, business, competitive, market, regulatory and other factors, many of which are
beyond our control, as well as the other factors described in the 20-F under the sections captioned
“Risk Factors.”
Contact:
Mark Carbeck Erica Bartsch
Chief Corporate and Strategy Officer Sloane & Company
Eros International PLC 212-446-1875
[email protected] [email protected]
+44 207 258 9909
###

8
EROS INTERNATIONAL PLC
UNAUDITED CONDENSED CONSOLIDATED STATEMENTS OF FINANCIAL POSITION
(Amounts in thousands, except share and per share data) As at Note June 30, 2019 March 31, 2019 (in thousands) ASSETS
Non-current assets
Property and equipment $ 10,439 $ 10,921
Right of use assets 1,868 —
Intangible assets — content 5 720,821 706,572
Intangible assets — others 3,612 3,794
Investments 2,650 2,650
Trade and other receivables — amortised cost 1 9,090 10,065
Income tax receivable 1,234 1,284
Restricted deposits 766 756
Deferred income tax assets 1,263 1,263
Total non-current assets $ 751,743 $ 737,305
Current assets
Inventories $ — $ 435
Trade and other receivables — fair value 1 129,929 125,229
Trade and other receivables — amortised cost 1 78,721 79,916
Investments 233 1,042
Cash and cash equivalents 80,789 89,117
Restricted deposits 9,201 55,858
Total current assets 298,873 351,597
Total assets $ 1,050,616 $ 1,088,902
LIABILITIES
Current liabilities
Trade and other payables $ 84,085 $ 83,487
Acceptances 3 3,046 8,366
Short-term borrowings — fair value 2 53,401 68,349
Short-term borrowings — amortised cost 2 98,852 140,559
Derivative financial instruments — 620
Lease Liabilities 837 —
Current income tax payable 22,463 17,291
Total current liabilities $ 262,684 $ 318,672
Non-current liabilities
Long-term borrowings — amortised cost 2 68,600 71,920
Lease Liabilities 1,008 —
Other long - term liabilities 15,969 13,898
Deferred income tax liabilities 23,433 27,427
Total non-current liabilities $ 109,010 $ 113,245
Total liabilities $ 371,694 $ 431,917
EQUITY
Share capital 4 $ 40,924 $ 39,326
Share premium 591,250 580,013
Reserves 6,763 (2,202)
Other components of equity (79,017) (79,696 )
JSOP reserve (15,985 ) (15,985 )
Equity attributable to equity holders of Eros International Plc $ 543,935 $ 521,456
Non-controlling interest 134,987 135,529
Total equity $ 678,922 $ 656,985
Total liabilities and shareholder’s equity $ 1,050,616 $ 1,088,902
9
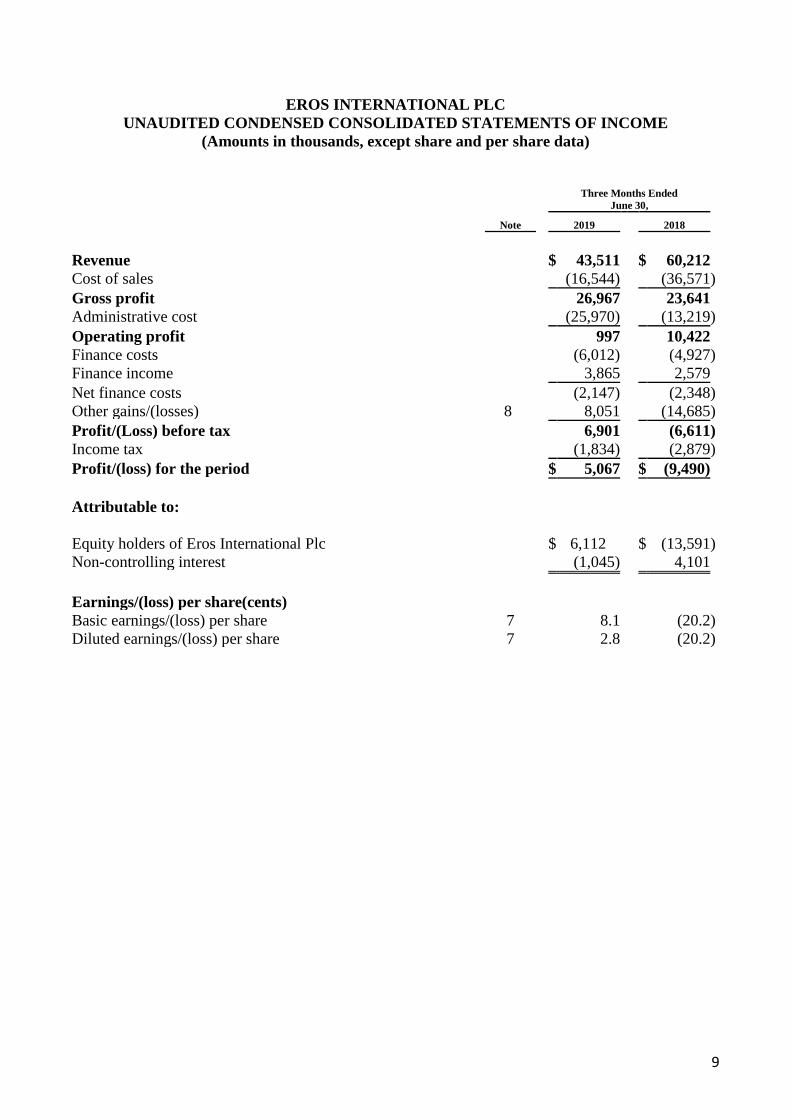
EROS INTERNATIONAL PLC
UNAUDITED CONDENSED CONSOLIDATED STATEMENTS OF INCOME
(Amounts in thousands, except share and per share data)
Three Months Ended
June 30,
Note 2019 2018
Revenue $ 43,511 $ 60,212
Cost of sales (16,544) (36,571 )
Gross profit 26,967 23,641
Administrative cost (25,970) (13,219 )
Operating profit 997 10,422
Finance costs (6,012) (4,927 )
Finance income 3,865 2,579
Net finance costs (2,147) (2,348 )
Other gains/(losses) 8 8,051 (14,685 )
Profit/(Loss) before tax 6,901 (6,611 )
Income tax (1,834) (2,879 )
Profit/(loss) for the period $ 5,067 $ (9,490)
Attributable to:
Equity holders of Eros International Plc $
6,112 $ (13,591 )
Non-controlling interest (1,045) 4,101
Earnings/(loss) per share(cents)
Basic earnings/(loss) per share 7 8.1 (20.2 )
Diluted earnings/(loss) per share 7 2.8 (20.2 )

10
EROS INTERNATIONAL PLC
UNAUDITED CONDENSED CONSOLIDATED STATEMENTS OF COMPREHENSIVE
INCOME/(LOSS)
(Amounts in thousands, except share and per share data)
Three Months Ended
June 30,
2019 2018
Profit/(loss) for the period $ 5,067 $ (9,490 )
Other comprehensive Income:
Items that will be subsequently reclassified to profit or loss
Exchange differences on translating foreign operations 1,135 (11,147 )
Total other comprehensive income/(loss) for the period $ 1,135 $ (11,147 )
Total comprehensive income/(loss) for the period, net of tax $ 6,202 $ (20,637 )
Attributable to:
Equity holders of Eros International Plc $ 6,791 $ (20,241 )
Non-controlling interest (589 ) (396 )
The accompanying notes are an integral part of these unaudited condensed consolidated financial
statements.
11
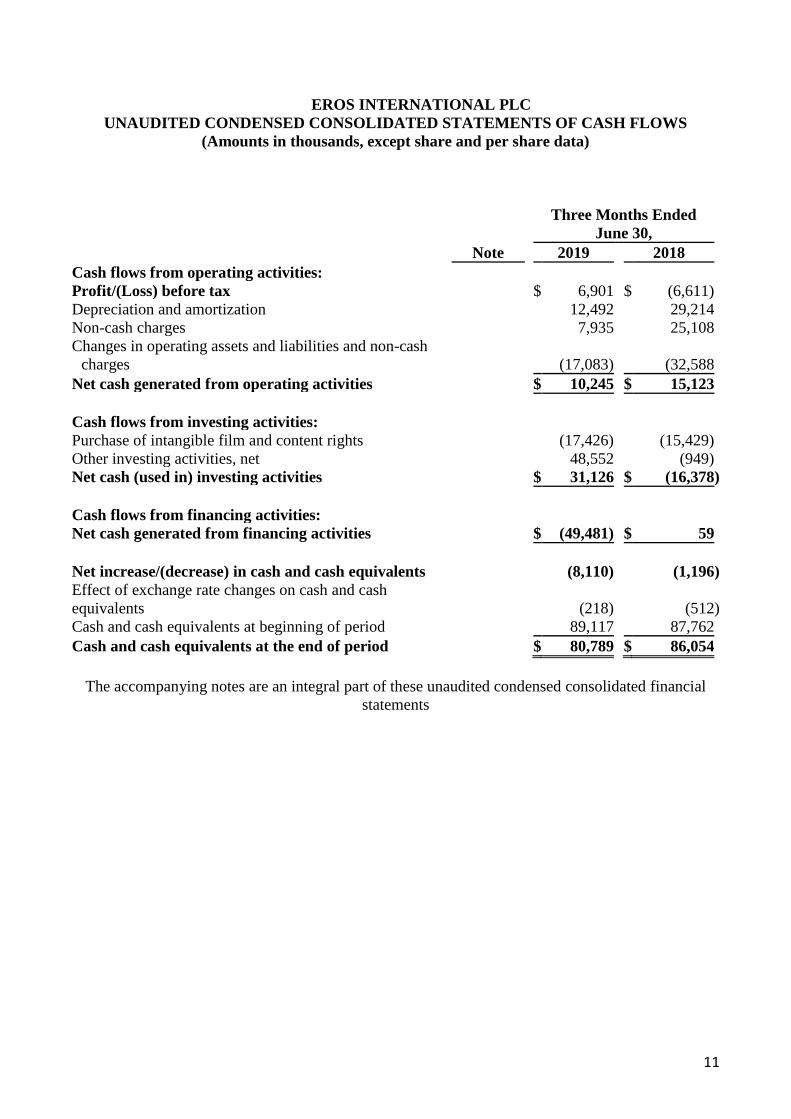
EROS INTERNATIONAL PLC
UNAUDITED CONDENSED CONSOLIDATED STATEMENTS OF CASH FLOWS
(Amounts in thousands, except share and per share data)
Three Months Ended
June 30,
Note 2019 2018
Cash flows from operating activities:
Profit/(Loss) before tax $ 6,901 $ (6,611) Depreciation and amortization 12,492 29,214
Non-cash charges 7,935 25,108
Changes in operating assets and liabilities and non-cash
charges
(17,083) (32,588
Net cash generated from operating activities $ 10,245 $ 15,123
Cash flows from investing activities:
Purchase of intangible film and content rights (17,426) (15,429)
Other investing activities, net 48,552 (949)
Net cash (used in) investing activities $ 31,126 $ (16,378 )
Cash flows from financing activities:
Net cash generated from financing activities $ (49,481) $ 59
Net increase/(decrease) in cash and cash equivalents (8,110) (1,196 )
Effect of exchange rate changes on cash and cash
equivalents (218) (512 )
Cash and cash equivalents at beginning of period 89,117 87,762
Cash and cash equivalents at the end of period $ 80,789 $ 86,054
The accompanying notes are an integral part of these unaudited condensed consolidated financial
statements

12
EROS INTERNATIONAL PLC
NOTES TO UNAUDITED CONDENSED CONSOLIDATED INTERIM FINANCIAL
STATEMENTS
(Amounts in thousands, except share and per share data)
1. TRADE AND OTHER RECEIVABLES
As at
June 30,
2019
March 31,
2019
Trade accounts receivables (net of credit impairment loss)
Trade accounts receivables at fair value $ 129,929 125,229
Trade accounts receivables at amortised cost 70,399 71,129 Total Trade accounts receivables $ 200,328 $ 196,358
Other receivables at amortised cost 17,412 18,852
Total Trade and other receivables 217,740 215,210
Current 208,650 205,145
Non-current 9,090 10,065
$ 217,740 $ 215,210
The age of account receivables net of credit of credit impairment loss are past due but not impaired
were as follows:
As at
June 30,
2019
March 31,
2019
Not more than three months $ 46,633 $ 44,687
More than three months but not more than six months 35,467 15,948
More than six months but not more than one year 22,636 15,310
More than one year 7,126 8,796
$ 111,862 $ 84,741
The movement in the allowances for expected credit losses is as follows:
Year ended June30, 2019
Trade
Receivables Other
Receivables Total
Receivables
Balance as on April 1, 2019 $ 41,335 $ 447 $ 41,782
Charged to operations 13,005 — 13,005
Unwinding of expected credit loss (included in finance income) (2,885 ) — (2,885 )
Reversal of expected credit loss (included in other gains/(losses)) (1,287 ) — (1,287 )
Translation adjustment (124) — (124) Bad debts (2,201) — (2,201)
Balance as at June 30, 2019 $ 47,843 $ 447 $ 48,290
Year ended March 31, 2019

13
Trade
Receivables Other
Receivables Total
Receivables
Balance on April 1, 2018 $ 10,193 $ — $ 10,193
Impact of adoption of IFRS 9 18,050 447 18,497
Balance as on April 1, 2018 28,243 447 28,690
Charged to operations 60,208 7,284 67,492
Unwinding of expected credit loss (included in finance
income) (13,227 ) — (13,227 )
Reversal of expected credit loss (included in other
gains/(losses)) (20,698 ) — (20,698 )
Translation adjustment (160 ) — (160 )
Bad debts (13,031 ) (7,284 ) (20,315 )
Balance at the March 31 2019 $ 41,335 $ 447 $ 41,782
2 BORROWINGS
An analysis of long-term borrowings is shown in the table below.
Nominal As at
Interest Rate Maturity June 30, 2019 March 31, 2019
(in thousands)
Asset backed borrowings
Vehicle loan 2.5 - 9.5% 2017-22 $ 243 $ 382
Term loan
MCLR +3.2% -
4.50% 2019-22 12,199 12,947
Term loan BR + 2.75% 2020-21 943 1,083
Term loan
10.39% -
13.75% 2020-23 — 251
$ 13,385 $ 14,663
Unsecured borrowings
Retail bond 6.50% 2021-22 63,500 65,215
Convertible notes 14.23% 2020-21 53,401 68,349
$ 116,901 $ 133,564
Cumulative effect of unamortised costs (606) (691 )
Instalments due within one year:
Convertible notes (53,401) (68,349 )
Others (7,679) (7,267 )
$ 68,600 $ 71,920
Long-term borrowings at fair value $ — $ —
Long-term borrowings at amortised cost $ 68,600 $ 71,920
Analysis of short-term borrowings
Nominal As at
interest rate (%) June 30 2019 March 31, 2019
(in thousands)
Asset backed borrowings
Export credit, bill discounting and overdraft
MCLR +.40% to
4.60% $ 42,096 $ 32,078

14
Export credit, bill discounting and overdraft
Base Rate + 0.5% to
1% 27,189 3,533
Export credit, bill discounting and overdraft 6.01% - 15.25% 3,586 26,719
Short term loan 3.25% - 15.75% 18,301 70,962
$ 91,172 $ 133,292
Unsecured borrowings
Instalments due within one year on long-term
borrowing 61,081 75,616
$ 152,253 $ 208,908
Short-term borrowings at fair value 53,401 68,349
Short-term borrowings at amortised cost $ 98,852 $ 140,559
Bank prime lending rate and marginal cost lending rate (“BPLR” & “MCLR”) is the Indian equivalent
to LIBOR. Asset backed borrowings are secured by fixed and floating charges over certain Group
assets.
Reconciliation of fair value measurement of Convertible Notes
June 30,2019
Particulars (in thousands)
As at March 31,2019 $ 68,349
Interest 2,094
‘A’ ordinary shares issued in lieu of convertible notes (12,057)
Gain on fair value of convertible notes (4,985)
As at June 30,2019 $ 53,401
3. ACCEPTANCES
June, 30 March, 31
2019 2019
(in thousands)
Payable under the film financing arrangements $ 3,046 $ 8,366
$ 3,046 $ 8,366
Acceptances comprise of short – term credit availed from financial institutions for payment to film
producers for film co-production arrangement entered by the group. The carrying value of acceptances
are considered a reasonable approximation of fair value
4.
ISSUED SHARE CAPITAL
Number of
Shares GBP
Authorized (in thousands)
Ordinary shares of 30p each at March 31, 2019 150,000,000 45,000
Ordinary shares of 30p each at June 30, 2019 (*) 150,000,000 45,000

15
(*) The Company increased authorized number of shares to 200,000,000 on September 25, 2019.
Number of Shares USD
Allotted, called up and fully paid
A Ordinary
30p Shares(*)
B Ordinary
30p Shares(*) (in thousands)
As at March 31, 2018 55,718,423 9,712,715 $ 35,334
Issue of shares in the quarter ended June 30, 2018 2,747,645 — 1,138
Issue of shares in the quarter ended September 30, 2018 3,773,385 — 1,471
Issue of shares in the quarter ended December 31, 2018 1,659,767 — 641
Transfer of B Ordinary to A Ordinary share 1,500,000 (1,500,000 ) —
Issue of shares in the quarter ended March 31, 2019 1,892,518 — 742
As at March 31, 2019 67,291,738 8,212,715 $ 39,326
Issue of shares in the quarter ended June 30, 2019 4,192,459 — 1,598
71,484,197 8,212,715 40,924
(*) Each A ordinary shares is entitled to one vote on all matters and each B shares is entitled to ten
votes.
The Company issued A Ordinary shares as follows:
Number of Shares
As at
June 30,2019 March 31, 2019
Issuance to Founders Group(1) — 1,769,911
Issuance towards settlement of Convertible notes(2) 3,975,792 4,411,359
Exercise against Restricted Share Unit/ Management scheme (3) 216,667 770,541
Issuance towards Reliance Industries Limited (4) — 3,111,088
2015 Share Plan (5) — 10,416
Total 4,192,459 10,073,315
(1) Average exercise price of NIL (March 2019: $14.69) (2) Average exercise price of $3.03 (March 2019: $11.28) (3) 216,667 shares exercised at $NIL (March 2019: 183,000) exercised price at $NIL (March 2019:
$0.39) (4) Average exercise price of $NIL (March 2019: $15) (5) Average exercise price of $NIL (March 2019: $7.92)
5. INTANGIBLE ASSETS – CONTENT
Gross
Content
Assets
Accumulated
Amortization
Impairment
Loss
Content
Assets
As at June 30, 2019
Film and content rights $ 1,689,687 $ (969,037 ) $ (366,703 ) $ 353,947
Content advances 391,317 — (38,832) 352,485
Film productions 14,389 — — 14,389
Non-current content assets $ 2,095,393 $ (969,037 ) $ (405,535 ) $ 720,821
As at March 31, 2019
Film and content rights $ 1,675,406 $ (954,628 ) $ (366,703 ) $ 354,075

16
Content advances 378,268 — (38,832 ) 339,436
Film productions 13,061 — — 13,061
Non-current content assets $ 2,066,735 $ (954,628 ) $ (405,535 ) $ 706,572
6. SHARE BASED COMPENSATION PLANS
The compensation cost recognized with respect to all outstanding plans and by grant of shares, which
are all equity settled instruments, is as follows:
Three months ended June 30,
(in thousands)
2019 2018
IPO India Plan $ 123 $ 428
2014 Share Plan — 47
2015 Share Plan 95 7
Other share option awards(**) 665 1,461
Management scheme (staff share grant) 2,783 2,487
$ 3,666 $ 4,430
(**) includes Restricted Share Unit (RSU) and Other share option plans

17
EROS INTERNATIONAL PLC
NOTES TO UNAUDITED CONDENSED CONSOLIDATED INTERIM FINANCIAL
STATEMENTS
(Amounts in thousands, except share and per share data)
7. EARNINGS PER SHARE (EPS)
Three months ended June 30,
(in thousands, except number of shares and earnings per share)
2019 2018
Basic Diluted Basic Diluted
Earnings/(loss) attributable to the equity
holders of the parent 6,112 6,112 (13,591) (13,591)
Potential dilutive effect related to Senior
convertible notes $ — (2,891) $ — —
Potential dilutive effect related to share
based compensation scheme in subsidiary
undertaking — 7 — (115)
Adjusted earnings attributable to equity
holders of the parent $ 6,112 3,228 $ (13,591) (13,706)
Weighted average number of shares 75,693,502 75,693,502 67,362,810 67,362,810
Potential dilutive effect of Senior
convertible notes — 39,469,344 — —
Potential dilutive effect related to share
based compensation scheme — 1,801,456 — 75,383
Adjusted weighted average number
of shares 75,693,502 116,964,302 67,362,810 67,438,193
Earnings/(loss) per share
Earnings/(loss) attributable to the equity
holders of the parent per share (cents) 8.1 2.8 (20.2) (20.2)
The above table does not split the earnings per share separately for the ‘A’ ordinary 30p shares and
the ‘B’ ordinary 30p shares as there is no variation in their entitlement to participate in undistributed
earnings.

18
EROS INTERNATIONAL PLC
NOTES TO UNAUDITED CONDENSED CONSOLIDATED INTERIM FINANCIAL
STATEMENTS
(Amounts in thousands, except share and per share data)
8. OTHER GAINS/(LOSSES)
Three months ended June 30,
(in thousands)
2019 2018
Foreign exchange gain/(loss), net $ 1,796 $ 3,361 Gain/(loss) on sale of property and equipment (4) —
(Loss) on de-recognition of financial assets measured at
amortized cost net (*) (270) (1,304) Loss of available- for – sale measured at fair value
through profit and loss (809) —
Gains/(Loss) on financial liability (convertible notes)
measured at fair value through profit and loss account 4,985 (21,323) Reversal of expected credit loss 1,287 4,581
Fair value of receivables 306 —
Credit from Government of India 760 —
$ 8,051 $ (14,685)
(*) Arising on assignment and novation of trade receivables and trade payables with no-recourse.
Derecognition of aforesaid financial assets/liabilities measured at amortized cost is to mitigate both
credit risk and liquidity risk
9. IFRS – 16 LEASES
Effective April 1, 2019, the Company adopted IFRS 16– Leases, which specifies how to recognize,
measure, present and disclose leases. The standard provides a single accounting model, requiring the
recognition of assets and liabilities for all major leases previously classified as “operational leases”.
The company applied Modified Retrospective Approach on the date of initial application.
The Company recognizes a right-of-use asset and a lease liability at the lease commencement date.
The right-of-use asset is initially measured at cost, based on the initial amount of the lease liability.
The assets are depreciated to the earlier of the end of the useful life of the right-of-use asset or the
lease term using the straight-line method as this most closely reflects the expected pattern of
consumption of the future economic benefits. The lease term includes periods covered by an option
to extend if the Company is reasonably certain to exercise that option. In addition, the right-of-use
asset is periodically adjusted for certain re-measurements of the lease liability. There is no impact on
transition in opening balance of retained earnings as at April 1, 2019.
The weighted average incremental borrowing rate of 12% (for India) and 7.45% (for other locations)
has been applied to lease liabilities recognized in the statement of financial position at the date of
initial application.
The Company has decided to use the approach that allows the right-of-use asset to be recognized at
an amount equal to the liability as at the date of initial application. Based on such approach the Right
to Use Asset and Lease Liability as of April 1, 2019, have been created at $ 1,907 and $ 1,907,

19
respectively. Further, interest expense on Lease Liabilities amounted to $ 40 during the three months
ended June 30, 2019.Depreciation on Right to Use amounted to $ 281 for the three months ended
June, 30 2019.
Impact of IFRS 16 on Finance Lease
April 1, 2019, equipment amounting to $ 243 has been reclassified to ROU from property and
equipment. As at April 1, 2019, amount of $ $153 pertaining to term Borrowings and amount of $
98 pertaining to Short Term Borrowings have been reclassified to Lease Liabilities in relation to
Finance Lease. The Company has continued to discount the lease rental amount at Interest Rate
Implicit in the lease agreements.
Non-GAAP Financial Measures
Net Income
The Company uses the term Net Income, as the International Financial Reporting Standards
(“IFRS”) define the term as synonymous with profit for the period.
Reconciliation of Gross Revenue (Non- GAAP)
In addition to the results prepared in accordance with IFRS, the Company has presented Gross
Revenue. The Company uses Gross Revenue along with other IFRSs measures to evaluate operating
performance. Gross Revenue is defined as reported revenue adjusted in respect of significant financing
component that arises on account of normal credit terms provided to catalogue customers.
Reconciliation of Adjusted EBITDA
In addition to the results prepared in accordance with IFRS, the Company has presented Adjusted
EBITDA. The Company uses Adjusted EBITDA along with other IFRSs measures to evaluate
operating performance. Adjusted EBITDA is defined as EBITDA adjusted for (gains)/impairments of
available-for-sale financial assets, profit/loss on held for trading liabilities (including profit/loss on
derivatives), transactions costs relating to equity transactions, share based payments, loss/(gain) on
sale of property and equipment, Loss on de-recognition of financial assets measured at amortized cost,
net, credit impairment loss, net, adjustment towards arisen significant discounting, component loss on
financial liability (convertible notes) measured at fair value through profit and loss, Loss on
deconsolidation of a subsidiary and exceptional items such as impairment of goodwill, trademark, film
& content rights and content advances.
Adjusted EBITDA, as used and defined by us, may not be comparable to similarly-titled measures
employed by other companies and is not a measure of performance calculated in accordance with
GAAP. Adjusted EBITDA should not be considered in isolation or as a substitute for operating
income, net income, cash flows from operating investing and financing activities, or other income or
cash flow statement data prepared in accordance with GAAP. Adjusted EBITDA provides no
information regarding a company’s capital structure, borrowings, interest costs, capital expenditures
and working capital changes or tax position. However, Eros’ management team believes that Adjusted
EBITDA is useful to an investor in evaluating the Company’s results of operations because this
measure:
• is widely used by investors to measure a company’s operating performance without regard to
items excluded from the calculation of such term, which can vary substantially from company

20
to company depending upon accounting methods and book value of assets, capital structure
and the method by which assets were acquired, among other factors;
• helps investors to evaluate and compare the results of Eros’ operations from period to period
by removing the effect of the Company’s capital structure from its operating structure.
See the supplemental financial schedules for reconciliations to IFRSs measures in the table below,
which presents a reconciliation of Eros’ Adjusted EBITDA to net income.
Adjusted EBITDA
Three months ended June 30,
2019 2018
(in thousand)
Profit/(Loss) for the year $ 5067 $ (9,490 )
Income tax expense 1,834 2,879
Net finance costs 2,147 2,348
Depreciation 391 248
Amortization(1) 224 471
EBITDA (Non- GAAP) 9,663 (3,544 )
Share based payment(2) 3,666 4,430
Loss on sale of property and equipment 4 —
Reversal of credit impairment losses /(gains) (1,287) (4,581 )
Loss on de-recognition of financial assets measured at amortized cost,
net 270 1,304
Closure of derivative asset — 249
Credit impairment losses/(gains) 10,805 1,919
Fair Value of receivables (306) —
Loss/(Gain) of available- for – sale measured at fair value through profit
and loss 809 —
Loss/(Gain) on financial liability (convertible notes) measured at fair
value through profit and loss (4,985) 21,323
Adjustment arisen from significant discounting component — 6,410
Adjusted EBITDA (Non-GAAP) $ 18,639 $ 27,510
Amortization of intangible film and content rights 11,877 28,495
Gross Adjusted EBITDA $ 30,516 $ 56,005
(1) Includes only amortization of intangible assets other than intangible content assets.
(2) Consists of compensation costs recognized with respect to all outstanding plans and all other
equity settled instruments.