Ernst & Young - Renewable Energy Country Attractiveness Indeces
36
The toxic legacy of the glo renewables market, accor Indices. Although new inv climbing 30% to US$243b economic conditions chal While China continues to markets, its score remain growth, falling stocks, inf Global h Renewab attracti February 2011 Issue 28 In this issue: Overview of indices 1 Renewable support mechanisms: the transition to low carbon 2 Electricity market reform – the transition for renewables 6 growth, falling stocks, inf Its closest competitor, the Scheme – providing some the US installed 5.1GW of China’s 16.5GW in 2010. last month to set an ambi Across Europe, the pictur some markets, but tighte support mechanisms. Thi for solar PV. In Novembe France introduced a three reductions in Germany an Turkey has risen in the in more favorable FITs, diffe from an amended RPO an dropped in the rankings d In terms of technologies, of 51%. However, onshor sector grew strongly, whi The big news in the UK, w consultation, announced Hendry, Minister of State The lead article reflects o mechanisms need to take challenges toward financi transition for renewables 6 Financing the EU’s 2020 renewable energy targets – key challenges 7 M&A activity 9 IPO activity 10 All renewables index 11 Wind indices 13 Near-term wind index 14 Solar indices 15 Country focus – 16 China, US, Germany, UK, Italy, France, Spain, Canada, Portugal, Brazil, Turkey Commentary — guidance notes 27 Company index 29 Glossary 30 Ernst & Young Services for Renewable Energy Projects 31 Ernst & Young contacts 32 Ernst & Young publications 33 obal financial crisis continues to cast a shadow over the world rding to this issue of Ernst & Young’s Country Attractiveness vestment in clean energy reached unprecedented levels in 2010, b (€181b), some countries and technologies are finding the llenging, leaving the market in an overall state of flux. lead the way and is still experiencing growth in its wind and solar ns static, amid concerns over the sustainability of its meteoric flationary pressures, and indications of an uneven supply chain. highlights ble energy country iveness indices flationary pressures, and indications of an uneven supply chain. e US, has approved a one-year extension of the Treasury Grant e much needed respite to its renewable energy market. Last year, f wind power, barely half of 2009’s level, and less than a third of . However, President Obama used his State of the Union address itious 80% clean electricity target for 2035. re is mixed. Levels of new renewables deployment remain strong in ening government budgets are putting increasing pressure on is has led to a series of “sudden” and planned FIT cuts, especially er, Spain finalized a package of significant cuts, while in December e-month moratorium for new projects. Despite staged FIT nd Italy, about 7GW and 4GW of solar were installed last year. ndices following approval of a new energy law which introduced erentiated by technology. The Indian solar market has benefited nd other financial support. However, the Netherlands and Australia due to reduced government incentives. 2010 was a good year for offshore wind, with new capacity growth re wind was down 7% globally, with a 14% fall in Europe. The solar ile Biomass investment remained similar to levels in 2009. which remains fifth in our rankings, is the Electricity Market Reform in December. We are delighted to have a feature article by Charles e for DECC, describing the transition for renewables. on the transition to low carbon, discussing how renewable support e a broader view, while another feature article looks at the key cing the EU 2020 renewable energy targets.
-
Upload
sofia-kent -
Category
Documents
-
view
33 -
download
1
description
Ernst & Young - Renewable Energy Country Attractiveness Indeces.pdf
Transcript of Ernst & Young - Renewable Energy Country Attractiveness Indeces

The toxic legacy of the global financial crisis continues to cast a shadow over the world renewables market, according to this issue of Ernst & Young’s Country Attractiveness Indices. Although new investment in clean energy reached unprecedented levels in 2010, climbing 30% to US$243b (economic conditions challenging, leaving the market in an overall state of flux.
While China continues to lead the way and is still experiencing growth in its wind and solar markets, its score remains static, amid concerns over the sustainability of its meteoric growth, falling stocks, inflationary pressures, and indications of an uneven supply chain.
Global highlights
Renewable energy country attractiveness indices
February 2011Issue 28
In this issue:Overview of indices 1
Renewable support mechanisms: the transition to low carbon 2
Electricity market reform – the transition for renewables 6 growth, falling stocks, inflationary pressures, and indications of an uneven supply chain.
Its closest competitor, the US, has approved a oneScheme – providing some much needed respite to its renewable energy market. Last year, the US installed 5.1GW of wind power, barely half of 2009’s level, and less than a third of China’s 16.5GW in 2010. However, President Obama used his State of the Union address last month to set an ambitious 80% clean electricity target for 2035.
Across Europe, the picture is mixed. Levels of new renewables deployment remain strong in some markets, but tightening government budgets are putting increasing pressure on support mechanisms. This has led to a series of “sudden” and planned FIT cuts, especially for solar PV. In November, Spain finalized a package of significant cuts, while in December France introduced a threereductions in Germany and Italy, about 7GW and 4GW of solar were installed last year.
Turkey has risen in the indices following approval of a new energy law which introduced more favorable FITs, differentiated by technology. The Indian solar market has benefited from an amended RPO and other financial support. However, the Netherlands and Australia dropped in the rankings due to reduced government incentives.
In terms of technologies, 2010 was a good year for offshore wind, with new capacity growth of 51%. However, onshore wind was down 7% globally, with a 14% fall in Europe. The solar sector grew strongly, while Biomass investment remained similar to levels in 2009.
The big news in the UK, which remains fifth in our rankings, is the consultation, announced in December. We are delighted to have a feature article by Charles Hendry, Minister of State for DECC
The lead article reflects on the transition to low carbon, discussing how renewable support mechanisms need to take a broader view, while another feature article looks at the key challenges toward financing the EU 2020 renewable energy targets.
transition for renewables 6
Financing the EU’s 2020 renewable energy targets –key challenges 7
M&A activity 9
IPO activity 10
All renewables index 11
Wind indices 13
Near-term wind index 14
Solar indices 15
Country focus – 16
China, US, Germany, UK, Italy, France, Spain, Canada, Portugal, Brazil, Turkey
Commentary — guidance notes 27
Company index 29
Glossary 30
Ernst & Young Services for Renewable Energy Projects 31
Ernst & Young contacts 32
Ernst & Young publications 33
The toxic legacy of the global financial crisis continues to cast a shadow over the world renewables market, according to this issue of Ernst & Young’s Country Attractiveness Indices. Although new investment in clean energy reached unprecedented levels in 2010, climbing 30% to US$243b (€181b), some countries and technologies are finding the economic conditions challenging, leaving the market in an overall state of flux.
While China continues to lead the way and is still experiencing growth in its wind and solar markets, its score remains static, amid concerns over the sustainability of its meteoric growth, falling stocks, inflationary pressures, and indications of an uneven supply chain.
Global highlights
Renewable energy country attractiveness indices
growth, falling stocks, inflationary pressures, and indications of an uneven supply chain.
Its closest competitor, the US, has approved a one-year extension of the Treasury Grant providing some much needed respite to its renewable energy market. Last year,
the US installed 5.1GW of wind power, barely half of 2009’s level, and less than a third of China’s 16.5GW in 2010. However, President Obama used his State of the Union address last month to set an ambitious 80% clean electricity target for 2035.
Across Europe, the picture is mixed. Levels of new renewables deployment remain strong in some markets, but tightening government budgets are putting increasing pressure on support mechanisms. This has led to a series of “sudden” and planned FIT cuts, especially for solar PV. In November, Spain finalized a package of significant cuts, while in December France introduced a three-month moratorium for new projects. Despite staged FIT reductions in Germany and Italy, about 7GW and 4GW of solar were installed last year.
Turkey has risen in the indices following approval of a new energy law which introduced FITs, differentiated by technology. The Indian solar market has benefited
from an amended RPO and other financial support. However, the Netherlands and Australia dropped in the rankings due to reduced government incentives.
In terms of technologies, 2010 was a good year for offshore wind, with new capacity growth of 51%. However, onshore wind was down 7% globally, with a 14% fall in Europe. The solar sector grew strongly, while Biomass investment remained similar to levels in 2009.
The big news in the UK, which remains fifth in our rankings, is the Electricity Market Reform consultation, announced in December. We are delighted to have a feature article by Charles
Minister of State for DECC, describing the transition for renewables.
The lead article reflects on the transition to low carbon, discussing how renewable support mechanisms need to take a broader view, while another feature article looks at the key challenges toward financing the EU 2020 renewable energy targets.

The Ernst & Young Country Attractiveness Indices (CAI) provide scores for national renewable energy markets, renewable energy infrastructures and their suitability for individual technologies. The indices provide scores out of 100 and are updated on a regular basis.
The main indices (all renewables and wind) are referred to as the “long-term indices.” The near-term wind index takes a two-year view with slightly different parameters and weightings (see right).
The CAI take a generic view, and different sponsor/financier requirements will clearly affect how countries are rated. Ernst & Young’s Renewable Energy Group can provide detailed studies to meet specific corporate objectives. It is important that readers refer to the guidance notes set out on pages 27-28 when referring to the indices.
Long-term indicesThe long-term indices are forward-looking and take a long-term view, hence the UK’s high ranking in the wind index, explained by
Overview of indices: Issue 28
Ernst & Young was ranked the leading project finance advisor in the Americas, Europe, Middle East and Africa between 2001 and 2009 by Project Finance International
Renewable energy country attractiveness indices Issue 28
view, hence the UK’s high ranking in the wind index, explained by the large amount of unexploited wind resource, strong offshore regime and attractive tariffs available under the Renewables Obligation (RO) mechanism. Conversely, although Denmark has the highest proportion of installed wind capacity to population level, it scores relatively low because of its restricted grid capacity and reduced tariff incentives.
All renewables indexThis index provides an overall score for all renewable energy technologies. It combines individual technology indices as follows:
1. Wind index — 68% (comprising onshore wind index and offshore wind index)
2. Solar index — 15%(comprising solar photovoltaic (PV) index and solar concentrated power (CSP) index)
3. Biomass and other resource index — 17%
Individual technology indicesThese indices are derived from scoring:
► General country-specific parameters (the renewables infrastructure index), accounting for 35%
► Technology-specific parameters (the technology factors), accounting for 65%
Overview of indices: Issue 28Renewables infrastructure indexThis provides an assessment by country of the general regulatory infrastructure for renewable energy (see page 11).
Technology factorsThese provide resource-specific assessments for each country.
Long-term solar indexThis index is derived from scoring:
► The solar PV index — 73%
► The solar CSP index — 27%
Long-term wind indexThis index is derived from scoring:
► The onshore wind index — 70%
► The offshore wind index — 30%
Near-term wind index
1
Comments and suggestionsWe would welcome your comments or suggestions on any aspect of the indices. Detailed attractiveness surveys and market reports can be provided, taking account of specific corporate objectives.
Please visit our website www.ey.com/renewables or contact either:
Ben Warren: [email protected]
Andrew Perkins: [email protected]
Dane Wilkins: [email protected]
Arnaud Bouille: [email protected]
Enquiries to the guest columnist Jonathan Johns should be addressed to [email protected]
The best way to access historical information in Bloomberg is from Ernst & Young Renewable Energy - Total Renewable Country Attractiveness Index page: {EYRE<GO>}. Each value can be evaluated to reveal history.
Near-term wind indexThe near-term wind index takes a forward-looking two-year view based on the parameters of most concern to a typical investor looking to make an investment in the near term. The index is based on separate scores for onshore and offshore wind. For parameters and weightings see pages 27-28.

In the previous CAI issue, it was suggested that we should not have too high expectations for Cancun – and in that regard, the conference did not disappoint. Even though Cancun put the Kyoto show back on the road, the COP 17 talks in South Africa are unlikely to establish sufficiently universal or indeed reliable carbon pricing mechanisms to provide a significant underpinning of finance for renewable energy projects. In the absence of agreement, the poor developing world is left in difficulties. The embryonic World Bank US$6.4b (€4.8b) climate investment funds initiative is unlikely to compensate for a disabled and time-expired JI/CDM mechanism – which needs reform as well as renewal, as funds to date have tended to flow disproportionately to new growth economies better placed to provide support through indigenous carbon markets — as China now intends to develop.
In established economies, the signs are that, when free allocations are removed, carbon trading mechanisms (such as the EU-ETS) do encourage heavy energy users and electricity generators to diversify away from fossil fuels.
In all probability, such mechanisms are better organized on a regional basis, reinforced by a global system of trading – as the value (or cost) of carbon varies according to the degree of exposure of individual economies to fossil fuels. However, they are less effective in encouraging renewable and other forms of
Renewable support mechanisms: the transitionto low carbonJonathan Johns, guest columnist
are less effective in encouraging renewable and other forms of low carbon investment due to the lack of a reliable long-term futures market with predictable prices: a problem neither the ETS nor JI/CDM solves.
Consequently, in both developed and new growth economies, renewable support mechanisms (predominantly feed-in tariffs -FITs) are likely to remain the prime driver of the industry in the next 15 to 20 year period needed to achieve grid parity at wholesale electricity prices. And in the developing poor nations, thought is required as to how best to effect similar levels of support to complement JI/CDM or its successors.
In developed countries, the challenge is to meet increased targets for carbon reductions while gaining benefits of economies of scale and declining technology costs – but without the policy tools or fiscal budgets available to more planned new growth economies, which benefit from greater state-sponsored liquidity and a more controlled industrial and planning policy.
The pressures to reduce national debt in developed countries, and control fiscal burdens on industry, consumers and taxpayers, are leading to a very keen focus on better value for money. This is supplemented by a renewed interest in carbon taxes and other fund raising devices – notwithstanding the desire to combat climate change and drastically lower carbon emissions. In the extreme case of the challenges posed by the floods in Australia, the Government has had to suspend or postpone approximately A$500m (€373m) of renewables and low carbon funding to divert resources to that more urgent short-term need – a disaster that may well be a symptom of the difficulties posed by climate change.
Renewable energy country attractiveness indices Issue 28
As renewables go beyond a niche role and become a significant contributor to an energy economy, absolute levels of public investment move center stage – with cost per kWh generated and cost per carbon tonne abated being the most critical metrics. Underlying the debate are concerns, seized on by climate change skeptics, about the impact of support mechanisms on rising energy costs for industry, the taxpayer/consumer, and the fuel poor. Subsidies also need to compete with other non-climate change related spending priorities.
It is comforting that recent exercises by the International Energy Agency (IEA) and by Ofgem (the UK energy market regulator) show that, given an appropriate technology mix, investment in renewables and low carbon generation represents good value for money over the long term – compared to the alternative of preserving the status quo and remaining exposed to volatile fossil fuel prices. It remains the case that the renewables industry needs to stay focused on increasing efficiencies and reducing costs of production to maintain strong support. In the short term, investment in renewables does increase costs; the benefits come later.
There are considerable challenges in a climate of global competition and continued poor financial liquidity in many developed countries. Installation levels collapsed in the US in 2010 (with a 50% wind reduction from 9.9GW to 5.1GW) and
Renewable support mechanisms: the transition
2010 (with a 50% wind reduction from 9.9GW to 5.1GW) and declined by nearly 10% in Europe (from 10.3GW to 9.3GW across the EU-27).
One of the benefits of FIT mechanisms is that, as illustrated in previous issues of the CAI, they tend to provide less costly renewable energy per kWh generated, due to their lower risk profile and greater certainty. They are easier to understand by both investors and finance providers and tend to attract a greater plurality of market participation (from local communities and businesses as well specialist developers, investment funds and utilities) than more complex market-based mechanisms (such as green certificates - GC). As a consequence, well-designed FITs have usually led to greater capacity growth, subject to planning and grid availability, and a more conducive environment – where there are appropriate skills to encourage local manufacture.
In contrast, market-based mechanisms, due to their higher risk, and higher cost of capital, have on the whole been less effective in terms of capacity build and much more expensive to the consumer/tax payer per kWh produced – although not in terms of cost per head of population, due to much lower levels of capacity deployment. The paradox of some market mechanisms is that their low overall cost in terms of absolute levels of support is a function of their relative failure – not necessarily the characteristic required if increased carbon targets are to be met.
2

Although the RO was more successful in the UK than the preceding Non-Fossil Fuel Obligation (NFFO) auction system, other countries in Europe with more stable FIT mechanisms were able to obtain much greater capacity growth. FITs allow greater local participation and greater engagement, in an admittedly more renewables-friendly permit process. In territories such as Germany, where FITs are set at a higher level in the earlier years of a contract (matching debt repayment) and lower in later years (encouraging a long-term equity participation), there are also other advantages for the consumer/taxpayer in that a portfolio of relatively low-cost renewables can be built up over time for an economy. Low carbon electricity at costs much closer to brown power prices will provide a competitive advantage should carbon intensity become a major discriminating factor.
This type of approach has advantages over premium FITs which, as seen in Spain, can become very expensive without a cap, if fossil fuel prices and wholesale electricity prices rise. This puts up the overall cost of renewable electricity to an economy and loses the critical hedging benefits that fixed tariffs provide, which also avoid a double subsidy if carbon trading or taxes are applied to the energy economy as a whole .
Furthermore, FITs are more easily adjusted to reflect downward pricing pressures if technology costs reduce, and indeed can be used via staged degression over a number of years, to provide a used via staged degression over a number of years, to provide a signal to the market as to the improvements in value required as a fair exchange for public support. However, in certain circumstances where market distortions occur, short notice downgrades (such as French and Czech solar PV tariffs recently) can lead to market shocks, plant closures and reversals of previous job gains. (This can exacerbate difficulties in dealing with low-cost competition, from Asia, for example.)
Not only have we seen relatively strong debates in Germany about the speed of tariff degression and its impact on the indigenous solar industry in particular, but also more recently in Spain, the attempt by the authorities to limit for three years and on a retrospective basis the number of hours for which PV projects can obtain support. This is on the grounds of affordability – albeit with an extension of support from 25 to 28 years.
Given this backdrop, it is not surprising that many countries have been reviewing the levels of tariff-based support mechanisms. There have been successive announcements of reductions –particularly if existing mechanisms show signs of being expensive relative to others. Figures 1 and 2 show a steady decline in tariffs in many territories – which may be contrasted to the upward movement in oil prices as the new growth markets stimulate demand and as security concerns in North Africa and the Middle East re-emerge (Figure 3).
Renewable energy country attractiveness indices Issue 28
Figure 1 – Roof-mounted (4-10kW) solar PV FIT rates
Figure 2 – Ground-mounted (1-5MW) solar PV FIT rates
0
10
20
30
40
50
60
Dec
-09
Feb-
10
Apr
-10
Jun-
10
Aug
-10
Oct
-10
Dec
-10
Feb-
11
Apr
-11
Jun-
11
Aug
-11
Oct
-11
Dec
-11
€ce
nts
/ kW
hFrance Germany SpainItaly UK
25303540
cent
s /
kWh
Figure 3 – Weekly Brent Blend Spot Price
3
05
10152025
Dec
-09
Feb-
10
Apr
-10
Jun-
10
Aug
-10
Oct
-10
Dec
-10
Feb-
11
Apr
-11
Jun-
11
Aug
-11
Oct
-11
Dec
-11
€ce
nts
/ kW
h
France Germany SpainItaly UK
020406080
100120140160
Jan,
200
7A
pr, 2
007
Jul,
2007
Oct
, 200
7
Jan,
200
8A
pr, 2
008
Jul,
2008
Oct
, 200
8
Jan,
200
9A
pr, 2
009
Jul,
2009
Oct
, 200
9
Jan,
201
0A
pr, 2
010
Jul,
2010
Oct
, 201
0Ja
n, 2
011
US$
/ ba
rrel
Weekly Brent Blend Spot Price (Dollars per Barrel)
One criticism of fixed FITs is that they rely on government rather than the market to determine the appropriate level of tariffs. This process can be distorted by lobbying and may lead to technology costs rising to the level of tariffs in a jurisdiction rather than being similar to those charged in less well-rewarded countries. Too high tariffs can lead to a “gold rush” and more capacity being installed than contemplated or budgeted for. This could well be the case with UK solar farms, which show signs of taking an excessive share of restricted renewable energy budgets primarily intended for the rooftop market–leading to a FIT review just announced by the UK Government.
In Germany, the speed of solar tariff degression is partly controlled by the volume introduced: so that under current proposals (to be confirmed at the end of May), there will be a 15% cut in July if more than 7.5GW is installed (and a 2.5% increase if less than 2.5GW is installed, with intervening changes at different levels of installation).
In California, where the Federal Energy Commission ruled that the California Public Utilities Commission did not have the power to set fixed tariffs, the problem has been solved by a novel “reverse auction” process, with a 1GW capacity cap providing contracts for installation sizes known to be less problematic for grid connection.
In Portugal, excess applications are partly controlled by the need In Portugal, excess applications are partly controlled by the need to bid for connection capacity at prices starting at €400,000 per MW. In Spain, a queuing process has been applied to permits, which industry has argued has stifled development in some regions.
In the past, capacity tenders (auctions) have been used with mixed success. Difficulties have been common in countries with poor planning and permitting records, often leading to awarded contracts not being fulfilled and gaming of the bidding process with bids below economic prices. Capacity tenders have been used to better effect in emerging high growth economies where deployment is less of an issue, e.g., in South America and in China, before the latter moved more closely to a FIT system.
Although the alternative tax-based Production Tax Credit (PTC) in the US has been very cost-effective (at least prior to the need in 2009 for it to be supported by Treasury Grants), its stop-start nature has been problematic for industry. The grants were only renewed for a year at the last minute in 2010, and this considerable uncertainty in no small way contributed to low levels of wind capacity increase in the US, and to China overtaking the US as the leader in terms of total MW installed.
Renewable energy country attractiveness indices Issue 28
Recognizing the debate about the direction of US energy policy, President Obama has called in his State of the Union address for a new low carbon support mechanism to be adopted: covering gas, renewables, nuclear and clean coal.
Renewables’ increasing importance as a prime energy market player requires the sector to interact with other segments of the energy industry – with consequent policy implications. For example, in addition to the need to replace aging fossil fuel and retiring nuclear capacity, there is also the need possibly to double electricity generation to provide power for the increasing electrification of heat and transport. New policy is required to deal with the availability and pricing of appropriate grid power and backup reserve from other low carbon technologies. There is a need to deal with more remote, more distributed, and more intermittent generation; as well as to deal with the balancing of electricity supply and demand both in an instant and over the long term. Energy policy is required to manage the interaction with clean coal initiatives and energy efficiency, together with demand management – which is increasingly likely to be priced and used as a network management tool.
All of these necessary initiatives require US$100b of investment in most major economies and US$ trillions worldwide. In the current financial climate, such initiatives invite close scrutiny in terms of capital required, returns and output generated, and terms of capital required, returns and output generated, and carbon tonnes produced or saved. Not to do so can lead to anomalies. For example, at present, many jurisdictions, whether by way of FITs (as in Germany) or market-based mechanisms (such as Renewables Obligation Certificates (ROCs) in the UK) tend to direct biomass investment toward electricity generation, whereas a holistic approach would rationally encourage combined heat and power with its more efficient energy conversion. It will be interesting to see whether the pioneering UK Renewable Heat Incentive (to be launched in June 2011) deals with this issue, at a smaller scale at least.
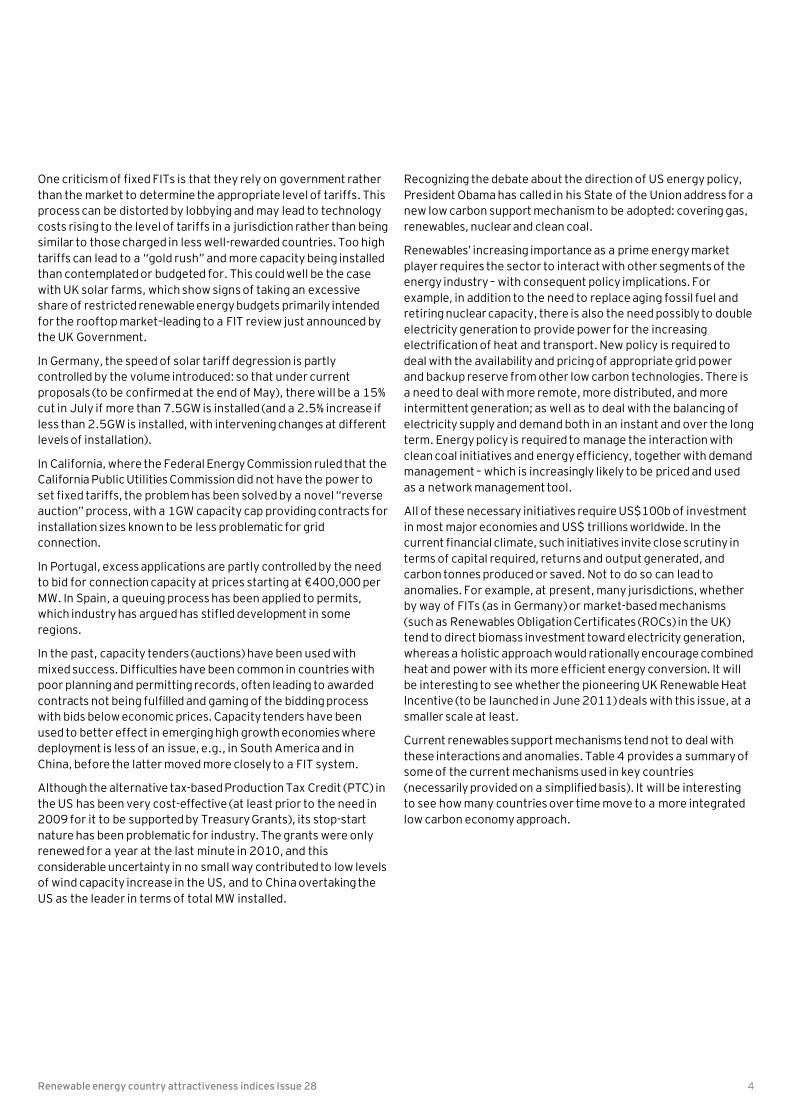
Current renewables support mechanisms tend not to deal with these interactions and anomalies. Table 4 provides a summary of some of the current mechanisms used in key countries (necessarily provided on a simplified basis). It will be interesting to see how many countries over time move to a more integrated low carbon economy approach.
4
Table 4 – Summary of renewable energy support mechanisms
The need to deal with these interactions is dealt with by the Electricity Market Reform (EMR) consultation announced in the UK in December 2010. This concludes that the current measures in the UK will not deliver on the Government’s objectives for decarbonization, renewables deployment, security of supply or affordability for consumers.
The market reforms propose a suite of inter-related measures, including a carbon floor price – a tax based on a progression to a
Country Onshore wind Offshore wind Solar PV
UK ROC or FIT (<5MW) ROC ROC or FIT (<5MW)
Italy GC (or FIT<200kW) GC FIT
Germany FIT FIT FIT
France FIT FITCall for tenders
FIT
Spain Hybrid feed-in tariff Hybrid
Portugal Tendering scheme for grid access and FIT
n/a Tendering scheme for grid access and FIT
US (California) PTC / Treasury GrantREC
PTC / Treasury GrantREC
“Reverse auction” FIT
US (Texas) PTC / Treasury GrantREC
PTC / Treasury GrantREC
ITC / Treasury GrantREC
China Agreed PPA rate Agreed PPA rate Government grants
including a carbon floor price – a tax based on a progression to a price of £20 to £40 (€43.2 to €47) per tonne by 2020 and £70 (€82.3) per tonne by 2030. The EMR also proposes a low carbon FIT (most likely varied by technology type) which may also cover nuclear generation and carbon capture and storage. This is to replace the previous relatively expensive market-based RO system. These market reforms are also accompanied by proposals for capacity payments for flexible reserve plants or demand reduction measures and emissions performance standards to limit emissions from carbon intensive plants. They are to be complemented by a “Green Deal” which is targeted toward re-energizing energy efficiency; and by a Green Investment Bank to stimulate investment – although at the time of writing, there were concerns that Treasury intervention may mean that the scope of this latter institution will be restricted.
Of course as always, “the devil is in the detail” and the danger is the desire of legislators to ensure that interventionist support is accompanied by market-influenced controls and price discovery may overcomplicate solutions provided.
The EMR consultation poses many questions over the form of the FIT– preferring a “contract for difference” mechanism accompanied possibly by an auction process which, if poorly implemented, could produce a complexity that would negate some of the benefits that a simple FIT provides. It could also leave exposure to market risk. Certainly, participants more familiar with basic FIT systems could conclude that the more complicated proposals do not warrant further engagement – with the consequence that the desired broadening of market participation would not occur to the extent that it could.
Renewable energy country attractiveness indices Issue 28
It is interesting to note that the second preferred mechanism is a premium FIT (similar to that used in Spain), even though some of the disadvantages causing it to fall out of favor are acknowledged in the consultation paper. Perhaps because of the complexity of interacting with the UK’s deregulated energy trading arrangements, there is no preference for a fixed FIT. Indeed, the analysis provides no cost comparison to a two-stage FIT with degression (such as that in Germany), even though there is evidence to suggest that this type of approach does, over time,
Solar CSP Biomass Geothermal
(<5MW) n/a ROC ROC
FIT GC (or FIT for small plants)
GC (or FIT for small plants)
FIT FIT FIT
FIT FITCall for tenders
FIT
Hybrid Hybrid n/a
Tendering scheme for and FIT
Tendering scheme for grid access and FIT
Tendering scheme for grid access and FIT
n/a
“Reverse auction” FIT ITC / Treasury Grant REC
PTC / Treasury Grant REC
PTC / Treasury Grant REC
ITC / Treasury Grant ITC / Treasury Grant REC
PTC / Treasury Grant REC
PTC / Treasury Grant REC
Government grants Agreed PPA rate Agreed PPA rate n/a
evidence to suggest that this type of approach does, over time, produce a more cost-effective portfolio of low carbon energy production.
For all of these observations, the EMR is to be welcomed as an innovative and comprehensive approach to dealing with the challenges of the low carbon economy. Together with President Obama’s State of the Union address encouraging a clean energy standard, they signal very strongly the need for a significant shift of emphasis – so that support mechanisms deal with the low carbon economy as a whole. For this reason, further changes in other jurisdictions are to be expected – and not just those dealing with downward price adjustments.
In the short term, industry economics are favoring gas in Europe and the US — and coal, not only in Asia, but also in a surprising number of developed economies. For example, in 2010, coal capacity added in Europe exceeded coal capacity retired for the first time in many years. Perhaps one of the most challenging examples of economies focusing on the broader low carbon market and seeking to focus on costs is Brazil’s announcement that gas plants will be allowed to compete in some energy tenders that had expected to be limited to renewables.
As a consequence of reduced investment in Europe and the US, many Western renewable energy technology providers are reporting shorter order books for the current year. It is therefore important that the renewables sector engages in the wider low carbon energy debate to ensure that it benefits from the incentives it needs and gives value for money to the various stakeholders. There is much to be done.
5

Electricity market reform renewables
Charles Hendry, Minister of State for the Department of Energy and Climate Change, United Kingdom
Last December, the Department of Energy and Climate Change (DECC) announced the Coalition Government’s Electricity Market Reform (EMR), aimed at moving the UK to the front of the global race for electricity investment, driving the growth of clean energy industries in the UK, and ensuring the best possible deal for consumers.
These reforms will lay the foundations for a sustainable economy, bringing billions in investment in the UK through greater certainty, safeguarding jobs up and down the supply chain, and giving the UK real competitive advantage in advanced energy technologies.
The proposed changes include a new FIT support scheme for low carbon electricity which will replace the current RO support mechanism for new, large scale renewable electricity. The rationale for the change (and the lead option of a contracts-for-difference model of FIT) is that greater revenue certainty through a FIT contract will enable investors to access lower-cost capital. This will save consumers money, potentially make investment more attractive to investors who prefer lower risk and could make it easier to operate as an independent generator. it easier to operate as an independent generator.
Final decisions will be made in a White Paper later this year, and a key consideration will be how to ensure a smooth transition with minimum disruption to investment decisions. We have set out the transition proposals to the new scheme and we are working with industry to ensure that developers receive the certainty they need to secure investment.
As well as giving certainty for the longer term through a proposed new system of FITs, we are providing reassurance to the industry on the rules for existing investments, and for those made between now and 31 March 2017.
Currently, renewable electricity generation in the UK is supported by the RO. This has proven successful at pulling through generation to date, and will continue to be the main mechanism for delivering the renewable electricity necessary to meet our EU 2020 targets.
We are, therefore, consulting on how we “vintage” the RO scheme – crystallizing the position for existing generation – when the new support scheme is introduced. Our aim is to minimize any uncertainty or hiatus in investment during the transition period, and to give confidence to industry for existing investments.
In the consultation document, we set out our proposals to close the RO to new accreditations from 1 April 2017. All projects accredited under the RO prior to this date will receive their full 20 years’ support, subject to the end dates set in the RO.
Renewable energy country attractiveness indices Issue 28
Electricity market reform – the transition for
To give further certainty over the level of support that generators will receive, we have announced a new, faster timetable for the RO Banding Review. This will give earlier notice of support levels for generation that accredits between 1 April 2013 and 31 March 2017. It is our intention to consult on the new banding levels from summer 2011, issuing a Government Response in the autumn with the new bands coming into force on 1 April 2013.
The closure of the RO to new investment will create a closed pool of capacity where the number and size of existing stations are known, along with their scheduled lifetimes within the scheme. This means that, after 2017, we will no longer have to predict what new capacity will accredit in future obligation periods when setting the obligation level. We are, therefore, consulting on how the obligation should be set in future so as to ensure a stable ROC price.
The EMR consultation closes on 11 March 2011, and we welcome views on our proposals. These will be taken into account in developing the White Paper that will be published later this year, setting out our confirmed proposals on how we intend to make the UK an even better place for green investment.
6

Financing the EU’s 2020 renewable energy targets – key challenges
Introduction
The Directive 2009/28/EC on the promotion of the use of energy from renewable sources (RES) sets the overall target to reach 20% renewable energy in gross final energy consumption in 2020. This target is broken down into binding individual Member State targets. Reaching these targets will require a huge mobilization of investments in renewable energies in the coming decade in the European Union (EU).
In order to identify the financial constraints that might hinder the achievement of the 20% target, Article 23 (7) of the Directive requires the Commission to present an analysis and an action plan with a view to the better and increased use of available funds and the better coordination of Community and national funding in various forms. For this reason, the European Commission requested a study on Financing renewable energy in the European energy market. This study, carried out by Ernst & Young in association with other consortium partners (Ecofys, FraunhoferInstitute, University of Vienna) was completed late 2010. Key insights from the study are presented below.
Meeting 2020 targets: the financing challenge
Existing financing instruments have enabled investments in the renewable energy sector to reach record-breaking levels over the past few years, although this growth has been distributed past few years, although this growth has been distributed unevenly across Member States. According to data from Bloomberg New Energy Finance, capital flowing into the asset-based and structured funding deals related to renewable energy in Europe reached a peak of €35b in 2008, falling to €27b in 2009 and €17b in 2010.1
Based on the scenarios analyzed in this study, meeting the 2020 targets will involve much higher levels of financing. It is estimated that the average annual capital expenditure for new renewable energy installations will range from €60b to €70b. Adding the financial resources needed for all investments in the renewable energy sector, including early stage technology funding and grid reinforcement, would lead to even higher figures. A gross estimate of the financial gap to be considered therefore reaches approximately €35b per year for the 10 years up to 2020. Whether sufficient capital will be available and directed to renewable energy generation in Europe is highly unpredictable, as financing in renewable energy competes with other investment opportunities, including outside the energy sector, and in other regions. Ensuring sufficient inflow of capital over the long term will require strong political commitment from both governments and from the European Commission.
Renewable energy country attractiveness indices Issue 28
1 Figures based on disclosed transaction values only
Financing the EU’s 2020 renewable energy
Are the current instruments able to address the financing needs of the sector?
A large number of support schemes and financing instruments have been established over the years to support the development of renewable technologies and projects. Most instruments fall under three main categories:
► Market instruments (FITS, premiums, ROs, tenders, fiscal incentives)
► Equity Finance Mechanisms (venture capital, equity, R&D grants, capital/project grants, contingent grants)
► Debt Finance Mechanisms (mezzanine debt, senior debt, guarantees)
The appropriateness of financial instruments is highly dependent on technology or project’s development stage. Current perceptions indicate that access to finance can be enhanced by innovative public-private approaches for equity provision to technology developers, and on guarantee mechanisms for project developers. Some innovative instruments such as guarantees and mezzanine funds can have a significant multiplier effect as they contribute to cover technical and political risks. From the perspective of debt and equity providers, there is no one-size-fits-all option, but rather a mix of instruments that will be appropriate all option, but rather a mix of instruments that will be appropriate to specific levels of maturity of technologies or projects, and to various country-specific contexts.
Capital availability is influenced by a number of factors
Focusing on debt, our survey indicated that factors included:
► Capacity of banks to lend long-term to the renewable energy sector
► Ability of banks to recycle that loan capital through secondary loan markets to other long-term institutional lenders such as pension funds, insurance funds or other capital markets
► Impact of bank regulations on asset-liability mismatches
Due to the factors above, European banks have had to limit their lending to their core relationship clients and to increase their selectiveness in terms of geographies, for example by concentrating on home markets. It is also expected that the ‘Basel 3’ banking regulations, which will govern the capital and liquidity buffers banks carry, will also lead to more cautious lending policies from the banks. Although renewable energy project finance activity has increased in 2010, with a renewed appetite to pursue active lending to the renewable energy sector, the risk of not reaching the 2020 RES directive targets cannot be ruled out –due to a shortage of capital.
7

Multilateral banks, EU institutions and Structural funds have supported the renewable energy market
As a result of the financial crisis from mid-2008 onwards, multilateral banks (such as the European Investment Bank - EIB) have filled a void on the project finance market and significantly increased their involvement in supporting RES projects. As an example, the EIB’s loans to the RES sector reached over €4b in 2009.
In addition to the EIB’s investment activity, financial support from EU institutions also comes from:
► The European Regional Development Fund (ERDF) and the Cohesion Fund (the Structural Funds) which have allocated €4.7b to renewable projects for the 2007-13 period, i.e., an annual budget of €0.7b (EU-wide).
► The EU Economic Recovery Plan, which from May 2009, dedicates €565m to offshore wind.
In addition to grants, Structural Funds can also provide other forms of financing such as equity investments, loans, guarantees or a combination of them. Financial engineering instruments have acquired a new emphasis in the current programming period. Focused on enterprise (primarily SMEs) and urban development, including renewable energy and energy-efficiency development, including renewable energy and energy-efficiency investments, examples include :
► The JESSICA initiative – designed to support investment in sustainable urban development and regeneration, including renewable energyand related infrastructures.
► ELENA– managed by EIB and funded by EC budget. It covers up to 90% of the costs associated with technical assistance for preparing large sustainable energy investment programs in cities and regions.
Key conditions to improve the sector’s access to finance: stability, coordination and transparency
The realization of the EU targets for renewable energy asks for a huge investment. In a context where the scarcity of capital could increase in the coming years, Member States have the opportunity to reduce the absolute need for capital in various ways. The first step is to remove the non-economic barriers that are still prohibiting an accelerated deployment of RES. This will potentially reduce the investment needed during the project development phase in particular, which is reflected in the project cost at financial close. The non-economic barriers concern administrative deficiencies that are encountered during project development (permitting, grid access), but also deficiencies in the design of the support scheme. Financial attractiveness remains strongly subordinated to long-term visibility and appropriateness of support schemes for RES development.
Renewable energy country attractiveness indices Issue 28
Our study identified the following recommendations:
► Pursue the support of renewable energy infrastructure development. Technologies such as offshore wind and solar CSP in particular often require important infrastructure development. Generally grid infrastructure development is a key element to enable the financing of renewable energy projects in order to improve project economics, allow connection within a reasonable time-frame, and in some cases to export the electricity generated.
► Enhance the use of the cooperation mechanisms as defined in the RES Directive. An intensified cooperation between Member States would potentially reduce the need for capital at the European level and also appear beneficial with respect to the corresponding support expenditures. Several governments are currently studying the possibilities to implement Articles 6 (statistical transfers) and 9 (joint projects) of the Directive.
► The introduction of new policy instruments should be assessed from the viewpoint of financiers, in balance with the viewpoint of consumers/taxpayers. Thereby, an alignment of financial support conditions for the individual RES technologies between the countries is recommended to increase the cost-efficiency of RES support at the European increase the cost-efficiency of RES support at the European level, for example via the establishment of a European working group on the coordination of RES support (or RES tariffs).
► Risk assessment tools and ratings should be developed for renewable energy technologies. In cooperation with the financial sector, this would offer an independent opinion on the likelihood of a project’s ability to deliver the expected returns, and thus increase a developer’s ability to attract investment. It would also correct for undesired finance gaps for certain technologies, and would encourage a more rapid commercial-scale deployment of emerging technologies.
► The promotion of advanced and/or innovative forms of public private partnerships (PPP): government participation, loans and loan guarantees; dedicated support based on “open book” procedures; new types of insurance. For large-scale projects, with significant technological, regulatory or market risks, government involvement may help to raise finance at a lower cost of capital.
8
Contact:Alexis GazzoTel: + 33 1 46 93 63 98Email: [email protected]
M&A activity
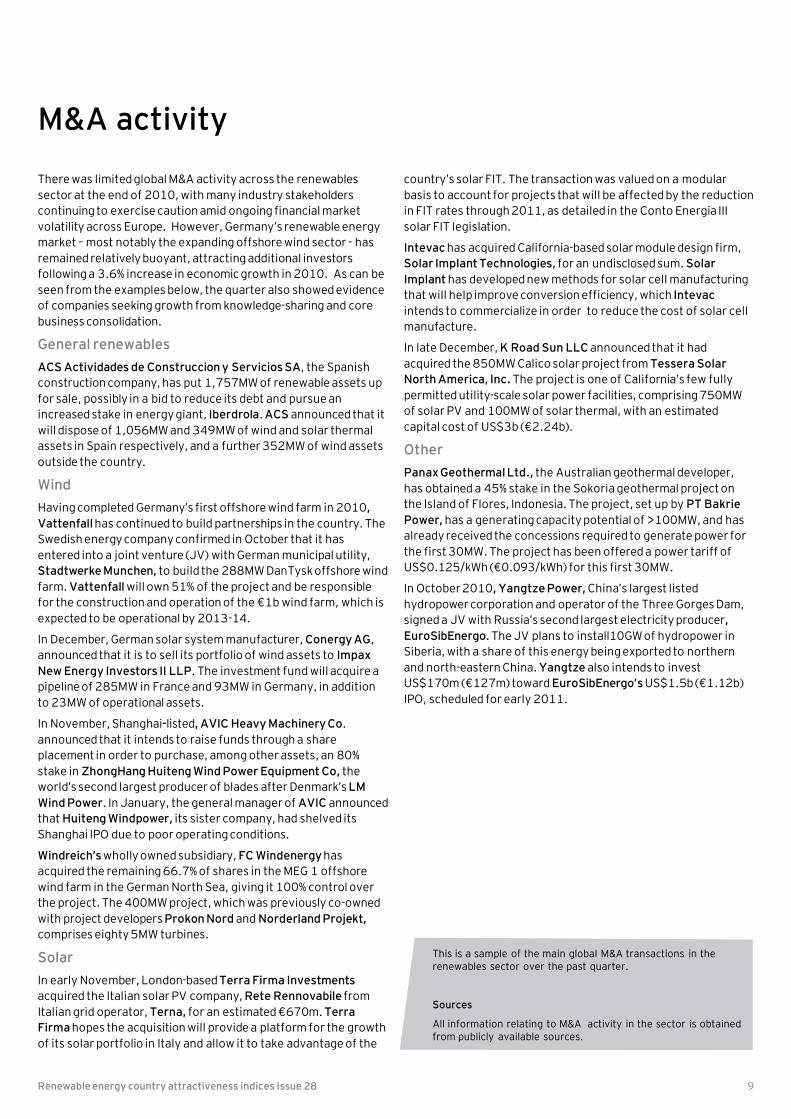
There was limited global M&A activity across the renewablessector at the end of 2010, with many industry stakeholders continuing to exercise caution amid ongoing financial market volatility across Europe. However, Germany’s renewable energy market – most notably the expanding offshore wind sector - has remained relatively buoyant, attracting additional investors following a 3.6% increase in economic growth in 2010. As can be seen from the examples below, the quarter also showed evidence of companies seeking growth from knowledge-sharing and core business consolidation.
General renewablesACS Actividades de Construccion y Servicios SA, the Spanish construction company, has put 1,757MW of renewable assets up for sale, possibly in a bid to reduce its debt and pursue an increased stake in energy giant, Iberdrola. ACS announced that it will dispose of 1,056MW and 349MW of wind and solar thermal assets in Spain respectively, and a further 352MW of wind assets outside the country.
WindHaving completed Germany’s first offshore wind farm in 2010, Vattenfallhas continued to build partnerships in the country. The Swedish energy company confirmed in October that it has entered into a joint venture (JV) with German municipal utility, entered into a joint venture (JV) with German municipal utility, Stadtwerke Munchen, to build the 288MW DanTysk offshore wind farm. Vattenfall will own 51% of the project and be responsible for the construction and operation of the €1b wind farm, which is expected to be operational by 2013-14.
In December, German solar system manufacturer, ConergyAG, announced that it is to sell its portfolio of wind assets to Impax New Energy Investors II LLP. The investment fund will acquire a pipeline of 285MW in France and 93MW in Germany, in addition to 23MW of operational assets.
In November, Shanghai-listed, AVIC Heavy Machinery Co. announced that it intends to raise funds through a share placement in order to purchase, among other assets, an 80% stake in ZhongHang Huiteng Wind Power Equipment Co, the world’s second largest producer of blades after Denmark’s LM Wind Power. In January, the general manager of AVIC announced that Huiteng Windpower, its sister company, had shelved its Shanghai IPO due to poor operating conditions.
Windreich’swholly owned subsidiary, FC Windenergy has acquired the remaining 66.7% of shares in the MEG 1 offshore wind farm in the German North Sea, giving it 100% control over the project. The 400MW project, which was previously co-owned with project developers Prokon Nord and Norderland Projekt, comprises eighty 5MW turbines.
SolarIn early November, London-based Terra Firma Investments acquired the Italian solar PV company, Rete Rennovabile from Italian grid operator, Terna, for an estimated €670m. Terra Firmahopes the acquisition will provide a platform for the growth of its solar portfolio in Italy and allow it to take advantage of the
Renewable energy country attractiveness indices Issue 28
country’s solar FIT. The transaction was valued on a modular basis to account for projects that will be affected by the reduction in FIT rates through 2011, as detailed in the Conto Energia III solar FIT legislation.
Intevac has acquired California-based solar module design firm, Solar Implant Technologies, for an undisclosed sum. Solar Implant has developed new methods for solar cell manufacturing that will help improve conversion efficiency, which Intevacintends to commercialize in order to reduce the cost of solar cell manufacture.
In late December, K Road Sun LLC announced that it had acquired the 850MW Calico solar project from Tessera Solar North America, Inc. The project is one of California’s few fully permitted utility-scale solar power facilities, comprising 750MW of solar PV and 100MW of solar thermal, with an estimated capital cost of US$3b (€2.24b).
OtherPanax Geothermal Ltd., the Australian geothermal developer, has obtained a 45% stake in the Sokoria geothermal project on the Island of Flores, Indonesia. The project, set up by PT Bakrie Power, has a generating capacity potential of >100MW, and has already received the concessions required to generate power for the first 30MW. The project has been offered a power tariff of US$0.125/kWh (€0.093/kWh) for this first 30MW.US$0.125/kWh (€0.093/kWh) for this first 30MW.
In October 2010, Yangtze Power, China’s largest listed hydropower corporation and operator of the Three Gorges Dam, signed a JV with Russia’s second largest electricity producer, EuroSibEnergo. The JV plans to install10GW of hydropower in Siberia, with a share of this energy being exported to northern and north-eastern China. Yangtze also intends to invest US$170m (€127m) toward EuroSibEnergo’sUS$1.5b (€1.12b) IPO, scheduled for early 2011.
9
This is a sample of the main global M&A transactions in the renewables sector over the past quarter.
Sources
All information relating to M&A activity in the sector is obtained from publicly available sources.
IPO activity
IPO activity at the end of 2010 struggled to gather pace, resulting in numerous examples of postponed offerings and disappointing debuts. This was most noticeable in China, where investors appear to be exercising caution amid concerns China will implement measures to resolve growing currency pressures and curb inflation as a result of accelerated economic growth.
In the renewable energy sector, falling stock prices have been attributed to concerns that growth in the Chinese wind market will slow over the coming months as the industry starts to mature, with domestic turbine manufacturers facing increased competition from local and overseas rivals in what is already considered by some to be a relatively saturated market. In mid-February, the benchmark Hang Seng Index had dropped 5.9% from a twelve-month high on 8 November 2010.
General renewablesIssue 27 of the CAI highlighted the planned €1b IPO of Huaneug Renewables Corp’s as being one of the largest of the year. In light of the concerns above, however, Huaneng announced in December that it has postponed its IPO on the Hong Kong Stock Exchange due to “the change in market conditions and recent unexpected and excessive market volatility.”
This stagnation in investor appetite was also apparent in mid-December, with the disappointing debut of China Datang Corp’s renewable power division, also featured in Issue 27 of the CAI. renewable power division, also featured in Issue 27 of the CAI. Shares in China Datang Corp Renewable Power fell 6.9% to HK$2.17 (€0.21) per share on its first day of trading, and the company only managed to raise HK$4.9b (€0.47b) of the planned HK$7.7b (€0.74b) reported in Issue 27. Some commentators have suggested that the decline in Datang Renewable’s stock can also be attributed to the fact that many of its wind farms are in remote parts of China with weak grid capacity, highlighting a more general investor concern that a large number of wind farms are still not connected to the grid.
WindThe beginning of 2011 does not appear to have fared much better, with the first major Chinese listing of the year, Sinovel Wind Group Co. falling on its first day of trading. Sinovel, a leading Chinese wind turbine maker, raised RMB9.5b (€1.07b) on Shanghai’s stock exchange at an offer price of RMB90 (€10.14) per share. However, the stock fell 8.9% on its debut, fuelingspeculation that the shares may have been overvalued, in light of increasing competition for clean-energy products and uncertainty as to whether the Chinese wind sector can sustain the rapid growth seen in the past year.
In December, Titan Wind Energy Suzhou listed on the Shenzhen Stock Exchange via an IPO that raised CNY1.3b (€0.15b). The Chinese wind turbine tower manufacturer will use the revenue from the listing to invest in an offshore wind tower manufacturing plant, a technology upgrading program and a R&D center.
Renewable energy country attractiveness indices Issue 28
SolarTrony Solar, the largest amorphous thin film solar cell manufacturer in China, raised HKD1.73b (€0.17b) following its November listing on the Hong Kong Stock Exchange. The company plans to use 70% of the capital raised to expand capacity, with the remainder of the balance used to repay shareholder loans and to provide working capital.
Green bondsUtilization of green bonds has started to gather pace, with SunPower Corp, the US solar PV module manufacturer completing the world’s first publicly rated bond sale for a solar PV project via two €97.6m tranches. The €195.2m issue will help finance SunPower’s72MW Montalto Di Castro project in Italy, which is now complete and connected to the local grid. The fixed-rate 18-year bonds will pay 5.175% and 4.839%, with Moody’s rating the bonds at Aa2 and Baa3 grade respectively. It is hoped that the transaction will begin a trend which opens up a new global-scale pool of capital to fund renewables projects beyond traditional project financing from banks.
10
This is a sample of the main global IPO transactions in the renewables sector over the past quarter.
Sources
All information relating to IPO activity in the sector is obtained from publicly available sources.

Rank1 CountryAll
renewablesWind index
Onshorewind
Offshorewind
1 (1) China 71 76 78 692 (2) USA3 67 67 70 563 (3) Germany 63 66 63 743 (3) India 63 64 71 425 (5) UK 62 68 64 795 (6) Italy 62 62 65 547 (7) France 58 60 62 578 (8) Spain 55 56 60 429 (9) Canada 54 60 65 46
10 (10) Portugal 52 55 59 4211 (11) Ireland 50 57 57 5711 (12) Sweden 50 54 54 5311 (12) Greece 50 52 56 4114 (12) Australia 49 49 53 4015 (15) Japan 48 48 50 4116 (16) Poland 47 53 56 4216 (18) Brazil 47 48 53 3518 (16) Netherlands 46 52 51 5518 (18) Belgium 46 52 50 5818 (18) South Korea 46 47 46 5121 (21) Denmark 44 47 44 5621 (22) Egypt 44 45 49 3623 (22) Romania 43 46 49 3823 (22) Norway 43 47 48 4525 (25) Mexico 42 43 43 4125 (25) New Zealand 42 47 51 3627 (28) Turkey 41 43 46 35
All renewables index at February 2011
Renewable energy country attractiveness indices Issue 28
27 (28) Turkey 41 43 46 3527 (27) South Africa 41 43 46 3529 (30) Finland 39 41 43 3629 (28) Austria4 39 36 45 0
Having continuously climbed the All renewables index in recent Issues, China is a non-mover in Issue 28 amid concerns that its wind and solar supply chain may be unevenly balanced and unable to support the rapid growth experienced by both sectors in the past year. There are also reports of unconnected wind capacity.
The US, meanwhile, has finally reversed its downward trend of recent issues and has risen a point in the All renewables index following the Government's decision to extend the 1603 Treasury Grant Program through to the end of 2011. The news is a sign that the US Administration is prepared to take necessary steps to boost renewable energy development, even if it does come at the eleventh hour. However, there is still some longer-term uncertainty.
It was also announced in Q4 that the ban imposed in May 2010 preventing California utilities from trading “unbundled” RECs has been reversed, creating a tradable market around California’s renewable obligations. It seems, however, that US biomass developers were the biggest losers in recent months, given the Environment Protection Agency (EPA) announcement of a three-year delay on a decision regarding the regulation of CO2 emissions from biomass-fired power plants.
Notes:1. Ranking in Issue 27 is shown in brackets.2. Combines with each set of technology factors to produce the individual technology indices.3. This indicates US states with RPS and favorable renewable energy regimes.4. Technology weightings have been adjusted for landlocked countries to reflect the lack of offshore potential.
Offshore Solar index Solar PV
Solar CSP
Biomass/other
Geo-thermal
Infra-structure2
60 67 40 59 51 7772 71 75 61 67 6154 65 0 63 54 6268 70 64 59 45 6540 54 0 59 38 7165 68 60 56 65 6851 60 24 59 36 6263 61 68 50 33 5534 46 0 49 34 6249 58 22 46 33 5726 35 0 48 27 5932 44 0 55 34 5354 59 41 41 32 5253 55 46 45 59 5154 64 27 39 43 5732 43 0 42 23 4742 46 30 50 22 4733 45 0 39 21 4231 42 0 39 28 5246 53 28 41 35 4329 40 0 45 32 5145 45 45 38 27 4232 44 0 43 38 4322 30 0 44 30 4845 46 39 38 54 3824 32 0 34 51 4539 43 29 36 43 43
index at February 2011
11
39 43 29 36 43 4338 35 46 35 32 4320 27 0 50 24 4040 54 0 48 34 51
India is a non-mover in the All renewables index but did see positive movements in the technology-specific indices. The end of 2010 saw positive news for the solar industry in respect of funding and the introduction of solar-specific energy purchase obligations. The country’s wave and tidal sector also received a boost, with Atlantis Resources Corp.planning to construct a 250MW commercial tidal-current power plant. It will be the first of its kind in Asia and will receive FITs from the state.
Italy has risen a point and now ranks joint fifth with the UK. This reflects the major surge in PV installations in Q4 of 2010, and the EIB’s €600m package awarded to Enel Green Power SpA to fund its 840MW renewable energy plan to develop wind and solar projects across Italy.
Spain’s Government finally bit the bullet and voted to cut PV solar subsidies by 45% for large ground-mounted installations (though smaller-scale rooftop fared better with only a 5% reduction). This was in a bid to reduce the €15m tariff deficit and slow down growth in the sector. It followed announcements earlier in the quarter that support would also be reduced for wind and CSP developments. As a result, Spain has fallen one point in the All renewables index.
Source: Ernst & Young analysis
Combines with each set of technology factors to produce the individual technology indices.This indicates US states with RPS and favorable renewable energy regimes.Technology weightings have been adjusted for landlocked countries to reflect the lack of offshore potential.

All renewables index at February 2011 (cont’d)
Portugal increased one point in the biomass/other index to reflect the Government’s signing of a contract with Redes Energéticas Nacionais allowing the potential development of 250MW of wave energy capacity by 2020, requiring an investment of €500m.
Ireland’s €86b funding bailout has led to a one point fall in the All renewables index amid fears that the financial crisis could have a detrimental impact on the financing of renewable energyprojects. The national elections proposed for early 2011 are also likely to postpone renewable energy project decisions until at least the end of the first quarter.
Australia has fallen a point in the All renewables index amid reports that the new Government’s policies could lead to severe restrictions on the construction of wind farms, with as many as 50%-70% of proposed wind farms expected to be lost. Data for 2010 also suggests that electricity output from new wind and solar power plants dropped almost 80% last year as projects struggled to arrange financing. A total of 221MW was added to the grid in 2010 compared with 993MW in 2009.
Australia’s Government also announced in Q4 that the scale-back of the federal Solar Credit scheme for households will take effect from 1 July 2011, a year earlier than scheduled. However, there was some good news, with planning approval being awarded for the US$1b (€0.75b) Stockyard Hill Wind Farm (471MW), one of Australia’s largest renewable energy developments.Australia’s largest renewable energy developments.
New Zealand's geothermal score received a boost following the approval awarded to Contact Energy in respect of the Tauhara 2 project in the central North Island, which will have a generating capacity of approximately 250MW.
Renewable energy country attractiveness indices Issue 28
index at February 2011 (cont’d)
Brazil has risen one point and now ranks 16th in the All renewables index. The country’s new 10-year energy plan, announced in November, pledges that no more fossil fuel power plants will be built after 2014. Authorities expect to add an additional 3GW of renewable capacity to the grid in the next two years, having already connected an estimated 4GW in 2010 .
The Netherlands has fallen two places following the announcement that, in a bid to save €3b, the new Dutch Government will cut subsidies for most renewable technologies, and potentially exclude offshore wind, solar and biomass altogether. A new system to be introduced mid-2011, reported to be more complex, will allocate subsidies in four phases on a first-come-first-served basis as opposed to fixed-period subsidies based on the difference between the cost of renewable energy and conventional electricity. It is also likely that procedures to obtain subsidies will be tightened under the new system.
Egypt has risen one place in the All renewables index to reflect the Energy Minister’s wind power “master plan” to secure 2.6GW of power in 2011 alone. Egypt is also due to receive a €540m support package from the EIB for priority electricity generation and transmission investment across the country. It is not yet clear what effect the current political unrest is likely to have on the country’s renewable energy sector, therefore this is not reflected in Egypt's score at present. reflected in Egypt's score at present.
Turkey has risen one point following the long-awaited approval by the Turkish Parliament of amendments to the Renewable Law, introducing differentiated tariffs across the various technologies from the previous flat rate tariff of around €0.05/kWh. Additional premiums will also be awarded to reflect developers’ utilization of the domestic supply chain.
12

Rank1 Country Wind index1 (1) China 762 (2) UK 683 (3) USA2 674 (3) Germany 665 (5) India 646 (6) Italy 627 (7) France 607 (7) Canada 609 (9) Ireland 57
10 (10) Spain 5611 (11) Portugal 5512 (12) Sweden 5413 (14) Poland 5314 (14) Belgium 5214 (13) Netherlands 5214 (14) Greece 5217 (17) Australia 4918 (19) Brazil 4818 (18) Japan 4820 (19) Norway 4720 (19) South Korea 4720 (19) New Zealand 4720 (19) Denmark 4724 (24) Romania 4625 (25) Egypt 4526 (26) South Africa 4326 (28) Turkey 4326 (26) Mexico 43
Wind indices at February 2011
Renewable energy country attractiveness indices Issue 28
26 (26) Mexico 4329 (29) Finland 4130 (30) Austria 36
China has decreased one point in the wind index. The wind sector has continued to show strong growth and, in Q4, the country’s first wind-power deal financed entirely through international bank syndication raised US$140m (€104.5m) for a 201MW facility, indicating the potential for global investors to participate in China’s rapidly growing renewable energy market. However, a report by CCID Consulting suggests the supply chain is challenged by a combination of bottlenecks from weak R&D capacity and limited grid capacity. It is likely China will need to address these issues in order to sustain its current growth trends and to prevent stalling while the supply chain catches up.
Spain has dropped a point in the onshore wind index. In late November, Spain approved cuts of 35% to wind power subsidies between now and 2013, in a bid to save €1.1b. The technology will also face limits on the number of hours it can earn subsidized rates. While in the same period, the Spanish Government assigned development rights for 796MW of new wind farm concessions, this is likely to be dampened by the subsidy cuts.
Meanwhile, the German financing community has given the BorkumWest II offshore wind (200MW) a boost, providing developer, Trianelwith the required €550m investment via a
Notes:1. Ranking in Issue 27 is shown in brackets.2. This indicates US states with RPS and favorable renewable energy regimes.
Onshore wind Offshore wind Near-term wind78 69 8664 79 5270 56 7563 74 4671 42 5365 54 4662 57 4765 46 4857 57 4160 42 4559 42 3854 53 3656 42 4050 58 3851 55 3756 41 4053 40 4053 35 3750 41 2648 45 3346 51 3051 36 3244 56 2749 38 3649 36 3046 35 3646 35 3243 41 31
Wind indices at February 2011
13
43 41 3143 36 3045 0 30
project financing deal, the first such transaction for the Germany offshore industry. This indicates the strong financing potential for future projects and has been awarded a one point increase for offshore wind.
The US also saw positive signs in respect of funding for wind projects in Q4, increasing its wind score by one point. Caithness Energy LLC closed a US$1.3b (€0.97b) loan carrying an 80% guarantee from the Department of Energy for its 845MW Shepherds Flat wind farm in Oregon. In the same period, Western Wind Corp. completed a US$240m (€179m) financing deal for its 120MW Windstar project based on preferential funding terms.
Completing the trend, CEZ has secured a 17-year €200m loan from the EIB to co-finance construction of the 347MW Fântânele-Cogealac wind farm in Romania, resulting in a one point increase in the wind index.
Austria remains at the bottom of the wind indices following the release of 2010 installed capacity data by the European Wind Energy Association (EWEA). The figures indicate that Austria installed only 16MW of new wind capacity in 2010, while the Netherlands also had a weak year, with only 15MW installed.
Source: Ernst & Young analysis
This indicates US states with RPS and favorable renewable energy regimes.

Near-term wind index at February 2011
Rank1 Country Wind index1 (1) China 862 (2) USA2 753 (3) India 534 (4) UK 525 (5) Canada 486 (6) France 477 (7) Germany 467 (7) Italy 469 (7) Spain 45
10 (10) Ireland 4111 (11) Greece 4011 (11) Poland 4011 (11) Australia 4014 (14) Portugal 3814 (15) Belgium 3816 (15) Brazil 3716 (15) Netherlands 3718 (18) Sweden 3618 (18) South Africa 3618 (18) Romania 3621 (21) Norway 3322 (22) Turkey 3222 (22) New Zealand 3224 (24) Mexico 3124 (24) Mexico 3125 (26) South Korea 3025 (26) Finland 3025 (24) Austria 3025 (26) Egypt 3029 (29) Denmark 2730 (30) Japan 26
Renewable energy country attractiveness indices Issue 28
Notes: Source: Ernst & Young analysis1. Ranking in Issue 27 is in brackets.2. This indicates US states with RPS and favorable renewable energy
regimes.
term wind index at February 2011
In Q4, China completed the first phase of the Jiuquan wind project, connecting around 1.15GW to the grid. More than 3,500 turbines have been erected, with a total installed capacity of 5.16GW, making it the country’s largest wind project to date. Several other wind projects were also approved in the period, including Nindong Wind Power’s 49.5MW, filed in Ningxia Province; Huadin Power’s 248MW to be installed across various sites; China Ming Yang Wind Power Group’s 200MW government-authorized project in the Hami area; and China Wind Power International Corp.’s five-phase 550MW project in Heilongjiang province, with the first 50MW phase already connected.
In the US, the extension of the 1603 Treasury Grant Program is likely to spur the development of a number of wind projects which were previously stalled awaiting a decision. However, given the uncertainty around the initiative post-2011 and the “eleventh hour” decision, any surge in wind development is likely to be in the short term only unless the US Government announces a more long-term commitment to renewable energy support in the next 12 months.
Belgium’s Thornton Bank offshore wind farm is to be expanded via a €1.3b project finance investment. This represents the world’s biggest project finance deal for an offshore wind project and indicates that the financing community have confidence in the growth potential of the industry. In December, Vestasthe growth potential of the industry. In December, Vestasinaugurated the Bligh Bank Offshore Wind Farm off the coast of Belgium; the 165MW wind farm represents the country’s largest clean energy project to date.
Following the launch of Egypt’s wind “master plan,” including the ambition to secure 2.6GW in 2011, it is reported that the government has secured funding for “several” 540MW wind farms in the Gulf of Suez, including arrangements with the EIB, German Development Bank, and the Governments of Spain and Japan. It has also been announced that the Government will issue a private sector tender for a 1.37GW wind farm on a build-operate-transfer basis.
New data indicates Poland’s wind market saw particularly strong growth in the first three quarters of 2010. Wind farm applications represented around 16GW of capacity, a 5GW increase on the same period in 2009. Installed capacity has risen more than 50% year-on-year and market growth appears to have led to supply chain development and increased investment in indigenous manufacturing capacity. Recent statistics from EWEA for 2010 indicate 382MW was installed, compared with 180MW in 2009.
14

Rank1 Country Solar index1 (1) USA 722 (2) India 683 (3) Italy 654 (4) Spain 635 (5) China 606 (6) Greece 546 (7) Japan 546 (7) Germany 549 (7) Australia 53
10 (10) France 5111 (11) Portugal 4912 (12) South Korea 4613 (14) Egypt 4513 (13) Mexico 4515 (15) Brazil 4216 (16) UK 4016 (16) Austria 4018 (18) Turkey 3919 (19) South Africa 3820 (20) Canada 3421 (20) Netherlands 3322 (22) Romania 3222 (22) Sweden 3222 (22) Poland 3225 (25) Belgium 3126 (26) Denmark 2927 (27) Ireland 2628 (28) New Zealand 24
Solar indices at February 2011
Renewable energy country attractiveness indices Issue 28
28 (28) New Zealand 2429 (29) Norway 2230 (30) Finland 20
Spain has decreased a point in the solar index following confirmation of the expected cut in premiums for future projects and the capping of FIT payments to a 25-year period. In December, however, the Government unexpectedly announced measures which would also retroactively limit the number of hours per annum that solar developers can claim above-market rates, equivalent to a 30% revenue reduction over the next three years. The subsidization period will be extended to 28 years for existing plants as compensation. The retroactive measures have been described as “illegal” by some industry groups, and legal action is already being taken. As part of the measures to reduce the subsidy deficit, Spain has also announced it will reduce support for CSP plants in their first year of operation.
Italy, meanwhile, experienced a major PV surge in Q4 2010, installing 975MW, taking total installed capacity to 3GW, despite the tariff cuts in previous months. Market analysts suggest the high return for solar projects in Italy and the decision to phase in subsidy cuts could result in another doubling of the market in 2011.
Notes:1. Ranking in Issue 27 is shown in brackets.2. This indicates US states with RPS and favorable renewable energy regimes.
Solar index Solar PV Solar CSP72 71 7568 70 6465 68 6063 61 6860 67 4054 59 4154 64 2754 65 053 55 4651 60 2449 58 2246 53 2845 45 4545 46 3942 46 3040 54 040 54 039 43 2938 35 4634 46 033 45 032 44 032 44 032 43 031 42 029 40 026 35 024 32 0
Solar indices at February 2011
15
24 32 022 30 020 27 0
France has suspended subsidies for solar for a three-month period for non-residential installations over 3kW while it studies the rules around the potential for further subsidy cuts (in addition to the two cuts in 2010) and measures to limit growth in the sector, following a surge of developments in 2010. As a result, it has decreased a point in the solar index.
Greece has also fallen a point, as only 80MW of the 2.8GW worth of solar PV licenses issued through to October 2010 were connected to the grid due to financing barriers, with small-scale projects securing the majority of loans awarded to the sector.
India has amended its renewable portfolio obligation (RPO) policy to require power distribution companies to purchase at least 0.25% of solar-generated electricity. This will be supported by the introduction of a solar-specific tradable REC mechanism. India’s solar sector is also benefiting from increased financial support, contributing to a one point increase in the solar index.
South Africa has presented its plans for the world’s biggest solar park to potential investors. The Government hopes the US$21.4b (€16b) project will reach 1GW as early as 2012, and 5GW in the next ten years, comprising mainly CSP technology.
Source: Ernst & Young analysis
This indicates US states with RPS and favorable renewable energy regimes.

Country focus – China
GeneralRenewable energy development in China remains high; however, there are concerns that the exponential growth witnessed in recent years could be impacted by the wider macroeconomic environment in 2011. A reduction in the number and relative success of Chinese company IPOs toward the end of 2010 is an indication that investors are proceeding with more caution, as the Government considers measures to address potentially unsustainable growth rates and stabilize inflation.
WindDespite these concerns, China’s onshore wind sector continues to demonstrate strong growth, with a series of positive developments in the last quarter. The most significant of these was the completion of the first phase of the Jiuquan wind project.
Ranking Issue 28 Issue 27
All renewables index 1 1
Long-term wind index 1 1
Near-term wind index 1 1
Solar index 5 5
Investors proceed with more caution
Source: Ernst & Young analysis
was the completion of the first phase of the Jiuquan wind project. The country’s largest wind project has an installed capacity of 5.16GW, with 1.15GW now connected to the grid. Other notable developments include the approval awarded to Huadian Power to construct 247.5MW of wind assets, and China Wind Power Corp’s plan to develop 550MW of wind power assets after receiving a US$21.1m (€15.75m) construction loan from the Agricultural Development Bank of China.
However, these ongoing positive developments are balanced against concerns that the industry’s supply chain could hinder continued market growth at the pace experienced in recent years. According to a research report released by Chinese consultancy firm, CCID Consulting, in October 2010, the upper end of the supply chain is challenged by bottlenecks in R&D capability and small-scale equipment production, while the lower end is constrained by a lack of grid capacity. As China seeks to strengthen its domestic renewable energy production market, these supply chain issues will need to be addressed if growth is to be maintained in the sector.
In January, China and the US signed cooperation agreements on a wide range of energy initiatives, including a joint investment of US$1b (€0.75b) by UPC Renewables and Guodian to develop 1GW of wind power. This is seen as a positive sign for the wind industry as a whole, as the US seeks to learn from China’s unique ability to rollout projects at scale.
Renewable energy country attractiveness indices Issue 28
Q4 saw China’s first wind power deal financed entirely through international bank syndication, indicating strong potential for the future financing of Chinese renewables projects by global investors and increased access to diversified forms of capital away from traditional project finance. The International Finance Corporation (IFC) has raised a US$140m (€104.5m) debt facility for China WindPower Group’s 201MW wind farm in Northern China. The deal comprises a US$45m (€33.6m) loan from the IFC, and an additional US$95m (€70.9m) syndicated bank loan.
SolarShares in Chinese solar power companies temporarily soared in December following news that the Chinese Government will introduce subsidies to stimulate increased growth in the sector. The subsidies will account for half of the bidding contract prices for key solar equipment. China plans to have an installed capacity of 20GW of solar power by 2020, compared with 600MW at the end of 2010. The Government will also create 13 industry zones for demonstrations of solar energy application, in a bid to facilitate deployment of solar energy at the scale required to meet this target.
While China’s solar industry is arguably still in its infancy, CCID Consulting’s October report suggests that growth may already be impeded by an unevenly balanced supply chain. According to CCID, polysilicon production is below the required capacity and is CCID, polysilicon production is below the required capacity and is over-reliant on imports, while 95% of the solar batteries produced in the middle stage of the supply chain are exported. Meanwhile, production of PV components at the lower end of the supply chain is challenged by over-capacity and lower profit margins due to insufficient investment and low technical content.
Despite supply chain barriers, solar projects in China are still being realized. In early December, Suntech Power Holdings Co, the Chinese solar panel manufacturer, entered into a joint venture with two state-owned companies to develop a 1.2GW solar farm in Jiangsu province. Suntech will invest US$60m (€44.8m) for a 40% stake in the project. The first 600MW of the US$150m (€112m) plant is expected to be completed by mid-2011.
16
Contact:Ivan TongTel: + 86 10 58153373Email: [email protected]
Ben WarrenTel: + 44 (0)20 7951 6024Email: [email protected]
Country focus – US
PolicyThe US Congress ended months of uncertainty when, in late December, it announced the results of its long-awaited decision on the extension of the 1603 Treasury Grant Scheme for renewable energy. The passing of the tax bill in December, which extends the scheme for another year through to 31 December 2011, has re-ignited confidence among developers who had been rushing to complete projects before the original expiry date, or had postponed projects altogether amid speculation that extension of the scheme would not be approved. The Grant provides commercial installations with a cash grant in lieu of the 30% investment tax credit.
The approved tax bill also expanded depreciation incentives for some commercial renewable projects, providing greater up-front cost savings for renewable energy developers. Instead of
Ranking Issue 28 Issue 27
All renewables index 2 2
Long-term wind index 31 31
Near-term wind index 2 2
Solar index 1 1
Positive short-term decisions for energy sector
1 Joint Source: Ernst & Young analysis
cost savings for renewable energy developers. Instead of depreciating the installation over its typical economic life, the total cost of the project can now be depreciated in the same year it becomes operational, reducing taxable profits in that first year. For projects commissioned during 2012, the first-year bonus depreciation is stepped back down to 50% of the project cost.
There was also good news for energy developers in California in Q4 following the announcement by the California Public Utilities Commission that it has overturned a ban (initiated in May 2010) that prohibited the trade of RECs separately from the power associated with the credits. However, utilities can only use “unbundled” RECs to meet 25% of their renewable energy obligations.
Onshore windThe onshore wind market received a confidence boost from the investment community at the end of 2010, attracting significant financing and favorable terms. In mid-December, Caithness Energyclosed a US$1.3b (€0.97b) loan for the 845MW Shepherds Flat wind project in Oregon, carrying an 80% guarantee from the Department of Energy (DOE). Western Wind Energy Corp also cemented financing for its 120MW project in California, including a low interest loan for CAD179m (€132.9m) and CAD15m (€11.14m) of non-interest bearing vendor funding.
Renewable energy country attractiveness indices Issue 28
Offshore windThe Cape Wind initiative, which is designed to bring 468MW of wind power off the coast of Massachusetts, received its finalpermit from the Environmental Protection Agency (EPA) in early January 2011. Construction can now begin on the first offshore wind farm in the US, expected to cost in the region of US$1b (€0.75b).
SolarProject developer, Sempra Generation, has completed construction of the largest solar PV plant in the US. The 48MW Copper Mountain solar PV plant in Nevada was connected to the grid in early December.
In November, NRG Energy announced that it plans to launch construction of its 250MW California Valley Solar PV Ranch in mid-2011. NRG is assuming all operational and financial responsibility, investing US$450m (€335.9m) of equity into the project, while SunPower Corp will be responsible for the design, build and operation for the facility. At the start of 2011, SunPower also signed PPAs with utility, Southern California Edison, to deliver 711MW of new capacity, spread across three projects expected to come on line in 2014-16.
These developments represent a significant addition to generating capacity given the cumulative thermal and PV solar generating capacity given the cumulative thermal and PV solar capacity in the US at the end of 2009 was 1.7GW.However, the US solar PV market still remains in its infancy despite the favorable irradiation levels, especially when compared with Germany, which installed around 7GW in 2010 alone.
The growth of solar thermal continues to gather pace with the expansion of the DOE’s loan guarantee program. In December, it guaranteed a US$1.45b (€1.08b) loan for the construction of a 250MW CSP installation in Arizona by Spain’s Abengoa.
BiomassAt the beginning of January, the EPA announced a three-year delay for the decision on regulating carbon dioxide emissions from biomass-fired power plants, creating continued uncertainty for biomass developers, who have already begun to cancel projects.
17
Contact:Michael BernierTel: + 617 585 0322Email: [email protected]
Dorian HuntTel: + 617 585 2448Email: [email protected]

Country focus – Germany
PolicyAs expected, the FIT for solar PV was reduced on 1 January 2011, with the next wave of cuts originally scheduled for the beginning of 2012. However, at the end of January 2011, the Environment Ministry and the solar power industry reached a provisional agreement for a new tariff structure in a bid to slow the installation rate in a more sustainable way and to avoid introducing a fixed cap on the amount of money spent on new solar installations. The solar industry has argued that a fixed cap could actually impede a reduction in capital costs as competitive forces are limited.
The revised tariff structure introduces a flexible adjustment to financial support from July 2011 onwards, six months earlier than planned. If more than 3.5GW of installations are forecast for this year, determined by the number of projects connected to the
Ranking Issue 28 Issue 27
All renewables index 3 31
Long-term wind index 4 31
Near-term wind index 7 71
Solar index 6 71
Solar PV tariff cuts brought forward six months
1 Joint Source: Ernst & Young analysis
this year, determined by the number of projects connected to the grid between March and May, cuts in the tariff of up to 15% will be implemented if the forecast is greater than 7.5GW, reducing by 3% for every 1GW less than 7.5GW; for example, a forecast of 5.5GWp-6.5GWp would incur a 9% cut in the FIT. Any tariff reductions in July 2011 will then be deducted from the cuts scheduled for January 2012. Further, the agreement actually allows for an increase of 2.5% in the tariff rate if the forecast is less than 2.5GW.
These cuts come as a result of exponential growth in the solar PV industry in the past year, with component costs having fallen disproportionately to the tariff levels. Solar power currently contributes 9% of the electricity which falls under the German Renewable Energy Act (EEG), although it accounts for 40% of the costs of the EEG. In view of this, further reductions are expected to be implemented in the new EEG in 2012.
InfrastructureIn November, the German Energy Agency, DENA, published its second Grid Study on the level of grid expansion required to meet the country’s 2020 renewable energy target. The report concludes that it needs to invest €9.7b on new high voltage lines in order to integrate 39% of renewable electricity by 2020. This timely report comes as an announcement by a German Minister in January confirms that the Government views expansion of the German and pan-European electricity grid as a top priority if Germany is to remain a competitive renewable energy market.
Renewable energy country attractiveness indices Issue 28
Germany
Offshore windLand constraints affecting Germany’s onshore wind capacity are resulting in a continued surge in offshore wind development. After the ceremonial opening of the 60MW Alpha Ventus wind farm in April 2010, BARD announced at the beginning of December 2010, that the first 4 of 80 wind turbines comprising the BARD Offshore 1 wind farm are now exporting electricity to the grid. This has increased Germany’s offshore capacity from 82MW at 30 June 2010 to 157MW at the end of December 2010. Construction of Baltic 1, the first offshore wind park in the Baltic sea, was completed in September 2010, but could not be connected to the grid, due to delays in the delivery of the offshore sea cables.
Construction of Germany’s largest offshore wind farm, Trianel Borkum West II, commenced at the end of December 2010, following the financial close of the first phase of the project. It represents Germany’s first offshore wind farm project financing deal as well as the first European municipality-driven project of its kind. Eleven banks were involved in the €550.5m project finance loan, with over 85% provided by the EIB and the State Bank of North Rhine-Westphalia. The transaction reinforces the sentiment that the investment community is showing increased confidence in the offshore wind market.
Solar PVSolar PVThe German Solar Association estimates that an additional 7GWp-8GWp of solar capacity was added in 2010, resulting in an overall installed capacity of 16GW-17GW. While it is considered unlikely that this high growth level will be sustained through 2011, given the two FIT reductions last year and further reduction on 1 January 2011, it is hoped the revised tariff policy, which introduces a ratchet mechanism based on capacity, will help dampen growth in the sector in a less volatile way, making sure that Germany’s PV market remains competitive in 2011.
BiomassThe Association of German Wood-Based Panel Industries, VHI, has warned that the expansion of biomass wood production has reached a saturation point. The Association argues that studies have shown that the increasing number of biomass power plants connecting to the grid means Germany could have an annual wood fall shortage of 30 million m3 by 2020.
18
Contact:Dr. Frank J. MatzenTel: + 49-6196-996-25259Email: [email protected]
Dr. Florian RopohlTel: + 49-40-36132-16554Email: [email protected]

Country focus – UK
PolicyIn December, the UK Government released its consultation document on fundamental EMR. The reforms propose the replacement of the RO with a “contract-for-difference” FIT that would provide premium top-up payments to renewable energy generators if wholesale electricity prices fall below a benchmark rate. The reforms would also provide money for consumers if wholesale prices exceed the cost of renewable energy generation.
As reported in the article on page 6 by Charles Hendry, Minister of State for DECC, the new FIT mechanism will provide increased, long-term revenue certainty for the investment community, hopefully unlocking access to new sources of low-cost capital that have shown signs of growth over the past quarter. The EMR also proposes a complementary carbon floor price that would provide
Reforms to electricity marketRanking Issue 28 Issue 27
All renewables index 5 5
Long-term wind index 2 2
Near-term wind index 4 4
Solar index 16 161
1 Joint Source: Ernst & Young analysis
proposes a complementary carbon floor price that would provide greater long-term pricing certainty in the power sector, with generators able to factor the external cost of carbon emissions into their production costs.
In November, National Grid commented that the high number of renewable projects with a signed connection agreement with the transmission network operator is a positive sign that the UK will meet its EU 2020 renewable energy target. However, a complex planning system appears to have led to the UK missing its 2010 target of 10%, producing only 6.7% of electricity from RES. Ongoing policy reforms are now addressing the low rate of planning application approvals and a lack of port infrastructure for offshore wind. Responsibilities are shifting from a national to a local level following the October 2010 Comprehensive Spending Review. However there are concerns that budgetary cuts to local authorities may result in insufficient resources to assess planning applications effectively.
Offshore windIn mid-November, Ofgem launched the second round of tenders for the offshore transmission network, required to connect six new projects to the national grid and facilitate the expansion of the sector. The £1.9b (€2.24b) tender provides investors with the opportunity to own and operate the network currently connecting the 2.8GW of offshore wind farms off the UK coastline, for the next 20 years.
The first round, covering £1.1b (€1.3b) of links, attracted around £4b (€4.71b) of investor appetite and achieved savings of £350m (€412m) through the competitive process.
Renewable energy country attractiveness indices Issue 28
The UK’s offshore sector seems to be attracting funding from even the more risk-averse investors, a strong indication of the financing community’s confidence in the maturing technology. Pensionen-fonds PGGM, the Dutch pension fund, and AmpèreEquity Fund have acquired a 24.8% stake in DONG Energy’s 367MW Walney offshore wind project for an estimated consideration of £16m (€18.8m).
December saw Iberdrola Renovables and Vattenfall commence work on the 7.2GW East Anglia Array offshore wind project. Initial focus will be on East Anglia ONE, comprising 400 turbines with a total capacity of 1.2GW.
SolarThe UK’s PV sector continues to gather pace, with a number of planning applications submitted for ground-mounted projects, mostly in the South West of England. However, DECC announced at the start of February that they have commissioned an early review of the FIT scheme over concerns that large-scale PV arrays will divert FIT revenue from domestic and commercial rooftop installations and competing technologies. The cumulative cap of £360m (€424m) per annum on FIT revenue across all Rrenewable technologies in 2014-15, imposed as a consequence of budgetary pressures, means that a fixed budget will be available to support all FIT technologies. The announcement available to support all FIT technologies. The announcement should help to provide more certainty to the investment community after the original announcement by DECC in November 2010 that they were considering a reduction in the tariff for large-scale solar PV.
BiomassDespite ongoing uncertainty about the RO for biomass reported in Issue 27, the market has not stalled completely. In December, RWE npower Renewables started work on the UK’s largest biomass combined heat and power (CHP) plant in Scotland, with parent company, RWE Innogy, investing some €235m in the 50MW project.
In January, there was also good news for Prenergy Power, with the Environment Agency announcing that it was “likely” to ease emissions limits for it 350MW Port Talbot plant. The plant would be permitted to use wood pellets as well as the previously agreed wood chip fuel source.
TidalPower trader, SmartestEnergy, has signed a PPA with the European Marine Energy Centre, to acquire all the electricity from its Orkney Islands test center. The sites, which can reach 11MW at maximum capacity, are an important step in commercializing wave and tidal power technology.
19
Contact:Ben WarrenTel: + 44 (0)20 7951 6024Email: [email protected]

Country focus – Italy
PolicyFollowing the announcement of the national guidelines on new renewable energyplant authorizations in July 2010, local authorities (LA) have introduced restrictions on land in agricultural areas which can be used for the installation of solar PV, as well as limitations on wind farm installations in areas of natural and architectural heritage. The region most affected was Puglia, where LAs have identified all areas subject to any kind of constraint (e.g., parks, reserves and UNESCO sites).
While these identified restriction zones will reduce the overall land available for renewable energydevelopment, the exercise will prevent developers wasting time and money on investigating sites which will never receive approval. Further, the Italian permitting situation is expected to improve over the first two quarters of 2011, with a clearer framework resulting in a more efficient
Ranking Issue 28 Issue 27
All renewables index 5 6
Long-term wind index 6 6
Near-term wind index 7 7
Solar index 3 3
Solar PV market resilient to phased FIT reductions
1 Joint Source: Ernst & Young analysis
2011, with a clearer framework resulting in a more efficient authorization process.
InfrastructureIn November 2010, Terna, the national grid operator, signed a strategic partnership agreement with the Montenegrin Transmission System (CGES) for the construction of the Italy-Montenegro undersea power interconnection. The “electricity bridge” is valued at an estimated €860m and will connect renewable energysources between Italy and the Balkan Peninsula. This connection forms part of Italy’s renewable energy strategy under the EU 20:20:20 Directive. Once complete, the connection will provide Italy with the option to import renewable energyfrom Montenegro, and predominantly hydropower from the other Balkan States. Terna will finance €760m of the construction, with CGES financing €100m to strengthen the local grid network. Terna will also acquire a 22% stake in CGES.
SolarIt is expected that 2010 installation figures for solar PV will show that Italy installed the second highest volume of capacity in Europe. The favorable FIT under the “Conto Energia” led to an estimated 4.5GW of total installed capacity in Italy at the end of last year, with approximately half of this installed in 2010 alone. However, there was only 2.8GW connected to the grid at the end of 2010, as developers seek to sign contracts with the energy service management body, GSE. While the phased reduction in tariffs in 2011 is likely to cause a slight reduction in the solar PV growth rate, market analysts still expect Italy to add an additional 2GW of capacity in 2011, as falling module prices maintain highly attractive internal rates of return for solar projects in the country.
Renewable energy country attractiveness indices Issue 28
In a sign that the scheduled tariff reductions in 2010 will not affect the credit markets, Rete Rinnovabile, a division of the grid operator Terna, has secured refinancing for its portfolio of solar PV assets. The agreement for up to €593.8m has been agreed with a consortium of seven leading European banks.
Access to financeEnel Green Power SpA agreed a €600m package with the EIB in December 2010, to fund 840MW of renewable projects in the country. The initial loan will provide €400m to assist with the development of small and medium-sized wind and solar projects. The 20-year loan has attracted favorable interest terms and has been secured against Enel Green Power SpA’s parent company, Enel SpA.
The Swiss utility and renewable energy producer, BKW FMB Energie AG, announced in early January that it will invest up to CHF2b (€1.54b) in wind energy projects across Italy and Germany over the coming years. The investment comes as part of the utility’s plans to develop a 750MW foreign wind portfolio to position itself as a market leader in wind power development across Europe.
20
Contact:Roberto GiacomelliTel: + 39 331 6744229 Email: [email protected]
Country focus – France
Solar PVThe French Government has joined other European countries in realigning its solar PV incentive mechanism to help control its budget deficit. Solar PV has come under increasing scrutiny as the cost to the state-controlled utilities is expected to rise to €915m in 2011, up from €128m in 2010. In December 2010, this led the Ministry responsible for renewable energy legislation to introduce a moratorium on non-residential solar PV projects >3kW for a period of three months.
The exception to the decree is for those plants >3kW for which acceptance of the grid-connection financial and technical proposal (PTF) was filed before 2 December, 2010. These plants will have to commission the projects within 18 months from the PTF. For projects >3kW for which the grid-connection application
Ranking Issue 28 Issue 27
All renewables index 7 7
Long-term wind index 7 71
Near-term wind index 6 6
Solar index 10 10
Solar PV: three-month moratorium for new projects
1 Joint Source: Ernst & Young analysis
PTF. For projects >3kW for which the grid-connection application was filed after 2 December 2010, producers are required to file a new grid-connection application after the end of the suspension period in April 2011.
At the end of January, The French Supreme Administrative Court rejected the urgent motion filed by several producers to have this decree suspended.
This latest news could undermine confidence in the PV market, which had seen a resurgence over the past year, contributing over 730MW of the total 1,100MW of renewable energy capacity installed in the first nine months of 2010.
As a result of the expansion in solar PV, the Government is to launch a new regulatory framework for the industry in mid-February 2011. A consultation with industry was launched at the end of December 2010 to implement a stable FIT policy that encourages the development of the entire supply chain.
The draft report released on 9 February (as part of the above consultation) states that grid connection applications representing a total 6,401MW had been filed by the end of December 2010. Of this, 3,014MW has not been affected by the FIT suspension , while around 3,387MW of projects have been suspended.
The draft report addresses notably the following possible amendments to the French FIT system:
► Limiting the development of solar PV electricity to 500MW per annum (including 200MW for ground-mounted plants, 150MW for non-residential rooftop installations and 150MW for residential rooftop). The solar industry has proposed a target of between 700MW and 1,000MW per year.
Renewable energy country attractiveness indices Issue 28
► Replacing the FIT with a tendering process for ground-mounted solar plants, and potentially large-scale rooftop installations (a threshold of 250kW or 1MW is being discussed)
► Reducing the tariff by10% per year for low capacity building-integrated plants in order to take account of the steady decline in production costs
► Providing certainty as to the date on which the right to receive the FIT is secured during the project development phase
► The application of a building-integrated tariff to new buildings and significant building restoration projects only
► The necessity to properly articulate the end of the suspension period and the adoption of the new tariff system, including the possible adoption of a transition FIT for projects that have been suspended as a consequence of the December 2010 decree (provided these projects meet certain conditions)
The final version of the report will be released and provided to the French Government shortly after 11 February, which is the last day of the consultation process. The Government will then decide what tariff system shall be implemented, with the new tariff scheme likely to be adopted by the end of February or the beginning of March 2011.beginning of March 2011.
Offshore windOn January 25, the Government announced that, in Q2 2011, it would launch a 3,000MW tender for offshore wind projects in the Channel between Le Havre and Le Treport. This process should enable the installation of 600 wind turbines, representing a total investment of around €10b. Five areas would be selected by the Government for the offshore farms, which should start producing electricity in 2015. This initial 3,000MW is the first half of the Government's strategy to install 6,000MW of offshore wind by 2020 to help meet its target of 23% renewable energy by this date.
BiomassOn 27 January, the Government adopted a new ministerial order that provides for a new FIT system and sets out rules for plant-based or animal-based biomass installations.
21
Contact:Jean-Christophe SabourinTel: + 33 1 55 61 18 55 Email: [email protected]

Country focus – Spain
PolicyThe Spanish Government has implemented a series of cost-cutting measures as it seeks to reduce the FIT deficit by more than €4.6b over the next three years, while also protecting consumer energy bills. Renewable energy has been heavily subsidized over the past 10 years, which has led to a €15b tariff deficit as the industry has developed to reach more than 16% of Spain’s total power generation by the end of 2010. This is predominantly attributable to wind and solar PV.
As a result, the Government intends to save €2.2b from the solar PV sector, €891m from solar thermal energy and €232m from the wind sector. Saving plans and energy efficiency will contribute a further €670m, and €588m of income will be generated from a new fee for electricity production.
Ranking Issue 28 Issue 27
All renewables index 8 8
Long-term wind index 10 10
Near-term wind index 9 7
Solar index 4 4
Government finalizes a collection of cuts
1 Joint Source: Ernst & Young analysis
PVSolar PV has been at the centre of Spain’s reduction in renewable energy incentives. A Royal Decree was passed in November that reduced the tariff rate by 45% for ground-mounted projects, and 5% for domestic rooftops. This was followed by a subsequent Decree that was passed by Parliament at the end of January that will reduce the revenue received by generators by 30% through to 2013. The Decree will cap the number of hours that solar installations can receive the premium tariff, replacing it with a standard rate for some of those hours. The premiums will be reduced by an estimated €2.22b. To compensate for the reduction, the tariff guarantee will be extended from 25 to 28 years.
The industry is now questioning the Government’s commitment to renewable energy, accusing it of reneging on policy commitments by retroactively cutting tariffs once they have been assigned. As a consequence, PV industry trade associations have appealed the November Decree in the Supreme Court and are seeking to help investors take legal action against the Decree passed in January, once subsidy payments are stopped later in the year.
As a result of the Government’s intentions to temper growth in the industry, only 919 out of 4,354 solar PV plants submitted to planning between October and December 2010 were approved.
The reduction in tariff rates is set to damage confidence among companies and investors, who have invested €20b in the sector. The industry is seeking alternative investment paths, recently evidenced in January by the commitment of the regional Government of Murcia to develop a €1.1b, 400MW plant in the
Renewable energy country attractiveness indices Issue 28
region. Instead of the FIT, the project will operate through a series of public-private initiatives, supported by the regional public holding company, Andaltia.
Onshore wind The local Government in Catalonia assigned development rights to 769MW of new wind farm concessions, paving the way for an expected €1.2b investment in the sector. However, the decision made in November 2010 to reduce subsidies 35% until 1 January 2013, in conjunction with the limitation on the number of operating hours receiving premium rates, may impact short-term growth. Despite this reduction, Fersa Energias Renovables was granted a €160m loan from the EIB to fund the construction of wind assets. The loan will consist of €50m worth of corporate debt with €110m of project financing.
Solar thermalSubsidies have also been cut in the solar thermal sector. CSP plants will not be allowed to take advantage of the premium tariff above market price option during year one of operation, qualifying instead for the set FIT option foreseen in Royal Decree 661. The agreement also limits the amount of hours which CSP plants can receive premiums above the market price.
Despite a shift in regulation, investment is still occurring in the sector, with Acciona Energia’s 50MW plant at Majadas De Tietar sector, with Acciona Energia’s 50MW plant at Majadas De Tietar connecting to the grid at the end of 2010. The €237m investment takes Acciona’sglobal portfolio of solar thermal plants to 214MW, accounting for 17% of global market share.
22
Contact:Eva María AbansTel: + 34 933 66 38 05Email: [email protected]
Víctor DuránTel: + 34 915 72 76 90Email: [email protected]
Country focus – Canada
PolicyCooperation between provinces for renewable energydevelopment is steadily increasing, with hope for a single market in the near future. A CAD6.2b (€4.6b) deal between Nova Scotia, New Brunswick , Newfoundland and Labrador to develop transmission assets from the 824MW Muskrat Falls hydroelectric power facility signifies the unity that provinces are developing.
In order to stimulate supply chain development, the domestic content requirements under Ontario's FIT program provide above market power rates for solar power projects >10kW if 50% (25% for wind projects) of the total costs and labor are sourced locally. This proportion has increased to 60% (50% for wind) in 2011. The incentives for supply chain development are in line with Ontario’s 20-year action plan to increase generation from wind, solar and biomass energy to 13% by 2018, up from 3% in 2010. It is hoped
Ranking Issue 28 Issue 27
All renewables index 9 9
Long-term wind index 7 7
Near-term wind index 5 5
Solar index 20 20
Ontario encourages domestic supply chain
Source: Ernst & Young analysis
Renewable energy country attractiveness indices Issue 28
biomass energy to 13% by 2018, up from 3% in 2010. It is hoped a CAD7b (€5.2b) deal with Samsung for 2.5GW of wind and solar will assist in meeting these targets.
Domestic supply chain development via content obligations is also a fundamental driver of the provincial government's ambition to stimulate job growth. While there have been some concerns over the bankability of some inexperienced manufacturers, thus far investors have not been deterred by the legislation. However, Japan has launched a dispute settlement at the World Trade Organization against the domestic content requirements, claiming they are anti-competitive.
With Ontario's provincial election at the end of 2011 and rising electricity retail prices, there is a perception that renewable energy development is an inefficient use of tax payers’ money, with risks that there could be dampened ambition for its development in the coming year. However, the majority of the rise in retail prices is attributable to transmission infrastructure upgrades and the refurbishment of conventional power plants.
WindAs at the end of October 2010, Canada’s installed wind power capacity totaled 3,549MW. The sector is continuing to attract finance, with two projects of note reaching financial close in 2010. In October, the sector saw the CAD114.6m (€85m) financial close of the 62MW Glen Dhu wind farm in Nova Scotia, east Canada. The project is set to be fully operational by 31 March 2011.
The second project to reach financial close was the Mont Louis wind farm in Quebec. Northland Power Income Fund closed the CAD146m (€108.4m) financing of the 100MW facility at the end of September. The Mont Louis project, which is scheduled to achieve full commercial operation by Q3 2011, will operate under a 20-year power purchase agreement with Hydro-Quebec.
SolarIn Ontario, the solar PV market continues to show signs of growth, as demonstrated by the opening of an 80MW solar farm in Sarnia. Developed by Enbridgeand First Solar, the project is currently one of the largest operating solar PV facilities in the world and was developed under the previous support mechanism in Ontario, known as RESOP.
Solar Power Partners and JCM Capital have signed a JV to develop a 200MW portfolio of solar PV in Ontario, commencing construction in 2011.
In a bid to meet the higher domestic content requirements in 2011, the solar sector has seen increased supply chain activity, with metal fabrication company Melitron announcing that it has selected Alberta-based Sustainable Energy Technologies to build its SUNENERGYTM inverter. International developer SunEdisonhas secured domestic solar PV panel supply for its 2011 projects, made available through a partnership between SunEdison’sparent MEMC and Nasdaq-listed Flextronics. Based in Ontario,
23
parent MEMC and Nasdaq-listed Flextronics. Based in Ontario, Flextronics will produce MEMC-branded solar PV panels in a facility with an initial capacity of 50MW.
The Canadian market has also seen entry by China’s SunTech Power Holding Co, the world’s largest maker of crystalline silicon solar panels, and US-based Calisolar Inc, who have jointly agreed to develop a silicon plant in Ontario.
BiomassNova Scotia Utility and Review Board has approved the development of a 60MW biomass facility. Nova Scotia Power and NewPage Port Hawksebury will construct the CAD208m (€155m) plant, which will generate 3% of the state’s electricity requirements.
Contact:Mark PorterTel: + 1 416 943 2108Email: [email protected]

Country focus – Portugal
PolicyOngoing concern over Portugal’s public finances and external debt liabilities, coupled with illiquidity in the banking sector mean that access to funding for renewable energy development has been constrained in recent months. Despite this, the Government continues to affirm its commitment to the renewable energy sector.
A successful bond issue of €1.25b by the Government on 12 January may provide the sector with the increased confidence it requires, as it seeks to access the capital markets after a period of constrained liquidity. It also appears that Portugal is following the lead of other European countries and using renewable energy development as a means to revive its economy.
The publication of new targets to generate 31% of energy from
Ranking Issue 28 Issue 27
All renewables index 10 10
Long-term wind index 11 11
Near-term wind index 14 14
Solar index 11 11
Bond issue creates positive sign for renewables
Source: Ernst & Young analysis
The publication of new targets to generate 31% of energy from renewables by 2020 is also a sign of commitment to the sector. The National Renewable Energy Action Plan (NREAP) submitted to the EU Commission in July 2010, details Portugal’s strategy for meeting its target and builds on the National Energy Strategy which was passed into law in April 2010.
The overall outlook for renewable energy in Portugal therefore remains positive despite the financial crisis, although grid access could prove to be a challenge to growth in the sector. Developers currently have to tender for a grid access license per MW of power capacity, although the legislation allows government to determine periods in which developers can apply to the Government directly for the licenses. The Government has recently limited this option to some technologies, including solar CSP.
WindIn 2010, Portugal generated more power from wind power than coal, increasing 20% on 2009 to 9.03TWh. Given the high resource potential, Portugal’s NREAP envisages 6.8GW of onshore and 75MW of offshore wind capacity by 2020.
Solar PVSolar PV capacity has increased marginally from 64MW in September 2009 to the current level of 81MW. Industry stakeholders believe that the current target of 1GW by 2020 lacks ambition. Given the resource potential, there is common belief that 2.5GW is a more realistic target.
Renewable energy country attractiveness indices Issue 28
Portugal
In late 2010, the Government tendered licenses for solar projects with a combined capacity of 150MW and a minimum bid price of €400k per MW. The results, announced in February, revealed that the highest bid price was over €1m per MW. This is good news for the solar industry, which has not allocated grid connections to PV projects for the past three years due to grid capacity constraints. The Government is also planning to tender grid access to “mini-solar” projects up to 250kW in early 2011, including schools and public buildings, as it strives to meet targets of 500MW in this small scale solar sector by 2020.
Solar CSPThe NREAP sets out a CSP-installed capacity target of 500MW by 2020. The industry is still at a relatively early stage of development, with the first project due on line in 2011. In 2010, to facilitate the development of the industry, the Government granted CSP developers the opportunity to apply directly for grid access licenses. However, there is concern that this process only provides for a limited amount of capacity expansion, as access to licenses is restricted to a small number of developers.
BiomassThe 93MW of new biomass plants that have been awarded licenses since 2005 are struggling to materialize due to low tariffs and bankability issues. A higher tariff was agreed at the tariffs and bankability issues. A higher tariff was agreed at the end of 2010, although difficulties in securing feedstock supply is still a hurdle in attracting finance. As a result, the country is struggling to keep on track for its 2020 target of 952MW.
OtherThe Government is making efforts to facilitate the licensing process for small-scale hydro power projects under 10MW. Grid access licenses totaling 20MW were tendered in 2010 and a further 100MW are expected in 2011. This increase comes as a result of the Government raising €30m less than the envisaged €100m target from the issue of licenses for small-scale hydropower projects in 2010.
Redes Energéticas Nacionais, the network operator, has signed a contract with the Government, providing a concession which allows the potential development of 250MW of wave energy near the port of Peniche. The project is likely to attract over €500m of investment and will strengthen Portugal’s status as a world leader in wave energy technology.
24
Contact:
José Gonzaga RosaTel: + 35 1 21 7912 232 Email: [email protected]
Diogo LucasTel: + 35 21 7912 231Email: [email protected]

Country focus – Brazil
PolicyThe election of Dilma Rousseff in October 2010, as the new President of Brazil, is being hailed as a positive sign for the renewable energy industry given her commitment to continue the policies implemented by her predecessor. Most notable is the extension of the PROINFA program, which provides renewable energy development incentives for projects which begin generating energy before 31 December 2011. According to a report by ANEEL, the National Energy Agency, 800MW of the 3.3GW contracted by PROINFA is expected to enter into operation in 2011.
In November, the Ministry of Mines and Energy also ratified a new 10-year plan for the expansion of renewable energy, which foresees an estimated investment of BRL952b (€420.2b) over the period 2010-19. The new plan includes a commitment to
Ranking Issue 28 Issue 27
All renewables index 16 18
Long-term wind index 18 19
Near-term wind index 16 15
Solar index 15 15
Wind power soars in public auction
1 Joint Source: Ernst & Young analysis
the period 2010-19. The new plan includes a commitment to ceasing the development of any additional fossil fueled plants after 2014, with hydropower expected to replace the majority of the capacity.
These policy measures are aligned to meet Brazil’s objective of adding 4GW of renewable energy capacity to the grid in 2010, with a further 777MW added in 2011 and 2GW in 2012.
Onshore windWind was a predominant technology in ANEEL’s Alternative Sources Auction in August 2010, representing 70 of the 89 contracted projects, and estimated investments of BRL8b (€3.53b) by 2013.
Brazil currently has 930MW of installed wind power generation, representing 0.7% of the country’s energy mix. This is set to increase to 1,440MW as an additional 510MW of installed capacity from 14 wind parks is realized in 2011.
Growth in the sector has also been aided by Brazilian development banks, BNDES and Banco de Nordeste, having provided Renova Energia SA with a BRL905m (€399.5m) loan to develop 294MW of wind power. The loan represents 77% of the BRL1.17b (€0.52b) needed to construct the plants, which are expected to be operational in 2012.
However, many wind farms are located far from the transmission network and incur high connection costs. As a result, wind energy association ABEEólica has commissioned a study to facilitate investment in a transmission line along Brazil’s northeast coast to exploit the region’s vast growth potential.
Renewable energy country attractiveness indices Issue 28
General Electric has received orders to deliver over 400MW of wind turbine capacity across the country as a result of the latest alternative energy auction. This is part of GE’s wider strategy to invest in fast-growing emerging markets such as Brazil and the Middle East, as it looks to increase sales. GE initially plans to invest US$200m (€149m) in wind turbine and energy technology in Brazil.
In December 2010, Gamesa also announced that it is targeting Brazil as a manufacturing and operational base for its expansion into South America. The wind turbine manufacturer announced that it would set up a 300MW nacelle production facility in Bahia, as it seeks to take advantage of markets with high growth potential.
HydropowerIn early 2011, BNDES (National Bank for Social and Economic Development) and the German Development Bank, KfW, signed a US$68m (€50.8m) contract to finance small hydropower projects, to be built in Brazil by private local companies.
25
Contact:Luiz Cláudio S. CamposTel: + 55 21 2109 1419Email: [email protected]

Country focus – Turkey
PolicyIn 2009, the renewable energy market in Turkey was predicted to boom after a long period of consultation led to a proposed energy bill that would have guaranteed higher FIT rates for renewable energy developments. However, the legislation stalled in Parliament amid fears that it would lead to retail electricity price inflation.
After a long period of debate, the Government finally passed a new energy law in December 2010, ending a period of uncertainty and speculation. The new rates are an improvement on the original flat rate tariff of €0.05-€0.055/kWh across all technologies .
The new tariff rates are as follows:
Ranking Issue 28 Issue 27
All renewables index 27 28
Long-term wind index 26 28
Near-term wind index 22 22
Solar index 18 18
Government finally passes new energy law
Source: Ernst & Young analysis
The law also changes the base tariff currency from euros to US dollars, while in addition to the new tariff, producers would be subject to an additional tariff premium up to US$0.067/kWh (€0.05/kWh), based on their utilization of the domestic supply chain. This represents a significant advancement of policy as the Turkish Government strives to develop a solar PV manufacturing base to benefit the wider economy.
While the Government maintains the rates are high enough to incentivize renewable energy production, they are lower than the original rates proposed in 2008 and fall short of the European average. This has led many industry stakeholders to suggest that the tariffs are too low to attract commercial capital and, without increased support, the Government risks falling short of its 30% renewable energy target by 2023.
Renewable energy country attractiveness indices Issue 28
Technology Tariff rate US$/kWh Tariff duration/yearsWind 0.073 10
Hydropower 0.073 10
Solar PV 0.133 10
Solar thermal 0.133 10
Geothermal 0.105 10
Biomass 0.133 10
Despite the perceived low tariff levels, the passing of the long-awaited energy law is good news and suggests that the renewables industry in Turkey will experience a positive growth trajectory in the short to medium term at least.
WindApproximately 2.3GW of wind power capacity in Turkey has been licensed to date. However, the previously unattractive flat rate tariff and relatively low wind speeds in the licensed areas, means that only half the licensed projects are expected to be completed, with funders viewing the projects as too risky to finance.
There are also some concerns that the change in the FIT base rate currency from euros to US dollars may increase the risk involved with wind power development, since project costs are traditionally denominated in euros. Developers may therefore have to start hedging component prices to reduce this currency risk.
SolarThe new renewable energy laws state that the total solar capacity to be connected to the transmission system by 31 December 2013 shall not exceed 600MW per year. The Cabinet will determine the rate after this date. This cap may stifle investment as investors look to other markets where component costs have already decreased. Furthermore, the new tariff only applies to already decreased. Furthermore, the new tariff only applies to generators who have obtained a license to export the electricity to the grid. This may stifle investment in small-scale domestic schemes that perceive the system as too bureaucratic.
Access to financeThe European Bank for Reconstruction and Development (EBRD) has agreed to provide €400m worth of loans to Turkish banks to finance private sector investments in mid-sized renewableprojects. This will help unlock the estimated €200b required to realize Turkey’s renewable energy source investment potential.
26
Contact:Erkan BaykusTel: + 90 312 286 38 00Email: [email protected]

Commentary – guidance notes
Long-term indexAs stated on page 1, the individual technology indices, which combine to generate the All renewables index, are made up as follows:
► Renewables infrastructure index – 35%
► Technology factors – 65%
These guidance notes provide further details on the renewables infrastructure index and the technology factors.
Renewables infrastructure indexThe renewables infrastructure index is an assessment by country of the general regulatory infrastructure for renewable energy. On a weighted basis, the index considers:
► Electricity market regulatory risk (29%) — markets that are fully deregulated score higher, as they have experienced the “market shock” on underlying wholesale prices that this transition may exert. While this may not affect current projects, these effects are particularly important when considering long-term investment prospects.
► Planning and grid connection issues (42%) — favorable planning environments (low failure rates and strong adherence to national targets) score highly. Grid connection scoring is based on the ease of obtaining a grid connection in scoring is based on the ease of obtaining a grid connection in a cost-effective manner. The score also takes account of the degree of grid saturation for intermittent technologies.
► Access to finance (29%) — a market with a mature renewable energy financing environment, characterized by cheap access to equity and good lending terms, will score higher.
This generic renewables infrastructure index is combined with each set of technology factors to provide the individual technology indices.
Technology factorsThese comprise six indices providing resource-specific assessments for each country, namely:
1. Onshore wind index
2. Offshore wind index
3. Solar PV index
4. Solar CSP index
5. Geothermal index
6. Biomass and other resources index
Renewable energy country attractiveness indices Issue 28
guidance notes
Other renewable energy resources include small hydro, landfill gas, and wave and tidal technologies. Energy from waste is not considered. Each of the indices consider, on a weighted basis, the following:
1. Power off-take attractiveness (19%) — this includes the price received, the potential price variation and length of PPAs granted. Higher scores are also achievable if a government guarantees the power off-take rather than merchant offtakers.
2. Tax climate (11%) — favorable, high-scoring tax climates that stimulate renewable energy generation can exist in a variety of forms and structures. The most successful incentives and structures have been direct renewable energy tax breaks or brown energy penalties, accelerated tax depreciation on renewable energy assets and tax-efficient equity investment vehicles for individuals.
3. Grant/soft loan availability (9%) — grants can be available at local, regional, national and international levels, and may depend on the maturity of a technology as well as the geographical location of the generating capacity. Soft loans have historically been used in pioneering countries of renewable energy technologies to kick-start the industry. High scores are achieved through an array of grants and soft loans.
4. Market growth potential (18.5%) — this considers current 4. Market growth potential (18.5%) — this considers current capacity compared with published targets. Higher scores are given if ambitious targets have been set and policy framework is in place to accelerate development. The realism of targets is taken into account as well as the seriousness with which they are being pursued (e.g., penalties in place for non-compliance).
5. Current installed base (8%) — high installed bases demonstrate that the country has an established infrastructure and supply chain in place, which will facilitate continued growth and, in particular, encourage the repowering of older projects.
6. Resource quality (19%) — for example, wind speeds and solar intensity.
7. Project size (15.5%) — large projects provide economies of scale and a generally favorable planning environment, which facilitates project development financing.
27

Commentary – guidance notes
Near-term wind indexAs stated on page 1, the near-term wind index focuses on factors of most immediate concern to near-term investment in wind energy. The scoring follows the same methodology as for the long-term wind index, but with a more focused set of parameters and a tailored weighting. Therefore, the indices consider the following, on a weighted basis, for both onshore and offshore wind separately:
► Power off-take attractiveness – 28%
► Tax climate – 8%
► Resource quality –14%
► Market growth potential (next two years) – 40%
► Project size – 11%
Renewable energy country attractiveness indices Issue 28
guidance notes
In the offshore near-term wind index, countries with no projects estimated to reach construction in the next two years are excluded.
It should be noted that the market growth potential score is based on a view taken of a range of business analysts’ forecasts and Ernst & Young’s own market knowledge. There is significant variation between analysts’ views on each market, and within some markets, the variation is greater than in others. The forecasts used are a market view only and the scores in no way guarantee that the forecasted capacity will be built.
While comparisons have been made between scores in the long-term and near-term wind indices, it should be emphasized that, due to the different weightings and parameters used, these cross-comparisons are of a narrative nature only and by no means indicate any quantitative valuation.
28

Company index
Company PageABEEólica 26Abengoa 18Acciona Energia’s 23ACS Actividades de Construccion y Servicios SA 10Andaltia 23ANEEL 26Atlantis Resources Corp 12AVIC Heavy Machinery Co 10Banco de Nordeste 26BARD 19BKW FMB Energie AG 21BNDES 26Caithness Energy LLC 14, 18 Calisolar Inc 24CCID Consulting 14, 17CEZ 14CGES 21China Datang Corp Renewable Power 11China Ming Yang Wind Power Group 15China Wind Power International Corp., China Wind Power Corp. 15, 17 China WindPower Group 17Conergy AG 10Contact Energy 13DONG Energy’s 20Ecofys 8Enbridge 24Enbridge 24Enel Green Power SpA , Enel SpA 12, 21
European Investment Bank, EIB 9, 12, 13,14, 15, 19, 21, 23
EuroSibEnergo 10FC Windenergy, Windreich 10Fersa Energias Renovables 23First Solar 24Flextronics 24Gamesa 26General Electric 26German Development Bank, KfW 15, 26 Guodian 17Huadian Power 17Huaneng 11Hydro-Quebec 24Iberdrola Renovables 10, 20 Intevac 10JCM Capital 24K Road Sun LLC 10LM Wind Power 10Melitron 24MEMC, SunEdison 24NewPage Port Hawkesbury 24Norderland Projekt 10Nova Scotia Power 24NRG Energy 18Panax Geothermal Ltd 10Pensionenfonds PGGM 20Prenergy Power 20Prokon Nord 10PT Bakrie Power 10Redes Energéticas Nacionais 13, 25 Renova Energia SA 26
Renewable energy country attractiveness indices Issue 28
Company PageRete Rennovabile 10RWE Innogy, RWE npower renewables 20Samsung 24Sempra Generation 18Sinovel 11SmartestEnergy 20Solar Implant Technologies 10Solar Power Partners 24Southern California Edison 18Stadtwerke Munchen 10State Bank of North Rhine-Westphalia 19SunPower Corp 11, 18Suntech Power Holdings Co 17Sustainable Energy Technologies 24Terna, Terra Firma Investments 10, 21Tessera Solar North America, Inc 10The Agricultural Development Bank of China 17The European Marine Energy Centre 20The International Finance Corporation (IFC) 17Thornton Bank 15Titan Wind Energy Suzhou 11Trianel 14, 19 Trony Solar 11UPC Renewables 17Vattenfall 10, 20 Vestas 15VHI 19VHI 19Western Wind Corp 14Western Wind Energy Corp 18Yangtze Power 10ZhongHang Huiteng Wind Power Equipment Co 10
29

Glossary
Abbreviation Definitionb BillionCAI Country Attractiveness IndicesCHP Combined heat and powerCO2 Carbon dioxideCSP Concentrated solar powerDECC Department of Energy and Climate Change
DENA Deutsche Energie-Agentur GmbH (The German Energy Agency)
DOE Department of Energy EBRD European Bank for Reconstruction and Development
EEG Erneuerbare-Energien-Gesetz (German Renewable Energy Act)
EIB European Investment BankEMR Electricity Market ReformEPA Environment Protection AgencyERDF European Regional Development Fund EU European UnionETS Emissions Trading System FIT Feed-in tariffGC Green certificate GW GigawattGWp Gigawatt peakIEA International Energy AgencyIFC International Finance CorporationIFC International Finance CorporationIPO Initial public offeringIRR Internal rate of returnJI/CDM Joint Implementation/Clean Development Mechanism kW/kWh Kilowatt/Kilowatt hourLA Local authoritiesm MillionM&A Mergers and acquisitionsMW/MWh Megawatt/Megawatt hourPPA Power purchase agreementPPP Public private partnership
PROINFA Programme of Incentives for Alternative Electricity Sources
PTC Production Tax CreditPV PhotovoltaicREC Renewable Energy Certificates RENAP Renewable Energy Action PlanRES Renewable energy sourcesRESOP Renewable Energy Standard Offer Program RO Renewables ObligationROC Renewables Obligation Certificate RPO Renewable Purchase Obligation RPS Renewables Portfolio Standard SME Small and medium enterprises t TrillionTWh Terrawatt hour
Renewable energy country attractiveness indices Issue 28 30

Ernst & Young Services for Renewable Energy ProjectsErnst & Young Renewable Energy Group
With a dedicated team of over 100 international advisors operating from our global team, Ernst & Young’s Renewable Energy Grohelps clients to increase value from renewable energy activity.
Technologies we cover
Established
Onshore and offshore wind
Solar PV and CSP
Biomass and CHP
Hydro and geothermal
Biofuels
Landfill gas
Renewable energy country attractiveness indices Issue 28
Finance raising
► End-to-end project finance solutions –debt and equity
► Assist competitive tender process► Due diligence► Data room preparation
Commercial and financial analysis
Transaction Advisoryservice offering
► Strategic entry and business strategy
► Financing strategy► Valuation modeling► Commercial contract review
► Joint venture negotiations► Public offerings► Commercial modeling support
► Benchmarking analysis► Scenario analysis
Ernst & Young Services for Renewable Energy ProjectsWith a dedicated team of over 100 international advisors operating from our global team, Ernst & Young’s Renewable Energy Group
Technologies we cover
Emerging
Wave TidalSmallhydro
Carbon captureand storage
31
M&A
Feasibility and improved efficiency
Transaction Advisoryservice offering
► Financial structuring► Taxation structuring –
cross-border specialists
► Market analysis► Competitive sales processes► Bid review and negotiations
► Joint venture advice► Asset-backed finance solutions► Capital allowances► Structured leasing
► Commercial modeling support► Valuation and deal structuring► Targeted pool of potential
investors/acquisition targets► Preparation for IPO

Contact
For further information on our services and points of view, please visit our website www.ey.com/renewables or contact:
Ben WarrenPartner, Head of Renewable Energy Infrastructure Advisory,Ernst & Young [email protected]
Andrew PerkinsPartner, Ernst & Young [email protected]
CAI production supported by:
Phil DominySenior [email protected]
Klair [email protected]
Rob HaywardAssistant [email protected]
Also assisted by Sourav Saha (Senior Analyst)
To be added to the soft copy distribution list of the CAI please contact:
US (2)
Belgium (18)
UK (5)
Italy (6)
France (7)
Spain (8)
Canada (9)
Portugal (10)
Ireland (11)
Sweden (12)
Greece(12)
Netherlands (16)
Brazil (18)
Germany (3)
Denmark (21)
Egypt (22)
Norway (22)
Mexico (25)
Renewable energy country attractiveness indices Issue 28
CAI please contact:
Olivia [email protected] 951 5559
Map highlighting CAI countries and their respective Issue 28 rankings
For further information on our services and points of view, please visit our website www.ey.com/renewables or contact:
Cleantech Team contacts
Gil ForerGlobal Cleantech Center LeaderNew York, NY, [email protected]
Scott SarazenGlobal Markets LeaderBoston, MA, [email protected]
John de YongeDirector of Account EnablementNew Jersey, [email protected]
Jay SpencerAmericas Cleantech [email protected]
China (1)
India (4)
Sweden (12)
Australia (12)
Japan (15)
Poland (16)
South Korea (18)
Denmark (21)
Romania (22)
New Zealand (25)
South Africa (27)
Turkey (28)
Austria (28)Finland (30)
32
Robert SeiterEurope/Middle East/Ireland /Africa Cleantech [email protected]
Map highlighting CAI countries and their respective Issue 28 rankings

Recent Ernst & Young publications
Cleantech and the UK growth opportunity
Ernst & Young interviewed over 300 key British cleantech stakeholders in Government, growth companies, funds, large corporates and research institutes to understand first-hand their opinions of the market currently, how it will change in the future and what is needed now to establish the conditions for success.
MENA Assessment of the Local Manufacturing Potential For Concentrated Solar Power Projects
This study proposes roadmaps and an action plan to help develop the potential of locally manufactured CSP components in the existing industry and for new market entrants in MENA.
Available at www.ey.com
components in the existing industry and for new market entrants in MENA. Ernst & Young contributed to the findings of this report. Published on the World Bank website.
United Utilities – May edition
The special smart edition of Utilities Unbundled explores the real meaning and impact of the smart grid at different points in the energy value chain and looks at how major players around the world are planning to face challenges and change in the new smart market.
Renewable energy country attractiveness indices Issue 28
Cleantech Matters – The electrification of transportation: from vision to reality
This report summarizes the findings of Ernst & Young's fifth annual global series of cleantech ignition sessions; executive roundtables that convene key stakeholders to discuss important cleantech issues.
Valuing Cleantech Investments
Recommendations for cleantechvaluation:► Cleantech is a growth sector for
investment requiring substantial amounts of capital
► Investment cases should be stress
Recent Ernst & Young publications
► Investment cases should be stress tested
► Policy risk should be incorporated into valuations
► Undertake formal valuations to support investment cases
Utilites Unbundled – December edition
This issue of Utilities Unbundled explores the challenges of taking on “first-of-a-kind.” Our main feature examines how some of our leading US and European utilities are balancing the risks and demands of major new investments to deliver capital-efficient results. We also look in depth at another “great unknown” for the utility industry - the impact of electrified transport.
33


Ernst & Young
Assurance Tax Transactions Advisory
About Ernst & YoungErnst & Young is a global leader in assurance, tax, transaction and advisory services. Worldwide, our 141,000 people are united by our shared values and an unwavering commitment to quality. We make a difference by helping our people, our clients and our wider communities achieve their potential.
Ernst & Young refers to the global organization of member firms of Ernst & Young Global Limited, each of which is a separate legal entity. Ernst & Young Global Limited, a UK company limited by guarantee, does not provide services to clients. For more information about ourorganization, please visit www.ey.com
© 2011 EYGM Limited.All Rights Reserved.
EYG No. DE0225
This publication contains information in summary form and is therefore intended for general guidance only. It is not intended to be a substitute for detailed research or the exercise of professional judgment. Neither EYGM Limited nor any other member of the global Ernst & Young organization can accept any responsibility for loss occasioned to any person acting or refraining from action as a result of any material in this publication. On any specific matter, reference should be made to the appropriate advisor.
The opinions of third parties set out in this publication are not necessarily the opinions of the global Ernst & Young organization or its member firms. Moreover, they should be viewed in the context of the time they were expressed.
www.ey.com