Erik Guercio Associate Director of Research - aacom.org · Erik Guercio Associate Director of...
31
Photo courtesy of LECOM What You Can Do with the OME Data on the AACOM Website Erik Guercio Associate Director of Research
Transcript of Erik Guercio Associate Director of Research - aacom.org · Erik Guercio Associate Director of...

Photo courtesy of LECOM
What You Can Do with the OME
Data on the AACOM Website
Erik Guercio
Associate Director of Research

Introduce research department staff
Provide an overview of the website
Show examples of the types of reports on the website
Discuss the data we collect
Annual Survey, Student Survey, AACOMAS Application,
Special Reports, etc.
Examples of using excel to manipulate data
Q&A Session
Purpose of Presentation

Navigation to the
Research website
Types of reports
available on website
Reports archives
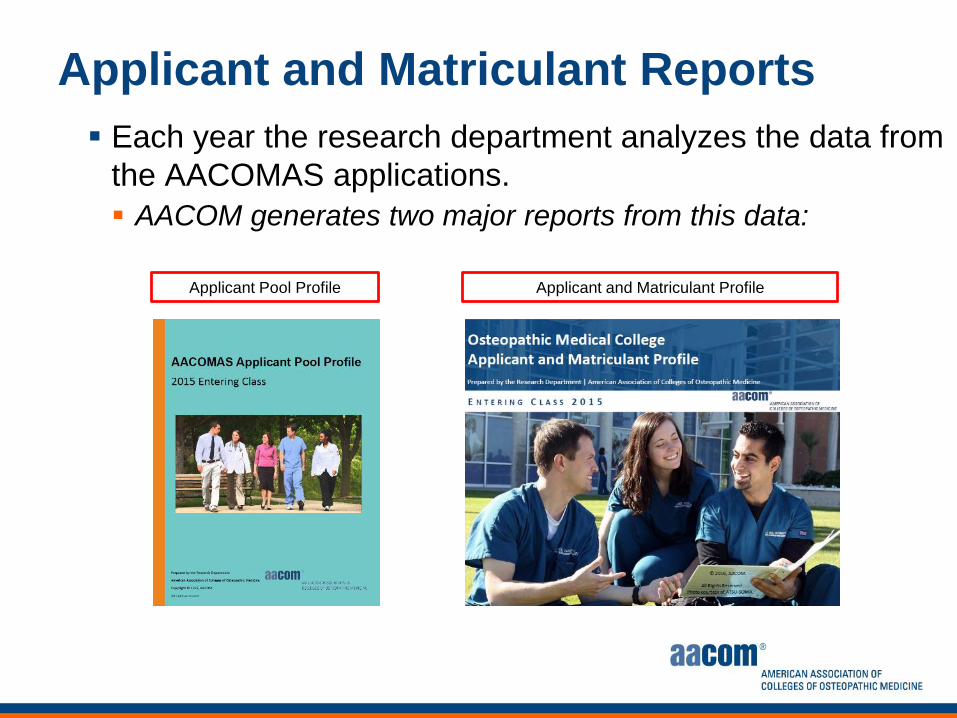
AACOM Reports Website Overview

AACOM Reports Categories

Types of Reports
Excel
Archives

Latest Reports
Latest report Feed:

Applicants and Matriculants
Data drawn from AACOMAS application
Does not include UNTHSC/COM and NYIT-COM’s
emigre data

Applicants and Matriculants
Each year the research department analyzes the data from
the AACOMAS applications.
AACOM generates two major reports from this data:
Applicant and Matriculant Reports
Applicant Pool Profile Applicant and Matriculant Profile

Applicant trends –
four years.
Over the last four years,
approximately 46 percent
of the AACOMAS applicant
pool was female.
Four Year Applicant Profile Report
Growth in
applicants and
designations.

In-State and Out-of-
State Matriculants
Broken out by COM
In-State and Out-of-State Matriculants
Mean for all COMs

Entering and Graduating Class Survey

Entering and Graduating Class Survey
Survey distributed by the schools to their entering
students and graduating seniors.
Data are self-reported by students
Survey Tool: Snap.

Each year the entering and graduating classes at each of
the COMs is surveyed.
AACOM generates two major reports from this data:
Entering and Graduating Class Survey
Entering Student Survey
Summary ReportGraduating Seniors Survey
Summary Report

Entering students
planning loan
forgiveness
participation by
program.
Entering Student Loan Forgiveness Participation

By gender and
race-ethnicity.
Graduating
seniors’
immediate post
graduate plans.
Over the past three years,
a greater percentage of
females reported
“allopathic residency” as
their immediate post
graduate plans.
Graduating Seniors’ Post-Graduate Plans

Annual Survey
Annual Osteopathic Medical School Questionnaires
(Annual Survey for short)
Survey distributed annually to all schools.
Survey Vendor: Armature.

Annual Survey

Each year AACOM administers the Annual Osteopathic
Medical School Questionnaires.
Data from this survey is used in various reports:
Annual Survey
Enrollment Revenues and Expenditures Graduates

Total Enrollment by Race/Ethnicity
2015-16 Total
Enrollment by
Race/Ethnicity
Race/Ethnicity Categories:
Non-URM:
-Asian
-White
-Two or more races
-Unknown & Nonresident Alien
URM:
-Black/African American
-Hispanic/Latino
-American Indian/Alaska Native
-Pacific Islander

Graduates by Race/Ethnicity
2014-15
Graduates by
Race/Ethnicity
Race/Ethnicity Categories:
Non-URM:
-Asian
-White
-Two or more races
-Unknown & Nonresident Alien
URM:
-Black/African American
-Hispanic/Latino
-American Indian/Alaska Native
-Pacific Islander
Special Reports

Each year AACOM produces special reports to showcase
trend data or address emerging questions/topic.
Examples of special reports include:
Special Reports
COM by Inaugural Class Preliminary Enrollment Trends in Applicants,
Enrollment, and Graduates

Trends Report: Applicants, Enrollment,
and Graduates
Growth in Applicants,
Enrollees, and Graduates

Diversity Report: Applicants, Enrollment,
and Graduates
Female and
underrepresented
minority total enrollment

Using Excel to Manipulate Data
Sort/Filter
Pivot Tables
Pivot Charts

College
Sorting and Filtering
Academic Year
Sort highest
percent female…

Pivot Tables
Insert pivot table and
select range…
Create custom
reports…

Pivot Charts
Insert pivot chart and
select range…
Quickly produce column charts for your college
using pivot tables…

Questions & Answers

Reports and data available on the Data
and Trends section of the AACOM website:http://www.aacom.org/reports-programs-initiatives/aacom-reports
Follow us on twitter:https://twitter.com/aacomresearch
AACOM Research
Erik Guercio, M.A.Associate Director of Research
Tel: 301-968-4153 Email: [email protected]