
ERES 2011 Giacomo Morri - Paolo Benedetto Teaching real estate finance with cases: SUNLIGHT VILLAGE...
34
ERES 2011 Giacomo Morri - Paolo Benedetto Teaching real estate finance with cases: SUNLIGHT VILLAGE case study Giacomo Morri - Paolo Benedetto presented at the 18 th Annual ERES Conference June 15th - 18th, 2011 Eindhoven
-
Upload
horatio-richardson -
Category
Documents
-
view
214 -
download
0
Transcript of ERES 2011 Giacomo Morri - Paolo Benedetto Teaching real estate finance with cases: SUNLIGHT VILLAGE...

ERES 2011 Giacomo Morri - Paolo Benedetto
Teaching real estate finance with cases: SUNLIGHT VILLAGE case study
Giacomo Morri - Paolo Benedetto
presented at the 18th Annual ERES Conference June 15th - 18th, 2011 Eindhoven

ERES 2011 Giacomo Morri - Paolo Benedetto
Introduction
• Purpose of the work
• Industry needs– Real estate & Finance– Computer skills– Team working
• From theory to practice– Learning by doing– Problem solving skills– Presentation skills
2

ERES 2011 Giacomo Morri - Paolo Benedetto
Use of Sunlight Village case study
• Different RE finance courses– Master of Science– Master in Real Estate (post experience)– Executive courses for practitioners
• Presentation tool only– Class presentation– Spreadsheet creation by the teacher
• Exercise & Examination tool– Initial presentation by the teacher– Spreadsheet creation by students– Final class presentation & discussion by students– Valuation by the teacher– Delivery of spreadsheet & PPT solution files for self-assessment
3

ERES 2011 Giacomo Morri - Paolo Benedetto
Example of a case studySUNLIGHT VILLAGE
4

ERES 2011 Giacomo Morri - Paolo Benedetto
The role of the story
• The topic:– Land development, financing & acquisition
• Players involved:– Mary Watson attorney, land owner & seller– Julie Holmes MD real estate development company & buyer
“Mary Watson, a well reputed attorney in a top legal firm, and Julie Holmes, managing director of an international real estate development company, have been friends since they were children. They attended the same schools and they have been playing volleyball in the same team for many years. Later on, even if they went to different universities, respectively studying law and finance, they have always kept in touch and now, that they are older, their daughters are best friends at primary school.”
5

ERES 2011 Giacomo Morri - Paolo Benedetto
The object
6
Seller: Land
• 10,000sqm plot of land
• The bid €5 million
“A few years ago, Mary’s family purchased a 10,000sqm plot of land for €2 million that has recently obtained a building permit for 5,000sqm for residential from the municipality. The family accountant has suggested selling the property for not less than €5 million, but Mary doesn’t trust him too much and she has therefore proposed the deal to Julie, knowing that they might find an agreement which can satisfy both of them.”

ERES 2011 Giacomo Morri - Paolo Benedetto
Input data – development
• Direct construction costs €1,100/sqm
• Land drainage €400,000
• Urban land development costs 12% of direct building costs
• Other costs as % of the direct building costs:– designing costs 3% – project management 2%– contingency 5%
• Development Timing 3 years from 2011
• Sales €3,500/sqm 3 years from 2012 (preliminary contract)
7
RESIDENTIAL sqm 5000 2011 2012 2013 2014 2015
Land acquisition 50% 50% 0% 0% 0%
Land drainage 100% 0% 0% 0% 0%Urban development costs 100% 0% 0% 0% 0%Building % 20% 40% 40% 0% 0%Preliminary contract % 0% 20% 25% 35% 20%Sale (notary's deed) % 0% 0% 0% 60% 40%
ERES 2011 Giacomo Morri - Paolo Benedetto
Input data – development
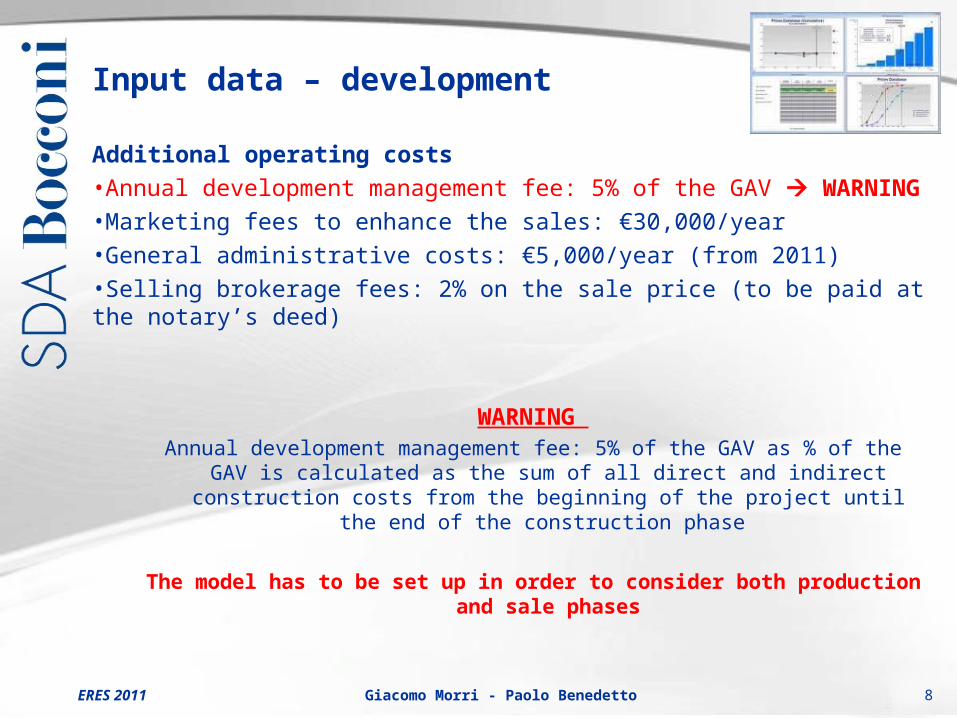
Additional operating costs
•Annual development management fee: 5% of the GAV WARNING
•Marketing fees to enhance the sales: €30,000/year
•General administrative costs: €5,000/year (from 2011)
•Selling brokerage fees: 2% on the sale price (to be paid at the notary’s deed)
WARNING Annual development management fee: 5% of the GAV as % of the GAV is
calculated as the sum of all direct and indirect construction costs from the beginning of the project until the end of the construction phase
The model has to be set up in order to consider both production and sale phases
8

ERES 2011 Giacomo Morri - Paolo Benedetto
Input data – funding issues
• Expected equity return 15% • Corporate tax rate 35%• No constant cap capital structure, but structured finance approach:
– purchase of the land without recurring to bank debt– capital expenditures financed with debt– no VAT financing
• Construction facility financing– loan to cost on CAPEX: 80% – interest rate: 5% – upfront fee: 0.60% over the total amount – Bullet financing with repayment accordingly to the notary’s deed sales (release
price 1.00)
• VAT rate– 10% on sales and on capex – 20% on all services
9

ERES 2011 Giacomo Morri - Paolo Benedetto
Problem solving – investment decisions
Two questions arise
•Would you buy the land @ €5,000,000? – Just yes or no… and why?
•Offering €3,000,000 fixed payment at the beginning, what is the maximum amount of extra return (in %) above a 10% hurdle rate (levered IRR) that can be granted to the seller as deferral payment at the end of the project?
– Calculating earn-out without any previous explanation: Knowledge of financial models Use of IRR
but no previous theory about earn-out scheme construction
10

ERES 2011 Giacomo Morri - Paolo Benedetto
Use of the case studySUNLIGHT VILLAGE
11

ERES 2011 Giacomo Morri - Paolo Benedetto
Use of SUNLIGHT VILLAGE case study
• Task: Investment valuation, financing & negotiation
• Object: Residential development scheme
• Main issues: – Investment spreadsheet model for DCF investment Analysis– Project financing approach (equity side)
• Students’ task– Case Study Requested Output Take decisions!
Yes or no Earn out
– Complete land development report using DCF (formula working spreadsheet)– Power point presentation – Class presentation
12

ERES 2011 Giacomo Morri - Paolo Benedetto
Use of SUNLIGHT VILLAGE case study
• Team working– Group composition– Working hours decision (When? Where? How?...)
• Data selection – What is really useful?– What is sensitive for the final decision?
• Application of finance to real estate– Accounting (P&L - Balance sheet)– Cash flow models (investment, financing, covenants etc.)– Investment criteria (IRR, NPV, PBP etc.)
• Practical skills– Use of spreadsheet– Power point presentation– Class presentation & Communication
13

ERES 2011 Giacomo Morri - Paolo Benedetto
Use of spreadsheet
• Not only finance, but also practical skills with daily tool– more and more companies require people already able to create and properly
manage DCF models & presentations
• Some major tips to use spreadsheet for case solution– Colors– Cell (data or formula)– Data input & calculation sheet– Output data sheets (for presentation and print)– Data analysis tools: Sensitivity & Goal seek
• Tips related to Power Point presentation – Executive summary– Use of attachments– Public speech presentation and complete document
14
ERES 2011 Giacomo Morri - Paolo Benedetto
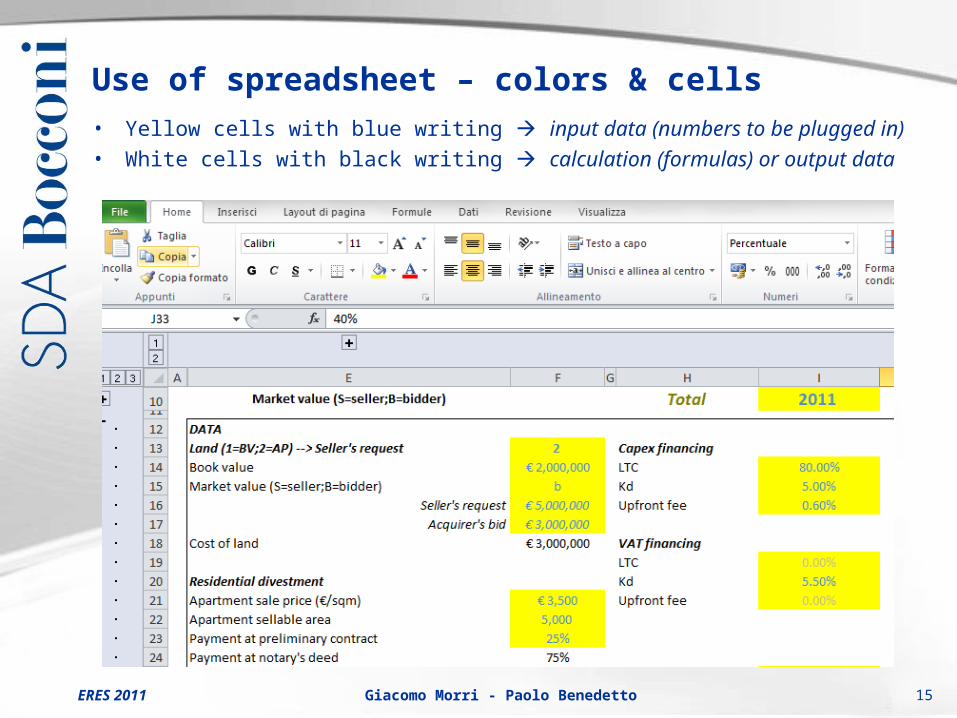
Use of spreadsheet – colors & cells
15
• Yellow cells with blue writing input data (numbers to be plugged in)
• White cells with black writing calculation (formulas) or output data
ERES 2011 Giacomo Morri - Paolo Benedetto
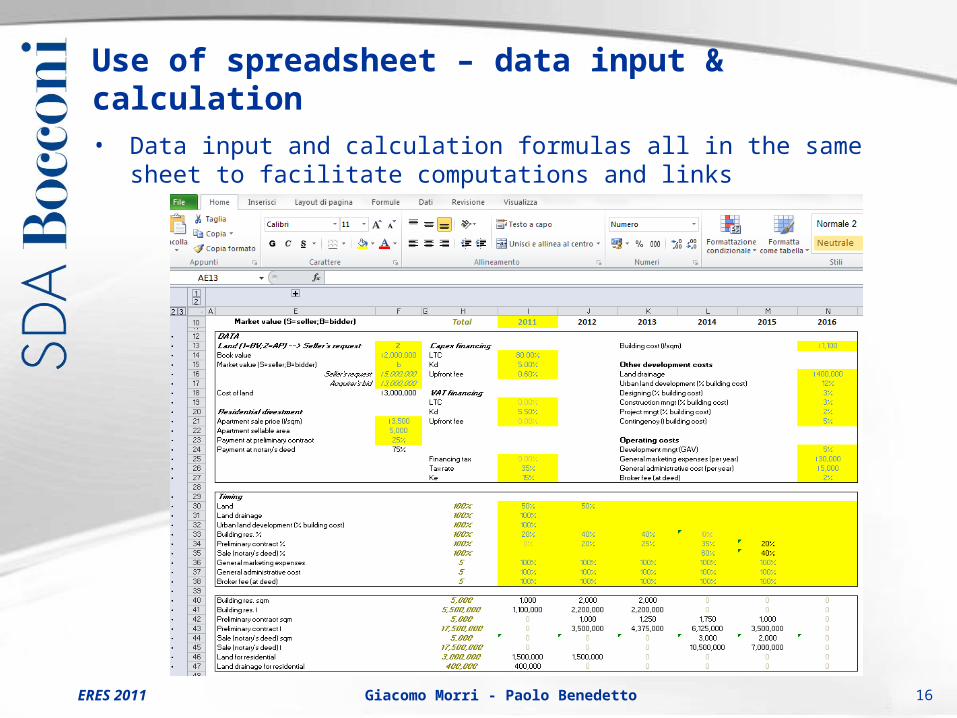
Use of spreadsheet – data input & calculation
16
• Data input and calculation formulas all in the same sheet to facilitate computations and links

ERES 2011 Giacomo Morri - Paolo Benedetto
Use of spreadsheet – output data sheets
17
• Output data separate from input and calculation sheet If input data changes, output tables and graphs are always ready to be copy-pasted in presentations and reports
2011 2012 2013 2014 2015WIPInventory residentialInitial inventory 27,452,440 0 3,918,150 8,143,600 10,993,350 4,397,340New production 10,993,350 3,918,150 4,225,450 2,849,750 0 0Sales 10,993,350 0 0 0 6,596,010 4,397,340Final inventory 27,452,440 3,918,150 8,143,600 10,993,350 4,397,340 0
Variation 3,918,150 4,225,450 2,849,750 -6,596,010 -4,397,340
Trading DebtInitial Trading Debt 3,718,750 0 0 875,000 1,968,750 875,000New Trading Debt 4,375,000 0 875,000 1,093,750 1,531,250 875,000Collected Trading Debt 4,375,000 0 0 0 2,625,000 1,750,000Final Trading Debt 3,718,750 0 875,000 1,968,750 875,000 0
Variation 0 875,000 1,093,750 -1,093,750 -875,000

ERES 2011 Giacomo Morri - Paolo Benedetto
Use of spreadsheet – data analysis tools
18
• Tables (1 or 2 entries)– Sensitivity analysis
• Graphs21.9% 3,000 3,200 3,500 3,700 4,000950 17.6% 21.5% 27.0% 30.6% 35.7%
1,000 15.9% 19.8% 25.3% 28.9% 33.9%1,050 14.1% 18.1% 23.6% 27.2% 32.2%1,100 12.4% 16.3% 21.9% 25.5% 30.6%1,150 10.6% 14.6% 20.3% 23.8% 28.9%1,200 8.9% 12.9% 18.6% 22.2% 27.3%1,250 7.3% 11.3% 17.0% 20.6% 25.7%
Apartment sale price (€/sqm)
Build
ing
cost
(€/s
qm)
-€ 4 -€ 3 -€ 2 -€ 1 € 0 € 1 € 2 € 3 € 4 € 5 € 6
2011 2012 2013 2014 2015
€ M
M
Levered cash flows
ERES 2011 Giacomo Morri - Paolo Benedetto
Solving a case studySUNLIGHT VILLAGE
example
19

ERES 2011 Giacomo Morri - Paolo Benedetto
Solution: main steps
• Analysis of the problem
• Data preparation – Building, operating and company costs– Work in progress: investment
• Accounting– Profit & loss statement – without debt– Unlevered cash flow statement – VAT flows
• Bank Financing– Profit & loss statement – with debt– Levered cash flow statement & Investment criteria
• Balance sheet
• Sensitivity analysis
• Deferral payment
20

ERES 2011 Giacomo Morri - Paolo Benedetto
Solution – building, operating & company costs
21
2011 2012 2013 2014 2015Building res. sqm 5,000 1,000 2,000 2,000 0 0Building res. € 5,500,000 1,100,000 2,200,000 2,200,000 0 0Preliminary contract sqm 5,000 0 1,000 1,250 1,750 1,000Preliminary contract € 17,500,000 0 3,500,000 4,375,000 6,125,000 3,500,000Sale (notary's deed) sqm 5,000 0 0 0 3,000 2,000Sale (notary's deed) € 17,500,000 0 0 0 10,500,000 7,000,000Land for residential 3,000,000 1,500,000 1,500,000 0 0 0Land drainage for residential 400,000 400,000 0 0 0 0
2011 2012 2013 2014 2015Operating costs residentialCost of ProductionLand res. 3,000,000 1,500,000 1,500,000 0 0 0Land drainage res. 400,000 400,000 0 0 0 0Residential Building 5,500,000 1,100,000 2,200,000 2,200,000 0 0Urban land development 660,000 660,000 0 0 0 0Designing 165,000 33,000 66,000 66,000 0 0Construction mngt 165,000 33,000 66,000 66,000 0 0Project mngt 110,000 22,000 44,000 44,000 0 0Contingency 275,000 55,000 110,000 110,000 0 0Development mngt 718,350 115,150 239,450 363,750 0 0
Total 10,993,350 3,918,150 4,225,450 2,849,750 0 0Other costs (not in WIP)General marketing expenses 150,000 30,000 30,000 30,000 30,000 30,000General administrative cost 25,000 5,000 5,000 5,000 5,000 5,000Broker fee (at deed) 350,000 0 0 0 210,000 140,000
Total 35,000 35,000 35,000 245,000 175,000
DA
TA
PR
EP
AR
ATIO
N
ERES 2011 Giacomo Morri - Paolo Benedetto
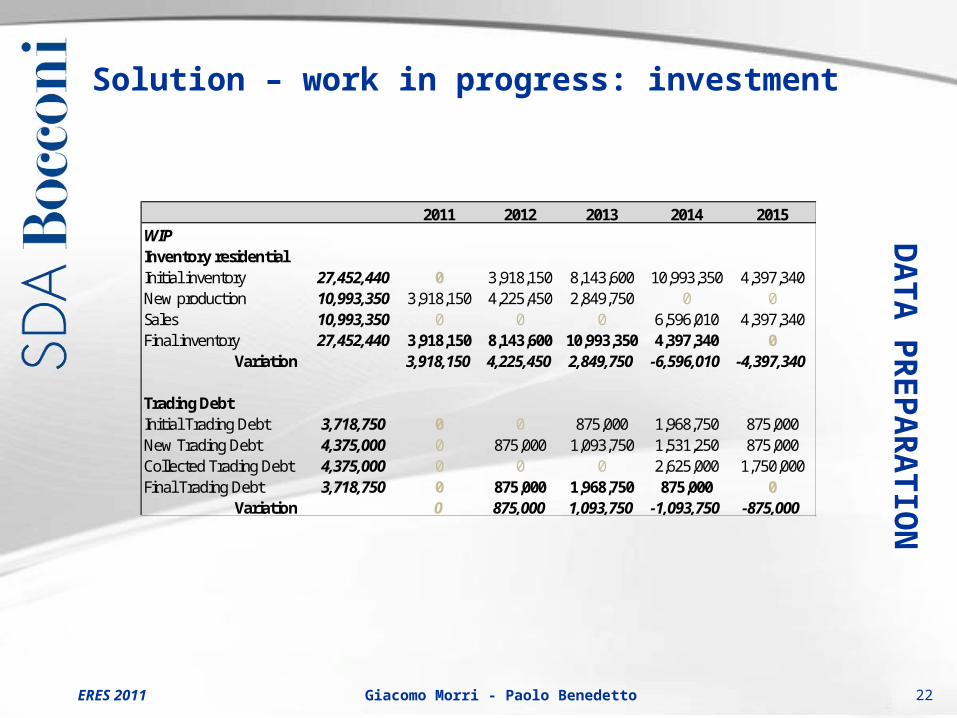
Solution – work in progress: investment
22
2011 2012 2013 2014 2015WIPInventory residentialInitial inventory 27,452,440 0 3,918,150 8,143,600 10,993,350 4,397,340New production 10,993,350 3,918,150 4,225,450 2,849,750 0 0Sales 10,993,350 0 0 0 6,596,010 4,397,340Final inventory 27,452,440 3,918,150 8,143,600 10,993,350 4,397,340 0
Variation 3,918,150 4,225,450 2,849,750 -6,596,010 -4,397,340
Trading DebtInitial Trading Debt 3,718,750 0 0 875,000 1,968,750 875,000New Trading Debt 4,375,000 0 875,000 1,093,750 1,531,250 875,000Collected Trading Debt 4,375,000 0 0 0 2,625,000 1,750,000Final Trading Debt 3,718,750 0 875,000 1,968,750 875,000 0
Variation 0 875,000 1,093,750 -1,093,750 -875,000
DA
TA
PR
EP
AR
ATIO
N
ERES 2011 Giacomo Morri - Paolo Benedetto
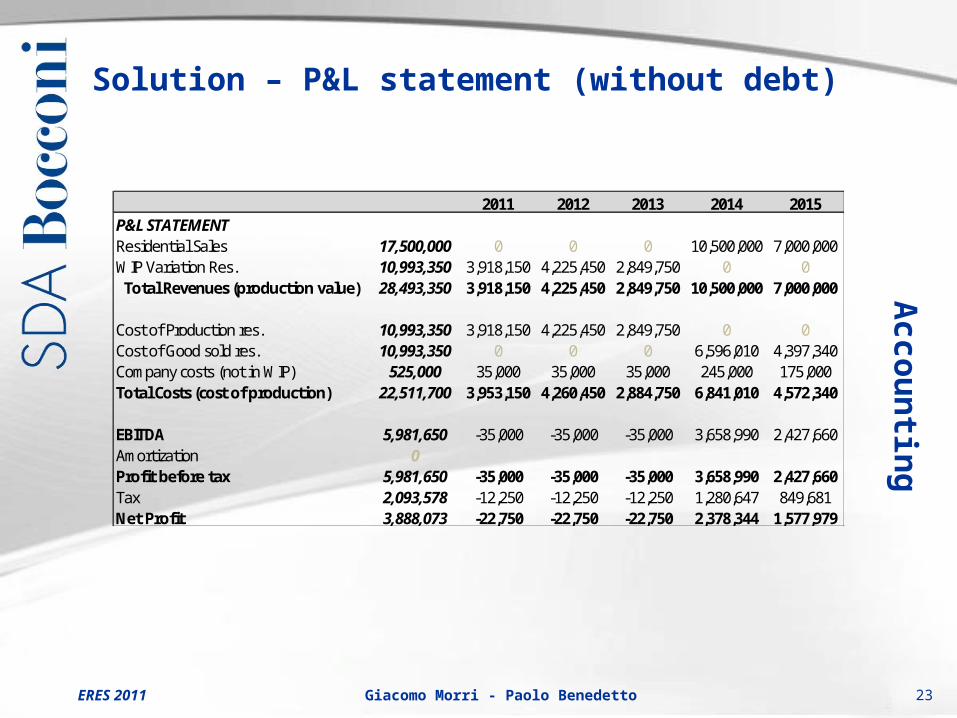
Solution – P&L statement (without debt)
23
2011 2012 2013 2014 2015P&L STATEMENTResidential Sales 17,500,000 0 0 0 10,500,000 7,000,000WIP Variation Res. 10,993,350 3,918,150 4,225,450 2,849,750 0 0
Total Revenues (production value) 28,493,350 3,918,150 4,225,450 2,849,750 10,500,000 7,000,000
Cost of Production res. 10,993,350 3,918,150 4,225,450 2,849,750 0 0Cost of Good sold res. 10,993,350 0 0 0 6,596,010 4,397,340Company costs (not in WIP) 525,000 35,000 35,000 35,000 245,000 175,000Total Costs (cost of production) 22,511,700 3,953,150 4,260,450 2,884,750 6,841,010 4,572,340
EBITDA 5,981,650 -35,000 -35,000 -35,000 3,658,990 2,427,660Amortization 0Profit before tax 5,981,650 -35,000 -35,000 -35,000 3,658,990 2,427,660Tax 2,093,578 -12,250 -12,250 -12,250 1,280,647 849,681Net Profit 3,888,073 -22,750 -22,750 -22,750 2,378,344 1,577,979
Accou
ntin
g

ERES 2011 Giacomo Morri - Paolo Benedetto
Solution – unlevered cash flow statement
24
2011 2012 2013 2014 2015CASH FLOW STATEMENTNet Profit 3,888,073 -22,750 -22,750 -22,750 2,378,344 1,577,979Amortization 0 0 0 0 0 0Inventory variation 0 -3,918,150 -4,225,450 -2,849,750 6,596,010 4,397,340Receivable variation 0 0 875,000 1,093,750 -1,093,750 -875,000 Investments 0Divestments 0Real Estate Cash Flow 3,888,073 -3,940,900 -3,373,200 -1,778,750 7,880,604 5,100,319
Unlevered IRR 14.36%
Accou
ntin
g

ERES 2011 Giacomo Morri - Paolo Benedetto
Solution – cash in & cash out
25
2011 2012 2013 2014 2015Cash OutLand res. 3,000,000 1,500,000 1,500,000 0 0 0Land drainage res. 400,000 400,000 0 0 0 0Residential Building 5,500,000 1,100,000 2,200,000 2,200,000 0 0Urban land development 660,000 660,000 0 0 0 0Designing 165,000 33,000 66,000 66,000 0 0Construction mngt 165,000 33,000 66,000 66,000 0 0Project mngt 110,000 22,000 44,000 44,000 0 0Contingency 275,000 55,000 110,000 110,000 0 0Development mngt 718,350 115,150 239,450 363,750 0 0General marketing expenses 150,000 30,000 30,000 30,000 30,000 30,000General administrative cost 25,000 5,000 5,000 5,000 5,000 5,000Broker fee (at deed) 350,000 0 0 0 210,000 140,000Tax 2,093,578 -12,250 -12,250 -12,250 1,280,647 849,681
Total 13,611,928 3,940,900 4,248,200 2,872,500 1,525,647 1,024,681
Cash InPreliminary contract (bookings) 4,375,000 0 875,000 1,093,750 1,531,250 875,000Final sale (notary's deed) 13,125,000 0 0 0 7,875,000 5,250,000
Total 17,500,000 0 875,000 1,093,750 9,406,250 6,125,000
Real Estate Cash Flow 3,888,073 -3,940,900 -3,373,200 -1,778,750 7,880,604 5,100,319
CH
EC
K

ERES 2011 Giacomo Morri - Paolo Benedetto
Solution – VAT
26
2011 2012 2013 2014 2015VATVAT on res. sale (debt) 10% 0 0 0 1,050,000 700,000VAT paid on capex (credit) 10% 221,500 231,000 231,000 0 0VAT paid on services (credit) 20% 47,630 90,090 114,950 49,000 35,000VAT balance 269,130 321,090 345,950 -1,001,000 -665,000
Initial VAT credit 0 269,130 590,220 936,170 0VAT balance 269,130 321,090 345,950 -1,001,000 -665,000 Intermediate VAT credit 269,130 590,220 936,170 -64,830 -665,000 VAT to be paid 0 0 0 -64,830 -665,000 VAT Payment o Refund 0 0 0 -64,830 -665,000 Final VAT credit 269,130 590,220 936,170 0 0
VAT balance 729,830 -269,130 -321,090 -345,950 1,001,000 665,000VAT Payment o Refund -729,830 0 0 0 -64,830 -665,000 VAT Flows 0 -269,130 -321,090 -345,950 936,170 0
Real Estate Cash Flow (inc. VAT) -4,210,030 -3,694,290 -2,124,700 8,816,774 5,100,319IRR 13.45%
Accou
ntin
g
ERES 2011 Giacomo Morri - Paolo Benedetto
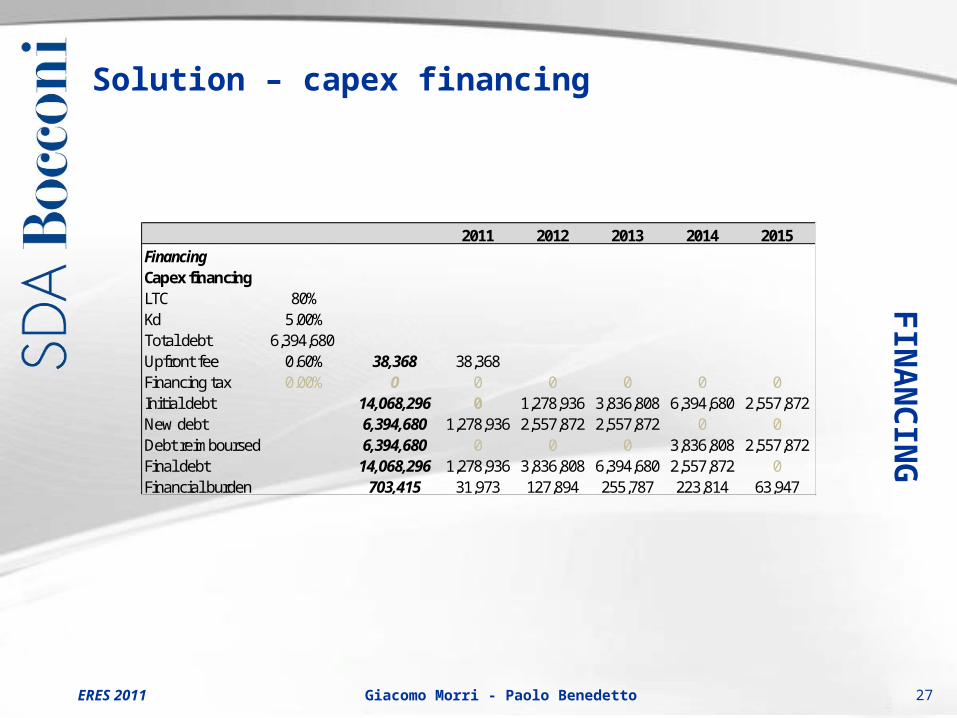
Solution – capex financing
27
2011 2012 2013 2014 2015FinancingCapex financingLTC 80%Kd 5.00%Total debt 6,394,680Upfront fee 0.60% 38,368 38,368Financing tax 0.00% 0 0 0 0 0 0Initial debt 14,068,296 0 1,278,936 3,836,808 6,394,680 2,557,872New debt 6,394,680 1,278,936 2,557,872 2,557,872 0 0Debt reimboursed 6,394,680 0 0 0 3,836,808 2,557,872Final debt 14,068,296 1,278,936 3,836,808 6,394,680 2,557,872 0Financial burden 703,415 31,973 127,894 255,787 223,814 63,947
FIN
AN
CIN
G

ERES 2011 Giacomo Morri - Paolo Benedetto
Solution – P&L statement (with debt)
28
2011 2012 2013 2014 2015P&L STATEMENTResidential Sales 17,500,000 0 0 0 10,500,000 7,000,000WIP Variation Res. 10,993,350 3,918,150 4,225,450 2,849,750 0 0
Total Revenues (production value) 28,493,350 3,918,150 4,225,450 2,849,750 10,500,000 7,000,000Cost of Production res. 10,993,350 3,918,150 4,225,450 2,849,750 0 0Cost of Good sold res. 10,993,350 0 0 0 6,596,010 4,397,340Company costs (not in WIP) 525,000 35,000 35,000 35,000 245,000 175,000
Total Costs (cost of production) 22,511,700 3,953,150 4,260,450 2,884,750 6,841,010 4,572,340EBITDA 5,981,650 -35,000 -35,000 -35,000 3,658,990 2,427,660Amortization 0 0 0 0 0 0EBIT 5,981,650 -35,000 -35,000 -35,000 3,658,990 2,427,660Financial burden 741,783 70,341 127,894 255,787 223,814 63,947EBT 5,239,867 -105,341 -162,894 -290,787 3,435,176 2,363,713Taxes 1,833,953 -36,870 -57,013 -101,776 1,202,312 827,300Net Income 3,405,914 -68,472 -105,881 -189,012 2,232,865 1,536,414
FIN
AN
CIN
G

ERES 2011 Giacomo Morri - Paolo Benedetto
Solution – levered cash flow statement
29
2011 2012 2013 2014 2015CASH FLOW STATEMENTNet Income 3,405,914 -68,472 -105,881 -189,012 2,232,865 1,536,414Amortization 0 0 0 0 0 0Inventory variation 0 -3,918,150 -4,225,450 -2,849,750 6,596,010 4,397,340Receivable variation 0 0 875,000 1,093,750 -1,093,750 -875,000 VAT credit variation 0 -269,130 -321,090 -345,950 936,170 0Investments 0Divestments 0New debt 6,394,680 1,278,936 2,557,872 2,557,872 0 0Debt reimboursement -6,394,680 0 0 0 -3,836,808 -2,557,872 FCFE (levered) 3,405,914 -2,976,816 -1,219,549 266,910 4,834,487 2,500,882Equity IN -2,976,816 -1,219,549 0 0 0Equity OUT 0 0 266,910 4,834,487 2,500,882IRR 21.94%NPV 773,170
FIN
AN
CIN
G

ERES 2011 Giacomo Morri - Paolo Benedetto
Solution – cash in & cash out
30
2011 2012 2013 2014 2015Cash OutLand res. 3,000,000 1,500,000 1,500,000 0 0 0Land drainage res. 400,000 400,000 0 0 0 0Residential Building 5,500,000 1,100,000 2,200,000 2,200,000 0 0Urban land development 660,000 660,000 0 0 0 0Designing 165,000 33,000 66,000 66,000 0 0Construction mngt 165,000 33,000 66,000 66,000 0 0Project mngt 110,000 22,000 44,000 44,000 0 0Contingency 275,000 55,000 110,000 110,000 0 0Development mngt 718,350 115,150 239,450 363,750 0 0General marketing expenses 150,000 30,000 30,000 30,000 30,000 30,000General administrative cost 25,000 5,000 5,000 5,000 5,000 5,000Broker fee (at deed) 350,000 0 0 0 210,000 140,000VAT Flows 936,170 269,130 321,090 345,950 0 0Financial burden 741,783 70,341 127,894 255,787 223,814 63,947Debt reimboursement 6,394,680 0 0 0 3,836,808 2,557,872Taxes 1,833,953 -36,870 -57,013 -101,776 1,202,312 827,300Total 21,424,936 4,255,752 4,652,421 3,384,712 5,507,933 3,624,118
Cash InPreliminary contract (bookings) 4,375,000 0 875,000 1,093,750 1,531,250 875,000Final sale (notary's deed) 13,125,000 0 0 0 7,875,000 5,250,000New debt 6,394,680 1,278,936 2,557,872 2,557,872 0 0
Total 24,830,850 1,278,936 3,432,872 3,651,622 10,342,420 6,125,000
FCFE (levered) 3,405,914 -2,976,816 -1,219,549 266,910 4,834,487 2,500,882
CH
EC
K
ERES 2011 Giacomo Morri - Paolo Benedetto
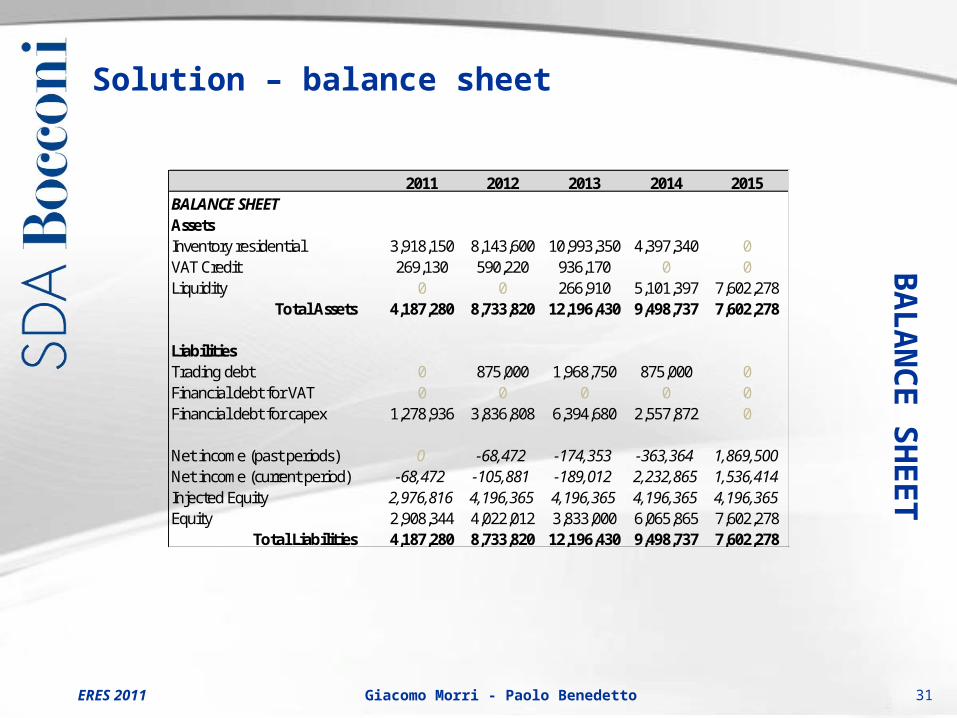
Solution – balance sheet
31
2011 2012 2013 2014 2015BALANCE SHEETAssetsInventory residential 3,918,150 8,143,600 10,993,350 4,397,340 0VAT Credit 269,130 590,220 936,170 0 0Liquidity 0 0 266,910 5,101,397 7,602,278
Total Assets 4,187,280 8,733,820 12,196,430 9,498,737 7,602,278
LiabilitiesTrading debt 0 875,000 1,968,750 875,000 0Financial debt for VAT 0 0 0 0 0Financial debt for capex 1,278,936 3,836,808 6,394,680 2,557,872 0
Net income (past periods) 0 -68,472 -174,353 -363,364 1,869,500Net income (current period) -68,472 -105,881 -189,012 2,232,865 1,536,414Injected Equity 2,976,816 4,196,365 4,196,365 4,196,365 4,196,365Equity 2,908,344 4,022,012 3,833,000 6,065,865 7,602,278
Total Liabilities 4,187,280 8,733,820 12,196,430 9,498,737 7,602,278
BA
LA
NC
E S
HEET

ERES 2011 Giacomo Morri - Paolo Benedetto
Solution – sensitivity analysis
32
21.9% 3,000 3,200 3,500 3,700 4,000950 17.6% 21.5% 27.0% 30.6% 35.7%
1,000 15.9% 19.8% 25.3% 28.9% 33.9%1,050 14.1% 18.1% 23.6% 27.2% 32.2%1,100 12.4% 16.3% 21.9% 25.5% 30.6%1,150 10.6% 14.6% 20.3% 23.8% 28.9%1,200 8.9% 12.9% 18.6% 22.2% 27.3%1,250 7.3% 11.3% 17.0% 20.6% 25.7%
Apartment sale price (€/sqm)
Build
ing
cost
(€/s
qm)
773,170 3,000 3,200 3,500 3,700 4,000950 272,768 690,809 1,317,869 1,735,909 2,362,970
1,000 91,142 509,242 1,136,303 1,554,343 2,181,4031,050 -93,789 327,676 954,736 1,372,776 1,999,8371,100 -278,721 144,260 773,170 1,191,210 1,818,2701,150 -463,652 -40,672 591,603 1,009,644 1,636,7041,200 -648,583 -225,603 408,867 828,077 1,455,1381,250 -833,514 -410,534 223,936 646,511 1,273,571
Apartment sale price (€/sqm)
Build
ing
cost
(€/s
qm)
SEN
SIT
IVIT
Y A
NA
LY
SIS

ERES 2011 Giacomo Morri - Paolo Benedetto
Solution – deferral payment
33
DEFER
RA
L P
AY
MEN
T
2011 2012 2013 2014 2015Target IRR 10.0% -2,976,816 -1,219,549 266,910 4,834,487 2,500,882Capitalized flows -4,358,356 -1,623,220 322,961 5,317,935 2,500,882Sum of capitalized flows -4,358,356 -5,981,576 -5,658,614 -340,679 2,160,202Deferred land payment 62.6% 1,352,287Effective FCFE 15.0% -2,976,816 -1,219,549 266,910 4,834,487 1,148,595
Offering €3,000,000 fixed payment at the beginning, what is the maximum amount of extra return (in %) above a 10% hurdle rate (levered IRR) that can be granted to the seller at the end of the project?
The maximum amount that can be granted to the seller at the end of the project is €1,352,287, i.e. 62% extra return

ERES 2011 Giacomo Morri - Paolo Benedetto 34
"In theory, there is no difference between theory and practice.
But, in practice, there is."
Johannes Lambertus Adriana van de Snepscheut
(computer scientist and educator)
Giacomo Morri Paolo Benedetto
Contacting Author
Giacomo Morri, PhDSDA Professor & Director Master in Real Estate Accounting, Control, Corporate Finance & Real Estate DepartmentSDA Bocconi School of ManagementMilan – [email protected]
www.propertyfinance.it
www.sdabocconi.it/mre


![Claudia Berretta, Elisa Morri, Riccardo Santolini ...€¦ · Claudia Berretta, Elisa Morri, Riccardo Santolini. Department of Human, Environmental and Natural Sciences [DiSUAN] University](https://static.fdocuments.in/doc/165x107/5f05c72f7e708231d414a8b4/claudia-berretta-elisa-morri-riccardo-santolini-claudia-berretta-elisa-morri.jpg)


