Specimens of Bushman Folklore (1911) - The Late Bleek Ph.D. & L.C.Lloyd

ERD
C SR
-13-
1
Investigation of the Corrosion Mechanism and Determination of the EMS Estimated Service Life at Site 81
Engi
neer
Res
earc
h an
d D
evel
opm
ent
Cent
er
Vincent F. Hock Jr., Charles A. Weiss, Jr., Robert D. Moser, Sean W. Morefield, and James B. Bushman
February 2013
Approved for public release; distribution is unlimited.

The US Army Engineer Research and Development Center (ERDC) solves the nation’s toughest engineering and environmental challenges. ERDC develops innovative solutions in civil and military engineering, geospatial sciences, water resources, and environmental sciences for the Army, the Department of Defense, civilian agencies, and our nation’s public good. Find out more at www.erdc.usace.army.mil.
To search for other technical reports published by ERDC, visit the ERDC online library at http://acwc.sdp.sirsi.net/client/default.

ERDC SR-13-1 February 2013
Investigation of the Corrosion Mechanism and Determination of the EMS Estimated Service Life at Site 81
Vincent F. Hock Jr. and Sean W. Morefield US Army Engineer Research and Development Center (ERDC) Construction Engineering Research Laboratory (CERL) 2902 Newmark Drive PO Box 9005 Champaign, IL 61826-9005
Charles A. Weiss Jr. and Robert D. Moser US Army Engineer Research and Development Center (ERDC) Geotechnical and Structures Laboratory (GSL) 3909 Halls Ferry Road Vicksburg, MS 39180
James B. Bushman Bushman & Associates, Inc. 6395 Kennard Road PO Box 425 Medina, OH 44256
Final report Approved for public release; distribution is unlimited.
Prepared for U.S. Army Corps of Engineers Europe District CMR 410, Box 1, APO, AE 09049
Under “Investigation of Corrosion Mechanism and Recommendations for Corrosion Mitigation.”

ERDC SR-13-1 ii
Abstract
Structural damage resulting from corrosion of steel-clad structures can be of concern, especially when the steel is part of electromagnetic shielding of an underground structure. The US Army Corps of Engineers was called to lend assistance by having its corrosion experts and research laboratories investigate the condition and extent of corrosion at such a structure (Site 81) in Israel. This report documents the investigation, conclusions, and recommendations. In summary, from investigation and analyses of core samples, no significant corrosion was discovered and the estimated mini-mum service life of the existing structure is 199 years.

ERDC SR-13-1 iii
Contents Abstract .......................................................................................................................................................... ii
List of Figures and Tables............................................................................................................................ iv
Preface ............................................................................................................................................................ vi
Unit Conversion Factors ........................................................................................................................... viii
1 Introduction ............................................................................................................................................ 1 1.1 Background .................................................................................................................... 1 1.2 Objectives ...................................................................................................................... 1 1.3 Approach ........................................................................................................................ 2
1.3.1 Task 1 .......................................................................................................................... 2 1.3.2 Task 2 .......................................................................................................................... 2 1.3.3 Task 3 .......................................................................................................................... 3 1.3.4 Task 4 .......................................................................................................................... 3
2 Field Testing the Experimental Plan ................................................................................................. 4
3 Field Testing: August 9–17, 2012 ..................................................................................................... 8
4 Core Sample Testing ..........................................................................................................................13 4.1 Methods ....................................................................................................................... 14
4.1.1 Acid-soluble chloride content analysis ..................................................................... 14 4.1.2 Petrographic analysis ............................................................................................... 14
4.2 Results and discussion ............................................................................................... 15 4.2.1 Acid-soluble chloride content ................................................................................... 15 4.2.2 Petrographic analysis ................................................................................................ 17
4.3 Conclusions of concrete core testing ......................................................................... 34
5 Summary of Results ........................................................................................................................... 35
6 Recommendations .............................................................................................................................. 37
7 References ........................................................................................................................................... 38
Appendix A: Water Testing ........................................................................................................................ 39
Appendix B: EMF Liner Corrosion Rate Measurement ....................................................................... 42
Appendix C: As-Received Core Samples ................................................................................................ 45
Appendix D: Supplemental Photomicrographs ..................................................................................... 54
Report Documentation Page

ERDC SR-13-1 iv
Figures and Tables
Figures
Figure 1. Step 1 of the in-situ LPR corrosion rate measurements. ......................................................... 4 Figure 2. Step 2 of the in-situ LPR corrosion rate measurements. ......................................................... 4 Figure 3. Step 3 of the in-situ LPR corrosion rate measurements. ......................................................... 5 Figure 4. Step 4 of the in-situ LPR corrosion rate measurements. ......................................................... 5 Figure 5. Step 5 of the in-situ LPR corrosion rate measurements. ......................................................... 6 Figure 6. Step 6 of the in-situ LPR corrosion rate measurements. ......................................................... 7 Figure 7. Step 7 of the in-situ LPR corrosion rate measurements........................................................... 7 Figure 8. Existing trough in concrete liner over EMS steel plate. ............................................................. 8 Figure 9. 16 in. diameter core hole cut to expose steel EMS for testing. ............................................... 8 Figure 10. Synthetic canvas bag containing two large instrument cases for transport to basement test site. ...................................................................................................................................... 10 Figure 11. Epoxy injection overview. ......................................................................................................... 11 Figure 12. Two-part epoxy-mixing caulking gun. ..................................................................................... 11 Figure 13. Close-up photo of epoxy injection. .......................................................................................... 11 Figure 14. Close-up photo of holes after final placement of bolts. ...................................................... 11 Figure 15. Segments of reinforcing steel extracted at 2-3 in. depth from core sample #4 (left) and core sample #5 (right) with both showing minor surface corrosion. .................................... 15 Figure 16. Photomicrographs of core sample #1 (5x above; 15x below). .......................................... 18 Figure 17. Photomicrographs of core sample #3 (5x above; 15x below). ............................................ 19 Figure 18. Photomicrographs of core sample #4 (5x above, 15x below). ............................................ 20 Figure 19. Photomicrographs of core sample #5 (5x above, 15x below). ............................................ 21 Figure 20. Photomicrographs of core sample #6 (5x above, 15x below). ............................................ 22 Figure 21. Photomicrographs of core sample #7 (5x above, 15x below). ............................................ 23 Figure 22. Photomicrographs of core sample #8 (5x above, 15x below). ............................................ 24 Figure 23. Photomicrographs of core sample #9 (5x above, 15x below). ............................................ 25 Figure 24. Photomicrographs of core sample #10 (5x above, 15x below). ......................................... 26 Figure 25. Photomicrographs of core sample #11 (5x above, 15x below). ......................................... 27 Figure 26. Photomicrographs of core sample #12 (5x above, 15x below). ......................................... 28 Figure 27. Photomicrographs of core sample #13 (5x above, 15x below). .......................................... 29 Figure 28. Photomicrographs of core sample #14 (5x above, 15x below). ......................................... 30 Figure 29. Photomicrographs of core sample #15 (5x above, 15x below). ......................................... 31 Figure 30. Photomicrographs of core sample #16 (5x above, 15x below). ......................................... 32 Figure 31. Photomicrographs of core sample #17 (5x above, 15x below). .......................................... 33

ERDC SR-13-1 v
Tables
Table 1. Chloride content results from core samples #1–#11. ............................................................. 16 Table 2. Chloride content results from core samples #12–#17. ......................................................... 17

ERDC SR-13-1 vi
Preface
This study was conducted for the US Army Corps of Engineers, Europe District under the Project, “Investigation of Corrosion Mechanism and Recommendations for Corrosion Mitigation,” which was funded by Mili-tary Interdepartmental Purchase Request (MIPR) #W2SD0622151436. The technical monitor was Adam Beris of the U.S Army Corps of Engi-neers, Israel Area Office, Northern Israel Resident Office (CENAU-EC-CI-N).
The work was performed by the Structures and Materials Branch (CF-M) of the Facilities Division (CF), U.S. Army Engineer Research and Devel-opment Center – Construction Engineering Research Laboratory (ERDC-CERL) at Champaign, IL. At the time of publication, Ms. Vicki Van Blaricum was Chief, CEERD-CF-M; Mr. L. Michael Golish was Chief, CEERD-CF; and Mr. Marty Savoie was the Technical Director for Envi-ronmental Quality and Infrastructure. The Deputy Director of ERDC-CERL was Dr. Kirankumar V. Topudurti and the Director was Dr. Ilker R. Adiguzel.
Laboratory analysis was performed by the Concrete and Materials Branch (CMB), Engineering Systems and Materials Division (ESMD), U.S. Army En-gineer Research and Development Center – Geotechnical and Structures Laboratory (ERDC-GSL) at Vicksburg, MS. At the time of publication, Chris-topher M. Moore was Chief, CMB; Dr. Larry N. Lynch was Chief, ESMD. The Deputy Director of ERDC-GSL was Dr. William P. Grogan and the Director was Dr. David W. Pittman.
COL Kevin J. Wilson was the Commander of ERDC, and Dr. Jeffery P. Holland was the Director.
Acknowledgements
The ERDC project delivery team (PDT) consisted of Mr. Vincent F. Hock, Mr. Sean W. Morefield, and Ms. Heather E. Johnson, ERDC-CERL; Dr. Robert D. Moser and Dr. Charles A. Weiss Jr., ERDC-GSL; and James B. Bushman, corrosion consultant. Laboratory assistance was provided by Mr. Kevin Torres-Cancel and Ms. Linda J. Ragan of the Concrete and Ma-terials Branch (CMB) at ERDC-GSL. Additional analytical chemistry sup-

ERDC SR-13-1 vii
port was provided by the Environmental Chemistry Branch, Environmen-tal Processes and Engineering Division of the ERDC Environmental La-boratory (ERDC-EL) in Vicksburg, MS.

ERDC SR-13-1 viii
Unit Conversion Factors
Multiply By To Obtain
cubic yards 0.7645549 cubic meters
feet 0.3048 meters
foot-pounds force 1.355818 joules
inches 0.0254 meters
microns 1.0 E-06 meters
pounds (force) per square inch 6.894757 kilopascals
pounds (mass) 0.45359237 kilograms

ERDC SR-13-1 1
1 Introduction
1.1 Background
As part of an ongoing project and to add improvements to an existing un-derground structure, the structure’s upper concrete overlay and galvanized steel plate comprising the electromagnetic shielding (EMS) were removed at selected locations. The galvanized steel plate was also removed at some wall locations. Almost all of the extracted plates exhibited some level of corrosion on the side that was in contact with the floor/wall concrete ele-ment while little or no corrosion was observed on the surface in contact with the 15–17 cm thick concrete overlay. Four samples were sent by the contractor to a laboratory which determined that the thickness of the cor-rosion was on the order of 100 microns.
Subsequently, several other locations were exposed and the visual results regarding corrosion found to be consistent with the initial findings. Alt-hough the total area of extracted galvanized steel plate is very small with respect to the total area of EMS, it is reasonable to assume that the corro-sion problem is very likely present throughout the whole envelope. It is worthwhile noting that at some locations of the floor slab, the presence of water was observed in the interstitial space between the slab and the plate. The source of this water has not been categorically determined and is con-troversial; possible sources of the water include byproduct of saw cutting operations performed by the current contractor, leftover rain water accu-mulated during the original construction, mix-water remaining after ce-ment hydration during concrete pour, and infiltration from the local groundwater due to possible damage in the waterproofing membrane. The extent of the water permeation is unknown at this time.
1.2 Objectives
The US Army Corps of Engineers was called to investigate the condition of and extent of corrosion on electromagnetic shielding at Site 81 in Israel. It was desired to estimate the remaining service life of the EMS based on ob-served conditions and measurements, and remediation courses if required.

ERDC SR-13-1 2
1.3 Approach
A field investigation was performed by the corrosion expert from ERDC-CERL and the corrosion consultant to observe and document the existing site conditions as it related to corrosion of the EMS, to gather pertinent information, and to supervise the physical drilling and coring (Steps 1–7; see Chapter 2) of the concrete overlay, EMS steel plate, and underlying concrete slab. Sample removal and other required physical labor was per-formed by additional on-site personnel. In-situ testing to collect the neces-sary data was performed by the corrosion expert and consultant. After the field testing was completed, laboratory testing and engineering analysis occurred. The investigation included the four tasks given below.
1.3.1 Task 1
Review available information on existing conditions and issues, and devel-op a field and laboratory testing plan.
1.3.2 Task 2
Calibrate testing equipment, including all components required to perform on-site testing, and prepare for overseas shipping. Equipment to be pro-vided includes the following instruments to perform in-situ linear polari-zation resistance (LPR) tests:
• 1 each — Gamry Reference 600™ Potentiostat DC/ AC corrosion measurement system
• 2 each — Computers with custom Gamry corrosion-rate software to operate potentiostat and analysis software to compile and summa-rize data.
• 2 each — Custom-built, project-specific counter electrodes of pre-cious metal oxide-(PMO) coated titanium
• 2 each — Custom-built, project-specific reference electrodes of PMO-coated titanium
• Instruments to be used to perform measurement of the EMS steel plate corrosion potential at the concrete slab/steel interface:
• 1 each — Fluke® Meter Model 293, a 5-½ digit precision volt-ohm meter (VOM)
• 1 each — Fluke Meter Model 865, a VOM meter with oscilloscope function
• 1 Each — Extech® Model 381295, a dual-channel true RMS 5 MHz digital oscilloscope

ERDC SR-13-1 3
• 1 Each — Extech Model 540, a 5-½ digit precision VOM recording meter
• 2 Each — Silver/silver chloride (Ag/AgCl) reference electrodes • 1 Each — Digital camera with macro lens capability to focus 1 in.
from lens. • Multiple test lead wires as needed for project
1.3.3 Task 3
Perform a field investigation of existing conditions as it relates to the cor-rosion of existing steel plates at the project site in Tel Aviv, Israel. The field testing included the following steps.
1. In-situ LPR testing to determine the active corrosion rate of the steel EMS surface in contact with the concrete slab.
2. Measuring the EMS steel plate corrosion potential at the concrete slab/steel interface at each of the selected LPR test locations after coring through the EMS steel plate and after performing the LPR tests.
3. Measuring moisture content at incremental depths in the thick con-crete slab underneath the metal plate and two walls. All moisture con-tent measurements shall be made using a GE Protimeter™ with an auxiliary deep-wall probe at various locations on the floor near selected locations where core samples will be extracted. The technique uses a two-wire probe to measure the concrete resistivity which is inversely related to the moisture content. A series of moisture measurements were made using the Protimeter probe, and a moisture profile was ob-tained. This test was performed prior to removing the core samples.
1.3.4 Task 4
Analyze the on-site in situ test results and prepare an interim report, which was submitted by ERDC to USACE-NAU on 9 September 2012. The interim report contained a clear summary of conclusive findings on the corrosion mechanism and the expected service life of the steel plates.

ERDC SR-13-1 4
2 Field Testing the Experimental Plan
Task 1 included a review of available information on existing conditions and issues, and development of a field and laboratory testing plan. The re-quired steps for performing the in-situ LPR corrosion rate measurements and the corrosion potential measurements were developed based on verbal and emailed descriptions of the structure construction. These seven steps are outlined below.
Step 1: Drill 4 in. core through concrete liner to steel plate EMS using di-amond core drill (Figure 1).
Figure 1. Step 1 of the in-situ LPR corrosion rate measurements.
Step 2: Pin EMS steel plate to underlying reinforced concrete with steel bolts inserted through EMS into epoxy-filled holes (Figure 2).
Figure 2. Step 2 of the in-situ LPR corrosion rate measurements.

ERDC SR-13-1 5
Step 3: After bolt epoxy has cured, use 3 in. diameter diamond-tipped core drill to drill down through steel plate and at least 2 ½ in. into under-lying concrete (Figure 3). Be sure drill is centered on the bolts securing the plate to concrete.
Figure 3. Step 3 of the in-situ LPR corrosion rate measurements.
Step 4: Insert precious metal oxide coated counter and reference elec-trodes into opposite sides of annulus created by 3 in. diameter core hole so that bottom of electrode touches the bottom of cored hole (Figure 4).
Figure 4. Step 4 of the in-situ LPR corrosion rate measurements.

ERDC SR-13-1 6
Step 5: Connect Gamry test leads to counter (white lead) and reference electrodes (red lead) and blue/green leads to pointed tool pressed in con-tact with center disk (working electrode of 3 in. diameter steel EMS disk) (Figure 5). Be sure counter and reference electrode insulated section iso-lates electrodes from EMS plate.
Figure 5. Step 5 of the in-situ LPR corrosion rate measurements.
Step 6: After LPR tests are complete (minimum 3 scans per cored hole), continue 3 in. core hole down to minimum 4–6 in. depth below EMS steel plate. Remove the breakout core from hole for future laboratory analysis by ERDC-CERL. After core is removed, detach EMS steel plate from core and exam surface in contact with underlying concrete (including photo

ERDC SR-13-1 7
documentation) to define percentage of surface that is suffering corrosion attack (Figure 6).
Figure 6. Step 6 of the in-situ LPR corrosion rate measurements.
Step 7: Measure steel EMS surface in contact with underlying concrete electrical corrosion potential using 3.5 molar potassium chlo-ride/silver/silver chloride reference electrode and Fluke Model 289 5½ digit precision VOM meter (Figure 7).
Figure 7. Step 7 of the in-situ LPR corrosion rate measurements.

ERDC SR-13-1 8
3 Field Testing: August 9–17, 2012
The initial site inspection revealed that there were a number of approxi-mately 16 in. (40 cm) wide troughs (Figure 8) that had been cut through the inner concrete liner to expose the EMS steel plate for inspection by others. It was decided that many of the test sites could be located within the precut troughs, saving considerable work by the site contractor and al-lowing additional time to perform the testing.
It was also determined that the site contractor had the capability of readily cutting 16 in. (40 cm) diameter core holes down to the EMS plate (Figure 9) which then could be readily removed to expose the plate. These larger access ports would also make later testing more efficient and accurate.
Figure 8. Existing trough in concrete liner over EMS steel plate.
Figure 9. 16 in. diameter core hole cut to expose steel EMS for testing.

ERDC SR-13-1 9
During this inspection, the general location of 10–12 test locations were identified on the main-floor level; it was anticipated that an additional two locations would tested in the sunken portion of the floor, and two wall samples would also be tested (one near floor level and one near the ceil-ing). If time permitted, it was intended that one core would be taken in the ceiling, but it was later determined that the local contractor’s equipment could not cut cores in the ceiling. This restriction was primarily because water cooling of the contractor’s cutting tool was required, and this cutting solution would flow down on and into the electric motor driving the core drill. After the site inspection was completed, the testing plan was finalized including additional details for the work that would begin on Sunday morning, beginning at 8 a.m. that day and each day thereafter. It should be noted that each test day typically ended at 6 p.m., and lunch breaks were not taken.
The test equipment was unpacked on Saturday, before testing began; each piece of equipment including meter, reference electrode, camera, and test leads were individually tested for functionality and accuracy. The LPR sys-tem then was set up, and several full scans were completed using glass chambers containing the “working”, “counter,” and “reference” electrodes coupled to the Gamry 600 instrument. In turn, the Gamry 600 was con-nected to an HP Envy 15 portable computer equipped with the necessary LPR testing software.
An initial meeting was held on Sunday morning with local USACE and site contractor personnel1 to familiarize all personnel with the study plans, methodologies, and assistance needed from M+W. M+W personnel indi-cated they were fully equipped to meet the project needs and would pro-vide the necessary professional support staff to facilitate the project in-cluding coring all test holes, providing lighting for dark locations, vacuums and minimum 100 psi air pressure nozzle blasters to clean holes. Their as-sistance was essential to the successful completion of the project. Figure 10 shows the instrument cases being transported to the basement test site.
1 M+W Group of M+W U.S., Inc. of Rehovot, Israel (M+W).

ERDC SR-13-1 10
Figure 10. Synthetic canvas bag containing two large instrument cases
for transport to basement test site.
It was then decided that trial LPR scans and concrete moisture tests should be performed at the first two locations to confirm the methodology to be used and to identify any problems. To perform the subsequent LPR testing, it was essential that the steel plate be held firmly in place while cutting through the plate with a core drill. To accomplish this, it was nec-essary to drill three 5/16 in. (0.8 cm) diameter holes approximately 1.5 in. (3.9 cm) deep through the steel plate on an equilateral triangle spacing to prevent the cut plate from rotating independent of the concrete cylinder as the diamond core bit rotated (see Step 2 of test procedure, Chapter 2). This proved to be extremely difficult as the EMS steel was an extremely hard material. Using drill bits with a titanium coating later improved the time to drill the three holes on each plate. After the three holes were drilled through the electromagnetic field (EMF) plate into the underlying con-crete, the holes were first vacuum cleaned, followed by high-pressure air blowing to remove all dust and moisture (although moisture would imme-diately begin seeping back into these holes at some locations). Immediate-ly following cleaning of each hole, a special caulking gun was placed into each hole; the gun contained two tubes of epoxy components (A & B) with a spiral mixing tip. Sufficient epoxy was injected to barely overflow each hole, immediately after which the steel bolts were firmly inserted flush to the plate in each hole (Figure 11–Figure 14). In most cases, the bolts had to

ERDC SR-13-1 11
be depressed several times to displace enough epoxy so that the bolt head was tight to the steel plate.
Figure 11. Epoxy injection overview. Figure 12. Two-part epoxy-mixing caulking gun.
Figure 13. Close-up photo of epoxy injection. Figure 14. Close-up photo of holes after final placement of bolts.
After the epoxy had cured for at least 1 hr, a socket wrench was used to en-sure each bolt was firmly cemented into the underlying concrete. Follow-ing setting of the bolts in locations #1 and #2, a concrete coring machine equipped with a 4.6 in. (11.6 cm) inside diameter, diamond-tipped core bit was set in place so that the core bit would not cut into any of the bolt heads. The machine was then secured in place, and the diamond bit was lowered to cut through the steel plate and into the underlying concrete to a depth of 2.5 in. (6 cm) below the EMF steel plate at locations #1 and #2.

ERDC SR-13-1 12
A number of issues were identified and techniques were evaluated to de-termine the best means for obtaining quality data. One of the biggest prob-lems encountered in obtaining data was the continuing ingress of ground-water seeping into the cored hole. This condition changed the water level on a continuing basis at many of the core test locations. Where this situa-tion existed, an industrial vacuum cleaner with water/dust separator was used with a narrow channel hose tip to remove water, as best as possible, at a rate which would keep the water at a constant level below the EMS plate level.

ERDC SR-13-1 13
4 Core Sample Testing
ERDC-CERL requested that the Concrete and Materials Branch (CMB) of ERDC-GSL provide support for the investigation of 16 of the 17 concrete core samples extracted from Site 81.2 Appendix C shows the condition of the as-received core samples.
The thickness measurements of the two EMS steel plate sections that were shipped with the core samples were:
1. The floor section thickness was an average (three measurements) 0.116 inches ( 2.9464 mm).
2. The wall section thickness was an average (three measurements) 0.1233 inches (3.13 mm).
The thickness measurements indicate very little floor EMS plate metal loss over the 11-year timeframe since construction. This conclusion is based on the original EMS plate thickness of ~3 mm estimate by NAU. This vali-dates our service life estimates of 200–500 years based on the in situ cor-rosion rates (See Chapter 5, Conclusions).
On 17 September 2012, the 16 concrete core samples were received by the CMB. Analyses requested for each sample included: (a) chloride content measurements at three depths from the surface of the core and (b) a gen-eral petrographic analysis of a polished sample to investigate key features of the concrete microstructure and any possible modes of deterioration present.
The following sections provide details of the techniques used for the chlo-ride content and petrographic analysis and the results obtained.
2 Author Vincent Hock verifies that 17 samples were taken at the site and none were mislabeled; howev-
er, he noted there was not a sample #2 received in the shipment of samples to ERDC-CERL, for which he supervised the unpacking. Thus, only 16 of the 17 samples originally taken could be analyzed.
ERDC SR-13-1 14
4.1 Methods
4.1.1 Acid-soluble chloride content analysis
An analysis of acid-soluble chloride content was performed according to ASTM C1152, “Standard Test Method for Acid-Soluble Chloride in Mortar and Concrete.” Segments of concrete were sectioned from each core at depths of 0–1 in., 1–2 in., and 2–3 in. from the surface of the core. Em-bedded pieces of rebar in the segments were removed by rough crushing of concrete in a hydraulic press. Each concrete segment was pulverized until it would pass through a No. 20 sieve (850 µm). Acid-soluble chloride was extracted from 10 g of the pulverized concrete powder by first dispersing the powder in 100 ml of deionized water (H2O), followed by addition of 25 ml solution of dilute nitric acid (HNO3 at 1:1 with deionized H2O). Solu-tions were then filtered and stored in vials.
Chloride content analysis was performed using ion chromatography by the Environmental Chemistry Branch of the ERDC Environmental Laboratory (ERDC-EL). Results of chloride content analyses were provided as parts per million (ppm) in the solutions analyzed which was converted to a per-centage by mass of the 10 g starting material. This percentage by mass val-ue was then converted to typical lb/yd3 and kg/m3 by using assumed con-crete unit weights of 4000 lb/yd3 and 2400 kg/m3, respectively.
4.1.2 Petrographic analysis
Petrographic analysis using stereomicroscopy (SM) was performed on all samples according to ASTM C856, “Standard Practice for Petrographic Examination of Hardened Concrete.” An approximately 1 in. thick slice was made from each concrete core received and lapped using alumina sus-pensions in water to a particle size of 5 µm. Polished samples were imaged using a Zeiss Stereo Discovery V12 microscope at magnifications of 5x–15x. An overall image was taken of each sample at low magnification and at least three selected sites were also imaged at higher magnification. Key microstructural features noted included fine and coarse aggregate size, morphology and mineralogy, air voids, the presence of fibers, and any de-terioration observed.

ERDC SR-13-1 15
4.2 Results and discussion
4.2.1 Acid-soluble chloride content
Results from acid-soluble chloride analysis are presented in Table 1 and Table 2 for each of the sixteen concrete cores at 0–1 in., 1–2 in., and 2–3 in. depths from the surface. Chloride content ranges from 0.097—2.068 lb/yd3. However, all but the topmost layer in sample #1 were below the threshold limit of 1 to 2 lbs/yd3 of concrete necessary to initiate corro-sion. 11 of the 16 cores tested had no definable increase in chloride ion concentration from the 3 in. level up through the 2 in. level to the 1 in. depth. Because the GSL team had no knowledge of the configuration and location of concrete cores taken at Site 81, conclusions related to potential exposure conditions and chloride ingress trends could not be made. Rein-forcing bars extracted from cores showed signs of minor corrosion (Figure 15); however, this condition most likely was due to atmospheric corro-sion prior to or during original installation of the rebar. Corrosion of the reinforcing steel’s exposed surface at the exterior of concrete cores was also noted; however, such corrosion likely occurred following the coring process when the steel was exposed to neutral pH water and oxygen.
Figure 15. Segments of reinforcing steel extracted at 2-3 in. depth from core sample #4 (left)
and core sample #5 (right) with both showing minor surface corrosion.

ERDC SR-13-1 16
Table 1. Chloride content results from core samples #1–#11.
Core Sample No.* Depth CI Content (%) *by mass concrete
Cl- Content (lb/yd3) *assume 4000 lb/yd3
Cl- Content (kg/m3) *assume 2400 kg/m3
#1 0-1 in. 0.052 2.068 1.228
1-2 in. 0.039 1.540 0.914
2-3 in. 0.027 1.060 0.629
#3 0-1 in. 0.023 0.924 0.549
1-2 in. 0.007 0.289 0.171
2-3 in. 0.009 0.364 0.216
#4 0-1 in. 0.021 0.831 0.493
1-2 in. 0.008 0.336 0.199
2-3 in. 0.004 0.179 0.106
#5 0-1 in. 0.007 0.281 0.167
1-2 in. 0.003 0.116 0.069
2-3 in. 0.003 0.123 0.073
#6 0-1 in. 0.012 0.467 0.277
1-2 in. 0.008 0.321 0.190
2-3 in. 0.009 0.357 0.212
#7 0-1 in. 0.020 0.818 0.486
1-2 in. 0.016 0.639 0.380
2-3 in. 0.009 0.354 0.210
#8 0-1 in. 0.017 0.669 0.397
1-2 in. 0.013 0.506 0.300
2-3 in. 0.011 0.428 0.254
#9 0-1 in. 0.007 0.300 0.178 1-2 in. 0.006 0.220 0.131 2-3 in. 0.005 0.207 0.123
#10 0-1 in. 0.004 0.163 0.097 1-2 in. 0.007 0.279 0.166
2-3 in. 0.008 0.332 0.197
#11 0-1 in. 0.015 0.595 0.353
1-2 in. 0.011 0.454 0.270
2-3 in. 0.008 0.322 0.191
*Note: sample #2 was not included in this study due to not being included in shipment.

ERDC SR-13-1 17
Table 2. Chloride content results from core samples #12–#17.
Core Sample No. Depth CI Content (%) *by mass concrete
Cl- Content (lb/yd3) *assume 4000 lb/yd3
Cl- Content (kg/m3) *assume 2400 kg/m3
#12 0-1 in. 0.008 0.316 0.187
1-2 in. 0.007 0.294 0.175
2-3 in. 0.006 0.221 0.131
#13 0-1 in. 0.005 0.186 0.110
1-2 in. 0.002 0.097 0.058
2-3 in. 0.003 0.121 0.072
#14 0-1 in. 0.005 0.199 0.118
1-2 in. 0.003 0.121 0.072
2-3 in. 0.003 0.127 0.075
#15 0-1 in. 0.005 0.212 0.126
1-2 in. 0.003 0.136 0.081
2-3 in. 0.005 0.189 0.112
#16 0-1 in. 0.003 0.130 0.077
1-2 in. 0.004 0.142 0.085
2-3 in. 0.003 0.124 0.074
#17 0-1 in. 0.005 0.205 0.122
1-2 in. 0.005 0.196 0.117
2-3 in. 0.005 0.205 0.121
4.2.2 Petrographic analysis
Selected representative images of each core sample are presented here. Additional photomicrographs of the same core samples are presented in Appendix D.
4.2.2.1 Core sample #1
Images of concrete from core sample #1 are shown in Figure 16. The con-crete appears to be composed of an angular coarse and subangular-shaped fine aggregate of unknown composition. There appears to be very little air in the concrete. The concrete appears quite competent, with no visible cracks or signs of chemical reactions.

ERDC SR-13-1 18
Figure 16. Photomicrographs of core sample #1 (5x above; 15x below).
4.2.2.2 Core sample #2
Core sample #2 was not included in this study due to its non-receipt in shipment to ERDC-CERL.

ERDC SR-13-1 19
4.2.2.3 Core sample #3
Images of concrete from core sample #3 are shown in Figure 17. The con-crete appears to be composed of an angular coarse and subangular-shaped fine aggregate of unknown composition. There appears to be very little air in the concrete. Although the concrete appears competent with no visible cracks, there are areas in the cement paste around selected aggregate par-ticles that are lighter in color than the surrounding paste.
Figure 17. Photomicrographs of core sample #3 (5x above; 15x below).

ERDC SR-13-1 20
4.2.2.4 Core sample #4
Images of concrete from core sample #4 are shown in Figure 18. The con-crete appears to be composed of an angular coarse and subangular-shaped fine aggregate of unknown composition. Some entrapped air is visible in the concrete. The concrete appears quite competent, with no visible cracks or signs of chemical reactions.
Figure 18. Photomicrographs of core sample #4 (5x above, 15x below).

ERDC SR-13-1 21
4.2.2.5 Core sample #5
Images of concrete from core sample #5 are shown in Figure 19. The con-crete appears to be composed of an angular coarse and subangular-shaped fine aggregate of unknown composition. There appears to be very little air in the concrete. Although the concrete appears competent with no visible cracks, there are areas in the cement paste around selected aggregate par-ticles that are lighter in color than the surrounding paste.
Figure 19. Photomicrographs of core sample #5 (5x above, 15x below).

ERDC SR-13-1 22
4.2.2.6 Core sample #6
Images of concrete from core sample #6 are shown in Figure 20. The con-crete appears to be composed of an angular coarse and subangular-shaped fine aggregate of unknown composition. There appears to be very little air in the concrete. The concrete appears quite competent, with no visible cracks or signs of chemical reactions.
Figure 20. Photomicrographs of core sample #6 (5x above, 15x below).

ERDC SR-13-1 23
4.2.2.7 Core sample #7
Images of concrete from core sample #7 are shown in Figure 21. The con-crete appears to be composed of an angular coarse and subangular-shaped fine aggregate of unknown composition. There appears to be very little air in the concrete. The concrete appears quite competent, with no visible cracks or signs of chemical reactions.
Figure 21. Photomicrographs of core sample #7 (5x above, 15x below).

ERDC SR-13-1 24
4.2.2.8 Core sample #8
Images of concrete from core sample #8 are shown in Figure 22. The con-crete appears to be composed of an angular coarse and subangular-shaped fine aggregate of unknown composition. There appears to be very little air in the concrete. The concrete appears quite competent, with no visible cracks or signs of chemical reactions.
Figure 22. Photomicrographs of core sample #8 (5x above, 15x below).

ERDC SR-13-1 25
4.2.2.9 Core sample #9
Images of concrete from core sample #9 are shown in Figure 23. The con-crete appears to be composed of an angular coarse and subangular-shaped fine aggregate of unknown composition. There appears to be very little air in the concrete. The concrete appears quite competent, with no visible cracks or signs of chemical reactions.
Figure 23. Photomicrographs of core sample #9 (5x above, 15x below).

ERDC SR-13-1 26
4.2.2.10 Core sample #10
Images from core sample #10 are shown in Figure 24. The concrete ap-pears to be composed of an angular coarse and subangular-shaped fine ag-gregate of unknown composition. There appears to be very little air in the concrete. A large crack in the concrete starts at the upper right center and proceeds through an orange-colored aggregate that extends into the ce-ment paste. There are no indications of any chemical reactions, which may indicate the damage is due to application of some structural load.
Figure 24. Photomicrographs of core sample #10 (5x above, 15x below).

ERDC SR-13-1 27
4.2.2.11 Core sample #11
Images of concrete from core sample #11 are shown in Figure 25. The con-crete appears to be composed of an angular coarse and subangular-shaped fine aggregate of unknown composition. There appears to be very little air in the concrete. The concrete appears quite competent, with no visible cracks or signs of chemical reactions.
Figure 25. Photomicrographs of core sample #11 (5x above, 15x below).

ERDC SR-13-1 28
4.2.2.12 Core sample #12
Images of concrete from core sample #12 are shown in Figure 26. The con-crete appears to be composed of an angular coarse and subangular-shaped fine aggregate of unknown composition. There appears to be very little air in the concrete. The concrete appears quite competent, with no visible cracks or signs of chemical reactions.
Figure 26. Photomicrographs of core sample #12 (5x above, 15x below).

ERDC SR-13-1 29
4.2.2.13 Core sample #13
Images of concrete from core sample #13 are shown in Figure 27. The con-crete appears to be composed of an angular coarse and subangular-shaped fine aggregate of unknown composition. There appears to be very little air in the concrete. The concrete appears quite competent, with no visible cracks or signs of chemical reactions.
Figure 27. Photomicrographs of core sample #13 (5x above, 15x below).

ERDC SR-13-1 30
4.2.2.14 Core sample #14
Images of concrete from core sample #14 are shown in Figure 28. The con-crete appears to be composed of an angular coarse and subangular-shaped fine aggregate of unknown composition. There appears to be very little air in the concrete. The concrete appears quite competent, with no visible cracks or signs of chemical reactions.
Figure 28. Photomicrographs of core sample #14 (5x above, 15x below).

ERDC SR-13-1 31
4.2.2.15 Core sample #15
Images of concrete from core sample #15 are shown in Figure 29. The con-crete appears to be composed of an angular-to-rounded coarse and subangular-to-rounded shaped fine aggregate of unknown composition. Steel fibers are present in the concrete. There appears to be very little air in the concrete. Although the concrete appears competent with no visible cracks, there are areas in the cement paste around selected aggregate par-ticles that are lighter in color than the surrounding paste.
Figure 29. Photomicrographs of core sample #15 (5x above, 15x below).

ERDC SR-13-1 32
4.2.2.16 Core sample #16
Images of concrete from core sample #16 are shown in Figure 30. The con-crete appears to be composed of an angular coarse and subangular-shaped fine aggregate of unknown composition. There appears to be very little air in the concrete. The concrete appears quite competent, with no visible cracks or signs of chemical reactions.
Figure 30. Photomicrographs of core sample #16 (5x above, 15x below).

ERDC SR-13-1 33
4.2.2.17 Core sample #17
Images of concrete from core sample #17 are shown in Figure 31. The con-crete appears to be composed of an angular-to-subangular coarse and subangular-to-rounded shaped fine aggregate of unknown composition. Steel fibers are present in the concrete. There appears to be very little air in the concrete. The concrete appears quite competent, with no visible cracks or signs of chemical reactions.
Figure 31. Photomicrographs of core sample #17 (5x above, 15x below).

ERDC SR-13-1 34
4.3 Conclusions of concrete core testing
Sixteen concrete core samples from Site 81 were investigated from the 17 samples taken. The study of these core samples consisted of chloride con-tent measurements at three depths from the surface and a petrographic analysis to identify key microstructural features and potential modes of deterioration. Conclusions from the study of the core samples are given below.
• Chlorides were found to be present in measureable quantities in each core analyzed, with contents ranging from 0.097–2.068 lb/yd3. Chloride contents in all but sample #1 were below the level of approximately 1–1.5 lb/yd3 of concrete necessary for initia-tion of corrosion of the embedded reinforcing steel. Further, Chlo-ride contents generally did not decrease with depth from the sur-face. No corrosion was evident on reinforcing steel bars and fibers extracted from concrete cores during the crushing process.
• Petrographic examination of the 16 concrete samples investigated showed competent concrete. The coarse and fine aggregate appear to be suitable for concrete and appear to be well distributed. There were steel fibers present in two of the concrete specimens. There appeared to be very little air in any of the concrete samples. Alt-hough one concrete sample had a crack present, it did not appear that it was the result of any deleterious chemical reaction. Three samples had lightly-colored cement paste surrounding selected ag-gregate particles. The cause for this discoloration is unclear, but there does not appear to be any obvious deterioration or cracking occurring in those samples. The concrete appears quite competent, with no visible cracks or signs of chemical reactions.

ERDC SR-13-1 35
5 Summary of Results
The corrosion rates measured were both extremely low and relatively uni-formly distributed across the underlying surface of each cored EMS steel plate (17 cores total). The average of all corrosion rates measured was 0.2356 mils per year (0.005984 mm/year) as shown in Appendix B. Given an EMS steel plate original thickness of 125 mils (3.175 mm), the average time to penetration would be 530 years.
As stated previously, the thickness measurements of the two EMS steel plate sections that were shipped with the core samples were 0.116 inches (2.9464 mm) for the floor section thickness and 0.1233 inches (3.13 mm) for the wall section (both an average of three measurements). These thick-ness measurements indicate very little floor EMS plate metal loss over the 11-year timeframe since construction, based on the original EMS plate thickness of ~3 mm estimated by NAU. This validates our service life esti-mates of 200–500 years based on the in-situ corrosion rates.
In order to predict the worst case scenario with 95% confidence, the worst case corrosion rate including two standard deviations of the average values measured would be 0.6272 mils per year (0.01593 mm/year) providing a minimum expected life until first penetration of 199 years given the same original plate thickness of 125 mils (3.175 mm).
A review of the percent moisture content data as measured by the Protometer instrument at multiple levels in the core holes indicated that the concrete slab beneath the EMS steel plate was saturated with ground-water. The groundwater seepage was confirmed by ever-rising water levels in both the bolt and core holes. However, the presence of the groundwater which has saturated or nearly saturated the concrete slab does not pro-mote corrosion of the EMS steel plate. This lack of corrosion is primarily due to lack of oxygen; oxygen was consumed by the initial corrosion of the plate shortly after construction, and oxygen replenishment is prevented by the presence of the steel EMS plate covering the concrete slab.
Analysis of the chloride ion concentration in the concrete core samples confirmed that the chlorides did not impact the corrosion rate of the EMS.

ERDC SR-13-1 36
Further, the analyses of the groundwater samples (Appendix A) confirmed that the chlorides also did not impact the corrosion rate of the EMS.

ERDC SR-13-1 37
6 Recommendations
Where the steel EMS steel plate has already been exposed, it is recom-mended that the exposed surfaces be cleaned using effective surface prep-aration methods and coated using the current practices. No further exca-vation of the steel EMS is recommended, since there was never any significant corrosion observed in the circular excavations made during this study. Further, the corrosion observed and examined at the floor/wall in-terface was minimal. Where the EMS steel plate has been penetrated, ei-ther during saw cutting or core drilling, appropriate repair measures to facilitate welding new material to reseal the EMS must be accomplished.

ERDC SR-13-1 38
7 References Angst, U., B. Elsener, C. K. Larsen, and Ø. Vennesland. 2009. “Critical Chloride Content
in Reinforced Concrete - A Review,” Cement and Concrete Research 39 (12): 1122-1138.
ASTM C856: “Standard Practice for Petrographic Examination of Hardened Concrete,” West Conshohocken, PA: American Society for Testing and Materials.
ASTM C1152: “Standard Test Method for Acid-Soluble Chloride in Mortar and Concrete,” West Conshohocken, PA: American Society for Testing and Materials.
FIB. 1992. Design Guide for Durable Concrete Structures. ed. Comité Euro-International du Béton - Fédération Internationale du Béton, Lausanne, Switzerland. London: Thomas Telford, Ltd.

ERDC SR-13-1 39
Appendix A: Water Testing
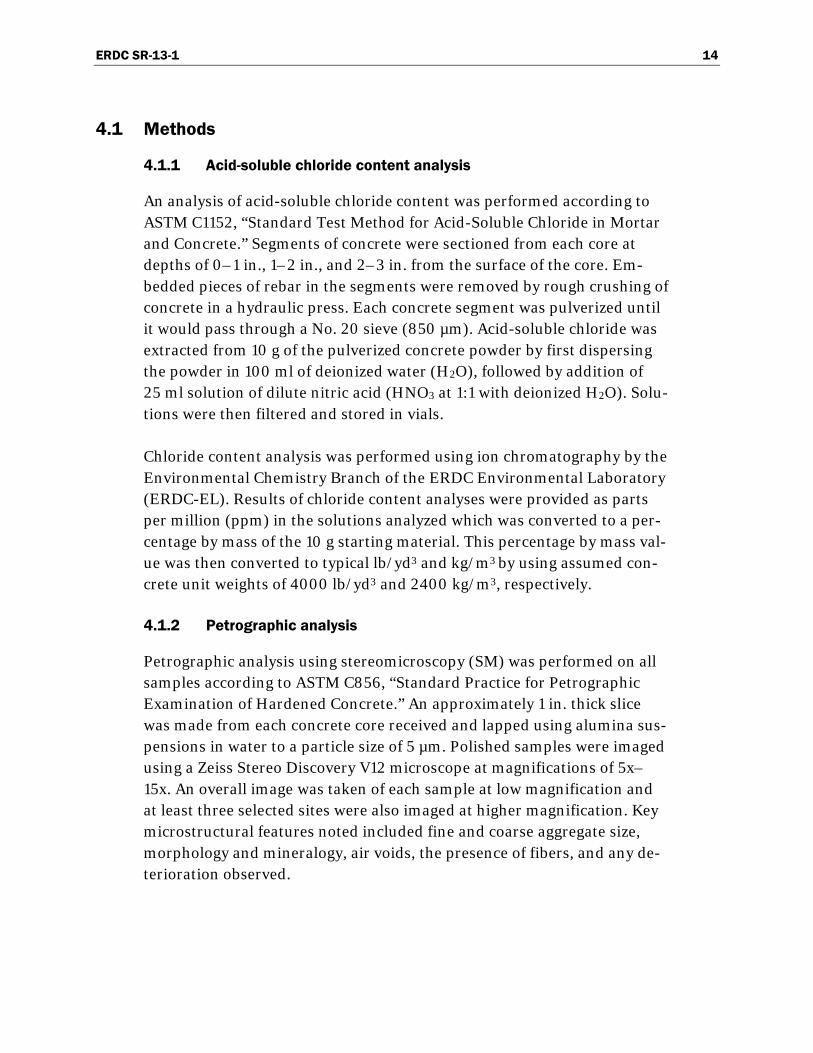
Figures A-1 and A-2 are reproductions of test results from Illinois State Water Survey analyses of two water samples collected at Site 81. Test point #1, level 5 is water from the core hole and test point #2, level 1 is ground-water.
Based on the comparison of the water qualities shown in Figures A-1 and A-2, the water sample taken from the core hole (test point #1, level 5) is groundwater with increased levels of sulfate, silica, sodium, potassium and total dissolved solids. The raw groundwater filtering through the Portland cement has dissolved these elements, causing their increase in the water sample taken from the core hole. The only exception is calcium and mag-nesium, which are somewhat decreased in the core hole water sample as compared to the groundwater sample but both contain moderate amounts of each element. The most important factor to note about the tests is the dramatic increase in alkalinity of the core hole water sample due to filter-ing through the highly alkaline concrete.

ERDC SR-13-1 40
Figure A-1. Analysis of water sample taken from test point #1, level 5.
ERDC SR-13-1 41
Figure A-2. Analysis of water sample taken from test point #2.

ERDC SR-13-1 42
Appendix B: EMF Liner Corrosion Rate Measurement
Figures B-1 through B-4 represent the corrosion rate measurements for the 17 samples.
Figure B-1. Corrosion rate measurements for core samples #1–5.

ERDC SR-13-1 43
Figure B-2. Corrosion rate measurements for core samples #6–10.
Figure B-3. Corrosion rate measurements for core samples #11–15.

ERDC SR-13-1 44
Figure B-4. Corrosion rate measurements for core samples #16–17, and collective data for all
samples.

ERDC SR-13-1 45
Appendix C: As-Received Core Samples
Figures C-1 – C-16 represent the as-received core samples #1 and #3–#16. Again, note that core sample #2 is not included here, due to it not being received in the original shipment to the ERDC lab from Site 81.

ERDC SR-13-1 46
Figure C-1. Photos of as-received core samples #1 and #3.

ERDC SR-13-1 47
Figure C-2. Photos of as-received core samples #4 and #5.

ERDC SR-13-1 48
Figure C-3. Photos of as-received core samples #6 and #7.

ERDC SR-13-1 49
Figure C-4. Photos of as-received core samples #8 and #9.

ERDC SR-13-1 50
Figure C-5. Photos of as-received core samples #10 and #11.

ERDC SR-13-1 51
Figure C-6. Photos of as-received core samples #12 and #13.
ERDC SR-13-1 52
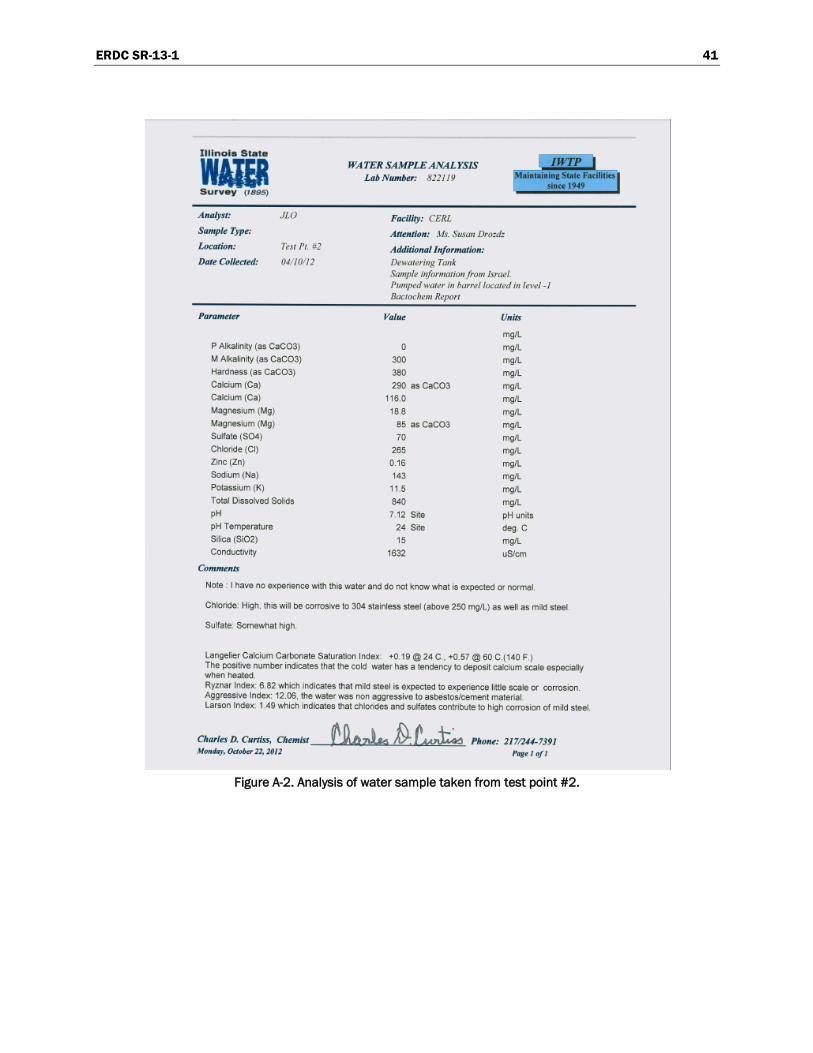
Figure C-7. Photos of as-received core samples #14 and #15.

ERDC SR-13-1 53
Figure C-8. Photos of as-received core samples #16 and #17.

ERDC SR-13-1 54
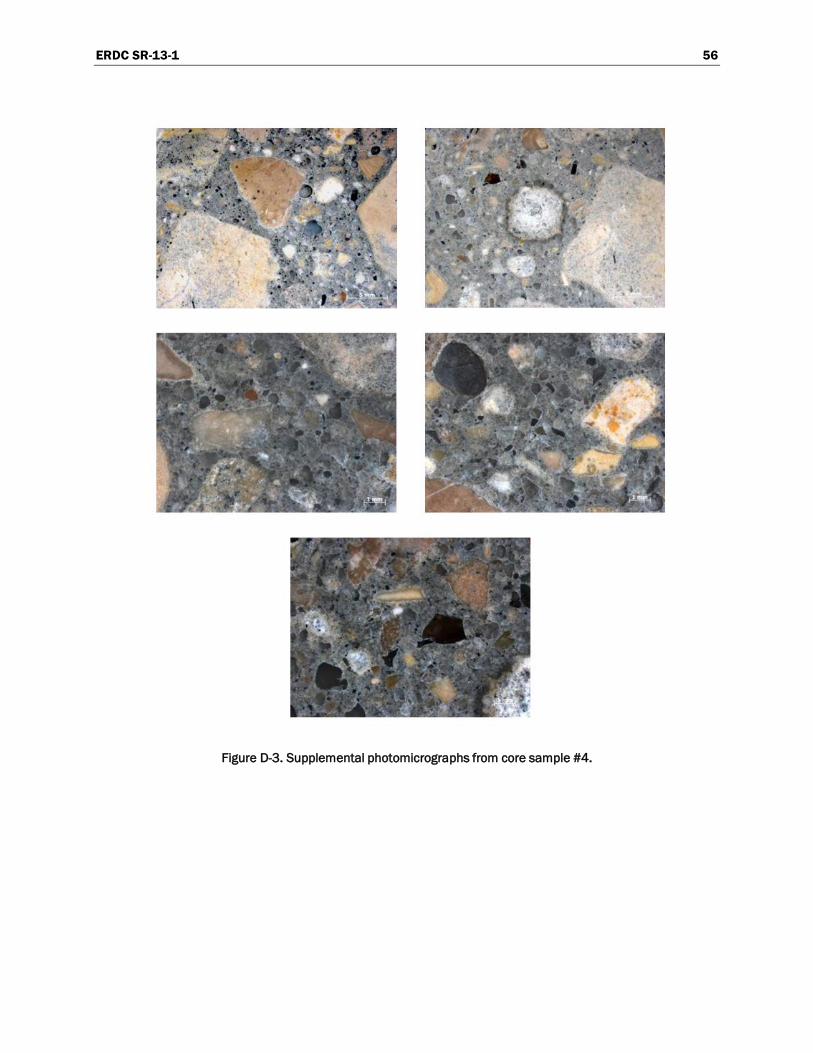
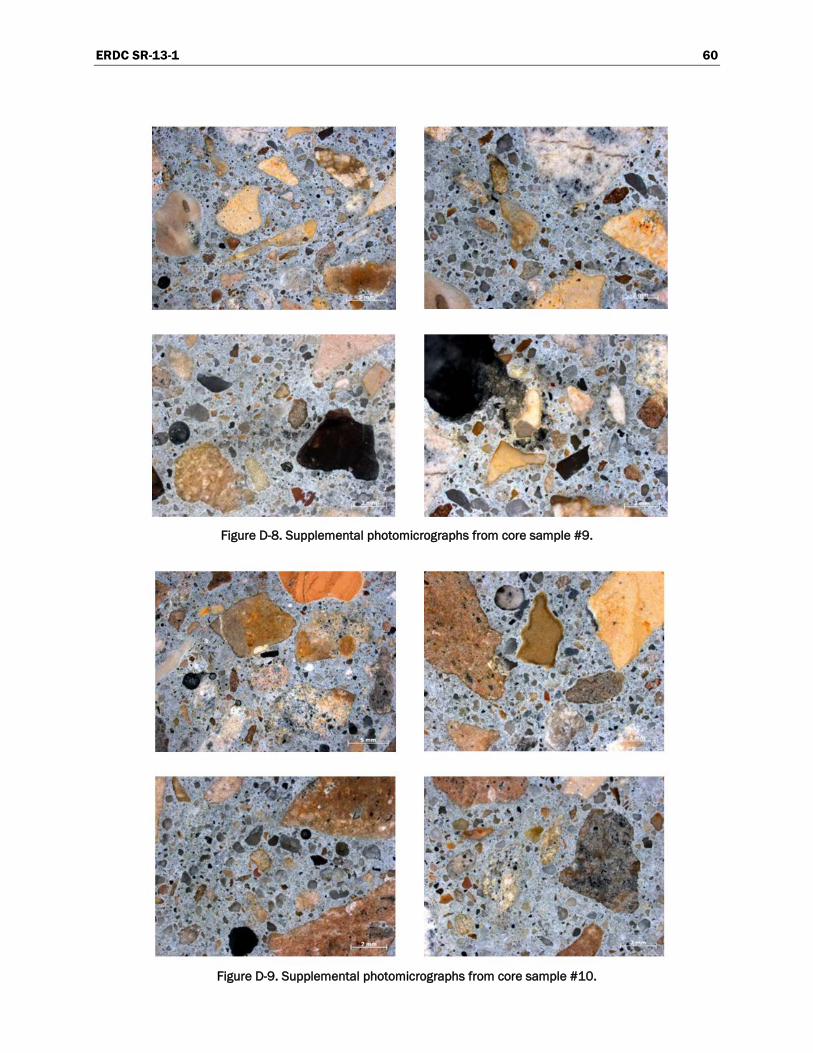
Appendix D: Supplemental Photomicrographs
Figures D-1 – D-17 represent supplemental photomicrographs of core samples #1 and #3–16, as taken during the petrographic analyses done at ERDC-GSL, as discussed in Chapter 4.
Figure D-1. Supplemental photomicrographs from core sample #1.

ERDC SR-13-1 55
Figure D-2. Supplemental photomicrographs from core sample #3.
ERDC SR-13-1 56
Figure D-3. Supplemental photomicrographs from core sample #4.

ERDC SR-13-1 57
Figure D-4. Supplemental photomicrographs from core sample #5.

ERDC SR-13-1 58
Figure D-5. Supplemental photomicrographs from core sample #6.

ERDC SR-13-1 59
Figure D-6. Supplemental photomicrographs from core sample #7.
Figure D-7. Supplemental photomicrographs from core sample #8.
ERDC SR-13-1 60
Figure D-8. Supplemental photomicrographs from core sample #9.
Figure D-9. Supplemental photomicrographs from core sample #10.

ERDC SR-13-1 61
Figure D-10. Supplemental photomicrographs from core sample #11.
Figure D-11. Supplemental photomicrographs from core sample #12.

ERDC SR-13-1 62
Figure D-12. Supplemental photomicrographs from core sample #13.

ERDC SR-13-1 63
Figure D-13. Supplemental photomicrographs from core sample #14.
Figure D-14. Supplemental photomicrographs from core sample #15.

ERDC SR-13-1 64
Figure D-15. Supplemental photomicrographs from core sample #16.
Figure D-16. Supplemental photomicrographs from core sample #17.

REPORT DOCUMENTATION PAGE Form Approved OMB No. 0704-0188
Public reporting burden for this collection of information is estimated to average 1 hour per response, including the time for reviewing instructions, searching existing data sources, gathering and maintaining the data needed, and completing and reviewing this collection of information. Send comments regarding this burden estimate or any other aspect of this collection of information, including suggestions for reducing this burden to Department of Defense, Washington Headquarters Services, Directorate for Information Operations and Reports (0704-0188), 1215 Jefferson Davis Highway, Suite 1204, Arlington, VA 22202-4302. Respondents should be aware that notwithstanding any other provision of law, no person shall be subject to any penalty for failing to comply with a collection of information if it does not display a currently valid OMB control number. PLEASE DO NOT RETURN YOUR FORM TO THE ABOVE ADDRESS. 1. REPORT DATE (DD-MM-YYYY)
February 2013
2. REPORT TYPE Final
3. DATES COVERED (From - To) 4. TITLE AND SUBTITLE
Investigation of the Corrosion Mechanism and Determination of the EMS Estimated Service Life at Site 81
5a. CONTRACT NUMBER 5b. GRANT NUMBER 5c. PROGRAM ELEMENT NUMBER
6. AUTHOR(S) Vincent F. Hock Jr., Charles A. Weiss Jr., Robert D. Moser, Sean W. Morefield, and James B. Bushman
5d. PROJECT NUMBER 5e. TASK NUMBER MIPR W2SD0622151436 5f. WORK UNIT NUMBER
7. PERFORMING ORGANIZATION NAME(S) AND ADDRESS(ES) U.S. Army Engineer Research and Development Center (ERDC) Construction Engineering Research Laboratory (CERL) PO Box 9005 Champaign, IL 61826-9005
8. PERFORMING ORGANIZATION REPORT NUMBER
ERDC SR-13-1
9. SPONSORING / MONITORING AGENCY NAME(S) AND ADDRESS(ES) 10. SPONSOR/MONITOR’S ACRONYM(S) USACE-NAU US Army Corps of Engineers
Europe District CMR 410, Box 1, APO, AE 09049
11. SPONSOR/MONITOR’S REPORT
NUMBER(S)
12. DISTRIBUTION / AVAILABILITY STATEMENT Approved for public release. Distribution is unlimited.
13. SUPPLEMENTARY NOTES
14. ABSTRACT
Structural damage resulting from corrosion of steel-clad structures can be of concern, especially when the steel is part of electromag-netic shielding of an underground structure. The US Army Corps of Engineers was called to lend assistance by having its corrosion ex-perts and research laboratories investigate the condition and extent of corrosion at such a structure (Site 81) in Israel. This report doc-uments the investigation, conclusions, and recommendations. In summary, from investigation and analyses of core samples, no significant corrosion was discovered and the estimated minimum service life of the existing structure is 199 years.
15. SUBJECT TERMS corrosion, steel, steel-clad structure, estimated minimum service (EMS), electromagnetic shielding (EMS) 16. SECURITY CLASSIFICATION OF: 17. LIMITATION
OF ABSTRACT 18. NUMBER
OF PAGES 19a. NAME OF RESPONSIBLE PERSON
a. REPORT
Unclassified b. ABSTRACT
Unclassified c. THIS PAGE
Unclassified
UU
75 19b. TELEPHONE NUMBER (in-
clude area code)
Standard Form 298 (Rev. 8-98)
Prescribed by ANSI Std. 239.18