ERDC-CERL Fuel Cell Program Energy Conversion Efficiency Potential for ... · Energy Conversion...
50
ERDC/CERL TR-12-10 ERDC-CERL Fuel Cell Program Energy Conversion Efficiency Potential for Forward-Deployed Generation Using Direct Carbon Fuel Cells Construction Engineering Research Laboratory Kevin Berner, Alex Perwich, Chris Brett, Justin Ruflin, Pallavi Pharkya, Abhishek Guha, Scott M. Lux, and Franklin H. Holcomb May 2012 Contained Energy’s “pre-hybrid” direct carbon fuel-cell configuration Approved for public release; distribution is unlimited.
-
Upload
hoangthien -
Category
Documents
-
view
216 -
download
0
Transcript of ERDC-CERL Fuel Cell Program Energy Conversion Efficiency Potential for ... · Energy Conversion...

ERD
C/CE
RL T
R-12
-10
ERDC-CERL Fuel Cell Program
Energy Conversion Efficiency Potential for Forward-Deployed Generation Using Direct Carbon Fuel Cells
Cons
truc
tion
Engi
neer
ing
Res
earc
h La
bora
tory
Kevin Berner, Alex Perwich, Chris Brett, Justin Ruflin, Pallavi Pharkya, Abhishek Guha, Scott M. Lux, and Franklin H. Holcomb
May 2012
C ontained E nergy’s “ pre-hybrid” direct carbon fuel-cell configuration
Approved for public release; distribution is unlimited.


ERDC-CERL Fuel Cell Program ERDC/CERL TR-12-10 May 2012
Energy Conversion Efficiency Potential for Forward-Deployed Generation Using Direct Carbon Fuel Cells
Scott M. Lux and Franklin H. Holcomb Construction Engineering Research Laboratory U.S. Army Engineer Research and Development Center 2902 Newmark Drive PO Box 9005 Champaign, IL 61826-9005
Kevin Berner, Alex Perwich, Chris Brett, Justin Ruflin, Pallvi Pharkya, and Abhishek Guha Contained Energy, LLC 51 Alpha Park Highland Heights, OH 44143
Final Report
Approved for public release; distribution is unlimited.
Prepared for Headquarters, US Army Corps of Engineers 441 G Street NW Washington, DC 20314-1000
Under Contract Number W9132T-08-C-0036 and an amendment under W9132T-08-C-0036 P00002

ERDC/CERL TR-12-10 ii
Abstract
Fuel logistics are a huge burden to the Army mission and supply lines. Improving efficiency and fuel flexibility will, in the long run, save lives as well as dollars. Fuel cells have long been looked on as a viable method to achieving efficiency and flexibility. The direct carbon fuel cell (DCFC) technology is one potential game-changing technology which could support meeting this challenge. It has the potential to convert carbon at high efficiency to a safe, non-explosive fuel, and one which could be produced from waste on-site at forward-deployed installations. The objective of this work was to produce a single-cell DCFC with a minimum performance of 120 W/L at 50% efficiency. This report summarizes a 2-year work effort by Contained Energy, LLC (CEL) to achieve this objective. The report explains the challenge of high temperature that is required to achieve the power densities necessary to produce feasible-sized, operational units. It also explains problems encountered with partial oxidation of the carbon at high temperatures which causes low efficiencies (due to the Boudouard reaction). Finally, CEL’s novel and new ceramic DCFC concept is explained, along with lessons learned in advancing DCFC technology.
DISCLAIMER: The contents of this report are not to be used for advertising, publication, or promotional purposes. Citation of trade names does not constitute an official endorsement or approval of the use of such commercial products. All product names and trademarks cited are the property of their respective owners. The findings of this report are not to be construed as an official Department of the Army position unless so designated by other authorized documents. DESTROY THIS REPORT WHEN NO LONGER NEEDED. DO NOT RETURN IT TO THE ORIGINATOR.

ERDC/CERL TR-12-10 iii
Table of Contents Abstract ............................................................................................................................................................. ii
List of Figures and Tables .................................................................................................................................... iv
Preface ................................................................................................................................................................ v
1 Introduction ................................................................................................................................................ 1 1.1 Background .......................................................................................................................... 1 1.2 Contained Energy’s DCFC technology ...................................................................................... 3 1.3 Objective .............................................................................................................................. 4 1.4 Approach ............................................................................................................................. 4 1.5 Mode of technology transfer ................................................................................................... 5
2 DCFC Performance Targets and Initial Results .............................................................................................. 6 2.1 DCFC performance targets ..................................................................................................... 6
2.1.1 Power density target ........................................................................................................................ 7 2.1.2 Efficiency target ............................................................................................................................... 8
2.2 Initial results ......................................................................................................................... 8
3 Fuel-Cell Efficiency ................................................................................................................................... 11 3.1 Definition of efficiency ......................................................................................................... 11 3.2 Explanation of results and the Boudouard reaction ................................................................. 14 3.3 Effect of Boudouard reaction on power output........................................................................ 17 3.4 Redesign of the DCFC and improvement of polarization .......................................................... 19
4 Power Density ........................................................................................................................................... 23 4.1 Ohmic resistance and active area ......................................................................................... 23 4.2 Kinetics and mass transport ................................................................................................. 26
5 Contained Energy’s Hybrid DCFC ............................................................................................................... 29 5.1 Hybrid DCFC structure.......................................................................................................... 30 5.2 Construction and initial performance .................................................................................... 33 5.3 Conclusions and additional challenges regarding the hybrid DCFC ........................................... 34
6 Conclusions .............................................................................................................................................. 36
References ....................................................................................................................................................... 37
Acronyms and Abbreviations ............................................................................................................................. 39
Appendix A: Half-Cell Setup .............................................................................................................................. 40
Report Documentation Page ............................................................................................................................. 42

ERDC/CERL TR-12-10 iv
List of Figures and Tables Figures Figure 1. Contained Energy’s DCFC technology. ................................................................................................... 3 Figure 2. Contained Energy’s cylinder (gas) cell construction. ............................................................................... 4 Figure 3. Technology readiness levels (From http://en.wikipedia.org/wiki/Technology
_readiness_level). .............................................................................................................................. 6 Figure 4. Early results — power (CEL). .................................................................................................................. 9 Figure 5. Early results — endurance (CEL). ........................................................................................................... 9 Figure 6. Voltage, current density, and power density. ........................................................................................ 13 Figure 7. Temperature and loan impact on efficiency.......................................................................................... 15 Figure 8. Direct carbon fuel cell. ........................................................................................................................ 15 Figure 9. Boudouard reaction. .......................................................................................................................... 16 Figure 10. Effect of temperature on power. ........................................................................................................ 17 Figure 11. Cartridge test fuel cell. ..................................................................................................................... 18 Figure 12. Detailed view of fuel test. ................................................................................................................. 18 Figure 13. Circuit diagram to represent current flow through the carbon bed of the fuel cell................................. 25 Figure 14. Effect of bubbles on fuel-cell performance. ....................................................................................... 27 Figure 15. Voltage-current curves for a carbon bed half-cell stirred at various speeds by an alumina
paddle. ............................................................................................................................................. 28 Figure 16. Two configurations that achieve the same power per volume with different power per area. ................ 29 Figure 17. Depiction of the solid oxide fuel cell technology. ................................................................................ 30 Figure 18. NASA bi-electrode supported cell (BSC) design................................................................................. 31 Figure 19. Proposed DCFC concept................................................................................................................... 31 Figure 20. Electron and ion pathways in the DCFC hybrid design. ....................................................................... 32 Figure 21. Fabrication process for Contained Energy’s scaffolding cells.............................................................. 33 Figure 22. A button cell being assembled for testing is shown on the right. ......................................................... 34 Figure A1. Contained Energy’s half-cell configuration, employing a working electrode with a bed of
carbon particles. ............................................................................................................................... 40 Figure A2. Alumina tube and separator used for a carbon bed, working electrode configuration. ........................ 41 Figure A3. Half-cell configuration used at Contained Energy to test slugs of carbon. ........................................... 41
Tables Table 1. Operating characteristics of conventional fuel cells vs. DCFCs. ................................................................ 2 Table 2. Power density comparison. .................................................................................................................... 7 Table 3. Results of selected fuel source efficiency tests (CEL). ............................................................................ 10 Table 4. Fuel-cell efficiency explained. .............................................................................................................. 11 Table 5. Fuel-cell efficiency (Cao et al. 2007). ................................................................................................... 12

ERDC/CERL TR-12-10 v
Preface
This study was conducted for the Office of the Director, Defense, Research, and Engineering (ODDR&E) under “Army Applications for Direct Carbon Fuel Cells.” Language for the project was identified in the Department of Defense appropriations bills of 2008 and 2009. This material is based on work supported by ERDC-CERL under Contract Number W9132T-08-C-0036 and an amendment under W9132T-08-C-0036 P00002 specified in Block 2 of the Standard Form 26 or 33. The technical monitor was Mr. Robert Boyd, ODDR&E.
The work was managed and executed by the Energy Branch (CF-E) of the Facilities Division (CF), U.S. Army Engineer Research and Development Center – Construction Engineering Research Laboratory (ERDC-CERL). The CERL principal investigator was Scott Lux. At the time of publication, Franklin Holcomb was Chief, CEERD-CF-E, and Michael Golish was Chief, CEERD-CF. The associated Technical Director was Martin Savoie, CEERD-CV-T. The Deputy Director of ERDC-CERL was Dr. Kumar Topudurti and the Director was Dr. Ilker R. Adiguzel.
The Commander and Executive Director of ERDC was COL Kevin J. Wilson, and the Director was Dr. Jeffery P. Holland.

ERDC/CERL TR-12-10 vi

ERDC/CERL TR-12-10 1
1 Introduction
1.1 Background
Energy is an operational imperative that affects a wide range of military capabilities… Energy dependence creates logistical supply burdens which increase oper-ational vulnerabilities and put soldiers at risk… A 1% reduction of fuel consumption in theater in Iraq or Afghanistan could mean roughly 60 fewer long-distance fuel convoys per year. A fuel convoy typically involves 50 to 100 soldiers. So reducing fuel con-sumption in theater would reduce soldier risk and likely mean fewer soldier casualties and fatalities.
Energy security also is important to the Army because it directly affects mission readiness and unit prepar-edness. Army bases and Soldier training missions re-quire secure and uninterrupted access to energy.
Indeed, both domestically and overseas the Army must retain access to energy and continue to operate even when - and especially when - catastrophe strikes and energy supplies are disrupted, cut off, or just plain difficult to secure. (Roege 2010)
Direct carbon fuel cells (DCFCs) have been identified as one of the poten-tial technologies that could help reduce the Army’s energy burden. DCFCs have been explained in detail in an earlier ERDC/CERL technical report (Wolk et al. 2007). The DCFC can potentially convert carbon fuels (e.g., coal, charred biomass) to electricity at 80% efficiency—well beyond the ef-ficiency of any other conversion technology and twice that of standard coal-fired power plants. For the same electrical output, a power generation system based on a DCFC would use less than half the fuel and produce less than half the carbon dioxide (CO2) of a conventional power system. When compared to the typical and inefficient diesel generators used in many mil-itary applications, the gains are even higher.

ERDC/CERL TR-12-10 2
DCFCs have begun receiving attention as an additional type of fuel cell. Conventional fuel cells typically operate on gaseous fuels, and that fuel (natural gas, propane, alcohol, etc.) is reformed to a hydrogen syngas, which is fed into the fuel-cell stack. The DCFC, however, can operate di-rectly on solid carbon fuel such as coal, biomass, and organic waste. Table 1 shows a general comparison of conventional fuel cells to DCFCs. At high temperatures (>600 ºC), this fuel is electro-oxidized to CO2 at the anode compartment to create electricity.
Table 1. Operating characteristics of conventional fuel cells vs. DCFCs.
PEMFC PAFC MCFC SOFC DCFC
Electrolyte Polymer Phosphoric acid
Molten car-bonate salt
Ceramic Fused KNO3
Operating Temperature
80 ºC (175ºF)
190 °C (375°F)
650 °C (1200°F)
1000 °C (1830°F)
700 °C (1110°F)
Fuel(s) H2 reformate H2 reformate H2/CO/ refor-mate
H2/CO2/ CH4 reformate
Solid carbon
Reforming External External External / internal
External / internal
Not neces-sary
Oxidant O2/air O2/air CO2/O2/air O2/air Humidified air
Efficiency (Higher Heating Value [HHV])
30–35% 40–50% 50–60% 45–55% 80%
PEMFC: Proton Exchange Membrane Fuel Cell PAFC: Phosphoric Acid Fuel Cell MCFC: Molten Carbonate Fuel Cell SOFC: Solid Oxide Fuel Cell
Despite the efficiency advantage shown in the above comparison, DCFC technology has undergone relatively little development since its inception more than 100 years ago.*
This report begins with an explanation of the approach to the project and the reasoning behind selected performance targets. It then addresses the challenges encountered during this work, the obstacles that remain for the
The majority of testing still occurs primarily in half-cell experiments and small laboratory tests. The objective of this pro-ject was to develop a working prototype of a DCFC that could effectively be scaled to a commercial product. The long-term goal of the effort is to de-velop high-efficiency power generation systems by utilizing DCFC technol-ogy.
* Cao, Sun, and Wang (2011) provide a good overview of DCFCs technology.

ERDC/CERL TR-12-10 3
DCFC technology, and the most recent design to address many of these challenges. Interest and basic research in DCFCs have increased over the past several years; the experiences and insights provided here should be useful to those working in the field.
1.2 Contained Energy’s DCFC technology
DCFC technology is well known to the Army for its high energy-conversion efficiency and has been the subject of a number of reports (e.g., Wolk et al. 2007; Lux et al. 2008). Figure 1 schematically illustrates Contained Ener-gy LLC’s (CEL’s) concept for DCFC technology, and Figure 2 shows CEL’s cylinder cell (gas cell) construction.
Oxygen reduced at the cathode combines with CO2 to form a carbonate ion, which then passes through a molten carbonate electrolyte layer to re-act with solid carbon at the anode, forming CO2 and electrons. Part of the anode carbon dioxide is recirculated to the cathode. The overall net reac-tion is C + O2 = CO2 + electrical energy. The anode exhaust consists of pure carbon dioxide.
Figure 1. Contained Energy’s DCFC technology.

ERDC/CERL TR-12-10 4
Figure 2. Contained Energy’s cylinder (gas) cell construction.
1.3 Objective
The primary objective of the work plan was to prove the commercial feasi-bility of the DCFC technology. More specifically, the objective was to deliv-er a DCFC single cell with a minimum performance of 120 W/L at 50% ef-ficiency by using a new ceramic DCFC concept.
1.4 Approach
This work was divided into two main efforts.
1. Research and characterization of the DCFC anode in order to improve per-formance and drive the prototype design.
2. Development and fabrication of a commercially scalable DCFC architec-ture.
The laboratory workload portion of this project was shared between two CEL-affiliated laboratories—one in Cleveland, Ohio, at the Wright Fuel Cell Group, and the other in North Canton, Ohio, at Stark State College. Work was generally split evenly between both locations until the focus shifted toward the development of the hybrid design described in Section 5. Original fuel-cell architecture was based on the technology CEL had li-censed from Lawrence Livermore National Lab (LLNL) in September 2005 (Cherepy et al. 2005). To solve major technical hurdles related to the LLNL technology, CEL conceived a hybrid DCFC design in 2009 that in-corporated components of solid oxide fuel cell (SOFC) technology that

ERDC/CERL TR-12-10 5
NASA developed (Cable et al. 2011). Once hybrid design work was initiat-ed, the North Canton lab took the lead to fabricate components for the hy-brid design, while the Cleveland location began hybrid testing and contin-ued research and characterization of the DCFC anode.
1.5 Mode of technology transfer
This report will be made publicly accessible through the ERDC library’s digital repository at: http://acwc.sdp.sirsi.net/client/default#.

ERDC/CERL TR-12-10 6
2 DCFC Performance Targets and Initial Results
2.1 DCFC performance targets
Delivering a viable product at a competitive cost remains a major chal-lenge for adopting fuel-cell technology, both for the military and for future commercialization. Application of a fuel cell in a military operation typi-cally centers on the following two benefits, representing common value propositions.
1. The ability of the fuel cell to reduce fuel consumption because of its higher efficiency compared to current power generators.
2. The ability of the fuel cell to operate on alternative fuels (such as waste products).
DCFCs need to provide these bene-fits and, at the same time, achieve the performance targets required for success in the military power generation marketplace. Making DCFCs rugged and user friendly are additional challenges to over-come, particularly with military applications.
Performance requirements for a power system, especially one for the military, are extensive. DCFC technology is currently at a De-partment of Defense (DoD) tech-nical readiness level (TRL) of 2–3 (Figure 3). To prove feasibility, the requirements for this study were simplified to one key power density and efficiency performance metric: 120 W/L at 50% efficiency. Achiev-ing both of these performance parameters of this metric simultaneously is
Figure 3. Technology readiness levels (From
http://en.wikipedia.org/wiki/Technology _readiness_level).

ERDC/CERL TR-12-10 7
the minimum essential performance necessary for DCFC technology to be competitive among other fuel-cell technology alternatives. The perfor-mance metrics were chosen based on the importance of both power densi-ty and efficiency to the performance of a DCFC power system.
2.1.1 Power density target
Power density is critical because it will dictate system size, portability, and cost. In certain applications, portability and volume requirements may not be primary drivers, but cost is a major concern in any application. Power density is able to provide a good measure of cost because the lower the power density, the larger the size of the fuel-cell system required to achieve a given power output. Manufacturing and material costs scale with fuel-cell size—the larger the fuel-cell system becomes, the greater will be the material and manufacturing costs.
To determine what might be appropriate in terms of power density, the DCFC technology was benchmarked against molten carbonate fuel cells (MCFCs), since they are similar in architecture and materials selection. MCFCs have gained wide acceptance in distributed generation applica-tions and have a power density of about 350 W/L (stack only). Compared to other fuel cells and especially to the diesel generators currently used by the military, MCFCs are relatively low in power density (and will likely be passed by SOFC technology as a result); thus MCFC performance serves as a useful lower bound of necessary performance.*
Table 2. Power density comparison.
A DCFC that cannot achieve power density on the order of magnitude of a MCFC is simply not going to be economical.
†
The MCFC power density of 350 W/L is a high initial target for DCFC technology, since it is a very early-stage technology compared to well-
* Source is confidential discussions with a leading MCFC manufacturer in response to a question about
why they were developing SOFC technology when they already have commercialized MCFC technology. † Source is Contained Energy’s internal working documents. It is difficult to get accurate power density
figures across and within technologies because figures vary based on desired comparison (e.g., power density per weight or per volume; comparison of complete fuel cell system or just the fuel cell stack).
DCFC SOFC NASA Tech
Power Density (Wt) 0.04 kW/kg 0.3 kW/kg 1.1 kW/kg
Power Density (Volume) 0.07 kW/L 1.3 kW/L 7.5 kW/L

ERDC/CERL TR-12-10 8
established MCFC technology. Thus, the power density metric was set about one-third that value, or 120 W/L. Any DCFC system capable of gen-erating 120 W/L will put the DCFC within range, at least, of MCFC per-formance.
2.1.2 Efficiency target
The efficiency target also is critical because efficiency is the key metric in terms of reducing fuel consumption (which is the first common value proposition listed above for fuel cells in military applications). The DCFC has the potential to far exceed the efficiencies of other technologies, in-cluding other fuel cells. If this efficiency cannot be achieved, however, then the DCFC likely will not be competitive with other fuel-cell options and/or the status quo, due to its lower power density and thus larger size.
The study metric of 120 W/L at 50% efficiency does not guarantee success for the DCFC, but a prototype with this capability will justify further de-velopment of DCFC technology. Note that in later sections of this report, a value of 120 mW/cm2 is used as the performance metric rather than 120 W/L. These metrics are the same assuming that the cell is only 1 cm thick (120 mW/cm2/1 cm = 120 W/L). The change was necessary, however, due to the difficulty of holding geometry consistent over various tests; using power per area allows performance to be measured across various configu-rations.
2.2 Initial results
The core technology for DCFC was licensed under a Cooperative Research and Development Agreement (CRADA) with LLNL. Their achieved results were the starting point of CEL’s initial baseline experiments. LLNL regu-larly had achieved power densities of 100 mW/cm2, but fuel efficiencies were not confirmed because the chemical reaction of carbon oxidation was well understood and considered easily achievable.
CEL’s initial focus was a power density target of 120W/L. Increasing the power output was the first challenge. This was achieved by optimizing re-active fuels, electrolyte optimization, and more importantly, the correct pressure being applied between anode and cathode. CEL’s early results proved promising, in terms of both power (Figure 4) and endurance (Figure 5).

ERDC/CERL TR-12-10 9
Figure 4. Early results — power (CEL).
Figure 5. Early results — endurance (CEL).
Once the power output was achieved, CEL’s attention focused on fuel effi-ciencies. Initially, results were well below the expected 60% and varied by fuel source (Table 3). These results and the work plan undertaken to re-solve these issues are explained in subsequent sections of this report.
LLNL Result
Target
CEI Result

ERDC/CERL TR-12-10 10
Table 3. Results of selected fuel source efficiency tests (CEL).

ERDC/CERL TR-12-10 11
3 Fuel-Cell Efficiency
Achieving a high efficiency with the DCFC has been one of the main objec-tives at CEL since the company’s start and its collaboration with ERDC-CERL, due to the enormous potential of DCFC to achieve very high effi-ciencies. The DCFC can potentially convert carbon fuels to electricity at 80% efficiency — well beyond the efficiency of any other conversion tech-nology and twice that of standard coal-fired power plants. The challenge with the DCFC, however, is actually achieving this potentially high effi-ciency in a practical design.
The overall efficiency of a fuel cell is actually composed of several efficien-cies, which are explained here to provide a basis for the later discussion of initial results for measuring efficiency, design changes made to improve efficiency, and final conclusions from this work.
3.1 Definition of efficiency
The overall efficiency of any fuel cell is the product of a theoretical effi-ciency, fuel utilization efficiency, and voltage efficiency (Table 4). The the-oretical efficiency is based on thermodynamics and is equal to 100.3% for the reaction of carbon at 750 °C. Fuel cells have a natural advantage be-cause an electrochemical reaction to convert fuel energy to electrical ener-gy allows for higher theoretical efficiencies compared to the thermody-namic limitations on other technologies such as the internal combustion engine. Even when compared to the theoretical efficiency for electrochem-ical conversion of other common fuels, the theoretical efficiency for carbon is very high (see Table 4 and Table 5), which is why DCFCs have the poten-tial to achieve efficiencies not reachable by most other technologies.
Table 4. Fuel-cell efficiency explained.
Type of Efficiency
Theoretical Efficiency
Fuel Utilization Efficiency Voltage Efficiency
Definition (∆ in Gibbs free energy) / (∆ in enthalpy)
(Fuel consumed by desired Rxn) / (Fuel input)
(Operating point voltage) / Open circuit voltage
Value Depends on
Undisputed thermodynamics Design, Engineering and Construction
Chosen operating point
ERDC/CERL TR-12-10 12
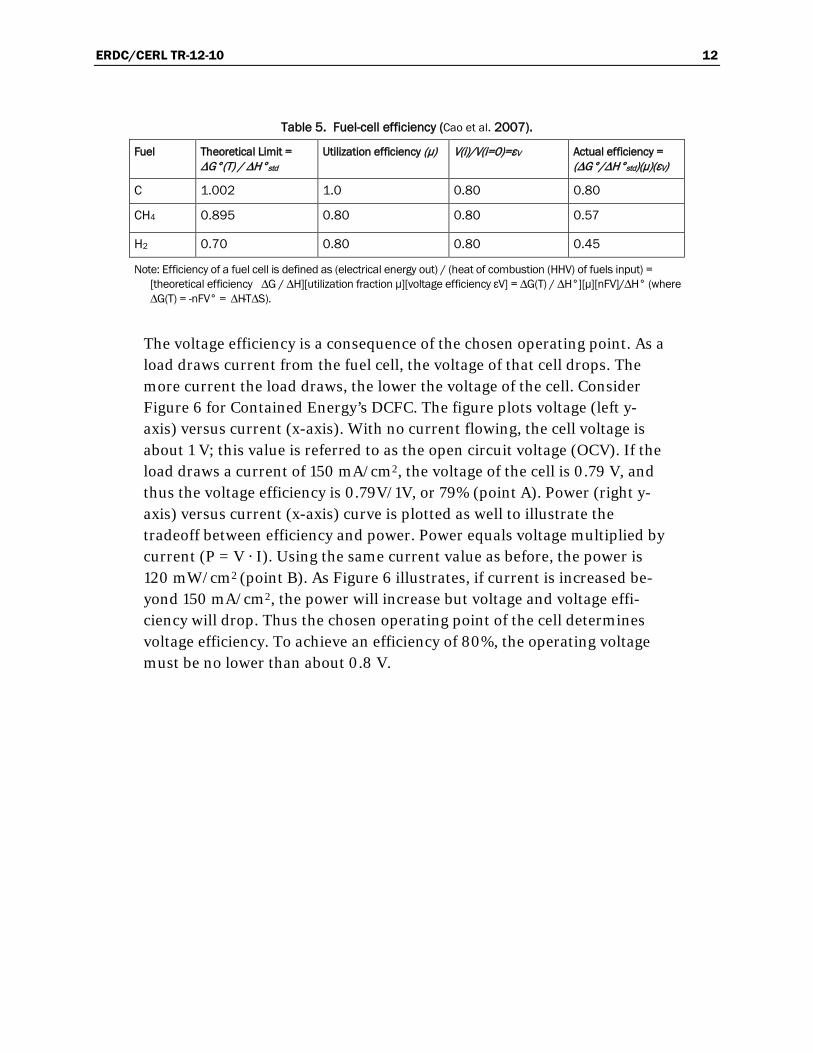
Table 5. Fuel-cell efficiency (Cao et al. 2007).
Fuel Theoretical Limit = ∆G°(T) / ∆H°std
Utilization efficiency (μ) V(i)/V(i=0)=εV Actual efficiency = (∆G°/∆H°std)(μ)(εV)
C 1.002 1.0 0.80 0.80
CH4 0.895 0.80 0.80 0.57
H2 0.70 0.80 0.80 0.45
Note: Efficiency of a fuel cell is defined as (electrical energy out) / (heat of combustion (HHV) of fuels input) = [theoretical efficiency ∆G / ∆H][utilization fraction μ][voltage efficiency εV] = ∆G(T) / ∆H°][μ][nFV]/∆H° (where ∆G(T) = -nFV° = ∆H-T∆S).
The voltage efficiency is a consequence of the chosen operating point. As a load draws current from the fuel cell, the voltage of that cell drops. The more current the load draws, the lower the voltage of the cell. Consider Figure 6 for Contained Energy’s DCFC. The figure plots voltage (left y-axis) versus current (x-axis). With no current flowing, the cell voltage is about 1 V; this value is referred to as the open circuit voltage (OCV). If the load draws a current of 150 mA/cm2, the voltage of the cell is 0.79 V, and thus the voltage efficiency is 0.79V/1V, or 79% (point A). Power (right y-axis) versus current (x-axis) curve is plotted as well to illustrate the tradeoff between efficiency and power. Power equals voltage multiplied by current (P = V · I). Using the same current value as before, the power is 120 mW/cm2 (point B). As Figure 6 illustrates, if current is increased be-yond 150 mA/cm2, the power will increase but voltage and voltage effi-ciency will drop. Thus the chosen operating point of the cell determines voltage efficiency. To achieve an efficiency of 80%, the operating voltage must be no lower than about 0.8 V.

ERDC/CERL TR-12-10 13
Figure 6. Voltage, current density, and power density.
The fuel utilization efficiency shown in Table 4 is a measure of how much fuel that is entering the fuel cell is actually consumed by the electrochemi-cal reaction. In a fuel cell that is fed gaseous fuel, such as hydrogen, this value typically does not exceed 80%; that is, 20% of the fuel passes through the fuel cell without reacting. In a DCFC, there is no exit for the carbon, so all the fuel should react and the utilization efficiency should be 100%.
In contrast to the theoretical and voltage efficiencies, the fuel utilization efficiency is more difficult to determine than just looking it up in a table or calculating from the voltage of the cell. Fuel utilization efficiency ( fη ) can
be calculated using the following formula:
recoveredcarbon wt - fuelcarbon wt nconsumptiocarbon actualnconsumptiocarbon expected ∫ ⋅
∆⋅⋅
== FntiM
fη
(Eq. 1)
where:
i = the electric current; t = time of the electrochemical evaluation; M = molecular weight of carbon;
AB
Current Density (mA/cm2)
Pow
er D
ensit
y (m
W/c
m2 )
D
CVo
ltage
(V)
E

ERDC/CERL TR-12-10 14
n = the number of electrons in the carbon reaction (which equals 4); and
F = Faraday’s constant.
The data required for this formula is the current output of the fuel cell over its operating life, the weight of the carbon fuel before operation, and the weight of the carbon fuel left over. The weight of the carbon fuel is easily measured before the experiment begins. To determine the weight after-ward, the carbon has to be separated from the frozen molten carbonate that was also present in the anode chamber. To do so, the carbon and mol-ten carbonate recovered from the anode chamber were soaked in acetic acid and water to dissolve the molten carbonate. The carbon was then re-peatedly washed, filtered, and dried to obtain an accurate measurement of the weight of the carbon recovered.
3.2 Explanation of results and the Boudouard reaction
In initial tests of DCFCs for efficiency, the fuel cells were running at about 0.6 V, so efficiencies of 60% were expected. However, the initial values recorded were less than 20%. Since the theoretical efficiency of a DCFC is 100.3%. (see Table 5) and the voltage efficiency can be readily measured, the recorded low value likely was the result of the fuel utilization efficien-cy. In other words, rather than producing electricity in the fuel cell, the carbon fuel was being consumed by another reaction.
The initial explanation for the low measured efficiency was thought to be an oxygen leak in the test apparatus. Perhaps oxygen was leaking into the fuel chamber and reacting with the carbon before the fuel had time to pro-duce power in the fuel cell. As efficiency testing of the DCFC prototypes continued, however, several experiments produced data that were incon-sistent with the oxygen leak explanation. If the low efficiency was due to an oxygen leak, then the leak should remain roughly constant whether the cell is producing power or sitting idle.
However, the leak (carbon lost per hour*
* The leak in a cell is calculated by determining how much carbon is lost per hour that cannot be at-
tributed to the electrochemical reaction taking place to produce current in the fuel cell.
) was much higher for cells that were “on” and producing power for long periods of time than for cells that were primarily idle over their lifetimes. This result seemed to indicate that the fuel-cell reaction itself was somehow increasing the leak and conse-

ERDC/CERL TR-12-10 15
quently, reducing efficiency (see Figure 7). Additional testing, including off-gas measurements, confirmed that the low efficiency of CEL’s DCFC was not due just to oxygen leaks; the next possible contributor identified was the Boudouard reaction.
Figure 7. Temperature and loan impact on efficiency.
The preferred anode reaction results in an off-gas that is pure CO2 (see Figure 8), and ideally this carbon dioxide (CO2) leaves the cell without re-acting with anything else. However, CEL’s anode off-gas measurements indicate the presence of carbon monoxide (CO), an undesired output. (The preferred reactions are illustrated in Figure 8.)
Figure 8. Direct carbon fuel cell.

ERDC/CERL TR-12-10 16
The CO in the fuel cell was a result of the Boudouard reaction:
CO2 + C 2CO (Eq. 2)
in which the unused carbon fuel in the anode chamber reacts with the CO2
off-gas produced in the electrochemical reaction to produce carbon mon-oxide, which then exits the cell. In other words, when the Boudouard reac-tion takes place, the CO2 on its way out of the fuel cell essentially picks up carbon fuel and carries it out as well (in the form of CO). The carbon picked up by the CO2 doesn’t have a chance to produce power and this consequently reduces the DCFC’s fuel utilization efficiency.
The Boudouard reaction expresses an equilibrium condition and, given enough time, it determines the percent of CO and CO2 gas composition in the presence of carbon. As Figure 9 illustrates, the equilibrium favors CO at the operating temperatures of the DCFC (750 oC – 850 oC). The Boudouard reaction is typically sluggish, but CEL’s molten carbonate elec-trolyte (also known as the “eutectic” in Figure 8) serves as a catalyst for the reaction. The rate of the Boudouard reaction in the presence of the car-bonate electrolyte was determined to be sufficiently fast enough to have the potential to severely and negatively impact fuel-cell efficiency. If the high efficiency of the DCFC is to be achieved, the Boudouard reaction needs to be eliminated from the anode chamber of the fuel cell.
Figure 9. Boudouard reaction.
Simply dropping the temperature did not solve the issue with the Boudouard reaction because dropping the temperature resulted in a drop

ERDC/CERL TR-12-10 17
in power output (see Figure 10). Thus, other ways of solving this problem needed to be investigated.
Figure 10. Effect of temperature on power.
3.3 Effect of Boudouard reaction on power output
The presence of CO in the anode also brought up the concern of the role that CO might play in the electrochemical reaction. The carbon needs to react directly in the DCFC in order to ensure high fuel utilization efficien-cy. The fuel utilization efficiency of the DCFC can be 100% in theory be-cause the carbon is solid. If instead, a gas such as CO is reacting and pro-ducing the majority of power, then fuel utilization efficiency anywhere near 100% will not be achievable. In fact, the DCFC would be less efficient than a typical fuel cell since the DCFC is not set up to run on a gaseous re-actant.
Dr. Choong-Gon Lee, a visiting professor at Case Western Reserve Univer-sity, was able to demonstrate the role of CO in the power reaction through an elegant experiment he developed while working for several months at Contained Energy (Lee, Hur, and Song 2011). Rather than drop carbon di-rectly into the anode chamber of the DCFC, as was typically done, Dr. Lee contained the carbon within a separate alumina fuel cartridge (Figure 11 and Figure 12). The advantage of using the cartridge was that it did not al-low the carbon to touch the current collector. If the carbon cannot touch

ERDC/CERL TR-12-10 18
the current collector, then it cannot react directly. That is, the only power that is produced by a cell using the cartridge must come from the reaction of carbon monoxide, not the reaction of carbon. The performance of Dr. Lee’s cartridge cell was identical to the performance of his cells that were fed carbon without the cartridge. Thus the DCFC was running almost en-tirely on the CO produced by the Boudouard reaction rather than the car-bon fuel directly.
Figure 11. Cartridge test fuel cell.
Figure 12. Detailed view of fuel test.

ERDC/CERL TR-12-10 19
3.4 Redesign of the DCFC and improvement of polarization
Based on work regarding the efficiency and Dr. Lee’s results, the operating temperature of the fuel cell was dropped from 850 °C to 750 °C, since the rate of the Boudouard reaction and the amount of CO to CO2 in equilibri-um increased with temperature (as previously noted in Figure 9). The cell also was redesigned to improve polarization of the carbon fuel in an at-tempt to eliminate the Boudouard reaction and force the cell to run direct-ly on the carbon rather than the CO.
Polarization of the carbon fuel refers to the condition when the carbon particles in the anode chamber of the fuel cell are at a different potential than the electrolyte surrounding these particles. This voltage difference naturally occurs in the fuel cell and is the force that drives the electro-chemical reaction. In other words, if the fuel particles are not sufficiently polarized (the voltage difference between the carbon and the electrolyte is not great enough), then the carbon will not react and power will not be produced. Insufficient polarization of the fuel particles may also cause the electrochemical oxidation of the fuel to be incomplete. If the carbon has enough polarization to react but not enough to fully convert the carbon to CO2, then the electrochemical reaction may produce CO rather than CO2. An example reaction could be:
2C + CO32- 3CO + 2e- (Eq 3)
The results of past literature on direct carbon fuel-cell technology have in-deed found that at very low overpotentials the DCFC will produce CO ra-ther than CO2. Thus sufficient polarization is a desired condition in the anode chamber in general. However, according to the past literature, po-larization also has the capability to protect the carbon fuel from the Boudouard reaction (Weaver et al. 1979; Vutetakis, Skidmore, and Byker 1987).
The half-cell experiments in the literature indicate that if polarization is sufficient, the carbon will only produce CO2 and the Boudouard reaction can be prevented, even if the Boudouard reaction is otherwise favored at the given temperature. The results of the early studies in the literature are the reason people continued to pursue DCFC technology; otherwise, with-out being able to stop the Boudouard reaction, the DCFC would have low efficiency and little commercial value.

ERDC/CERL TR-12-10 20
In Cherepy et al. (2005), Cooper’s group suggested that the Boudouard re-action could be excluded from the DCFC at practical temperatures (an op-erating temperature greater than 650 °C) with an operating potential of about 0.8 V or less per cell. At this polarization, the understanding was that all of the carbon fuel would be electrochemically converted to CO2 and electrons, and the Boudouard reaction would not occur.
To ensure sufficient polarization, the surfaces of all carbon particles ex-posed to CO2 in the anode compartment of a working cell must be in good contact with the molten carbonate, which conducts the ions. The carbon particles must also have good contact with other carbon particles in the bed and with the current collector in the anode to ensure that the carbon has sufficient access to electrons. If either the ionic or electron-conducting pathways are poor, the carbon may not be able to react, and if the carbon is not reacting then it is susceptible to the Boudouard reaction.
Several steps were then taken to better understand the polarization in the anode chamber and to improve polarization. Steps included using a more conductive carbon and testing several different types of carbons to com-pare results. In addition, the anode chamber was flooded with electrolyte to provide better ionic conductivity between the carbon and bulk electro-lyte. In previous designs, the carbon was merely wetted by a film of elec-trolyte since the anode chamber was allowed to drain, and all carbon par-ticles likely did not have sufficient access to the electrolyte. By flooding the anode, the carbon was now fully immersed in the electrolyte in an attempt to provide the best ionic conductivity possible. Older experiments found in the literature were repeated to confirm that those results could be replicat-ed (Weaver et al. 1979; Vutetakis, Skidmore, and Byker 1987).
Note that for all of the efficiency experiments, half-cells were used for test-ing rather than full cells. A half-cell is a cell setup where one electrode is isolated and tested individually. Although not exactly accurate, imagine cutting the cell depicted in Figure 8 in half to isolate the anode and then running tests on the isolated anode. By using a half cell, researchers were confident that only the performance of the anode was reflected, since no cathode was present.
It was soon apparent that sufficient polarization, in a carefully controlled experiment such as that used in the literature, was not difficult to achieve. The experiments found in the past literature were specifically designed to

ERDC/CERL TR-12-10 21
ensure that the reacting carbon surface is well connected electrically and has excellent access to the electrolyte (conditions necessary for polariza-tion); thus all exposed surfaces of carbon are reacting electrochemically and at high enough currents that they achieve sufficient polarization. For instance, using a solid slug of carbon such as graphite achieved fuel utiliza-tion efficiencies of about 95% in the half-cell experiments.*
In contrast, polarization in an anode chamber consisting of loose carbon particles was much more difficult to achieve. For a forward deployed gen-erator, using a slug of carbon seems impractical if the carbon is being de-rived from waste or from pyrolysis of a liquid fuel. The carbon powder produced by pyrolysis of waste or fuel would have to be pelletized into large blocks of carbon before being fed to the fuel cell. This pelletization process would not only require additional auxiliary equipment but also likely make reloading of the fuel cell difficult. Therefore, efforts were fo-cused on achieving polarization and thus high efficiency in a DCFC capable of running on loose carbon.
For controlled experiments where a slug is used, the high efficiencies consistent with the literature were achievable.
The efforts achieved fuel utilization efficiencies as high as 80% using beds of carbon particles, with an average efficiency of 68%. These results were much better than the fuel utilization efficiencies originally measured, but not sufficient for the final product.
Additional experiments attempted to improve polarization further. Beds were thinned to reduce the path length required for ions to reach all of the carbon. Gold wires were added as additional current collectors throughout the anode chamber to improve electron conductivity. None of these exper-iments, however, significantly increased the fuel utilization efficiency be-yond about 80%.
It is still possible that sufficient polarization was not achieved within the bed of carbon and that another method may generate a better result. How-ever results from an extensive number of tests also raise the concern that polarization might not be able to protect loose carbon. The carbon bed is moving and shifting continuously due to bubble generation, which can cause disconnects of the carbon and make sustaining polarization difficult.
* The carbon slug was tied to a gold wire and immersed in the electrolyte of the half-cell experiment.

ERDC/CERL TR-12-10 22
The shifting of the bed, the high surface area, and the easy access to CO2 bubbles also improves mass transport, which can promote the Boudouard reaction, thus decreasing the cell efficiency.
As of the conclusion of this study in 2010, achieving sufficient efficiency remained a challenge.

ERDC/CERL TR-12-10 23
4 Power Density
The target power density for the DCFC in this study was 120 W/L at 50% efficiency. The original DCFC test cells developed at CEL and running at 850 °C were able to achieve the power density target of 120 W/L but could not achieve the 50% efficiency due to the Boudouard reaction (refer to Sec-tion 3.3 ). Despite CEL’s many efforts to improve efficiency (e.g., lowering temperature, cell design modifications, and efforts to improve polariza-tion), the result was a significant reduction in power density to about 20 W/L (again, assuming a 1-cm thick cell). A DCFC with a power density of 20 W/L will be over ten times larger than an MCFC stack that can produce the same power output. Since manufacturing costs increase with stack volume, the current DCFC technology would be substantially more expen-sive—to a degree that cannot be overcome by the value of its fuel and effi-ciency benefits.
To improve power density, efforts were focused on the anode since it is known that the anode is primarily responsible for the observed poor DCFC performance (this result is readily apparent from half-cell experiments and from the use of reference electrodes in complete cells).
The four factors that dictate anode performance (and in fact electrode per-formance in any cell) are given below.
1. Ohmic resistance: a measure of the resistance to the flow of current in the cell.
2. Kinetics: dictates the speed of the electrochemical reaction. 3. Mass transport: moves reactants and products to and from the reaction
sites. 4. Active area: how much of the electrode is actually participating in the
reaction.
Our goal was to determine which of these factors was causing the poor per-formance in the anode of the DCFC and then fix the problem, if possible.
4.1 Ohmic resistance and active area
The ohmic resistance is a measure of both the electronic and ionic conduc-tivity within the fuel cell. The electronic conductivity is affected by the

ERDC/CERL TR-12-10 24
number and conductivity of the carbon particles within the bed, the con-nection between the particles, and the connection of the particles to the current collector. The ionic resistance is affected by the conductivity of the electrolyte, the amount of electrolyte present, and the path length through the electrolyte that the ions must travel to reach the reaction site.
To measure the ohmic resistance, alternating current (AC) impedance spectroscopy was used. AC impedance is a common technique used in electrochemical testing. Each of the factors (ohmic, kinetics, and mass transport) that dictate anode performance can be represented as an elec-trical resistance within the fuel cell and measured by the AC impedance method. The validity of the AC impedance technique depends heavily on the circuit that is used to interpret the results of the test. However, the measurement of ohmic resistance is more straightforward to interpret than the other resistances, and was found to be accurate for the DCFC.
The results of AC impedance indicated that the ohmic resistance in the DCFC is no more than about 5% of the total resistance of the cell. That is, the ohmic resistance does not seem to be to blame for the low performance of the DCFC. Note however, that the AC impedance method only measures the resistance of the portion of the cell that is actively involved in the cir-cuit being tested. For example, the electrolyte could actually be a very poor conductor, but its high resistance may not show up in the AC impedance measurement because the current only remains in the electrolyte for a very short distance. This situation was depicted by using a resistance network (Figure 13) meant to represent the current as it travels through the carbon bed (as illustrated the current is flowing from left to right). RC is the re-sistance per unit of bed that the flow of current sees within the carbon, and RE is the resistance per unit of the electrolyte. As the current travels from left to right, it can travel through the carbon (Figure 13a), or through the electrolyte (Figure 13b). At any point in the bed, the current can jump from the electrolyte to the carbon by reacting, in which case the current has to go through RCT (the charge transfer resistance).

ERDC/CERL TR-12-10 25
Figure 13. Circuit diagram to represent current flow through the carbon bed of the fuel cell.
Ideally, the current would travel throughout the bed as shown in Figure 13a; in this case, current is transferring from the electrolyte to the carbon at all points in the bed and 100% of the carbon is considered to be active (or polarized – to use the terminology in Section 3.4 ). The concern is that a situation like that shown in Figure 13b occurs instead — the current only travels a short distance through the available electrolyte due to the large resistances in the electrolyte, quickly jumps to the relatively lower re-sistance carbon, and completes it travel. In Figure 13b, only about 40% of the bed (as depicted) is active, which means that 60% of the bed is not be-ing utilized. This low active area results in poor utilization of the carbon surface area and low polarization; both of which result in decreased power.
The fact that the current quickly jumps from the electrolyte to the carbon also means that AC impedance measurement techniques may not accu-rately measure the electrolyte’s ohmic resistance, since only a small por-tion of the circuit (the first resistor in Figure 13b) is part of the active cir-cuit measurement.
Two types of tests were run to determine if the bed was mostly active or if a situation such as that shown in Figure 13b was occurring.
To test conductivity through the carbon, several tests were run in which multiple gold leads were placed into the anode chamber of the half-cell.
A
Rc Rc Rc Rc
Rct Rct Rct RctRct
RE RE RE RE
Carbon
Electrolyte
(a)
Rc Rc Rc Rc
Rct Rct Rct RctRctCarbon
Electrolyte
RE RE RE RE
(b)

ERDC/CERL TR-12-10 26
Potential scans were run using different sets of gold leads. For instance, the first scan would be tested with just one or two of the five gold leads; a second scan would use three gold leads; and the third scan would use all five leads. Results showed the performance of the fuel cell did not change substantially regardless of how many leads were used. This result indicates that the resistance through the carbon bed does not seem to be significant and thus is not likely to be causing low carbon utilization.
To test electrolyte conductivity, a half-cell design was developed whereby the exposure of the carbon bed to the bulk electrolyte within the half-cell was increased or decreased while the cell was running. Specifically, the ex-periment was designed with two separators that could be covered and un-covered (see Appendix A). Just as with the gold wire test, improving elec-trolyte access to the bed had a modest effect on performance, but in general, indicated that the carbon bed was largely active and was not lim-ited by electrolyte resistance.
As a final step in measuring the active areas in the bed, a variety of differ-ent carbons were tested with very different surface areas to see if this might be part of the limitation. Results showed that carbon surface area did not significantly affect fuel-cell performance.
The conclusion from these results was that the ohmic resistance and the active area of the electrode are not the factors limiting performance, and the carbon bed is mostly active and participating in the electrochemical reaction. A conclusion was reached that the performance problems being experienced were likely due to kinetics and/or mass transport.
4.2 Kinetics and mass transport
Several of the tests indicated that kinetic resistance was a problem. The fact that performance in half cells improved dramatically with fuel-cell op-erating temperature indicated there was significant kinetic resistance. Tests with AC impedance also indicated that kinetic resistance was very high and likely accounted for at least 60%–70% of the overall half-cell re-sistance.
To improve kinetics an attempt was made to add catalysts to the electro-lyte. However, solid catalysts (such as gold, nickel, and platinum powder) didn’t provide much improvement, likely because of the distributed nature of the carbon bed and consequently the low contact with the catalyst parti-

ERDC/CERL TR-12-10 27
cles. These catalysts also would likely be prohibitively costly to implement. A liquid catalyst is another option, but researchers were unable to identify any modifier that could be liquid in the cell at operating temperature and produce substantially more power than was already being achieved (the electrolyte used is already the catalyst of choice for increasing carbon oxi-dation reactions).
Mass transport was also an issue. In early tests using audio and visual re-cording techniques, researchers were able to determine the effect of bub-ble growth on fuel-cell performance. As shown in Figure 14, bubbles can have a dramatic impact on fuel-cell performance.
Figure 14. Effect of bubbles on fuel-cell performance.
A multitude of tests were run using agitation techniques to try to improve the mass transport of the fuel cell. Data showed that agitation techniques, particularly bubbling gas through the bed or vigorously stirring the carbon in the bed, did show modest improvements in performance. For instance, the results in Figure 15 are for a DCFC half-cell that was a stirred by an alumina paddle at the speeds shown.

ERDC/CERL TR-12-10 28
Figure 15. Voltage-current curves for a carbon bed half-cell stirred at
various speeds by an alumina paddle.
However, modest gains provided by the agitation techniques did not justi-fy the complication of adding the agitation mechanism to the cell.
ERDC/CERL TR-12-10 29
5 Contained Energy’s Hybrid DCFC
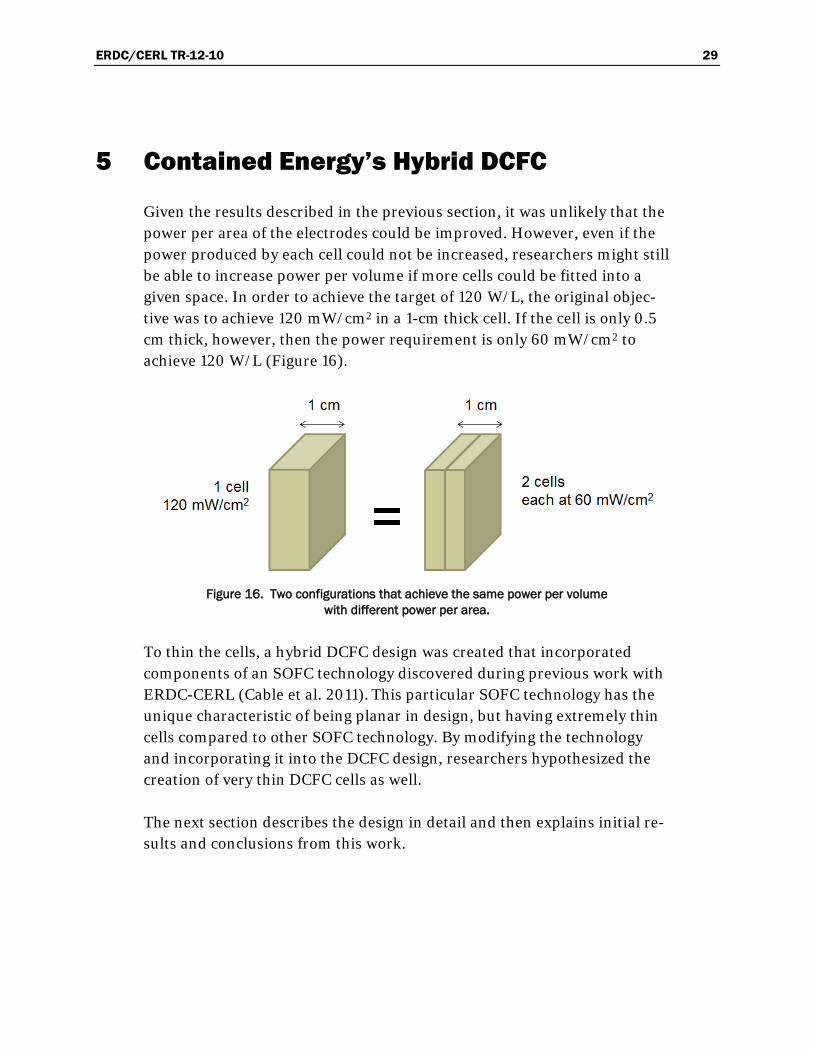
Given the results described in the previous section, it was unlikely that the power per area of the electrodes could be improved. However, even if the power produced by each cell could not be increased, researchers might still be able to increase power per volume if more cells could be fitted into a given space. In order to achieve the target of 120 W/L, the original objec-tive was to achieve 120 mW/cm2 in a 1-cm thick cell. If the cell is only 0.5 cm thick, however, then the power requirement is only 60 mW/cm2 to achieve 120 W/L (Figure 16).
Figure 16. Two configurations that achieve the same power per volume
with different power per area.
To thin the cells, a hybrid DCFC design was created that incorporated components of an SOFC technology discovered during previous work with ERDC-CERL (Cable et al. 2011). This particular SOFC technology has the unique characteristic of being planar in design, but having extremely thin cells compared to other SOFC technology. By modifying the technology and incorporating it into the DCFC design, researchers hypothesized the creation of very thin DCFC cells as well.
The next section describes the design in detail and then explains initial re-sults and conclusions from this work.
ERDC/CERL TR-12-10 30
5.1 Hybrid DCFC structure
The new DCFC design that was developed is referred to as a hybrid config-uration because the design utilizes components from both SOFC and MCFC technology.*
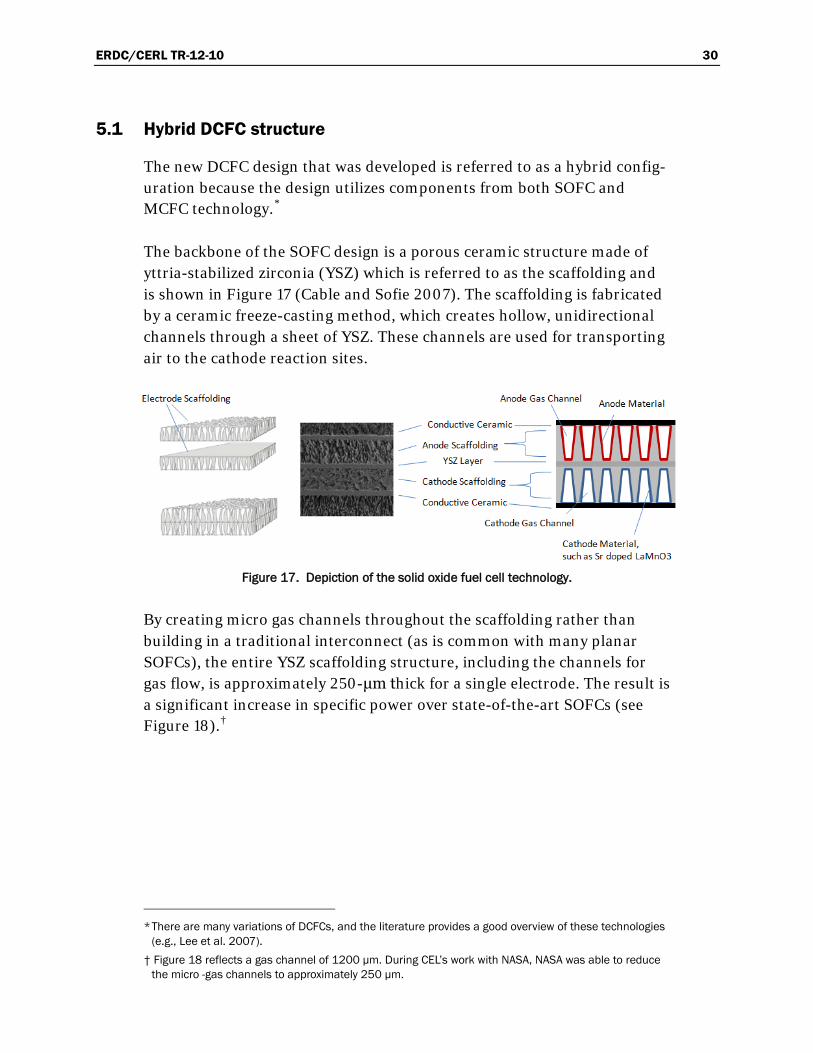
The backbone of the SOFC design is a porous ceramic structure made of yttria-stabilized zirconia (YSZ) which is referred to as the scaffolding and is shown in
Figure 17 (Cable and Sofie 2007). The scaffolding is fabricated by a ceramic freeze-casting method, which creates hollow, unidirectional channels through a sheet of YSZ. These channels are used for transporting air to the cathode reaction sites.
Figure 17. Depiction of the solid oxide fuel cell technology.
By creating micro gas channels throughout the scaffolding rather than building in a traditional interconnect (as is common with many planar SOFCs), the entire YSZ scaffolding structure, including the channels for gas flow, is approximately 250-μm thick for a single electrode. The result is a significant increase in specific power over state-of-the-art SOFCs (see Figure 18).†
* There are many variations of DCFCs, and the literature provides a good overview of these technologies
(e.g., Lee et al. 2007).
† Figure 18 reflects a gas channel of 1200 μm. During CEL’s work with NASA, NASA was able to reduce the micro -gas channels to approximately 250 μm.

ERDC/CERL TR-12-10 31
Figure 18. NASA bi-electrode supported cell (BSC) design.*
In the SOFC design, the layers of scaffolding are stacked, and different catalysts are deposited in each layer to create alternating cathodes and an-odes. In contrast, the CEL design shown in
Figure 19 uses only one layer of scaffolding per cell. In place of the anode scaffolding, a box-like structure made from zirconia (same material as the scaffolding ceramic) is used to create the anode chamber and contain the carbon.
Figure 19. Proposed DCFC concept.
* Source: February 2009 presentation by NASA GRC SOFC Team to Contained Energy.

ERDC/CERL TR-12-10 32
A dense, thin YSZ electrolyte layer is deposited between the cathode scaf-folding and the anode chamber. The YSZ layer conducts the oxygen ions from the cathode to the anode chamber, similar to a typical zirconia-based electrolyte in a SOFC. This layer also serves as a barrier to prevent the molten carbonate electrolyte from moving from the anode to the cathode. As illustrated in Figure 19, both the anode structure (the YSZ electrolyte layer) and the anode are made of the same material. CEL planned to con-struct them together in the green form and then fire them together, result-ing in a single integrated structure. A layer of a high-temperature, elec-tron-conductive ceramic, such as lanthanum chromite, is added to the top of the scaffolding of each cell and connects a set of adjoining cells electri-cally with a series connection. The single-cell structure shown in Figure 19 can then be repeated by laminating single-cell structures together to create one solid stack of any number of cells.
A common SOFC electrode material (e.g., lanthanum strontium magnesi-um oxide with a perovskite crystal structure [LSM]) is deposited by using a proprietary infiltration method on the surface of the channels on the cath-ode side to impart catalytic properties necessary to catalyze the oxygen re-action. Molten carbonate electrolyte is contained in the anode chamber to improve electrolyte/carbon contact and enhance ion transport. The elec-trons generated in the anode travel through the electrode coatings and through the conductive ceramic onto the next cell in the stack. At the ends of the stack, the electrons travel through an external circuit and applied load (in turn creating power) before returning back to the other side of the fuel cell. Figure 20 shows the pathways for a single-cell DCFC hybrid.
Figure 20. Electron and ion pathways in the DCFC hybrid design.
ERDC/CERL TR-12-10 33
Figure 20 depicts the reaction as O2- reacting with carbon, though the ac-tual mechanism could certainly be more complicated. The reactions de-picted in Figure 20 are given as:
Cathode reaction: O2 + 4e- = 2O2- (Eq. 4)
Anode reaction: C + 2O2- = CO2 + 4e- (Eq. 5)
Complete reaction: C + O2 = CO2 (Eq. 6)
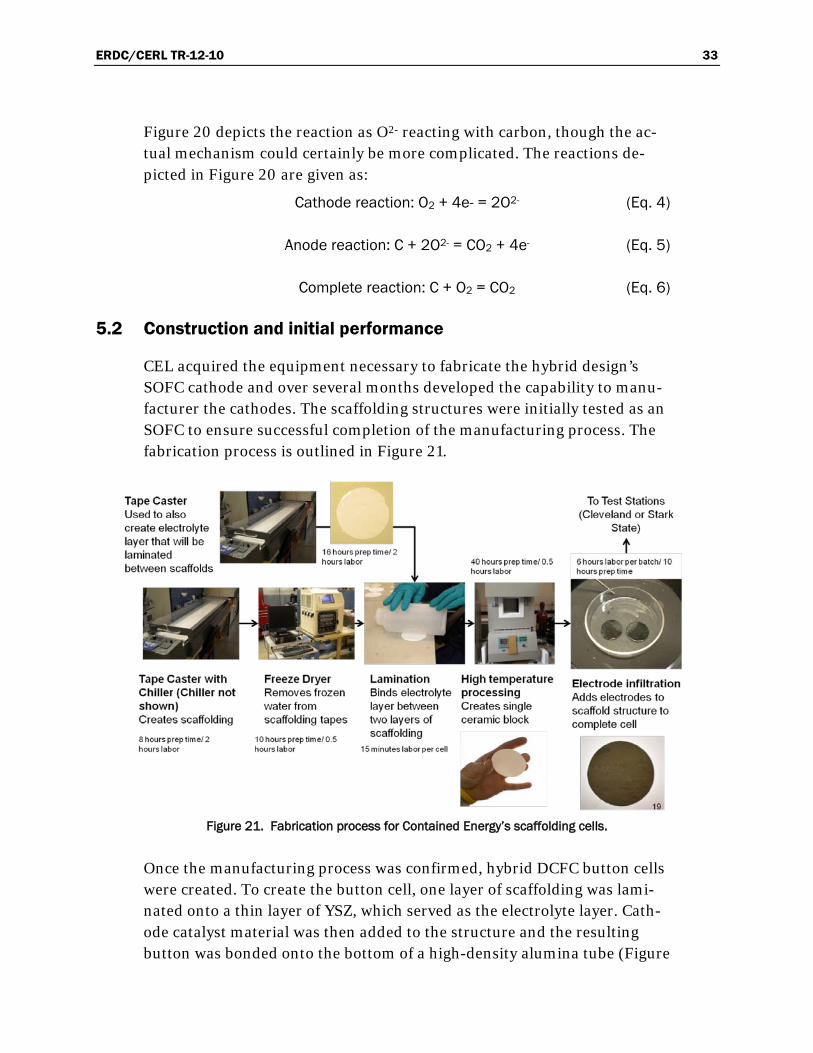
5.2 Construction and initial performance
CEL acquired the equipment necessary to fabricate the hybrid design’s SOFC cathode and over several months developed the capability to manu-facturer the cathodes. The scaffolding structures were initially tested as an SOFC to ensure successful completion of the manufacturing process. The fabrication process is outlined in Figure 21.
Figure 21. Fabrication process for Contained Energy’s scaffolding cells.
Once the manufacturing process was confirmed, hybrid DCFC button cells were created. To create the button cell, one layer of scaffolding was lami-nated onto a thin layer of YSZ, which served as the electrolyte layer. Cath-ode catalyst material was then added to the structure and the resulting button was bonded onto the bottom of a high-density alumina tube (Figure
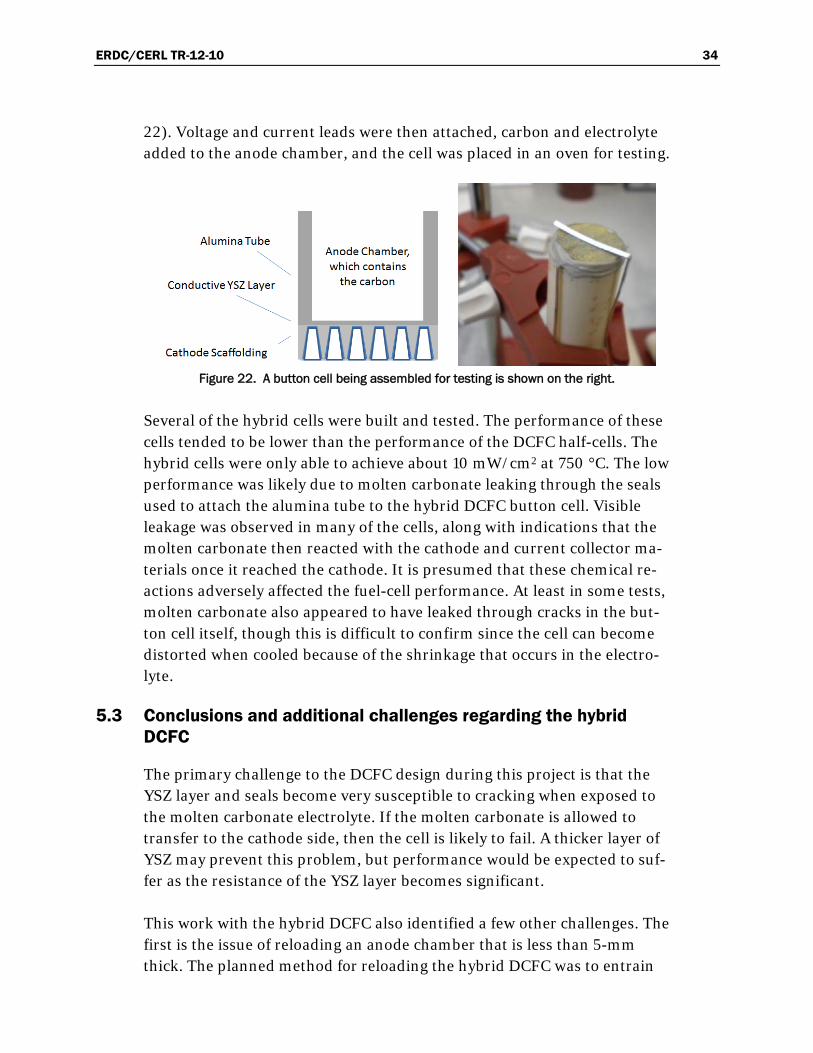
ERDC/CERL TR-12-10 34
22). Voltage and current leads were then attached, carbon and electrolyte added to the anode chamber, and the cell was placed in an oven for testing.
Figure 22. A button cell being assembled for testing is shown on the right.
Several of the hybrid cells were built and tested. The performance of these cells tended to be lower than the performance of the DCFC half-cells. The hybrid cells were only able to achieve about 10 mW/cm2 at 750 °C. The low performance was likely due to molten carbonate leaking through the seals used to attach the alumina tube to the hybrid DCFC button cell. Visible leakage was observed in many of the cells, along with indications that the molten carbonate then reacted with the cathode and current collector ma-terials once it reached the cathode. It is presumed that these chemical re-actions adversely affected the fuel-cell performance. At least in some tests, molten carbonate also appeared to have leaked through cracks in the but-ton cell itself, though this is difficult to confirm since the cell can become distorted when cooled because of the shrinkage that occurs in the electro-lyte.
5.3 Conclusions and additional challenges regarding the hybrid DCFC
The primary challenge to the DCFC design during this project is that the YSZ layer and seals become very susceptible to cracking when exposed to the molten carbonate electrolyte. If the molten carbonate is allowed to transfer to the cathode side, then the cell is likely to fail. A thicker layer of YSZ may prevent this problem, but performance would be expected to suf-fer as the resistance of the YSZ layer becomes significant.
This work with the hybrid DCFC also identified a few other challenges. The first is the issue of reloading an anode chamber that is less than 5-mm thick. The planned method for reloading the hybrid DCFC was to entrain

ERDC/CERL TR-12-10 35
carbon in an inert gas and pump this mixture into the bottom of the anode chamber. Tests to determine the feasibility of this method were run, but as the anode chamber was thinned, the bubbles carrying the carbon particles became more volatile due to the small space and tended to push the car-bon in the anode chamber out of the cell. Despite best efforts to dampen the effect of the bubbles, this reloading method did not work successfully. A better reloading method may need to be found for very thin cells.
Construction of the thin, stackable anode chambers depicted in Figure 19 may also be difficult to achieve. Part of the reason why the hybrid DCFC button cells were cracking is because there is only scaffolding on one side of the button. In the SOFC design, the fact that scaffolding is on both sides of the YSZ may help to balance the forces on the YSZ layer during manu-facturing and prevent cracking. Without the second YSZ layer, preventing cracking may be very difficult.

ERDC/CERL TR-12-10 36
6 Conclusions
The work described in this report, and in fact all work completed since CEL’s founding, has focused on the development of DCFCs that utilize molten carbonate electrolyte in the anode chamber. While this design may have the best potential for achieving the highest possible efficiencies, it al-so faces certain problems.
1. The reaction of carbon directly at the anode requires the use of molten carbonate to ensure good contact between the electrolyte and the carbon particles. Without this contact, the carbon is more likely to first convert to CO before reacting at the electrode (such as in DCFC designs developed by other researchers that only utilize SOFC components).
2. Molten carbonate creates a host of problems, not just due to reloading but also due to corrosion, shunt currents, buildup of impurities, and general operation. In particular, the molten carbonate makes turning the cells on and off difficult because if the DCFC was turned off, all electrolyte would freeze, shrink, and likely crack the fuel cells.
3. The reaction of carbon directly in the fuel cell is very sluggish (kinetics are slow), as this work has indicated, and may not be able to be improved to a level sufficient for a commercial product.
4. The Boudouard reaction is also difficult to shut off, and the cell is simply not designed to run on the CO if it is produced.

ERDC/CERL TR-12-10 37
References Cable, Thomas L., and Stephen W. Sofie. 2007. “Symmetrical, bi-electrode supported
solid oxide fuel cell.” US Patent Application No. 2007/0065701 A1, published 22-March-2007; Application No. 11/218,185 , filed 16-Sep-2005.
Cable, Thomas L., John A. Setlock, Serene C. Farmer, and Andrew J. Eckell. 2011. “Regenerative Performance of the NASA Symmetrical Solid Oxide Fuel Cell Design.” International Journal of Applied Ceramic Technology 8 (1): 1–12. Article first published online: 22 JAN 2010. doi: 10.1111/j.1744-7402.2009.02477.x
Cao, D., Y. Sun, and G. Wang. 2007. “Direct Carbon Fuel Cells – Fundamental And Recent Developments.” Journal of Power Sources 167: 250–257.
Cherepy, N. J., R. Krueger, K. J. Fiet, A. F. Jankowski, and J.F. Cooper. 2005. “Direct Conversion of Carbon Fuels in a Molten Carbonate Fuel Cell.” Journal of The Electrochemical Society, 152: A80-A87
Lee, Andrew C., Reginald E. Mitchell, and Turgut M. Gür, “Thermodynamic Analysis Of Gasification-Driven Direct Carbon Fuel Cells.” Journal of Power Sources. 194: 774–785.
Lee, C.-G., H. Hur, and M.–B. Song. 2011. “Oxidation Behavior of Carbon in a Coin-Type Direct Carbon Fuel Cell.” Journal of The Electrochemical Society, 158 (4): B410–B415.
Lux, S., F. Holcomb, and R. Wolk. “Waste-to-Energy at Military Installations through Pyrolysis and Direct Carbon Fuel Cells.” FuelCell2008-65247 in Proceedings of FuelCell2008, Sixth International Fuel Cell Science, Engineering and Technology Conference, June 16-18, 2008, Denver, Colorado, USA.
Roege, Paul E., COL. 1 April 2010. Power and Energy Strategy White Paper. Fort Monroe, FL: Army Capabilities Integration Center, http://www.arcic.army.mil/DOCS/PE%20Strategy%20Apr%202010.pdf
Vutetakis, D. G., D. R. Skidmore, and H. J. Byker. 1987. “Electrochemical Oxidation of Molten Carbonate-Coal Slurries.” Journal of The Electrochemical Society, 134: 3027. doi: http://dx.doi.org/10.1149/1.2100334. (See also D. G. Vutetakis. 1985. Doctoral Dissertation, Ohio State University, Columbus, OH.)
Weaver, R. D., S. C. Leach, A. E. Bayce, and L. Nanis, 1979. Direct Electrochemical Generation of Electricity from Coal. SAN-0115/105-1. Menlo Park, CA: Statistical Research, Inc. (SRI) ;(available from NTIS).
Wikipedia. n.d. “Technology Readiness Level.” Available at http://en.wikipedia.org/wiki/Technology_readiness_level

ERDC/CERL TR-12-10 38
Wolk, R., S. Lux, S. Gelber, and F. Holcomb. 2007. Direct Carbon Fuel Cells: Converting Waste to Electricity. ERDC/CERL TR-07-32/ADA482934. Champaign, IL: Engineer Research and Development Center, Construction Engineering Research Laboratory (ERDC-CERL). http://www.cecer.army.mil/techreports/ERDC-CERL_TR-07-32/ERDC-CERL_TR-07-32.pdf

ERDC/CERL TR-12-10 39
Acronyms and Abbreviations
Term Definition AC alternating current ANSI American National Standards Institute BSC bi-electrode supported cell CEL Contained Energy, LLC CERL Construction Engineering Research Laboratory CO carbon monoxide CO2 carbon dioxide CRADA cooperative research and development agreement DCFC direct carbon fuel cell DoD Department of Defense ERDC Engineer Research and Development Center HHV higher heating value LLC limited liability company LLNL Lawrence Livermore National Laboratory LSM lanthanum strontium magnesium oxide MCFC molten carbonate fuel cell NASA National Aeronautics and Space Administration NTIS National Technical Information Service OCV open-circuit voltage OMB Office of Management and Budget PAFC phosphoric acid fuel cell PEMFC proton-exchange membrane fuel cell SOFC solid oxide fuel cell SRI Statistical Research, Inc. TR technical report TRL technology readiness level WE working electrode YSZ ytrria-stabilized zirconia

ERDC/CERL TR-12-10 40
Appendix A: Half-Cell Setup
The half-cell setup used in the majority of CEL’s tests is shown in Figure A1; the detail of the working electrode (WE) is shown on the left, and the configuration in the alumina crucible is shown on the right.
Figure A1. Contained Energy’s half-cell configuration, employing a working electrode with a bed of carbon particles.
Figure A2 shows the alumina tube with a section cut out and a porous alumina wall glued into place to act as the separator between the bed and the bulk electrolyte.

ERDC/CERL TR-12-10 41
Figure A2. Alumina tube and separator used for a
carbon bed, working electrode configuration.
Figure A3 shows the configuration used to test slugs of carbon (also re-ferred to as button cells).
Figure A3. Half-cell configuration used at Contained Energy to test slugs of carbon.

R E P OR T DOC UME NT AT ION P AG E Form Approved
OMB No. 0704-0188 Public reporting burden for this collection of information is estimated to average 1 hour per response, including the time for reviewing instructions, searching existing data sources, gathering and maintaining the data needed, and completing and reviewing this collection of information. Send comments regarding this burden estimate or any other aspect of this collection of information, including suggestions for reducing this burden to Department of Defense, Washington Headquarters Services, Directorate for Information Operations and Reports (0704-0188), 1215 Jefferson Davis Highway, Suite 1204, Arlington, VA 22202-4302. Respondents should be aware that notwithstanding any other provision of law, no person shall be subject to any penalty for failing to comply with a collection of information if it does not display a currently valid OMB control number. PLEASE DO NOT RETURN YOUR FORM TO THE ABOVE ADDRESS. 1. REPORT DATE (DD-MM-YYYY)
30-05-2012 2. REPORT TYPE
Final 3. DATES COVERED (From - To)
4. TITLE AND SUBTITLE Energy Conversion Efficiency Potential for Forward-Deployed Generation Using Direct Carbon Fuel Cells
5a. CONTRACT NUMBER W9132T-08-C-0036 (as amended – Poooo2)
5b. GRANT NUMBER
5c. PROGRAM ELEMENT
6. AUTHOR(S) Kevin Berner, Alex Perwich, Chris Brett, Justin Ruflin, Pallavi Pharkya, Abhishek Guha, Scott M. Lux, and Franklin H. Holcomb
5d. PROJECT NUMBER
5e. TASK NUMBER
5f. WORK UNIT NUMBER
7. PERFORMING ORGANIZATION NAME(S) AND ADDRESS(ES) US Army Engineer Research and Development Center (ERDC) Construction Engineering Research Laboratory (CERL) PO Box 9005 Champaign, IL 61826-9005
8. PERFORMING ORGANIZATION REPORT NUMBER
ERDC/CERL TR-12-10
9. SPONSORING / MONITORING AGENCY NAME(S) AND ADDRESS(ES) 10. SPONSOR/MONITOR’S ACRONYM(S) HQUSACE Headquarters
US Army Corps of Engineers 441 G Street NW Washington DC 20314-1000
11. SPONSOR/MONITOR’S REPORT NUMBER(S)
12. DISTRIBUTION / AVAILABILITY STATEMENT Approved for public release; distribution is unlimited.
13. SUPPLEMENTARY NOTES
14. ABSTRACT Fuel logistics are a huge burden to the Army mission and supply lines. Improving efficiency and fuel flexibility will, in the long run, save lives as well as dollars. Fuel cells have long been looked on as a viable method to achieving efficiency and flexibility. The direct carbon fuel cell (DCFC) technology is one potential game-changing technology which could support meeting this challenge. It has the potential to convert carbon at high efficiency to a safe, non-explosive fuel, and one which could be produced from waste on-site at forward-deployed installations. The objective of this work was to produce a single-cell DCFC with a minimum performance of 120 W/L at 50% efficiency. This report summarizes a 2-year work effort by Contained Energy, LLC (CEL) to achieve this objective. The report explains the challenge of high temperature that is required to achieve the power densities necessary to produce feasible-sized, operational units. It also explains problems encountered with partial oxidation of the carbon at high temperatures which causes low ef-ficiencies (due to the Boudouard reaction). Finally, CEL’s novel and new ceramic DCFC concept is explained, along with lessons learned in advancing DCFC technology.
15. SUBJECT TERMS direct carbon fuel cell (DCFC), fuel cells, DCFC technology, non-explosive fuel, fuel logistics, military installations, lessons learned
16. SECURITY CLASSIFICATION OF: 17. LIMITATION OF ABSTRACT
18. NUMBER OF PAGES
19a. NAME OF RESPONSIBLE PERSON
a. REPORT Unclassified
b. ABSTRACT Unclassified
c. THIS PAGE Unclassified UU 50
19b. TELEPHONE NUMBER (include area code)
NSN 7540-01-280-5500 Standard Form 298 (Rev. 8-98)
Prescribed by ANSI Std. 239.1