Erasmus University Rotterdam Sari Putri Student ID number: 379393 Supervisor: Julian Emami Namini...
42
Erasmus University Rotterdam Erasmus School of Economics Bachelor’s Thesis International Bachelor Economics and Business Economics THE RESOURCE CURSE: NATURAL RESOURCE ABUNDANCE ON THE GOVERNMENT TRANSPARENCY AND ECONOMIC EXPANSION Adinda Sari Putri Student ID number: 379393 Supervisor: Julian Emami Namini Rotterdam, June 2018
Transcript of Erasmus University Rotterdam Sari Putri Student ID number: 379393 Supervisor: Julian Emami Namini...

Erasmus University Rotterdam Erasmus School of Economics
Bachelor’s Thesis International Bachelor
Economics and Business Economics
THE RESOURCE CURSE: NATURAL RESOURCE
ABUNDANCE ON THE GOVERNMENT
TRANSPARENCY AND ECONOMIC EXPANSION
Adinda Sari Putri
Student ID number: 379393
Supervisor: Julian Emami Namini
Rotterdam, June 2018

Abstract
The thesis analyzes the effect of ‘resource curse’ in ASEAN and OECD countries
between 1990 and 2016. So far, there has not been empirical research that proved
resource-rich economies in ASEAN and OECD countries had less transparency in their
governmental system than the resource-poor ones and tested whether this lack of
transparency has reduced their economic growth. By deploying ordinary least square
regression, this paper’s results show a robust negative causal relationship running from
oil and food resources export revenues to transparency. Furthermore, the decrease in
economic expansion that is affected by the shortage of transparency is a result of ‘point’
(oil, ores, and minerals) resources revenues.

2
Table of Contents
1. INTRODUCTION 1
2. LITERATURE REVIEW 5
2.1 RESOURCE CURSE 5 2.2 ASEAN 6 2.3 OECD 7
3. THEORETICAL FRAMEWORK 9
4. DATA & ECONOMETRIC ANALYSIS 10
4.1 DATA 10 4.2 ECONOMETRIC ANALYSIS 16
5. RESULTS 18
5.1 GOVERNMENT TRANSPARENCY REGRESSION ANALYSIS 18 5.2 ECONOMIC GROWTH REGRESSION ANALYSIS 23
6. POLICY IMPLICATIONS 27
7. CONCLUSION 28
BIBLIOGRAPHY 30
APPENDIX 34
APPENDIX 1 34 TABLE A: DESCRIPTIVE STATISTICS 34 TABLE B: LIST OF COUNTRIES USED IN “CORE” REGRESSIONS (45) 35 APPENDIX 2 35 TABLE C: AVERAGE VALUE OF ‘POINT’ RESOURCES (PERCENTAGE OF GDP) IN 1990-2015 35 TABLE D: GOVERNMENT TRANSPARENCY INDEX IN 2016 37 TABLE E: AVERAGE VALUE OF GDP GROWTH (PERCENTAGE) IN 1990-2016 38

1
1. Introduction
Some evidence in the past research concludes that resource-abundant countries most likely fall
in the phenomena of ‘resource curse’. Rotemberg and Woodford (1996) suggested the event of
an overvalued oil price in the period of the 1970s affected the abnormal increase of income in
the oil-rich countries, the unexpected gain in income occurred in these countries may be
expected to happen regarding their domestic savings and fiscal revenues. However, compared
to other developing countries, both of them argued that these countries have not inevitably
outshined economically. Therefore, Usui (1997) studied this paradoxical occurrence in the
setting of Dutch disease; he refers to where export revenue may have adverse effects on
tradable sectors. He added that Dutch disease impacts internally like the national economy, but
also affects the external area (non-tradable goods) that could lead to a real appreciation of the
currency.
Furthermore, another derivative of ‘resource curse' classification is the Nigerian disease model.
This model analyzes the resource benefits from export are necessarily neglected by
governments in favor of a lack of institutional capacity to manage the revenues of resource
export efficiently (Williams, 2011). As a result, he argued that these studies often lead to
corruption and rent-seeking behavior. Isham et al. (2005) added that there is a difference
between the types of natural resources that could lead to ‘resource curse’, it is generally
classified into ‘point’ resources like oil, ores and minerals; and ‘diffuse’ resources namely food
and agriculture. Research explained the term of ‘point’ natural resources; it consists of more
geographically specific, which is easier for governments to have authority on them and rent-
seeking behavior is more likely to happen (Auty, 2001). Robinson et al. (2006) elaborated on
the argument regarding ‘diffuse’ resources, which are geographically diverse; consequently, it
is hard to maintain ownership and authority for this specific resource type.
To elaborate on how economic growth diverges in the resource-rich and resource-poor
countries, World Bank (2011) illustrated it in Figure 1. It elaborates to what extent the
difference between growth winners and growth losers regarding their institutional

2
arrangements. Also, Figure 1 shows average yearly economic growth from 1975 to 2010
against the share of primary exports in respective countries.
Figure 1: Correlation between GDP growth and resource dependence
Source: World Bank (2011), cited in Free Policy Briefs
As the graph above, there is a robust negative relationship between a country’s rents of primary
exports and its consequence in the economic growth. However, World Bank (2011) argued that
there are counterexamples to the earlier research, as Norway is one of the wealthiest economies
concerning their GDP per capita, it is still the second largest of natural gas and the fifth largest
of oil exporter. Other OECD member countries, like Australia and Chile, have economically
performed well, not only due to resource wealth but also to some extent, it has an impact.
Moreover, Boshini et al. (2007) confirmed the prior research on the importance of resource
type that influences the problem. They stressed that merely more valuable and concentrated
geographically namely metals and diamonds, could impact an institutional system. The
following figure illustrates the result of their research by exhibiting the marginal effects on
different resource type in the relationship with institutional quality.

3
Source: Boschini et al. (2007), cited in Free Policy Briefs
The upper graph shows a positive effect on good institutions with mineral exports production
and an adverse impact on poor institutions; the below figure shows that it has steeper
consequences when it comes to metals and diamond production.
At a theoretical approach, efficiency level of institutions has not specified the level of
transparency yet. In the past decade, the transparency movement has raised awareness as Islam
(2006) added that international organizations argue that transparency is a requirement for a
better institution and a suitable measurement for corruption. Indeed, transparency can multiply
the problems associated with resource-abundant countries (Kolstad & Wiig, 2009). They also
argued that this lack of transparency could make corruption more attractive and generate
principal-agent problems in a country (this means that it is between government and its citizens
as well as the elected officials and the bureaucracy). Also, Williams (2011) stressed that
through these resource revenues by decreasing the importance of national taxation can excavate
democracy system in the country. Therefore, this thesis aims to bridge this gap empirically by
examining the effects of natural resource abundance on specifically government transparency
as well as to the country’s economic prosperity.
Figure 2: Different types of resources on the institutional quality

4
Thus, if this tremendous natural resource extraction dangers to shift the political and economic
condition of countries who export the resources, and investments in ‘point’ resources will only
expand resource exhaustion and escalate corruption, then it is essential to analyze the ‘resource
curse’. Hence, the research question is:
To what extent does the natural resource abundance hinder the quality of government
transparency and the national economic growth?
This thesis creates a few additional contributions. First of all, I believe there have not been
previous studies that have analyzed the different effects of each type of natural resources on
transparency as well as economic growth in ASEAN and OECD countries. The ‘point’ resource
components of natural resources could be presumed to affect government transparency and
economic growth negatively. Secondly, the thesis will focus on these multinational
organizations, which are classified in the Association of Southeast Asian Nations (ASEAN)
and in the Organization for Economic Co-operation and Development (OECD), to see whether
these countries could have impacted by the ‘resource curse’. Thirdly, as this thesis aims to
investigate whether the abundance of natural resources has direct effects on institution’s
transparency that subsequently is affecting economic growth in the country. Therefore,
additional variables were taken into account whether country’s trade openness will have a
positive or negative effect on the transparency and whether real effective exchange rates will
affect growth beyond the trade openness of the respective country. Rodrik (2008) added that
undervaluation of the currency impacts economic growth in developing countries. Finally, this
thesis employs a recent data set (1990-2016) and carries out some robustness tests to verify the
results validity.
The rest of this thesis structured in the following: In the second section, it presents the literature
review that will summarize previous research findings that bring together the main arguments
in this thesis. The theoretical framework will show in Section 3 where it outlines the hypotheses
regarding the resource-rich economies on transparency and economic growth. The data along
with the econometric analysis to explain the methods used in testing the postulated hypotheses
will demonstrate in Section 4. Section 5 will be presenting the findings, while Section 6 will
discuss the policy implications. The conclusion regarding the research question, discussion on
the shortcomings and possible approaches for further studies will reveal in Section 7.

5
2. Literature Review
2.1 Resource Curse
One crucial finding by World Bank (1994) in economic prosperity area is resource-abundant
nations have tendency to develop less rapid than states with a lower level of natural resources.
It gives examples that economic development losers, such as Nigeria, Zambia, Venezuela,
Saudi Arabia, Sierra Leone, and Angola are all resource-abundant economies, which are still
left behind until now. In comparison, Asian tigers like, South Korea, Hong Kong, Taiwan, and
Singapore are all resource-poor countries that perform relatively well. Relatively, World Bank
argued that resource-rich economies are one-step behind than the less resource reserve
countries. However, it concluded that we should not jump to the conclusion that ‘resource
curse’ impact all resource-rich economies. World Bank also gave the contrary evidence from
many growth winners: Canada, Norway, Botswana, and Australia are resource-abundant
countries, yet they are well-developed economies. Furthermore, five out of eighty-two
countries included in a World Bank research study, those belong to the top eight economies
concerning natural resource wealth and the uppermost fifteen countries regarding their GDP
per capita.
In contrast, Sachs and Warner (1995) found that the resource abundance leads to a deterioration
of institutional quality, which subsequently is reducing economic prosperity, was empirically
unimportant. They argued that the natural resource abundance is not a sufficient parameter to
analyze the role of institutions, this is because of the lack of evidence for institutional
deteriorate caused by natural resource abundance. They claimed that natural resources raise the
standard for institutional arrangements so that ‘resource curse' merely happens in countries
where poor institutions occur.
Lane and Tornell (1996) found that inefficient institutions cause the failing economic condition
after the unexpected oil gain in Nigeria, Mexico, and Venezuela, which ultimately was inviting
grabbing activities in these countries. They added that there are disarrangements in the
governmental system, such as corruption, the weak rule of law and malfunctioning
bureaucracy. Acemoglu and Robinson (2000) gave an example in Congo, the great natural
resource wealth, including 15 percent of the world’s copper reserves, vast amounts of gold,
zinc, diamonds, and oil gave the former president (Mobutu) a constant flow of income to assist
sustaining his power and position. They added that higher resource rents make it more

6
convenient for dictators to buy off political problems and resource abundance increases the
political benefits of buying votes.
2.2 ASEAN
The Association of Southeast Asian Nations (ASEAN) has ten member countries. Amongst the
ASEAN members, Laos, Vietnam, and Cambodia are agriculture-based economies with a high
proportion of gross domestic product (GDP) comes from the production. Singapore is the most
urbanized country in ASEAN. Hence, its contribution to the agriculture activity to its GDP is
not until 5 percent (ASEAN, 2002). The research added that Indonesia, Malaysia, Brunei,
Myanmar, and Thailand are five countries in ASEAN with the most substantial inheritance of
both individual income and total oil resource.
Figure 3: Oil reserves in Southeast Asia
Source of Data: World Development Indicators
On a national level, the organization has stimulated the formation of two national platforms to
increase awareness in cooperation in the field of politics, security, trade and investment,
agriculture and sustainable development (ASEAN, 2002). On the other hand, as a matter of
fact, ASEAN is a community with different levels of political and economic conditions.
Similarly, social divergence in these countries triggered by their difference in infrastructural
and urbanization levels. In addition, while the economic outlook in Indonesia and Philippines

7
are uncertain, the economic prosperity in Malaysia, Thailand, and Singapore are promising
(ASEAN, 2005).
Poor system and corruption are familiar in Southeast Asia. Kenny (2007) possessed that
substantial infrastructure project in ASEAN is often inviting corrupted governance, due to their
capital-intensive type. He added that in Indonesia, a financial review of roads built in a village
reported missing materials amount to 24 percent of total expenditure and assumed the parties
involved corrupted it. Kenny also explained that most of the medium-sized enterprises in
ASEAN countries expect to lose at least 11 percent of its budget for infrastructure projects on
bribing system.
Nehru (2012) argued the theory behind the ‘resource curse’ is worrisome for ASEAN due to
economic divergence and weak institutions. For instance, Brunei and Singapore are the most
developed economies, Brunei as the power of oil, while in manufacture, technology innovation,
and exclusive services taken by Singapore. He believed that Indonesia has (on average) small
fiscal deficit, steady growth, but poor government system and external debt burden. On the
other side, Malaysia and Thailand stay in excellent condition and grow steadily, while Laos
and Cambodia pushed by their resource-rich production and the effect of rapidly increasing
adjacent markets. For Vietnam, Nehru added that it continues to run the high external current
account and fiscal deficit, but it has a large state enterprise sector.
2.3 OECD
Bassanini and Scarpetta (2001) found that there is no evidence for developed economies grows
at a slower rate than emerging economies. However, evidence of this convergent situation has
been weakening in OECD countries. They argued that this could show that nations may
persistently show divergences in growth rates and living standards because of differences in
resources, framework conditions, saving rates and technological advances. Figure 4
demonstrates the deviations in GDP growth (annual percentage) among OECD members,
whereas the vertical axis is the OECD countries and the horizontal axis is the year proposed.

8
Figure 4: Comparison of GDP growth for OECD members
Source of Data: World Development Indicators
Jiménez-Rodríguez and Sánchez (2005) described that the divergence in the economic
conditions of OECD countries could show regarding how natural resources impact their stage
of growth. In regards with OECD oil exporters, it indicates that Norway advantages from oil
price increased, on the other hand, in the United Kingdom a rise in oil prices is shown to have
a negative impact on GDP growth. These opposite results for oil-rich countries traced, which
is a significant appreciation in the real exchange rate for UK pound sterling.
Karl (2005) explained the effect of oil export production on the political economics of two
countries, which are Mexico and Norway, only Norway that highly produced oil correlates with
positive growth unlike for Mexico. Karl added that countries whom focusing on oil production
and declining in other economic activities, creating high subsidies for oil companies and
prioritizing oil profits above the other public goods. In contrast, she argued that the resource
curse is by no means inevitable in some OECD members – Australia, Chile, Canada and the
United States; as they are still leading in mineral and manufacturing productions and have
consistent improvement in their per capita national income.

9
3. Theoretical Framework
According to the literature review, a set of hypotheses formulated on the impact of natural
resource abundance on government transparency and economic growth in ASEAN as well as
OECD countries. The ‘resource curse’ hypothesis predicts that resource-rich economies or
nations that are highly dependent on their natural resources have a lack of transparency in their
governmental institutions and move slowly in growth. Additionally, the past empirical reports
serve as partial assistance for a negative relationship between natural resource profits and
institutional quality. As this thesis focuses on the abundance of natural resources may lead to
low transparency in the government system, the first hypothesis is therefore as follows:
Hypothesis 1: Resource-rich countries in ASEAN and OECD are less transparent than other
countries
In the above discussion, the majority of empirical and theoretical research, which have studied
the effect of the primary export revenues, directly affect inefficiency in the institutions. Some
political economy theories concluded that a situation with a lack of transparency and
accountability, a ‘resource curse’ would happen where the resource is abundant as there is no
effective system to monitor the government officials' activities. Interestingly, in intuitive, it can
be confirmed empirically that countries with abundance in natural resources with good
institutions have performed quite well, while others with poor quality have not performed well
economically. On the other hand, one probable downside argued by Mehlum et al. (2006), it is
that the government system is exogenous to resource abundance. However, Robinson et al.
(2006) argued that the previous argument is not entirely true due to the resource rents can
impact the quality of a country's institutions. Hence, in this thesis' topic, it could be understood
that a shortage of government transparency significantly impacted by the resource revenues.
Thus, a second hypothesis formulated is:
Hypothesis 2: Resource-rich countries in ASEAN and OECD are less transparent as a direct
result of their resource revenues
Finally, this thesis examines the impact of natural resources revenues on economic growth. To
check the significant resource revenues could lead the government trying to cover the specific
level of these rents, where this will have a broad adverse impact on the economy altogether.
Williams (2011) described that these revenues treated as a tax on the revenues, but the

10
downside is the government officials who receive it not the government, and any deadweight
losses to the overall economy may become eventually very little due to this manipulation. He
added yet this is not often to happen. There are possible ways to affect the broader economy
by a lack of transparency, namely when the government does not commit to being transparent
in their actions concerning the data release to its citizens, which is not only existing in resource-
abundant countries (Williams, 2009). He also added regarding the difficulty of releasing and
gathering information; it would be hard for the private market participants to construct
investment and consumption decisions. Therefore, it may be logical to speculate a negative
relationship between natural resource abundance and economic growth. Thus, the third
hypothesis postulated in the following:
Hypothesis 3: Resource-rich countries in ASEAN and OECD are less transparent, and this
lack of transparency has a negative effect on economic growth
4. Data & Econometric Analysis
4.1 Data
The variables that used in this paper outlined in this section. Table A in the appendix section
provides summary statistics of all variables used. This assessment analyzes the connection
between natural resources, transparency and economic prosperity on the within-country
variation in all of these interest emerging economies – 10 ASEAN and 35 OECD countries for
the period span of 1990 until 2016. The panel data deployed is formed by the data availability
as well as the period where the sample countries are sensitive to a significant Asian financial
crisis in the 1990s, peaking in the year of 1997, which impacted a worldwide economic
meltdown due to financial contagion. Table B in the appendix presents all of the countries
employed. The statistics composed of an unbalanced group of annual observations.
The Dependent Variables
Government Transparency – the first dependent variable – is employed by the E-government
Development Index to enhance transparency. The index used is 0 to 1 index, with 1 representing
the highest level of transparency. Bertot et al. (2010) suggested that e-government and social
media would improve transparency in the country regarding standard developing

11
measurement for transparency. Open e-government concept is not a requirement but a necessity
to acquire national citizens' demand for more accountability, openness, and transparency
(Ganapati & Reddick, 2012). Data on e-government were obtained for each nation from the
United National E-government Knowledge Database. This recently developed database
provides extensive coverage across United Nations member states, to serve a performance
rating of member countries' governments compared to one and the other (United Nations,
2016). The database has started since 2003 and had some gaps in 2006, 2007, 2009, 2011,
2013, and 2015. The last data set used for the year 2016. Eight observations of e-government
obtained for each country being lagged for one period, thus totaling 227 observations.
GDP Growth – the second dependent variable – is employed in the second regression analysis.
It is annual percentage growth rate of GDP at market prices based on constant domestic
currency. The aggregates of GDP growth based on U.S. dollars in 2010. Based on World Bank
(2011), GDP is the sum of gross amount added by all production in the economy and any
product taxes and deducted by any subsidies, which are not including in the production of the
goods. The GDP growth calculated without taking into account deductions for depreciation of
assembled assets or reduction of natural resources. GDP growth itself plays a role as a
dependent variable for the second analysis to see the best aggregate measure of economic
activity in the respective countries, unlike GDP per capita growth that does not account the
overall financial health of a nation. Kolstad and Wiig (2009) explained that the economic
growth analysis aims to see whether the inadequacy of transparency regarding the revenue
earned from natural resource may consequently have a negative impact on the overall economy,
both directly from asymmetrical information and indirectly, through institutional qualities like
corruption. The data obtained from World Development Indicators.
Research once described that the higher transparency in one country, the greater would be the
investment, which ultimately can affect the economic growth (Williams, 2009). Humpreys et
al. (2007) explained that from 1997 to 2000 countries with abundance in the natural resource
have performed less in economic condition than the states with less plenty in natural resource.
They added that it could show that political economy and governance are essential when it
comes to vulnerability in countries regarding ‘resource curse'. Bevan et al. (1999) summed up
that Indonesia grew much better than Nigeria in the progress of its resources and successfully
leave the ‘resource curse’ hypothesis due to the rapid economic growth in the continent of Asia
whereas trade and investment are greater than in Africa, to understand that Nigeria’s

12
neighbors struggled in economic condition. A combination of lack of transparency and
abundance in natural resource plays a role to analyze the presence of ‘resource curse’ (Rosser,
2006).
The Independent Variables of Interest
Primary Commodity Exports. One of the main topics in this paper is that resource abundance
could impact a direct negative condition on transparency. To test this hypothesis, the first
regression model uses a variable of primary interest: Primary Commodity Exports (a proxy of
resource revenues) as a proportion of country’s GDP. These estimates formed from methods
described in The Changing Wealth of Nations: Measuring Sustainable Development in the New
Millennium (World Bank, 2011). Furthermore, I would like to separate the type of resources,
aim to see the different impacts of transparency and economic growth as confirmed by
Williams (2011). He emphasized that several essential factors may be relevant to transparency
on natural resources, which is how specifically ‘point' resources (fuel, ores, and minerals)
revenues negatively affect transparency or whether any natural resources can affect rent-
seeking behavior that ultimately causes transparency to decrease. That is why, to test the
hypothesis of whether specific type of natural resources, four additional variables are added to
compare, namely: Fuel, Ores and Minerals (proxies of the ‘point’ resources, which
hypothetically cause negative effect on institutions); Food, Agriculture (proxies of the ‘diffuse’
resources, which hypothetically have a more insignificant impact on institutions). These data
on natural resources revenues obtained for each country and year from the World Development
Indicators. There will be lags (of varying degrees) in the natural resources employed. The
‘point’ resources predicted to have a negative relationship with transparency, while ‘diffuse’
resources variables predicted to have a positive relationship with transparency.
GDP per capita. This variable has a role as an independent variable in the second regression
analysis and acts as a control variable in the first equation. It highlights that income might
affect transparency and economic growth. It is in U.S. Dollars at prices in today’s value. The
natural logarithm of this variable will be used to analyze the elasticity of GDP per capita
regarding transparency. The data obtained from World Bank Data and OECD Data. The overall
economy is mostly affected by the lack of data release or information released by the
government regarding private market investors on their decisions in investment and
consumption (Williams, 2009). Research from Mehlum et al. (2006) concluded that those

13
good institutions induce entrepreneurs to invest in the country, which will impact living
standard in the society increases.
Control Variables
Data on these eight variables have been identified by prior research, as potential factors that
could affect transparency and economic growth obtained. All variables take one-period lags.
They briefly explained below:
Executive Constraints. The Political Constraint Index Dataset (POLCON), under the
production of Witold J. Henisz, measures the magnitude of challenges in the administrative
sector of government. The index features the executive, judicial and legislative sections of
government in the respective countries. It analyzes weak to a substantial degree through 0 to 1
scale. The statistics employed from Governance Assessment Portal. Karl (2005) described that
natural resources dependent countries for the livelihood of the people are one of the
problematic states economically, socially unstable and conflicted government. Williams (2009)
elaborated that how higher revenues of primary exports will directly impact a less efficient of
the executive and lower transparency.
Gross Secondary Enrolments. Both genders and independent of age computed as a proportion
of the population of official secondary education age for the data of gross secondary
enrolments. The research is collected to see how education impacts government transparency.
The statistics computed from the United Nations Educational, Scientific and Cultural
Organization (UNESCO) Institute for Statistics. This level of education is expected to improve
the transparency since there is an improvement in education level involves greater skills and
knowledge in the population. Williams (2011) argued that the supply side of the transparency
is the quality of the data that are produced by the government needs high levels of education
and the demand side is educated citizens, which they demand more information when they are
well-educated. At the same time, UNESCO (2016) insisted that it is vital to put sufficient
transparency within the government to enable the civil society to play their full part in
development, namely, education. Therefore, a positive relationship expected between
education enrolment and transparency.

14
Government Consumption. Government’s final expenditure presented as a proportion of GDP.
Data employed from World Development Indicators dataset. A high amount of natural resource
may lead to higher government expenditure; this could be the case due to ‘buy off’ interest
groups (Williams, 2011). However, the higher spending of the government can also cause by
the rise of general welfare spending, i.e., for online infrastructure, increasing government
transparency (Pina et al., 2010). They also added that citizens use Information and
Communication Technologies (ICTs) to empower them to observe government performance
and accountability, to increase interactivity between government and its citizens through the
Internet.
Country’s Openness. The ratio of trade (imports and exports) to country's GDP used as a proxy
of country's openness variable. Data on the sum of trade as a percentage of GDP collected from
World Development Indicators. Countries undertaking on trade negotiations are not only
looking for the accessible in market opportunities, however, to reduce market opacity that will
build up regulatory transparency, which can be seen already in OECD countries and large
emerging economies in these past years (Lejárraga & Shepherd, 2013). Surely, openness and
transparency centrally define the commitment a government chooses as the basis of how it
shares information with its citizens (Alemanno, 2013). On the other side, he added that
openness would increase the technology spread from well-developed economies to developing
countries that could consequently promote the economic growth of a nation. Hence, I expect
to have country’s openness positively correlated to transparency and economic growth.
Population Growth. This variable represents annual growth rate from the previous period to
the current period, expressed in percentage. The population based on the de facto definition
where it counts all residents irrespective of their legal status or citizenship in these 45 nations.
Data on population growth derived from World Development Indicators. A few theoretical
analyses emphasize that high increase in the population may create pressure on the low level
of natural resources, reduce private and public arrangement (World Bank, 1994). Often,
population growth is related to the food problems, for instance, malnutrition and hunger. If this
happens rapidly, it will affect the economic turmoil to rise (Becker et al., 1999). On the other
hand, there is evidence that shows population growth has a positive effect on Indonesia's
economic growth (Putra, 2011). He argued that the needs of the labor force are relatively high
in Indonesia; hence low-skilled and high-skilled people mostly employed in many industries.
Therefore, this factor supports economic development in Indonesia.

15
Institutional Quality. IQ is a proxy that shows a perception of the quality of public sector, civil
service and the level of its independence from political constraints. Also, how the quality of
policy formulated and the implementation as well as the credibility of the government's
devotion to formulated systems. The scale is -2.5 to 2.5 from weak to robust criteria. This data
collected from Worldwide Governance Indicators (WGI) dataset, a branch of World Bank
statistics. The database starts from the period of 1996 to 2015, with the lag in the years of 1997,
1999 and 2001. Sachs and Warner (1995) considered that rent-seeking hypothesis that is caused
by natural resource abundance might lead to a deterioration of institutional quality, which
ultimately hurts economic growth. The argument by Sachs and Warner is inconsistent with
another research employed in Norway, which is considered, as one of the European poorest
countries in the early 20th century yet now is one of the wealthiest European countries
(Mehlum et al., 2006). They argued that the growth of Norway be recently profoundly affected
by its oil export and natural gas export, and then is regarded as one of the least corrupt countries
in the world.
Real Effective Exchange Rates. This variable represents the nominal exchange rate – a
measure of the value of one currency over a weighted average of some foreign currencies,
divided by a price deflator (World Bank, 2011). Data on this variable adopted from
International Monetary Fund database. Macdonald (2000) suggested that if the productivity
growth in a country’s productive sector has a higher demand than its trading partners, an
appreciation of its real effective exchange rate be affected. Additionally, past research
experienced the negative impact of depreciation on output growth in five out of eleven
countries, while in the six of the states given, currency depreciation improves their economic
growth, namely: Indonesia, Myanmar, and Philippines (Christopoulos, 2004). It implies that
developing economies’ growth could easily impact by exogenous changes, depending on the
types of changes that come from its major buyer (AbuDalu et al., 2014). Adjustments in GDP
growth happen merely if the change regarding trade triggers a shift in local employment and
output, the impact of a change in the trade sector is not automatic, unlike the exchange rate
effect (Barro, 1997).
Once all control variables included in the regression analyses, data availability is taking into
account and resulting 839 observations are available for each variable, except Institutional
Quality, which amounts to 578 observations.

16
4.2 Econometric Analysis
Above three hypotheses explained were first tested using Ordinary Least Squares (OLS)
regressions as this thesis tries to analyze the impact on the natural resource revenues on the
country transparency and economic growth. Fornell and Larcker (1981) suggested that
unobservable confounding variables, which differ across time, might exist. Also, taking into
account the difference in size and growth in the sample countries. Thus the regression analyses
employ both country and time fixed effects. On the other note, in this paper, the residuals of
all regression models fulfill the homoscedasticity and normal distribution criteria.
Based on the previous research, there is a tendency for higher revenues of natural resource
exports could lead to less accountability from the executives and inefficient transparency. It is
therefore important to take account range of factors that are also influencing the release of data
and information to statistical examination. According to above theories, Equation 1 will be
used to investigate the first and second hypotheses, the core regression analysis of this thesis
is:
𝑮𝑻𝒊𝒕 = 𝜷𝟎 + 𝜷𝟏𝑵𝑨𝑻𝑹𝑬𝑺𝒊𝒕−𝟏 + 𝜷𝟐𝒁𝒊𝒕−𝟏 + 𝜸𝒊𝒕−𝟏 + 𝜺
(Equation 1)
Where i = 1, …, 45 and t = 1990, …, 2016 denote the country and year proposed respectively.
GT is the E-government Development Index (as a proxy of transparency), NATRES is the
natural resources employed, Z is a number of control variables that were hypothetically
influenced transparency. 𝛾 is a set of time dummy variables to describe for common aggregate
shocks and to command for each country heterogeneity. 𝜀 is the error term. Attentively, the
coefficient 𝛽1, regarding the explanations above, should be negative.
The panel data employed is from 1990 until the recent year, 2016. The initial sample size
consists of 45 countries (see Table B for a list of these countries), highlighting the emerging
countries of interest – the Southeast Asian nations as well as OECD members. As I am
interested in the causal relationship between natural resources and transparency, all variables
that deployed lagged by one period.

17
The subsequent question is how low level of transparency seen in ‘point’ resource-rich
countries is responsible for many other areas of the economy. In a different meaning, blocking
some information released regarding a lack of transparency to increase the revenues from
natural resource export will ultimately impact some areas of the economy. Hence, the third
hypothesis tested in Equation 2; it will be used to analyze whether reduce of economic growth
in one country, which affected by the resource rents that suffered from omitted variable bias
(government transparency). Some of the previous variables that employed in Equation 1 will
be included, again to see how various transmission mechanisms will operate in the regression
analysis. Using the same sample period and sample countries as Equation 1, the second
regression analysis is:
𝑮𝒓𝒐𝒘𝒕𝒉𝒊𝒕 = 𝜷𝟎 + 𝜷𝟏(𝑳𝒐𝒈)𝑮𝑫𝑷𝑷𝑪𝒊𝒕 + 𝜷𝟐𝑷𝑶𝑷𝑮𝒊𝒕 + 𝜷𝟑𝑶𝑷𝑬𝑵𝒊𝒕 + 𝜷𝟒𝑺𝑬𝑪𝒊𝒕 +
𝜷𝟓𝑿𝑪𝑶𝑵𝑺𝑻𝒊𝒕 + 𝜷𝟔𝑮𝑶𝑽𝑪𝒊𝒕 + 𝜷𝟕𝑵𝑨𝑻𝑹𝑬𝑺𝒊𝒕 + 𝜷𝟖𝑹𝑬𝑬𝑹𝒊𝒕 +𝜷𝟗𝑰𝑸𝒊𝒕−𝟏 + 𝜸𝒊𝒕−𝟏 + 𝜺
(Equation 2)
Where i = 1, …, 45 and t = 1990, …, 2016 denote the country and year proposed respectively.
Growth is annual percentage of GDP growth; (Log)GDPPC is the log of initial per capita;
POPG is the percentage of population growth over each period; OPEN is the sum of exports
and imports as percentage of GDP; SEC is a proxy of gross secondary enrolments; XCONST is
the executive constraints index; GOVC is a proxy for government expenditure; NATRES is a
number of the natural resources employed such as fuel, ores and minerals, agriculture raw
materials, food exports; REER is a proxy of real effective exchange rates; and lastly, IQ is the
institutional quality. 𝛾 is a set of time dummy variables to describe for common aggregate
shocks and to command for each country heterogeneity. 𝜀 is the error term. Attentively, the
coefficient 𝛽1, regarding the explanations above, should be positive.
A robustness test will be performed to verify the results validity. First of all, natural resources
separated into primary commodity exports and different type of resources, namely: ‘point' and
‘diffuse'. In theory, primary exports specifically have an ambiguous effect on the transparency.
From the evidence of early research, Ross (2001) analyzed that it did appear the ‘point'
resources to affect transparency negatively in general, which may turn effect that not all
resources would have this effect on transparency. That is why it is relevant to examine whether
a specific type of resources influences country's institution. Next, it is also useful to remove

18
the year lag of the dependent variable, as the lag alone already ‘soaks up' a significant
proportion of the variation in Government Transparency and GDP Growth. Then, the natural
logarithm of all variables will be carried out to analyze the elasticity of transparency and
economic growth. Osborne (2012) emphasized that using a logarithm degree assists the
analysis to be normalized from the error term, and then ultimately improves the robustness of
OLS regression estimation. Finally, it is theoretically possible that reverse equality may exist.
However, when switching the NATRES variable to be dependent variable and Government
Transparency as the independent variable is never significant.
5. Results
5.1 Government Transparency Regression Analysis
As explained in the theoretical framework, the first step to be analyzed here is whether
resource-rich countries are less transparent. Due to other factors that influence transparency
other than natural resources, Table 1 included the control variables and lagged by one period:
The log of GDP per capita, Executive Constraints, Gross Secondary Enrolments, Government
Consumption and Country’s Openness.
Table 1 provided the results when Government Transparency regressed to Primary Commodity
Exports and the control variables. The analysis regressed for seven models, starting with only
natural resources and transparency and then adding the control variables. As I would like to
see the effect in ASEAN economies specifically, I also did remove OECD countries in the
fourth model. Allegedly, the impact on resource rents to transparency is statistically significant
in Model 1. Thus, the first hypothesis, countries in ASEAN and OECD with abundance in
natural resources are less transparent, is not rejected, which means that natural resources have
a negatively significant relationship with transparency. In Model 2, I am adding several
variables: The log of GDP per capita, Executive Constraints, Gross Secondary Enrolments and
Government Consumption. In the variable of government expenditure as a percentage of GDP,
it shows that there is significant (at 1 percent) negative relationship with the transparency. It
understood that rich in natural resources could lead to increase the government consumption,
this overspending might affect public sector negatively and trigger it to release less
information.

19
Next to Model 3, adding one more variable - Country’s Openness, this leads to a more
significant effect on natural resources (p-value is from 0.015 to 0.011) on transparency.
Moreover, the results in Model 3 are consistent with the prior models. Additionally, in these
three models, it cannot be seen that Executive Constraints contribute negatively to the
relationship between natural resource abundance and transparency. In other meaning, resource-
rich economies in ASEAN and OECD are less transparent, not necessarily there are issues in
the country's executive stability.
In the fourth and fifth models, I removed OECD countries, taking into account most of OECD
countries are transparent and resource-poor countries, may bias the results. Model 4 shows that
when the OECD countries removed from the sample, the coefficient of Primary Commodity
Exports falls from -0.007 to -0.001 and the relationship is not significant anymore. The first
analysis of this, it might be ASEAN countries have high tendency to not release their
information or data not necessarily because of the resource revenues, but the overspending of
government expenditure. Andersen and Aslaksen (2008) argued that the resource revenues less
impact resource-rich countries that have a parliamentary democratic system. Hypothetically,
overall effect resource abundance depends on the political institutions and constitution
arrangement that are rational and accountable (Robinson et al., 2006). Ross (1999) explained
the major oil exporters in ASEAN countries, except Myanmar, are (on average) democratic
and transparent, and they have respect to the rule of law with moderate to secure civil society.
The second consideration of this is not all ASEAN countries are not necessarily abundance in
fuels, ores, and minerals; which leads natural resource revenues in ASEAN to have an
insignificant relationship with transparency. ‘Point’ resources like oil fields in other countries
have high tendency to be dominated by elites as well as oligarchs in the country; it is different
in ASEAN whereas oil reserves are more spread over a large geographic area when it compared
to the other oil-rich nations (Sovacool, 2010). He elaborated that oil and gas fields in Indonesia
diffused across different parts of Indonesia, namely: Riau, Java Sea, East Kalimantan and the
western Pacific Ocean, which occupies more than 433,000 square km.
A third analysis of why Southeast Asia has successfully avoided ‘resource curse’. Mehlum et
al. (2006) answered this by describing the extraction of a resource is mostly under partnership
scheme, this will ensure the revenues distributed to different stakeholders. They gave examples
that foreign international firms can also play a role as buffers against export instability.

20
Also, the largest oil production in Indonesia is no longer by the state-owned firm (Pertamina),
yet it produced by the multinational firms like Chevron, ExxonMobil, Total and
ConocoPhillips. Indeed, as of early 2006, Mehlum et al. (2006) argued that more than ten
international companies and at least 70 subsidiaries have been operating in Brunei, Myanmar,
Thailand, Malaysia and Indonesia, this means that oil and gas industries are mostly under the
cooperation scheme rather than a competitive model. Nevertheless, the adjusted R-squared in
the Model 5 is the highest of all when OECD countries removed and Country’s Openness
added.
Moreover, we predict that there are a few factors that are influencing transparency. As
explained above, type of resources has important assumption when it comes to affecting
institutional quality negatively. In this thesis, I divide into two types, which are ‘point', and
‘diffuse' resources, which may cause transparency to obstruct.
To process the issue, which type of resource revenue that will have a negative effect on
institutional quality, four adjustment variables were analyzed in Model 6 and 7, replacing
Primary Commodity Exports. Countries may perform a positive income growth per capita
when we specify the independent variable of interest into four sections: Fuel, Ores and
Minerals, Agriculture, and Food. The Country’s Openness became positively significant to
transparency. However, the resources contributing to the lack of transparency are not two of
the ‘point’ resources, but only one of them, which is oil export. Additionally, Food export also
has a negative contribution regarding how government releases their information even though
the food was assumed to have a positive effect. Thus, for ASEAN and OECD countries
irrespective of the proposed type - ‘point' and ‘diffuse', the oil and food revenues may
contribute to hindering the Government Transparency.
Looking at these seven models, I can conclude that I do reject the second hypothesis regarding
transparency in ASEAN and OECD countries are not directly affected by the Primary
Commodity Exports, but more significantly causal impacted by the Government Consumption.
The paper’s results demonstrate the quality of the transparency in the resource-rich economies
within the international organizations, which are ASEAN and OECD that tend to be low. This
impact is mainly affected by the oil and food resources, which posed differently from the past
research that has been done by Williams (2011). The finding of Williams suggested

21
that the efficacy of transparency running in the economy, mainly caused by the ‘point'
resources, such as fuels, minerals, and ores. However, it is different from the prior research due
to the sample countries hired in this thesis are mostly diffused in ores and minerals exports yet
abundant in oil and food exports.
Comparatively, ASEAN and OECD members in the sample years (1990-2016) are more
abundant in food exports than the rest of the world. Therefore, although in other countries food
resources are treated to be ‘diffuse' resources in the past theories, by all accounts it is not the
case for ASEAN and OECD countries. One of the recent researches that could confirm this
result is Williams (2011), he found that food export has a negative significant (negative effects
on transparency) but is not significant.
Additionally, the second hypothesis assumes that the resource export revenues, which initially
believed that the high revenues earned from the primary exports might trigger the government
to release fewer data to the public, directly affect the lack of transparency. However, this thesis
found that the high government expenditure has a stronger negative effect on transparency in
ASEAN and OECD governments. Dissimilar to Williams (2011), he discovered that only
Primary Commodity Exports revenues have direct roles in the quality of the institutions.

22
Table 1: Transparency OLS Regression Results
Model 1
Model 2
Model 3
Model 4
High-income
OECD
countries
removed
Model 5
High-income
OECD
countries
removed
Model 6
Independent
variable:
alternative
resources
Model 7
Independent
variable:
alternative
resources
Constant
0.667***
[0.000]
0.797***
[0.000]
0.677***
[0.000]
0.304
[0.737]
0.555
[0.532]
0.479
[0.066]
0.159
[0.592]
Primary Commodity
Exports, t-1
-0.006**
[0.025]
-0.007**
[0.015]
-0.007**
[0.011]
-0.001
[0.936]
-0.003
[0.702]
Log of per capita
GDP, t-1
0.003
[0.897]
0.013
[0.596]
0.072
[0.561]
0.054
[0.652]
0.028
[0.277]
0.053*
[0.056]
Executive
Constraints, t-1
-0.048
[0.284]
-0.055
[0.221]
-0.005
[0.960]
-0.005
[0.956]
-0.020
[0.661]
-0.027
[0.549]
Gross Secondary
Enrolments, t-1
0.001
[0.216]
0.001
[0.231]
0.001
[0.366]
0.000
[0.926]
0.000
[0.364]
0.000
[0.432]
Government
Consumption (%
GDP), t-1
-0.011***
[0.000]
-0.011***
[0.000]
-0.020**
[0.012]
-0.023***
[0.006]
-0.012***
[0.000]
-0.013***
[0.000]
Country’s Openness,
t-1
0.001
[0.190]
0.001
[0.167]
0.001**
[0.030]
Fuel, t-1
-0.005***
[0.003]
-0.005***
[0.002]
Ores and Minerals, t-
1
-0.000
[0.843]
-0.001
[0.763]
Agriculture Raw
Materials, t-1
0.003
[0.297]
0.005
[0.117]
Food, t-1
-0.005*
[0.096]
-0.006***
[0.000]
R-Squared
0.392
0.454
0.460
0.767
0.806
0.475
0.489
Adjusted R-Squared
0.392
0.454
0.460
0.767
0.806
0.475
0.489
Observations
227 227 227 74 74 227 227
Notes: P-values are written in parentheses. The regression uses both time and country fixed effects.
*Significant at 10% level
**Significant at 5% level
***Significant at 1% level

23
5.2 Economic Growth Regression Analysis
As explained extensively in theoretical framework, subsequent step to analyze whether
ASEAN and OECD resource-rich countries are less transparent and whether this condition will
ultimately impact their stages of economic growth. Due to specific other factors, which
influence GDP growth, the core explanatory variables are provided in Table 2 regarding current
period as well as lagged by one period. The variables respectively are the log of GDP per
capita, Population Growth, Country’s Openness, Executive Constraints, Gross Secondary
Enrolments, Government Consumption, ‘point’ resources, ‘diffuse’ resources, Real Effective
Exchange Rates (REER), Institutional Quality and Government Transparency.
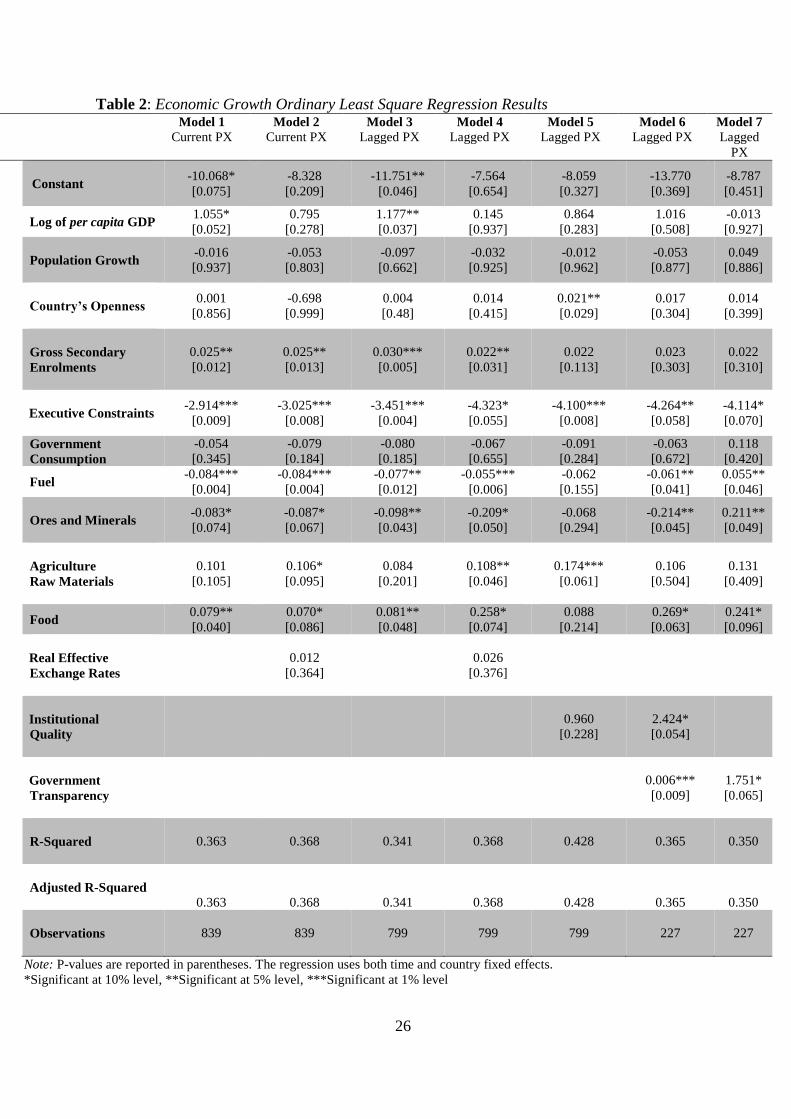
Table 2 showed the results when GDP Growth regressed with the natural logarithm of GDP
per capita and the other variables. The regression was run for seven models, starting with the
current model and then adding real exchange rate variable, continuing to the lagged values as
well as the institutional factors (transparency and quality of the institutions). Allegedly, in
Model 1, there is an effect of ‘resource curse’ when the current period used in the regression
analysis. The Executive Constraints and Fuel Exports have statistically significant (at 1
percent) relationship with countries’ GDP growth. In Model 2, I introduced the additional
variable named Real Effective Exchange Rates (REER), the adjustment eventuates in ‘diffuse’
resource that is agriculture export. In the previous model, the agriculture resource is not
significant with the economic growth yet when adding REER variable shifts the significant
positive relationship between this variable and GDP Growth, meaning that in an average
increase in agricultural export revenues will eventually support the economic growth in
ASEAN and OECD. The revenues of ‘diffuse' resources employed to support the rise of the
economic growth, unlike the ‘point' ones.
Furthermore, in Model 3, I took lag by one period of all variables, the coefficient of agriculture
and food resources remain positive and still statistically significant for food export revenues.
The p-value of oil increases unlike the p-value of Ores and Minerals resources decreases then
becomes significant at 5 percent level, which was only significant at 10 percent in previous
models. In other words, it shows that the curse in growth, caused by Ores and Minerals, more
significant to affect the economic growth negatively when one-period lagged taken into
account.
24
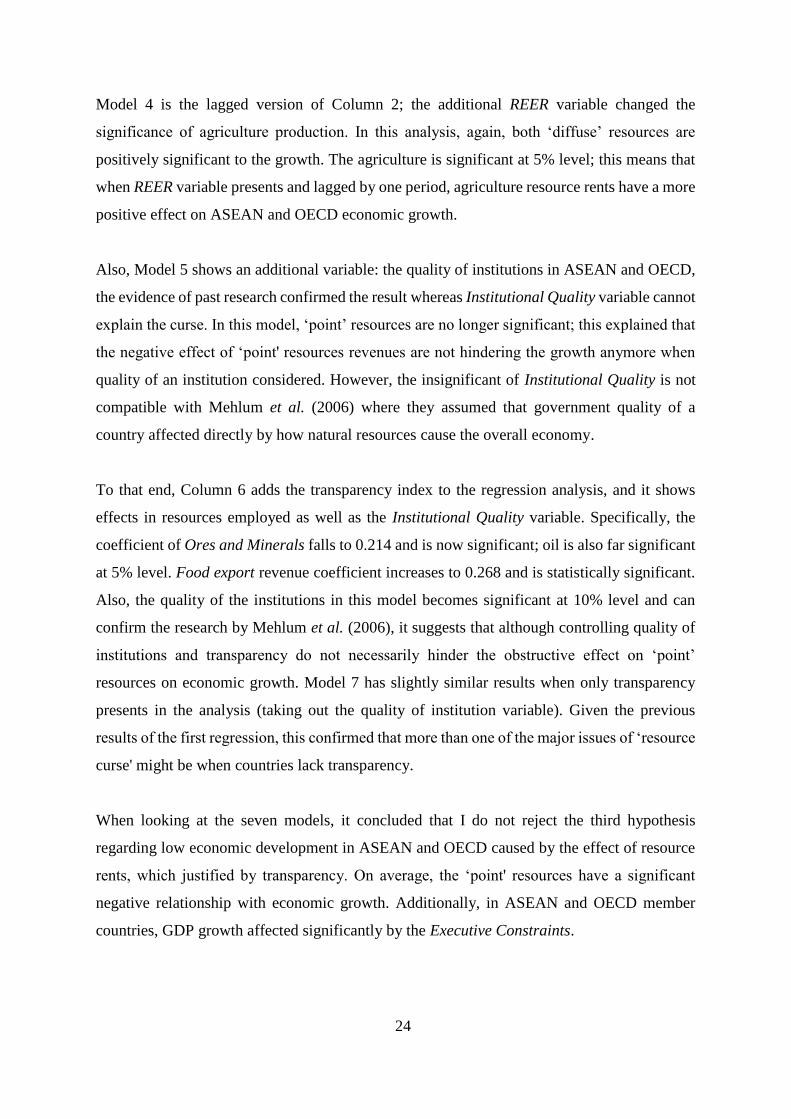
Model 4 is the lagged version of Column 2; the additional REER variable changed the
significance of agriculture production. In this analysis, again, both ‘diffuse’ resources are
positively significant to the growth. The agriculture is significant at 5% level; this means that
when REER variable presents and lagged by one period, agriculture resource rents have a more
positive effect on ASEAN and OECD economic growth.
Also, Model 5 shows an additional variable: the quality of institutions in ASEAN and OECD,
the evidence of past research confirmed the result whereas Institutional Quality variable cannot
explain the curse. In this model, ‘point’ resources are no longer significant; this explained that
the negative effect of ‘point' resources revenues are not hindering the growth anymore when
quality of an institution considered. However, the insignificant of Institutional Quality is not
compatible with Mehlum et al. (2006) where they assumed that government quality of a
country affected directly by how natural resources cause the overall economy.
To that end, Column 6 adds the transparency index to the regression analysis, and it shows
effects in resources employed as well as the Institutional Quality variable. Specifically, the
coefficient of Ores and Minerals falls to 0.214 and is now significant; oil is also far significant
at 5% level. Food export revenue coefficient increases to 0.268 and is statistically significant.
Also, the quality of the institutions in this model becomes significant at 10% level and can
confirm the research by Mehlum et al. (2006), it suggests that although controlling quality of
institutions and transparency do not necessarily hinder the obstructive effect on ‘point’
resources on economic growth. Model 7 has slightly similar results when only transparency
presents in the analysis (taking out the quality of institution variable). Given the previous
results of the first regression, this confirmed that more than one of the major issues of ‘resource
curse' might be when countries lack transparency.
When looking at the seven models, it concluded that I do not reject the third hypothesis
regarding low economic development in ASEAN and OECD caused by the effect of resource
rents, which justified by transparency. On average, the ‘point' resources have a significant
negative relationship with economic growth. Additionally, in ASEAN and OECD member
countries, GDP growth affected significantly by the Executive Constraints.

25
The second regression analysis argues that there is an obstructive impact from resource
revenues to transparency that is ultimately lowering the economic growth. After deploying
OLS regression, I found that natural resources do have a role in reducing the speed of growth
likewise the research performed by Williams (2011) found. Both ‘point’ resources are
responsible for the lower economic growth in the sample countries. Opposed with Williams
(2011), another variable has a stronger negative relationship with economic growth, which is
Executive Constraints. It indicates that in these 45 countries (Table B), limitations within the
decision-making power of the executives have a more significant adverse effect on their
economic prosperity.
26
Table 2: Economic Growth Ordinary Least Square Regression Results
Model 1
Current PX Model 2
Current PX
Model 3
Lagged PX
Model 4
Lagged PX Model 5
Lagged PX Model 6
Lagged PX
Model 7
Lagged
PX
Constant
-10.068*
[0.075]
-8.328
[0.209]
-11.751**
[0.046]
-7.564
[0.654]
-8.059
[0.327]
-13.770
[0.369]
-8.787
[0.451]
Log of per capita GDP 1.055*
[0.052]
0.795
[0.278]
1.177**
[0.037]
0.145
[0.937]
0.864
[0.283]
1.016
[0.508]
-0.013
[0.927]
Population Growth
-0.016
[0.937]
-0.053
[0.803]
-0.097
[0.662]
-0.032
[0.925]
-0.012
[0.962]
-0.053
[0.877]
0.049
[0.886]
Country’s Openness
0.001
[0.856]
-0.698
[0.999]
0.004
[0.48]
0.014
[0.415]
0.021**
[0.029]
0.017
[0.304]
0.014
[0.399]
Gross Secondary
Enrolments
0.025**
[0.012]
0.025**
[0.013]
0.030***
[0.005]
0.022**
[0.031]
0.022
[0.113]
0.023
[0.303]
0.022
[0.310]
Executive Constraints
-2.914***
[0.009]
-3.025***
[0.008]
-3.451***
[0.004]
-4.323*
[0.055]
-4.100***
[0.008]
-4.264**
[0.058]
-4.114*
[0.070]
Government
Consumption
-0.054
[0.345]
-0.079
[0.184]
-0.080
[0.185]
-0.067
[0.655]
-0.091
[0.284]
-0.063
[0.672]
0.118
[0.420]
Fuel -0.084***
[0.004]
-0.084***
[0.004]
-0.077**
[0.012]
-0.055***
[0.006]
-0.062
[0.155]
-0.061**
[0.041]
0.055**
[0.046]
Ores and Minerals
-0.083*
[0.074]
-0.087*
[0.067]
-0.098**
[0.043]
-0.209*
[0.050]
-0.068
[0.294]
-0.214**
[0.045]
0.211**
[0.049]
Agriculture
Raw Materials
0.101
[0.105]
0.106*
[0.095]
0.084
[0.201]
0.108**
[0.046]
0.174***
[0.061]
0.106
[0.504]
0.131
[0.409]
Food 0.079**
[0.040]
0.070*
[0.086]
0.081**
[0.048]
0.258*
[0.074]
0.088
[0.214]
0.269*
[0.063]
0.241*
[0.096]
Real Effective
Exchange Rates
0.012
[0.364]
0.026
[0.376]
Institutional
Quality
0.960
[0.228]
2.424*
[0.054]
Government
Transparency
0.006***
[0.009]
1.751*
[0.065]
R-Squared
0.363 0.368 0.341 0.368 0.428 0.365 0.350
Adjusted R-Squared
0.363
0.368
0.341
0.368
0.428
0.365
0.350
Observations
839 839 799 799 799 227 227
Note: P-values are reported in parentheses. The regression uses both time and country fixed effects.
*Significant at 10% level, **Significant at 5% level, ***Significant at 1% level

27
6. Policy Implications
The rejection of the second hypothesis implies that a decrease in government transparency is
not directly affected by the natural resource abundance. This evidence can show in the first
regression that enormous government expenditure could lead to a low release of information.
Considering this information, ASEAN and OECD members should take into account the
impact of government spending on the institutions. Therefore, it is worth to discuss the fiscal
policies in these countries, for it gives a positive effect on the governance. Primarily, after the
economic downturn, better fiscal policy will provide a boost to the stagnant growth that current
hits Southeast Asia and several OECD countries.
Parry (2008) noted that transparency could assess within the tight fiscal or budgeting position,
budgetary risks and the future steps of the government’s fiscal policy. Looking at Table D in
the appendix that 8 out of 10 ASEAN countries are ranked at the bottom, meaning that these
countries have very low government transparency. Durnev et al. (2008) agreed with the
previous evidence that fiscal issues have been taken seriously in developed economies, as
budgetary matters like corruption are mostly happening in developing countries as the product
of low transparency.
Additionally, failing to reject the third hypothesis further implies that there is a significant
dependency on natural resources and GDP growth. There is another factor that impacts
economic growth within a country, which constraints of power in executives. Cox and
Weingast (2015) found that increased executive restrictions significantly reduce the economic
turmoil when it comes to lowering a country's risk of getting stuck in poverty trap.
As for policy recommendations, members of ASEAN and OECD have to be aware that
government consumption might only effectively affect a partial weight of the national income,
meaning that while member countries are trying to improve economic agenda, e.g.,
infrastructure, they need to be aware that excessive fiscal stance would lead to poor
governance. On the other hand, although in most of ASEAN countries, Cox and Weingest
(2015) argued that it is more important to have a strong legislature constraining the executive
than to subject the power of the executive to fair elections to boost the economic growth.
However, this has an important policy implication as international community emphasizes the
importance of instituting elections. This thesis suggests that concerning the goal of fostering
economic development, creating political stability and increasing the growth will move a

28
country beyond its past violence or even better served by devising institutions that constrain
the executive scope. All in all, an appropriate recommendation to enhance the transparency,
which will eventually increase the chance of economic prosperity irrespective of whether the
natural resources are curse or blessing.
7. Conclusion
The natural resource abundance dynamics mainly debated whether it is a blessing or a curse;
this hypothesis assessed through the following research question:
To what extent does the natural resource abundance hinder the quality of government
transparency and the national economic growth?
Three hypothetical deductions have been statistically tested using macro data to help answer
the research question. It deduced when the first hypothesis is not rejected; there is a negative
impact on transparency when resource rents are high, particularly concerning fuel and food
exports revenues. However, when I took out OECD countries from the fraction, the ASEAN
level of transparency is not significantly affected by the natural resources. Moreover, rejecting
the second hypothesis leads us to government expenditure, which directly impacts the lack of
transparency in ASEAN and OECD countries.
The final hypothesis posed whether there is (at least partial weight) of negative effect from
natural resource abundance to economic growth. Once more, the natural resource does play a
role in economic growth. The analysis shows that ‘point' resources caused the lower speed of
the growth in a country when the transparency index was (also was not) involved in the
analysis, it indeed does not explain the ‘resource curse' entirely, nor it could explain the
accurate measurement for each country. Nonetheless, it also appears that executive constraint
is crucial for the weak growth in ASEAN and OECD member countries.
Coming into realization, the result of this paper suffers from several limitations. First, there is
no publicly available data for complete Government Transparency index and Institutional
Quality variable. The completeness of data resources may change the conclusion deduced from
the hypotheses tested, and therefore give different policy implications regarding the impact on
natural resource abundance to the transparency. Second, this paper only accounted for OECD
and ASEAN economics; this means that the effect of ‘resource curse’ captured by the

29
models is insufficient, given that other countries are more resource-dependent, which then
makes the results here do not explain the curse thoroughly.
Further researches that aim to examine similar paradox may as well gather a complete data set
to assure an accurate implication from the outcome of the analysis. More variables can also be
considered, such as the civil war involved in the period deployed in the study, it consists of the
resource-dependent condition may impact a domestic conflict whereas transparency in the
country caused. Finally, these two considerations might result in a more representative
conclusion.

30
Bibliography
AbuDalu, A., Ahmed, E. M., Almasaied, S. W., & Elgazoli, A. I. (2014). The Real Effective Exchange
Rate Impact on ASEAN-5 Economic Growth. Retrieved May 2017, from International Journal of
Economics & Management Sciences: https://www.omicsonline.org/open-access/the-real-effective-
exchange-rate-impact-on-asean-economic-growth-2162-6359.1000174.pdf
Acemoglu, D., & Robinson, J. A. (2000). Political Losers as Barriers to Economic Development.
Retrieved May 2017, from Massachusetts Institute of Technology:
https://economics.mit.edu/files/5686
Ades, A., & Di Tella, R. (1999). Rents, Competition and Corruption. Retrieved May 2017, from
Harvard University: https://projects.iq.harvard.edu/gov2126/files/aerentscorruption.pdf
Ahn, S., & Hemmings, P. (2000). Policy Influences on Economic Growth in OECD COuntries: An
Evaluation of the Evidence (Working Paper No. 246). Retrieved May 2017, from OECD Economics
Department: http://www.oecd-
ilibrary.org/docserver/download/581718238837.pdf?expires=1502039453&id=id&accname=guest&c
hecksum=5C6B025FFD2BEF9836ADA4573EAE22DF
Alemanno, A. (2013). Unpacking the Principle of Openness in EU Law: Transparency, Participation
and Democracy. Retrieved May 2017, from SSRN:
https://papers.ssrn.com/sol3/papers.cfm?abstract_id=2303644
Andersen, J. J., & Aslaksen, S. (2008). Constitutions and the Resource Curse. Retrieved May 2017,
from Science Direct: https://ac.els-cdn.com/S0304387807001058/1-s2.0-S0304387807001058-
main.pdf?_tid=6bee0561-9784-49cc-8860-
16881348a74b&acdnat=1528134259_5df2307f16ce023e7104aaec9e2e025e
ASEAN. (2002). 2002-2003 Annual Report of Asean. Retrieved May 2017, from
http://unpan1.un.org/intradoc/groups/public/documents/apcity/unpan011675.pdf
s
ASEAN. (2005). 2005-2006 Annual Report of Asean. Retrieved May 2017, from
http://www.asean.org/uploads/archive/ar06/FA%20AR%20ASEAN_1.pdf
Auty, R. M. (2001). The Political Economy of Resource-Driven Growth. Retrieved May 2017, from
Science Direct: https://www.sciencedirect.com/science/article/pii/S001429210100126X
Bassanini, A., & Scarpetta, S. (2001). Does Human Capital Matter for Growth in OECD Countries?
Evidence from PMG Estimates (Working Paper No. 282). Retrieved May 2017, from OECD
Economics Department: http://www.oecd-
ilibrary.org/docserver/download/424300244276.pdf?expires=1501943732&id=id&accname=guest&c
hecksum=0806C81E901E5B18861A056B646C60FB
Barro, R. J. (1997). Determinants of Economic Growth: A Cross-Country Empirical Study.
Cambridge, MA: MIT Press.
Bevan, D., Collier, P., & Gunning, J. W. (1999). The Political Economy of Poverty, Equity and
Growth. Oxford: Oxford University Press.
Becker, G. S., Glaeser, E. L., & Murphy, K. M. (1999). Population and Economic Growth. Retrieved
May 2017, from JSTOR:
https://www.jstor.org/stable/pdf/117096.pdf?refreqid=excelsior%3A329d79f562a2b77b5ed820bcea9
5df62

31
Bertot, J. C., Jaeger, P. T., & Grimes, J. M. (2010). Using ICTs to Create a Culture of Transparency:
E-government and Social Media as Openness and Anti-corruption Tools for Societies. Retrieved May
2017, from Science Direct:
https://www.sciencedirect.com/science/article/pii/S0740624X10000201?via%3Dihub
Boschini, A. D., Pettersson, J., & Roine, J. (2007). Resource Curse or Not: A Question of
Appropriability. Retrieved May 2017, from Wiley Online Library:
https://onlinelibrary.wiley.com/doi/epdf/10.1111/j.1467-9442.2007.00509.x
Christopoulos, D. K. (2004). Currency Devaluation and Output Growth: New Evidence from Panel
Data Analysis. Retrieved May 2017, from Taylor & Francis Online:
https://www.tandfonline.com/doi/abs/10.1080/1350485042000254647
Cox, G. W., & Weingast, B. R. (2015). Executive Constraint, Political Stability and Economic
Growth. Retrieved May 2017, from SSRN:
https://papers.ssrn.com/sol3/papers.cfm?abstract_id=2618059
Edwards, S. (1992). Trade Orientation, Distortions and Growth in Developing Countries. Retrieved
May 2017, from The National Bureau of Economic Research: http://www.nber.org/papers/w3716.pdf
Durney, A., Errunza, V., & Molchanov, A. (2008). Property Rights Protection, Corporate
Transparency and Growth. Retrieved May 2017, from Virginia University:
http://admin.darden.virginia.edu.
Fornell, C., & Larcker, D. F. (1981). Evaluating Structural Equation Models with Unobservable
Variables and Measurement Error. Retrieved May 2017, from JSTOR:
https://www.jstor.org/stable/pdf/3151312.pdf?refreqid=excelsior%3A147654b98f9a044e9536d7f634
b89f1c
Ganapati, S., & Reddick, C. G. (2012). Open E-government in US State Governments: Survey
Evidence from Chief Information Officers. Retrieved May 2017, from Elsevier:
https://www.sciencedirect.com/science/article/pii/S0740624X12000056
Isham, J., Pritchett, L., Woolcock, M., & Busby, G. (2005). The Varieties of Resource Experience:
Natural Resource Export Structures and the Political Economy of Economic Growth. Retrieved May
2017, from World Bank: https://elibrary.worldbank.org/doi/pdf/10.1093/wber/lhi010
Islam, R. (2006). Does More Transparency Go Along with Better Governance? Retrieved May 2017,
from Wiley Online Library: https://onlinelibrary.wiley.com/doi/epdf/10.1111/j.1468-
0343.2006.00166.x
Humpreys, M., Sachs, J. D., & Stiglitz, J. E. (2007). What is the Problem with Natural Resource
Wealth? New York: Columbia University Press.
Jiménez-Rodríguez, R., & Sánchez, M. (2005). Oil Price Shocks and Real GDP Growth: Empirical
Evidence for Some OECD Countries. Retrieved May 2017, from European Central Bank:
https://www.ecb.europa.eu/pub/pdf/scpwps/ecbwp362.pdf
Karl, T. L. (2005). Understanding the Resource Curse. New York: Open Society Institute.
Kenny, C. (2007). Infrastructure Governance and Corruption: Where Next. Washington, DC: The
World Bank Sustainable Development Network.
32
Kolstad, I., & Wiig, A. (2009). Is Transparency the Key to Reduce Corruption in Resource-rich
Countries? Retrieved May 2017, from Elsevier:
https://www.sciencedirect.com/science/article/pii/S0305750X08002246
Lane, P., & Tornell, A. (1996). Power, Growth and Voracity Effect. Retrieved May 2017, from
JSTOR:
https://www.jstor.org/stable/pdf/40215916.pdf?refreqid=excelsior%3A411c22d4eeefcff1a7888b7445
71bcb4
Lejárraga, I., & Shepherd, B. (2013). Quantitative Evidence on Transparency in Regional Trade
Agreements (OECD Trade Policy Paper No. 153). Retrieved May 2017, from OECD:
http://www.oecd-ilibrary.org/docserver/download/5k450q9v2mg5-
en.pdf?expires=1502040578&id=id&accname=guest&checksum=1013D99D41499BC16134705DBB
0435B1
Londregan, J. B., & Poole, K. T. (1996). Does High-income Promote Democracy? Retrieved May
2017, from JSTOR:
https://www.jstor.org/stable/pdf/25053987.pdf?refreqid=excelsior%3A7ab7d2b61a33041e1cae3dc03
a49a753
Nehru, V. (2012). Myanmar's Economic Policy Priorities. Washington, DC: Carnegie Endowment for
International Peace.
Macdonald, R. (2000). Concepts to Calculate Equilibrium Exchange Rates: An Overview (Discussion
Paper No. 3). Retrieved May 2017, from Deutsche Bundesbank Economic Research Department:
http://www.bundesbank.de/Redaktion/EN/Downloads/Publications/Discussion_Paper_1/2000/2000_0
7_03_dkp_03.pdf?__blob=publicationFile
Mehlum, H., Moene, K., & Torvik, R. (2006). Cursed by Resources or Institutions? Retrieved May
2017, from Wiley Online Library: https://onlinelibrary.wiley.com/doi/epdf/10.1111/j.1467-
9701.2006.00808.x
Osborne, J. W. (2002). Notes on the Use of Data Transformations. Practical Assessment, Research &
Evaluation.
Putra, J. S. (2011). Why is Facebook so Popular in Indonesia? Retrieved May 2017, from Tech in
Asia: https://www.techinasia.com/why-facebook-is-so-popular-in-indonesia
Pina, V., Torres, L., & Royo, S. (2010). Is E-government Leading to More Accountable and
Transparent Local Governments? An Overall View. Retrieved May 2017, from Wiley Online Library:
https://onlinelibrary.wiley.com/doi/epdf/10.1111/j.1468-0408.2009.00488.x
Sachs, J. D., & Warner, A. M. (1995). Natural Resource Abundance and Economic Growth (Working
Paper No. 5398). Retrieved May 2017, from National Bureau of Economic Research:
http://www.nber.org/papers/w5398.pdf
Sovacool, B. K. (2010). The Political Economy of Oil and Gas in Southeast Asia: Heading Towards
the Natural Resource Curse? Retrieved May 2017, from Taylor & Francis Online:
https://www.tandfonline.com/doi/pdf/10.1080/09512741003624484?needAccess=true
Robinson, J. A., Ragnar, T., & Thierry, V. (2006). The Political Foundations of the Resource Curse.
Retrieved May 2017, from Harvard University:
https://scholar.harvard.edu/files/jrobinson/files/jr_polfoundations.pdf

33
Rodrik, D. (2008). The Real Exchange Rate and Economic Growth. Retrieved May 2017, from
Brookings: https://www.brookings.edu/wp-content/uploads/2008/09/2008b_bpea_rodrik.pdf
Ross, M. L. (2001). Does Oil Hinder Democracy? Retrieved May 2017, from Harvard University:
https://scholar.harvard.edu/files/levitsky/files/ross_world_politics.pdf
Ross, M. L. (1999). The Political Economy of the Resource Curse. Retrieved May 2017, from
JSTOR:
https://www.jstor.org/stable/pdf/25054077.pdf?refreqid=excelsior%3A3288fde79d433858d594ba586
62ff71f
Rosser, A. (2006). The Political Economy of the Resource Curse: A Literature Survey (Working
Paper No. 268). Retrieved May 2017, from Centre for the Future State, Institute of Development
Studies: http://www2.ids.ac.uk/gdr/cfs/drc-pubs/summaries/summary%2021-Rosser-
ResourceCurse.pdf
Rotemberg, J. J., & Woodford, M. (1996). Imperfect Competition and the Effects of Energy Price
Increases on Economic Activity. Working Paper, NBER.
Tan, A. T. (2008). The Security of the ASEAN Energy Supply Chain. Seminar on Sustainable
Development and Energy Security. Institute of Southeast Asian Studies.
UNESCO. (2016). UNESCO Series on Internet Freedom: Privacy, Free Expansion and
Transparency. Retrieved May 2017, from UNESCO Publishing:
http://unesdoc.unesco.org/images/0024/002466/246610E.pdf
United Nations. (2016). UN E-government Survey Report: E-government in Support of Sustainable
Development. Retrieved May 2017, from
http://workspace.unpan.org/sites/Internet/Documents/UNPAN96407.pdf
Usui, N. (1997). Dutch Disease and Policy Adjustments to the Oil Boom: A Comparative Study of
Indonesia and Mexico. Retrieved May 2017, from Elsevier: https:
https://www.sciencedirect.com/science/article/pii/S0301420797000238
Williams, A. (2009). On the Release of Information by Governments: Causes and Consequences.
Retrieved May 2017, from Elsevier:
https://www.sciencedirect.com/science/article/pii/S0304387808000813
Williams, A. (2011). Shining a Light on the Resource Curse: An Empirical Analysis of the
Relationship Between Natural Resources, Transparency and Economic Growth. Retrieved May 2017,
from Elsevier: https://www.sciencedirect.com/science/article/pii/S0305750X10001828
World Bank. (2011). World Development Indicators. Washington: World Bank.
World Bank. (1994). Expanding the Measure of Wealth: Indicators of Environmentally Sustainable
Development. Monograph Series, Environmental Development Studies

34
Appendix
Appendix 1
Table A: Descriptive statistics
Variable Unit of
Measurement
No. of
Observation Mean
Standard
Deviation Min Max
Government
Transparency Index (0 to 1)
251 0.692 0.134 0.264 0.927
GDP Growth
Annual
percentage 839 3.287 3.459 -14.724 15.240
Primary Commodity
Exports
Proportion of
GDP 839 2.057 3.974 0.000 32.164
Log GDP per capita
Current US
Dollars 839 9.683 1.115 5.702 11.674
Executive Constraints Index (0 to 1) 839 0.477 0.132 0.016 0.778
Gross Secondary
Enrolments
Ratio
percentage 839 99.611 20.700 17.231 164.812
Government
Consumption
Proportion of
GDP 839 17.225 5.176 4.484 29.996
Country’s Openness
Proportion of
GDP 839 90.382 55.916 19.736 439.657
Fuel
Percentage of
merchandise
exports 839 1.079 1.541 -3.424 4.476
Ores and Minerals
Percentage of
merchandise
exports 839 9.226 15.133 0.000 99.340
Agricultural Raw
Materials
Percentage of
merchandise
exports 839 3.283 3.880 0.002 29.849
Food
Percentage of
merchandise
exports 839 11.345 9.634 0.000 60.963
Population Growth
Annual
percentage 839 0.815 0.805 -1.475 5.322
Real Effective Exchange
Rates Real value
839
98.810 16.431 204.083 37.305
Institutional Quality
Index (-2.5 to
2.5) 578 1.210 0.683 -0.956 2.431

35
Table B: List of countries used in “core” regressions (45) Australia Estonia Israel Myanmar* Slovenia
Austria Finland Italy Netherlands Spain
Belgium
Brunei Darussalam*
France
Germany
Japan
South Korea
New Zealand
Norway
Sweden
Switzerland
Cambodia*
Canada
Greece
Hungary
Laos*
Latvia
Philippines*
Poland
Thailand*
Turkey
Chile Iceland Luxembourg Portugal United Kingdoms
Czech Republic Indonesia* Malaysia* Singapore* United States
Denmark Ireland Mexico Slovak Republic Vietnam*
*Association of Southeast Asian Nations (ASEAN) Countries
Appendix 2
Table C: Average value of ‘point’ resources (percentage of GDP) in 1990-2015
Rank Country Oil, Ores and Minerals
Resources Revenues
1 Norway 63,40
2 Brunei Darussalam 56,50
3 Chile 50,95
4 Austria 45,57
5 Ireland 33,19
6 Canada 23,19
7 Iceland 22,84
8 Greece 22,25
9 Mexico 15,73
10 Malaysia 14,17
11 Singapore 13,33
12 Vietnam 12,32
13 United States 11,43
14 Poland 11,09
15 Netherlands 10,60
16 Estonia 9,37
17 Belgium 8,84

36
18 Finland 8,58
19 Sweden 7,57
20 New Zealand 7,29
21 Denmark 7,06
22 United Kingdom 6,89
23 Slovak Republic 6,75
24 Spain 6,39
25 Slovenia 5,90
26 Latvia 5,82
27 Portugal 5,80
28 Philippines 5,80
29 Turkey 5,67
30 France 5,23
31 Australia 5,20
32 Czech Republic 4,76
33 Switzerland 4,51
34 Hungary 4,48
35 Germany 4,21
36 Thailand 4,07
37 Israel 4,01
38 Luxembourg 3,75
39 Korea, Rep. 2,67
40 Italy 1,76
41 Myanmar 1,59
42 Indonesia 1,30
43 Cambodia 0,18
44 Japan -
45 Lao PDR -
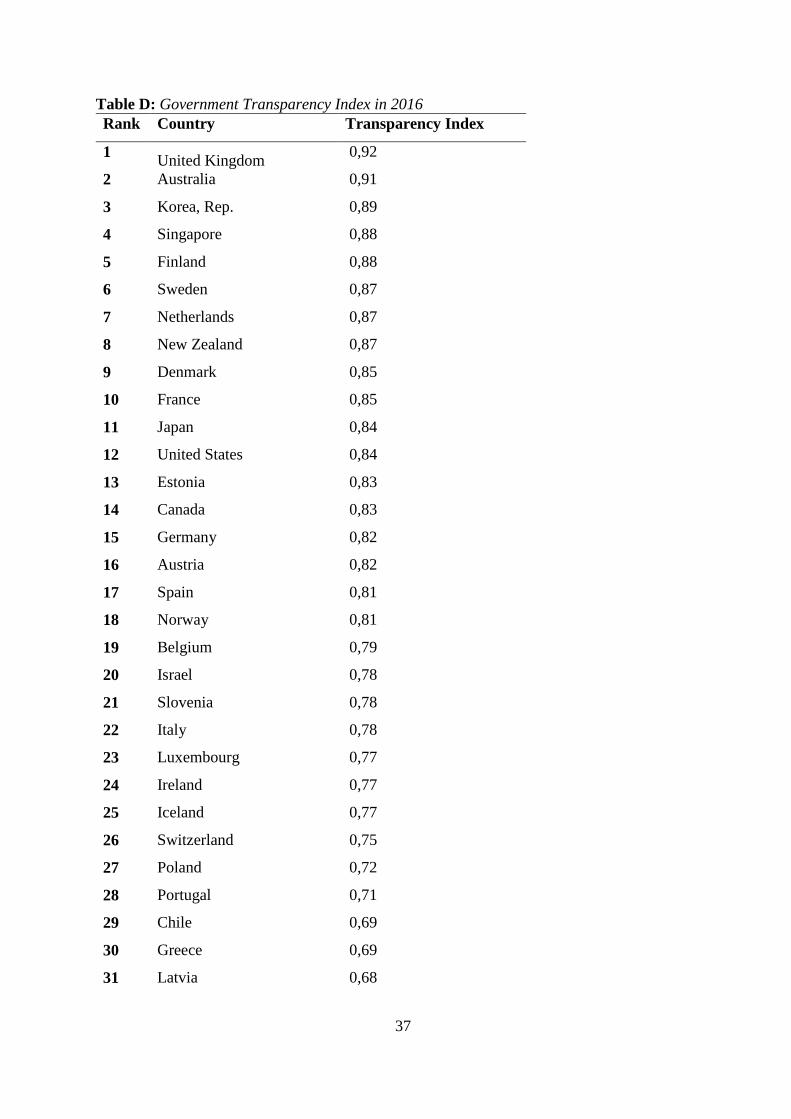
37
Table D: Government Transparency Index in 2016
Rank Country Transparency Index
1 United Kingdom
0,92
2 Australia 0,91
3 Korea, Rep. 0,89
4 Singapore 0,88
5 Finland 0,88
6 Sweden 0,87
7 Netherlands 0,87
8 New Zealand 0,87
9 Denmark 0,85
10 France 0,85
11 Japan 0,84
12 United States 0,84
13 Estonia 0,83
14 Canada 0,83
15 Germany 0,82
16 Austria 0,82
17 Spain 0,81
18 Norway 0,81
19 Belgium 0,79
20 Israel 0,78
21 Slovenia 0,78
22 Italy 0,78
23 Luxembourg 0,77
24 Ireland 0,77
25 Iceland 0,77
26 Switzerland 0,75
27 Poland 0,72
28 Portugal 0,71
29 Chile 0,69
30 Greece 0,69
31 Latvia 0,68

38
32 Hungary 0,67
33 Czech Republic 0,65
34 Mexico 0,62
35 Malaysia 0,62
36 Slovak Republic 0,59
37 Turkey 0,59
38 Philippines 0,58
39 Thailand 0,55
40 Brunei Darussalam 0,53
41 Vietnam 0,51
42 Indonesia 0,45
43 Lao PDR 0,31
44 Cambodia 0,26
45 Myanmar 0,24
Table E: Average value of GDP growth (percentage) in 1990-2016
Rank Country GDP Growth
1 Israel
8,57
2 Latvia 6,64
3 Australia 6,54
4 Sweden 6,25
5 France 5,96
6 Japan 5,72
7 United States 5,40
8 Czech Republic 5,23
9 Luxembourg 4,99
10 Mexico 4,74
11 Spain 4,68
12 Cambodia 4,33
13 Myanmar 4,32
14 Greece 4,05
15 Brunei Darussalam 4,03
16 Korea, Rep. 3,79

39
17 Estonia 3,48
18 Hungary 3,42
19 Lao PDR 3,15
20 Slovak Republic 3,12
21 United Kingdom 2,98
22 Italy 2,73
23 Indonesia 2,62
24 Vietnam 2,52
25 Austria 2,35
26 Iceland 2,32
27 Ireland 2,01
28 Chile 2,01
29 Denmark 1,97
30 Turkey 1,89
31 Finland 1,89
32 Belgium 1,88
33 Thailand 1,73
34 Slovenia 1,72
35 New Zealand 1,70
36 Philippines 1,57
37 Canada 1,56
38 Singapore 1,56
39 Portugal 1,55
40 Poland 1,52
41 Switzerland 1,38
42 Germany 1,33
43 Netherlands 1,14
44 Norway 0,86
45 Malaysia 0,69