Erasmus University - EUR
56
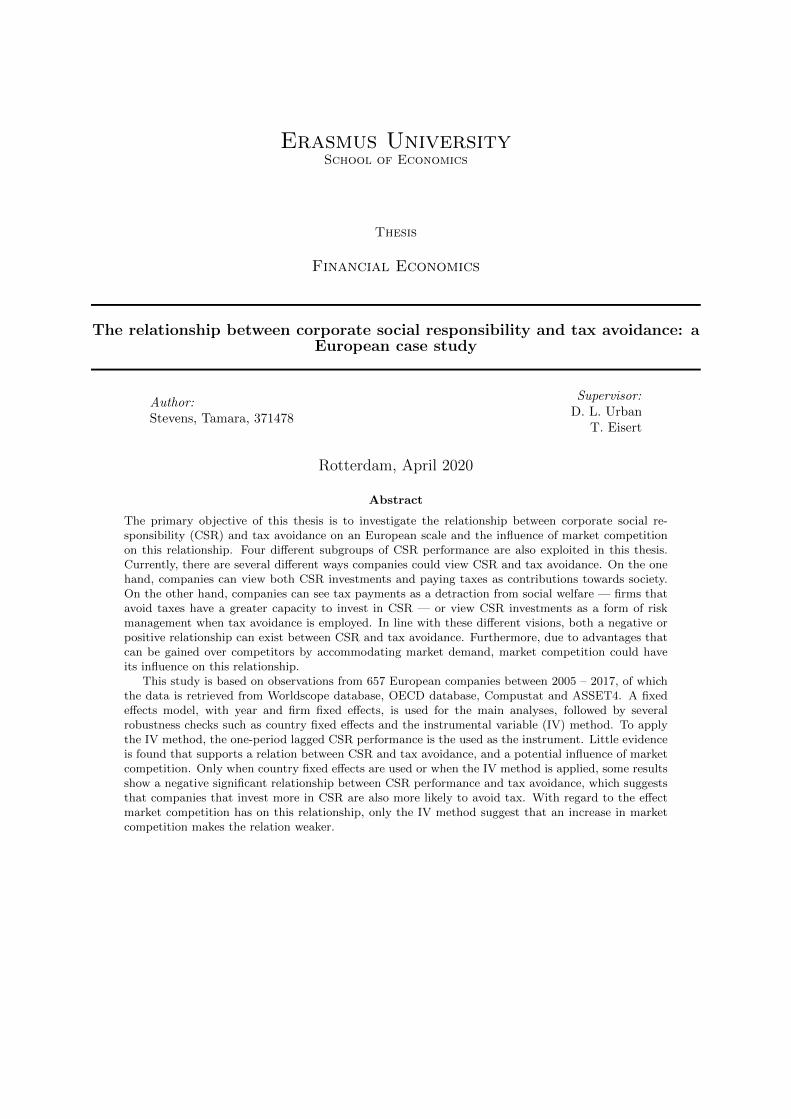
Erasmus University School of Economics Thesis Financial Economics The relationship between corporate social responsibility and tax avoidance: a European case study Author: Stevens, Tamara, 371478 Supervisor: D. L. Urban T. Eisert Rotterdam, April 2020 Abstract The primary objective of this thesis is to investigate the relationship between corporate social re- sponsibility (CSR) and tax avoidance on an European scale and the influence of market competition on this relationship. Four different subgroups of CSR performance are also exploited in this thesis. Currently, there are several different ways companies could view CSR and tax avoidance. On the one hand, companies can view both CSR investments and paying taxes as contributions towards society. On the other hand, companies can see tax payments as a detraction from social welfare — firms that avoid taxes have a greater capacity to invest in CSR — or view CSR investments as a form of risk management when tax avoidance is employed. In line with these different visions, both a negative or positive relationship can exist between CSR and tax avoidance. Furthermore, due to advantages that can be gained over competitors by accommodating market demand, market competition could have its influence on this relationship. This study is based on observations from 657 European companies between 2005 – 2017, of which the data is retrieved from Worldscope database, OECD database, Compustat and ASSET4. A fixed effects model, with year and firm fixed effects, is used for the main analyses, followed by several robustness checks such as country fixed effects and the instrumental variable (IV) method. To apply the IV method, the one-period lagged CSR performance is the used as the instrument. Little evidence is found that supports a relation between CSR and tax avoidance, and a potential influence of market competition. Only when country fixed effects are used or when the IV method is applied, some results show a negative significant relationship between CSR performance and tax avoidance, which suggests that companies that invest more in CSR are also more likely to avoid tax. With regard to the effect market competition has on this relationship, only the IV method suggest that an increase in market competition makes the relation weaker.
Transcript of Erasmus University - EUR
Erasmus UniversitySchool of Economics
Thesis
Financial Economics
The relationship between corporate social responsibility and tax avoidance: aEuropean case study
Author:Stevens, Tamara, 371478
Supervisor:D. L. Urban
T. Eisert
Rotterdam, April 2020
Abstract
The primary objective of this thesis is to investigate the relationship between corporate social re-sponsibility (CSR) and tax avoidance on an European scale and the influence of market competitionon this relationship. Four different subgroups of CSR performance are also exploited in this thesis.Currently, there are several different ways companies could view CSR and tax avoidance. On the onehand, companies can view both CSR investments and paying taxes as contributions towards society.On the other hand, companies can see tax payments as a detraction from social welfare — firms thatavoid taxes have a greater capacity to invest in CSR — or view CSR investments as a form of riskmanagement when tax avoidance is employed. In line with these different visions, both a negative orpositive relationship can exist between CSR and tax avoidance. Furthermore, due to advantages thatcan be gained over competitors by accommodating market demand, market competition could haveits influence on this relationship.
This study is based on observations from 657 European companies between 2005 – 2017, of whichthe data is retrieved from Worldscope database, OECD database, Compustat and ASSET4. A fixedeffects model, with year and firm fixed effects, is used for the main analyses, followed by severalrobustness checks such as country fixed effects and the instrumental variable (IV) method. To applythe IV method, the one-period lagged CSR performance is the used as the instrument. Little evidenceis found that supports a relation between CSR and tax avoidance, and a potential influence of marketcompetition. Only when country fixed effects are used or when the IV method is applied, some resultsshow a negative significant relationship between CSR performance and tax avoidance, which suggeststhat companies that invest more in CSR are also more likely to avoid tax. With regard to the effectmarket competition has on this relationship, only the IV method suggest that an increase in marketcompetition makes the relation weaker.

Stevens (2020)
Foreword
Before you lies the final product of my master thesis for the master Economics and Business, with a
specialism on Financial Economics. One year ago, I had to choose a subject for my thesis. Since taxation
has been an interest of mine throughout the years and plays a significant role in finance as well, I wanted
to let this topic come back in this thesis. Corporate social responsibility (CSR), on the other hand, was
some what new for me. On both topics, society has a pretty strong opinion, on the latter more positive
than on the former. Reading the newspapers, it seems that companies that avoid taxation obviously do
not care about the society and companies that invest in CSR clearly do. Although most situations are not
as clear-cut as that, following this line of reasoning, both the topics may say something about a company’s
ethical standard. Furthermore, if companies invest in CSR and thus are ethical, you would expect that
they do not avoid tax, or the other way around. The strong opinion of society triggered me in wanting to
find out more about the relationship between CSR and tax avoidance, as most of the company’s decisions
take more into consideration than just the ethical side of the story. Also I wanted to see what the influence
of market competition was on this relationship. Since society has such a strong opinion about both topics,
it could influence the relationship in markets in which consumers have a higher demanding power.
I could not have written this thesis without the support of a lot of family and friends. However, there
are a few I would like to thank in specific. First of all, my supervisor, Daniel Urban, thank you for letting
me write the thesis in complete independence, while providing guidance whenever I needed. Secondly,
Carolien and Jonathan, thank you for offering a sympathetic ear and sharing all the writing tips. Fur-
thermore, the many discussions I had with the both of you were very helpful. Thirdly, a big thanks to my
parents and brother who have been my biggest cheerleaders throughout my whole study and student life.
Due to their support I was not only able to finish two masters, but also to develop myself on a personal level.
I hope you enjoy your reading.
Tamara Stevens
Rotterdam, April 09, 2020
1

Stevens (2020)
Contents
1 Introduction 3
2 Literature review 5
2.1 Corporate social responsibility . . . . . . . . . . . . . . . . . . . . . . . . . . . . . . . . . . 5
2.2 Tax avoidance . . . . . . . . . . . . . . . . . . . . . . . . . . . . . . . . . . . . . . . . . . . . 6
2.3 Corporate social responsibility and tax avoidance . . . . . . . . . . . . . . . . . . . . . . . . 7
2.4 Competition . . . . . . . . . . . . . . . . . . . . . . . . . . . . . . . . . . . . . . . . . . . . . 12
2.5 Corporate social responsibility, tax avoidance and competition . . . . . . . . . . . . . . . . 13
3 Research design 14
3.1 Sample description . . . . . . . . . . . . . . . . . . . . . . . . . . . . . . . . . . . . . . . . . 14
3.2 Dependent variable . . . . . . . . . . . . . . . . . . . . . . . . . . . . . . . . . . . . . . . . . 15
3.3 Independent variable . . . . . . . . . . . . . . . . . . . . . . . . . . . . . . . . . . . . . . . . 17
3.4 Multiple regression model . . . . . . . . . . . . . . . . . . . . . . . . . . . . . . . . . . . . . 19
4 Results 21
4.1 Descriptive statistics . . . . . . . . . . . . . . . . . . . . . . . . . . . . . . . . . . . . . . . . 21
4.2 Correlation results . . . . . . . . . . . . . . . . . . . . . . . . . . . . . . . . . . . . . . . . . 22
4.3 Regression results . . . . . . . . . . . . . . . . . . . . . . . . . . . . . . . . . . . . . . . . . . 24
4.4 Robustness check . . . . . . . . . . . . . . . . . . . . . . . . . . . . . . . . . . . . . . . . . . 27
5 Conclusion 40
5.1 Conclusion and discussion . . . . . . . . . . . . . . . . . . . . . . . . . . . . . . . . . . . . . 40
5.2 Limitations and future research . . . . . . . . . . . . . . . . . . . . . . . . . . . . . . . . . . 41
6 References 43
7 Appendix 50
2

Stevens (2020)
1 Introduction
In the recent years, society is demanding companies to act in an ethical considering way, for example by
putting pressure on their corporate social responsibility (CSR) and their tax avoidance practices. The effect
of this pressure on CSR can be seen in several initiatives undertaken by companies. Bosch, for example,
invests half of its research and development budget in supporting universities and research programs that
focus on environment, energy and mobility. Moreover, Spotify offers more benefits to employees and
families, such as a longer period of parental leave. Furthermore, Unilever’s Ben & Jerry’s committed to
their shareholders that 7.5% of the pre-tax profits will be used for philanthropic work and TOMS donates
over 60 million pairs of shoes to children in need. Contrary, the effect of demanding companies to pay their
fair share of taxes is more difficult to see. However, through ‘tax shaming’ and use of the justice system
it is shown that tax-avoidance behaviour is no longer accepted. Starbucks, for example, had to deal with
consumer boycotts in the United Kingdom after reporting zero corporate tax payments (Graham et al.,
2014). Furthermore, several multinationals, such as Ikea, Fiat and Apple, are facing cases in court due to
their tax structures.
Due to the increasing amount of attention for CSR and tax avoidance, these two phenomena flourish
as study fields. Both phenomena are investigated on several research topics including the performance
of the company (Scholtens, 2008; Desai & Dharmapala, 2005), management decisions (Windsor, 2009;
Desai & Dharmapala, 2006; Armstrong et al., 2015; Dyreng et al., 2010) and the effects on reputation
(Minor & Morgan, 2011; Godfrey et al., 2009; Dyreng et al., 2016; Austin & Wilson, 2017; Hardeck &
Hertl, 2014). For CSR, studies show that making the decision to invest in CSR mostly follows good
financial results. However, a conflict is created for management when such a decision has to be made,
since they have to choose between short-term and long-term results. Furthermore, CSR investments can
be used as a reputation protection. For tax avoidance, studies show that characteristics of managers and
their compensation can affect the firm’s tax-avoidance practices. Moreover, when management does not
make the decision out of self-interest, avoiding tax could increase the firm value. When the tax-avoidance
behaviour of a company becomes public knowledge, it negatively affects the reputation.
So far CSR and tax avoidance have mostly been separate research topics. Besides for a few studies such
as Lanis & Richardson (2012), Huseynov & Klamm (2012), Hoi et al. (2013), Lanis & Richardson (2015)
and Watson (2015), the relationship between CSR and tax avoidance has not yet been researched in great
detail. CSR, with its corporate governance, social and environmental dimensions, reflects a substantial
number of stakeholders. Tax avoidance of companies, as tax being a big part of governmental income,
affects a lot of stakeholders. Since both are linked to stakeholders, further examination of the relationship
between CSR and tax avoidance is interesting, since the outcome of the study could potentially provide
more background on the reasoning behind employing CSR investments or tax avoidance. The extent to
which companies choose to engage in CSR and tax avoidance likely indicates in what manner engaging
in one activity affects the costs and benefits of the other (Davis et al., 2015). When a negative relation
between CSR and tax avoidance is found, companies likely view both CSR investments and paying taxes
as contributions towards society. Contrary, when a positive relation exists, paying taxes is likely seen as
a distraction from social welfare — firms that avoid taxes have a greater capacity to invest in CSR —
or CSR investments might be used for risk management purposes. Studies investigating the relationship
3

Stevens (2020)
between CSR and tax avoidance mostly find that companies with higher CSR performance are less likely
to avoid tax (Lanis & Richardson, 2012; Huseynov & Klamm, 2012; Hoi et al., 2013; Lanis & Richardson,
2015; Watson, 2015). So far most of the studies are conducted on US data. In Europe, CSR and tax
avoidance are also important topics. This can be seen in the substantial amount of negative attention for
the Volkswagen scandals and effort of the European commission to take down tax structures of for example
Ikea. Therefore, in this thesis the relationship between the overall CSR performance and tax avoidance
will be examined based on European companies. Currently, studies concentrate on the three dimensions of
CSR — corporate governance, society and environment — however, additionally four different subgroups
of these dimensions — management performance, shareholder performance, strategy performance and
community performance — will be exploited further in this thesis.
A factor that could affect the relationship between CSR and tax avoidance is market competition.
Market competition can force management to make tactical decisions in line with a certain competitive
strategy, and therefore have effect on the relationship between CSR and tax avoidance. It is apparent
that this has not yet been researched. Therefore, the effect of competition on this relationship will also be
examined in this thesis.
A number of contributions are made in this thesis. First of all, a contribution to science is made as there
is almost no research on the relationship between CSR and tax avoidance at an European scale. Moreover,
it is apparent that, the relationship between the subgroups of CSR and tax avoidance, and the effect of
competition on the relationship between the overall CSR and tax avoidance has not been examined at
all. Secondly, this study will provide managers with insights on CSR and tax avoidance in certain market
environments. Managers could incorporate this knowledge in their decision making. Thirdly, this study
is relevant for stakeholders and policy makers, since CSR and tax avoidance are phenomena that have a
high social value. Stakeholders benefit from companies that have a high CSR and/or do not avoid tax.
Moreover, this study could give more insight on the relationship of CSR and tax avoidance and the effect
of competition, which could be used for regulation purposes, for example, in order to reduce tax avoidance.
This thesis uses a fixed effects model at the firm and year level to capture the relation between (the
subgroups of) CSR and tax avoidance. To assess the effect of competition on the relationship, an inter-
action term between CSR performance and competition is added to the model. The data needed for the
performances concerning CSR is retrieved from the ASSET4 database (owned by Thompson Reuters),
which gives the (overall) CSR performance and divides the CSR performance into multiple subgroups.
The Worldscope database and OECD database are used to calculate three different proxies to capture a
company’s tax avoidance: effective tax rate, long-term effective tax rate and the book-tax difference. The
effective tax rate is defined as the total tax expense divided by the pre-tax book income. The long-term
effective tax rate is defined as the five-year average total tax expense divided by the five-year average total
pre-tax book income. The book-tax difference measure is defined as the difference between the pre-tax
book income and the taxable income. Furthermore, to capture the market competition the Herfindahl-
Hirschman Index (HHI) will be calculated, using data retrieved from the Worldscope database.
Contrary to earlier studies, no significant effects were found between the CSR performance and tax
avoidance using the firm and year fixed effects. The insignificance is presumably a result of existing
4

Stevens (2020)
endogeneity in the model. The model, with firm and year fixed effects, might not have captured all the
omitted variable bias. Upon further investigation into the robustness of the results, a negatively significant
relationship is shown between CSR performance and the effective tax rates when the firm fixed effects are
replaced by country fixed effects or when the instrumental variable (IV) method is applied (using the one-
period lagged CSR performance as an instrument). Surprisingly, the relation between the management
performance and tax avoidance is significant throughout the main analysis (using firm and year fixed ef-
fects). This was supported by a robustness check, an IV method using the one-period lagged management
performance as an instrument. The other subgroups of CSR performance — shareholder performance,
the strategy performance, and the community performance — show no significant results in the main
analysis (using firm and year fixed effects). Furthermore, in the main analysis market competition has an
insignificant effect on the relationship between CSR and tax avoidance. However, when the IV method
is applied as a robustness check, a positive significant result is shown suggesting that market competition
makes the relation weaker.
The remainder of this thesis is structured as follows: the next section provides an overview of related
literature on CSR, tax avoidance, competition, and combinations of these concepts. Section 3 elaborates
on the data and the methodology, after which, in section 4, the results and robustness tests, such as the
country fixed effects and the IV method, will be presented. Section 5 concludes and discusses the findings,
implications, limitations and possible future research.
2 Literature review
2.1 Corporate social responsibility
Given the wider societal context of today (Damgaard et al., 2003; Porter & Kramer, 2006; Avi-Yonah,
2008), non-financial performance, such as CSR, is widely considered along with financial performance
as an essential quality of successful companies (Avi-Yonah, 2008). This is supported by the idea that
ordinary companies intrinsically offer nothing of value to the society (Barrett, 2009). While philanthropic
values may be a reason for companies to care about their CSR performance, investing in CSR can also
be a part of the corporate strategy. CSR investments for instance can be used as management tool to
strengthen the organizations’ performance through the creation of a better image in the stakeholder’s mind
by showing their responsible behaviour towards society. (Barnett & Salomon, 2006; Orlitzky et al., 2003).
The positive influence of CSR as a management tool can be seen in the impact of CSR investments on
brand evaluations, choice recommendations, customer satisfaction and loyalty (Sen & Bhattacharya, 2001;
Luo & Bhattacharya, 2006; Werther Jr & Chandler, 2005). A study conducted by Sen & Bhattacharya
(2001) suggest that consumers evaluate the company favourable when they are supporting CSR activities,
this effect is even stronger when the CSR activity is relevant to the company’s already existing product.
Luo & Bhattacharya (2006) show that CSR investments positively affects consumer satisfaction. Research
by Werther Jr & Chandler (2005) found that CSR can be used as a brand insurance, due to its direct
positive effect on brand loyalty. Whether CSR also has a direct effect on the financial performance of a
5

Stevens (2020)
company is still a debate amongst researchers (Lu et al., 2014), as mixed results on the relationship are
found (Reverte et al., 2016; Huatuco et al., 2013; Barnett & Salomon, 2012). CSR can, however, be used
to reduce a negative reaction of the market on the stock price in face of a negative events (Godfrey et al.,
2009); CSR can function as an insurance to limit value loss.
Although CSR has evolved for many years (Carroll, 1979), and several empirical and case studies
have examined various factors relating to the CSR performance of companies, there has been no research
consensus on the definition of CSR. In 1991, Carroll et al. (1991) developed the well-known pyramid
of corporate social responsibility, asserting that companies not only have economic and legal obligations
towards society, but also ethical and discretionary responsibilities (Carroll et al., 1991). In the more
recent research, environment and governance responsibility have been - next to the social responsibility —
included in the CSR definition. Van Marrewijk (2003), for example, refers to CSR as “activities, voluntary
by definition, demonstrating the inclusion of social and environmental concerns in business operations and
in interactions with stakeholders”. Dahlsrud (2008) summarizes all the different CSR definitions used and
concludes that basically all the papers refer to one or more of the so-called CSR dimensions – voluntariness,
stakeholder, social, environmental, and economic. Given these different definitions and dimensions, the
overall CSR performance is defined broadly in this thesis as a company’s performance regarding three
dimensions namely the corporate governance, society and the environment.
It should be acknowledged that specific regulation on CSR investments has — in Europe — not yet
occurred, meaning that companies need other motives to consider CSR a valuable investment (Avi-Yonah,
2008). No distinction will be made, however, between CSR conducted by a company for altruistic or
selfish motives (Lanis & Richardson, 2015), since many companies act with both motives in mind (Lanis
& Richardson, 2012).
2.2 Tax avoidance
Corporate income taxes, the direct taxes paid on income by corporate entities, often have a large impact on
decisions made by managers (Princen, 2012). Managers take extensive actions, such as reallocation of the
company headquarters (Voget, 2011), to reduce the corporate taxes that must be paid (Graham, 2013).1
Reduction of the taxes paid can be done either by avoidance or by evasion. Tax avoidance is a practise
that uses disruptions and loopholes in the tax systems to lower taxation costs.2 Tax evasion, on the other
hand, is mostly established by purposely misrepresenting or hiding financial information from the tax
authorities, such as a lower taxable income or higher deprecation, causing lower tax payments. Although
tax avoidance is legal and evasion is not (OECD, 2019), much negative attention recently has been drawn
to companies that participate in tax avoidance,3 mainly due to economic crisis of 2008 during which this
tax-avoiding behaviour of multinationals became more public known (Pegg, 2017; Bender, 2017). Making
the idea that everyone, including companies, must pay their fair share of taxes, to become more broadly
carried.
1 See also corporate decisions made by companies such as Google, Fiat, Ikea, Apple and the use of the Double Irish DutchSandwich.
2 However, when taxpayers try to find loopholes with the intentions to pay less tax, even if technically legal, their actionsmay be against the spirit of the law and in this sense considered noncompliant (James et al., 2001).
3 This attention is not only created by media but also by the European Commission by for example releasing a listwith companies that avoid taxation (European Parliament, 2015) or by challenging multinationals in court about theirbehaviour.
6

Stevens (2020)
Assuming that there is a tight relationship between the state and the society, the fair share thought
can be extended further to state that the payment of corporate tax can be considered as a payment to
the community (Lanis & Richardson, 2015). The payment of corporate taxes has community and societal
implications because it is partly financing the provision of public goods in society (Prichard et al., 2015).
Implying that if companies do not pay taxes, the government is losing revenue and needs to cut expenses
(Lanis & Richardson, 2015). For this reason, payments of corporate taxes by a company could have a
relationship with their CSR performance.
Following Hanlon & Heitzman (2010) and Dyreng et al. (2010), tax avoidance is defined broadly as
a reduction of corporate income taxes. Meaning that, there is no distinction made between reductions
accomplished legally (avoidance) or illegally (evasion). In this thesis, tax avoidance is represented by three
different proxies: effective tax rate (ETR), long-term effective tax rate (LETR), and book-tax difference
(BTD). The ETR is the total tax expense divided by total pre-tax book income (Hanlon & Heitzman,
2010; Guenther, 2014; Dyreng et al., 2010). The LETR is the five-year average total tax expense divided
by the five-year average total pre-tax book income based on the idea of Dyreng et al. (2010) and Davis et
al. (2015). Companies that avoid taxes by reducing their tax expenses, while maintaining the same total
pre-tax book income, should have lower ETR’s and LETR’s. Overall, a lower ETR or LETR would suggest
more tax avoidance. The BTD is the difference between the reported pre-tax book income to shareholders
and the reported taxable income to the tax authorities (Manzon Jr & Plesko, 2001; Desai & Dharmapala,
2006). Companies that avoid taxes would have a lower taxable income, while maintaining their pre-tax
book income. This implies that a higher book-tax difference would suggest more tax avoidance. These
proxies are further explained and discussed in Section 3.
2.3 Corporate social responsibility and tax avoidance
Existing theories and empirical evidence have suggested different views and found mixed results on the
relationship, negative or positive, between a company’s CSR performance and tax avoidance. A negative
relationship, which will be discussed first, implies that companies with higher (lower) CSR performance,
would be less (more) likely to avoid taxes. A positive relationship, discussed second, implies that companies
with a higher (lower) CSR performance are more (less) likely to avoid taxes.
2.3.1 Arguments suggesting a negative relationship
The negative relationship between CSR performance and tax avoidance is ingrained into two contrary
theories about the purpose of management — the shareholder and the stakeholder (Moser & Martin,
2012). The shareholder theory states that the purpose of management is to realise the specified ends
of shareholders, with the assumption that the ends are legal and basically non-deceptive (Smith, 2003;
Schaefer, 2008). Those ends are, in practise, mostly the maximisation of the company’s profit. In contrast,
the stakeholder theory states that it is the company’s duty to balance the shareholders’ financial interest
against the interest of other stakeholders, such as employees, customers, and the community, even if this
entails reducing profit (Carroll, 1979; Gass & Mackey, 2007; Smith, 2003; Schaefer, 2008).
Connecting these two theories with the relationship between CSR performance and tax avoidance, it
could be argued that — from a shareholders’ point of view — limited CSR investments must be made,
7

Stevens (2020)
and tax-avoidance behaviour should be stimulated. Since this is causing a reduction of costs, profits will
be maximised. Economist Milton Friedman’s argument might be the most influential one in support of
this line of reasoning. He states that a manager is hired by the shareholders with the general duty to
follow the shareholders’ directions. This duty will be most of the time to maximise the profit (Friedman,
1970), implying that companies will only invest in CSR and pay their taxes if it increases the profit. From
a stakeholders’ perspective, CSR investments must be stimulated, and tax avoidance should be decreased
since it harms the society. Porter & Kramer (2006) and Avi-Yonah (2008) support the stakeholder theory
with the view that companies have a major impact that extends beyond maximising shareholder wealth.
Companies must survive the rigours of a competitive business environment, thus need to deal with many
other entities and individuals, and care about CSR (Avi-Yonah, 2008). Furthermore, investing in CSR or
paying tax may also maximise profit (Schaefer, 2008), for example due to competitive advantages it might
bring (Jones, 1995). Therefore, the theories do not necessarily exclude each other.
Several studies also suggested a negative relationship between CSR and tax avoidance (Lanis & Richard-
son, 2012; Huseynov & Klamm, 2012; Hoi et al., 2013; Lanis & Richardson, 2015; Watson, 2015). Lanis
& Richardson (2012) researched the relationship between CSR and tax aggressiveness in Australia. Their
study suggests that Australian firms with a high level of CSR disclosures have higher ETRs. Therefore,
the firms are likely to be less tax aggressive. A study conducted by Huseynov & Klamm (2012) finds
evidence for a positive relationship between low CSR performance ratings and lower ETRs. This suggests
that firms that invest less in CSR, avoid more taxes. Lanis & Richardson (2015) indicate, based on self-
reported tax disputes, that more socially responsible firms are likely to employ less tax avoidance. Hoi et
al. (2013) findings suggest that firms with excessive irresponsible CSR activities have a higher likelihood
of engaging in tax-sheltering activities and a greater BTD, which suggests more tax avoidance. Watson
(2015) investigates the relationship between CSR, tax avoidance, and earnings performance. The study
shows that a lack of CSR is positively associated with tax avoidance of firms with low current or future
earnings performance.
2.3.2 Arguments suggesting a positive relationship
Regarding the shareholder and stakeholder theory and several studies, CSR and tax avoidance are likely
negatively associated. However, the contrary — a positive relationship — can also be argued; firms with
a higher CSR performance might avoid more taxes (Davis et al., 2015). From a company’s point of view,
paying taxes detracts from social welfare since tax payments reduce economic development, job growth,
and innovation by the company (Davis et al., 2015). This argumentation is supported by several studies
(Hines Jr, 2005; Djankov et al., 2010; Ljungqvist & Smolyansky, 2014). Hines Jr (2005) implies that
there is a significant amount of evidence showing that investments in the country and tax avoidance are
strongly influenced by tax policies due to the mobility of capital. Furthermore, Djankov et al. (2010) find
a consistent and large adverse impact of corporate taxes on investments and entrepreneurship. Moreover,
Ljungqvist & Smolyansky (2014) conclude that an increase in corporate tax rates leads to a reduction in
employment and wage income, and that when implemented during recessions, corporate tax cuts boost
economic activity. More generally, when a firm has a relatively higher after-tax profit, its impact on social
welfare through investments may increase, which both improves the income level of the community and
increases other sources of tax revenue (Ljungqvist & Smolyansky, 2014). In other words, firms that avoid
8

Stevens (2020)
taxes have a greater capacity to invest in CSR.
Another theory that would suggest a positive relationship is the risk management theory. In general,
risk management refers to a practice of identifying, analysing and reducing potential risk. Godfrey et al.
(2009) finds that participation in CSR activities could be a method to reduce risk, since in the face of
certain types of negative events, for example an adverse event (Minor & Morgan, 2011), a lesser negative
reaction on the stock price occurs for companies that participated in more CSR activities. This implies that
CSR can create an insurance-like protection (Godfrey et al., 2009). Linking this theory to the relationship
between CSR and tax avoidance, it could be reasoned that CSR investments can be used as an insurance
to limit value loss in case the tax-avoidance behaviour of a company becomes public. This effect gives
incentives to invest more in CSR, when more tax avoidance is employed.
There are some studies that have found results which are suggesting a positive relationship between
CSR and tax avoidance (Sikka, 2010; Lanis & Richardson, 2013; Davis et al., 2015; Col & Patel, 2019).
Sikka (2010) provides a few examples of companies that claim through their CSR reporting to be ethical,
while employing tax avoidance. Moreover, in contrast to other research conducted by Lanis & Richard-
son, discussed in Section 2.3.1, they also provide evidence for a positive relationship Lanis & Richardson
(2013). Their small sample study of 40 Australian corporations accused of tax aggressive activities, show
a positive and significant relationship between CSR disclosure and tax aggressiveness, and thus suggest a
positive relation between CSR and tax avoidance. Furthermore, Davis et al. (2015) argue that CSR and
tax payments can act as substitutes since they find a consistent negative relation between CSR and the
LETR. These results provide empirical evidence that firms with higher CSR performances are more likely
to avoid more tax. That risk management can also play a role when deciding to invest in CSR is shown
by Col & Patel (2019). They found out that companies affected by a new controlled foreign corporations
look-through rule, a signal that firms make use of tax heavens, are responding with increasing their CSR
practices.
Overall, theoretical background is provided for both the negative and positive relationship. The nega-
tive relation is supported by the shareholder and stakeholder theory. The positive relation is substantiated
by the idea that paying taxes detracts from social welfare or the risk management theory. The majority of
the empirical studies, however, find a negative relation between CSR and tax avoidance of firms, suggesting
that companies that invest more (less) in CSR are less (more) likely to avoid taxation.
2.3.3 Hypothesis development
Although evidence for both relationships (negative and positive) is found, the majority of the empirical
research implies that the relationship between the general CSR performance and tax avoidance is negative.
Furthermore, the proxies used for tax avoidance and the research framework of the studies that show a
negative relation, corresponds with the proxies and framework used for this thesis. Moreover, research also
indicates a worldwide trend to offer more weight to stakeholders due to developments such as the Enron
and WorldCom scandals (Martin et al., 2009). Against this background and in combination with the rise
of the fair share thought, it is expected that companies that value the (overall) CSR performance would
be less likely to participate in corporate tax avoidance. Based on this reasoning, the following hypothesis
is created:
9

Stevens (2020)
H1: Ceteris paribus, the CSR performance and the tax avoidance of a firm are negatively related
As mentioned in Section 2.1, CSR performance can be split into three different dimensions: corporate
governance, society and environment. These three dimensions are defined as follows. Firstly, corporate
governance performance is defined as the management performance, shareholder performance and the
CSR strategy. Secondly, societal performance is defined as the influence on the workforce, human rights,
community and product responsibility. Thirdly, environment performance is defined as the factors that
determine resource usage, emissions and innovation. Thus far, not much research has been conducted on
the relationship between these subgroups of CSR performance and tax avoidance for European companies.
Due to the rising availability of information on CSR performance, the subgroups can now be researched. In
this thesis further research will be conducted on the subgroups of corporate governance since the decision
to invest in CSR and/or to avoid taxes is linked to the corporate governance of a company. This makes
the relationship between the different subgroups and tax-avoidance behaviour interesting and useful. One
subgroup of the societal dimension, the community, is also further researched. Community performance
measures the company’s commitment towards being a good citizen, protecting public health and respecting
business ethics, which seems contradicting values for companies that avoid taxation. Therefore, it would
be interesting to see the relationship between this subgroup and tax avoidance. The scope of the thesis
will extend to the management, shareholder, strategy and community subgroups only. This is due to
missing links within the other subgroups of the societal dimension and tax avoidance, and other studies
conducted by Lanis & Richardson (2015); Laguir et al. (2015) who found an insignificant relationship
between environmental performance and tax avoidance.
With the following sub-hypotheses, the research advice offered by Lanis & Richardson (2015) is cited.
The hypothesis development regarding the relationship between the subgroups of governance performance
and tax avoidance will be discussed first, followed by the hypothesis development regarding the relation-
ship between the subgroup of social performance and tax avoidance.
The management performance measures a company’s commitment and effectiveness towards following
best practice corporate governance principles. The corporate governance principles differ among European
countries and companies, but the Organization for Economic Cooperation and Development (OECD) is
publishing guidelines every several years with key building blocks for a good corporate governance frame-
work and practical guidance. The guidelines state that a well-functioning corporate governance system
should embrace a high level of transparency, accountability, board oversight, and respect for the rights
of shareholders and the role of key stakeholders (OECD, 2015). Following the same line of reasoning for
the relationship between the overall CSR performance and tax avoidance, it could be argued that when
a company values the corporate governance principles, especially the role of key stakeholders, it would
perform higher on the management performance and should also be less likely to avoid taxes. Based on
this reasoning, the following hypothesis is created:
H1a: Ceteris paribus, the CSR-management performance and the tax avoidance of a firm are negatively
related
10

Stevens (2020)
Furthermore, the relationship between shareholders performance — the company’s effectiveness towards
equal treatment of shareholders and the use of anti-takeover devices — and tax avoidance has also not yet
been researched. Equal treatment of the shareholders — domestic and foreign, government and private or
minority and majority — is viewed as good corporate governance and, in some situations, even demanded
by law (OECD, 2000, 2015; Mucciarelli, 2010). Anti-takeover devices are means to counteract external
corporate governance as they help shelter managers from the forces of the takeover market. Managers, who
might be insufficiently competent or qualified to manage a company, could use these devices to prevent a
hostile takeover or to maintain their positions when a takeover occurs (Meade & Brown, 1995). On the
one hand, this could result in managers showing more risky or aggressive behaviour without carrying the
negative effects of their actions. On the other hand, if managers are protected, they can apply a more
long-term vision of the company since they are safer in their position, and having a negative revenue in
the short term will likely hurt them less.
The relationship between shareholders performance and tax avoidance, in itself a less obvious one,
can be based on a company’s awareness towards their own corporate governance. Unequal treatment of
shareholders, for example, is a sign of bad corporate governance (OECD, 2000). Following the same line
of reasoning as used before, companies that care about their corporate governance are more likely to have
a higher shareholder performance and lower tax avoidance. For this reason, it is anticipated that a nega-
tive relationship between the shareholders performance measure and tax avoidance exists. The following
hypothesis is created:
H1b: Ceteris paribus, the CSR-shareholders performance and the tax avoidance of a firm are negatively
related
The strategy performance measure captures the company’s practices to communicate the involvement
of CSR in their daily decision-making processes. The reasons why companies allow CSR to be a part
of their decision-making processes differ and are therefore affecting the extent of communication about
this involvement. On the one hand, companies can use participation in CSR activities as an insurance-
like protection, explained in Section 2.3.2 (Godfrey et al., 2009; Col & Patel, 2019). In this case, the
participation must be public knowledge to reduce the negative market reaction in the face of a negative
event (Godfrey et al., 2009). When this protection is implemented due to the tax-avoidance behaviour
of the company, a positive relationship will exist between the strategy performance measure and tax
avoidance.
On the other hand, when the investments in CSR are used to respond to legitimate expectations of
stakeholders, explained in Section 2.3.1, a company will also highly promote their CSR integration to
inform their stakeholders that their expectations are taken into account (Kemper et al., 2013). In that
case, it would be contrary to also participate in an increasing amount of tax avoidance due to the damage
it can induce to the relationship with the stakeholders, when the tax-avoidance behaviour becomes public
(Hanlon & Slemrod, 2009). In addition, an increasingly prominent element of CSR implementation is
partnerships between companies and nongovernmental organisations (NGOs), which are mostly highly
promoted (Seitanidi & Crane, 2009). Poret (2014) determines that during such partnerships, NGOs are
11

Stevens (2020)
carrying the risk of losing credibility and legitimacy. Intuitively, NGOs would not enter a partnership
with firms that, to their knowledge, are employing an increasing amount of tax avoidance due to the
potential reputation damage. Therefore, these partnerships would force companies to limit or decrease
their tax avoidance. In conclusion, when companies implement CSR in their daily decision-making process
to satisfy their stakeholders, the strategy performance measure and tax avoidance would have a negative
relationship.
Due to research indicating a worldwide trend to offer more weight to stakeholders (Martin et al., 2009),
it is expected that a negative relationship exists between strategy performance and tax avoidance. The
following hypothesis is created:
H1c: Ceteris paribus, the CSR-strategy performance and the tax avoidance of a firm are negatively related
Investing in CSR and/or avoiding tax has (positive and negative) consequences for the society. The
community performance measure is based on the company’s commitment towards being a good citizen,
protecting public health and respecting business ethics. Due to the connection between tax payments
and government spending, explained in Section 2.2, it could be argued that if a company cares about the
community by being a good citizen, protecting public health and respecting ethics, it would also employ
less tax avoidance. Following this argumentation, community performance and tax avoidance should be
negatively associated. Based on this reasoning, the following hypothesis is created:
H1d: Ceteris paribus, the CSR-community performance and the tax avoidance of a firm are negatively
related
2.4 Competition
As discussed in Section 2.3.1, the negative relationship between CSR performance and tax avoidance can
be explained by the shareholder theory or the stakeholder theory. Following these theories, companies
would either invest (disinvest) in CSR and decrease (increase) their tax avoidance when their revenue
increases, or when the stakeholders demand it. In other words, the behaviour of the company is influenced
by market demand. However, the influence of the demand itself depends on the amount of competition
within the company’s market since in markets that are highly competitive, advantage can be gained over
competitors by accommodating market demand.
Economist Michael E. Porter states that two main strategies can be applied to gain the advantages: the
cost leadership strategy or the differentiation strategy (Porter & Advantage, 1985).4 In the cost leadership
strategy, companies aim to become the low-cost producer in their industry (Porter & Advantage, 1985).
In the differentiation strategy, companies seek to be unique in their industry through dimensions that are
highly valued by buyers (Porter & Advantage, 1985). Regarding the strategies, Porter stated: “A firm that
engages in each generic strategy but fails to achieve any of them is ‘stuck in the middle.’ It possesses no
competitive advantage” (Porter & Advantage, 1985). In other words, to achieve a competitive advantage,
4 Both the strategies can also be done in a narrow competitive scope within a industry, Porter calls that the focus strategy(Porter & Advantage, 1985). This could be seen as the third strategy but is basically the application of the cost leadershipstrategy or differentiation strategy on a smaller scope.
12

Stevens (2020)
you need to choose between these strategies.
2.5 Corporate social responsibility, tax avoidance and competition
When a company applies the cost leadership strategy due to market competition, it could have implica-
tions for the CSR performance and the tax-avoidance behaviour. To lower the costs, the company could
disinvest in CSR and/or will likely avoid more tax, as taxes are mostly viewed as a cost (Sikka, 2010;
Cai & Liu, 2009). Cai & Liu (2009) found evidence that within the Chinese industrial markets, com-
panies in more competitive market environments are implementing such a strategy by engaging in more
tax-avoidance activities. Notably, due to the weak enforcement of the corporate income tax in China, tax
avoidance there, compared to Europe, is likely easier to employ (Cai & Liu, 2009).
When applying the differentiation strategy, a company can use CSR investments as a competitive
advantage (Porter & Kramer, 2006), since relationships with the stakeholders are based on trust and
cooperation (Jones, 1995; Ruf et al., 2004). Flammer (2015)) and Fernandez-Kranz & Santalo (2010)
researched the relationship between CSR investments and competition. Flammer (2015) finds support
for the view of CSR as a competitive strategy by showing that U.S. domestic companies increase their
engagement in CSR in response to tariff reductions. Furthermore, Fernandez-Kranz & Santalo (2010) find
that firms have a higher CSR performance when they are in more competitive markets. Considering this
study, it could be said that CSR can be used through positive reputation branding to obtain a certain
market position.
Tax avoidance is generally viewed as a reputation destroyer (Desai & Dharmapala, 2008), and prior
research shows that the reputation effects are relevant in a company’s decision on whether to engage in
tax avoidance (Dyreng et al., 2016; Austin & Wilson, 2017). Hanlon & Slemrod (2009) find that when
a company’s involvement in tax shelters becomes public, its stock price, on average, declines due to a
potential consumer backlash. Several experimental researches support this reasoning (Hardeck & Hertl,
2014; Antonetti & Anesa, 2017; Asay et al., 2018). Following the results of these studies, it is less likely that
companies that are in highly competitive markets and have chosen to apply the differentiation strategy,
will engage in tax avoidance.
2.5.1 Hypothesis development
As mentioned in the section above, companies that employ the cost leadership strategy are more likely
to disinvest in CSR and increase tax avoidance. In contrast, companies that employ the differentiation
strategy are more likely to invest in CSR and decrease tax avoidance. Therefore, for both strategies a
negative relationship seems to occur, implying that companies with higher (lower) CSR performance would
be less (more) likely to avoid taxes. Based on this reasoning, the following hypothesis is created:
H2: Ceteris paribus, CSR performance and tax avoidance are stronger negatively related in more compet-
itive markets
13

Stevens (2020)
3 Research design
3.1 Sample description
In order to analyse the relationship between the (subgroups of) CSR performance and tax avoidance, and
the influence of competition, an initial sample with European companies is retrieved from ASSET4 (owned
by Thompson Reuters, available via Datastream). The sample is reduced by the following exclusions: (1)
all the companies that do not have all the data for calculation of the tax-avoidance proxies; (2) all the
financial companies because of government regulation, which likely affects their tax avoidance (companies
with a Standard Industrial Classification (SIC) code of 6000–6900); and (3) all the Turkish companies since
the largest part of the country is in Asia, which leaves them out of the scope. The final sample consists
of 657 European companies, based in Austria, Belgium, Czech Republic, Denmark, Finland, France, Ger-
many, Greece, Hungary, Ireland, Italy, Luxembourg, Norway, Poland, Portugal, Slovenia, Spain, Sweden,
Switzerland, The Netherlands and United Kingdom, and active in seven different industries.5
Table 1: The sample: construction
Sample construction steps N
ASSET4 World 8049
ASSET4 Europe 1570
(1) Excluded companies due to missing data for tax avoidance proxies - 400
(2) Excluded companies due to industry - 381
(3) Excluded companies due to scope - 132
Total sample 657
This table presents the construction of the total sample. The sample contains 657 Europeancompanies with observations between 2005 and 2017. Excluded from the sample are companiesthat have missing data for the calculation of the tax-avoidance proxies, are active in the financialindustry (SIC-code: 6000-6900) or are based in countries outside the scope.
To investigate the relationship, three tax-avoidance proxies will be constructed. The first proxy, ef-
fective tax rate, is based on data from 2005–2017. The second proxy, long-term effective tax rate, is
based on data from 2001–2017. The third proxy, book-tax difference, is based on data from 2005–2017.
The required data is retrieved from the Worldscope database (available via Datastream) and the OECD
database. The CSR performance and its subgroups are obtained from ASSET4 (owned by Thompson
Reuters, available via Datastream, also used by Chen et al. (2010); Ioannou & Serafeim (2012); Gomes
(2019)). For analysing the effect of market competition on the relationship, the Herfindahl-Hirschman
Index is used as the competition measure and will be calculated based on data from 2005–2017, retrieved
from the Worldscope database.
In the upcoming paragraphs, the dependent variable (proxies for tax avoidance), the independent
variables (CSR and competition), the control variables and the base regression model will be discussed.
5 The representation of countries in the sample can be found in Table 19 of the Appendix. The representation of industriesin the sample can be found in Table 20 of the Appendix.
14

Stevens (2020)
3.2 Dependent variable
Analysing tax avoidance of companies is challenging due to the confidentiality of financial information on
tax returns (Hanlon & Heitzman, 2010). In order to conduct research on the avoidance — despite the lack
of information — proxies must be created based on public information. As a result, no proxy is without
limitations (Hanlon & Heitzman, 2010). Therefore, multiple proxies will be generated and employed in this
thesis. The three proxies applied — effective tax rate, long-term effective tax rate and book-tax difference
— are widely used in tax research (Gupta & Newberry, 1997; Desai & Dharmapala, 2006; Adhikari et al.,
2006; Cai & Liu, 2009; Chen et al., 2010; Dyreng et al., 2010). To control for the effect of potential outliers,
the sample is winsorized at the 1st and 99th percentiles (Shevlin, 2001; Lanis & Richardson, 2015). The
construction and meaning of the proxies will be explained in the following paragraphs.
3.2.1 Effective tax rate
Following Dyreng et al. (2010) and Guenther (2014), the first proxy that will be used is the effective tax
rate (ETR). The ETR measures the average tax rate that is paid by the company on its income. Although
the ETR can fluctuate significantly from year-on-year, it is the most commonly used proxy due to the
simplicity of the calculation and easily understandable meaning. The ETR will be calculated as follows.
ETRit = TTEit/PIit, (1)
where the effective tax rate (ETR) for a firm (i) in year (t) is defined as the total tax expense (TTE,
current and deferred) divided by the pre-tax book income (PI).6
The ETR is negatively correlated to tax avoidance. In other words, when companies are more (less)
engaged in tax avoidance, the ETR should be lower (higher). In the final sample used for calculation of
the proxy, a measurement issue occurs for companies that reported either a negative pre-tax book income
or a tax refund. Following Gupta & Newberry (1997) and Adhikari et al. (2006), these observations will
remain in the sample. The proxy is, however, distorted in certain situations. For example, when a firm has
a negative pre-tax book income and a tax refund (negative total tax expense), the ETR will be positive
even though no taxes are paid. Furthermore, when a firm did pay taxes (positive total tax expense) but
reported a negative pre-tax book income, the proxy will be negative even though the company did pay
tax. To account for this problem, the recoding scheme recommended by Gupta & Newberry (1997) is used
by setting the proxy: (1) to zero for firms with a tax refund and (2) to one for firms with positive taxes
and negative/zero pre-tax book income.
3.2.2 Long-term effective tax rate
Based on the idea of Dyreng et al. (2010) and Davis et al. (2015), a long-term effective tax rate (LETR)
based on five years will be used as the second proxy. Using a long-term proxy, an effective tax rate is
calculated that is closer to the company’s tax costs over the long run. This proxy should also be less
affected by accrual-based management activities7 than annual effective tax rate measures, such as the
6 The pre-tax income is defined as all income/loss before any federal, state or local taxes. Also the extraordinary itemsthat reported net of taxes are excluded.
7 These are activities done by the management to achieve a desired financial reporting result.
15

Stevens (2020)
ETR, since the longer time period should capture the reversals of the accruals (Dyreng et al., 2008).
Ideally, the five-year cash effective tax rate would have been calculated. This proxy is based on the cash
flow instead of the profit and loss statement, and is even better able to take into account the situation that
a significant part of tax avoidance consists of accelerating tax deductions and postponing taxable income,
which causes a lower current taxable income but a higher taxable income in the future. These situations
are only partly taken into account when using the LETR (Dyreng et al., 2008). Due to data limitations of
Worldscope, the cash effective tax rate unfortunately can not be calculated. The LETR will be calculated
as follows.
LETRit =
N∑t=1
TTEit/
N∑t=1
(PIit), (2)
where the long-term effective tax rate (LETR) for a firm (i) in year (t) is defined as the sum of five years
of total tax expense (TTE) divided by the sum of five years of pre-tax book income (PI). The LETR is
also negatively correlated to tax avoidance. This means that when companies are more (less) engaged in
tax avoidance, the LETR should be lower (higher). During the creation of the LETR, the measurement
issue for firms that reported either negative income or tax refunds — explained in Section 3.2.1 — also
occurs. To account for this problem, the same recoding scheme is applied as used for the ETR.
3.2.3 Book-tax difference
The book-tax difference (BTD), the third proxy, is based on the gap between the pre-tax book income
reported by the company to its shareholders and the taxable income reported to the tax authorities on
which the company actually pays its taxes. The ideal tax shelter will create a permanent, rather than
temporary, difference (Shevlin, 2001). Companies that are relatively successful in avoiding taxes should be
able to maintain significant permanent differences. The BTD proxy attempts to capture these permanent
differences between the book and taxable income (Shevlin, 2001).
Following Manzon Jr & Plesko (2001), Gupta & Newberry (1997) and Shevlin (2001), in order to
calculate the BTD, the taxable income has to be calculated first, as this information is non-excluded. The
taxable income is estimated based on the current tax expense minus the deferred taxes divided by the
statutory tax rate. Deferred taxes refers to a negative or positive post on the balance sheet of the company
from taxes that still must be paid or were overpaid, and are subtracted due to their temporary character.
The taxable income will be calculated as follows.
TIit = (TTEit −DEFit)/STRct, (3)
where the taxable income (TI) for a firm (i) in year (t) is defined as the current tax expenses (TTE)
minus the deferred taxes (DEF ) divided by the (top marginal) statutory tax rate (STR) per country c in
year t.
After estimating the taxable income, the difference will be calculated with the following equation:
BTDit = (PIit − TIit)/ASSETit, (4)
16

Stevens (2020)
where the book-tax difference (BTD) for a firm (i) in year (t) is defined as the pre-tax book income (PI)
minus the taxable income (TI), scaled by the total assets (ASSET ). The BTD is positively correlated
to tax avoidance. In other words, when companies are more (less) engaged in tax avoidance, the BTD
should be higher (lower) since the difference between the income communicated to shareholders, pre-tax
book income, and to the tax authorities, taxable income, is larger (smaller).
Regarding the calculation of the BTD, a measurement error also arises for companies that reported
a negative pre-tax book income. A problem occurs, for example, when there is a loss according to the
pre-tax book income and revenue according to the taxable income. In that case a (large) negative gap is
calculated with the BTD. Blackburne & Blouin (2016) argue that (large) negative BTDs are a proxy for
the overall level of noise in accounting systems. This, therefore, suggests that these BTDs are causing a
measurement error when calculating a tax-avoidance proxy. An second measurement issue arises when the
pre-tax book income and the taxable income both present a loss, and no taxes are paid nor should be paid,
based on these two measures. However, when the negative taxable income is higher than the negative
pre-tax book income, a positive BTD will be calculated. The higher the taxable income, the higher the
gap, insinuating that the company is avoiding tax. Companies could, in theory, attempt to maximize their
negative taxable income to create a loss that they can use in another year. However, companies that are
making a book loss likely have different priorities than avoiding taxes (Desai & Dharmapala, 2006). To
account for these two measurement issues, the proxy is set at zero for firms with a negative pre-tax book
income.
3.3 Independent variable
3.3.1 Corporate social responsibility
The data for performances concerning CSR is subtracted from ASSET4. The ASSET4 database of Thom-
son Reuters provides comparable CSR data covering more than 7000 public companies going back to
2002, with the aim to provide an up-to-date, objective and comprehensive global coverage. The recently
extended database has an overall environmental, social, and governance (ESG) score which is measuring
the company’s ESG performance based on public-reported data. In this thesis, this score will be seen as
the CSR performance measure. The CSR performance measure is an combination of the ten subgroups
weighted proportionately and will have a value between 0 and 100, of which 0 means low performance
and 100 means high performance. The ten subgroups are: resource use, emissions, innovation, workforce,
human rights, community, product responsibility, management, shareholders, CSR strategy (Eikon, 2018).
In an other study (Ioannou & Serafeim, 2012), a combination of scores on the CSR dimensions — gover-
nance, environmental and social — was used to calculate the overall CSR performance due to the lack of
a general score. With the new ESG score, this is not needed anymore.
For the sub-hypotheses, the management, shareholders, CSR strategy and community scores will be
used as the performance measures. The subgroups are based on a percentile rank scoring methodology,
which makes the outcome insensitive to outliers. Each subgroup’s score is the equally weighted sum of all
relevant indicators used to create the subgroup (Eikon, 2018) and will have a value between the 0 and 100,
of which 0 means low performance and 100 means high performance. The subgroups’ performance have a
positive influence on the CSR performance. In other words, a higher (lower) subgroup performance causes
17
Stevens (2020)
a higher (lower) CSR performance.
3.3.2 Competition
For the second hypothesis, the market competition — for which several measures can be used — must be
calculated. Following Cai & Liu (2009), the Herfindahl-Hirschman Index (HHI) will be used. The HHI
accounts for the number of firms in a market by incorporating the relative size of all firms in the market.
In other words, it shows the level of market concentration. HHI will be calculated as follows.
HHIjt =
N∑i=1
(Si)2, (5)
where the Herfindahl-Hirschman Index (HHI) is calculated for an industry (j) in year (t) by squaring the
market share (S) of each company (i) that is part of the industry. This is followed by summing up all the
market shares. The HHI is negatively correlated with competition since it gives heavier weight to firms
with large market shares than to firms with small shares due to the squaring of the shares. This coincides
with the theoretical concept that competition is relatively strong in an industry with a low concentration
of sales in a large number of firms (low HHI). In contrast, a high HHI corresponds to a high concentration
of sales in an industry spread over a small number of firms with larger market shares, and thus a less
competitive market. When there are more than 50 firms in the sample of a specific industry, the 50 largest
firms — based on sales — are used to calculate the competition. When there are fewer than 50, all the
firms available are used. The HHI will be a number between 0 and 1.
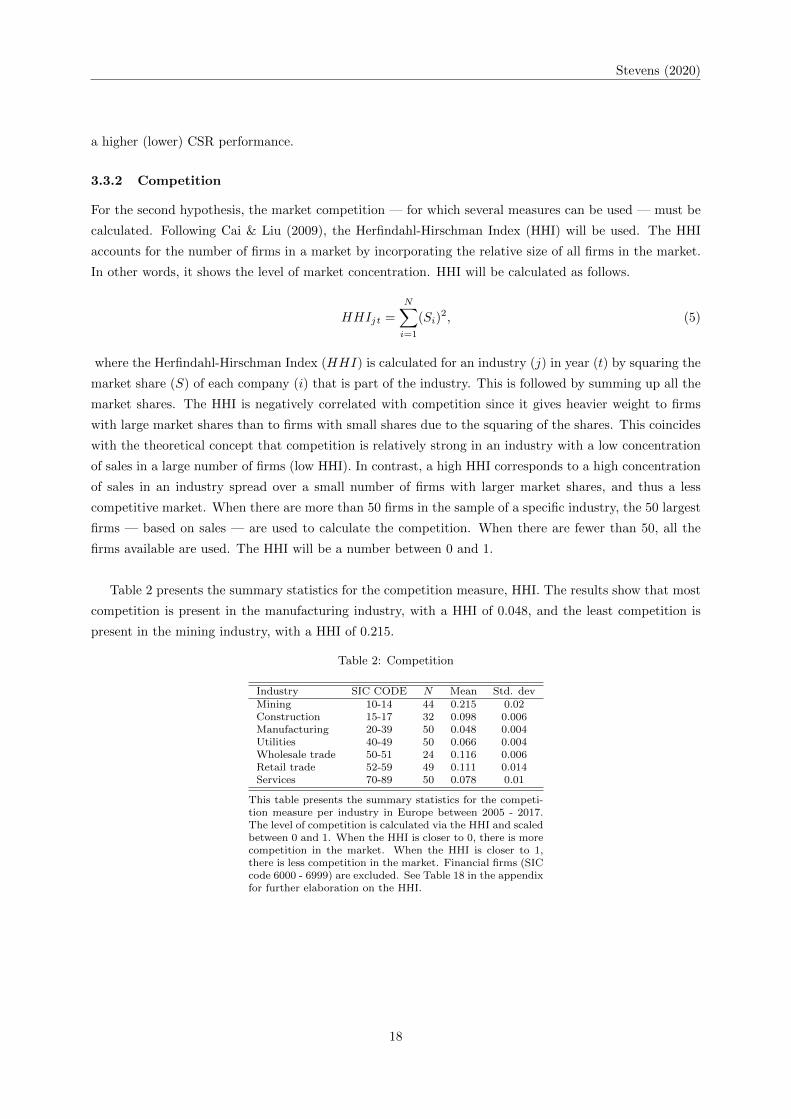
Table 2 presents the summary statistics for the competition measure, HHI. The results show that most
competition is present in the manufacturing industry, with a HHI of 0.048, and the least competition is
present in the mining industry, with a HHI of 0.215.
Table 2: Competition
Industry SIC CODE N Mean Std. devMining 10-14 44 0.215 0.02Construction 15-17 32 0.098 0.006Manufacturing 20-39 50 0.048 0.004Utilities 40-49 50 0.066 0.004Wholesale trade 50-51 24 0.116 0.006Retail trade 52-59 49 0.111 0.014Services 70-89 50 0.078 0.01
This table presents the summary statistics for the competi-tion measure per industry in Europe between 2005 - 2017.The level of competition is calculated via the HHI and scaledbetween 0 and 1. When the HHI is closer to 0, there is morecompetition in the market. When the HHI is closer to 1,there is less competition in the market. Financial firms (SICcode 6000 - 6999) are excluded. See Table 18 in the appendixfor further elaboration on the HHI.
18

Stevens (2020)
3.3.3 Control variables
Since numerous variables could determine a company’s tax avoidance, a set of control variables is included
in to the model to ensure that the results are robust. The control variables applied, are frequently used
in research focused on tax avoidance. Six control variables are added: leverage (LEV), inventory intensity
(INVENT), the market-to-book ratio (MKTB), return on assets (ROA), firm size (SIZE) and Big 4 auditor
(BIG4). The data is retrieved from the Worldscope database and Compustat, Capital IQ. The following
paragraph discusses the selected control variables and how they are determined.
The LEV is included as a control variable due to the tax deduction of the interest payments. More
leveraged firms might benefit from their debt financing, which makes them less likely to avoid corporate
taxes (Gupta & Newberry, 1997; Hope et al., 2013). LEV is measured by dividing the long-term debt by
the total assets. INVENT is included to control for firms that are more inventory intensive; compared to
capital-intensive firms, they should be less likely to avoid corporate taxes (Stickney & McGee, 1982). The
INVENT is calculated by dividing the total inventory by the total assets, and is set to 0 if missing. The
MKTB is a ratio that is included to control for the extent of growth of the firm, and is set to 1 if missing.
Chen et al. (2010) discuss that dividing the market value of equity by the book value of equity creates
an effective measure for the growth of the company. Furthermore, Loebbecke et al. (1989) argued that
when a firm has more growth opportunities, management may engage in more risky behaviour to maintain
the growth. This risky behaviour could increase the likelihood of engaging in tax avoidance. The ROA
is included to control for the profitability of firms. Intuitively, firms with a higher profit are subject to a
higher tax rate, which could offer them more incentive to avoid taxes. However, research shows conflicting
results for this measure on tax avoidance behaviour (Gupta & Newberry, 1997; Adhikari et al., 2006).
The ROA is measured as the pre-tax income divided by the total assets. SIZE controls for the size of the
firm. Based on prior research (Zimmerman, 1983), it is expected that larger firms are more likely to avoid
taxes than smaller firms due to their economic influence and their international presence, which make it
easier to reduce their tax burden. This measure is calculated by taking the natural log of total assets.
The sixth control variable is the BIG4. This controls for firms that are using a Big 4 auditing firm. Prior
research by Matsumura & Tucker (1992); Rezaee (2005) shows that firms that are controlled for Big 4
auditors are positively associated with audit quality and the probability of detecting financial statement
fraud. Therefore, it is expected that firms engaged with a Big 4 auditor are less likely to avoid corporate
taxes. BIG4 is a dummy variable, coded 1 if the firm uses a Big 4 external auditor and 0 if it does not.
The variables, except for BIG4, are winsorized at the 1st and 99th percentiles.
3.4 Multiple regression model
The main statement in this thesis concerns the relationship between CSR performance and tax avoidance
on a company level. To examine this relationship, an ordinary least squares (OLS) regression will be
applied. While using the OLS, two effects — multicollinearity and endogeneity, both common problems
in economic research — have to be diminished.
19

Stevens (2020)
3.4.1 Multicollinearity
Multicollinearity occurs when the explanatory variables (independent and control variables) are themselves
related. An increase of multicollinearity makes it more difficult to determine the effect of single variables
due to their interrelationships (Hair. et al., 2014). By using panel data for this study, the observed sample
size increases, thereby diminishing the multicollinearity (Wooldridge, 2015). Although panel data is used,
the variables will be tested on their level of multicollinearity in Section 4.2.
3.4.2 Endogeneity
Endogeneity, broadly stated, occurs when explanatory variables are correlated with the error term and
can arise, for example, from omitted variables. This issue can appear in this thesis, first of all, because of
the potential jointly determination of a company’s tax-avoidance behaviour and their CSR performance.
Although control variables are added for the observable firm characteristics, the unobservable determinants
can result in an omitted variables problem. Secondly, firms engaging in tax avoidance may choose to invest
more in CSR performance. This will lead to a reserve causality problem.8 Endogeneity causes a wrong
estimation of the relationship between CSR and tax avoidance.
By applying a fixed or random effects model, the time invariant omitted variable bias in particular
can be decreased (Wooldridge, 2015). The fixed effects model, a conventional method to analyse panel
data (Wooldridge, 2015), is based on the idea that an unobserved effect is correlated with (an) explanatory
variable(s) of the sample. The random effects model is based on that same assumption plus the assumption
that there is an unobserved effect that is independent of all explanatory variables in all time periods
(Wooldridge, 2015). To decide which model should be used, the Hausman test needs to be conducted.
The concept of the test is that the null hypothesis — stating that the random effects model should be
used — gets rejected when the p-value is less than 0.05 (Wooldridge, 2015). While applying the Hausman
test on the regressions used for all the (sub)hypotheses in this thesis, it rejects the use of the random
effects model in favour of the fixed effects model for all the (sub)hypotheses (Prob>chi2 = 0.0001 and
Prob>chi2 = 0.0000). The fixed effects model is used by adding firm-specific effects9 and year-specific
effect. Therefore, dummies for each of the 657 firms and the different years in the sample are created,
which have to control and capture systematic differences in risk and performance across firms and the
influence of aggregate (time-series) trends. As a robustness check, in Section 4.4.4 the firm fixed effects
will be replaced by country fixed effects. In Section 4.4.5, it will be discuss how the endogeneity can be
handled by applying an additional method, the instrumental variable method.
8 When testing for model specifications via the linktest and ovtest (stata), it shows that there is a problem with misspec-ification which could suggest that there is omitted variable bias in the sample.
9 The firm-specific effects subsume the industry effects, since the industry is time invariant within the firms of the sample.
20
Stevens (2020)
3.4.3 Regression model
To research the relationship between (the subgroups of) CSR performance and tax avoidance, the following
base regression model will be estimated:10
TAit = α+ β1CSRit + β2LEVit + β3INV ENT + β4MKTBit
+ β5ROA+ β6SIZE + β7BIG4 + β8−21Y EAR+ β22 −6 79FIRM + εit. (6)
In the model, i is the firm 1–657; t the period 2005–2017; TA the firm’s ETR, LETR or BTD; CSR the
firm’s overall CSR performance (CSRPERF ), management performance (CSRMAN), shareholder per-
formance (CSRSHAR), strategy performance (CSRSTRAT ) or community performance (CSRCOM);
LEV the debt divided by total assets; INV ENT the inventory divided by total assets; MKTB the market
value of equity divided by the book value of equity; ROA the pretax income divided by total assets; SIZE
the natural logarithm of total assets; BIG4 a dummy variable, coded 1 if the firm uses a Big 4 auditor
and 0 otherwise; Y EAR a year dummy variable for year-specific effects; FIRM a firm dummy variable
for firm-specific effects; and ε the error term.
To account for competition in the regression model, the HHI and a two-way interaction term for the
relationship between CSR performance and HHI (CSRPERF ×HHI) are added to the equation.11 Via
this interaction term, the simultaneous effect of the two independent variable on the dependent variable
is taken into account.
TAit = α+ β1CSRPERFit + β2HHIit + β3CSRPERF ×HHI + β4LEVit
+ β5INV ENTit + β6MKTBit + β7ROAit + β8SIZEit + β9BIG4it
+ β10−23Y EAR+ β24−682FIRM + εit, (7)
4 Results
4.1 Descriptive statistics
Table 3 presents the descriptive statistics of all the variables used in the sample. The values that are
reported are the mean, standard deviation, minimum, median and maximum of the tax-avoidance proxies,
the CSR performance and its subgroups, competition measure (HHI) and control variables. Table 3 shows
that the ETR and the LETR have a mean (median) of 0.295 (0.260) and 0.318 (0.274), respectively,
suggesting that, on average, companies in the sample pay less taxes on the shorter term than on the longer
term. The BTD has a mean (median) of 0.017 (0.002), which indicates that, on average, the estimated
taxable income is lower than the reported pre-tax book income for the entire sample. Out of the CSR
performance and its subgroups, the table also shows that, on average, companies score the highest on the
community performance (51.701) and the lowest on the overall CSR performance (51.065). However, the
differences between the means of the performances is rather small. According to the summary statistics,
the average HHI is 0.105.
10 The other assumptions of the OLS regressions are met (linearity, normality).11 The main effect of HHI is also included regardless of its significance to prevent cofounding between the main and
interaction effects.
21

Stevens (2020)
Table 3: Descriptive statistics - full sample
Obs. Mean Std. dev Min Median MaxETR 8541 0.295 0.251 0.000 0.260 2.254LETR 8541 0.318 0.266 0.000 0.274 3.857BTD 8541 0.017 0.171 -0.632 0.002 0.669CSRPERF 7037 51.065 15.656 7.82 48.690 93.62CSRCOM 7024 51.701 29.531 0.250 51.000 99.820CSRMAN 7019 51.067 28.509 0.470 51.090 99.880CSRSHARE 7019 50.163 28.924 0.130 50.000 99.870CSRSTRAT 7019 54.197 27.634 0.160 56.380 99.880HHI 3887 0.105 0.052 0.042 0.094 0.244LEV 8541 0.192 0.143 0.000 0.179 0.682INV ENT 8541 0.112 0.120 0.000 0.087 0.712MKTB 8541 2.744 2.735 -2.450 2.030 18.100ROA 8541 0.078 0.084 -0.178 0.068 0.376SIZE 8541 15.346 1.766 11.507 15.227 19.607BIG4 8541 0.865 0.342 0 1 1
This table presents the descriptive statistics for the 657 European companies between 2005 and 2017. Variable definitions:ETR is the tax expenses divided by pre-tax income; LETR is the sum of five year tax expenses divided by the sum offive year pre-tax income; BTD is the difference between the pre-tax income and the taxable income scaled by total assets;CSRPERF is the CSR performance of the company; CSRCOM is the community performance of the company; CSRMANis the management performance of the company; CSRSHARE is the shareholders performance of the company; CSRSTRATis the strategy performance of the company; HHI is the sum of the squared market shares in the industry; LEV is the debtdivided by total assets; INV INT is the inventory dividend by total assets; MKTB is the market value of equity divided bythe book value of equity; ROA is the pre-tax income divided by total assets; SIZE is the natural logarithm of total assets;and BIG4 is a dummy variable, coded 1 if the firm uses a big-four auditor, otherwise 0. The tax-avoidance proxies andthe control variables, except BIG4, are winsorized at the 1st and 99th percentiles. See Table 18 in the appendix for furtherelaboration on the composition and the meaning of the different variables.
4.2 Correlation results
To research if a multicollinearity problem occurs, discussed in Section 3.4.1, the Pearson pairwise corre-
lation test is applied. The results are reported in Table 4. The highest correlation occurs between the
community performance and the strategy performance, two measures that will not be used within the
same regression. The coefficient, however, has a value of 0.454, which is considered as a moderate level
of collinearity (Hair. et al., 2014).12 The other correlation coefficients have such low values that it is
reasonable to assume that multicollinearity will not be a problem. Moreover, while estimating the base
regression model, the variance inflation factors (VIFs) are calculated as well, as an additional test for
signs of multicollinearity among the explanatory variables. The (unreported) results confirm that no VIFs
exceed 1.5 for any of the explanatory variables, thus multicollinearity is not problematic in the model.13
Table 4 shows that both ETR and LETR are significantly negatively associated with the BTD (p<0.01),
which is in line with the explanation of the proxies. The ETR, LETR and BTD are all significantly neg-
atively associated with the following control variables: leverage (LEV ), inventory intensity (INV ENT ),
the market-to-book ratio (MKTB), return on assets (ROA). The proxies all have a positive significant
relation with the firm size (SIZE).
12 According to Hair. et al. (2014), a correlation coefcient that is equal or higher than 0.90 is the first indication ofsubstantial collinearity.
13 Hair. et al. (2014) suggest that a VIF value above ten corresponds with a high level of multicollinearity amongst theexplanatory variables.
22

Stevens (2020)
Table
4:
Pea
rson
pair
wis
eco
rrel
ati
on
resu
lts
12
34
56
78
910
11
12
13
14
15
ET
R(1)
-
LE
TR
(2)
0.3
83***
-
BT
D(3)
-0.0
99***
-0.0
84***
-
CSR
PR
EF
(4)
-0.0
28**
-0.0
26**
0.0
14
-
CSR
CO
M(5)
0.0
17
0.0
09
-0.0
72***
0.3
68***
-
CSR
MA
N(6)
-0.0
03
-0.0
09
0.0
11
0.4
06***
0.3
01***
-
CSR
SH
AR
(7)
0.0
11
0.0
40***
-0.0
16
0.1
24***
0.0
43***
0.0
85***
-
CSR
ST
RA
T(8)
-0.0
01
-0.0
32***
0.0
16
0.3
28***
0.4
54***
0.2
56***
0.0
22*
-
HH
I(9)
0.0
84***
0.0
76***
0.0
76***
0.0
01
-0.0
43***
0.0
43***
0.0
17
0.0
05
-
LE
V(10)
0.0
27**
0.0
24**
0.1
51***
0.0
62***
0.0
79***
0.0
26**
-0.0
07
0.0
72***
-0.0
27**
-
IN
VE
NT
(11)
-0.0
34***
-0.0
32***
-0.1
28***
-0.0
15
-0.0
70***
-0.0
99***
-0.0
25**
-0.0
38***
0.0
39***
-0.2
97***
-
MK
TB
(12)
-0.0
65***
-0.0
65***
-0.1
26***
0.0
12
-0.0
15
0.0
27**
-0.0
31***
-0.0
23*
0.0
52***
-0.0
14
-0.0
19*
-
RO
A(13)
-0.2
08***
-0.1
97***
-0.0
70***
-0.0
09
-0.0
49***
0.0
39***
-0.0
14
-0.0
51***
0.1
44***
-0.3
01***
0.0
92***
0.4
14***
-
SIZ
E(14)
0.0
40***
0.0
36***
0.0
69***
0.1
35***
0.4
18***
0.2
04***
-0.0
19
0.4
41***
0.0
26**
0.1
40***
-0.1
24***
-0.1
33***
-0.1
41***
-
BIG
4(15)
-0.0
52***
-0.0
50***
0.0
12
0.0
41***
0.0
34***
-0.0
09
-0.0
03
0.0
58***
-0.0
24**
0.0
12
0.0
23**
0.0
56***
-0.0
01
-0.0
06
-
This
table
presentsthe
Pearson
pair-w
ise
correla
tio
ncoeffic
ientsbetween
the
dependentvaria
ble
s,the
CSR
perfo
rm
ance
and
the
sub-g
roupsofCSR,and
the
controlvaria
ble
sfo
rthe
8541
European
firm
-yearobservatio
nsbetween
2005
-2017.
See
Table
18
inthe
appendix
for
further
ela
boratio
non
the
com
positio
nand
the
meanin
gofthe
diffe
rent
varia
ble
s.
*Sig
nific
ant
at
the
0.1
0le
vel
**
Sig
nific
ant
at
the
0.0
5le
vel
***
Sig
nific
ant
at
the
0.0
1le
vel
23

Stevens (2020)
4.3 Regression results
4.3.1 Corporate social responsibility and tax avoidance
The results of the fixed effects model, with firm and year fixed effects, for hypothesis 1 and its sub-
hypotheses are depicted in Table 5, Table 6, and the Tables 21, 22 and 23 in the Appendix. Since
heteroscedasticity and autocorrelation are found to be present, robust standard errors are used.14
The results of the model with control variables included, indicate an insignificant negative relation-
ship between the effective tax rates and the CSR performance, and an insignificant positive relationship
between the book-tax difference and the CSR performance. Although these results are insignificant and
nothing can be stated about the relationship, the (negative and positive) signs suggests a relationship
contrary to what was anticipated. The results suggest that firms that are investing more in CSR, are
more likely to avoid tax.15 Furthermore, a negatively significant relation is found between management
performance and the long-term effective tax rate (Table 6) (p <0.01), which is contrary to my expectations
which anticipated that companies who are more committed and effective towards following best corporate
governance principles would be less likely to participate in tax avoidance. However, the result suggests that
companies that value management performance are more likely to avoid taxes. The other sub-hypotheses,
presented in the Tables 21, 22 and 23 in the Appendix, only show insignificant results. Regarding the
control variables, several significant relations are documented. These results suggests that companies that
are likely to have a lower return on assets (ROA) and to be larger in size (SIZE), are less likely to employ
tax avoidance. Moreover, it shows that companies that are likely to avoid more taxes are less likely to be
inventory-intense (INVENT).
In conclusion, for the main hypothesis and the sub-hypotheses 1b, 1c and 1d, no evidence has been
found for a relationship. For sub-hypothesis 1a, only one of the proxies, LETR, shows a significant negative
effect that contradicts the hypothesis.
14 Autocorrelation is detected via the Wooldridge test. By making use of the robust option, the standard errors are beingclustered at a firm level. This allows the regression errors to have an arbitrary autocorrelation within an firm, but treatthe errors as uncorrelated across firms. They allow for hetroskedasticity and autocorrelation in a way that is consistentwith the fixed effects assumption (Stock & Watson, 2015).
15 When companies are more (less) engaged in tax avoidance, the effective tax rates should be lower (higher) and the BTDshould be higher (lower).
24

Stevens (2020)
Table 5: CSR performance and tax avoidance
ETR LETR BTD
CSRPERF -0.001 -0.001 0.000(-1.96) (-1.85) (1.22)
LEV -0.083 0.024 0.004(-1.37) (0.33) (0.12)
INVENT -0.119 -0.169 -0.303***(-0.99) (-1.23) (-3.67)
MKTB 0.001 -0.001 -0.002(0.46) (-0.32) (-1.50)
ROA -0.826*** -0.653*** 0.098(-8.11) (-6.63) (1.72)
SIZE 0.029** 0.049*** 0.000(2.68) (3.40) (0.05)
BIG4 -0.004 -0.046 0.001(-0.20) (-1.63) (0.12)
Constant -0.018 -0.254 0.039(-0.10) (-1.10) (0.42)
N 7035 7035 7035adj. R2 0.049 0.053 0.040Firm Effects yes yes yesYear Effects yes yes yes
This table presents the results from regressing theproxies of tax avoidance on the CSR performance andthe control variables over the 2005-2017 period for 657European firms in the sample. The control variablesare leverage (LEV), inventory intensity (INVENT),the market-to-book ratio (MKTB), return on assets(ROA), firm size (SIZE) and Big 4 auditor (BIG4).The model includes firm and year fixed effects.Robust t statistics corrected for clustering at the firmlevel are presented in parentheses.* p < 0.05, ** p < 0.01, *** p < 0.001
Table 6: Management performance and tax avoid-ance
ETR LETR BTD
CSRMAN -0.000 -0.001** 0.000(-1.77) (-3.08) (0.81)
LEV -0.083 0.026 0.004(-1.35) (0.36) (0.13)
INVENT -0.117 -0.170 -0.303***(-0.97) (-1.24) (-3.68)
MKTB 0.001 -0.001 -0.002(0.43) (-0.36) (-1.46)
ROA -0.829*** -0.652*** 0.099(-8.11) (-6.65) (1.75)
SIZE 0.029** 0.050*** 0.000(2.69) (3.44) (0.06)
BIG4 -0.004 -0.048 0.001(-0.23) (-1.71) (0.12)
Constant -0.031 -0.257 0.043(-0.18) (-1.12) (0.46)
N 7017 7017 7017adj. R2 0.048 0.055 0.039Firm Effects yes yes yesYear Effects yes yes yes
This table presents the results from regressing theproxies of tax avoidance on the management perfor-mance and the control variables over the 2005-2017period for 657 European firms in the sample. Thecontrol variables are leverage (LEV), inventory inten-sity (INVENT), the market-to-book ratio (MKTB),return on assets (ROA), firm size (SIZE) and Big 4auditor (BIG4). The model includes firm and yearfixed effects. Robust t statistics corrected for cluster-ing at the firm level are presented in parentheses.* p < 0.05, ** p < 0.01, *** p < 0.001
4.3.2 Competition
The results of the fixed effects model, with firm and year fixed effects, for hypothesis 2 are depicted in
Table 7. In this model, the robust standard errors are also used to counter the effects on the model caused
by autocorrelation and heteroskedasicity.
In the model, tax avoidance is regressed on the CSR performance, competition (HHI) and the interaction
term (CSRPERF x HHI) with the control variables included. The results show insignificant coefficients for
the CSR performance, competition and the interaction term. Currently, nothing can be concluded about
the influence of competition on the relationship between CSR performance and tax avoidance. However,
it is notable that the interaction term, in combination with the effective tax rate, is negative and, in
combination with the long-term effective tax rate, positive. This suggests that, based on the effective tax
rate, the effect of CSR performance on tax avoidance will increase when less competition exists in the
market (higher HHI). Contrarily, the results for the long-term effective tax rate suggest that the effect of
25

Stevens (2020)
CSR performance on tax avoidance will decrease in a lesser competitive market (higher HHI). Regarding
the control variables, the same variables show a significant relationship as shown and explained in Section
4.3.1.
Table 7: CSR performance and tax avoidance, and theinfluence of market competition
ETR LETR BTD
CSRPERF -0.000 -0.001 0.001(-0.33) (-1.03) (1.89)
HHI 0.337 -0.958 -0.397(0.51) (-1.41) (-1.17)
CSRPERF x HHI -0.005 0.001 -0.005(-0.58) (0.11) (-1.71)
LEV -0.083 0.023 0.004(-1.37) (0.32) (0.11)
INVENT -0.117 -0.182 -0.311***(-0.97) (-1.31) (-3.72)
MKTB 0.001 -0.001 -0.002(0.45) (-0.25) (-1.41)
ROA -0.828*** -0.641*** 0.106(-8.14) (-6.55) (1.87)
SIZE 0.029** 0.049*** 0.000(2.67) (3.41) (0.06)
BIG4 -0.003 -0.047 0.000(-0.18) (-1.67) (0.05)
Constant -0.041 -0.182 0.071(-0.23) (-0.77) (0.72)
N 7035 7035 7035adj. R2 0.048 0.054 0.042Fixed effects yes yes yesYear dummies yes yes yes
This table presents the results from regressing the proxiesof tax avoidance on the CSR performance, competition andthe interaction term of CSR performance and competition,and the control variables over the 2005-2017 period for657 European firms in the sample. The control variablesare leverage (LEV), inventory intensity (INVENT), themarket-to-book ratio (MKTB), return on assets (ROA),firm size (SIZE) and Big 4 auditor (BIG4). The modelincludes firm and year fixed effects. Robust t statisticscorrected for clustering at the firm level are presented inparentheses.* p < 0.05, ** p < 0.01, *** p < 0.001
26

Stevens (2020)
4.4 Robustness check
To examine the validity of my results additional robustness tests are conducted. These tests evaluate the
sensitivity of the results to the change over time, an alternative measure of CSR, the difference between low
and high CSR performance groups, country fixed effects, and a different approach to address endogeneity.
4.4.1 Change of time
Although the main model mostly shows insignificant effects, the strength of the effect might still have
increased over time. As mentioned before, the CSR and tax avoidance have increased in importance over
the years. This could have led to a significant effect in the latest year(s), which is currently overshadowed
by a long time frame of insignificance. To test whether the strength of this relationship has increased,
an interaction term is added to the main model, which is the standardised value of change over time
multiplied by the standardised values of the performance. The results for the CSR performance and its
subgroups are presented in Table 8. The interaction variable of the CSR performance (CSRPERF int.)
shows an insignificant relationships. A significantly negative relationship is shown between the interaction
term for management performance and the effective taxes rates (p <0.01 and p <0.05). Table 8 also shows
that the relationship between the interaction term for strategy performance and the book-tax difference
is significantly negative at a 5% level. These results imply a contrary effect than discussed; the relation-
ship between the management and strategy performances, and tax avoidance became less strong over time.
The strength of the effect also may have increased over time when researching the influence of competi-
tion, especially due to the globalisation, which has increased the market competition. The results of adding
an interaction of the standardised value of change over time, multiplied by the standardised values of CSR,
HHI and CSR x HHI, are shown in Table 9. The interaction variable CSRPERF int. and CSR x HHI
int. show only insignificant effects. The interaction variable HHI int. shows a positive significant effect in
relation to the LETR, which implies that the relationship between tax avoidance and competition became
stronger over time. Furthermore, a significantly positive result is presented between CSR performance
and the book-tax difference. However, as Williams (2015) points out, this effect can not be interpreted as
main effects in a model with interaction terms may have little meaning, or could be misleading.
27
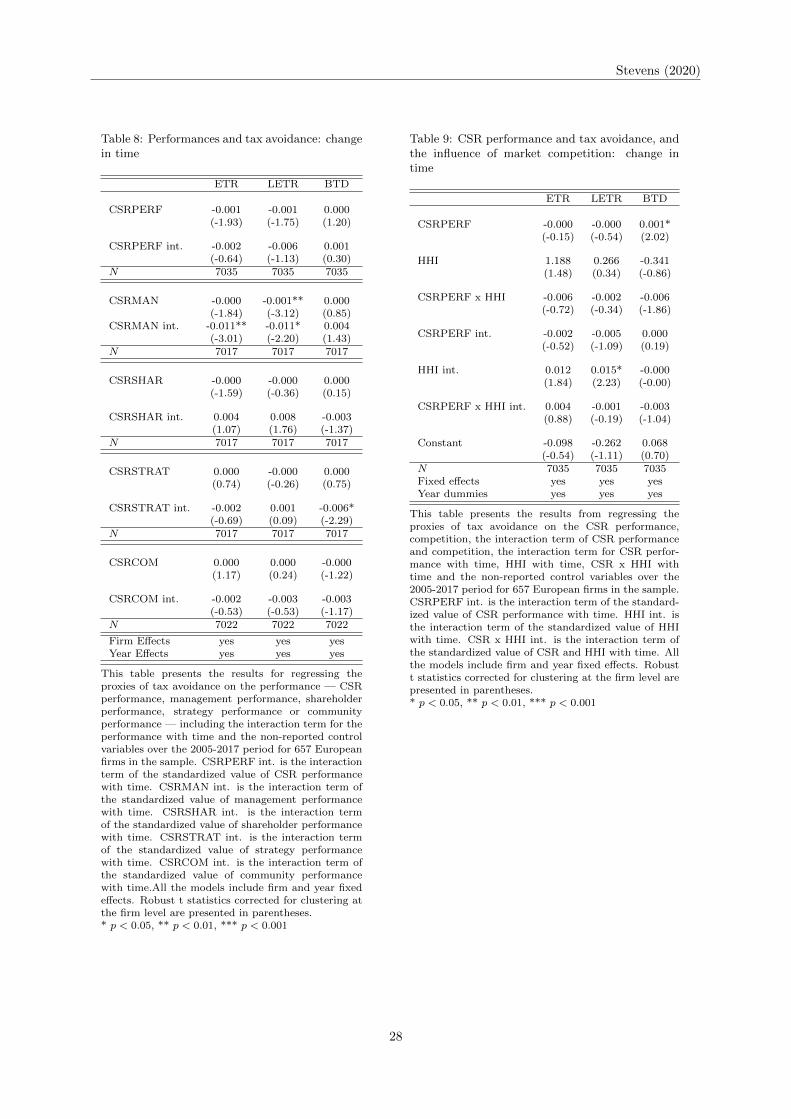
Stevens (2020)
Table 8: Performances and tax avoidance: changein time
ETR LETR BTD
CSRPERF -0.001 -0.001 0.000(-1.93) (-1.75) (1.20)
CSRPERF int. -0.002 -0.006 0.001(-0.64) (-1.13) (0.30)
N 7035 7035 7035
CSRMAN -0.000 -0.001** 0.000(-1.84) (-3.12) (0.85)
CSRMAN int. -0.011** -0.011* 0.004(-3.01) (-2.20) (1.43)
N 7017 7017 7017
CSRSHAR -0.000 -0.000 0.000(-1.59) (-0.36) (0.15)
CSRSHAR int. 0.004 0.008 -0.003(1.07) (1.76) (-1.37)
N 7017 7017 7017
CSRSTRAT 0.000 -0.000 0.000(0.74) (-0.26) (0.75)
CSRSTRAT int. -0.002 0.001 -0.006*(-0.69) (0.09) (-2.29)
N 7017 7017 7017
CSRCOM 0.000 0.000 -0.000(1.17) (0.24) (-1.22)
CSRCOM int. -0.002 -0.003 -0.003(-0.53) (-0.53) (-1.17)
N 7022 7022 7022
Firm Effects yes yes yesYear Effects yes yes yes
This table presents the results for regressing theproxies of tax avoidance on the performance — CSRperformance, management performance, shareholderperformance, strategy performance or communityperformance — including the interaction term for theperformance with time and the non-reported controlvariables over the 2005-2017 period for 657 Europeanfirms in the sample. CSRPERF int. is the interactionterm of the standardized value of CSR performancewith time. CSRMAN int. is the interaction term ofthe standardized value of management performancewith time. CSRSHAR int. is the interaction termof the standardized value of shareholder performancewith time. CSRSTRAT int. is the interaction termof the standardized value of strategy performancewith time. CSRCOM int. is the interaction term ofthe standardized value of community performancewith time.All the models include firm and year fixedeffects. Robust t statistics corrected for clustering atthe firm level are presented in parentheses.* p < 0.05, ** p < 0.01, *** p < 0.001
Table 9: CSR performance and tax avoidance, andthe influence of market competition: change intime
ETR LETR BTD
CSRPERF -0.000 -0.000 0.001*(-0.15) (-0.54) (2.02)
HHI 1.188 0.266 -0.341(1.48) (0.34) (-0.86)
CSRPERF x HHI -0.006 -0.002 -0.006(-0.72) (-0.34) (-1.86)
CSRPERF int. -0.002 -0.005 0.000(-0.52) (-1.09) (0.19)
HHI int. 0.012 0.015* -0.000(1.84) (2.23) (-0.00)
CSRPERF x HHI int. 0.004 -0.001 -0.003(0.88) (-0.19) (-1.04)
Constant -0.098 -0.262 0.068(-0.54) (-1.11) (0.70)
N 7035 7035 7035Fixed effects yes yes yesYear dummies yes yes yes
This table presents the results from regressing theproxies of tax avoidance on the CSR performance,competition, the interaction term of CSR performanceand competition, the interaction term for CSR perfor-mance with time, HHI with time, CSR x HHI withtime and the non-reported control variables over the2005-2017 period for 657 European firms in the sample.CSRPERF int. is the interaction term of the standard-ized value of CSR performance with time. HHI int. isthe interaction term of the standardized value of HHIwith time. CSR x HHI int. is the interaction term ofthe standardized value of CSR and HHI with time. Allthe models include firm and year fixed effects. Robustt statistics corrected for clustering at the firm level arepresented in parentheses.* p < 0.05, ** p < 0.01, *** p < 0.001
28

Stevens (2020)
4.4.2 Dichotomous dummy
The absence of a significant relationship could be a result from the performance distribution as well. As
is shown in Table 3, a mass of the CSR performance and its subgroups score around 51. For a test
of robustness, the sample will be segmented into corporate social responsible firms (the top quartile of
the performance) and noncorporate social responsible firms (the bottom quartile of the performance).
Considering only these two groups the following regression is performed:
TAit = α+ β1CSRdummyεit + β2LEVit + β3INV ENT + β4MKTBit
+ β5ROA+ β6SIZE + β7BIG4 + β8−21Y EAR+ β22 −6 79FIRM + εit. (8)
TAit = α+ β1CSRPERFdummyεit + β2HHIit + β3CSRPERFdummy ×HHI
+ β4LEVit + β5INV ENT + β6MKTBit + β7ROA+ β8SIZE + β9BIG4
+ β10−23Y EAR+ β24−682FIRM + εit. (9)
In equation 8, which tests hypothesis 1 and its sub-hypotheses, the CSRdummy can be replaced by
a dummy for the CSR performance, management performance, shareholder performance, strategy perfor-
mance or community performance. Equation 9 tests the second hypothesis. The dummy variable takes
the value of 0 for low performance rating (bottom 25%) and the value of 1 for high performance rating
(top 25%).
Table 10 and 11 presents the results for the regressions with a replacement of the performances with
the dummy variables. The replacement does not produce significance in any of the variables of interest.
29

Stevens (2020)
Table 10: Performances and tax avoidance:dichotomous dummy
ETR LETR BTD
D.CSRPERF -0.031 -0.024 -0.001(-1.95) (-1.51) (-0.14)
N 3517 3517 3517
D.CSRMAN -0.008 -0.029 0.003(-0.45) (-1.80) (0.30)
N 3508 3508 3508
D.CSRSHAR -0.029 -0.006 0.005(-1.89) (-0.34) (0.60)
N 3520 3520 3520
D.CSRSTRAT 0.052 0.026 -0.004(1.55) (0.67) (-0.26)
N 3499 3499 3499
D.CSRCOM 0.046 0.035 -0.004(1.52) (1.11) (-0.29)
N 3511 3511 3511
Firm Effects yes yes yesYear Effects yes yes yes
This table presents the results from regressingthe proxies of tax avoidance on the dummy forthe performance and the non-reported controlvariables over the 2005-2017 period for 657European firms in the sample. The indepen-dent variables — D.CSRPERF, D.CSRMAN,D.CSRSHAR, D.CSRSTRAT, D.CSRCOM —are a dummy variables, coded 1 if the firm isbelongs to the top 25% of the sample based onperformance, and coded 0 if the firm is partof the bottom 25% of the sample. The modelinclude firm and year fixed effects. Robust tstatistics corrected for clustering at the firmlevel are presented in parentheses.* p < 0.05, ** p < 0.01, *** p < 0.001
Table 11: CSR performance and tax avoidance,and the influence of market competition: dichoto-mous dummy
ETR LETR BTD
D.CSRPERF -0.018 -0.043 0.018(-0.49) (-1.57) (1.08)
HHI -0.068 -0.690 -1.187**(-0.08) (-0.95) (-2.94)
D.CSRPERF x HHI -0.176 0.272 -0.244(-0.35) (0.80) (-1.33)
N 3517 3517 3517Firm Effects yes yes yesYear Effects yes yes yes
This table presents the results from regressing theproxies of tax avoidance on the dummy for overallCSR performance and other control variables over the2005-2017 period for 657 European firms in the sample.The independent variable, D.CSRPERF, is a dummyvariable, coded 1 if the firm is belongs to the top 25%of the sample based on CSR performance, and coded0 if the firm is part of the bottom 25% of the sample.The model include firm and year fixed effects. Robustt statistics corrected for clustering at the firm level arepresented in parentheses.* p < 0.05, ** p < 0.01, *** p < 0.001
4.4.3 Sub-sample analysis: low and high level performance
The sample that is used in this thesis contains companies that perform either worse or better than av-
erage based on their performance. The relationship between tax avoidance and the performance could
differ between these two groups. For example, companies that perform better than average might be more
actively aware of their tax avoidance behaviour. To test if this is the case, the sample will be divided
into two sub-samples. The first sub-sample is containing companies with lower than average performance
(bottom 50% of the sample). The second sub-sample is containing the companies with a higher than
average performance (top 50% of the sample).
Table 12 presents the results for the sub-sample analyses. Insignificant coefficients between the tax
avoidance proxies and the CSR performance are found. Regarding the sub-hypotheses, only the strategy
performance shows some significant relations. First of all, there is a significant negative relation between
30

Stevens (2020)
the long-term effective tax rate and the low level strategy performance at a 0.01% level. This suggests
that companies who perform below the average based on strategy performance and invest in strategy per-
formance (higher performance score, but below the average) are more likely to avoid tax (lower LETR).
Secondly, a positively significant relation between book-tax difference and the high level strategy per-
formance is found (p <0.01), suggesting that companies who perform above average based on strategy
performance are more likely to avoid tax.
Table 12: Performances and tax avoidance: low and high level performance
ETR LETR BTDLOW HIGH LOW HIGH LOW HIGH
CSR <mean CSR >mean CSR <mean CSR >mean CSR <mean CSR >mean
CSRPERF -0.000 -0.000 -0.001 -0.001 -0.000 0.001(-0.79) (-0.07) (-1.29) (-1.14) (-0.52) (1.94)
N 3516 3519 3516 3519 3516 3519
CSRMAN -0.000 -0.000 -0.001 0.000 -0.000 0.000(-1.27) (-0.14) (-1.75) (0.46) (-0.60) (0.68)
N 3506 3511 3506 3511 3506 3511
CSRSHAR -0.000 -0.000 0.000 -0.000 0.000 0.000(-1.00) (-0.92) (1.21) (-1.02) (0.97) (0.51)
N 3470 3547 3470 3547 3470 3547
CSRSTRAT -0.001 -0.001 -0.001* -0.000 -0.000 0.000*(-1.43) (-1.95) (-2.00) (-0.49) (-0.37) (1.98)
N 3505 3512 3505 3512 3505 3512
CSRCOM -0.000 0.000 -0.000 0.000 -0.000 0.000(-0.51) (0.42) (-0.35) (0.19) (-1.21) (0.27)
N 3511 3511 3511 3511 3511 3511
Firm Effects yes yes yes yes yes yesYear Effects yes yes yes yes yes yes
This table presents the results from regressing the proxies of tax avoidance on either the low or highperformance and the non-reported control variables over the 2005-2017 period for 657 European firms in thesample. The independent variables — CSR performance, management performance, shareholder performance,strategy performance, community performance — are divided into two groups, the bottom 50% of the sample(LOW) and the top 50% of the sample (HIGH). The model includes firm and year fixed effects. Robust tstatistics corrected for clustering at the firm level are presented in parentheses.* p < 0.05, ** p < 0.01, *** p < 0.001
4.4.4 Country fixed effects
It is discussed in Section 3.4.2 that in order to deal with endogeneity a fixed effects model is used with firm
and year fixed effects. Models including these fixed effects are used throughout the main analyses and the
first three robustness tests. In the study sample, however, different countries are represented. By making
use of country fixed effects, systematic differences in the financial environment across countries (such as
tax laws) can be captured. As a robustness test, country fixed effects will be implemented in the model
instead of firm fixed effects. Controlling for systematic differences between countries may deal correctly
with the endogeneity in the model.
31

Stevens (2020)
The results of the fixed effects model with country and year fixed effects for hypothesis 1 and its
sub-hypotheses are depicted in Table 13. The results for hypothesis 2 are presented in Table 14. In the
models, the robust standard errors are used to counter the effects on the model caused by autocorrelation
and heteroskedasticity. Furthermore, error term is clustered at a country level.
The results presented in Table 13 indicate a significant negative relationship between the effective tax
rate and the CSR performance, and between long-term effective tax rate and strategy performance. These
results however do contradict the hypotheses, as the results suggest that firms that are investing more
in the performances concerning CSR, are more likely to avoid tax. However, a positive relation is found
between the shareholder performance and the long-term effective tax rate, and a negative relation is found
between book-tax difference and community performance. These results are in line with the hypotheses,
suggesting that companies that are investing more in performances concerning CSR, are less likely to avoid
tax.
Thus the results suggest that companies that invest more in CSR performance and strategy perfor-
mance, are more likely to avoid tax. Contrary to this, companies that invest more in shareholder perfor-
mance and community performance are less likely to avoid tax. For management performance, however,
no evidence for an effect is found.
The results in Table 14 presents no significant effects for the interaction term of CSR performance
and competition. Positive significant effects are show between the effective tax rates and the competition
proxy, however, this effect cannot be interpreted as main effects in a model with interaction terms may
have little meaning, or could be misleading (Williams, 2015).
Using country fixed effects as a robustness check, suggest that the main model with firm fixed effects
has omitted variable bias.
32

Stevens (2020)
Table 13: Performances and tax avoidance: coun-try fixed effects
ETR LETR BTD
CSRPERF -0.001** -0.001 0.000(-2.85) (-1.48) (0.79)
N 7035 7035 7035
CSRMAN -0.000 -0.000 -0.000(-0.17) (-0.16) (-0.52)
N 7017 7017 7017
CSRSHAR 0.000 0.000** -0.000(0.70) (2.99) (-1.09)
N 7017 7017 7017
CSRSTRAT -0.000 -0.000* -0.000(-0.26) (-2.30) (-0.63)
N 7017 7017 7017
CSRCOM 0.000 0.000 -0.001***(1.10) (1.11) (-3.86)
N 7022 7022 7022
Country Effects yes yes yesYear Effects yes yes yes
This table presents the results from regressing theproxies of tax avoidance on the performance — CSRperformance, management performance, shareholderperformance, strategy performance or communityperformance — and the non-reported control variablesover the 2005-2017 period for 657 European firms inthe sample. The models include country and yearfixed effects. Robust t statistics corrected for cluster-ing at the country level are presented in parentheses.* p < 0.05, ** p < 0.01, *** p < 0.001
Table 14: CSR performance and tax avoidance,and the influence of market competition: countryfixed effects
ETR LETR BTD
CSRPERF -0.000 0.000 0.000(-0.08) (0.54) (0.51)
HHI 1.114*** 1.349* 0.045(4.24) (2.38) (0.20)
CSRPERF x HHI -0.008 -0.013 -0.001(-1.51) (-1.53) (-0.17)
N 7035 7035 7035Country Effects yes yes yesYear Effects yes yes yes
This table presents the results from regressing theproxies of tax avoidance on the CSR performance,competition and the interaction term of CSR per-formance and competition, and the non-reportedcontrol variables over the 2005-2017 period for 657European firms in the sample. The model includescountry and year fixed effects. Robust t statisticscorrected for clustering at the country level arepresented in parentheses.* p < 0.05, ** p < 0.01, *** p < 0.001
4.4.5 Instrumental Variable Method
In this section, the fifth and last robustness check will be conducted by applying another commonly
used technique: the instrumental variable (IV) method via a two-stage least squares (2SLS) regression.
This is done since potential endogeneity, even though the fixed effects model is applied, could still have
biased the results and causing the insignificance. By using the IV method, missing or unknown variables
that vary with time and are correlated with the explanatory variables can also be considered (Angrist &
Pischke, 2008; Wooldridge, 2015). The IV approach requires an instrument, which will be added to the
equation, that is correlated to a firm’s CSR performance but not correlated to its tax-avoidance behaviour
(Wooldridge, 2015). A good instrument, z, has to satisfy the following three conditions:
1. The relevance assumption: z has a causal effect on the exposure X.
2. The independence assumption: z does not share common causes with the outcome Y.
3. The exclusion restriction: z affects the outcome Y only through X (Lousdal, 2018; Hernan, Miguel
A., 2008).
The first condition is the only assumption that is verifiable, and it requires that the proposed instrument
and the performances concerning CSR are associated. Simply the existence of an association is required
33

Stevens (2020)
to meet the assumption, but a weak association may lead to a vulnerability of the analysis due to weak
instrument’s bias.16 Therefore, strong IVs are generally preferred over weak instruments (Labrecque &
Swanson, 2018). The satisfaction of the other two conditions can only be examined by analysing informa-
tion on the subject matter (Wooldridge, 2015; Labrecque & Swanson, 2018).
In line with prior studies (Cui et al., 2018; Liu et al., 2019), the one-period lagged CSR performance
is used as the IV for the 2SLS regression.17,18 To ensure that the applied IV is a strong instrument, the
three conditions have to be tested.
The first condition, the relevance assumption, is present if there is an association between the IV and
the independent variable. It can be assumed that a lagged variable has a causal effect on the present
variable, since the former variable is based on the latter one. Therefore, it is likely that this assumption
will be validated. During the application of the IV, it will be possible to verify if the relevance assumption
holds and if the IV is a weak or strong instrument.
The second condition, the independence assumption, is met when there is no confounding of the effect
of the one-period lagged CSR performance on tax avoidance. Therefore, the instrument has to be random.
These variables occur in different time frames, therefore enough randomization between these two variables
exists to accept this assumption.
To satisfy the exclusion restriction, often the most difficult one to prove, the lagged IV should affect
tax avoidance only through the CSR performance variable; in other words, the lagged IV can not have a
direct influence on the CSR performance variable (Lousdal, 2018; University of Manitoba, n.d.). In the
first instance, since the lagged variable occurred in the past, and thus should not be correlated with the
error term in the present, it seems that the lagged variable is exogenous (Hyndman, 2010) and therefore
meets this restriction. However, the present performance may be influenced by the past performance. This
is a potential weakness of the instrument that could influence the results of the 2SLS regression, and it
implies that the results should be carefully interpreted.
When performing the IV method, the sample, the tax-avoidance proxies, and the control variables used
in the main regression (Section 3.4.3) are used for this method as well. Moreover, the firms and year fixed
effects are also included. The IV method is applied via the 2SLS regression which entails two stages. In
the first stage, predicted values for the performances concerning CSR will be calculated with the use of
the IV, the one-period lagged performance. For hypothesis 1, its sub-hypotheses, and hypothesis 2, the
first stage will be estimated as follows.
CSRit = α+ β1L.CSRεit + β2LEVit + β3INV ENT + β4MKTBit
+ β5ROA+ β6SIZE + β7BIG4 + β8−21Y EAR+ β22 −6 79FIRM + εit, (10)
16 Either through finite-sample limitations or by increasing biases due to violations of other assumptions.17 In some studies (Jo & Harjoto, 2011; Akben-Selcuk, 2019; El Ghoul et al., 2011; Benlemlih & Bitar, 2018; Kim et al.,
2014) firm age or the industry-year average of overall CSR scores are used as an instrument. The variable, firm age, failedthe relevance assumption, and thus could not be used in this thesis. The industry-year average of the performances,based on the 48 Fama-French industries, fails the over-identification test (Hansen J statistics) and thus not used.
18 The application of a lagged explanatory variable as an IV is a commonly used approach (Reed, 2015; Wang & Bellemare,2019). Research using a lagged instrument often appear in top journals including the Journal of Finance and theEconomic Journal (Reed, 2015).
34
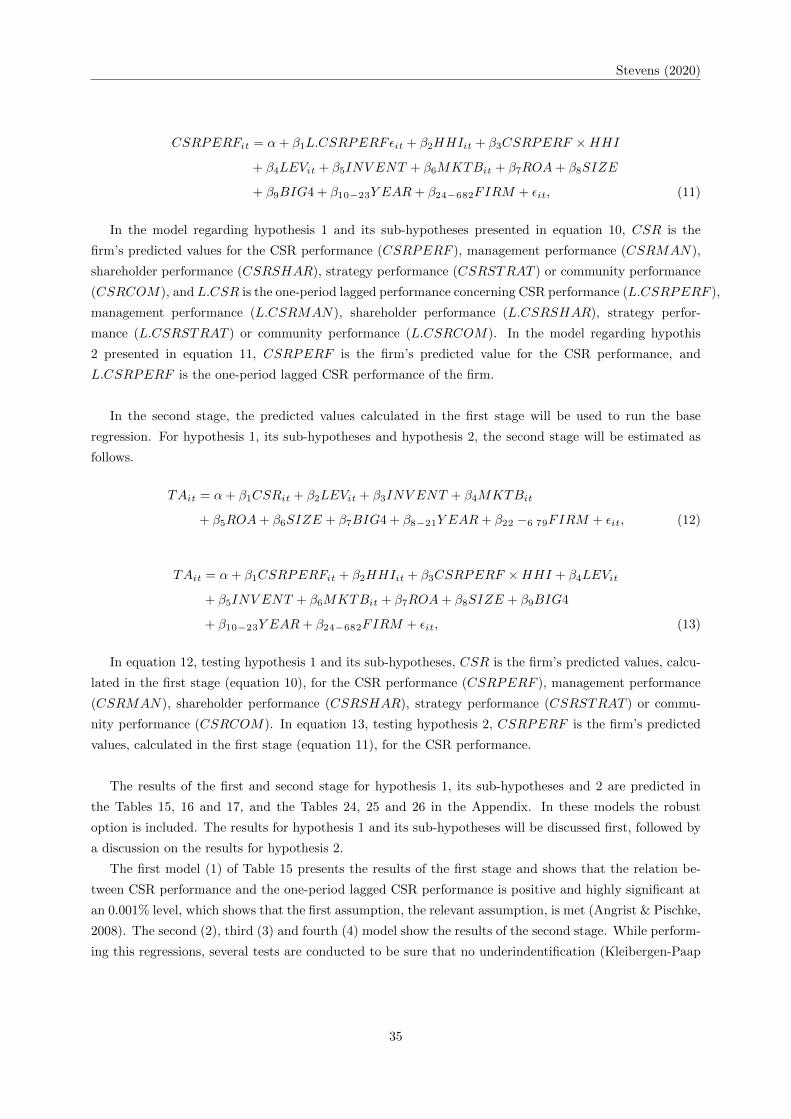
Stevens (2020)
CSRPERFit = α+ β1L.CSRPERFεit + β2HHIit + β3CSRPERF ×HHI
+ β4LEVit + β5INV ENT + β6MKTBit + β7ROA+ β8SIZE
+ β9BIG4 + β10−23Y EAR+ β24−682FIRM + εit, (11)
In the model regarding hypothesis 1 and its sub-hypotheses presented in equation 10, CSR is the
firm’s predicted values for the CSR performance (CSRPERF ), management performance (CSRMAN),
shareholder performance (CSRSHAR), strategy performance (CSRSTRAT ) or community performance
(CSRCOM), and L.CSR is the one-period lagged performance concerning CSR performance (L.CSRPERF ),
management performance (L.CSRMAN), shareholder performance (L.CSRSHAR), strategy perfor-
mance (L.CSRSTRAT ) or community performance (L.CSRCOM). In the model regarding hypothis
2 presented in equation 11, CSRPERF is the firm’s predicted value for the CSR performance, and
L.CSRPERF is the one-period lagged CSR performance of the firm.
In the second stage, the predicted values calculated in the first stage will be used to run the base
regression. For hypothesis 1, its sub-hypotheses and hypothesis 2, the second stage will be estimated as
follows.
TAit = α+ β1CSRit + β2LEVit + β3INV ENT + β4MKTBit
+ β5ROA+ β6SIZE + β7BIG4 + β8−21Y EAR+ β22 −6 79FIRM + εit, (12)
TAit = α+ β1CSRPERFit + β2HHIit + β3CSRPERF ×HHI + β4LEVit
+ β5INV ENT + β6MKTBit + β7ROA+ β8SIZE + β9BIG4
+ β10−23Y EAR+ β24−682FIRM + εit, (13)
In equation 12, testing hypothesis 1 and its sub-hypotheses, CSR is the firm’s predicted values, calcu-
lated in the first stage (equation 10), for the CSR performance (CSRPERF ), management performance
(CSRMAN), shareholder performance (CSRSHAR), strategy performance (CSRSTRAT ) or commu-
nity performance (CSRCOM). In equation 13, testing hypothesis 2, CSRPERF is the firm’s predicted
values, calculated in the first stage (equation 11), for the CSR performance.
The results of the first and second stage for hypothesis 1, its sub-hypotheses and 2 are predicted in
the Tables 15, 16 and 17, and the Tables 24, 25 and 26 in the Appendix. In these models the robust
option is included. The results for hypothesis 1 and its sub-hypotheses will be discussed first, followed by
a discussion on the results for hypothesis 2.
The first model (1) of Table 15 presents the results of the first stage and shows that the relation be-
tween CSR performance and the one-period lagged CSR performance is positive and highly significant at
an 0.001% level, which shows that the first assumption, the relevant assumption, is met (Angrist & Pischke,
2008). The second (2), third (3) and fourth (4) model show the results of the second stage. While perform-
ing this regressions, several tests are conducted to be sure that no underindentification (Kleibergen-Paap
35

Stevens (2020)
rk LM test), weak identification (Cragg-Donald Wald test and the Kleibergen-Paap rk Wald F test)19 or
overindentification (Hansen J statistic) exists. All the three models pass these tests, which suggest that
the IV is a strong instrument. The results show a negative significant relationship between the effective
tax rates and the CSR performance. This is suggesting that, contrary to my hypothesis, firms that are
investing more in CSR are more likely to avoid taxes. More contradicting results are found in Table 16 for
the management performance, which has a negative significant relation with the long-term effective tax
rate. This suggests that firms with higher invests in management performance, are more likely to avoid
taxation. Regarding the rest of the sub-hypotheses, no significant results are found as shown in Tables 24,
25 and 26 in the Appendix.
In the first model (1) of Table 17, the results show that the relevance assumption is met as the relation
between CSR performance and the one-period lagged CSR performance is (positive) highly significant
at an 0.001% level (Angrist & Pischke, 2008). The second (2), third (3) and fourth (4) model show
the results of the second stage. The several tests, done to be sure that no underindentification, weak
identification or overindentification exists, are passed, suggesting that the IV is a strong instrument. A
significantly positive relation is presented between the effective tax rates and the interaction term, sug-
gesting that the relationship - contrary to my hypothesis - between CSR and tax avoidance gets stronger
(the effect of CSR on tax avoidance increases) as the competition decreases (HHI gets higher). The results
show a negative significant relationship between the effective tax rates and the CSR performance as well
as with competition. However, as mentioned in Section 4.4.1, no conclusion can be draw from these results.
19 As the results show, the Kleibergen-Paap rk Wald F statistic is, however, substantially higher for the subgroup perfor-mances than for the CSR performance.
36

Stevens (2020)
Table 15: CSR performance and tax avoidance: instrumentalvariable method
CSRPERF ETR LETR BTD(1) (2) (3) (4)
CSRPERF -0.004* -0.006*** -0.000(-2.57) (-3.72) (-0.47)
LEV 0.617 -0.090 -0.013 0.007(0.26) (-1.49) (-0.18) (0.20)
INVENT -7.856 -0.107 -0.229 -0.303***(-1.26) (-0.88) (-1.69) (-3.77)
MKTB -0.005 0.001 -0.000 -0.002(-0.06) (0.57) (-0.15) (-1.46)
ROA 10.789*** -0.819*** -0.657*** 0.109(3.67) (-8.04) (-6.69) (1.91)
SIZE 0.132 0.026* 0.054*** 0.002(0.25) (2.40) (3.60) (0.30)
BIG4 0.483 -0.011 -0.042 0.003(0.62) (-0.61) (-1.50) (0.42)
L.CSRPERF 0.173***(11.07)
Constant 35.145*** 0.186 -0.064 0.033(4.20) (0.98) (-0.27) (0.34)
N 6840 7034 7034 7034adj. R2 0.086 0.051 0.062 0.037Firm Effects yes yes yes yesYear Effects yes yes yes yesKleibergen-Paap rk Wald F statistic 122.55
This table presents the results of the IV method to correct for endo-geneity. The results are shown from the Instrumental Variable (IV)method that control for the endogeneity of CSR performance. Oneinstrument is employed: the one-period lagged CSR performance.Model (1) shows the first stage regression (where the dependentvariable is the overall CSR performance). In models (2), (3) and (4)presents the results of the second stage regression (2SLS). The modelincludes firm and year fixed effects. Also the Kleibergen-Paap rkWald F statistic is shown in this table. Robust t statistics correctedfor clustering at the firm level are presented in parentheses.* p < 0.05, ** p < 0.01, *** p < 0.001
37

Stevens (2020)
Table 16: Management performance and tax avoidance: in-strumental variable method
CSRMAN ETR LETR BTD(1) (2) (3) (4)
CSRMAN -0.000 -0.001** -0.000(-0.17) (-2.97) (-0.54)
LEV 2.412 -0.092 -0.010 0.008(0.62) (-1.51) (-0.14) (0.25)
INVENT -7.890 -0.077 -0.194 -0.303***(-1.11) (-0.63) (-1.44) (-3.76)
MKTB -0.105 0.001 -0.001 -0.002(-0.80) (0.53) (-0.27) (-1.45)
ROA 12.772** -0.858*** -0.703*** 0.106(2.72) (-8.37) (-7.15) (1.88)
SIZE 0.468 0.026* 0.054*** 0.002(0.48) (2.34) (3.59) (0.31)
BIG4 -1.082 -0.013 -0.049 0.003(-0.74) (-0.68) (-1.72) (0.34)
L.CSRMAN 0.363***(25.61)
Constant 22.946 0.022 -0.258 0.022(1.47) (0.12) (-1.09) (0.23)
N 6821 7016 7016 7016adj. R2 0.165 0.050 0.061 0.037Firm Effects yes yes yes yesYear Effects yes yes yes yesKleibergen-Paap rk Wald F statistic 655.910
This table presents the results of the IV method to correct forendogeneity. The results are shown from the Instrumental Variable(IV) method that control for the endogeneity of managementperformance. One instrument is employed: the one-period laggedmanagement performance. Model (1) shows the first stageregression (where the dependent variable is the managementperformance). In models (2), (3) and (4) presents the results ofthe second stage regression (2SLS). The model includes firm andyear fixed effects. Also the Kleibergen-Paap rk Wald F statistic isshown in this table. Robust t statistics corrected for clustering atthe firm level are presented in parentheses.* p < 0.05, ** p < 0.01, *** p < 0.001
38

Stevens (2020)
Table 17: CSR performance and tax avoidance, and the influenceof market competition: instrumental variable method
CSRPERF ETR LETR BTD(1) (2) (3) (4)
CSRPERF -0.013* -0.021*** -0.001(-2.24) (-3.60) (-0.37)
HHI -472.391*** -5.790* -10.556*** -1.093(-18.06) (-2.09) (-3.77) (-0.80)
CSR x HHI 10.608*** 0.131* 0.219*** 0.012(21.95) (2.14) (3.58) (0.39)
LEV 0.058 -0.089 0.019 0.005(0.05) (-1.44) (0.26) (0.14)
INVENT -2.807 -0.168 -0.264 -0.310***(-0.98) (-1.37) (-1.84) (-3.68)
MKTB -0.004 0.001 -0.000 -0.002(-0.10) (0.49) (-0.19) (-1.31)
ROA 3.201 -0.783*** -0.593*** 0.100(1.62) (-7.56) (-5.96) (1.72)
SIZE 0.219 0.031** 0.058*** -0.000(0.91) (2.83) (3.80) (-0.05)
BIG4 -0.187 -0.011 -0.055 0.000(-0.45) (-0.60) (-1.85) (0.02)
L.CSRPERF 0.044***(5.57)
Constant 39.287*** 0.507 0.606 0.147(9.97) (1.66) (1.86) (0.99)
N 6840 6840 6840 6840adj. R2 0.784 0.048 0.058 0.040Firm Effects yes yes yes yesYear Effects yes yes yes yesKleibergen-Paap rk Wald F statistic 31.013
This table presents the results of the IV method to correct forendogeneity. The results are shown from the Instrumental Variable(IV) method that control for the endogeneity of CSR performance.One instrument is employed: the one-period lagged CSR performance.Model (1) shows the first stage regression (where the dependentvariable is the overall CSR performance). In models (2), (3) and (4)presents the results of the second stage regression (2SLS). The modelincludes firm and year fixed effects. Also the Kleibergen-Paap rk WaldF statistic is shown in this table. Robust t statistics corrected forclustering at the firm level are presented in parentheses.* p < 0.05, ** p < 0.01, *** p < 0.001
39

Stevens (2020)
5 Conclusion
5.1 Conclusion and discussion
In this thesis, one of the first attempts is provided to investigate the relationship between CSR and tax
avoidance on a European scale, and the influence of market competition on this relation. The relationship
between CSR and tax avoidance is supported on the one hand by the shareholder and stakeholder theory
when assuming a negative relation, and on the other hand, when a positive relation is assumed, by the
idea that tax payments detract from social welfare and risk management. Furthermore, due to advantages
that can be gained over competitors by accommodating market demand, market competition could have
its influence on this relationship. In this study, the CSR performance has been tested, as well as four
subgroups: management performance, shareholder performance, strategy performance and community
performance. To perform the study, a fixed effects model with year and firm fixed effects is applied on
a sample of 657 firms with observations over a time period of 2005 - 2017. To capture the effect of
competition, an interaction term between CSR and competition is added to the model. Moreover, several
tests are done to check the robustness of the results such as country fixed effects and the instrumental
variable (IV) method. When applying the IV method, the one-period lagged performance is used as the
instrument.
Using the main model with firm and year fixed effects, there is no evidence found for a relationship
between the CSR performance and tax avoidance as the results are insignificant. However, when country
fixed effects and the IV method are used as robustness checks, a negative significant relationship is shown.
This suggests that a model with firm fixed effects has omitted variable bias. Upon further investigation
into CSR, a positive relationship is found between the management performance and tax avoidance. The
robustness of this result is shown when using the IV method as well. The shareholder performance, the
strategy performance, and the community performance mainly show insignificant results in combination
with tax avoidance. When tested for robustness, these performances do show significant results when the
country fixed effects are included. Furthermore, in the main analysis, including firm and year fixed effects,
market competition has an insignificant effect on the relationship between CSR and tax avoidance. How-
ever, when the IV method is applied as a robustness check, a positive significant result is shown suggesting
that market competition makes the relation weaker.
While conducting the model with firm and year fixed effects, mainly insignificant results are found.
These results should not be misinterpreted; insignificant results do not prove that no relationship exists
between tax avoidance and CSR, or that the competition has no influence on this relationship. The
relationship and influence are simply not found in this study. A significant result might come up when,
for example, a bigger sample is used, or another methodology is applied. For example using country fixed
effect and an IV model.
Interestingly, the only relationship that shows significant results throughout the main analysis, is the
relation between the management performance and the long-term effective tax rate.The result suggests
that, contrary to the hypothesis, companies who are more committed and effective towards corporate
governance principles, are more likely to avoid tax. This result can be explained by the theory, discussed
in Section 2.3.2, that paying taxes can actually detract from social welfare. Companies may argue that
40

Stevens (2020)
avoiding taxes has a positive influence on its stakeholders, as it allows the company to invest in, for
example, job growth and innovation.
To deal with potential endogeneity after using the fixed effects model, the IV method is applied via a
2SLS regression. The results show more significant effects than the main analyses. However, it can not be
concluded that a relationship is present, as it is uncertain if the exclusion restriction is satisfied by the used
instrument, the one-period lagged performance. To meet the exclusion restriction, the present performance
can not be influenced by the past performance. In general, companies set out a certain strategy that they
want to follow, also regarding CSR investments. This strategy is mostly linked to the company’s profit.
When a company, such as Nike who highly values their CSR, earns the profit they need to continue their
strategy, there might be a link between, for example, the CSR performance of past year(s) and the current
year. Contrary to this, when a company does not earn the needed profit to pursue their strategy or earns
more, the CSR investment strategy might change and a link with the past might be non existing. Due to
the potential weakness of the instrument, the results should be carefully interpreted. This means that even
though a significant result is shown, this could also be the result of more missing or unknown variables.
5.2 Limitations and future research
As with any study, this thesis is prone to certain limitations. The first limitation is the data availability.
In this thesis, only the ASSET4 database is used to retrieve data on CSR. This database receives its
information of European companies on a voluntarily bases. This could give a sample bias, since mostly big
firms that probably care about CSR have this information and would be willing to share it. Moreover, from
the 8049 firms in the ASSET4 database only 1570 are European. The used sample consist of 657 companies,
since several firms did not share the data needed to calculate the tax avoidance proxies. Therefore, the
study is applied on a relatively small sample and with more simplified tax avoidance proxies. Secondly,
each tax avoidance proxy has its limitations. Even though different proxies have been used, performing this
study with alternative tax avoidance proxies might change the results. The third limitation of this study
is that no explicit distinction is made between the different European countries in the sample. Within
these countries tax and CSR policies could differ. Although, country fixed effects may partially capture
these differences, a case study per country would be more thorough. This limits the conclusions that can
be drawn from this study, since nothing can be said about about a country in specific or the tax-avoidance
behaviour of a specific firm. Finally, there is relatively little prior research on this topic, which complicates
the reliance on scientific literature.
Future research on the relationship between tax avoidance and CSR could look into a number of areas.
First of all, the scope of the research can be changed. Research could be conducted on the relationship
per European country, since each European country has its own policies regarding CSR investments and
taxation. It could be interesting, for example, to look more into European countries that are qualied as tax
heaven. Moreover, instead of looking at European countries, studies could also focus on emerging countries,
such as South Africa, which has a lot of regulation on CSR contrary to the European countries. Secondly,
the subgroups of CSR can be more extensively examined. In this thesis, signicant results are found for the
management performance. In future research, this relation could be more exploit. Furthermore, analyses
could be conducted on the other subgroups as well. Thirdly, a fixed effects model and an IV method
are applied in this thesis. However, another methodologies, such as a matching approach, or a dierent
41

Stevens (2020)
instrumental variable — when available — could also be used. Fourthly, only the inuence of market
competition on this relationship has been researched, however, more phenomena could potentially have an
inuence. For example, characteristics of CEO’s. Future research could look into these other phenomena.
In other words, still a lot is unknown about the relationship between CSR and tax avoidance.
42

Stevens (2020)
6 References
Adhikari, A., Derashid, C., & Zhang, H. (2006). Public policy, political connections, and effective tax
rates: Longitudinal evidence from malaysia. Journal of Accounting and Public policy , 25 (5), 574–595.
Akben-Selcuk, E. (2019). Corporate social responsibility and financial performance: The moderating role
of ownership concentration in turkey. Sustainability , 11 (13), 3643.
Angrist, J. D., & Pischke, J.-S. (2008). Mostly harmless econometrics: An empiricist’s companion.
Princeton university press.
Antonetti, P., & Anesa, M. (2017). Consumer reactions to corporate tax strategies: The role of political
ideology. Journal of Business Research, 74 , 1–10.
Armstrong, C. S., Blouin, J. L., Jagolinzer, A. D., & Larcker, D. F. (2015). Corporate governance,
incentives, and tax avoidance. Journal of Accounting and Economics, 60 (1), 1–17.
Asay, H. S., Hoopes, J. L., Thornock, J. R., & Wilde, J. H. (2018). Consumer responses to corporate tax
planning.
Austin, C. R., & Wilson, R. J. (2017). An examination of reputational costs and tax avoidance: Evidence
from firms with valuable consumer brands. The Journal of the American Taxation Association, 39 (1),
67–93.
Avi-Yonah, R. S. (2008). Corporate social responsibility and strategic tax behavior. In Tax and corporate
governance (pp. 183–198). Springer.
Barnett, M. L., & Salomon, R. M. (2006). Beyond dichotomy: The curvilinear relationship between social
responsibility and financial performance. Strategic management journal , 27 (11), 1101–1122.
Barnett, M. L., & Salomon, R. M. (2012). Does it pay to be really good? addressing the shape of the
relationship between social and financial performance. Strategic Management Journal , 33 (11), 1304–
1320.
Barrett, J. D. (2009). Corporate social responsibility and quality management revisited. The journal for
Quality and Participation, 31 (4), 24.
Bender, T. (2017). Tussen ethiek en wet: de derde weg. Weekblad fiscaal recht , 20 .
Benlemlih, M., & Bitar, M. (2018). Corporate social responsibility and investment efficiency. Journal of
Business Ethics, 148 (3), 647–671.
Blackburne, T., & Blouin, J. (2016). Understanding the informativeness of book-tax differences. Unpub-
lished Working Paper .
Cai, H., & Liu, Q. (2009). Competition and corporate tax avoidance: Evidence from chinese industrial
firms. The Economic Journal , 119 (537), 764–795.
Carroll, A. B. (1979). A three-dimensional conceptual model of corporate performance. Academy of
management review , 4 (4), 497–505.
43

Stevens (2020)
Carroll, A. B., et al. (1991). The pyramid of corporate social responsibility: Toward the moral management
of organizational stakeholders. Business horizons, 34 (4), 39–48.
Chen, S., Chen, X., Cheng, Q., & Shevlin, T. (2010). Are family firms more tax aggressive than non-family
firms? Journal of Financial Economics, 95 (1), 41–61.
Col, B., & Patel, S. (2019). Going to haven? corporate social responsibility and tax avoidance. Journal
of Business Ethics, 154 (4), 1033–1050.
Cui, J., Jo, H., & Na, H. (2018). Does corporate social responsibility affect information asymmetry?
Journal of Business Ethics, 148 (3), 549–572.
Dahlsrud, A. (2008). How corporate social responsibility is defined: an analysis of 37 definitions. Corporate
social responsibility and environmental management , 15 (1), 1–13.
Damgaard, J., Elkjaer, T., & Johannesen, N. (2003). Tax and corporate responsibility. Tax journal ,
695 (2), 1–4.
Davis, A. K., Guenther, D. A., Krull, L. K., & Williams, B. M. (2015). Do socially responsible firms pay
more taxes? The accounting review , 91 (1), 47–68.
Desai, M. A., & Dharmapala, D. (2005). Corporate tax avoidance and firm value. NBER Working paper
series(11241).
Desai, M. A., & Dharmapala, D. (2006). Corporate tax avoidance and high-powered incentives. Journal
of Financial Economics, 79 (1), 145–179.
Desai, M. A., & Dharmapala, D. (2008). Tax and corporate governance: an economic approach. In Tax
and corporate governance (pp. 13–30). Springer.
Djankov, S., Ganser, T., McLiesh, C., Ramalho, R., & Shleifer, A. (2010). The effect of corporate taxes
on investment and entrepreneurship. American Economic Journal: Macroeconomics, 2 (3), 31–64.
Dyreng, S. D., Hanlon, M., & Maydew, E. L. (2008). Long-run corporate tax avoidance. the accounting
review , 83 (1), 61–82.
Dyreng, S. D., Hanlon, M., & Maydew, E. L. (2010). The effects of executives on corporate tax avoidance.
The Accounting Review , 85 (4), 1163–1189.
Dyreng, S. D., Hoopes, J. L., & Wilde, J. H. (2016). Public pressure and corporate tax behavior. Journal
of Accounting Research, 54 (1), 147–186.
Eikon, T. R. (2018). Thomson reuters esg scores.
El Ghoul, S., Guedhami, O., Kwok, C. C., & Mishra, D. R. (2011). Does corporate social responsibility
affect the cost of capital? Journal of Banking & Finance, 35 (9), 2388–2406.
44

Stevens (2020)
European Parliament. (2015). Tax rulings and other measures similar in nature or effect. European
Parliament resolution of 25 November 2015 on tax ruling and other measures similar in nature of ef-
fect (2015/2066(INI)). http://www.europarl.europa.eu/doceo/document/TA-8-2015-0408 EN.pdf
?redirect. (Online; accessed 14 November 2019)
Fernandez-Kranz, D., & Santalo, J. (2010). When necessity becomes a virtue: The effect of product
market competition on corporate social responsibility. Journal of Economics & Management Strategy ,
19 (2), 453–487.
Flammer, C. (2015). Does product market competition foster corporate social responsibility? evidence
from trade liberalization. Strategic Management Journal , 36 (10), 1469–1485.
Friedman, M. (1970). The social responsibility of business is to increase its profits the new york times
magazine, september 13, 1970. The New York Times Company .
Gass, S. M., & Mackey, A. (2007). Input, interaction, and output in second language acquisition. Theories
in second language acquisition: An introduction, 175199 .
Godfrey, P. C., Merrill, C. B., & Hansen, J. M. (2009). The relationship between corporate social
responsibility and shareholder value: An empirical test of the risk management hypothesis. Strategic
management journal , 30 (4), 425–445.
Gomes, M. (2019). Does csr influence m&a target choices? Finance Research Letters, 30 , 153–159.
Graham, J. R. (2013). Do taxes affect corporate decisions? a review. In Handbook of the economics of
finance (Vol. 2, pp. 123–210). Elsevier.
Graham, J. R., Hanlon, M., Shevlin, T., & Shroff, N. (2014). Incentives for tax planning and avoidance:
Evidence from the field. The Accounting Review , 89 (3), 991–1023.
Guenther, D. A. (2014). Measuring corporate tax avoidance: Effective tax rates and book-tax differences.
Available at SSRN 2478952 .
Gupta, S., & Newberry, K. (1997). Determinants of the variability in corporate effective tax rates:
Evidence from longitudinal data. Journal of accounting and public policy , 16 (1), 1–34.
Hair., J. F., Black, W. C., Babin, B. J., & Anderson, R. E. (2014). Multivariate data analysis. Pearson.
Hanlon, M., & Heitzman, S. (2010). A review of tax research. Journal of accounting and Economics,
50 (2-3), 127–178.
Hanlon, M., & Slemrod, J. (2009). What does tax aggressiveness signal? evidence from stock price
reactions to news about tax shelter involvement. Journal of Public Economics, 93 (1-2), 126–141.
Hardeck, I., & Hertl, R. (2014). Consumer reactions to corporate tax strategies: Effects on corporate
reputation and purchasing behavior. Journal of business ethics, 123 (2), 309–326.
Hernan, Miguel A. (2008). Brief introduction to instrumental variables. http://www.bristol.ac.uk/
caite/workshopsandresearchmeetings/ivworkshop/introtoinstrumentalvariables.pdf. (On-
line; accessed 13 Februaryy 2020)
45

Stevens (2020)
Hines Jr, J. R. (2005). Corporate taxation and international competition. Ross School of Business
Paper(1026).
Hoi, C. K., Wu, Q., & Zhang, H. (2013). Is corporate social responsibility (csr) associated with tax
avoidance? evidence from irresponsible csr activities. The Accounting Review , 88 (6), 2025–2059.
Hope, O.-K., Ma, M. S., & Thomas, W. B. (2013). Tax avoidance and geographic earnings disclosure.
Journal of Accounting and Economics, 56 (2-3), 170–189.
Huatuco, L. D. H., Montoya-Torres, J. R., Shaw, N., Calinescu, A., Wang, Z., & Sarkis, J. (2013). Inves-
tigating the relationship of sustainable supply chain management with corporate financial performance.
International Journal of Productivity and Performance Management .
Huseynov, F., & Klamm, B. K. (2012). Tax avoidance, tax management and corporate social responsibility.
Journal of Corporate Finance, 18 (4), 804–827.
Hyndman, R. J. (2010). Public Communication.
Ioannou, I., & Serafeim, G. (2012). What drives corporate social performance? the role of nation-level
institutions. Journal of International Business Studies, 43 (9), 834–864.
James, S., J., H., Hite, P., & Toumi, M. (2001). Developing a tax compliance strategy for revenue services.
Bulletin for International Fiscal Documentation, 55 , 158–164.
Jo, H., & Harjoto, M. A. (2011). Corporate governance and firm value: The impact of corporate social
responsibility. Journal of business ethics, 103 (3), 351–383.
Jones, T. M. (1995). Instrumental stakeholder theory: A synthesis of ethics and economics. Academy of
management review , 20 (2), 404–437.
Kemper, J., Schilke, O., Reimann, M., Wang, X., & Brettel, M. (2013). Competition-motivated corporate
social responsibility. Journal of Business Research, 66 (10), 1954–1963.
Kim, Y., Li, H., & Li, S. (2014). Corporate social responsibility and stock price crash risk. Journal of
Banking & Finance, 43 , 1–13.
Labrecque, J., & Swanson, S. A. (2018). Understanding the assumptions underlying instrumental variable
analyses: a brief review of falsification strategies and related tools. Current epidemiology reports, 5 (3),
214–220.
Laguir, I., Stagliano, R., & Elbaz, J. (2015). Does corporate social responsibility affect corporate tax
aggressiveness? Journal of cleaner production, 107 , 662–675.
Lanis, R., & Richardson, G. (2012). Corporate social responsibility and tax aggressiveness: An empirical
analysis. Journal of Accounting and Public Policy , 31 (1), 86–108.
Lanis, R., & Richardson, G. (2013). Corporate social responsibility and tax aggressiveness: a test of
legitimacy theory. Accounting, Auditing & Accountability Journal .
46

Stevens (2020)
Lanis, R., & Richardson, G. (2015). Is corporate social responsibility performance associated with tax
avoidance? Journal of Business Ethics, 127 (2), 439–457.
Liu, N., Liu, C., Guo, Q., Da, B., Guan, L., & Chen, H. (2019). Corporate social responsibility and
financial performance: A quantile regression approach. Sustainability , 11 (13), 3717.
Ljungqvist, A., & Smolyansky, M. (2014). To cut or not to cut? on the impact of corporate taxes on
employment and income (Tech. Rep.). National Bureau of Economic Research.
Loebbecke, J., Eining, M., & Willingham, J. (1989). Auditors experience with material irregularities-
frequency, nature, and detectability. Auditing-A Journal of Practice Theory , 9 (1), 1-28.
Lousdal, M. L. (2018). An introduction to instrumental variable assumptions, validation and estimation.
Emerging themes in epidemiology , 15 (1), 1.
Lu, W., Chau, K., Wang, H., & Pan, W. (2014). A decade’s debate on the nexus between corporate
social and corporate financial performance: a critical review of empirical studies 2002–2011. Journal of
cleaner production, 79 , 195–206.
Luo, X., & Bhattacharya, C. B. (2006). Corporate social responsibility, customer satisfaction, and market
value. Journal of marketing , 70 (4), 1–18.
Manzon Jr, G. B., & Plesko, G. A. (2001). The relation between financial and tax reporting measures of
income. Tax L. Rev., 55 , 175.
Martin, J., Petty, W., & Wallace, J. (2009). Shareholder value maximization—is there a role for corporate
social responsibility? Journal of Applied Corporate Finance, 21 (2), 110–118.
Matsumura, E., & Tucker, R. (1992). Fraud detection: A theoretical foundation. Accounting review ,
753-782.
Meade, N. L., & Brown, R. M. (1995). Antitakeover devices and management efficiency: An empirical
study using accounting measures. Review of Quantitative Finance and Accounting , 5 (4), 375–392.
Minor, D., & Morgan, J. (2011). Csr as reputation insurance: Primum non nocere. California Management
Review , 53 (3), 40–59.
Moser, D. V., & Martin, P. R. (2012). A broader perspective on corporate social responsibility research
in accounting. The Accounting Review , 87 (3), 797–806.
Mucciarelli, F. M. (2010). Equal treatment of shareholders and european union law case note on the
decision “audiolux” of the european court of justice. European Company and Financial Law Review ,
7 (1), 158–167.
OECD. (2000). Equal Treatment of Shareholders and Protection of Their Rights. https://www.oecd.org/
daf/ca/corporategovernanceprinciples/1930044.pdf. (Online; accessed 14 January 2020)
OECD. (2015). G20/OECD Principles of corporate governance. https://www.oecd.org/daf/ca/
Corporate-Governance-Principles-ENG.pdf. (Online; accessed 5 December 2019)
47

Stevens (2020)
OECD. (2019). Glossary of Tax Terms. https://www.oecd.org/ctp/glossaryoftaxterms.htm. (Online;
accessed 20 November 2019)
Orlitzky, M., Schmidt, F. L., & Rynes, S. L. (2003). Corporate social and financial performance: A
meta-analysis. Organization studies, 24 (3), 403–441.
Pegg, D. (2017, Dec). The tech giants will never pay their fair share of taxes - unless we make them.
Opinion. Retrieved from https://www.theguardian.com/commentisfree/2017/dec/11/tech-giants
-taxes-apple-paradise-corporation-avoidance
Poret, S. (2014). Corporate-ngo partnerships in csr activities: why and how?
Porter, M. E., & Advantage, C. (1985). Creating and sustaining superior performance. Competitive
advantage, 167 .
Porter, M. E., & Kramer, M. R. (2006). The link between competitive advantage and corporate social
responsibility. Harvard business review , 84 (12), 78–92.
Prichard, W., Cobham, A., & Goodall, A. (2015). The ictd government revenue dataset. https://
opendocs.ids.ac.uk/opendocs/bitstream/handle/20.500.12413/10250/ICTD WP19.pdf.
Princen, S. (2012). Determining the impact of taxation on corporate financial decision-making. Reflets et
perspectives de la vie economique, 51 (3), 161–170.
Reed, W. R. (2015). On the practice of lagging variables to avoid simultaneity. Oxford Bulletin of
Economics and Statistics, 77 (6), 897–905.
Reverte, C., Gomez-Melero, E., & Cegarra-Navarro, J. G. (2016). The influence of corporate social
responsibility practices on organizational performance: evidence from eco-responsible spanish firms.
Journal of Cleaner Production, 112 , 2870–2884.
Rezaee, Z. (2005). Causes, consequences, and deterence of financial statement fraud. Critical Perspectives
on Accounting , 16 (3), 277–298.
Ruf, B. M., Meade-Christie, N. L., & Brown, R. M. (2004). The relationship between the existence of
antitakeover devices and corporate social performance. Academy of Accounting and Financial Studies
Journal , 8 (2), 9.
Schaefer, B. P. (2008). Shareholders and social responsibility. Journal of Business Ethics, 81 (2), 297–312.
Scholtens, B. (2008). A note on the interaction between corporate social responsibility and financial
performance. Ecological economics, 68 (1-2), 46–55.
Seitanidi, M. M., & Crane, A. (2009). Implementing csr through partnerships: Understanding the selection,
design and institutionalisation of nonprofit-business partnerships. Journal of business ethics, 85 (2),
413–429.
Sen, S., & Bhattacharya, C. B. (2001). Does doing good always lead to doing better? consumer reactions
to corporate social responsibility. Journal of marketing Research, 38 (2), 225–243.
48

Stevens (2020)
Shevlin, T. (2001). Corporate tax shelters and book-tax differences. Tax L. Rev., 55 , 427.
Sikka, P. (2010). Smoke and mirrors: Corporate social responsibility and tax avoidance. In Accounting
forum (Vol. 34, pp. 153–168).
Smith, H. J. (2003). The shareholders vs. stakeholders debate. MIT Sloan Management Review , 44 (4),
85–90.
Stickney, C. P., & McGee, V. E. (1982). Effective corporate tax rates the effect of size, capital intensity,
leverage, and other factors. Journal of accounting and public policy , 1 (2), 125–152.
Stock, J. H., & Watson, M. W. (2015). Introduction to econometrics (3rd updated edition). Age (X3),
3 (0.22).
University of Manitoba. (n.d.). An introduction to instrumental variables. https://umanitoba.ca/
faculties/health sciences/medicine/units/chs/departmental units/mchp/protocol/media/
Instrumental variables.pdf. (Online; accessed 1 March 2020)
Van Marrewijk, M. (2003). Concepts and definitions of csr and corporate sustainability: Between agency
and communion. Journal of business ethics, 44 (2-3), 95–105.
Voget, J. (2011). Relocation of headquarters and international taxation. Journal of Public Economics,
95 (9-10), 1067–1081.
Wang, Y., & Bellemare, M. F. (2019). Lagged variables as instruments.
Watson, L. (2015). Corporate social responsibility, tax avoidance, and earnings performance. The Journal
of the American Taxation Association, 37 (2), 1–21.
Werther Jr, W. B., & Chandler, D. (2005). Strategic corporate social responsibility as global brand
insurance. Business Horizons, 48 (4), 317–324.
Williams, R. (2015). Interaction effects between continuous variables. https://www3.nd.edu/~rwilliam/
stats2/l55.pdf.
Windsor, D. (2009). Tightening corporate governance. Journal of International Management , 15 (3),
306–316.
Wooldridge, J. M. (2015). Introductory econometrics: A modern approach: Nelson education. Scarborough,
ON, Canada.
Zimmerman, J. L. (1983). Taxes and firm size. Journal of accounting and economics, 5 , 119–149.
49

Stevens (2020)
7 Appendix
Table 18: Overview of the variables
Dependent variables Source DefinitionEffective tax rate Worldscope ETR Calculated by dividing the tax expenses by pre-tax book income.
The variable is winsorized at the 1st and 99th percentiles.Long-term effective taxrate
Worldscope LETR Calculated by dividing the five-year average total tax expense bythe five-year average total pre-tax book income. The variable iswinsorized at the 1st and 99th percentiles.
Book tax difference Worldscope BTD Calculated by difference between the pre-tax book income andthe taxable income scaled by total assets. The taxable income iscalculated by dividing the the current tax expense by the statutorytax rate per country per year. The variable is winsorized at the1st and 99th percentiles.
Independent variables DefinitionCSR Performance ASSET4 CSRPERF The overall CSR performance of the company is a proportion-
ately weighted measure of ten subgroups: resource use, emissions,innovation, workforce, human rights, community, product respon-sibility, management, shareholders, CSR strategy. This measurehas a value between the 0 and 100.
Management perfor-mance
ASSET4 CSRMAN The management performance measures a company’s commit-ment and effectiveness towards following best practice corporategovernance principles. This measure has a value between the 0and 100.
Shareholder perfor-mance
ASSET4 CSRSHAR The shareholder performance measures a company’s commitmentand effectiveness towards equal treatment of shareholders and theuse of anti-takeovers devices. This measure has a value betweenthe 0 and 100.
Strategy performance ASSET4 CSRSTRAT The CSR strategy performance reflects a company’s practices tocommunicate that it integrates the economic (financial), socialand environmental dimensions into its day-to-day decision-makingprocess. This measure has a value between the 0 and 100.
Community perfor-mance
ASSET4 CSRCOM The community performance measures the company’s commit-ment towards being a good citizen, protecting public health andrespecting business ethics. This measure has a value between the0 and 100.
Competition Worldscope HHI Herfindahl-Hirschman Index is calculated per industry by sum-ming up the squared market shares of the companies in the mar-ket. The HHI will be a number between 0 and 1.
Control variables DefinitionLeverage Worldscope LEV Leverage is calculated by dividing debt by total assets. The vari-
able is winsorized at the 1st and 99th percentiles.Inventory intensity Worldscope INV ENT Inventory intensity is calculated by dividing inventory by total
assets, and set to 0 if missing. The variable is winsorized at the1st and 99th percentiles.
Market-to-book ratio Worldscope MKTB Market-to-book ratio is calculated by dividing market value ofequity by book value of equity, and set to 1 if missing. The variableis winsorized at the 1st and 99th percentiles.
Return on Assets Worldscope ROA Return on assets is calculated by dividing pre-tax income by totalassets. The variable is winsorized at the 1st and 99th percentiles.
Size Worldscope SIZE Size is the natural logarithm of total assets. The variable is win-sorized at the 1st and 99th percentiles.
Audited by a big-fourfirm
Compustat BIG4 Audited by a big-four firm is a dummy variable, coded 1 if thefirm uses a big-four auditor; otherwise 0.
Year fixed effects Y EAR A year dummy to control for systematic differences that exist overtime.
Firm fixed effects FIRM A firm dummy to control for systematic differences that exist ata firm level.
50

Stevens (2020)
Table 19: The sample: countries
Country N
Austria 11
Belgium 18
Czech Republic 2
Denmark 23
Finland 22
France 81
Germany 73
Greece 12
Hungary 3
Ireland 10
Italy 34
Luxembourg 3
Norway 19
Poland 5
Portugal 10
Slovenia 1
Spain 29
Sweden 48
Switzerland 41
The Netherlands 24
United Kingdom 188
Total sample 657
This table presents the countries in which the companies of thesample are based. The sample contains 657 European compa-nies based in 21 different countries. Firms based in Turkey areexcluded from the sample.
Table 20: The sample: industries
Industry SIC CODE N
Mining 10-14 33
Construction 15-17 30
Manufacturing 20-39 315
Utilities 40-49 114
Wholesale trade 50-51 19
Retail trade 52-59 49
Services 70-89 97
Total sample 657
This table presents the industries in which the companies ofthe sample are active in. The sample contains 657 Europeancompanies active in 7 industries. Firms active in the financialindustry (SIC codes 6000-6999) are excluded from the sample.
51

Stevens (2020)
Table 21: Shareholder performance and tax avoid-ance
ETR LETR BTD
CSRSHAR -0.000 -0.000 0.000(-1.59) (-0.36) (0.14)
LEV -0.085 0.023 0.005(-1.38) (0.33) (0.14)
INVENT -0.107 -0.163 -0.304***(-0.88) (-1.17) (-3.68)
MKTB 0.001 -0.001 -0.002(0.41) (-0.33) (-1.47)
ROA -0.830*** -0.658*** 0.100(-8.10) (-6.69) (1.76)
SIZE 0.029** 0.049*** 0.000(2.67) (3.38) (0.07)
BIG4 -0.004 -0.047 0.001(-0.21) (-1.66) (0.10)
Constant -0.033 -0.275 0.045(-0.19) (-1.18) (0.48)
N 7017 7017 7017adj. R2 0.048 0.0520.028Firm Effects yes yes yesYear Effects yes yes yes
This table presents the results from regressing theproxies of tax avoidance on the shareholder perfor-mance and other control variables over the 2005-2017period for 657 European firms in the sample. Thecontrol variables are leverage (LEV), inventory inten-sity (INVENT), the market-to-book ratio (MKTB),return on assets (ROA), firm size (SIZE) and Big 4auditor (BIG4). The model includes firm and yearfixed effects. Robust t statistics corrected for cluster-ing at the firm level are presented in parentheses.* p < 0.05, ** p < 0.01, *** p < 0.001
Table 22: Strategy performance and tax avoid-ance
ETR LETR BTD
CSRSTRAT 0.000 -0.000 0.000(0.75) (-0.27) (0.81)
LEV -0.083 0.024 0.005(-1.36) (0.33) (0.15)
INVENT -0.110 -0.167 -0.301***(-0.90) (-1.22) (-3.64)
MKTB 0.001 -0.001 -0.002(0.43) (-0.32) (-1.48)
ROA -0.831*** -0.659*** 0.101(-8.13) (-6.70) (1.77)
SIZE 0.029** 0.049*** 0.000(2.66) (3.37) (0.08)
BIG4 -0.004 -0.047 0.001(-0.22) (-1.65) (0.06)
Constant -0.051 -0.272 0.039(-0.28) (-1.15) (0.42)
N 7017 7017 7017adj. R2 0.048 0.052 0.039Firm Effects yes yes yesYear Effects yes yes yes
This table presents the results from regressing theproxies of tax avoidance on the strategy performanceand other control variables over the 2005-2017 periodfor 657 European firms in the sample. The controlvariables are leverage (LEV), inventory intensity (IN-VENT), the market-to-book ratio (MKTB), returnon assets (ROA), firm size (SIZE) and Big 4 auditor(BIG4). The model includes firm and year fixedeffects. Robust t statistics corrected for clustering atthe firm level are presented in parentheses.* p < 0.05, ** p < 0.01, *** p < 0.001
52

Stevens (2020)
Table 23: Community performance and tax avoid-ance
ETR LETR BTD
CSRCOM 0.000 0.000 -0.000(1.16) (0.23) (-1.24)
LEV -0.082 0.023 0.004(-1.34) (0.32) (0.12)
INVENT -0.116 -0.165 -0.304***(-0.96) (-1.20) (-3.70)
MKTB 0.001 -0.001 -0.002(0.44) (-0.32) (-1.46)
ROA -0.831*** -0.658*** 0.099(-8.11) (-6.70) (1.75)
SIZE 0.029** 0.049*** 0.001(2.64) (3.38) (0.09)
BIG4 -0.004 -0.047 0.001(-0.24) (-1.64) (0.15)
Constant -0.050 -0.279 0.050(-0.28) (-1.19) (0.54)
N 7022 7022 7022adj. R2 0.048 0.052 0.040Firm Effects yes yes yesYear Effects yes yes yes
This table presents the results from regressing theproxies of tax avoidance on the community perfor-mance and other control variables over the 2005-2017period for 657 European firms in the sample. Thecontrol variables are leverage (LEV), inventory inten-sity (INVENT), the market-to-book ratio (MKTB),return on assets (ROA), firm size (SIZE) and Big 4auditor (BIG4). The model includes firm and yearfixed effects. Robust t statistics corrected for cluster-ing at the firm level are presented in parentheses.* p < 0.05, ** p < 0.01, *** p < 0.001
Table 24: Shareholder performance and tax avoidance: instru-mental variable method
CSRSHAR ETR LETR BTD(1) (2) (3) (4)
CSRSHAR 0.000 -0.000 0.000(0.26) (-0.52) (0.69)
LEV -3.248 -0.092 -0.016 0.008(-0.82) (-1.50) (-0.23) (0.25)
INVENT 23.817** -0.080 -0.174 -0.308***(2.66) (-0.65) (-1.28) (-3.77)
MKTB -0.198 0.001 -0.001 -0.002(-1.39) (0.54) (-0.22) (-1.41)
ROA 7.672 -0.860*** -0.714*** 0.104(1.57) (-8.38) (-7.29) (1.86)
SIZE 0.916 0.026* 0.053*** 0.002(1.08) (2.33) (3.54) (0.28)
BIG4 -1.476 -0.012 -0.046 0.003(-0.95) (-0.67) (-1.62) (0.41)
L.CSRSHAR 0.348***(25.07)
Constant 16.198 0.016 -0.303 0.012(1.19) (0.09) (-1.27) (0.13)
N 6821 7016 7016 7016adj. R2 0.135 0.050 0.059 0.037Firm Effects yes yes yes yesYear Effects yes yes yes yesKleibergen-Paap rk Wald F statistic 628.345
This table presents the results of the IV method to correct for endo-geneity. The results are shown from the Instrumental Variable (IV)method that control for the endogeneity of shareholder performance.One instrument is employed: the one-period lagged shareholderperformance. Model (1) shows the first stage regression (wherethe dependent variable is the shareholder performance). In models(2), (3) and (4) presents the results of the second stage regression(2SLS). The model includes firm and year fixed effects. Also theKleibergen-Paap rk Wald F statistic is shown in this table. Robustt statistics corrected for clustering at the firm level are presented inparentheses.* p < 0.05, ** p < 0.01, *** p < 0.001
53

Stevens (2020)
Table 25: Strategy performance and tax avoidance: instrumentalvariable method
CSRSTRAT ETR LETR BTD(1) (2) (3) (4)
CSRSTRAT 0.000 0.000 -0.000(0.96) (0.57) (-0.44)
LEV -2.426 -0.092 -0.015 0.008(-0.79) (-1.50) (-0.21) (0.23)
INVENT -21.825** -0.063 -0.174 -0.306***(-2.91) (-0.51) (-1.30) (-3.76)
MKTB 0.056 0.001 -0.001 -0.002(0.60) (0.50) (-0.21) (-1.43)
ROA -1.160 -0.855*** -0.713*** 0.104(-0.27) (-8.34) (-7.26) (1.85)
SIZE -0.637 0.026* 0.053*** 0.002(-1.09) (2.36) (3.53) (0.29)
BIG4 2.465* -0.013 -0.046 0.003(2.49) (-0.73) (-1.63) (0.41)
L.CSRSTRAT 0.420***(26.94)
Constant 38.694*** -0.012 -0.334 0.025(4.12) (-0.06) (-1.36) (0.27)
N 6821 7016 7016 7016adj. R2 0.242 0.050 0.059 0.037Firm Effects yes yes yes yesYear Effects yes yes yes yesKleibergen-Paap rk Wald F statistic 725.852
This table presents the results of the IV method to correct for endo-geneity. The results are shown from the Instrumental Variable (IV)method that control for the endogeneity of strategy performance. Oneinstrument is employed: the one-period lagged strategy performance.Model (1) shows the first stage regression (where the dependent variableis the strategy performance). In models (2), (3) and (4) presents theresults of the second stage regression (2SLS). The model includes firmand year fixed effects. Also the Kleibergen-Paap rk Wald F statistic isshown in this table. Robust t statistics corrected for clustering at thefirm level are presented in parentheses.* p < 0.05, ** p < 0.01, *** p < 0.001
54

Stevens (2020)
Table 26: Community performance and tax avoidance: instru-mental variable method
CSRCOM ETR LETR BTD(1) (2) (3) (4)
CSRCOM 0.000 0.000 -0.000(0.51) (0.21) (-1.23)
LEV -2.916 -0.091 -0.015 0.006(-0.87) (-1.49) (-0.21) (0.17)
INVENT 0.131 -0.077 -0.183 -0.300***(0.02) (-0.64) (-1.35) (-3.74)
MKTB -0.005 0.001 -0.000 -0.002(-0.06) (0.53) (-0.19) (-1.43)
ROA -2.565 -0.858*** -0.716*** 0.104(-0.63) (-8.36) (-7.29) (1.85)
SIZE 0.208 0.026* 0.052*** 0.002(0.33) (2.32) (3.53) (0.34)
BIG4 0.930 -0.013 -0.045 0.003(0.89) (-0.72) (-1.60) (0.41)
L.CSRCOM 0.387***(26.37)
Constant 21.708* 0.011 -0.315 0.027(2.19) (0.06) (-1.31) (0.28)
N 6827 7021 7021 7021adj. R2 0.268 0.050 0.059 0.037Firm Effects yes yes yes yesYear Effects yes yes yes yesKleibergen-Paap rk Wald F statistic 695.222
This table presents the results of the IV method to correct forendogeneity. The results are shown from the Instrumental Variable(IV) method that control for the endogeneity of communityperformance. One instrument is employed: the one-period laggedcommunity performance. Model (1) shows the first stage regression(where the dependent variable is the community performance). Inmodels (2), (3) and (4) presents the results of the second stageregression (2SLS). The model includes firm and year fixed effects.Also the Kleibergen-Paap rk Wald F statistic is shown in thistable. Robust t statistics corrected for clustering at the firm levelare presented in parentheses.* p < 0.05, ** p < 0.01, *** p < 0.001
55

![upervisor] - Erasmus University Thesis Repository](https://static.fdocuments.in/doc/165x107/61eee13f3b52e23f30712a61/upervisor-erasmus-university-thesis-repository.jpg)