ERA Shields Real Estate April Stat Pack
6
MONTHLY STAT PACK Data through April 30, 2013 MONTHLY RESIDENTIAL REVIEW Welcome to the ERA Shields Stat Pack. The intention for providing this infor- mation to you is to educate you on the current local real estate market so you can better make decisions for you and your family. Real estate markets vary from city to city as well as neighborhood to neighborhood. When the national media reports on how the real estate market is doing, it is reporting on national num- bers and it is likely very different from how your neighborhood is performing. You will find factual data within The Stat Pack from which you may draw your own conclusions. On the last page you will find a brief summary. QUICK FACTS ABOUT THE LAST 3 MONTHS ⇒ The number of Active Listings is very low but has level out ⇒ The number of Sales for over the past 3 months is up 25% from 2012 ⇒ Single Family Building Permits are up 377 units (61% increase) ⇒ The Average Inventory Level is down more than 30 days ⇒ The Average Sales Price and Median Sales Price both jumped 7% & 12% ⇒ 65% of sales in this quarter were under $250K compared to 71% in 2012 ⇒ Foreclosure starts are down 400 units (35%) in 2013 The data found within the ERA Shields Real Estate Stat Pack is based on information from the Pikes Peak REALTOR® Services Corporation (RSC) or its PPMLS. This content is deemed reliable; however RSC, PPMLS and ERA Shields Real Estate do not guarantee its accuracy. Data maintained by RSC does not reflect all real estate activity in the market. Additional sources include the Colorado Springs EDC, El Paso County Assessor, El Paso County Trustee, Colorado Springs HBA, PPAR, The Gazette, The CSBJ and NAR. This graph compares the number of homes on the market to the number of sales over the past 3 months for El Paso County and determines how many months it would take to sell through the current listing inventory. Most economists consider 6.0 months to be a balanced market.
-
Upload
eric-estrada -
Category
Documents
-
view
214 -
download
0
description
Monthly statistical report from ERA Shields Real Estate.
Transcript of ERA Shields Real Estate April Stat Pack

MONTHLY STAT PACK
Data through April 30, 2013
MONTHLY
RESIDENTIAL REVIEW
Welcome to the ERA Shields Stat Pack. The intention for providing this infor-
mation to you is to educate you on the current local real estate market so you can
better make decisions for you and your family. Real estate markets vary from
city to city as well as neighborhood to neighborhood. When the national media
reports on how the real estate market is doing, it is reporting on national num-
bers and it is likely very different from how your neighborhood is performing.
You will find factual data within The Stat Pack from which you may draw your
own conclusions. On the last page you will find a brief summary.
QUICK FACTS ABOUT THE LAST 3 MONTHS
⇒ The number of Active Listings is very low but has level out
⇒ The number of Sales for over the past 3 months is up 25% from 2012
⇒ Single Family Building Permits are up 377 units (61% increase)
⇒ The Average Inventory Level is down more than 30 days
⇒ The Average Sales Price and Median Sales Price both jumped 7% & 12%
⇒ 65% of sales in this quarter were under $250K compared to 71% in 2012
⇒ Foreclosure starts are down 400 units (35%) in 2013
The data found within the ERA Shields Real Estate Stat Pack is based on
information from the Pikes Peak REALTOR® Services Corporation
(RSC) or its PPMLS. This content is deemed reliable; however RSC,
PPMLS and ERA Shields Real Estate do not guarantee its accuracy. Data
maintained by RSC does not reflect all real estate activity in the market.
Additional sources include the Colorado Springs EDC, El Paso County
Assessor, El Paso County Trustee, Colorado Springs HBA, PPAR, The
Gazette, The CSBJ and NAR.
This graph compares the
number of homes on the
market to the number of
sales over the past 3
months for El Paso County
and determines how many
months it would take to sell
through the current listing
inventory. Most economists
consider 6.0 months to be a
balanced market.

MONTHLY PRICING TOOLS
Determine how your neighborhood is performing
Last Month Area Comparisons for Single Family & Patio Homes
This chart is ideal for helping you determine how your neighborhood is doing. If you are considering
selling your home, this information is just one tool you can reference to assist you with pricing
your home strategically. Call me if you need assistance utilizing this graph.
*Inventory = The number of months it would take to sell through the current active listings at the current
sales rate if no other homes came on the market. **DOM = Days on Market for the homes which actually sold.
For April 1, 2013 - April 30, 2013
Area Listings Solds DOM Inventory Avg List $ Avg Sales $
Black Forest 115 22 93 5.2 $594,577 $360,344
Briargate 202 56 79 3.6 $370,574 $306,267
Calhan 19 3 27 6.3 $212,153 $235,633
Central 170 63 71 2.7 $246,055 $176,883
Drennan 18 1 10 18.0 $150,336 $125,000
East 137 52 67 2.6 $237,910 $173,850
Ellicott 28 3 236 9.3 $178,743 $225,967
Falcon 36 8 174 4.5 $270,785 $216,500
Falcon North 196 50 73 3.9
$299,099 $259,197
Fountain Valley 356 150 63 2.4 $224,281 $186,930
Manitou 29 7 58 4.1 $389,186 $314,286
Marksheffel 73 16 57 4.6 $280,531 $206,456
Midway 9 5 34 1.8 $368,978 $171,380
Northeast 165 87 44 1.9 $290,422 $229,178
Northgate 98 28 95 3.5 $474,857 $425,831
Northwest 110 31 66 3.5 $469,975 $316,607
Old Colorado City
46 20 63 2.3 $245,976 $219,475
Peyton 30 6 179 5.0 $440,957 $305,733
Powers 239 89 51 2.7 $241,185 $203,733
Rock Creek 9 2 13 4.5 $607,878 $237,750
Southeast 127 47 63 2.7 $150,512 $134,261
Southwest 247 41 92 6.0 $679,680 $350,462
Tri Lakes 219 38 64 5.8 $495,809 $387,132
Ute Pass 43 2 259 21.5 $410,724 $139,000
West 62 17 43 3.6 $495,909 $205,730
Divide 57 8 96 7.1 $450,331 $217,063
Woodland Park 88 14 104 6.3 $464,502 $287,790
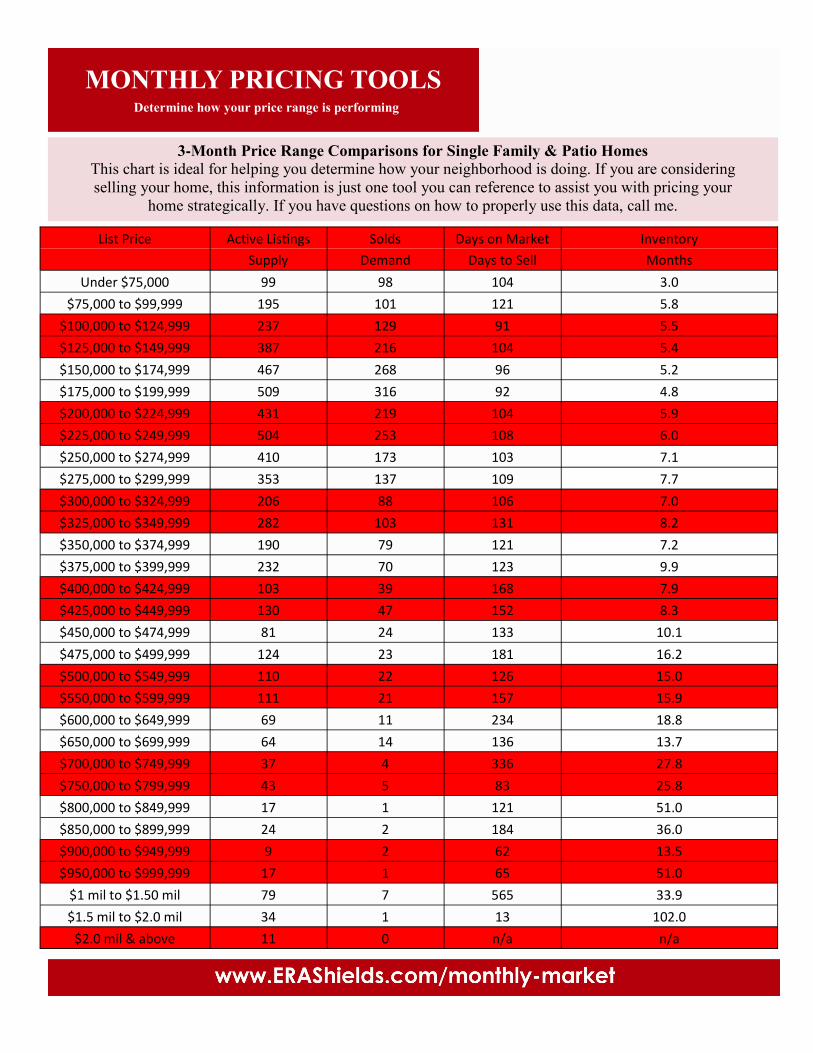
MONTHLY PRICING TOOLS
Determine how your price range is performing
3-Month Price Range Comparisons for Single Family & Patio Homes
This chart is ideal for helping you determine how your neighborhood is doing. If you are considering
selling your home, this information is just one tool you can reference to assist you with pricing your
home strategically. If you have questions on how to properly use this data, call me.
List Price Ac�ve Lis�ngs Solds Days on Market Inventory
Supply Demand Days to Sell Months
Under $75,000 99 98 104 3.0
$75,000 to $99,999 195 101 121 5.8
$100,000 to $124,999 237 129 91 5.5
$125,000 to $149,999 387 216 104 5.4
$150,000 to $174,999 467 268 96 5.2
$175,000 to $199,999 509 316 92 4.8
$200,000 to $224,999 431 219 104 5.9
$225,000 to $249,999 504 253 108 6.0
$250,000 to $274,999 410 173 103 7.1
$275,000 to $299,999 353 137 109 7.7
$300,000 to $324,999 206 88 106 7.0
$325,000 to $349,999 282 103 131 8.2
$350,000 to $374,999 190 79 121 7.2
$375,000 to $399,999 232 70 123 9.9
$400,000 to $424,999 103 39 168 7.9
$425,000 to $449,999 130 47 152 8.3
$450,000 to $474,999 81 24 133 10.1
$475,000 to $499,999 124 23 181 16.2
$500,000 to $549,999 110 22 126 15.0
$550,000 to $599,999 111 21 157 15.9
$600,000 to $649,999 69 11 234 18.8
$650,000 to $699,999 64 14 136 13.7
$700,000 to $749,999 37 4 336 27.8
$750,000 to $799,999 43 5 83 25.8
$800,000 to $849,999 17 1 121 51.0
$850,000 to $899,999 24 2 184 36.0
$900,000 to $949,999 9 2 62 13.5
$950,000 to $999,999 17 1 65 51.0
$1 mil to $1.50 mil 79 7 565 33.9
$1.5 mil to $2.0 mil 34 1 13 102.0
$2.0 mil & above 11 0 n/a n/a

3-MONTHS OF DATA
COMPARING DATA OVER THE PAST 10 YEARS
Active Listings at the end of the month when compared to the same
month the previous 10 years.
This graph shows the total number of Solds for the past 3 months. Comparing
3-months of data over the past 10 years helps determine what trends are occurring.
Active Listings
3-Months of Solds

3-MONTHS OF DATA
COMPARING DATA OVER THE PAST 10 YEARS
The Average & Median Sales Prices for the same month over the past 10 years.
The price range your home is within, dictates your odds of selling.
Generally the lower your price, the more potential buyers.

Monthly Summary
The year thus far continues to be good to homeowners. Prices continue their steady climb from the depths of 2009; average sales price is up 12% and median price is up 19% since 2009. Inventory levels have finally leveled off after dropping more than 45% since 2008. The combination of extremely low mortgage rates and low inventory has allowed the market to rebound nicely in the past several months. The good news for buyers is that values continue to be good when you consider the low mortgage rates and the fact that prices are down about 7% from the height of the market in 2007. The greatest challenge for buyers in todays market is finding a good home since there are so few homes on the market.