Equity Valuation Dividend Discount Method with constant earnings growth rate 1.
22
Equity Valuation Dividend Discount Method with constant earnings growth rate 1
-
Upload
ernest-morrison -
Category
Documents
-
view
216 -
download
0
Transcript of Equity Valuation Dividend Discount Method with constant earnings growth rate 1.

Equity Valuation Dividend Discount Method with constant earnings growth rate
1

Balance Sheet2
Assets 2010 2011 ChangeCurrent assets:
Cash and cash equivalents…………………………………………….230$ 326$ 96$ Accounts receivable………………………...………………………………….586$ 673$ 87$ Inventories……………………...…………………………………………………..610$ 657$ 47$ Total current assets………………………………………………….1,426$ 1,656$ 230$
Long-term assets:Property, plant, and equipment, at cost…………………………………….2,000$ 2,350$ 350$ Accumulated depreciation……………………….………………………………..(1,000)$ (970)$ 30$ Property, plant, and equipment, net………………………………………………1,000$ 1,380$ 380$ Investment securities…………………………………………..…………………..450$ 400$ (50)$ Total noncurrent assets……………………………………………1,450$ 1,780$ 330$
Total assets……………………………………..………………………………………………..2,876$ 3,436$ 560$
Liabilities and Shareholders' EquityCurrent liabilities:
Accounts payable…………………………….…………………………………….332$ 388$ 56$ Income taxes payable………………………….…………………………………….9$ 10$ 1$
Short-term debt……………………………...….…………………………………….147$ 126$ (21)$
Total current liabilities………………………………………………..488$ 524$ 36$
Long-term debt…………………………...…………………………………………………….500$ 835$ 335$
Deferred taxes………………………………………………………………………..65$ 70$ 5$
Total liabilities……………………………...……………………………..1,053$ 1,429$ 376$
Shareholders' equity:Common stock ($1 par) …………………………………………...…………….50$ 60$ 10$ Additional paid-in capital…………….…………………………………….133$ 167$ 34$ Retained earnings…………………………………..………………………………1,640$ 1,780$ 140$ Total shareholders' equity…………………………..………………..1,823$ 2,007$ 184$
Total liabilities and shareholders' equity………………………………….………..2,876$ 3,436$ 560$
FAIRWAY CORPORATIONBalance Sheet
As of December 31, 2010, and 2011(in thousands)

Balance Sheet
3
Assets 2011Current assets:
Cash and cash equivalents……………………………………………. 326$ Accounts receivable………………………...………………………………….673$ Inventories……………………...…………………………………………………..657$ Total current assets………………………………………………….1,656$
Long-term assets:Property, plant, and equipment, at cost…………………………………….2,350$ Accumulated depreciation……………………….………………………………..(970)$ Property, plant, and equipment, net………………………………………………1,380$ Investment securities…………………………………………..…………………..400$ Total noncurrent assets……………………………………………1,780$
Total assets……………………………………..………………………………………………..3,436$
Liabilities and Shareholders' EquityCurrent liabilities:
Accounts payable…………………………….…………………………………….388$ Income taxes payable………………………….…………………………………….10$
Short-term debt……………………………...….…………………………………….126$
Total current liabilities………………………………………………..524$
Long-term debt…………………………...…………………………………………………….835$
Deferred taxes……………………………………………………………………….. 70$
Total liabilities……………………………...……………………………..1,429$
Shareholders' equity:Common stock ($1 par) …………………………………………...…………….60$ Additional paid-in capital…………….…………………………………….167$ Retained earnings…………………………………..………………………………1,780$ Total shareholders' equity…………………………..………………..2,007$
Total liabilities and shareholders' equity………………………………….………..3,436$
Current Assets Current Liabilitites CE 326$ AP 388$ AR 673$ ITP 10$ INV 657$ SD 126$ CA 1,656$ CL 524$
Long-term Assets Long-term Liabilities
GC 2,350$ LD 835$ AD (970)$ T 70$ NC 1,380$ LL 905$ IS 400$ LA 1,780$ Shareholders' Equity
TA 3,436$ PAR 60$ APC 167$ RE 1,780$ EB 2,007$
LE 3,436$
Assets Liabilties and Shareholders' Equity
FAIRWAY CORPORATION Balance Sheet
As of December 31, 2011 (in thousands)

Equity Value
For a simple firm Liabilities + Equities = Debt Capital + Equity Capital + “Non-Capital”
Capital = Debt Capital + Equity Capital C = DB + EB
Fair value of firm = Fair value of firm’s capital V = D + E
Fair value of equity, E, is computed from the discounted cash flow to the equity holders discounted at the rate cost of equity capital
Assume that the cash flow to equity holders is only dividends
4

Firm Value5

Constant Growth Rate Equity Value
The value of an financial entity is the present value of future cash flows discounted at the rate cost of the cash flows
Now assume that the dividend is growing at a constant rate, gDIV
Write as a infinite sum as follow
6
N
1ii
E
i0 )k(1
DIVE
1i
iE
1iDIV
10 )k(1)g(1
DIVE
)k(1)g(1
...)k(1)g(1
)k(1)g(1
k11
DIVEE
1DIV
3E
2DIV
2E
DIV
E10
)g1(DIVDIV DIV1i-i

Constant Growth Value
As the spread between the rate cost, k, and cash flow growth, g, narrows, the convergence slows considerably
As cash flow growth rate approaches the rate cost, the series does not converge
7
k=10%
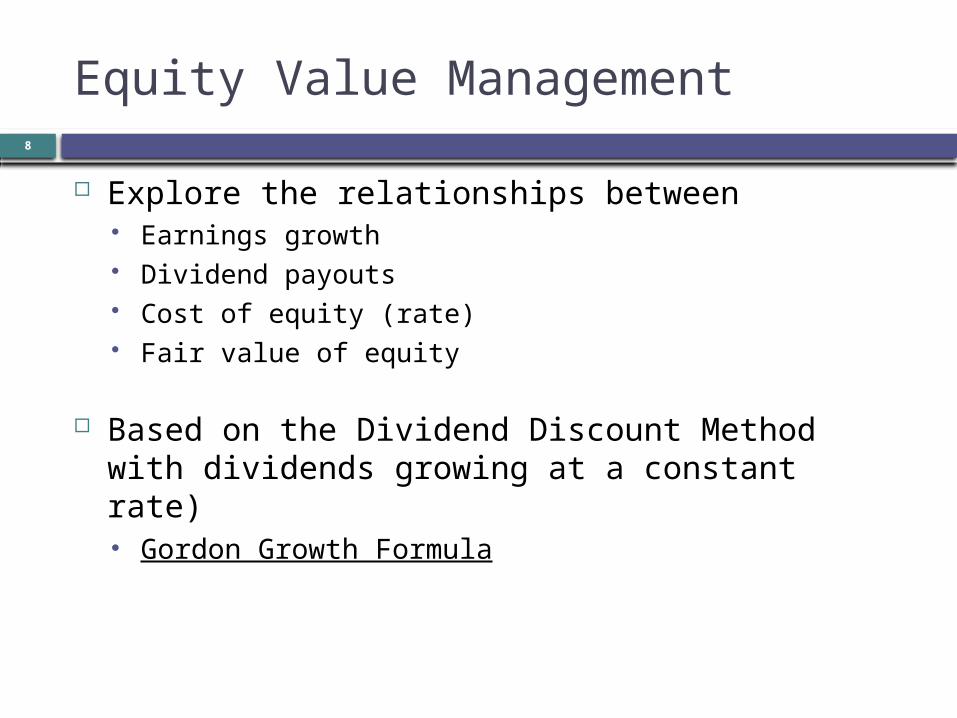
Equity Value Management
Explore the relationships between Earnings growth Dividend payouts Cost of equity (rate) Fair value of equity
Based on the Dividend Discount Method with dividends growing at a constant rate) Gordon Growth Formula
8

Equity Value Per Share
d0
1EEE g
pd
kr]r[E
d0
1E g
pd
k
)gk(d
pdE
10
pvgo pvcy p
kd
)gk(d
kd
p
0
E
1
dE
1
E
10
ns
Ep
ns
DIVd
00
11
9
perpetuity a as dividend firstof value presentkd
yield dividendpd
gg
E
1
0
1
DIVd

Share price v. Dividend Growth Rate
d1 = $0.50, kE = 10%
p0 = pvcy + pvgo
10
$-
$10
$20
$30
$40
$50
0% 1% 2% 3% 4% 5% 6% 7% 8% 9%
Shar
e pr
ice,
p0
dividend growth rate, gd
p0
pvgo
pvdy
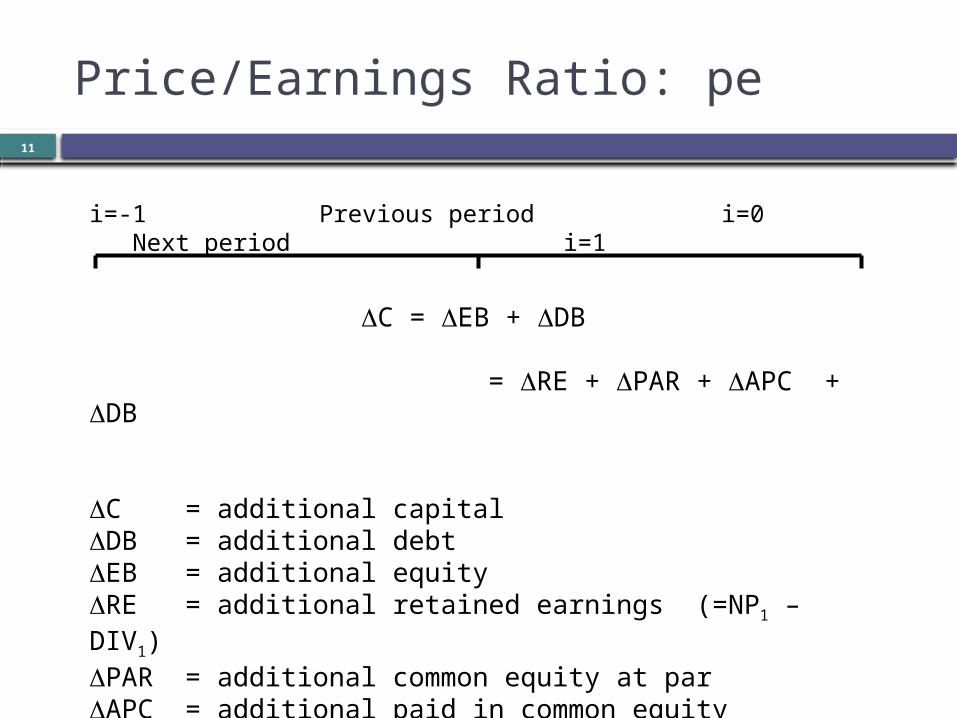
Price/Earnings Ratio: pe 11
D C = D EB + DDB
= DRE + D PAR + DAPC + DDB
D C = additional capitalDDB = additional debtD EB = additional equityDRE = additional retained earnings (=NP1 – DIV1)D PAR = additional common equity at parDAPC = additional paid in common equity
i=-1 Previous period i=0 Next period i=1

Price/Earnings Ratio, pe
i=-1 i=0 i=1
e0 e1
d0 d1
eb-1 eb 0 eb1
)gk(e)b1(
p
e)b1(d
dE
10
11
)gk()b1(
ep
peeE1
0
b = plowback ratio (assume constant) thus ge = gd
(1-b) = dividend payout ratio
12
NPDIV
b1
NPRE
b
D
DRE = NP – DIV = NP b∙ RE
NP
DRE
DIV

Price/Earnings Ratio: pe
In the case of no additional (external) investor financing DDB = 0, DAPC = D PAR = 0 D C = D EB = DRE
And a scalable firm with a constant plowback, b
)roebk()b1(
ep
peE
13
b = plowback ratio
reinvestment of earnings
(1-b) = dividend payout ratio
eb = equity book value per share
Long run assumption ge=geb
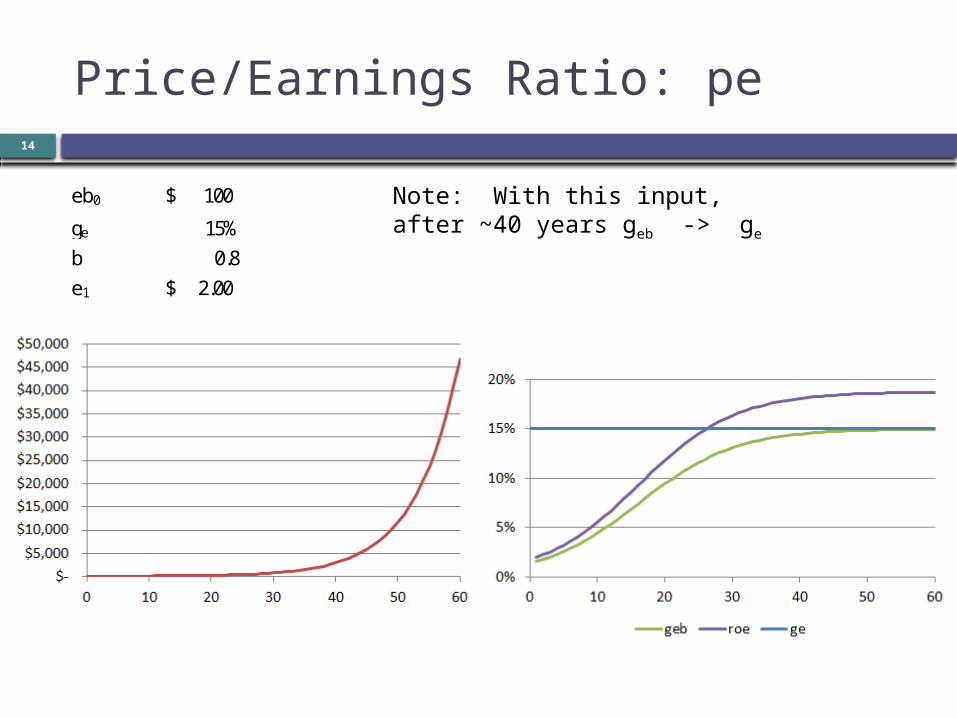
Price/Earnings Ratio: pe14
eb0 100$
ge 15%b 0.8e1 2.00$
Note: With this input, after ~40 years geb -> ge

PEG Ratio
The peg is a price measure normalized for earnings (e1) and earnings growth rate (ge) 3 to 5 years estimated growth rate
Typical heuristic > 2 relatively high valuation = 1 pe ratio = earnings growth (converting ratio to percent) < 1 relatively low valuation
Morningstar Table
eEee gkg100)b1(
g100pe
peg
16

Valuation Ratios 17

Forward PE Ratio18

Critical Growth Rates
Internal growth rate, gint: the maximum growth rate that does not require additional external financing
Sustainable growth rate, gsus: the maximum growth rate that maintains the current capital structure, , with additional investor contributed debt
EBDB
19
NA-1 NA0 NA1
IC-1 IC0 IC1
i=-1 i=0 i=1
DIV0 = NP0 (1-b) DIV∙ 1= NP0 (1-b) (1+g)∙ ∙
DRE0 = NP0 b∙ DRE1=NP0 b (1+g)∙ ∙
Critical growth rate derivations for core business operationsSo use • NA not TA and• IC not C or LE• NAIC• roa is return on net book assets• roe is return on book equity

Critical Growth Rates20
DNA = D IC = IC1 – IC0
= DDB + D EB
= DDB + DAPC + DPAR + DRE
DNA = g NA∙ 0
DNA = DRE DDB
= NP0 b (1+g) + ∙ ∙ DDB
NA-1 NA0 NA1
i=-1 i=0 i=1
DRE0 = NP0 b∙ DRE=NP0 b (1+g)∙ ∙
DNA = DRE + DDB

Internal Growth Rate, gint 21
bNP)g1(RE
0DB
DBRENAgNA
int
int
D
D
DDD
b·NP )g(1 NA g intint
b·NP b·NP) (NA g
b·NP b·NP g - NA g
int
intint
)roab1(roab
g
roab )roab - (1 g
NANP
roa
int
int
NA-1 NA0 NA1
i=-1 i=0 i=1
DRE0 = NP0 b∙ DRE1=NP0 b (1+g)∙ ∙
DNA1 = DRE1 + DDB1

Sustainable Growth Rate, gsus
22
EBDB
bNP)g1(bNP)g1(NAg sussussus
)EBDB
1(bNP)g1(NAg sussus
EBNA
EBEBDB
EBDB
1
EBNA
bNP)g1(NAg sussus
EBNP
b)g1(g sussus
)roeb1(roeb
g
roeb)g1(g
EBNP
roe
sus
sussus
NA-1 NA0 NA1
i=-1 i=0 i=1
DRE0 = NP0 b∙ DRE1=NP0 b (1+g)∙ ∙
DNA1 = DRE1 + DDB1
bNP)g1(RE
EBDB
REDB
DBRENAgNA
sus
sus
D
DD
DDD