Equity Research Reports… THB: Bangkok Chain Hospital · life nutrition business in China. He...
19
Equity research│September 20, 2016 Asia Pacific Daily - 20 September 2016 Equity Research Reports… ▌IDEA OF THE DAY | China Strategy Note - CNH – HIBOR volatility to continue | P2 CNH HIBOR surged to 23.7%/12.5% overnight/1-week on 19 Sep 2016, the highest level since Jan 2016. CNH has historically rebounded after such sudden spikes in HIBOR rates. We believe the liquidity drain in the CNH market was due to the People’s Bank of China (PBOC) not extending previous currency swap contracts. We maintain our year-end forecast of 6.8 for US$/Rmb. ——————————————————————————————————————————————————————————————————————————————————————— ▌China/Hong Kong China Mengniu Dairy (ADD, tp:HK$16.00) - Change of CEO | P3 China Overseas Land & Investment Ltd (ADD, tp:HK$35.00) - CITIC acquisition completed… | P4 Sunac (HOLD, tp:HK$5.70) - Acquisition of Legend projects inexpensive | P5 Gaming (OVERWEIGHT) - Slower before Oct Golden Week | P6 ——————————————————————————————————————————————————————————————————————————————————————— ▌Indonesia Bank Mandiri (ADD, tp:Rp12,500.00▲) - Better trade-off | P7 ——————————————————————————————————————————————————————————————————————————————————————— ▌South Korea S-Oil Corporation (ADD, tp:W105,000.00▼) - Weak refining to drag down 3Q16 earnings | P8 ——————————————————————————————————————————————————————————————————————————————————————— ▌Malaysia Berjaya Sports Toto (HOLD, tp:RM3.10) - Seasonally weak 1Q | P9 ——————————————————————————————————————————————————————————————————————————————————————— ▌Singapore Strategy Flash Note - Feedback from marketing | P10 ——————————————————————————————————————————————————————————————————————————————————————— ▌Taiwan Auto Parts (NEUTRAL) - Only half-way there | P11 ——————————————————————————————————————————————————————————————————————————————————————— ▌Thailand Jasmine International (ADD, tp:THB6.65) - The finale | P12 Supalai PCL (ADD▲, tp:THB26.75▲) - Saving the best for last | P13 Showcasing CIMB Research Ideas TWN: Momo.com Inc 16/09 Reprogrammed for growth >PDF ——————————————————————————————————————————————————————————————————————————————————— THB: Bangkok Chain Hospital 15/09 No new beds until 4Q17 >PDF ——————————————————————————————————————————————————————————————————————————————————— CHN/HKG: Banks 14/09 Next stop: Breaking out of the band >PDF ——————————————————————————————————————————————————————————————————————————————————— TWN: CUB Elecparts 13/09 Sensing the pressure ahead >PDF ——————————————————————————————————————————————————————————————————————————————————— CHN: Property - Overall 12/09 To see earnings recovery in FY16 and FY17 >PDF Regional Equity Research Contacts Michael GREENALL, CFP Regional Head of Research T: (60) 3 2261 9088 E: [email protected] ——————————————————————————————————————————————————————————————————————————————————— Show Style "View Doc Map" CIMB Conference / Events | CIMB Malaysia Public Sector Corporate Day 10 October 2016 Theme: Malaysia Location: Kuala Lumpur ——————————————————————————————————————————————————————————————————————————————————— IMPORTANT DISCLOSURES, INCLUDING ANY REQUIRED RESEARCH CERTIFICATIONS, ARE PROVIDED AT THE END OF THIS REPORT. IF THIS REPORT IS DISTRIBUTED IN THE UNITED STATES IT IS DISTRIBUTED BY CIMB SECURITIES (USA), INC. AND IS CONSIDERED THIRD-PARTY AFFILIATED RESEARCH. Powered by the EFA Platform
Transcript of Equity Research Reports… THB: Bangkok Chain Hospital · life nutrition business in China. He...

Equity research│September 20, 2016
Asia Pacific Daily - 20 September 2016
Equity Research Reports…
▌IDEA OF THE DAY | China Strategy Note - CNH – HIBOR volatility to continue | P2 CNH HIBOR surged to 23.7%/12.5% overnight/1-week on 19 Sep 2016, the highest level since Jan 2016. CNH has historically rebounded after such sudden spikes in HIBOR rates. We believe the liquidity drain in the CNH market was due to the People’s Bank of China (PBOC) not extending previous currency swap contracts. We maintain our year-end forecast of 6.8 for US$/Rmb. ——————————————————————————————————————————————————————————————————————————————————————— ▌China/Hong Kong China Mengniu Dairy (ADD, tp:HK$16.00) - Change of CEO | P3 China Overseas Land & Investment Ltd (ADD, tp:HK$35.00) - CITIC acquisition completed… | P4 Sunac (HOLD, tp:HK$5.70) - Acquisition of Legend projects inexpensive | P5 Gaming (OVERWEIGHT) - Slower before Oct Golden Week | P6 ——————————————————————————————————————————————————————————————————————————————————————— ▌Indonesia Bank Mandiri (ADD, tp:Rp12,500.00▲) - Better trade-off | P7 ——————————————————————————————————————————————————————————————————————————————————————— ▌South Korea S-Oil Corporation (ADD, tp:W105,000.00▼) - Weak refining to drag down 3Q16 earnings | P8 ——————————————————————————————————————————————————————————————————————————————————————— ▌Malaysia Berjaya Sports Toto (HOLD, tp:RM3.10) - Seasonally weak 1Q | P9 ——————————————————————————————————————————————————————————————————————————————————————— ▌Singapore Strategy Flash Note - Feedback from marketing | P10 ——————————————————————————————————————————————————————————————————————————————————————— ▌Taiwan Auto Parts (NEUTRAL) - Only half-way there | P11 ——————————————————————————————————————————————————————————————————————————————————————— ▌Thailand Jasmine International (ADD, tp:THB6.65) - The finale | P12 Supalai PCL (ADD▲, tp:THB26.75▲) - Saving the best for last | P13
Showcasing CIMB Research Ideas
TWN: Momo.com Inc 16/09 Reprogrammed for growth >PDF
———————————————————————————————————————————————————————————————————————————————————
THB: Bangkok Chain Hospital 15/09 No new beds until 4Q17 >PDF
———————————————————————————————————————————————————————————————————————————————————
CHN/HKG: Banks 14/09 Next stop: Breaking out of the band >PDF
———————————————————————————————————————————————————————————————————————————————————
TWN: CUB Elecparts 13/09 Sensing the pressure ahead >PDF
———————————————————————————————————————————————————————————————————————————————————
CHN: Property - Overall 12/09 To see earnings recovery in FY16 and FY17 >PDF
Regional Equity Research Contacts
Michael GREENALL, CFP Regional Head of Research T: (60) 3 2261 9088 E: [email protected]
———————————————————————————————————————————————————————————————————————————————————
Show Style "View Doc Map"
CIMB Conference / Events |
CIMB Malaysia Public Sector Corporate Day 10 October 2016 Theme: Malaysia Location: Kuala Lumpur
———————————————————————————————————————————————————————————————————————————————————
IMPORTANT DISCLOSURES, INCLUDING ANY REQUIRED RESEARCH CERTIFICATIONS, ARE PROVIDED AT THE END OF THIS REPORT. IF THIS REPORT IS DISTRIBUTED IN THE UNITED STATES IT IS DISTRIBUTED BY CIMB SECURITIES (USA), INC. AND IS CONSIDERED THIRD-PARTY AFFILIATED RESEARCH.
Powered by the EFA Platform
China│Equity research│September 19, 2016
Strategy Note
IMPORTANT DISCLOSURES, INCLUDING ANY REQUIRED RESEARCH CERTIFICATIONS, ARE PROVIDED AT THE END OF THIS REPORT. IF THIS REPORT IS DISTRIBUTED IN THE UNITED STATES IT IS DISTRIBUTED BY CIMB SECURITIES (USA), INC. AND IS CONSIDERED THIRD-PARTY AFFILIATED RESEARCH.
Powered by the EFA Platform
China Strategy CNH – HIBOR volatility to continue
CNH HIBOR surged to 23.7%/12.5% overnight/1-week on 19 Sep 2016, the highest ■level since Jan 2016.
CNH has historically rebounded after such sudden spikes in HIBOR rates. ■ We believe the liquidity drain in the CNH market was due to the People’s Bank of ■China (PBOC) not extending previous currency swap contracts.
We maintain our year-end forecast of 6.8 for US$/Rmb. ■
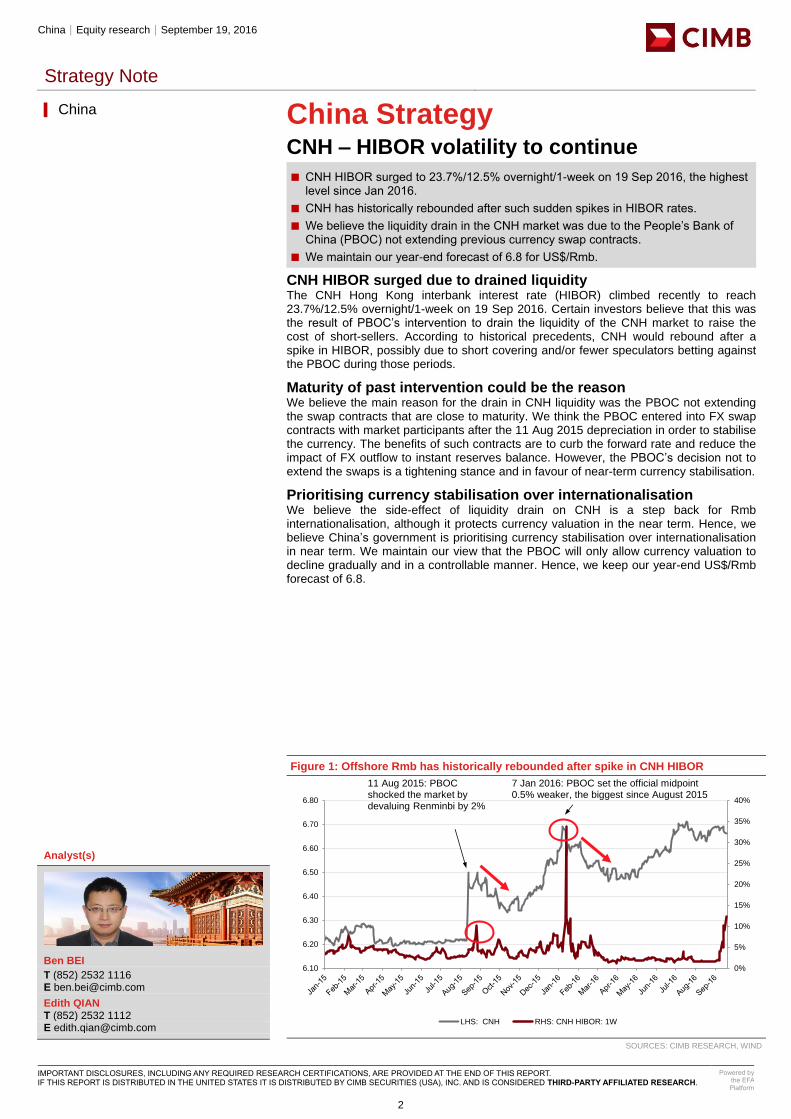
CNH HIBOR surged due to drained liquidity The CNH Hong Kong interbank interest rate (HIBOR) climbed recently to reach 23.7%/12.5% overnight/1-week on 19 Sep 2016. Certain investors believe that this was the result of PBOC’s intervention to drain the liquidity of the CNH market to raise the cost of short-sellers. According to historical precedents, CNH would rebound after a spike in HIBOR, possibly due to short covering and/or fewer speculators betting against the PBOC during those periods.
Maturity of past intervention could be the reason We believe the main reason for the drain in CNH liquidity was the PBOC not extending the swap contracts that are close to maturity. We think the PBOC entered into FX swap contracts with market participants after the 11 Aug 2015 depreciation in order to stabilise the currency. The benefits of such contracts are to curb the forward rate and reduce the impact of FX outflow to instant reserves balance. However, the PBOC’s decision not to extend the swaps is a tightening stance and in favour of near-term currency stabilisation.
Prioritising currency stabilisation over internationalisation We believe the side-effect of liquidity drain on CNH is a step back for Rmb internationalisation, although it protects currency valuation in the near term. Hence, we believe China’s government is prioritising currency stabilisation over internationalisation in near term. We maintain our view that the PBOC will only allow currency valuation to decline gradually and in a controllable manner. Hence, we keep our year-end US$/Rmb forecast of 6.8.
[ X ]
Figure 1: Offshore Rmb has historically rebounded after spike in CNH HIBOR
SOURCES: CIMB RESEARCH, WIND
▎China
Analyst(s)
Ben BEI
T (852) 2532 1116 E [email protected]
Edith QIAN T (852) 2532 1112 E [email protected]
0%
5%
10%
15%
20%
25%
30%
35%
40%
6.10
6.20
6.30
6.40
6.50
6.60
6.70
6.80
LHS: CNH RHS: CNH HIBOR: 1W
11 Aug 2015: PBOC shocked the market by devaluing Renminbi by 2%
7 Jan 2016: PBOC set the official midpoint 0.5% weaker, the biggest since August 2015
2

Food & Beverages│Hong Kong│Equity research
Company Flash Note
IMPORTANT DISCLOSURES, INCLUDING ANY REQUIRED RESEARCH CERTIFICATIONS, ARE PROVIDED AT THE END OF THIS REPORT. IF THIS REPORT IS DISTRIBUTED IN THE UNITED STATES IT IS DISTRIBUTED BY CIMB SECURITIES (USA), INC. AND IS CONSIDERED THIRD-PARTY AFFILIATED RESEARCH.
Powered by the EFA Platform
China Mengniu Dairy
Change of CEO
Yashili Chairman Jeffrey Lu was appointed as Mengniu’s new CEO. There will be no ■change in strategic direction; management to focus on improvements in four areas.
Despite the board reshuffling, Mengniu Chairman Mr. Ma highlighted that ■development of dairy industry is still a key focus of COFCO Group.
Maintain Add and DCF-based target price. Dairy industry recovery to drive 2H16. ■
Yashili Chaiman Jeffrey Lu appointed as new CEO ● Mengniu CEO Sun Yiping has resigned from her roles as CEO, executive director
and member of the strategy and development committee for personal career development reasons.
● She will be replaced by Jeffrey Lu who was re-designated as chairman of Yashili on the same day. Prior to serving as chairman, Lu was CEO of Yashili and served as a director for each of Yashili's business units. Before that, Lu oversaw Danone's early life nutrition business in China. He worked for Danone for over ten years.
● Yashili is looking for suitable candidates to appoint as CEO to lead the company. Jeffrey Lu will continue to be the CEO of Yashili during this transition period.
No change in strategic direction ● Ma said that there will be no change in the strategic direction of the company. The
new management team will focus on four key areas:
● 1) improving operational efficiencies and enhancing the business model, 2) product innovation to drive sales growth in room temperature, low temperature dairy products as well as IMF segment, 3) optimise integrated business model to achieve more synergies, and 4) enhance brand image and improve relationships with local government, relevant enterprises and distributors.
● Mengniu remains committed to its goal of becoming a world-class enterprise, and aims to achieve Rmb100bn sales p.a. by 2020. Lu guided that Mengniu strives to narrow the gap with Yili in terms of market cap, revenue and profitability, and is open to M&As.
Development of dairy industry still a key focus of COFCO Group ● After the recent board reshuffling, COFCO (China National Cereals, Oils and
Foodstuffs Corporation) only has two members in Mengniu’s board, while Danone and Arla have one board member each. But Ma reiterated that COFCO’s focus is on developing the domestic dairy industry. He said that COFCO has the right to nominate another member onto Mengniu’s board, which will be exercised when there is more clarity on what the board needs.
Enhanced cooperation among big-3 shareholders ● Ma announced plans for COFCO, Danone and Arla to jointly set up an R&D centre in
China to improve product innovation capabilities. They will also adopt a centralised procurement method to improve their cost advantage.
Maintain Add ● We keep our Add call on Mengniu as we expect a stronger 2H16 driven by the dairy
industry’s recovery, 2H15’s low base effect and improving distribution and marketing capabilities. Low raw milk price and product mix upgrade are expected to drive GPM expansion. Downside risks include earlier than expected recovery in raw milk prices which could hurt Mengniu’s GPM in the short term.
Figure 1: Peer comparison
SOURCES: CIMB, COMPANY REPORTS
Company Ticker Recom.
Mkt cap
(US$m)
Price
(HK$)
TP
(HK$)
Potential
Upside
ADT
(US$m)
CY16F
P/E
CY17F
P/E
China Mengniu Dairy 2319 HK Add 7,280 14.4 16.0 11.1% 26.6 20.7 16.8
Yashili International 1230 HK Add 1,080 1.8 1.9 8.0% 0.3 nm 27.6
China Modern Dairy 1117 HK Hold 1,080 1.6 1.3 -17.7% 4.6 nm 16.8
China Huishan Dairy 6863 HK Reduce 5,180 3.0 1.8 -39.6% 2.3 35.7 28.1
Yuanshengtai Dairy Farm 1431 HK Not Rated 267 0.5 na na 0.2 22.8 11.4
Inner Mongolia Yili 600887 CH Not Rated 14,650 16.1 na na 118.5 18.2 16.2
Bright Dairy & Food Co 600597 CH Not Rated 2,550 13.8 na na 29.4 33.3 28.7
Biostime International 1112 HK Not Rated 1,760 21.7 na na 9.8 17.0 15.4
Beingmate Baby & Child 002570 CH Not Rated 1,760 11.5 na na 15.4 na na
▎Hong Kong
September 19, 2016 - 3:22 PM
ADD (no change) Consensus ratings*: Buy 15 Hold 10 Sell 3
Current price: HK$14.74
Target price: HK$16.00
Previous target: HK$16.00
Up/downside: 8.5%
CIMB / Consensus: 20.3%
Reuters: 2319.HK
Bloomberg: 2319 HK
Market cap: US$7,452m
HK$57,814m
Average daily turnover: US$16.03m
HK$124.3m
Current shares o/s 3,889m
Free float: 68.7% * Source: Bloomberg
Key financial forecasts
Source: Bloomberg
Price performance 1M 3M 12M
Absolute (%) 8.9 10.5 11.5
Relative (%) 7.1 -3.5 2.7
Major shareholders % held COFCO 16.3
Danone 9.9
Arla 5.3
Analyst(s)
Lei YANG, CFA
T (86) 21 5047 1771 x108 E [email protected]
ONG Khang Chuen T (852) 2539 1326 E [email protected]
Dec-16F Dec-17F Dec-18F
Net Profit (Rmbm) 2,380 2,945 3,503
Core EPS (Rmb) 0.61 0.76 0.90
Core EPS Growth 0.8% 23.7% 18.9%
FD Core P/E (x) 20.72 16.75 14.08
Recurring ROE 10.3% 11.7% 12.6%
P/BV (x) 2.06 1.87 1.69
DPS (Rmb) 0.14 0.18 0.21
Dividend Yield 1.12% 1.39% 1.65%
81.0
92.7
104.3
116.0
10.0
12.0
14.0
16.0
Price Close Relative to HSI (RHS)
20
40
60
Sep-15 Dec-15 Mar-16 Jun-16
Vo
l m
3

Property Development│Hong Kong│Equity research
Company Flash Note
IMPORTANT DISCLOSURES, INCLUDING ANY REQUIRED RESEARCH CERTIFICATIONS, ARE PROVIDED AT THE END OF THIS REPORT. IF THIS REPORT IS DISTRIBUTED IN THE UNITED STATES IT IS DISTRIBUTED BY CIMB SECURITIES (USA), INC. AND IS CONSIDERED THIRD-PARTY AFFILIATED RESEARCH.
Powered by the EFA Platform
China Overseas Land & Investment Ltd
CITIC acquisition completed, bodes well for sales growth and earnings ahead
■ COLI announced that the CITIC acquisition was completed on 15 Sep.
■ We believe that this is positive for COLI as the acquisition can sustain its sales and earnings growth ahead.
■ Reiterate our Add call and target price of HK$35. It is our large-cap top pick.
CITIC acquisition completed on 15 Sep ● COLI announced that it had completed the acquisition of CITIC’s property assets on
15 September.
● The total acquisition cost is about HK$100bn, with HK$37bn coming from HK$30bn in new COLI shares (price: HK$27.13) issued and HK$7bn of commercial properties transferred coupled with total net debt of HK$63bn. This represents an average land cost of about Rmb3.5k/sq m.
● The total size of the CITIC portfolio is around 31m sq m (attributable: 24m sq m). The acquisition increases COLI’s land bank by almost 80%.
● COLI’s financials remain strong post the transaction. We estimate its net gearing to stay low at about 30%.
We estimate NAV acquisition of 13% from CITIC projects ● Total sales resources of these projects are around Rmb450bn, which management
projects to be the key contribution to COLI’s growth over the next few years.
● Apart from the sizeable portfolio, the beauty of the deal is that most of the projects (~80%) are located in second- and top-tier cities, where property markets have outperformed the overall industry.
● Given its attractive land cost, 15-20% cheaper than via land auction, we estimate CITIC projects to offer a gross margin of about 32%, higher than COLI’s 30%.
Reiterate our top buy call on COLI ● We believe COLI can sustain its growth post the CITIC acquisition. In the near term,
we expect its contracted sales momentum to remain strong over the next few months.
● The stock is trading at a 25% discount to NAV, 9x FY16 P/E and 3.5% dividend yield, which appears attractive. We maintain our Add rating and price target of HK$35, which is based on par to NAV. COLI is our top pick among the large-caps.
● Key risks to our call are potential cooling measures from local governments.
Figure 1: We expect COLI contracted sales to pick up in the next few months
SOURCES: CIMB, COMPANY REPORTS
0
5,000
10,000
15,000
20,000
25,000
0
5,000
10,000
15,000
20,000
25,000
30,000
35,000
Jan-
13F
eb-1
3M
ar-1
3A
pr-1
3M
ay-1
3Ju
n-13
Jul-1
3A
ug-1
3S
ep-1
3O
ct-1
3N
ov-1
3D
ec-1
3Ja
n-14
Feb
-14
Mar
-14
Apr
-14
May
-14
Jun-
14Ju
l-14
Aug
-14
Sep
-14
Oct
-14
Nov
-14
Dec
-14
Jan-
15F
eb-1
5M
ar-1
5A
pr-1
5M
ay-1
5Ju
n-15
Jul-1
5A
ug-1
5S
ep-1
5O
ct-1
5N
ov-1
5D
ec-1
5Ja
n-16
Feb
-16
Mar
-16
Apr
-16
May
-16
Jun-
16Ju
l-16
Aug
-16
AS
P (H
KD
/sqm
)
Con
trac
ted
sale
s (H
KD
mn)
Contracted sales (HKD mn) (LHS) ASP (HKD/sqm) (RHS)
▎Hong Kong
September 19, 2016 - 9:02 AM
ADD (no change) Consensus ratings*: Buy 25 Hold 6 Sell 0
Current price: HK$25.55
Target price: HK$35.00
Previous target: HK$35.00
Up/downside: 37.0%
CIMB / Consensus: 10.3%
Reuters: 0688.HK
Bloomberg: 688 HK
Market cap: US$32,472m
HK$251,938m
Average daily turnover: US$61.40m
HK$476.2m
Current shares o/s 10,956m
Free float: 34.9% * Source: Bloomberg
Key financial forecasts
Source: Bloomberg
Price performance 1M 3M 12M
Absolute (%) -5.7 10.6 12.3
Relative (%) -7.5 -3.4 3.5
Major shareholders % held China Overseas Holdings 55.1
CITIC Group 10.0
Analyst(s)
Raymond CHENG, CFA
T (852) 2539 1324 E [email protected]
Siu Fung LUNG T (852) 2539 1327 E [email protected]
Dec-16F Dec-17F Dec-18F
Net Profit (HK$m) 31,748 38,380 43,782
Core EPS (HK$) 3.05 3.50 4.00
Core EPS Growth 8.9% 14.8% 14.1%
FD Core P/E (x) 8.12 7.29 6.39
Recurring ROE 14.6% 14.9% 15.3%
P/BV (x) 1.15 1.04 0.93
DPS (HK$) 0.90 1.02 1.16
Dividend Yield 3.54% 4.00% 4.52%
97.0
101.4
105.9
110.3
114.8
19.0
21.0
23.0
25.0
27.0
Price Close Relative to HSI (RHS)
20
40
60
80
Sep-15 Dec-15 Mar-16 Jun-16
Vol m
4
Property Development│Hong Kong│Equity research│September 19, 2016
Company Note
IMPORTANT DISCLOSURES, INCLUDING ANY REQUIRED RESEARCH CERTIFICATIONS, ARE PROVIDED AT THE END OF THIS REPORT. IF THIS REPORT IS DISTRIBUTED IN THE UNITED STATES IT IS DISTRIBUTED BY CIMB SECURITIES (USA), INC. AND IS CONSIDERED THIRD-PARTY AFFILIATED RESEARCH.
Powered by the EFA Platform
Sunac Acquisition of Legend projects inexpensive
■ Sunac announced it will acquire 42 projects from Legend Holding for Rmb13.8bn.
■ The acquisition cost of Rmb2.7k/sqm does not look expensive as we estimate gross margin of 19% from these projects, higher than its current margin.
■ However, we are skeptical about the success of the transaction given Sunac’s poor M&A track record.
■ Sunac's high leverage (net gearing: 110%) is another concern.
■ Maintain Hold, with a price target of HK$5.7.
Acquiring 42 projects (GFA: 7.3m sqm) from Legend Holding Sunac announced that it has signed two framework agreements with Legend Holding (3396 HK) to acquire 42 property projects from the latter. We estimate total acquisition cost of about Rmb16.8bn, including Rmb13.8bn cash consideration and Rmb3bn net debt from these projects. The transaction is subject to approvals from both companies’ shareholders (EGM). A detailed circular is slated to be dispatched by November and the earliest time of completion for the transaction is by end-December.
About 65% of projects located in second tier cities The total size of these 42 projects are about 7.3m sqm or attributable GFA of 6.2m sqm, assuming Sunac holds 85% stake. This translates to average land cost of Rmb2.7k/sqm. Based on Legend's 1H16 report, we estimate about 1% of these projects are located in tier one cities, 64% in tier two cities and 35% in tier cities. Please refer to Fig. 3 for details.
All-in cost of Rmb17bn or average land cost of Rmb2.7k/sqm The average land cost of Rmb2.7k/sqm does not appear expensive, in our view, as these projects should offer higher gross margin than the projects Sunac acquired via land auctions. We estimate gross margin for these projects to be around 19% (please refer to Fig. 1 for calculations), assuming average selling price of Rmb9.5k/sqm.
High gearing still a concern We think Sunac obtained good payment terms for the deal. Management guided that for the Rmb13.8bn cash consideration, Rmb4.5bn will be paid this year and the remaining Rmb9.3bn will be paid in 2017. However, we are concerned about Sunac's high leverage. Its net gearing rose to 110% (perpetual bonds are considered debts) on the back of aggressive land banking in 1H16 and we expect gearing to remain high in the next 1-2 years. We think Sunac needs to better balance its growth vs. leverage.
Maintain Hold with TP of HK$5.7 Overall, we think the acquisition is positive for Sunac, if completed, as it can get land at cheaper costs and with better margins. Given its unimpressive track record on M&As, we maintain our Hold rating with a price target of HK$5.7, based on 50% discount to NAV. It is trading at an undemanding valuation of 50% discount to NAV and 9x FY16F P/E. Key downside risk to our call is potential delay or cancellation of the transaction.
▎Hong Kong
HOLD (no change) Consensus ratings*: Buy 9 Hold 7 Sell 3
Current price: HK$5.48
Target price: HK$5.70
Previous target: HK$5.70
Up/downside: 4.0%
CIMB / Consensus: -19.2%
Reuters: 1918.HK
Bloomberg: 1918 HK
Market cap: US$2,404m
HK$18,652m
Average daily turnover: US$11.63m
HK$90.18m
Current shares o/s: 3,390m
Free float: 38.9% * Source: Bloomberg
Key changes in this note
No change
Source: Bloomberg
Price performance 1M 3M 12M Absolute (%) -3.9 17.3 32.4
Relative (%) -5.7 3.3 23.6
Major shareholders % held Hongbin Sun 47.2
Analyst(s)
Raymond CHENG, CFA
T (852) 2539 1324 E [email protected]
Siu Fung LUNG T (852) 2539 1327 E [email protected]
[ X ]
SOURCE: COMPANY DATA, CIMB FORECASTS
Financial Summary Dec-14A Dec-15A Dec-16F Dec-17F Dec-18F
Total Net Revenues (Rmbm) 25,072 22,945 29,167 35,478 42,571
Operating EBITDA (Rmbm) 2,844 1,090 2,609 3,779 5,287
Net Profit (Rmbm) 3,230 4,032 1,986 3,654 4,413
Core EPS (Rmb) 0.97 0.99 0.53 0.94 1.16
Core EPS Growth (8.9%) 2.0% (46.8%) 77.8% 23.9%
FD Core P/E (x) 4.86 4.81 9.06 5.10 4.11
DPS (Rmb) 0.19 0.19 0.05 0.14 0.23
Dividend Yield 4.05% 4.12% 1.12% 2.98% 4.93%
EV/EBITDA (x) 9.08 24.37 13.69 9.88 6.93
P/FCFE (x) 1.14 NA 7.99 31.53 5.48
Net Gearing 44.5% 75.9% 88.5% 89.3% 82.5%
P/BV (x) 0.98 0.84 0.57 0.52 0.47
ROE 22.0% 19.0% 7.6% 10.8% 12.1%
CIMB/consensus EPS (x) 0.97 1.23 1.05
91.0
103.0
115.0
127.0
139.0
151.0
3.70
4.20
4.70
5.20
5.70
6.20
Price Close Relative to HSI (RHS)
20
40
60
80
Sep-15 Dec-15 Mar-16 Jun-16
Vol m
5
Travel and Leisure│Hong Kong│Equity research│September 19, 2016
Sector Note
IMPORTANT DISCLOSURES, INCLUDING ANY REQUIRED RESEARCH CERTIFICATIONS, ARE PROVIDED AT THE END OF THIS REPORT. IF THIS REPORT IS DISTRIBUTED IN THE UNITED STATES IT IS DISTRIBUTED BY CIMB SECURITIES (USA), INC. AND IS CONSIDERED THIRD-PARTY AFFILIATED RESEARCH.
Powered by the EFA Platform
Gaming Slower before Oct Golden Week
GGR for Sep is tracking above seasonality at -4% mom (projection based on 1-18 ■Sep) versus historical seasonal decline of 10% mom.
Average daily revenue slowed last week, as we head into Golden Week. ■ Based on strong holiday hotel bookings and improving player sentiment, we expect ■continued improvement in sector fundamentals.
Maintain Overweight on sector with Galaxy as our top pick, given its undemanding ■valuations.
Sep GGR tracking above historical seasonality We estimate that GGR in 1-18 Sep was MOP10.8bn (taking the average of the various data sources that report weekly GGR). This implies an average daily revenue (ADR) of MOP600. Assuming the same ADR for the rest of the month, we forecast that Sep GGR will reach MOP18bn (+5% yoy, -4% mom), better than our initial expectation of MOP17.5bn (+2% yoy, -7% mom) and above historical seasonality of a 10% mom decline (Sep is typically a seasonally slow month for gaming revenues).
Lower seasonality outweighs new property opening Using the mid-point of various data sources, we estimate that weekly ADR in 12-18 Sep fell by mid-single digit wow. Parisian Macao’s opening did not have the same incremental impact on sector GGR growth, as Wynn Palace’s opening did. This may be because Wynn Palace opened during summer holidays, while Sands Parisian opened in a seasonally slow month, three weeks before Golden Week. The incremental crowds at Parisian are low-end mass, which do not contribute significantly to sector revenues.
Golden Week in Oct expected to be strong Based on Expedia.com, many properties are sold out for Golden Week two weeks ahead, including MGM, Ritz Carlton, City of Dreams and Four Seasons. Wynn Palace, Venetian and Studio City still have rooms but they are priced at a 136% average premium for the Golden Week compared to room prices this week. Given that higher-end properties such as Ritz Carlton are fully booked, we suspect that higher quality players will support strong Oct GGR, which we project will see 2-4% yoy growth.
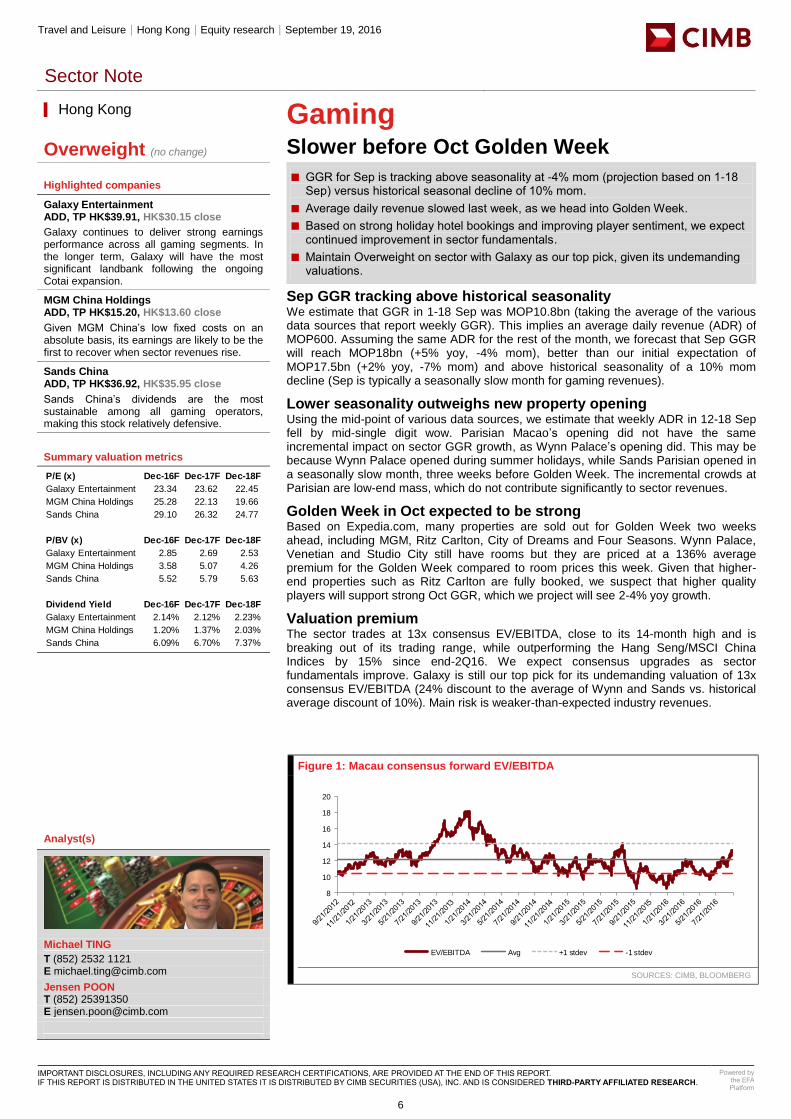
Valuation premium The sector trades at 13x consensus EV/EBITDA, close to its 14-month high and is breaking out of its trading range, while outperforming the Hang Seng/MSCI China Indices by 15% since end-2Q16. We expect consensus upgrades as sector fundamentals improve. Galaxy is still our top pick for its undemanding valuation of 13x consensus EV/EBITDA (24% discount to the average of Wynn and Sands vs. historical average discount of 10%). Main risk is weaker-than-expected industry revenues.
Figure 1: Macau consensus forward EV/EBITDA
SOURCES: CIMB, BLOOMBERG
Title:
Source:
Please fill in the values above to have them entered in your report
8
10
12
14
16
18
20
EV/EBITDA Avg +1 stdev -1 stdev
[ X ]
▎Hong Kong
Overweight (no change)
Highlighted companies
Galaxy Entertainment ADD, TP HK$39.91, HK$30.15 close
Galaxy continues to deliver strong earnings performance across all gaming segments. In the longer term, Galaxy will have the most significant landbank following the ongoing Cotai expansion.
MGM China Holdings ADD, TP HK$15.20, HK$13.60 close
Given MGM China’s low fixed costs on an absolute basis, its earnings are likely to be the first to recover when sector revenues rise.
Sands China ADD, TP HK$36.92, HK$35.95 close
Sands China’s dividends are the most sustainable among all gaming operators, making this stock relatively defensive.
Summary valuation metrics
Analyst(s)
Michael TING
T (852) 2532 1121 E [email protected]
Jensen POON T (852) 25391350 E [email protected]
P/E (x) Dec-16F Dec-17F Dec-18F
Galaxy Entertainment 23.34 23.62 22.45
MGM China Holdings 25.28 22.13 19.66
Sands China 29.10 26.32 24.77
P/BV (x) Dec-16F Dec-17F Dec-18F
Galaxy Entertainment 2.85 2.69 2.53
MGM China Holdings 3.58 5.07 4.26
Sands China 5.52 5.79 5.63
Dividend Yield Dec-16F Dec-17F Dec-18F
Galaxy Entertainment 2.14% 2.12% 2.23%
MGM China Holdings 1.20% 1.37% 2.03%
Sands China 6.09% 6.70% 7.37%
6

Banks│Indonesia│Equity research│September 19, 2016
Company Note
IMPORTANT DISCLOSURES, INCLUDING ANY REQUIRED RESEARCH CERTIFICATIONS, ARE PROVIDED AT THE END OF THIS REPORT. IF THIS REPORT IS DISTRIBUTED IN THE UNITED STATES IT IS DISTRIBUTED BY CIMB SECURITIES (USA), INC. AND IS CONSIDERED THIRD-PARTY AFFILIATED RESEARCH.
Powered by the EFA Platform
Bank Mandiri Better trade-off
■ We like Mandiri’s strategy of focusing on corporate and consumer segments, the segments that it has a competitive advantage over its peers.
■ Asset quality is set to be better in 2H post massive downgrades in 2Q.
■ Compared to other SOE banks, it relies the least on the government’s budget or policy, alleviating budget and policy risks.
■ Despite cutting FY17-18 earnings forecasts by 8% amid lower non-interest income, we increase our GGM-based target price given lower discount rate assumptions.
Focusing on the right segment Mandiri is planning to focus mainly on two segments: consumer and corporate. This, in our view, is the right strategy given Mandiri’s expertise, strong funding base and robust asset quality in these two segments (both segments’ NPL was less than 2% in 2Q16). It also plans to reduce its commercial loan portfolio given asset quality issues (c.6.7% in 2Q16). The bank targets its bank-only commercial portfolio to contract to 25% of total loans by 2020 from 30% in 2015.
Asset quality is expected to improve 2Q16 NPL stood at 3.9%, deteriorating from 2.6% in FY15 amid massive downgrades in 2Q16 post its extensive review. This also resulted in an increase in credit costs to 3.7% in 2Q16 from 3.3% in 1Q16 (2.2% in FY15). We expect its provisions to normalise in the 2H (bank-only provisions dropped by 69% mom in July) due to stabilising asset quality (no major downgrades in Jul-Aug). Thus, we expect total provision to reach Rp16tr for FY16 (Rp10tr in 1H16).
Margins may surprise on the upside in 2H We expect its NIM to temporarily improve with the payment of RGM’s (Raja Garuda Mas) deferred interest of US$140m in Sep. All else being equal, we expect the payment to increase its NIM by c.90bp. The latest 3-month SPN auction (5.6% in 30 Aug 2016 vs. a 5.3% low in July) shows an improvement in the yield, which should positively impact its variable rate bond portfolio (c.Rp47tr/ 5% of total earning assets). Room for lowering TD costs (6.7% in 2Q16, higher than LPS rate of 6.25%) is also positive for margins.
Less uncertainty over government’s policy and budget Mandiri is one of the banks that rely the least on the government’s budget or policy amid its limited exposure to KUR (only Rp13tr target out of the government’s total target of Rp100tr disbursement) and FLPP (subsidised housing programme). This, in our view, alleviates the risk of changes in policy (i.e. changes in scheme) and/or lower budgets for such programmes.
Value aplenty Its stock price has gained 23% YTD and outperformed the JCI by 9% in the same period. Despite the rally, it still trades at 2x FY16 and 1.7x FY17 P/BV, below its 10-year average of 1.8x P/BV. We keep our FY16 earnings forecast but trims our estimates by 8% in FY17-18 amid lower non-interest income assumptions. Nonetheless, we raise our GGM-based target price to Rp12,500 given lower discount rate assumptions (to 13.7% from 14.5%) amid reduced risk from asset quality and changes in government policy.
▎Indonesia
ADD (no change) Consensus ratings*: Buy 9 Hold 13 Sell 6
Current price: Rp11,075
Target price: Rp12,500
Previous target: Rp10,900
Up/downside: 12.9%
CIMB / Consensus: 17.8%
Reuters: BMRI.JK
Bloomberg: BMRI IJ
Market cap: US$19,644m
Rp258,416,672m
Average daily turnover: US$20.05m
Rp263,653m
Current shares o/s: 57,966m
Free float: 40.0% * Source: Bloomberg
Key changes in this note
FY16F EPS decreased by 0.3%.
FY17F EPS decreased by 8%.
FY18F EPS decreased by 8%.
Source: Bloomberg
Price performance 1M 3M 12M
Absolute (%) -2.2 23.7 28
Relative (%) -0.3 14.3 6.4
Major shareholders % held Government of Indonesia 60.0
Analyst(s)
Jovent GIOVANNY
T (62) 21 3006 1727 E [email protected]
Timothy HANDERSON T (62) 21 3006 1724
[ X ]
SOURCE: COMPANY DATA, CIMB FORECASTS
Financial Summary Dec-14A Dec-15A Dec-16F Dec-17F Dec-18F
Net Interest Income (Rpb) 39,132 45,363 48,225 53,588 60,248
Total Non-Interest Income (Rpb) 17,749 21,773 23,139 22,903 25,737
Operating Revenue (Rpb) 56,882 67,136 71,364 76,490 85,985
Total Provision Charges (Rpb) (5,529) (12,043) (16,177) (11,234) (11,935)
Net Profit (Rpb) 19,872 20,335 18,395 23,144 26,638
Core EPS (Rp) 850 870 787 990 1,140
Core EPS Growth 12.1% 2.3% (9.6%) 25.8% 15.1%
FD Core P/E (x) 13.02 12.73 14.07 11.18 9.72
DPS (Rp) 234.0 212.9 261.4 197.1 248.0
Dividend Yield 2.11% 1.92% 2.36% 1.78% 2.24%
BVPS (Rp) 4,400 5,017 5,593 6,388 7,281
P/BV (x) 2.52 2.21 1.98 1.73 1.52
ROE 20.9% 18.5% 14.8% 16.5% 16.7%
% Change In Core EPS Estimates (0.30%) (7.79%) (8.11%)
CIMB/consensus EPS (x) 1.03 1.04 1.06
90.0
98.3
106.7
115.0
7,000
9,000
11,000
13,000
Price Close Relative to JCI (RHS)
50
100
150
Sep-15 Dec-15 Mar-16 Jun-16
Vo
l m
7

Oil & Gas Refinery│South Korea│Equity research│September 19, 2016
Company Note
IMPORTANT DISCLOSURES, INCLUDING ANY REQUIRED RESEARCH CERTIFICATIONS, ARE PROVIDED AT THE END OF THIS REPORT. IF THIS REPORT IS DISTRIBUTED IN THE UNITED STATES IT IS DISTRIBUTED BY CIMB SECURITIES (USA), INC. AND IS CONSIDERED THIRD-PARTY AFFILIATED RESEARCH.
Powered by the EFA Platform
S-Oil Corp Weak refining to drag down 3Q16 earnings
■ S-Oil’s 3Q16 net earnings likely to show a sharp decline (down 38% qoq) due to weaker refining fundamentals.
■ While refining division should post losses, we believe petrochem/lube divisions should continue to generate solid earnings in 3Q16.
■ We cut FY16-18 refining earnings by 5-26% to reflect a softer outlook. However, we are more positive on S-Oil’s petrochem/lube earnings.
■ Maintain Add on S-Oil, with a lower GGM-based target price of W105,000.
Expected loss in refining likely to drag earnings lower in 3Q16 Although refining margins have rebounded from US$3.4/bbl in early-Aug to ~US$7/bbl currently, we expect S-Oil’s 3Q16 operating profit (OP) to decline 64% qoq to W228bn (US$207m) given 1) weaker refining margins, 2) negative impact from the strong KRW, and 3) absence of positive oil price impact. While we expect its refining division to report a loss of W35bn in 3Q16 (vs. gain of W375bn in 2Q), petrochemical and lube earnings should remain robust (similar to SKI) as product spreads have stayed steady.
Rf margin, oil price and currency point to soft refining earnings… With gasoline fundamentals finally showing signs of recovery (spread up from US$10.4/bbl avg in Aug to ~US$14/bbl in Sep), refining margins have improved from US$4.5/bbl in Aug to US$6.6/bbl so far in Sep. However, we still expect the benchmark to be down from US$5.9/bbl in 2Q to US$5.5/bbl in 3Q given the QTD average. Coupled with the stronger KRW/US$ rate (W1,163/US$ in 2Q vs. W1,126/US$ QTD) and steady oil prices (US$12/bbl gain in 2Q), its refining division is likely to post losses in 3Q16.
… but non-refining earnings should remain robust in 3Q16 The PX-naphtha spread has been resilient in 2016, improving from US$349/t avg in 2015 to US$399/t in 1H16, and up further to US$426/t QTD, thanks to stronger demand from Chinese PTA/polyester makers and limited capacity expansion. Hence, we believe petrochem earnings to expand further to W153bn (US$139m) in 3Q16 from an already high level of W140bn (US$127m) in 2Q16. Despite the cost push from higher oil prices, lube earnings should also remain solid owing to firm demand for high-quality products.
Softer refining margin assumptions lead to lower earnings While refining margins started to recover in Sep, we think the full effect is likely to be felt from Nov onwards when winter demand picks up steam and the maintenance shutdown season starts to impact supply. Nonetheless, we have tempered our refining margin assumptions to take into account a softer trend (FY16 US$7.2/bbl to US$6.5, FY17 US$7.4 to US$7.0 and FY18 US$7.5 to US$7.2). Consequently, we have lowered our FY16-18 OP forecasts by 1-8% (also reflects higher non-refining earnings).
Buy on refining margin recovery and attractive valuations We reiterate our toned-down view on refiners due to a more subdued outlook for refining margins. However, with the refining supply-demand balance still looking benign in 2017, we believe refining margins will rally in the next several quarters. We maintain our Add call on S-Oil, with a lower GGM-based target price of W105,000 (based on 1.8x FY16F P/BV on 16% FY17F ROE), still representing ~40% upside. Key risks are slower oil demand growth and/or sustained high run rates leading to weaker refining margins.
▎South Korea
ADD (no change) Consensus ratings*: Buy 23 Hold 9 Sell 3
Current price: W74,500
Target price: W105,000
Previous target: W112,000
Up/downside: 40.9%
CIMB / Consensus: -4.1%
Reuters: 010950.KS
Bloomberg: 010950 KS
Market cap: US$7,476m
W8,387,418m
Average daily turnover: US$24.00m
W27,203m
Current shares o/s: 112.6m
Free float: 36.6% * Source: Bloomberg
Key changes in this note
2H16F OP decreased by 21%.
FY17F OP decreased by 1%.
FY18F OP decreased by 1%.
Source: Bloomberg
Price performance 1M 3M 12M Absolute (%) -0.8 -9.5 25.4
Relative (%) 1.7 -10.5 22.4
Major shareholders % held Aramco Overseas Company B.V. 63.4
Analyst(s)
Peter K. LEE
T (82) 2 6730 6122 E [email protected]
John PK PARK T (82) 2 6730 6125 E [email protected]
[ X ]
SOURCE: COMPANY DATA, CIMB FORECASTS
Financial Summary Dec-14A Dec-15A Dec-16F Dec-17F Dec-18F
Revenue (Wb) 28,558 17,890 15,254 16,852 18,140
Operating EBITDA (Wb) 50 1,091 2,009 1,837 1,941
Net Profit (Wb) (288) 631 1,402 1,109 1,131
Normalised EPS (W) (2,557) 5,608 12,456 9,847 10,042
Normalised EPS Growth (199%) 122% (21%) 2%
FD Normalised P/E (x) NA 13.29 5.98 7.57 7.42
DPS (W) 0 2,400 3,006 2,852 3,393
Dividend Yield 0.00% 3.22% 4.04% 3.83% 4.55%
EV/EBITDA (x) 216.3 8.5 4.5 6.1 5.8
P/FCFE (x) NA 4.79 18.37 NA 69.77
Net Gearing 50.5% 16.2% 11.6% 39.7% 34.4%
P/BV (x) 1.71 1.56 1.27 1.13 1.02
ROE (5.6%) 12.3% 23.4% 15.9% 14.5%
% Change In Normalised EPS Estimates (1.48%) (1.71%) (0.73%)
Normalised EPS/consensus EPS (x) 1.10 0.94 0.93
94.0
109.6
125.1
140.7
156.2
56,000
66,000
76,000
86,000
96,000
Price Close Relative to KOSPI (RHS)
500
1000
Sep-15 Dec-15 Mar-16 Jun-16
Vo
l th
8

Gaming│Malaysia│Equity research│September 19, 2016
Company Note
IMPORTANT DISCLOSURES, INCLUDING ANY REQUIRED RESEARCH CERTIFICATIONS, ARE PROVIDED AT THE END OF THIS REPORT. IF THIS REPORT IS DISTRIBUTED IN THE UNITED STATES IT IS DISTRIBUTED BY CIMB SECURITIES (USA), INC. AND IS CONSIDERED THIRD-PARTY AFFILIATED RESEARCH.
Powered by the EFA Platform
Berjaya Sports Toto Seasonally weak 1Q
We deem 1QFY04/17 core net profit of RM68m (US$17m) in line at 19% of our full-■year forecast and 21% of consensus as 1Q is seasonally weak.
1Q17 DPS of 4 sen was in line at 92% of 1Q net profit. ■ Vietnam will not contribute to profits but will reap long-term benefits via dividend ■income.
Maintain Hold rating and target price. ■
Stable operating metrics Sports Toto Malaysia (STM), BST’s Malaysian NFO business posted 1QFY04/17 revenue growth of 3.6% yoy due to higher sales from 4D Jackpot, while pretax profit rose 7.5% yoy to RM113m on lower prize payout. On a qoq basis, revenue fell 6.1% while pretax profit slid 33% yoy due to strong CNY sales last quarter and lower prize payout in 4Q16. (4QFY16: 63%, 1QFY17:66%). Headline net profit was negatively affected by RM9m in translation losses from its Philippines subsidiary.
HR Owen’s sales up on new model launches HR Owen’s (a luxury car distributor in UK and 71% subsidiary of BST’s Philippines subsidiary) revenue rose 17% yoy due to higher car sales volume and new model launches while pretax profit contracted 27% yoy as it was negatively impacted by higher opex in the quarter.
Dividend payout remains well above formal policy level BST paid out 92% of its 1Q net profit, well above its stated minimum dividend payout policy of 75%. We retain our FY17-19F payout ratio estimate of 85%.
Strong share price rebound since OPR cut BST’s share price has done well in the past three months, rising 16%. We believe this is due to 1) BST’s holding company Berjaya Land has stopped selling BST shares since Jun 16; and 2) a 25bp cut in overnight policy rate by Bank Negara Malaysia in Jul 16.
Vietnam: A long-term positive As BST’s effective stake in the Vietnam lottery operations is only 10%, we do not expect it to equity account Vietnam’s profits; however, it should benefit via any dividend income declared. We do not expect any profit contribution to BST in the first two years, but it should be a long-term positive for BST, as Malaysia’s NFO sector has gone ex-growth. The major beneficiary, in our view, will be BCorp (Not rated), BST’s ultimate holding company, which holds an effective 40% stake in BGT.
6.5% yield to provide share price support Our DDM-based target price is unchanged and supported by a 6.5% dividend yield. We maintain our FY17-19F EPS forecasts and Hold rating. We recommend Genting Malaysia for gaming exposure. Upside risk to our target price is a further cut in interest rate while downside risk is worsening NFO sales.
▎Malaysia
HOLD (no change) Consensus ratings*: Buy 3 Hold 9 Sell 0
Current price: RM3.39
Target price: RM3.10
Previous target: RM3.10
Up/downside: -8.7%
CIMB / Consensus: -5.2%
Reuters: BSTB.KL
Bloomberg: BST MK
Market cap: US$1,106m
RM4,570m
Average daily turnover: US$0.67m
RM2.72m
Current shares o/s: 1,351m
Free float: 57.4% * Source: Bloomberg
Key changes in this note
No change
Source: Bloomberg
Price performance 1M 3M 12M Absolute (%) 0.3 16.1 7.6
Relative (%) 2.5 14.6 7.2
Major shareholders % held Berjaya Land 42.6
Analyst(s)
Marcus CHAN, CFA
T (60) 3 2261 9070 E [email protected]
[ X ]
SOURCE: COMPANY DATA, CIMB FORECASTS
Financial Summary Apr-15A Apr-16A Apr-17F Apr-18F Apr-19F
Revenue (RMm) 5,288 5,563 5,387 5,389 5,393
Operating EBITDA (RMm) 588.6 522.0 568.3 572.2 576.9
Net Profit (RMm) 379.8 306.2 349.7 356.4 349.5
Core EPS (RM) 0.28 0.23 0.26 0.26 0.26
Core EPS Growth 7.8% (19.4%) 14.2% 1.9% (2.1%)
FD Core P/E (x) 12.06 14.96 13.10 12.85 13.13
DPS (RM) 0.22 0.19 0.22 0.22 0.22
Dividend Yield 6.34% 5.60% 6.49% 6.62% 6.47%
EV/EBITDA (x) 8.32 9.40 7.80 7.74 7.66
P/FCFE (x) 13.04 12.78 8.38 17.61 16.71
Net Gearing 35.0% 35.6% (16.9%) (16.5%) (16.5%)
P/BV (x) 6.69 6.01 4.77 4.52 4.29
ROE 58.1% 42.3% 40.6% 36.1% 33.5%
CIMB/consensus EPS (x) 1.06 1.05
91.0
96.1
101.3
106.4
2.80
3.00
3.20
3.40
Price Close Relative to FBMKLCI (RHS)
1
2
3
4
Sep-15 Dec-15 Mar-16 Jun-16
Vol m
9

Singapore│Equity research
Strategy Flash Note
IMPORTANT DISCLOSURES, INCLUDING ANY REQUIRED RESEARCH CERTIFICATIONS, ARE PROVIDED AT THE END OF THIS REPORT. IF THIS REPORT IS DISTRIBUTED IN THE UNITED STATES IT IS DISTRIBUTED BY CIMB SECURITIES (USA), INC. AND IS CONSIDERED THIRD-PARTY AFFILIATED RESEARCH.
Powered by the EFA Platform
Singapore Strategy Feedback from marketing
“Any good news in Singapore?” was a common question during our recent ■marketing trip to Singapore and Malaysia.
No major pushback on our defensive high-yield names, with Venture Corp, ST ■Engineering and Singtel as our three must-own top picks.
We replaced Best World with Thai Bev in our 10% hit list, given its recent surge. ■ Maintain Overweight on REITS and property, and identified two other themes to play ■the Singapore market: 1) ASEAN domestic consumption, and 2) new technology.
Stick to safe names, don’t mind paying premium valuations ● Among the regional funds, investors were mostly underweight on Singapore, with a
minority sticking to index names such as Singtel and Comfort Delgro. Singapore funds were generally receptive to our must-own, high-yield top picks of Venture Corp, STE and Singtel.
● In a weak economic growth environment, investors do not mind paying a premium valuation for stocks with earnings growth, such as SATS, Sheng Shiong and Raffles Medical. Investors were unanimously negative on offshore, marine and banks.
● The common questions were: 1) Will Singapore continue to ease monetary policy? 2) What could re-rate the FSSTI? 3) Any government-linked companies to be listed? 4) What company will be the next Swiber? 5) Banks are cheap, is it time to buy? 6) Will government relent on property cooling measures? 7) Is Sheng Shiong’s margin sustainable? 9) Will there be oversupply of data centres in Singapore? 8) What will Leo do to maintain or raise its beer market share against Thai Bev?
What can the government do? ● With projected core inflation of around 1% and GDP of 1-2% for 2016, we do not
foresee more easing measures after the Monetary Authority of Singapore’s (MAS) Apr 16 move to keep the rate of Singapore dollar appreciation to zero %. Current core inflation (0.8% for 7M16) and GDP (2.1% for 1H16) still track our forecasts. Hence, we believe the policy will be unchanged unless inflation and growth falls out of range.
● We expect to see more initiatives and emphasis on information, communication and technology (ICT) to set Singapore apart from its regional peers in the end-16 report from the Committee of Future Economy (CFE), spearheaded by the Ministry of Finance, together with 30 members from different industries. The CFE will build upon and update its 2010 report, in which one of the stark recommendations implemented was lower reliance of foreign labour over the years.
ASEAN domestic consumption & new technology are key themes ● We maintain Overweight on REITS and property, and see two additional themes to
play the Singapore equity market: Firstly, companies with ASEAN exposure, including Thai Bev, Courts Asia, Dairy Farm, Delfi and Singtel, as they benefit from rising domestic consumption in Thailand, Malaysia and Indonesia, spurred by pump priming and infrastructure spending by the government.
● Secondly, increase in demand for niche technologies such as life sciences, smart nation spending and big data cloud, could shape Singapore’s future economy. To this end, Venture Corp, STE, and KDC Reit are names that we think will benefit from this trend.
[ X ]
Figure 1: Singapore +10% and -10% return picks
SOURCES: CIMB, COMPANY REPORTS
Sector Recom. +10% return -10% downside
Property Overweight Capitaland, UOL -
REITs Overweight KDC REIT, MINT -
Gamnig Overweight GENS -
Comsumer Neutral Cityneon, Courts, ThaiBev, mm2 -
Telcos Neutral SingTel -
Others - Dutech Holdings, UMS Holdings, Venture -
Commodities Underweight First Resources Golden Agri
Capital Goods Underweight - SMM, EZION
Financials Underweight - OCBC
▎Singapore
September 19, 2016 - 5:34 PM
Highlighted companies
SingTel ADD, TP S$4.50, S$3.91 close
SingTel is the least at risk among its local peers of being negatively affected by the entry of a fourth mobile operator in Singapore due to its diversified operations. We forecast core net profit to be flat in FY17, then rise by a decent 8.4%/10.1% in FY18/19.
Thai Beverage ADD, TP S$1.14, S$0.93 close
Thai Bev would benefit from market share gain in beer segment, as we believe its competitor is unlikely to roll out drastic rebranding measures. Margin expansion from lower depreciation could also catalyse the stock.
Venture Corporation HOLD, TP S$9.52, S$9.00 close
Base DPS of S$0.50 remains defensible, given the company’s limited capex, translating into 5.4% dividend yield in FY16. Increasing demand for niche technology and life sciences could drive Venture’s earnings growth. Stronger 2H16 earnings are a key catalyst.
X#
S$NEER slope could remain flattish
FSSTI valuations
Analyst(s)
LIM Siew Khee
T (65) 6210 8664 E [email protected]
Title:
Source:
Please fill in the values above to have them entered in your report
#VALUE!
99
101
103
105
107
109
111
113
115
117
119
121
Oct-10 Apr-11 Oct-11 Apr-12 Oct-12 Apr-13 Oct-13 Apr-14 Oct-14 Apr-15 Oct-15 Apr-16
S$NEER
Stronger S$
Weaker S$
STI CY2014 CY2015 CY2016 CY2017 CY2018
Core P/E (x) 14.2x 12.9x 13.5x 13.2x 12.4x
FD Core P/E (x) 14.2x 12.9x 13.6x 13.3x 12.5x
Core EPS growth (%) 10% -6% -6% 3% 6%
Core Net Profit Growth (%) 4% -10% -2% 3% 6%
P/BV (x) 1.4x 1.2x 1.1x 1.1x 1.0x
Dividend yield (%) 3.5% 4.1% 3.9% 3.9% 4.1%
EV/EBITDA (x) 12.2x 13.4x 12.6x 11.9x 11.3x
P/FCF (x, equity) 13.6x (132.7x) 11.6x 16.3x 14.0x
P/FCF (x, firm) 23.0x (66.6x) 14.3x 22.0x 18.6x
Net gearing (%) 15.5% 18.1% 16.2% 16.6% 16.0%
ROE (%, recurring) 10.2% 9.0% 8.5% 8.2% 8.3%
FSSTI level 3,365 2,883 2,827 2,827 2,827
CIMB/consensus (x) 1.01 0.96 0.96
10

Automobiles and Parts│Taiwan│Equity research│September 19, 2016
Sector Note
IMPORTANT DISCLOSURES, INCLUDING ANY REQUIRED RESEARCH CERTIFICATIONS, ARE PROVIDED AT THE END OF THIS REPORT. IF THIS REPORT IS DISTRIBUTED IN THE UNITED STATES IT IS DISTRIBUTED BY CIMB SECURITIES (USA), INC. AND IS CONSIDERED THIRD-PARTY AFFILIATED RESEARCH.
Powered by the EFA Platform
Auto Parts Only half-way there
■ Taiwan auto part names benefit from outsourcing trends and growing content per car in the long run. We expect the mega-trend to continue.
■ We prefer original equipment (OE) suppliers to aftermarket (AM) suppliers in view of order visibility, earnings stability and level of entry barrier.
■ Client feedback on CUB centred on industry landscape and entry barrier for tyre pressure monitoring system (TPMS), deem unfavourable for CUB. Maintain Reduce.
■ Macauto is our top pick in Taiwan auto part space. Maintain Add.
Outsourcing trend favours Taiwan auto part names Taiwan auto part names have been benefitting from the manufacturing outsourcing trend since mid-2000s. The percentage of outsourced orders among North American auto makers had risen from 25% in 2007 to c.50% in 1H16, and we see Taiwanese auto part suppliers having unique advantages given their: 1) experience in AM business; 2) know-how in producing plastic/metallic auto parts; 3) cheap labour cost; and 4) minimal conflict of interest due to the lack of domestic car brands in Taiwan.
Still room to grow, but stick to potential outperformers While we believe the outsourcing trend and rising content per car due to new applications will keep unfolding, we think it is crucial to identify the long-term outperformers amid Taiwan auto part names before any unforeseen downside risks (such as a macro slowdown) materialise. After all, companies with different underlying addressable market has its own specific landscape.
We favour OE over AM given end-clients' switching costs We prefer OE suppliers over AM suppliers in Taiwan's auto part space, in view of the former's 1) higher entry-barrier; 2) more stable order flows; and 3) higher ROE (as shown in Figures 1 and 4). We believe the strict OE certification is key for these companies to move up the supply chain. The moat, in turn, creates longer order visibility and higher order stability that drives sustainability in earnings and ROE.
Our anti-consensus call on CUB generally accepted Clients generally agree with our non-consensus call on CUB given its pricey valuation Most client queries following our initiation report were on competition and entry barrier for TPMS. We hold our view that the technology entry barrier in the AM space is relatively low while the price competition is always fierce; this will lead to margin erosion.
Macauto our top pick in Taiwan auto parts sector Macauto’s valuation is in line with Taiwan auto part peers at 19.5x/16.7x FY16/17E EPS, which we deem still undemanding considering its steady margins outlook and superior ROE. We prefer OE over AM in Taiwan's auto part space, and favour Macauto (OE supplier) over CUB (AM supplier) from a long-term perspective.
[ X ]
Figure 1: ROE comparisons between OE and AM, 2010-15
SOURCES: CIMB RESEARCH, COMPANY, TEJ
▎ Taiwan
Neutral (N.A.)
Highlighted companies
CUB Elecparts REDUCE, TP NT$311.0, NT$363.0 close
We remain Reduce on CUB, in view of deceleration of TPMS replacement demand in US and impending gross margin pressure. We do not think the new business driver will come to the rescue in the near future.
Macauto Industrial ADD, TP NT$224.0, NT$201.5 close
We reiterate Add on Macauto, in view of its market share gain amid growing addressable market. We like its firm margin outlook and superior ROE, together with an undemanding valuation.
Summary valuation metrics
Analyst(s)
Mike YANG
T (886) 2 8729 8383 E [email protected]
Eric LIN T (886) 2 8729 8380 E [email protected]
0%
5%
10%
15%
20%
2010 2011 2012 2013 2014 2015
OE AM OE average AM average
P/E (x) Dec-16F Dec-17F Dec-18F
CUB Elecparts 24.19 21.57 20.65
Macauto Industrial 19.47 16.67 14.62
P/BV (x) Dec-16F Dec-17F Dec-18F
CUB Elecparts 10.07 8.57 7.54
Macauto Industrial 6.24 5.35 4.62
Dividend Yield Dec-16F Dec-17F Dec-18F
CUB Elecparts 2.89% 3.25% 3.39%
Macauto Industrial 3.34% 3.90% 4.79%
11

Telco - Fixed Line│Thailand│Equity research
Company Flash Note
IMPORTANT DISCLOSURES, INCLUDING ANY REQUIRED RESEARCH CERTIFICATIONS, ARE PROVIDED AT THE END OF THIS REPORT. IF THIS REPORT IS DISTRIBUTED IN THE UNITED STATES IT IS DISTRIBUTED BY CIMB SECURITIES (USA), INC. AND IS CONSIDERED THIRD-PARTY AFFILIATED RESEARCH. CIMB Securities Limited has had an investment banking relationship with Link Net and Jasmine Broadband Internet Infrastructure Fund within the preceding 12 months.
Powered by the EFA Platform
Jasmine International The finale ■ CEO Mr Bodharamik has proposed to buy Jasmine’s shares for THB7.25 apiece
and warrants for THB3.68 apiece.
■ From the current prices, this proposal is offering almost risk-free returns of 9% for shareholders and 15% for JAS-W3’s unit holders, with a 24-day holding period.
■ Maintain Add with the tender offer proposal as a re-rating catalyst.
Major shareholder tenders to buy all shares from minority holders ● This morning, Jasmine revealed that Mr Pete Bodharamik, who is the CEO and also
holds 1,844m Jasmine shares (31% of paid-up capital excluding 1,200m treasuryshares), had proposed to undertake a tender offer to purchase from minority shareholders 4,092m Jasmine common shares for THB7.25 per share and 2,734m units of JAS-W3 for THB3.68 per unit.
● The total transaction value will be THB39.7bn (US$1.13bn), financed by SCB. The tender offer period is set for 29 Sep - 3 Nov 16. According to the release, Mr Pete would like to better manage Jasmine and he has no intention to delist it from the SET.
Tender offer prices are quite tempting for minorities ● The tender offer price for Jasmine’s shares of THB7.25 is 9% above the latest price
and our target price of THB6.65. Meanwhile, the tender offer price for JAS-W3 ofTHB3.68 is 15% above the latest price. So we think all minority shareholders for both securities are likely to subscribe for this proposed tender offer.
Possible reasons behind tender offer proposal ● This tender offer proposal could have three reasons, in our opinion. First, Jasmine’s
share price is deeply undervalued in Bodharamik’s eyes, which we believe is due to the company’s substandard corporate governance. Second, this will ensure that Jasmine will not lack capital as the capex cycle for its fixed broadband coverage expansion will peak in FY16. Third, this is one of the best ways to avoid a possible hostile takeover.
Implications for fixed broadband industry landscape ● We see limited competitive implications for the fixed broadband industry from this
transaction as the number of players is still the same. On one hand, we are worried about Jasmine’s irrational business actions especially if it is delisted. On the other hand, this transaction illustrates the CEO’s strong confidence in the prospects of the fixed broadband business, driving him to put all his eggs in one basket.
Implications for JASIF ● On the bright side, JASIF’s potential earnings and valuation upside from new asset
injection from Jasmine is now more likely as an asset spin-off from Jasmine to JASIF could be one of Bodharamik’s funding alternatives.
● On the negative front, taking Jasmine private could increase the company’s risk of default as Bodharamik is likely to exploit its strong balance sheet to finance the tender offer transaction. Furthermore, the company will no longer need to comply with listed company disclosure and corporate governance practices.
An arbitrage opportunity ● We reiterate our earnings estimates, DCF-based target price of THB6.65 and Add call
on Jasmine. We recommend investors to buy the stock now and sell at THB7.25 with the tender offer in the next 24 working days to enjoy a risk-free return of 9%.
Figure 1: Tender offer proposal
SOURCES: CIMB, COMPANY REPORTS
Jasmine Amount JAS-W3 AmountPaid-up shares (m) 7,136 Outstanding units (m) 3,288Treasury shares -1,200Adj paid-up shares 5,936Pete's stake -1,844 Pete's stake -554Tender offer shares 4,092 Tender offer units 2,734Tender offer price (THB) 7.25 Tender offer price (THB) 3.68Tender offer proceeds (THB m) 29,665 Tender offer proceeds (THB m) 10,060Total proceeds needed (THB m) 39,725
▎Thailand September 19, 2016 - 1:49 PM
ADD (no change) Consensus ratings*: Buy 4 Hold 1 Sell 2
Current price: THB6.65 Target price: THB6.65 Previous target: THB6.65 Up/downside: 0.0% CIMB / Consensus: 59.3%
Reuters: JAS.BK Bloomberg: JAS TB Market cap: US$1,129m THB39,473m Average daily turnover: US$30.40m THB1,063m Current shares o/s 7,133m Free float: 65.4% * Source: Bloomberg
Key financial forecasts
Source: Bloomberg
Price performance 1M 3M 12M
Absolute (%) 11.8 27.9 14.7
Relative (%) 15.6 23.1 7.7
Major shareholders % held Mr. Pete Bodharamik 23.4 Quam Securities A/C client 6.7 Thai NVDR 2.6
Analyst(s)
Pisut NGAMVIJITVONG T (66) 2 657 9226 E [email protected]
Dec-16F Dec-17F Dec-18F
Net Profit (THBm) 2,868 4,604 5,599
Core EPS (THB) 0.45 0.62 0.78
Core EPS Growth 15.2% 35.6% 27.6%
FD Core P/E (x) 14.66 10.81 8.47
Recurring ROE 19.5% 23.8% 26.6%
P/BV (x) 2.74 2.42 2.12
DPS (THB) 0.20 0.32 0.39
Dividend Yield 3.02% 4.85% 5.90%
45.0
59.0
73.0
87.0
101.0
115.0
2.30
3.30
4.30
5.30
6.30
7.30
Price Close Relative to SET (RHS)
1
2
3
Sep-15 Dec-15 Mar-16 Jun-16
Vol
b
12

Property Development│Thailand│Equity research│September 19, 2016
Company Note │ Alpha series
IMPORTANT DISCLOSURES, INCLUDING ANY REQUIRED RESEARCH CERTIFICATIONS, ARE PROVIDED AT THE END OF THIS REPORT. IF THIS REPORT IS DISTRIBUTED IN THE UNITED STATES IT IS DISTRIBUTED BY CIMB SECURITIES (USA), INC. AND IS CONSIDERED THIRD-PARTY AFFILIATED RESEARCH.
Powered by the EFA Platform
Supalai PCL Saving the best for last
We upgrade SPALI from Hold to Add, with higher target price of THB26.75. ■ In our view, SPALI is the best play in the low- to mid-range segment due to its ■sizeable backlog, most efficient cost control and promising sales growth prospects.
Its existing order backlog has secured 89.3% and 47.8% of our revenue forecasts ■for 2016F and 2017F, respectively, the highest in the sector.
We expect core net profit growth to accelerate from 9.7% in 2016 to 13.4% in 2017. ■ SPALI is a likely key beneficiary of recovery in farm income. ■
Upgrade from Hold to Add with target price of THB26.75 We upgrade SPALI to Add because: 1) current valuation offers a good entry point, with expected total return of 24%, 2) it provides best earnings visibility in the sector with better growth prospects in 2017, and 3) it is a likely beneficiary of upturn in farm income, given its large exposure to provincial markets. SPALI is attractive now as share price has fallen 14.2% in Sep 16 from the YTD peak in Aug 16. We raise our 2016-18F EPS for SPALI by 2.9-8.3%. Our TP of THB26.75 is based on 8.5x FY17 P/E (8.4x previously), 0.25 s.d. above historical average forward P/E.
Superior earnings visibility in the sector We believe SPALI is the best play in the low- to mid-range segment due to its sizeable presales backlog, efficient cost control and promising growth prospects. SPALI’s backlog at end-2Q16 was THB34.5bn, which will be recognised as revenue in 2H16-2019. SPALI has higher earnings visibility in 2016-17F than its peers. The existing backlog has secured 89.3% and 47.8% of our revenue forecasts for 2016F and 2017F, respectively, versus sector average of 71.8% and 21.1%.
Core net profit growth to accelerate to 13.4% in 2017 We expect SPALI’s core net profit growth to accelerate from 9.7% in 2016 to 13.4% in 2017, driven by a surge in condo revenue, continued increase in revenue from low-rise housing and a slight improvement in gross margin. We estimate that SPALI’s condo revenue will rise 21.5% yoy to THB13.3bn in 2017, supported by 10 condo projects worth THB16.4bn that are scheduled to transfer next year.
Likely beneficiary of an upturn of farm income According to the Bank of Thailand, farm income growth turned positive to 3.3% yoy in 2Q16. Farm income index in Jul 16 rose 18.9% yoy. The pick-up in farm income is likely to be positive for property demand in provincial markets. In our view, SPALI will be a key beneficiary of a recovery in farm income, given its large exposure to provincial markets (largest in sector). The company targets for upcountry presales to contribute 25% of total presales in 2016, an increase from 21% in 2015.
Presales YTD on track to meet our FY16 expectation SPALI’s presales fell 44.9% mom but rose 33.3% yoy to THB1.9bn in Aug 16 owing to slower condo presales from the absence of new condo launches. Its 8M16 presales rose 40.2% yoy to THB15.6bn, representing 63.7% of our full-year forecast. We believe its presales are on track to meet our FY16 target of THB24.5bn. Low-rise housing presales YTD were impressive. Condo presales momentum is likely to pick up in 4Q16, boosted by the launch of two condos – Supalai Veranda Rama 9 and Supalai Sukhumvit 39.
▎Thailand
ADD (previously HOLD) Consensus ratings*: Buy 19 Hold 6 Sell 1
Current price: THB22.50
Target price: THB26.75
Previous target: THB24.50
Up/downside: 18.9%
CIMB / Consensus: 26.6%
Reuters: SPAL.BK
Bloomberg: SPALI TB
Market cap: US$1,105m
THB38,622m
Average daily turnover: US$5.41m
THB189.1m
Current shares o/s: 1,717m
Free float: 71.2% * Source: Bloomberg
Key changes in this note
FY16-18F residential revenue increased by 1.8-10.2%.
FY16-18F SG&A expenses increased by 1.0-11.7%.
FY16-8F EPS increased by 2.9-8.3%.
Source: Bloomberg
Price performance 1M 3M 12M
Absolute (%) -8.5 0 22.3
Relative (%) -4.7 -4.8 15.3
Major shareholders % held Tangmatitham family 28.2
Thai NVDR 9.6
State Street Bank 5.4
Analyst(s)
Pornthipa RAYABSANGDUAN
T (66) 2 657 9229 E [email protected]
SOURCE: COMPANY DATA, CIMB FORECASTS
Financial Summary Dec-14A Dec-15A Dec-16F Dec-17F Dec-18F
Total Net Revenues (THBm) 18,591 21,364 22,414 25,439 27,900
Operating EBITDA (THBm) 5,940 5,954 6,546 7,450 8,144
Net Profit (THBm) 4,478 4,349 4,772 5,410 5,892
Core EPS (THB) 2.61 2.53 2.78 3.15 3.43
Core EPS Growth 55.4% (2.9%) 9.7% 13.4% 8.9%
FD Core P/E (x) 8.62 8.88 8.09 7.14 6.55
DPS (THB) 1.00 1.00 1.11 1.26 1.37
Dividend Yield 4.44% 4.44% 4.94% 5.60% 6.10%
EV/EBITDA (x) 8.61 9.85 8.62 7.76 7.16
P/FCFE (x) 38.60 19.85 31.04 17.10 23.69
Net Gearing 66.4% 94.8% 72.0% 66.6% 59.2%
P/BV (x) 2.22 1.95 1.70 1.48 1.30
ROE 28.3% 23.3% 22.4% 22.1% 21.1%
% Change In Core EPS Estimates 2.93% 7.73% 8.18%
CIMB/consensus EPS (x) 1.00 1.03 1.02
88.0
97.0
106.0
115.0
124.0
133.0
16.0
18.0
20.0
22.0
24.0
26.0
Price Close Relative to SET (RHS)
10
20
30
Sep-15 Dec-15 Mar-16 Jun-16
Vol m
13

Asia Pacific Daily│Equity research│September 20, 2016
REGIONAL HEAD
Michael William GREENALL Regional Head of Research +60 (3) 2261 9088 [email protected]
COUNTRY HEADS OF RESEARCH
Ivy NG, CFA Siew Khee. LIM Erwan TEGUH Kasem PRUNRATANAMALA, CFA Michael KOKALARI, CFA Malaysia Singapore Indonesia Thailand Vietnam +60 (3) 2261 9073 +65 6210 8664 +62 (21) 3006 1720 +66 (2) 657 9221 +84 907 974408 [email protected] [email protected] [email protected] [email protected] [email protected] Bertram LAI Dohoon LEE Eric LIN Pramod AMTHE Joyce Anne, RAMOS Hong Kong/China South Korea Taiwan India Philippines +852 2532 1111 +82 (2) 6730 6121 +886 (2) 8729 8380 +91 (22) 6602-5167 +63 (2) 888 7293 [email protected] [email protected] [email protected] [email protected] [email protected] Coverage via partnership arrangement with Yolan SEIMON SB Equities Sri Lanka +94 (11) 2306273 [email protected] Coverage via partnership arrangement with John Keells Stock Brokers
REGIONAL SECTOR HEADS
KJ KWANG Ivy NG, CFA Raymond YAP, CFA Offshore & Marine Plantations Transportation +82 (2) 6730 6123 +60 (3) 2261 9073 +60 (3) 2261 9072 [email protected] [email protected] [email protected]
7
14

Asia Pacific Daily│Equity research│September 20, 2016
DISCLAIMER WJV#05 The content of this report (including the views and opinions expressed therein, and the information comprised therein) has been prepared by and belongs to CIMB save that (i) if it is a report written by the analyst(s) of John Keells Stock Brokers (“John Keells”), it belongs to John Keells; (ii) if it is a report written by the analyst(s) of SB Equities Inc (“SBE”), it belongs to SBE; and (iii) if it is a report written by the analyst(s) of Morgans Financial Limited (“Morgans”), it belongs to Morgans. This report is distributed by CIMB and in respect of sections of the report relating to (i), (ii) and/or (iii) aforesaid, it is distributed pursuant to an arrangement between John Keells, SBE and Morgans respectively and none of the aforesaid parties is an affiliate of CIMB. This report is not directed to, or intended for distribution to or use by, any person or entity who is a citizen or resident of or located in any locality, state, country or other jurisdiction where such distribution, publication, availability or use would be contrary to law or regulation. By accepting this report, the recipient hereof represents and warrants that he is entitled to receive such report in accordance with the restrictions set forth below and agrees to be bound by the limitations contained herein (including the “Restrictions on Distributions” set out below). Any failure to comply with these limitations may constitute a violation of law. This publication is being supplied to you strictly on the basis that it will remain confidential. No part of this report may be (i) copied, photocopied, duplicated, stored or reproduced in any form by any means or (ii) redistributed or passed on, directly or indirectly, to any other person in whole or in part, for any purpose without the prior written consent of CIMB. The information contained in this research report is prepared from data believed to be correct and reliable at the time of issue of this report. CIMB, John Keells, SBE and/or Morgans, as the case may be, may or may not issue regular reports on the subject matter of this report at any frequency and may cease to do so or change the periodicity of reports at any time. None of CIMB, John Keells, SBE or Morgans is under any obligation to update this report in the event of a material change to the information contained in this report. None of CIMB, John Keells, SBE or Morgans has any and none of them will accept any, obligation to (i) check or ensure that the contents of this report remain current, reliable or relevant, (ii) ensure that the content of this report constitutes all the information a prospective investor may require, (iii) ensure the adequacy, accuracy, completeness, reliability or fairness of any views, opinions and information, and accordingly, CIMB, John Keells, SBE and Morgans and their respective affiliates and related persons (and their respective directors, associates, connected persons and/or employees) shall not be liable in any manner whatsoever for any consequences (including but not limited to any direct, indirect or consequential losses, loss of profits and damages) of any reliance thereon or usage thereof. In particular, CIMB, John Keells, SBE and Morgans disclaim all responsibility and liability for the views and opinions set out in this report. Unless otherwise specified, this report is based upon reasonable sources. Such sources will, unless otherwise specified, for market data, be market data and prices available from the main stock exchange or market where the relevant security is listed, or, where appropriate, any other market. Information on the accounts and business of company(ies) will generally be based on published statements of the company(ies), information disseminated by regulatory information services, other publicly available information and information resulting from our research. Whilst every effort is made to ensure that statements of facts made in this report are accurate, all estimates, projections, forecasts, expressions of opinion and other subjective judgments contained in this report are based on assumptions considered to be reasonable as of the date of the document in which they are contained and must not be construed as a representation that the matters referred to therein will occur. Past performance is not a reliable indicator of future performance. The value of investments may go down as well as up and those investing may, depending on the investments in question, lose more than the initial investment. No report shall constitute an offer or an invitation by or on behalf of CIMB, John Keells, SBE or Morgans or their respective affiliates to any person to buy or sell any investments. CIMB, John Keells, SBE and/or Morgans and/or their respective affiliates and related companies, their directors, associates, connected parties and/or employees may own or have positions in securities of the company(ies) covered in this research report or any securities related thereto and may from time to time add to or dispose of, or may be materially interested in, any such securities. Further, CIMB, John Keells, SBE and/or Morgans and/or their respective affiliates and related companies do and seek to do business with the company(ies) covered in this research report and may from time to time act as market maker or have assumed an underwriting commitment in securities of such company(ies), may sell them to or buy them from customers on a principal basis and may also perform or seek to perform significant investment banking, advisory, underwriting or placement services for or relating to such company(ies) as well as solicit such investment, advisory or other services from any entity mentioned in this report. CIMB, John Keells, SBE and/or Morgans and/or their respective affiliates may enter into an agreement with the company(ies) covered in this report relating to the production of research reports. CIMB, John Keells, SBE and/or Morgans may disclose the contents of this report to the company(ies) covered by it and may have amended the contents of this report following such disclosure. The analyst responsible for the production of this report hereby certifies that the views expressed herein accurately and exclusively reflect his or her personal views and opinions about any and all of the issuers or securities analysed in this report and were prepared independently and autonomously. No part of the compensation of the analyst(s) was, is, or will be directly or indirectly related to the inclusion of specific recommendations(s) or view(s) in this report. The analyst(s) who prepared this research report are prohibited from receiving any compensation, incentive or bonus based on specific investment banking transactions or for providing a specific recommendation for, or view of, a particular company. Information barriers and other arrangements may be established where necessary to prevent conflicts of interests arising. However, the analyst(s) may receive compensation that is based on his/their coverage of company(ies) in the performance of his/their duties or the performance of his/their recommendations and the research personnel involved in the preparation of this report may also participate in the solicitation of the businesses as described above. In reviewing this research report, an investor should be aware that any or all of the foregoing, among other things, may give rise to real or potential conflicts of interest. Additional information is, subject to the duties of confidentiality, available on request. The term “John Keells Stock Brokers” shall, unless the context otherwise requires, mean each of John Keells Stock Brokers and its affiliates, subsidiaries and related companies. The term “SB Equities Inc.” shall, unless the context otherwise requires, mean each of SB Equities Inc. and its affiliates, subsidiaries and related companies. The term “Morgans Financial Limited” shall, unless the context otherwise requires, mean each of Morgans Financial Limited and its affiliates, subsidiaries and related companies. The term “CIMB” shall denote, where appropriate, the relevant entity distributing or disseminating the report in the particular jurisdiction referenced below, or, in every other case, CIMB Group Holdings Berhad ("CIMBGH") and its affiliates, subsidiaries and related companies.
8
15

Asia Pacific Daily│Equity research│September 20, 2016
Country CIMB Entity Regulated by Hong Kong CIMB Securities Limited Securities and Futures Commission Hong Kong India CIMB Securities (India) Private Limited Securities and Exchange Board of India (SEBI) Indonesia PT CIMB Securities Indonesia Financial Services Authority of Indonesia Malaysia CIMB Investment Bank Berhad Securities Commission Malaysia Singapore CIMB Research Pte. Ltd. Monetary Authority of Singapore South Korea CIMB Securities Limited, Korea Branch Financial Services Commission and Financial Supervisory Service Taiwan CIMB Securities Limited, Taiwan Branch Financial Supervisory Commission Thailand CIMB Securities (Thailand) Co. Ltd. Securities and Exchange Commission Thailand
Information in this report is a summary derived from individual research reports. As such, readers are directed to the individual research report or note to review the individual Research Analyst’s full analysis of the subject company. Important disclosures relating to the companies that are the subject of research reports published by CIMB, John Keells, SBE or Morgans, as the case may be, and the proprietary position by each of them and shareholdings of its Research Analysts’ who prepared the report in the securities of the company(s) are available in the individual research report. This report does not purport to contain all the information that a prospective investor may require. CIMB, John Keells, SBE and Morgans and their respective affiliates do not make any guarantee, representation or warranty, express or implied, as to the adequacy, accuracy, completeness, reliability or fairness of any such information and opinion contained in this report. None of CIMB, John Keells, SBE, Morgans and their respective affiliates and related persons shall be liable in any manner whatsoever for any consequences (including but not limited to any direct, indirect or consequential losses, loss of profits and damages) of any reliance thereon or usage thereof. This report is general in nature and has been prepared for information purposes only. It is intended for circulation amongst CIMB and its affiliates’ clients generally and does not have regard to the specific investment objectives, financial situation and the particular needs of any specific person who may receive this report. The information and opinions in this report are not and should not be construed or considered as an offer, recommendation or solicitation to buy or sell the subject securities, related investments or other financial instruments or any derivative instrument, or any rights pertaining thereto. Investors are advised to make their own independent evaluation of the information contained in this research report, consider their own individual investment objectives, financial situation and particular needs and consult their own professional and financial advisers as to the legal, business, financial, tax and other aspects before participating in any transaction in respect of the securities of company(ies) covered in this research report. The securities of such company(ies) may not be eligible for sale in all jurisdictions or to all categories of investors.
Australia : The distribution of this report is not an offer to buy or sell to any person within or outside Australia or a solicitation to any person within or outside of Australia to buy or sell any instrument described herein. This report is being issued outside Australia to a limited number of institutional investors and may not be provided to any person other than the original recipient and may not be reproduced or used for any other purposes. Canada: This research report has not been prepared in accordance with the disclosure requirements of Dealer Member Rule 3400 – Research Restrictions and Disclosure Requirements of the Investment Industry Regulatory Organization of Canada. For any research report distributed by CIBC, further disclosures related to CIBC conflicts of interest can be found at https://researchcentral.cibcwm.com . China: For the purpose of this report, the People’s Republic of China (“PRC”) does not include the Hong Kong Special Administrative Region, the Macau Special Administrative Region or Taiwan. The distributor of this report has not been approved or licensed by the China Securities Regulatory Commission or any other relevant regulatory authority or governmental agency in the PRC. This report contains only marketing information. The distribution of this report is not an offer to buy or sell to any person within or outside PRC or a solicitation to any person within or outside of PRC to buy or sell any instruments described herein. This report is being issued outside the PRC to a limited number of institutional investors and may not be provided to any person other than the original recipient and may not be reproduced or used for any other purpose. France: Only qualified investors within the meaning of French law shall have access to this report. This report shall not be considered as an offer to subscribe to, or used in connection with, any offer for subscription or sale or marketing or direct or indirect distribution of financial instruments and it is not intended as a solicitation for the purchase of any financial instrument. Germany: This report is only directed at persons who are professional investors as defined in sec 31a(2) of the German Securities Trading Act (WpHG). This publication constitutes research of a non-binding nature on the market situation and the investment instruments cited here at the time of the publication of the information. The current prices/yields in this issue are based upon closing prices from Bloomberg as of the day preceding publication. Please note that neither the German Federal Financial Supervisory Agency (BaFin), nor any other supervisory authority exercises any control over the content of this report. Hong Kong: This report is issued and distributed in Hong Kong by CIMB Securities Limited (“CHK”) which is licensed in Hong Kong by the Securities and Futures Commission for Type 1 (dealing in securities), Type 4 (advising on securities) and Type 6 (advising on corporate finance) activities. Any investors wishing to purchase or otherwise deal in the securities covered in this report should contact the Head of Sales at CIMB Securities Limited. The views and opinions in this research report are of CIMB, John Keells, SBE or Morgans, as the case may be, as of the date hereof and are subject to change. If the Financial Services and Markets Act of the United Kingdom or the rules of the Financial Conduct Authority apply to a recipient, our obligations owed to such recipient therein are unaffected. CHK has no obligation to update its opinion or the information in this research report. This publication is strictly confidential and is for private circulation only to clients of CHK. India: This report is issued and distributed in India by CIMB Securities (India) Private Limited (”CIMB India") which is registered with SEBI as a stock-broker under the Securities and Exchange Board of India (Stock Brokers and Sub-Brokers) Regulations, 1992, the Securities and Exchange Board of India (Research Analyst) Regulations, 2014 (SEBI Registration Number INH000000669) and in accordance with the provisions of Regulation 4 (g) of the Securities and Exchange Board of India (Investment Advisers) Regulations, 2013, CIMB India is not required
9
16
Asia Pacific Daily│Equity research│September 20, 2016
to seek registration with SEBI as an Investment Adviser. The research analysts, strategists or economists principally responsible for the preparation of this research report are segregated from equity stock broking and merchant banking of CIMB India and they have received compensation based upon various factors, including quality, accuracy and value of research, firm profitability or revenues, client feedback and competitive factors. Research analysts', strategists' or economists' compensation is not linked to investment banking or capital markets transactions performed or proposed to be performed by CIMB India or its affiliates.” Indonesia: This report is issued and distributed by PT CIMB Securities Indonesia (“CIMBI”). The views and opinions in this research report are our own as of the date hereof and are subject to change. If the Financial Services and Markets Act of the United Kingdom or the rules of the Financial Conduct Authority apply to a recipient, our obligations owed to such recipient therein are unaffected. CIMBI has no obligation to update its opinion or the information in this research report. Neither this report nor any copy hereof may be distributed in Indonesia or to any Indonesian citizens wherever they are domiciled or to Indonesian residents except in compliance with applicable Indonesian capital market laws and regulations. This research report is not an offer of securities in Indonesia. The securities referred to in this research report have not been registered with the Financial Services Authority (Otoritas Jasa Keuangan) pursuant to relevant capital market laws and regulations, and may not be offered or sold within the territory of the Republic of Indonesia or to Indonesian citizens through a public offering or in circumstances which constitute an offer within the meaning of the Indonesian capital market law and regulations. Ireland: CIMB is not an investment firm authorised in the Republic of Ireland and no part of this document should be construed as CIMB acting as, or otherwise claiming or representing to be, an investment firm authorised in the Republic of Ireland. Malaysia: This report is issued and distributed by CIMB Investment Bank Berhad (“CIMB”) solely for the benefit of and for the exclusive use of our clients. If the Financial Services and Markets Act of the United Kingdom or the rules of the Financial Conduct Authority apply to a recipient, our obligations owed to such recipient therein are unaffected. CIMB has no obligation to update, revise or reaffirm its opinion or the information in this research reports after the date of this report. New Zealand: In New Zealand, this report is for distribution only to persons who are wholesale clients pursuant to section 5C of the Financial Advisers Act 2008. Singapore: This report is issued and distributed by CIMB Research Pte Ltd (“CIMBR”). CIMBR is a financial adviser licensed under the Financial Advisers Act, Cap 110 (“FAA”) for advising on investment products, by issuing or promulgating research analyses or research reports, whether in electronic, print or other form. Accordingly CIMBR is a subject to the applicable rules under the FAA unless it is able to avail itself to any prescribed exemptions. Recipients of this report are to contact CIMB Research Pte Ltd, 50 Raffles Place, #19-00 Singapore Land Tower, Singapore in respect of any matters arising from, or in connection with this report. CIMBR has no obligation to update its opinion or the information in this research report. This publication is strictly confidential and is for private circulation only. If you have not been sent this report by CIMBR directly, you may not rely, use or disclose to anyone else this report or its contents. If the recipient of this research report is not an accredited investor, expert investor or institutional investor, CIMBR accepts legal responsibility for the contents of the report without any disclaimer limiting or otherwise curtailing such legal responsibility. If the recipient is an accredited investor, expert investor or institutional investor, the recipient is deemed to acknowledge that CIMBR is exempt from certain requirements under the FAA and its attendant regulations, and as such, is exempt from complying with the following : (a) Section 25 of the FAA (obligation to disclose product information); (b) Section 27 (duty not to make recommendation with respect to any investment product without having a reasonable basis where you may be reasonably expected to rely on the recommendation) of the FAA; (c) MAS Notice on Information to Clients and Product Information Disclosure [Notice No. FAA-N03]; (d) MAS Notice on Recommendation on Investment Products [Notice No. FAA-N16]; (e) Section 36 (obligation on disclosure of interest in securities), and (f) any other laws, regulations, notices, directive, guidelines, circulars and practice notes which are relates to the above, to the extent permitted by applicable laws, as may be amended from time to time, and any other laws, regulations, notices, directive, guidelines, circulars, and practice notes as we may notify you from time to time. In addition, the recipient who is an accredited investor, expert investor or institutional investor acknowledges that a CIMBR is exempt from Section 27 of the FAA, the recipient will also not be able to file a civil claim against CIMBR for any loss or damage arising from the recipient’s reliance on any recommendation made by CIMBR which would otherwise be a right that is available to the recipient under Section 27 of the FAA, the recipient will also not be able to file a civil claim against CIMBR for any loss or damage arising from the recipient’s reliance on any recommendation made by CIMBR which would otherwise be a right that is available to the recipient under Section 27 of the FAA. South Korea: This report is issued and distributed in South Korea by CIMB Securities Limited, Korea Branch (“CIMB Korea”) which is licensed as a cash equity broker, and regulated by the Financial Services Commission and Financial Supervisory Service of Korea. In South Korea, this report is for distribution only to professional investors under Article 9(5) of the Financial Investment Services and Capital Market Act of Korea (“FSCMA”). Spain: This document is a research report and it is addressed to institutional investors only. The research report is of a general nature and not personalised and does not constitute investment advice so, as the case may be, the recipient must seek proper advice before adopting any investment decision. This document does not constitute a public offering of securities. CIMB is not registered with the Spanish Comision Nacional del Mercado de Valores to provide investment services. Sweden: This report contains only marketing information and has not been approved by the Swedish Financial Supervisory Authority. The distribution of this report is not an offer to sell to any person in Sweden or a solicitation to any person in Sweden to buy any instruments described herein and may not be forwarded to the public in Sweden. Switzerland: This report has not been prepared in accordance with the recognized self-regulatory minimal standards for research reports of banks issued by the Swiss Bankers’ Association (Directives on the Independence of Financial Research).
10
17

Asia Pacific Daily│Equity research│September 20, 2016
Taiwan: This research report is not an offer or marketing of foreign securities in Taiwan. The securities as referred to in this research report have not been and will not be registered with the Financial Supervisory Commission of the Republic of China pursuant to relevant securities laws and regulations and may not be offered or sold within the Republic of China through a public offering or in circumstances which constitutes an offer or a placement within the meaning of the Securities and Exchange Law of the Republic of China that requires a registration or approval of the Financial Supervisory Commission of the Republic of China. Thailand: This report is issued and distributed by CIMB Securities (Thailand) Company Limited (“CIMBS”) based upon sources believed to be reliable (but their accuracy, completeness or correctness is not guaranteed). The statements or expressions of opinion herein were arrived at after due and careful consideration for use as information for investment. Such opinions are subject to change without notice and CIMBS has no obligation to update its opinion or the information in this research report. If the Financial Services and Markets Act of the United Kingdom or the rules of the Financial Conduct Authority apply to a recipient, our obligations owed to such recipient are unaffected. CIMB Securities (Thailand) Co., Ltd. may act or acts as Market Maker, and issuer and offerer of Derivative Warrants and Structured Note which may have the following securities as its underlying securities. Investors should carefully read and study the details of the derivative warrants in the prospectus before making investment decisions. AAV, ADVANC, AMATA, ANAN, AOT, AP, BA, BANPU, BBL, BCP, BDMS, BEAUTY, BEC, BEM, BH, BJCHI, BLA, BLAND, BTS, CBG, CENTEL, CHG, CK, CKP, CPALL, CPF, CPN, DELTA, DTAC, EARTH, EGCO, EPG, GL, GLOW, GPSC, GUNKUL, HANA, HMPRO, ICHI, INTUCH, IRPC, ITD, IVL, JAS, KBANK, KCE, KKP, KTB, KTC, LH, LHBANK, LPN, M, MAJOR, MINT, PLANB, PLAT, PS, PTG, PTT, PTTEP, PTTGC, QH, ROBINS, RS, S, SAMART, SAMTEL, SAWAD, SCB, SCC, SCCC, SCN, SGP, SIRI, SPALI, SPCG, STEC, STPI, SVI, TASCO, TCAP, THAI, THCOM, TICON, TISCO, TMB, TOP, TPIPL, TRUE, TTA, TTCL, TTW, TU, UNIQ, UV, VGI, VNG, WHA, WORK. Corporate Governance Report: The disclosure of the survey result of the Thai Institute of Directors Association (“IOD”) regarding corporate governance is made pursuant to the policy of the Office of the Securities and Exchange Commission. The survey of the IOD is based on the information of a company listed on the Stock Exchange of Thailand and the Market for Alternative Investment disclosed to the public and able to be accessed by a general public investor. The result, therefore, is from the perspective of a third party. It is not an evaluation of operation and is not based on inside information. The survey result is as of the date appearing in the Corporate Governance Report of Thai Listed Companies. As a result, the survey result may be changed after that date. CIMBS does not confirm nor certify the accuracy of such survey result.
Score Range: 90 - 100 80 - 89 70 - 79 Below 70 or No Survey Result Description: Excellent Very Good Good N/A
United Arab Emirates: The distributor of this report has not been approved or licensed by the UAE Central Bank or any other relevant licensing authorities or governmental agencies in the United Arab Emirates. This report is strictly private and confidential and has not been reviewed by, deposited or registered with UAE Central Bank or any other licensing authority or governmental agencies in the United Arab Emirates. This report is being issued outside the United Arab Emirates to a limited number of institutional investors and must not be provided to any person other than the original recipient and may not be reproduced or used for any other purpose. Further, the information contained in this report is not intended to lead to the sale of investments under any subscription agreement or the conclusion of any other contract of whatsoever nature within the territory of the United Arab Emirates. United Kingdom: In the United Kingdom and European Economic Area, this report is being disseminated by CIMB Securities (UK) Limited (“CIMB UK”). CIMB UK is authorized and regulated by the Financial Conduct Authority and its registered office is at 27 Knightsbridge, London, SW1X7YB. Unless specified to the contrary, this report has been issued and approved for distribution in the U.K. and the EEA by CIMB UK. Investment research issued by CIMB UK has been prepared in accordance with CIMB Group’s policies for managing conflicts of interest arising as a result of publication and distribution of investment research. This report is for distribution only to, and is solely directed at, selected persons on the basis that those persons: (a) are eligible counterparties and professional clients of CIMB UK; (b) have professional experience in matters relating to investments falling within Article 19(5) of the Financial Services and Markets Act 2000 (Financial Promotion) Order 2005 (as amended, the “Order”), (c) fall within Article 49(2)(a) to (d) (“high net worth companies, unincorporated associations etc”) of the Order; (d) are outside the United Kingdom subject to relevant regulation in each jurisdiction, or (e) are persons to whom an invitation or inducement to engage in investment activity (within the meaning of section 21 of the Financial Services and Markets Act 2000) in connection with any investments to which this report relates may otherwise lawfully be communicated or caused to be communicated (all such persons together being referred to as “relevant persons”). This report is directed only at relevant persons and must not be acted on or relied on by persons who are not relevant persons. Any investment or investment activity to which this report relates is available only to relevant persons and will be engaged in only with relevant persons. Where this report is labelled as non-independent, it does not provide an impartial or objective assessment of the subject matter and does not constitute independent “investment research” under the applicable rules of the Financial Conduct Authority in the UK. Consequently, any such non-independent report will not have been prepared in accordance with legal requirements designed to promote the independence of investment research and will not subject to any prohibition on dealing ahead of the dissemination of investment research. Any such non-independent report must be considered as a marketing communication. United States: This research report is distributed in the United States of America by CIMB Securities (USA) Inc, a U.S. registered broker-dealer and a related company of CIMB Research Pte Ltd, CIMB Investment Bank Berhad, PT CIMB Securities Indonesia, CIMB Securities (Thailand) Co. Ltd, CIMB Securities Limited, CIMB Securities (India) Private Limited, and is distributed solely to persons who qualify as “U.S. Institutional Investors” as defined in Rule 15a-6 under the Securities and Exchange Act of 1934. This communication is only for Institutional Investors whose ordinary business activities involve investing in shares, bonds, and associated securities and/or derivative securities and who have professional experience in such investments. Any person who is not a U.S. Institutional Investor or Major Institutional Investor must not rely on this communication. The delivery of this research report to any person in the United States of America is not a recommendation to effect any transactions in the securities discussed herein, or an endorsement of any opinion expressed herein. CIMB Securities (USA) Inc, is a FINRA/SIPC
11
18

Asia Pacific Daily│Equity research│September 20, 2016
member and takes responsibility for the content of this report. For further information or to place an order in any of the above-mentioned securities please contact a registered representative of CIMB Securities (USA) Inc. Other jurisdictions: In any other jurisdictions, except if otherwise restricted by laws or regulations, this report is only for distribution to professional, institutional or sophisticated investors as defined in the laws and regulations of such jurisdictions.
Corporate Governance Report of Thai Listed Companies (CGR). CG Rating by the Thai Institute of Directors Association (Thai IOD) in 2015, Anti-Corruption Progress Indicator 2015. AAV – Very Good, 3B, ADVANC – Excellent, 3A, AEONTS – Good, 1, AMATA – Very Good, 2, ANAN – Very Good, 3A, AOT – Very Good, 2, AP - Good, 3A, ASK – Very Good, 3B, ASP – Very Good, 4, BANPU – Very Good, 4, BAY – Very Good, 4, BBL – Very Good, 4, BCH – not available, no progress, BCP - Excellent, 5, BEM – not available, no progress, BDMS – Very Good, 3B, BEAUTY – Good, 2, BEC - Good, 3B, BH - Good, 2, BIGC - Excellent, 3A, BJC – Good, 1, BLA – Very Good, 4, 1, BTS - Excellent, 3A, CBG – Good, 1, CCET – not available, 1, CENTEL – Very Good, 3A, CHG – Good, 3B, CK – Excellent, 3B, COL – Very Good, 3A, CPALL – Good, 3A, CPF – Very Good, 3A, CPN - Excellent, 5, DELTA - Very Good, 3A, DEMCO – Very Good, 3A, DTAC – Excellent, 3A, EA – not available, 3A, ECL – Good, 4, EGCO - Excellent, 4, EPG – not available, 3B, GFPT - Very Good, 3A, GLOBAL – Very Good, 2, GLOW - Good, 3A, GPSC – not available, 3B, GRAMMY - Excellent, 3B, GUNKUL – Very Good, 1, HANA - Excellent, 4, HMPRO - Excellent, 3A, ICHI – Very Good, 3A, INTUCH - Excellent, 4, ITD – Good, 1, IVL - Excellent, 4, JAS – not available, 3A, JASIF – not available, no progress, JUBILE – Good, 3A, KAMART – not available, no progress, KBANK - Excellent, 4, KCE - Excellent, 4, KGI – Good, 4, KKP – Excellent, 4, KSL – Very Good, 2, KTB - Excellent, 4, KTC – Very Good, 3A, LH - Very Good, 3B, LPN – Excellent, 3A, M - Good, 2, MAJOR - Good, 1, MAKRO – Good, 3A, MALEE – not available, 2, MBKET – Good, 2, MC – Very Good, 3A, MCOT – Excellent, 3A, MEGA – Very Good, 2, MINT - Excellent, 3A, MTLS – Good, 2, NYT – Good, no progress, OISHI – Very Good, 3B, PLANB – Good, 3B, PS – Excellent, 3A, PSL - Excellent, 4, PTT - Excellent, 5, PTTEP - Excellent, 4, PTTGC - Excellent, 5, QH – Very Good, 2, RATCH – Excellent, 3A, ROBINS – Excellent, 3A, RS – Very Good, 1, SAMART - Excellent, 3B, SAPPE - Good, 3B, SAT – Excellent, 5, SAWAD – Good, 1, SC – Excellent, 3B, SCB - Excellent, 4, SCBLIF – not available, no progress, SCC – Excellent, 5, SCN – Good, 1, SCCC - Good, 3A, SIM - Excellent, 3B, SIRI - Good, 1, SPALI - Excellent, 3A, SPRC – not available, no progress, STA – Very Good, 1, STEC – Very Good, 3B, SVI – Very Good, 3A, TASCO – Very Good, 3A, TCAP – Very Good, 4, THAI – Very Good, 3A, THANI – Very Good, 5, THCOM – Excellent, 4, THRE – Very Good, 3A, THREL – Very Good, 3A, TICON – Very Good, 3A, TISCO - Excellent, 4, TK – Very Good, 3B, TKN – not available, no progress, TMB - Excellent, 4, TPCH – Good, 3B, TOP - Excellent, 5, TRUE – Very Good, 2, TTW – Very Good, 2, TU – Very Good, 3A, UNIQ – not available, 2, VGI – Excellent, 3A, WHA – Good, 3A, WORK – not available, no progress.
Comprises level 1 to 5 as follows: Level 1: Committed Level 2: Declared Level 3: Established (3A: Established by Declaration of Intent, 3B: Established by Internal Commitment and Policy) Level 4: Certified Level 5: Extended.
CIMB Recommendation Framework Stock Ratings Definition: Add The stock’s total return is expected to exceed 10% over the next 12 months. Hold The stock’s total return is expected to be between 0% and positive 10% over the next 12 months. Reduce The stock’s total return is expected to fall below 0% or more over the next 12 months. The total expected return of a stock is defined as the sum of the: (i) percentage difference between the target price and the current price and (ii) the forward net dividend yields of the stock. Stock price targets have an investment horizon of 12 months.
Sector Ratings Definition: Overweight An Overweight rating means stocks in the sector have, on a market cap-weighted basis, a positive absolute
recommendation. Neutral A Neutral rating means stocks in the sector have, on a market cap-weighted basis, a neutral absolute
recommendation. Underweight An Underweight rating means stocks in the sector have, on a market cap-weighted basis, a negative absolute
recommendation.
Country Ratings Definition: Overweight An Overweight rating means investors should be positioned with an above-market weight in this country relative to
benchmark. Neutral A Neutral rating means investors should be positioned with a neutral weight in this country relative to benchmark. Underweight An Underweight rating means investors should be positioned with a below-market weight in this country relative to
benchmark.
12
19