Equity Research Report Midcap Partners OSAI AS SPA BUY
45
MIDCAP PARTNERS • LOUIS CAPITAL MARKETS • 42 rue Washington • PARIS • 130 Wood Street • LONDON Equity Research Report – Midcap Partners OSAI AS SPA BUY Unique skills for automation Target Price: 2.7€ 5 November 2020 Potential Upside: +65% A Skill Based Jewel OSAI is an absolute leader in the automation sector. The company has been able to achieve exceptional revenue growth over the past 13 years. OSAI has increased revenue from €6.7m in 2007 to €35.6m in 2019, a compound annual growth rate of 15% over the period. In addition, OSAI's EBITDA margin has remained consistently above 10%, peaking at around 16% in 2018 and 2019. Despite its small size, OSAI is an international leader with nearly 80% of its revenues coming from exports. OSAI provides innovative solutions to many different sectors and is a partner of the world's largest multinational companies such as Marelli (automotive), Hanon Systems (automotive), Medtronic (medical technology), OSRAM (electronic devices), STM (semiconductors), Infineon (semiconductors) and AMKOR (semiconductors). A Resilient Business Model Suffering Only a Moderate Covid Impact OSAI is a highly technological company. Teleworking measures were easy to implement since the company was already prepared. Thus, the COVID epidemic did not have too severe an impact on its financial results. OSAI was able to operate with almost 80% of its workforce, 140 people, working intelligently. This flexibility is reflected in the H1 results where the company posted a revenue loss of only 21% compared to the same period in 2019 and the EBITDA margin even increased from 6.7% in H1 2019 to 10.8% in H1 2020 (+410 bp). In addition, OSAI's financial health was fully in line with end-2019, with a net financial position of €17.42m (compared with €17.43m at the end-2019). A Horizon Full of Opportunities OSAI's most interesting feature is that the company is exposed to the fastest niches in all the markets where it operates. In the automotive industry, management has been able to redirect its attention from the traditional car to intelligent mobility and electric cars. OSAI is also investing heavily in the medical sector, which is expected to experience double-digit growth in the medium and long term, particularly in Asia. Not only will these markets be the fastest growing, but they are also the markets with the highest margins. It is therefore expected that not only will OSAI's revenue tend to increase sharply, but above all that the company will be in a position to structurally increase its margins, and thus its cash flow. Valuation: Target Price at 2.7€ and BUY recommendation Our discounted cash flow valuation method, which is based on a terminal growth rate of 2.0% and a WACC of 9.9%, gives an enterprise value of 49.7 million euros, which implies a multiple of 1.2 of sales in 2021. Subtracting the net financial position of €12.2 million gives an equity value of €37.5 million or €2.7 per share. Market Data Industry Industrial Automation Share Price (€) 1,6 Market Cap (€M) 23,1 Market Segment AIM Italia Bloomberg OSA IT Ownership Structure Mirella Ferrero 63,1% Free Float 36,9% €M (31/12) 2019A 2020E 2021E 2022E Sales (€M) 38,6 34,9 40,4 48,0 Growth 29,3% -9,6% 15,9% 18,8% EBIT 3,3 2,7 3,3 4,4 EBIT Margin 8,4% 7,7% 8,1% 9,1% Net Income 1,9 1,4 1,9 2,7 EPS € 0,19 0,12 0,13 0,19 EPS growth 10,7% -37,5% 12,0% 45,8% FCF -2,1 1,8 -2,2 0,2 ROIC 8,6% 7,2% 7,6% 9,5% Net debt 17,4 10,1 12,3 12,1 Gearing net 254% 71% 76% 64% Upcoming Event 29/03/2021 FY 2020 Rating History n.a. Contact Analyst David Coppini (lead) Pierre Vaurice Email [email protected] Phone +33 (0)1 78 95 71 78 Midcap Partners estimates
Transcript of Equity Research Report Midcap Partners OSAI AS SPA BUY

MIDCAP PARTNERS • LOUIS CAPITAL MARKETS • 42 rue Washington • PARIS • 130 Wood Street • LONDON
Equity Research Report – Midcap Partners
OSAI AS SPA BUY Unique skills for automation Target Price: 2.7€
5 November 2020 Potential Upside: +65%
A Skill Based Jewel
OSAI is an absolute leader in the automation sector. The company has been able to achieve exceptional revenue growth over the past 13 years. OSAI has increased revenue from €6.7m in 2007 to €35.6m in 2019, a compound annual growth rate of 15% over the period.
In addition, OSAI's EBITDA margin has remained consistently above 10%, peaking at around 16% in 2018 and 2019.
Despite its small size, OSAI is an international leader with nearly 80% of its revenues coming from exports.
OSAI provides innovative solutions to many different sectors and is a partner of the world's largest multinational companies such as Marelli (automotive), Hanon Systems (automotive), Medtronic (medical technology), OSRAM (electronic devices), STM (semiconductors), Infineon (semiconductors) and AMKOR (semiconductors).
A Resilient Business Model Suffering Only a Moderate Covid Impact
OSAI is a highly technological company. Teleworking measures were easy to implement since the company was already prepared. Thus, the COVID epidemic did not have too severe an impact on its financial results. OSAI was able to operate with almost 80% of its workforce, 140 people, working intelligently. This flexibility is reflected in the H1 results where the company posted a revenue loss of only 21% compared to the same period in 2019 and the EBITDA margin even increased from 6.7% in H1 2019 to 10.8% in H1 2020 (+410 bp). In addition, OSAI's financial health was fully in line with end-2019, with a net financial position of €17.42m (compared with €17.43m at the end-2019).
A Horizon Full of Opportunities
OSAI's most interesting feature is that the company is exposed to the fastest niches in all the markets where it operates. In the automotive industry, management has been able to redirect its attention from the traditional car to intelligent mobility and electric cars. OSAI is also investing heavily in the medical sector, which is expected to experience double-digit growth in the medium and long term, particularly in Asia. Not only will these markets be the fastest growing, but they are also the markets with the highest margins. It is therefore expected that not only will OSAI's revenue tend to increase sharply, but above all that the company will be in a position to structurally increase its margins, and thus its cash flow.
Valuation: Target Price at 2.7€ and BUY recommendation
Our discounted cash flow valuation method, which is based on a terminal growth rate of 2.0% and a WACC of 9.9%, gives an enterprise value of 49.7 million euros, which implies a multiple of 1.2 of sales in 2021. Subtracting the net financial position of €12.2 million gives an equity value of €37.5 million or €2.7 per share.
Market Data
Industry Industrial Automation
Share Price (€) 1,6
Market Cap (€M) 23,1
Market Segment AIM Italia
Bloomberg OSA IT
Ownership Structure
Mirella Ferrero 63,1%
Free Float 36,9%
€M (31/12) 2019A 2020E 2021E 2022E
Sales (€M) 38,6 34,9 40,4 48,0
Growth 29,3% -9,6% 15,9% 18,8%
EBIT 3,3 2,7 3,3 4,4
EBIT Margin 8,4% 7,7% 8,1% 9,1%
Net Income 1,9 1,4 1,9 2,7
EPS € 0,19 0,12 0,13 0,19
EPS growth 10,7% -37,5% 12,0% 45,8%
FCF -2,1 1,8 -2,2 0,2
ROIC 8,6% 7,2% 7,6% 9,5%
Net debt 17,4 10,1 12,3 12,1
Gearing net 254% 71% 76% 64%
Upcoming Event
29/03/2021 FY 2020
Rating History
n.a.
Contact
Analyst David Coppini (lead)
Pierre Vaurice
Email [email protected]
Phone +33 (0)1 78 95 71 78
Midcap Partners estimates

MIDCAP PARTNERS • LOUIS CAPITAL MARKETS • 42 rue Washington • PARIS • 130 Wood Street • LONDON 2
I. INTRODUCTION 4
II. MARKET 8
III. INDUSTRIAL MODEL 12
IV. DIVISIONS 13
V. WIDE TECHNOLOGICAL PORTFOLIO COVERING DIFFERENT SECTORS AND MACHINE
TYPES: 25
VI. TECHNOLOGIES 26
VII. FINANCIAL ANALYSIS 27
VIII. OUTLOOK 32
IX. MANAGEMENT 35
X. ESG 36
XI. VALUATION 38
XII. FINANCIAL DATA (1/2) 42
XIII. FINANCIAL DATA (2/2) 43
DISCLAIMER 44

MIDCAP PARTNERS • LOUIS CAPITAL MARKETS • 42 rue Washington • PARIS • 130 Wood Street • LONDON 3
SWOT Analysis
Strengths Weaknesses
Highly skilled workforce
Strong track record (more than 30 years of experience)
Strategic partnerships with every client who relies on OSAI for innovation
Flexible and adaptable business model
Very strong brand recognition
Very small size compared to international competitors
Few resources to rapidly increase operations and invest in R&D
Sales come almost entirely from direct channel: distributors represent only 7%
Opportunities Threats
Exposure to fast-growing niches in each business unit
OSAI accompanied its growth with a passive strategy, which shows that customers contacted the company for its reputation as a solutions provider. Today, OSAI wants to become an active international player with an efficient sales force.
To take advtage of the worldwide installed base (more than 1000 machines) to develop the service and after-sales division
The traditional automobile segment is weakening (negative growth rate) and represents 15% of 2019 sales.
OSAI’s growth depends heavily on its R&D investments. However, the return on investment could become negative if its solutions do not materialise
Source : Company, Midcap Partners
MIDCAP PARTNERS • LOUIS CAPITAL MARKETS • 42 rue Washington • PARIS • 130 Wood Street • LONDON 4
I. Introduction
Osai was born in 1991 from the vision of its founder, Carlo Ferrero, of a more efficient and automated industrial world. Nowadays, the group is one of the most innovative global players in the design and construction of automatic assembly and testing machines and systems. Over the years, the company has developed a highly diversified portfolio of solutions in the following areas:
Micromechanics Semiconductor assembly and testing Automation of components and systems Laser cutting and welding Laser marking and cutting Automatic vertical loading systems
Source: Company
OSAI’s clients are global companies operating in a broad range of sectors including semiconductor manufacturers, integrated electronic systems, automotive components, and medical devices.
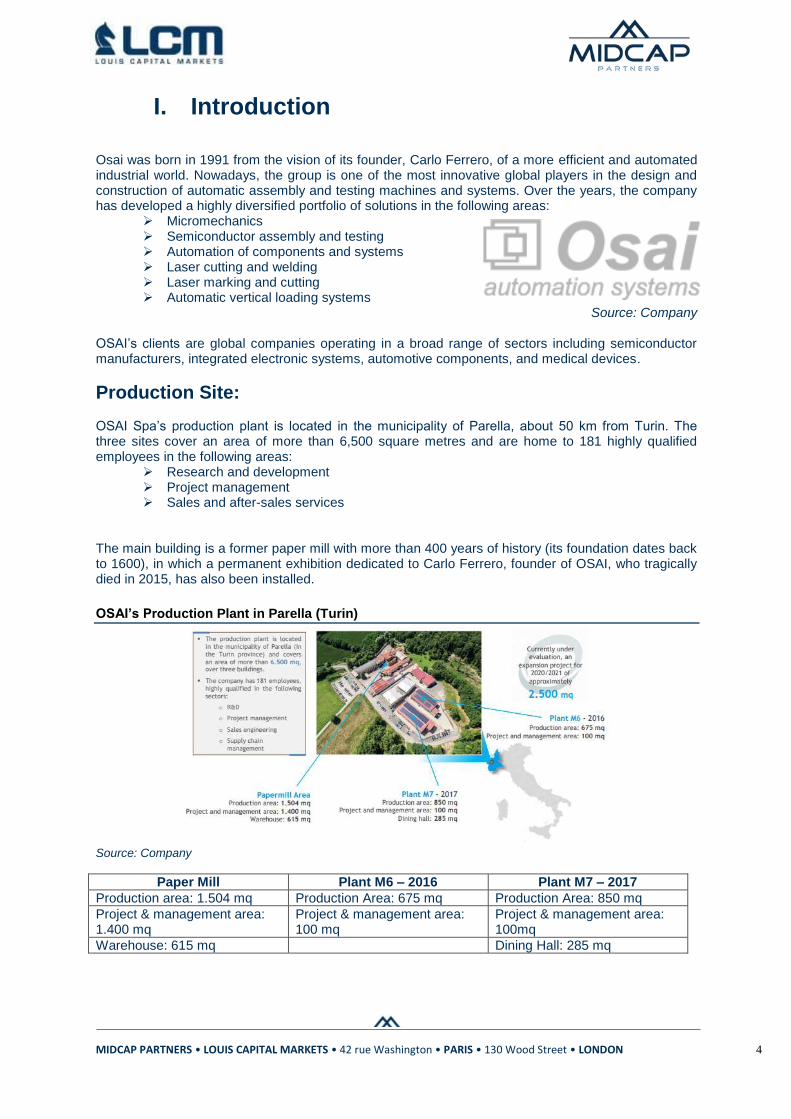
Production Site: OSAI Spa’s production plant is located in the municipality of Parella, about 50 km from Turin. The three sites cover an area of more than 6,500 square metres and are home to 181 highly qualified employees in the following areas:
Research and development Project management Sales and after-sales services
The main building is a former paper mill with more than 400 years of history (its foundation dates back to 1600), in which a permanent exhibition dedicated to Carlo Ferrero, founder of OSAI, who tragically died in 2015, has also been installed.
OSAI’s Production Plant in Parella (Turin)
Source: Company
Paper Mill Plant M6 – 2016 Plant M7 – 2017
Production area: 1.504 mq Production Area: 675 mq Production Area: 850 mq
Project & management area: 1.400 mq
Project & management area: 100 mq
Project & management area: 100mq
Warehouse: 615 mq Dining Hall: 285 mq

MIDCAP PARTNERS • LOUIS CAPITAL MARKETS • 42 rue Washington • PARIS • 130 Wood Street • LONDON 5
The existing structures would not allow the company to develop its activities beyond €40.0m For this reason, OSAI AS has decided to expend to a new production site, which has already been identified, of 2,500 square metres (expandable up to 11,000 square metres). Although we do not yet have details on the timing, once the agreement is finalised, the site should be operational in about three months and will require an investment of €3.0m. This new investment will increase the company’s surface area by 45% in order to accommodate new staff and support the growth of all activities.
Business: Osai is a supplier of automated component production line solution for customers operating in highly technological markets. The company is a trusted partner for its customers, who tend to involve OSAI in the development, design and production of new automated production lines. This allows client companies to customise each solution in order to achieve any kind of competitive advantage in terms of performance, cost, reliability and flexibility. OSAI’s clients are the most important companies in the following sectors: 1. Automotive 2. Telecommunications 3. Energy 4. Household appliances 5. Medical
Revenue: Over the last ten years, the company has grown steadily, rising from a revenue of €7.0m in 2007 to around €36.0m in 2019. This strong growth, which is exclusively organic, implies a Compound Annual Growth Rate (CAGR) over the period of 15% per year. In 2019, semiconductors accounted for 46% of revenue (€16.3m), followed by automation, which counted for 28% of revenue (€10.1m), and electronics, 18% of revenue (€6.5m). Finally, the laser and services division each account for 4% of total revenue (€1.28m and €1.34m respectively). Despite its still limited size in view of its extraordinary potential, OSAI is a multinational company with 77% of its sales devoted to exports. However, this percentage seems to be rather conservative insofar as a large part of the machines sold in Italy are then shipped abroad by customers.
Source : Société Group History (1991-2020)
Semiconductor; 46%
Automation; 29%
Electronic; 18%
Laser; 4%
Service; 4%
Italy; 20%
Europe; 36%
Rest of the World; 44%

MIDCAP PARTNERS • LOUIS CAPITAL MARKETS • 42 rue Washington • PARIS • 130 Wood Street • LONDON 6
Source: Company
The Group and Its Shareholders: To date, Ms. Mirella Ferrero holds 63% of the shares of OSAI Automation System Spa and the remaining 37% are held by the market. Currently, the Board of Directors is composed of four people: 1. Mirella Ferrero: President 2. Virgilio Giorza: Executive Director 3. Fabio Benetti: Executive Director and CEO 4. Sergio Duca: Independent Director 5. Paola Marini: Independent Director Group Structure and Current Board of Directors
Source: Company
Staff: OSAI’s Most Important Asset

MIDCAP PARTNERS • LOUIS CAPITAL MARKETS • 42 rue Washington • PARIS • 130 Wood Street • LONDON 7
As we have already seen, the company’s revenue growth has been very strong over the last ten years. This rapid growth has been supported by the company’s constant investment in the human capital that forms the basis of its success. A linear regression between the progression of the revenue and the increase in the number of employees over the last ten years shows an almost perfect correlation between the two variables Linear Progression between Revenue and Workforce (2010-2019)
Source: Company, Midcap Partners
As of June 2020, the group employs 181 highly qualified people with an average age of 42:
109 technicians (60 % of the workforce) 36 engineers (20 % of the workforce) 22 qualified professionals (12 % of the workforce)
Source: Company
y = 0,0048x + 5,6185 R² = 0,9862
0
20
40
60
80
100
120
140
160
180
200
0 5000 10000 15000 20000 25000 30000 35000 40000
Projects; 35
Software Developer;
19
Assembly; 33
Sales; 10
After Sales; 8
R&D; 5 Finance &
Administration; 10
Logistics, Warehous
e & Purchasin
g; 17
Other Staff; 44
Technicians
60%
Engineers 20%
Professionally
Qualified 12%
Other 8%

MIDCAP PARTNERS • LOUIS CAPITAL MARKETS • 42 rue Washington • PARIS • 130 Wood Street • LONDON 8
II. Market
AUTOMATION: Automation brings multiple benefits to manufacturing companies in terms of cost,
efficiency, speed, risk minimisation and profitability. OSAI is very well positioned on the market because, despite its small size, it offers a much broader spectrum of expertise than its competitors who are much larger in terms of revenue.
Benefits of Automation
Sources: Xerfi Global, Midcap Partners
By analysing the location of the machines installed and those recently sold, it is clear that the market is highly concentrated. In 2018, 75% of automatic industrial machines were concentrated in just five countries. China accounted for the vast majority of sales (about 40%), followed by Japan, South Korea, the United States and Germany. Chinese demand for automatic industrial machinery has grown exponentially since 2013. It is estimated that this trend will continue in the future, thanks in particular to the strategic “Made in China 2025” plan, which aims to achieve technological and productive self-sufficiency in this field. Despite much lower than anticipated growth, European countries are the most advanced in terms of industrial automation. More than half of the top 20 countries in the world for the density of automatic production machines are in Europe. On analysing this density, China finds itself in 21st place, behind the Czech Republic and below the average for European countries. For the record, this ranking is led by South Korea and Singapore. In terms of application sectors, electronics and automobiles (traditional + intelligent mobility) have been the market drivers in recent years. However, we are witnessing the emergence of new high-growth segments. Xerfi Global estimates that automatic machines for the production of robots and home automation will increase by 27% per year in the mid-term and those for entertainment by 12% per year.
Benefits of Automation
Improved process and
product quality
Less operational
risks
Improved energy and
raw materials efficiency
Cost reduction
Increased productivity
Less exposure to
rising personnel
costs

MIDCAP PARTNERS • LOUIS CAPITAL MARKETS • 42 rue Washington • PARIS • 130 Wood Street • LONDON 9
Semiconductor Market by Demand (Right) and by Country of Production (Left)
Source: Xerfi Global
Growth of Automatic Machines for the Production of Robots (in million units)
Sources: Xerfi Global, Midcap Partners
SEMICONDUCTORS: The semiconductor market (chips and/or integrated circuits) reached a
revenue of around €400.0bn in 2018.
China 39%
Japan 13%
South Korea 10%
USA 8%
Germany 5%
Rest of the world
25%
4,5
6
7,8
8,8
11
15
2 2,2 2,8 3
3,8 4
2016 2017 2018 2019 2020 2021
Domestic/Household Entertainment

MIDCAP PARTNERS • LOUIS CAPITAL MARKETS • 42 rue Washington • PARIS • 130 Wood Street • LONDON 10
The memory sector represents nearly 50% of the market, followed by Logic (23%), micro-components
(14%) and analogue products (13%). It is estimated that the market should remain fairly buoyant in the middle-term thanks to increasingly data-intensive applications that require increasingly high-performance chips, to the advent of 5G (and the development of 6G) and the proliferation of the machine learning, smart devices and the cloud, not only among consumers but also in industry. In addition, the explosion of data analysis is a strong driver of the demand for faster and more complex chips. Increased connectivity means that the semiconductor content of many products is constantly increasing (electric cars, energy networks, medical systems, etc.). In this context, Asia accounts for nearly 70% of global
demand, with China alone representing about 34%. In fact, the demand for machinery for the production and testing of semiconductors is driven by the APAC region since CHIP production is concentrated in this region. In the semiconductor sector, almost all companies adopt a “fabless” strategy, i.e. they subcontract production to specialised companies. The semiconductor manufacturing sector is highly concentrated with large groups such as TSMC, Global Foundries, Flex and Amkor who produce for all the largest companies in the sector. OSAI’s customers include Amkor and Flex, who put its solutions in contact with all the largest businesses in the sector.
MEDICAL TECHNOLOGY: The medical technology market is a massive and constantly
changing one. This industry is characterised by multiple factors:
Gradual adoption of health care in developing countries Ageing population Increased life expectancy Progress in advanced care and health technologies
The focus on emerging countries seems to be particularly important. L'accent mis sur les pays émergents semble être particulièrement important. Indeed, even though they currently contribute only to a small percentage of total revenue, they are the ones that have the greatest long-term growth potential. According to Xerfi Global, the United States and Europe account for 70% of the market (39% and 31% respectively) although they only have 1.07 billion people (14% of the world’s population), i.e. about 390 million fewer than China alone (1.4 billion or 18% of the population). Nowadays, China, despite being the world’s most populated country, accounts for only 6% of the medical technology market. This brief analysis allows us to better grasp the potential of emerging countries in this field, and of China in particular, when the population has access to more advanced health care.
Source: Xerfi Global
Taiwan 22%
South Korea 21%
Japan 17%
North America
13%
China 12%
Europe 6%
Rest of the world
9%
Americas 22%
Europe 9%
China 34%
Japan 8%
APAC (excl.
China) 27%
141 570
112 530
32 670
7 260
21 780
7 260 7 260
32 670

MIDCAP PARTNERS • LOUIS CAPITAL MARKETS • 42 rue Washington • PARIS • 130 Wood Street • LONDON 11
Available Income per Capita in China (€)
Sources: Xerfi Global, National Bureau of Statistics of China
Growth in Health Expenditure per Capita (2000-2017)
Sources: Xerfi Global, OECD
The five main groups represent 27% of the revenue and have dominated the market for many years. Medtronic is the sector’s world leader and represents 6.9% of the industry, or €25.0bn in sales. Medtronic is an OSAI customer for medical laser equipment, in particular for the production of dialysis machines. Five Main Global Groups in the Medical Market
Source: Xerfi Global
0
1000
2000
3000
4000
5000
1990 2000 2010 2016
Rural Urban
1,7%
1,9%
2,0%
2,2%
2,4%
2,6%
2,9%
3,1%
3,3%
3,3%
3,6%
4,8%
5,1%
7,5%
9,1%
France
Brazil
Germany
South Africa
Australia
Norway
USA
Netherlands
Japan
Turkey
Russia
India
Poland
Indonesia
China
Medtronic 7%
Johnson & Johnson 6%
Philips 5%
GE Healthcare 5% Abbott
4%
Others 73%

MIDCAP PARTNERS • LOUIS CAPITAL MARKETS • 42 rue Washington • PARIS • 130 Wood Street • LONDON 12
III. Industrial Model
OSAI Spa's business model is both simple and linear and composed of five progressive phases: 1. Order Acquisition: during which the company contacts the customer, takes note of the order
and the technological response to be made? 2. Planning: OSAI begins the solution’s study in close collaboration with the customer, analysing
the main characteristics required. 3. Development: OSAI starts the development and design of the solution, mainly applying a
tailor-made approach to the customer's wishes. 4. Production: once the solution has been defined, OSAI starts the assembly of the solution,
outsourcing low added value activities, such as the production of mechanical elements. 5. Distribution and After-sales: once the product is finished, OSAI ships it to the customer. Then,
OSAI takes care of the periodic maintenance contracts for the machines and the training of the customer's personnel.
This business model can be grouped into three macro-phases:
1. Order acquisition and design 2. Production: regarding the development and production 3. Distribution and customer services
Industrial model
Source: Company
1. ORDER ACQUISITION AND SOLUTION DESIGN
The initial contact between the potential client and OSAI can be made in different ways: (i) trade fairs (ii) events (iii) distributor or agent networks (iv) direct contact (v) contact via the web or social media. In this first phase, the division’s commercial manager takes note of all the requests from potential customers, which will then be passed on to the division's managers to monitor and select the projects that could become real orders. When the projects materialise, their feasibility, schedule and profitability are assessed. Once the previous budget study has been completed, the project is formalised by entering the basic specifications that will be finalised with the client.
Sector trade fairs: a first contact with potential customers
Source: Company
2. PRODUCTION: Once the order has been acquired, the development and production phase is undertaken. In general, orders can be divided into two macro categories:
MIDCAP PARTNERS • LOUIS CAPITAL MARKETS • 42 rue Washington • PARIS • 130 Wood Street • LONDON 13
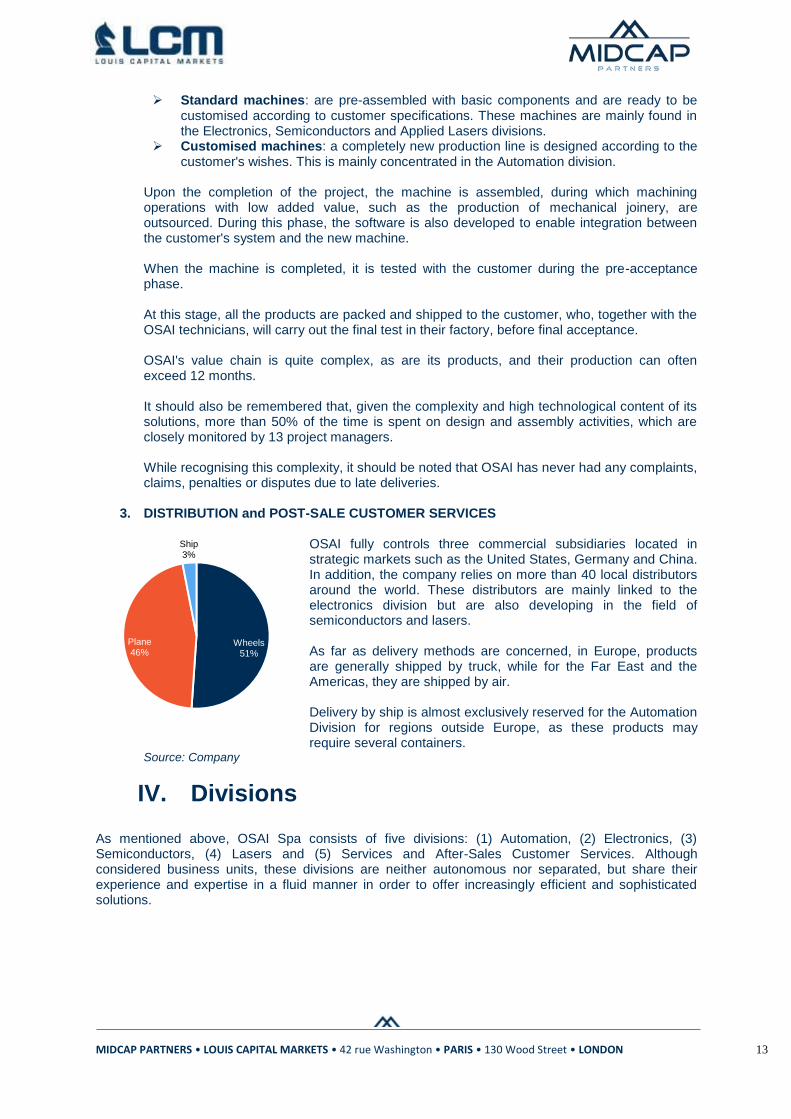
Wheels 51%
Plane 46%
Ship 3%
Standard machines: are pre-assembled with basic components and are ready to be customised according to customer specifications. These machines are mainly found in the Electronics, Semiconductors and Applied Lasers divisions.
Customised machines: a completely new production line is designed according to the customer's wishes. This is mainly concentrated in the Automation division.
Upon the completion of the project, the machine is assembled, during which machining operations with low added value, such as the production of mechanical joinery, are outsourced. During this phase, the software is also developed to enable integration between the customer's system and the new machine. When the machine is completed, it is tested with the customer during the pre-acceptance phase. At this stage, all the products are packed and shipped to the customer, who, together with the OSAI technicians, will carry out the final test in their factory, before final acceptance.
OSAI's value chain is quite complex, as are its products, and their production can often exceed 12 months. It should also be remembered that, given the complexity and high technological content of its solutions, more than 50% of the time is spent on design and assembly activities, which are closely monitored by 13 project managers. While recognising this complexity, it should be noted that OSAI has never had any complaints, claims, penalties or disputes due to late deliveries.
3. DISTRIBUTION and POST-SALE CUSTOMER SERVICES OSAI fully controls three commercial subsidiaries located in strategic markets such as the United States, Germany and China. In addition, the company relies on more than 40 local distributors around the world. These distributors are mainly linked to the electronics division but are also developing in the field of semiconductors and lasers. As far as delivery methods are concerned, in Europe, products are generally shipped by truck, while for the Far East and the Americas, they are shipped by air. Delivery by ship is almost exclusively reserved for the Automation Division for regions outside Europe, as these products may require several containers.
Source: Company
IV. Divisions
As mentioned above, OSAI Spa consists of five divisions: (1) Automation, (2) Electronics, (3) Semiconductors, (4) Lasers and (5) Services and After-Sales Customer Services. Although considered business units, these divisions are neither autonomous nor separated, but share their experience and expertise in a fluid manner in order to offer increasingly efficient and sophisticated solutions.

MIDCAP PARTNERS • LOUIS CAPITAL MARKETS • 42 rue Washington • PARIS • 130 Wood Street • LONDON 14
OSAI's product portfolio
Source: Company
1. AUTOMATION - Directed by Simone Ferraro This division, created in 1991, is the oldest in the group. It accounts for 28% of 2019 revenue (approximately €10m). The Automation business unit comprises five product lines: (i) Manual or automatic workstations, (ii) Rotating tables, (iii) Semi-automatic lines, (iv) flexible modules and finally (v) NeoTray/Vertical storage. Automation product portfolio
Source: Company
The solutions offered by this division are based on explicit customer requests. In fact, the customer comes directly to OSAI with a component to be produced and tested in an automated manner in order to optimise costs and time. For its part, OSAI defines the machines (or the production line composed of different machines that can measure up to 30 metres long) that will produce and test this component, automating the customer's production process. Currently, OSAI focuses its activities in this division on "light automation", that is, the automation of small and medium-sized systems, in which it has achieved over the years an excellent level of specialisation recognised by the market. This division mainly serves the automotive market, concentrating on advanced mobility rather than the traditional automobile. In order to satisfy all types of customer requests, OSAI offers three categories of ad hoc solutions:
Standard lines designed and manufactured by OSAI: these are automatic or semi-automatic production lines, also known as monolithic lines (which can measure 25-30 meters), with dedicated stations for each stage of the production process, customised at the customer's request.
Production lines integrated with third-party systems: OSAI can integrate third-party systems and machines with its own in order to offer even more flexible solutions.

MIDCAP PARTNERS • LOUIS CAPITAL MARKETS • 42 rue Washington • PARIS • 130 Wood Street • LONDON 15
Modular lines designed and built by OSAI: these are the most flexible solutions on the market, made up of independent but interconnected machines that allow different elements to be worked and assembled. The individual modules can be totally or partially replaced when the production process changes.
Different types of OSAI solutions
Source: Company
CLIENTS
PROFILE 2019
First-tier multinationals, which tend to increase their orders to OSAI after installing the first solution.
Marelli Federal Mogul
MARELLI is one of the leading independent suppliers to the automotive sector in the world. With approximately 60,000 employees worldwide, MARELLI has 170 facilities and R&D centres in Asia, America, Europe and Africa, generating revenue of €13.4bn (1.541bn yen) in 2019.
Federal-Mogul Corporation is an American company producing products for the automotive industry and transportation in general. Federal-Mogul operates with two independent divisions, Federal-Mogul Powertrain and Federal-Mogul Motorparts. Prior to being acquired by Tenneco in 2018, Federal Mogul saw revenue of nearly $8bn (2017).
Honeywell Tenneco
Honeywell is one of the largest multinational companies in the United States, operating in a variety of sectors, including industrial and domestic controls and automation, aerospace and automotive
Tenneco is a leading designer, manufacturer and marketer of automotive products for the original equipment and aftermarket, with sales of $17.45bn in 2019 and approximately 78,000 employees at
Federal Mogul 43%
Hanon Systems
35%
Borg Warner
12%
Huber Automotiv
e 10%

MIDCAP PARTNERS • LOUIS CAPITAL MARKETS • 42 rue Washington • PARIS • 130 Wood Street • LONDON 16
components, and specialty high-performance materials. The company employs approximately 130,000 people and has sales in excess of $35bn.
more than 300 locations worldwide.
Hanon Systems Brembo
Hanon Systems creates value for automotive manufacturers through its ongoing commitment to innovation and excellence. With its differentiated product portfolio, wealth of experience, and business acumen, Hanon Systems has been working to strengthen its leading position in innovative thermal and energy management solutions in the global automotive market since 1989. Hanon Systems achieved revenue of approximately $5.4bn in 2019.
Brembo SpA is the world leader and recognised innovator in disc brake technology for motor vehicles. Brembo supplies high-performance braking systems for the world's leading car, commercial vehicle and motorbike manufacturers, as well as clutches and other components for racing. Brembo is also a leader in the racing sector and has won more than 400 championships. In 2019 Brembo recorded revenue of €2.6bn.
BorgWarner Huber Automotive
BorgWarner Inc. is a U.S.-based supplier of parts and components to the global automotive industry, primarily known for its transmission products, including manual and automatic transmissions, transmission components such as electro-hydraulic control components, transmission control units, friction materials, one-way clutches, turbochargers, engine timing system components and four-wheel drive system components. BorgWarner is expected to generate revenue of $10.2bn in 2019.
As an established specialist in automotive electronics, Huber Automotive meets the ever-increasing demand for innovation in the field of mobility with its design and development successes, cooperative work and product range. We excel in the supply of general vehicle electronics, battery management systems, as well as E-Mobility concepts and energy storage systems. Huber Automotive recorded approximately $30bn in revenue in 2019.
Competition: there are three types of competitors in this space:
Global: companies such as GEFIT, Ruhlamat and JR, which have a direct relationship with car manufacturers and operate in sectors with higher added value such as engines and transmissions.
Specialists: a niche in which OSAI competes, with players such as Sinteco, Masmec, Nanchino and Loccioni, is for the supply of automatic systems to component producers operating in rank 1 with car manufacturers. This niche has quite attractive margins.
Systems engineering: companies such as Bonetto, Comau and AMX, which design and produce automation systems for component manufacturers operating at the lowest levels of the value chain. In this sector, products are much less complex, and competition is exclusively based on price.
The Automation Division’s Competition
Source: Company
The automation division is mainly competing in four different markets: (i) traditional cars, (ii) advanced mobility, (iii) home automation and (iv) medical.

MIDCAP PARTNERS • LOUIS CAPITAL MARKETS • 42 rue Washington • PARIS • 130 Wood Street • LONDON 17
The two segments linked to mobility are the most important in terms of revenue, while home automation and especially medical technology still represent small percentages. In terms of growth, however, the latter two sectors are expected to experience very robust growth. Similarly, advanced mobility is a mega-trend that is in vogue today and is experiencing very strong growth. The only market that appears to be experiencing negative growth is the traditional automotive market, which accounts for only 15% of revenue (2019 data). Overall, the markets in which the Automation division competes are expected to grow at an overall rate of 9% per year over the next five years. OSAI takes as reference a "Markets and Markets" study which estimates that the industrial automation market is expected to grow from $152 billion in 2020 to $229 billion in 2025, with APAC being the driver of this growth (particularly China). This strong growth is due to multiple factors : (i) a sharp increase in the complexity of systems, (ii) ever closer integration between mechanical and electronic technologies with a significant reliance on sensors, (iii) increasing adoption of automatic safety systems, (iv) widespread use of electric mobility.
Industrial control and plant automation market, by region ($bn)
Source: Company
2. ELECTRONICS: Directed by Simone Ferraro
OSAI's electronics division was founded in 2001, thanks to the group's ability to anticipate the market and attract demand with the creation of the NEO platform. In the last financial year, this division accounted for 18% of revenue, or €6.5m. The NEO line offers the market four different solutions: (i) NeoMark Easy and Twin for laser marking, (ii) NeoPlace Modula for laser welding, (iii) NeoCut Shape for laser cutting and (iv) Neo Router for mechanical cutting. This is the only division in which the products offered are mostly standard, on which customisations in terms of laser sources, software, etc... This division’s solutions are directly inserted into the production lines of large multinationals and small third-party manufacturers of electronic products.
Electronics product portfolio
Source: Company

MIDCAP PARTNERS • LOUIS CAPITAL MARKETS • 42 rue Washington • PARIS • 130 Wood Street • LONDON 18
The different types of OSAI solutions throughout the value chain
Source: Company
CLIENTS
PROFILE 2019
OSAI's client portfolio is large and fragmented (more than 40 clients), and can be divided into three categories: 1. Direct clients 2. Distributors: operational at local level 3. EMS: most electronic card manufacturers, as subcontractors.
Bitron ASM
Bitron is a leading global privately owned company in the research, development and manufacture of mechatronic devices and systems for the automotive, appliance, HVAC and energy sectors. The company reported revenue of €987m in 2019 and employs more than 6,000 people.
With almost 15,000 employees, ASM is the world's largest supplier of technologically advanced equipment and processes for the electronics industry. Today it supports electronics manufacturers worldwide in the implementation of their integrated intelligent factory. ASM had revenue of €1.3bn in 2019.
EP-TeQ OSRAM
EP-TeQ A/S has a unique combination of know-how, tools and machines for all electronic processes. The company has a long and profound experience in the development and production of tools and machines for manufacturers of electronic products.
OSRAM, based in Munich, is a leading global company in the field of photonics with a history going back more than 110 years. Focused primarily on semiconductor technologies, its products are used in a wide variety of applications ranging from virtual reality to autonomous driving and from smartphones to networked intelligent lighting solutions in buildings and cities. In the field of automotive lighting, the company is the global market and technology leader. OSRAM recorded revenue of €3.5bn in 2019.
FLEX JABIL
Flex is the manufacturing partner of choice that helps a diverse customer base design and build products that make the world a better place. The company was founded in 1969 and is listed on NASDAQ. Flex
Jabil (NYSE: JBL) is a manufacturing solutions provider that offers comprehensive design, manufacturing, supply chain and product management services. Drawing on the power of
Distributors
28%
Through Subsidiari
es 19%
Ep-teQ 19%
Bitron 30%
ASM 4%
MIDCAP PARTNERS • LOUIS CAPITAL MARKETS • 42 rue Washington • PARIS • 130 Wood Street • LONDON 19
earned $26.3bn in revenue in 2019. more than 200,000 people in 100 strategically located sites around the world, Jabil simplifies complexity and delivers value across a wide range of industries, driving innovation, growth and customer success. Jabil earned $25.3bn in revenue in 2019.
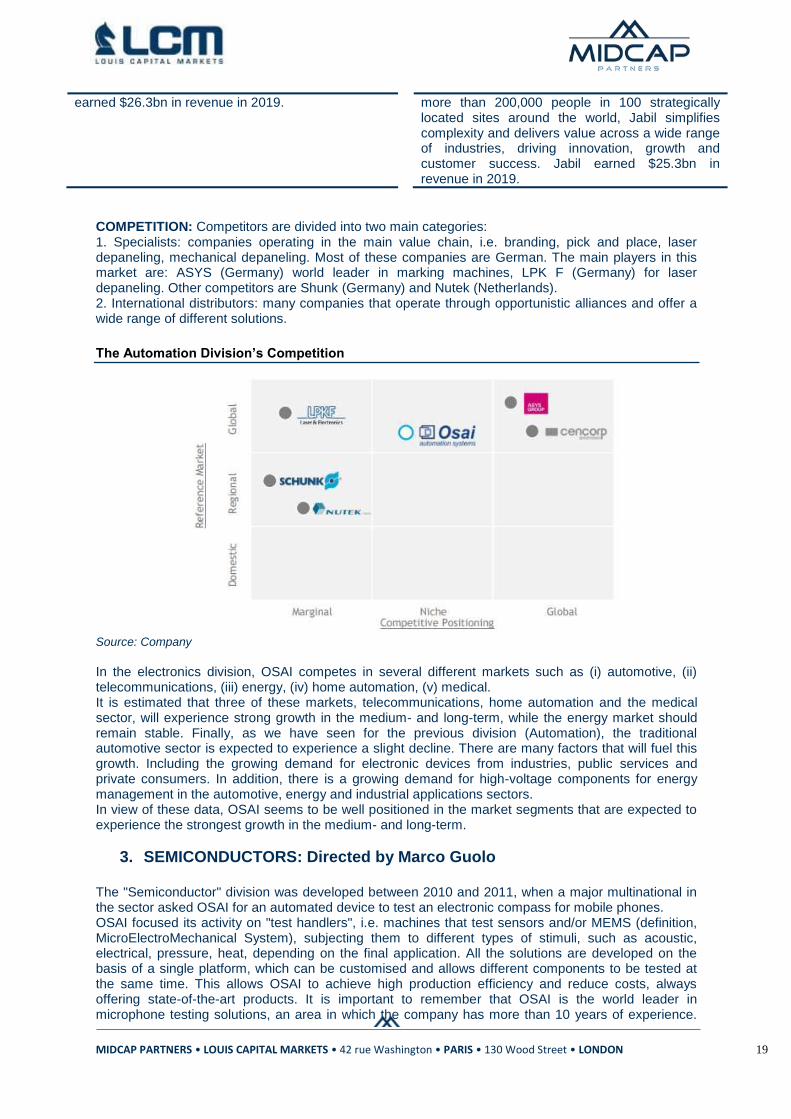
COMPETITION: Competitors are divided into two main categories: 1. Specialists: companies operating in the main value chain, i.e. branding, pick and place, laser depaneling, mechanical depaneling. Most of these companies are German. The main players in this market are: ASYS (Germany) world leader in marking machines, LPK F (Germany) for laser depaneling. Other competitors are Shunk (Germany) and Nutek (Netherlands). 2. International distributors: many companies that operate through opportunistic alliances and offer a wide range of different solutions.
The Automation Division’s Competition
Source: Company
In the electronics division, OSAI competes in several different markets such as (i) automotive, (ii) telecommunications, (iii) energy, (iv) home automation, (v) medical. It is estimated that three of these markets, telecommunications, home automation and the medical sector, will experience strong growth in the medium- and long-term, while the energy market should remain stable. Finally, as we have seen for the previous division (Automation), the traditional automotive sector is expected to experience a slight decline. There are many factors that will fuel this growth. Including the growing demand for electronic devices from industries, public services and private consumers. In addition, there is a growing demand for high-voltage components for energy management in the automotive, energy and industrial applications sectors. In view of these data, OSAI seems to be well positioned in the market segments that are expected to experience the strongest growth in the medium- and long-term.
3. SEMICONDUCTORS: Directed by Marco Guolo The "Semiconductor" division was developed between 2010 and 2011, when a major multinational in the sector asked OSAI for an automated device to test an electronic compass for mobile phones. OSAI focused its activity on "test handlers", i.e. machines that test sensors and/or MEMS (definition, MicroElectroMechanical System), subjecting them to different types of stimuli, such as acoustic, electrical, pressure, heat, depending on the final application. All the solutions are developed on the basis of a single platform, which can be customised and allows different components to be tested at the same time. This allows OSAI to achieve high production efficiency and reduce costs, always offering state-of-the-art products. It is important to remember that OSAI is the world leader in microphone testing solutions, an area in which the company has more than 10 years of experience.

MIDCAP PARTNERS • LOUIS CAPITAL MARKETS • 42 rue Washington • PARIS • 130 Wood Street • LONDON 20
Not everyone knows that ten years ago there was only one microphone in a phone, today 3-4 are installed for each smartphone. The microphone market is a market with enormous potential, just think of all the devices that can be activated by voice: smart mobility, home automation, smart watches, etc. To date, the division has five families of technologically advanced solutions:
NeoHandler: testing and calibrating sensors and MEMS PMTH: final test of the power modules. Also include final laser marking and packaging. ATPS: customised automatic solutions for combustion testing, with loading, unloading, pre-
testing and visual inspection (mandatory for components in the automotive market). Packaging of power devices: solutions for the automatic assembly of power modules Automation of burning tests: reliability tests for electronic components, mainly for
autonomous driving. Semiconductors product portfolio
Source: Company
The different types of OSAI solutions throughout the value chain
Source: Sociétè

MIDCAP PARTNERS • LOUIS CAPITAL MARKETS • 42 rue Washington • PARIS • 130 Wood Street • LONDON 21
CLIENTS
PROFILE 2019
OSAI is one of the leading suppliers of systems for semiconductor packaging and testing. OSAI supplies all of the world’s major players.
STM INFINEON
One of the world's largest semiconductor companies: - 2019: $9.56bn in revenue - 46,000 employees including 7,800 in R&D - More than 80 sales and marketing offices serving over 100,000 customers worldwide - 11 Manufacturing sites STM is one of OSAI's oldest clients.
Infineon Technologies AG is a global leader in semiconductor solutions that make life easier, safer and greener. Microelectronics from Infineon is the key to a better future. In FY 2019 (ending 30 September), the company recorded sales of approximately €8bn with about 41,400 employees worldwide. Infineon is listed on the Frankfurt Stock Exchange (symbol: IFX).
NXP TDK
NXP Semiconductors N.V. enables secure connections for a smarter world, with advanced solutions making life easier, better and safer. As a world leader in secure connectivity solutions for embedded applications, NXP is driving innovation in the automotive, industrial and IoT, mobile and communications infrastructure markets. The company employs 29,000 people and recorded revenue of more than €8bn in 2019.
TDK Corporation is a leading electronics company based in Tokyo, Japan. The product range also includes sensors and sensor systems such as temperature and pressure sensors, magnetic sensors and MEMS sensors. In addition, TDK supplies power supplies and power devices, magnetic heads and much more. In 2018, TDK had sales of $12bn and employed approximately 103,000 people. Recently, TDK acquired four companies that were already OSAI customers.
AMKOR SEMIKRON
Amkor Technology, Inc. is one of the world's largest providers of outsourced semiconductor packaging and testing services. Founded in 1968, Amkor pioneered the outsourcing of IC packaging and testing and today is a strategic manufacturing partner to leading semiconductor companies, foundries and electronic OEMs worldwide. For OSAI, being a supplier to AMKOR is essential, as AMKOR works for the world's largest semiconductor company. Amkor earned revenue of $4bn in 2019.
SEMIKRON is one of the world's leading manufacturers of modules and power systems, mainly in the medium power range (approx. 2 kW to 10 MW). Its products are at the heart of modern, energy-efficient motor drives and industrial automation systems. Other areas of application are power supply, renewable energies (wind and solar energy) and electric vehicles (passenger cars, vans, buses, trucks, forklifts, etc.). Semikron has earned approximately €500m in revenue in 2019.
Competition: the competitive space is still very fragmented with no competitor yet having acquired a leading position. Competition can be divided between global operators and specialists. The two main competitors in this division are Pentamaster, a Malaysian producer with a very low cost base, and SPEA with its headquarters located only 20 km from OSAI.
Infineon 29%
STM 23%
TDK 18%
CREA 11%
Semikron 8%
Aga 6%
NXP 5%

MIDCAP PARTNERS • LOUIS CAPITAL MARKETS • 42 rue Washington • PARIS • 130 Wood Street • LONDON 22
The Semiconductors Division’s Competition
Source: Company
There are three main reference markets for the semiconductor division:
Automobile: in particular autonomous driving Telecommunications: in particular MEMS testing and assembly Electric drive: in particular power modules
These three markets are expected to grow rapidly in the medium-term, so OSAI's positioning should give it faster growth than the semiconductor market. Regarding regions, the APAC region, and China in particular, is expected to be the fastest growing region, followed by the United States. This growth will be fuelled by the ever-increasing demand for AI-based autonomous driver chips. It is estimated that there are three times as many electrical components in a car today as there were ten years ago. This is due to the ever-increasing demand for chips for electric cars. In the industrial field too, machines are becoming more and more intelligent, more and more connected and independent of human control. This transformation, known as Industry 4.0 and closely linked to the IoT concept, necessarily involves more and more chips, which must not only be produced and assembled, but also tested to ensure reliability.
Semiconductor market growth by application (2016-2022)
Source: Company, PWC Research

MIDCAP PARTNERS • LOUIS CAPITAL MARKETS • 42 rue Washington • PARIS • 130 Wood Street • LONDON 23
4. LASER: Directed by Marco Guolo The laser division is a very special business unit. First of all, it is a historical division created in 1995 to supply automatic laser marking machines related to tracking. These laser marking machines were originally intended for the automotive market. Over the years, most of the solutions developed by this division have been adopted by the other divisions, particularly in Electronics (which is a sort of spin-off from the laser division). In the laser division we can find three product lines:
Laser marking Laser cutting Laser welding
OSAI's product portfolio in this division covers many industrial applications such as jewellery, watches and the medical sector. The medical sector has been OSAI's main focus in recent years, providing solutions for the production of life-saving devices such as pacemakers, catheters and heart valves. It is worth mentioning that the medical sector is one of the fastest growing markets in China. This growth is due to many factors such as an ageing population, higher wages and strong investments in welfare. Finally, it should be noted that medical coverage still has a low penetration rate, which means that in a country of 1.4 billion people, there is enormous room for growth.
Laser product portfolio
Source: Company
CLIENTS
PROFILE BLM Group
OSAI's clients are mainly international companies operating in the industrial and medical sectors. All customers require highly customised solutions, especially in the medical sector.
The BLM GROUP is a global partner for the entire tube processing process: from laser or disc cutting, to bending, shaping and certification of parts, with a worldwide presence. The company has more than 500 employees.
HUBA CONTROL MEDTRONIC
Huba Control develops, manufactures and sells components to measure the physical quantity of pressure and flow. The designation "pressure measuring components" includes pressure switches (ON-OFF switching elements), sensors and pressure transmitters (sensors with integrated amplifier electronics). Huba Control's specialisation in pressure measurement enables the development of innovative products.
Medtronic is one of the largest medical device companies in the world. Operating in 150 countries, their products treat 70 medical conditions and include cardiac devices, cranial and spinal robotics, insulin pumps, surgical tools, patient monitoring systems and more. Their therapies help more than 72 million people a year.
MICROPORT LIVANOVA
MicroPort® was founded in 1998 in a small office at the ZJ Hi-Tech Park in Shanghai, China, where a group of dedicated people came together with the common belief that advances in medical technology could transform the lives of patients around the world.
LivaNova is a global medical technology company with decades of experience and an unwavering commitment to improving the lives of patients around the world. As a global leader in cardiovascular and neuromodulation solutions, we

MIDCAP PARTNERS • LOUIS CAPITAL MARKETS • 42 rue Washington • PARIS • 130 Wood Street • LONDON 24
Over the past two decades, MicroPort® has taken important steps to fulfil its mission of providing reliable and universal access to state-of-the-art solutions to extend and reshape all lives. MicroPort is listed on the Hong Kong Stock Exchange.
are dedicated to creating useful products and therapies that transform lives every day. The company is listed on the Nasdaq. TDK has acquired four companies that were already OSAI customers.
Competition: The competitive landscape is characterised by the presence of small- and medium-sized companies that specialise in niche applications. Four of them operate in Italy. There is only one global player, the Japanese multinational Miyachi. The constant growth in demand for miniaturised components, both in microelectronic applications and in the medical sector, will be the driving force behind the growth of this market. OSAI already supplies these two niche markets and should therefore be well positioned to achieve strong growth in the medium term. The Laser Division’s Competition
Source: Company
5. AFTER-SALES and SERVICES Osai guarantees, directly or through third parties, coverage of the regions where the company has installed more than 1,000 machines and production lines. Given the unique nature of its solutions, in terms of technology, mechanics and software, only OSAI is able to guarantee adequate technical assistance. The Customer Service division represents a clear opportunity to develop OSAI's business and create more value for customers and shareholders. For all these reasons, OSAI wants to take advantage of its installed capacity worldwide by offering new services, which can be divided into four categories:
Services: such as on-demand interventions, remote on-demand assistance, assistance to existing systems and system installation.
Spare parts: such as specialised stock at headquarters and local offices, delivery of spare parts.
Academy: customised training based on customer needs by qualified OSAI experts, as well as training courses at the customer's plant or at OSAI's site.
Warranty agreement: fully customised maintenance contracts
It should be noted that this is a very high-margin area, with faster cash flow than in other sectors and with recurring revenue.
MIDCAP PARTNERS • LOUIS CAPITAL MARKETS • 42 rue Washington • PARIS • 130 Wood Street • LONDON 25
V. Wide technological portfolio covering different sectors and machine types:
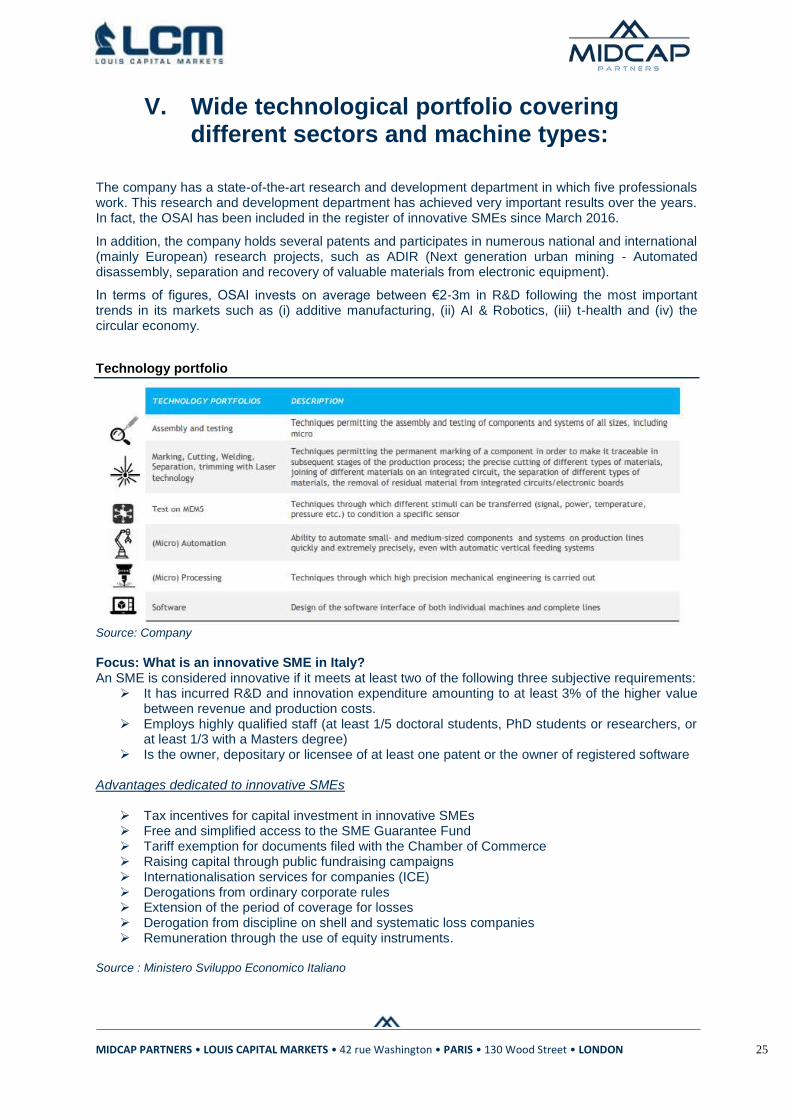
The company has a state-of-the-art research and development department in which five professionals work. This research and development department has achieved very important results over the years. In fact, the OSAI has been included in the register of innovative SMEs since March 2016.
In addition, the company holds several patents and participates in numerous national and international (mainly European) research projects, such as ADIR (Next generation urban mining - Automated disassembly, separation and recovery of valuable materials from electronic equipment).
In terms of figures, OSAI invests on average between €2-3m in R&D following the most important trends in its markets such as (i) additive manufacturing, (ii) AI & Robotics, (iii) t-health and (iv) the circular economy.
Technology portfolio
Source: Company
Focus: What is an innovative SME in Italy? An SME is considered innovative if it meets at least two of the following three subjective requirements:
It has incurred R&D and innovation expenditure amounting to at least 3% of the higher value between revenue and production costs.
Employs highly qualified staff (at least 1/5 doctoral students, PhD students or researchers, or at least 1/3 with a Masters degree)
Is the owner, depositary or licensee of at least one patent or the owner of registered software Advantages dedicated to innovative SMEs
Tax incentives for capital investment in innovative SMEs Free and simplified access to the SME Guarantee Fund Tariff exemption for documents filed with the Chamber of Commerce Raising capital through public fundraising campaigns Internationalisation services for companies (ICE) Derogations from ordinary corporate rules Extension of the period of coverage for losses Derogation from discipline on shell and systematic loss companies Remuneration through the use of equity instruments.
Source : Ministero Sviluppo Economico Italiano

MIDCAP PARTNERS • LOUIS CAPITAL MARKETS • 42 rue Washington • PARIS • 130 Wood Street • LONDON 26
VI. Technologies
OSAI is strongly involved in the development of high-tech products and processes. Each solution is specifically designed for a certain type of application, using ad hoc technologies that allow the product to be differentiated. Technologies, like products, can be analysed according to their life cycle. As far as their level of maturity is concerned, they can be classified into three different categories:
Emerging technologies: these represent new applications and new solutions tested with the possibility of positive results. During this phase, investments, sometimes substantial, are required to develop the new technology and gain a competitive advantage.
Key technologies: technologies which, if obtained, provide a substantial competitive advantage in terms of cost and performance, as they are not easily reproducible.
Core technologies: technologies that are easily accessible and therefore generally available to all competitors. At this stage, competition is almost exclusively regarding price.
As shown in the graph below, most of the technologies developed (or adopted) by OSAI are in the "key technologies" segment. This shows a very strong positioning of OSAI and a great potential for future growth for all business units of the group. It is important to remember that the R&D process is crucial in this context, as it allows this picture to be fed with new technologies and solutions. Technology cycle and OSAI technologies
Source: Company

MIDCAP PARTNERS • LOUIS CAPITAL MARKETS • 42 rue Washington • PARIS • 130 Wood Street • LONDON 27
VII. Financial Analysis
The group has experienced strong revenue growth over the last ten years, rising from €11m in 2010 to approximately €35,3m in 2019 (14% CAGR). This growth is mainly due to strong brand recognition at an international level. In addition, the company has always maintained an EBITDA margin of between 11-16%, demonstrating its strong profitability over time. As already mentioned, only 20% of OSAI's revenue comes from Italy, with Europe representing 36% and the rest of the world (mainly APAC) 44%.
Change in revenue and EBITDA over the last ten years (2010-2019, in €k)
Source: Company
As can be seen in the graph, the sales distribution according to end market has changed considerably over the last three years. The company has chosen to invest heavily in the "Semiconductor" division, as this is the business unit with the highest margins. In addition, the company is also focusing on the Laser division, specifically for medical applications where the group has a great deal of experience. Good results were not long in coming, as the laser division saw a 24% revenue increase in H1 2020. In the long-term, this strategy should not only significantly increase revenue, but also further improve margins.
Revenue trends by division (2014-2019)
*unconsolidated
Source: Company
10892 11541 14005 14399
17410 18994
23088
28600 30570
35260
1152 1553 1999 2139 2252 2411 2711 3350 4970 5290
11%
13% 14%
15%
13% 13%
12% 12%
16%
15%
0%
2%
4%
6%
8%
10%
12%
14%
16%
18%
0
10000
20000
30000
40000
50000
60000
2010 2011 2012 2013 2014 2015 2016 2017 2018 2019
Sales EBITDA EBITDA %
6,6
4,0 4,0
6,5 7,0
5,3
10,7
6,7
3,2
12,0
6,6
8,2
0,7 1,2
13,3
7,8 7,4
0,7 1,4
10,1
6,4
16,2
1,3 1,3
Automation Electronic Semiconductor Laser Services
2014* 2015* 2016* 2017 2018 2019

MIDCAP PARTNERS • LOUIS CAPITAL MARKETS • 42 rue Washington • PARIS • 130 Wood Street • LONDON 28
The cost structure is not linear in relation to revenue growth, as the company works mainly on commission, which can extend over two fiscal years. As a result, certain costs charged in one fiscal year may relate to products that will be completed and invoiced the following year. We have estimated that approximately 30% of the cost structure is represented by fixed costs. This pattern explains OSAI's flexibility in each environment and how the company has remained profitable over the years. Detailed evolution of cost allocation (2017-2019)
Source: Company
i. D&A: Over the last three years, depreciation and amortisation expenses have represented approximately 5% of total sales (or €1.96m in 2019). Mention should be made of the amortisation of development costs, which are depreciated over five years (see CapEx section). ii. Cost of services: these costs are mainly related to processing and outsourcing costs. Over the last three years, these costs have represented between 32.1% and 33.5% of total costs, i.e. €10.8m in 2019. OSAI outsources approximately 40% of these costs each year. iii. Personnel costs: employees are the most important asset and their skills are closely linked to company performance and growth, both in terms of revenue and margin. Between 2017 and 2018, personnel costs increased by €0.3m, due to the arrival of 11 additional employees at end-year (151 in 2018 versus 140 in 2017). However, the average cost per employee decreased from €53.7k to €51.5k. This trend was very similar in 2019 with 27 additional employees at end-year (178 in 2019 compared to 151 in 2018) for a total cost of €9.21k, i.e. an average cost per employee of €51.7k in line with the previous year.
iv. COGS: the cost of goods sold decreased from 40.5% of total costs in 2017 to 34.8% in 2019. In terms of gross margin, this means an increase in gross margin from 63% in 2017 to 70% in 2019.
13290
7740 11700
7480
7770
9210
10570
8610
10800
1470
1580
1960
2017 2018 2019
COGS Personnel Cost Cost of Services D&A
41% 30% 35%
23%
30% 27%
32% 34% 32%
4% 6% 6%
2017 2018 2019
COGS Personnel Cost Cost of Services D&A
MIDCAP PARTNERS • LOUIS CAPITAL MARKETS • 42 rue Washington • PARIS • 130 Wood Street • LONDON 29
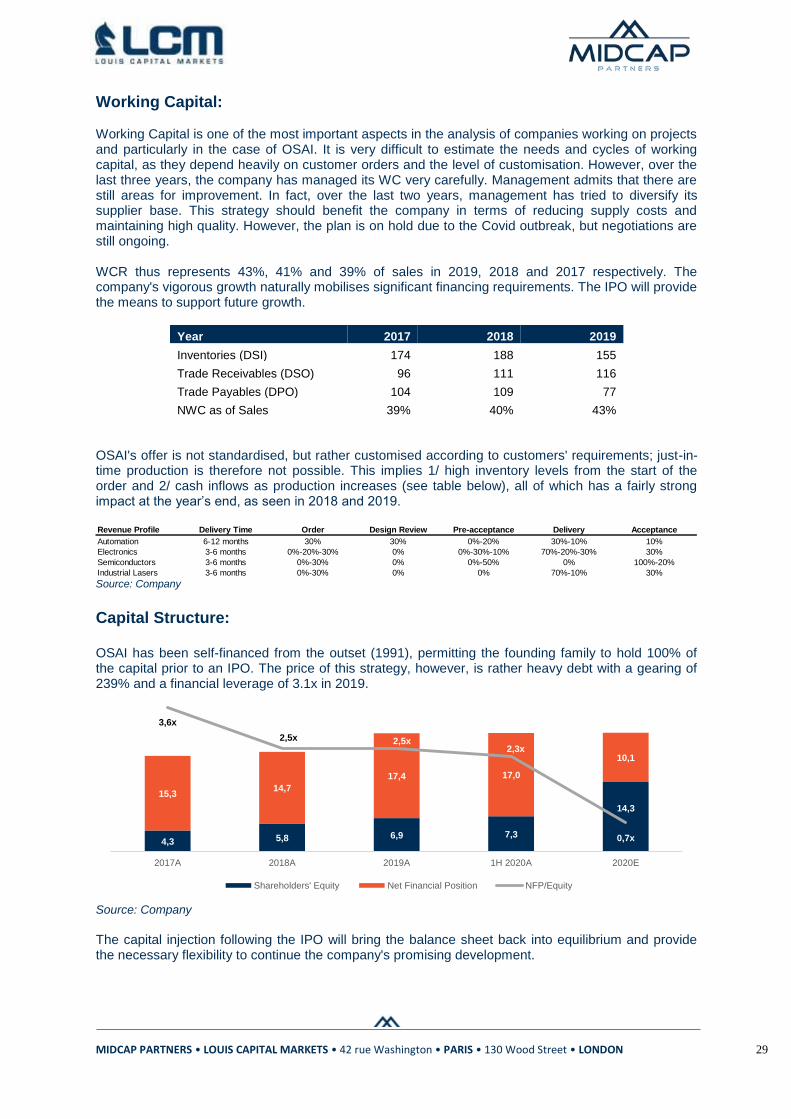
Working Capital: Working Capital is one of the most important aspects in the analysis of companies working on projects and particularly in the case of OSAI. It is very difficult to estimate the needs and cycles of working capital, as they depend heavily on customer orders and the level of customisation. However, over the last three years, the company has managed its WC very carefully. Management admits that there are still areas for improvement. In fact, over the last two years, management has tried to diversify its supplier base. This strategy should benefit the company in terms of reducing supply costs and maintaining high quality. However, the plan is on hold due to the Covid outbreak, but negotiations are still ongoing. WCR thus represents 43%, 41% and 39% of sales in 2019, 2018 and 2017 respectively. The company's vigorous growth naturally mobilises significant financing requirements. The IPO will provide the means to support future growth.
Year 2017 2018 2019
Inventories (DSI) 174 188 155
Trade Receivables (DSO) 96 111 116
Trade Payables (DPO) 104 109 77
NWC as of Sales 39% 40% 43%
OSAI's offer is not standardised, but rather customised according to customers' requirements; just-in-time production is therefore not possible. This implies 1/ high inventory levels from the start of the order and 2/ cash inflows as production increases (see table below), all of which has a fairly strong impact at the year’s end, as seen in 2018 and 2019.
Source: Company
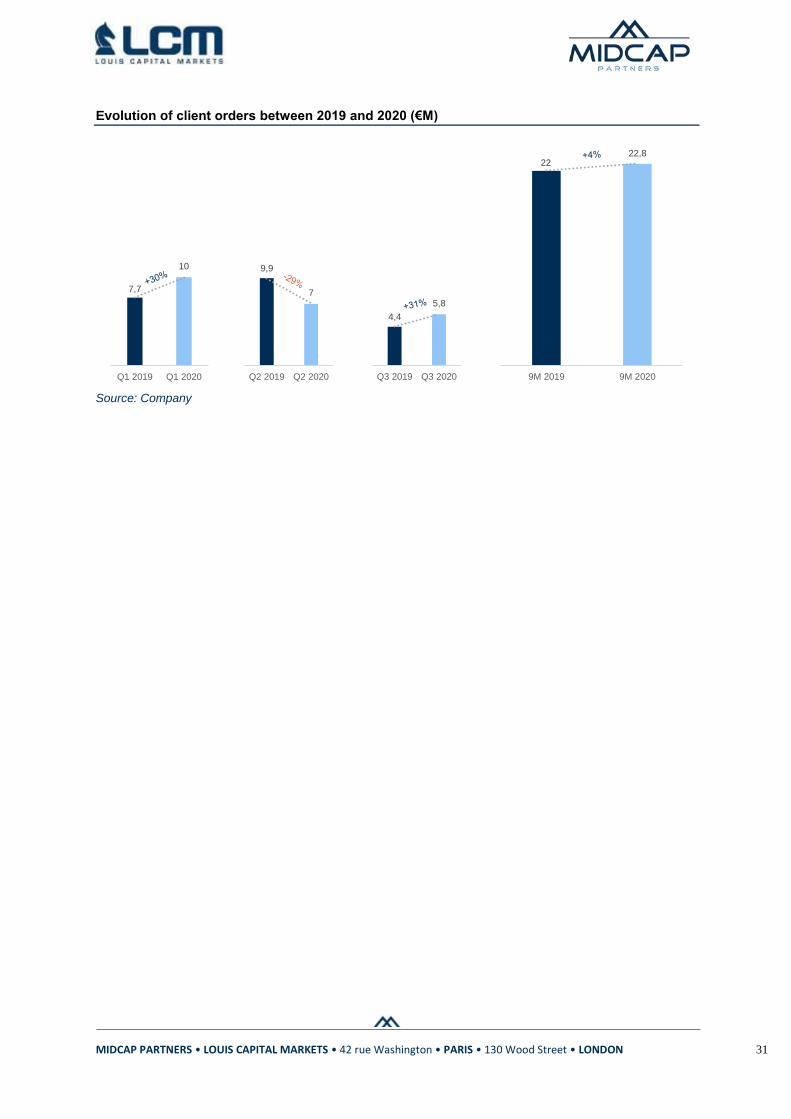
Capital Structure: OSAI has been self-financed from the outset (1991), permitting the founding family to hold 100% of the capital prior to an IPO. The price of this strategy, however, is rather heavy debt with a gearing of 239% and a financial leverage of 3.1x in 2019.
Source: Company
The capital injection following the IPO will bring the balance sheet back into equilibrium and provide the necessary flexibility to continue the company's promising development.
Revenue Profile Delivery Time Order Design Review Pre-acceptance Delivery Acceptance
Automation 6-12 months 30% 30% 0%-20% 30%-10% 10%
Electronics 3-6 months 0%-20%-30% 0% 0%-30%-10% 70%-20%-30% 30%
Semiconductors 3-6 months 0%-30% 0% 0%-50% 0% 100%-20%
Industrial Lasers 3-6 months 0%-30% 0% 0% 70%-10% 30%
4,3 5,8 6,9 7,3
14,3
15,3 14,7
17,4 17,0
10,1
3,6x
2,5x 2,5x 2,3x
0,7x
2017A 2018A 2019A 1H 2020A 2020E
Shareholders' Equity Net Financial Position NFP/Equity

MIDCAP PARTNERS • LOUIS CAPITAL MARKETS • 42 rue Washington • PARIS • 130 Wood Street • LONDON 30
Capex: A very significant part of the investments supported by OSAI are medium-term investments in development projects, on average 56% of total investments. 2017 was a year of substantial investments for OSAI. During this year, investments in fixed assets amounted to €3.0m, including €0.6m for the new M7 hangar. About €0.8m was invested in the production of two photovoltaic power plants and in the fibre optic infrastructure to keep the company up-to-date. Of this €3m, €1.6m represents development costs. In 2018, total investments amounted to €1.6m, of which €1.0m was for development projects. In 2019, investments amounted to €3m, including €1.1m for a "sale and lease back" operation of three machines produced by the parent company in previous years and intended for demonstrations at trade fairs and at customers' sites. This operation was necessary in order to facilitate the handling of the machines in terms of insurance and customs and not to overload the working capital. €1.6m of the €3m total mentioned above was allocated to development projects. Having recognised the importance of investments in development projects, it is useful to focus on this issue. Over the last three years, OSAI has allocated approximately €2.4m per year to development activities, capitalizing on average 60% of these costs and allocating the remaining 40% to the earnings statement. Total capex and development costs in €/000 (2017-2019)
Source: Company, Midcap Partners
Regarding orders, the company saw a 30% increase in Q1 2020, from €7.7m to €10m. Subsequently, the Covid pandemic hit the company's business and orders reached only 29% compared to Q1 2019 (€7.0m versus €9.9m). However, after the freeze, operations fully recovered with an 18% increase from July-August 2020 compared to the same period in 2019 (€4.0m versus €3.4m). In conclusion, orders from January to August 2020 are largely in line with those of the same period in 2019, standing at €21m.
0
500
1000
1500
2000
2500
3000
3500
2017 2018 2019
Total Capex of which Development Costs
67%
45%
64%
0%
10%
20%
30%
40%
50%
60%
70%
0
200
400
600
800
1000
1200
1400
1600
1800
2017 2018 2019
Expensed
Capitalized (in Capex)
% Capitalized
MIDCAP PARTNERS • LOUIS CAPITAL MARKETS • 42 rue Washington • PARIS • 130 Wood Street • LONDON 31
Evolution of client orders between 2019 and 2020 (€M)
Source: Company
7,7
10
Q1 2019 Q1 2020
9,9
7
Q2 2019 Q2 2020
4,4
5,8
Q3 2019 Q3 2020
22 22,8
9M 2019 9M 2020

MIDCAP PARTNERS • LOUIS CAPITAL MARKETS • 42 rue Washington • PARIS • 130 Wood Street • LONDON 32
VIII. Outlook
In the medium term, OSAI aims to expand and consolidate its organisational structure by recruiting senior executives in three key areas, namely sales, marketing and R&D. This is fully in line with the company's transition from a "sales-oriented" to a "business-oriented" company.
This means that OSAI needs to be closer to its customers in terms of sales force and technical assistance, in particular through the acquisition of qualified personnel at local level.
Much has been said about the development of after-sales service, through the employment of a new workforce in order to achieve:
Profitability and cash generation growth
Winning new customers and increasing customer loyalty
Future growth is expected to be mainly organic, but OSAI is actively monitoring the market to see if there are opportunities to acquire complementary niche operators in interesting countries, particularly in the laser and after-sales divisions.
Speaking of figures, OSAI plans to invest €9M over the next two and a half years:
Development of projects related to the circular economy: €5M
Significant investments in R&D that will require 4 million euros distributed equally between the Semiconductor Division and all other divisions.
In addition, in the medium- and long-term, after 2022, the company plans to invest a further €7m in:
M&A for the acquisition of new skills in innovative niche markets and for expansion into new geographical areas and new markets: €5M
Development of productive joint ventures in new markets such as the Far East, India and the Americas: 2M€.
Investments: Short-medium term (left) and medium-long term (right)
Source: Company
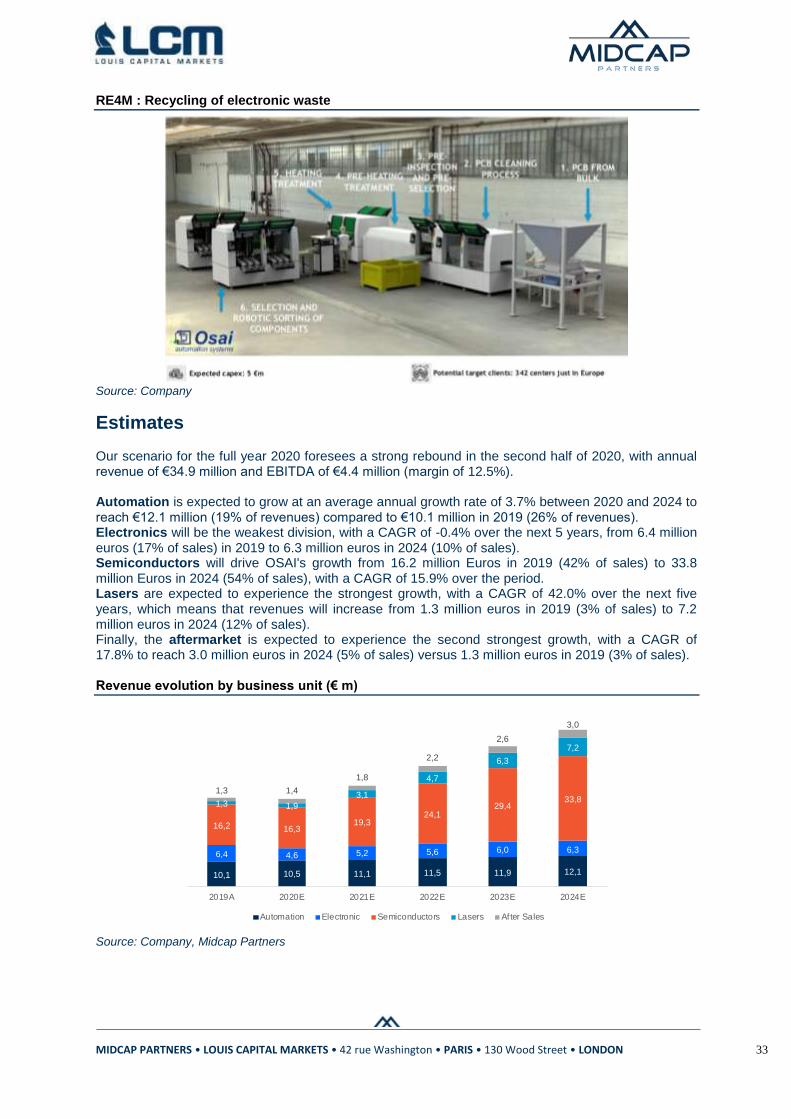
Circular Economy (RE4M): The Adir project is a European project promoted by the Horizon 2020 competition and coordinated by the Fraunhofer Institute. This project aims to develop an automated machine for the recovery of precious and rare metals from electronic devices, namely smartphones, tablets and electronic cards in general. Thanks to its work in advanced optical recognition, OSAI has studied and developed a machine capable of automatically identifying for these materials, which are subsequently dissolved by laser and collected in homogeneous containers. OSAI has already had contacts with two important international groups that are interested in this potential solution for recycling electronic components. Mr. Marco Guolo, who supervised the project, admitted that the company will spend between two to two and a half years developing a prototype. This prototype will then be tested at strategic collection points for electrical products. For this reason, the OSAI plans to market this new solution within four to five years.
Circular Economy;
5,0M€
R&D; 4,0M€
M&A; 5,0M€
Joint-ventures;
2,0M€
MIDCAP PARTNERS • LOUIS CAPITAL MARKETS • 42 rue Washington • PARIS • 130 Wood Street • LONDON 33
RE4M : Recycling of electronic waste
Source: Company
Estimates Our scenario for the full year 2020 foresees a strong rebound in the second half of 2020, with annual revenue of €34.9 million and EBITDA of €4.4 million (margin of 12.5%). Automation is expected to grow at an average annual growth rate of 3.7% between 2020 and 2024 to reach €12.1 million (19% of revenues) compared to €10.1 million in 2019 (26% of revenues). Electronics will be the weakest division, with a CAGR of -0.4% over the next 5 years, from 6.4 million euros (17% of sales) in 2019 to 6.3 million euros in 2024 (10% of sales). Semiconductors will drive OSAI's growth from 16.2 million Euros in 2019 (42% of sales) to 33.8 million Euros in 2024 (54% of sales), with a CAGR of 15.9% over the period. Lasers are expected to experience the strongest growth, with a CAGR of 42.0% over the next five years, which means that revenues will increase from 1.3 million euros in 2019 (3% of sales) to 7.2 million euros in 2024 (12% of sales). Finally, the aftermarket is expected to experience the second strongest growth, with a CAGR of 17.8% to reach 3.0 million euros in 2024 (5% of sales) versus 1.3 million euros in 2019 (3% of sales). Revenue evolution by business unit (€ m)
Source: Company, Midcap Partners
10,1 10,5 11,1 11,5 11,9 12,1
6,4 4,6 5,2 5,6 6,0 6,3
16,2 16,319,3
24,129,4
33,81,3 1,9
3,1
4,7
6,3
7,2
1,3 1,4
1,8
2,2
2,6
3,0
2019A 2020E 2021E 2022E 2023E 2024E
Automation Electronic Semiconductors Lasers After Sales

MIDCAP PARTNERS • LOUIS CAPITAL MARKETS • 42 rue Washington • PARIS • 130 Wood Street • LONDON 34
We estimate that the cost of raw materials and consumables should follow the historical average and remain between 30 and 32.5% of sales, with a slight increase in 2023 and 2024.
External services are expected to increase slightly as a percentage of sales starting in 2021, due to increased OSAI production.
According to management, OSAI will hire between 40 and 50 employees in the medium term, reaching 226 employees in 2024. For this reason, we have modeled personnel costs to increase from 10.6 million Euros in 2019 (27.5% of sales) to 15.0 million Euros in 2024 (24.0% of sales, -350bps). According to management's plan, we expect capital expenditure to be between 1.9 and 2.2 million euros per year, with a peak in 2021 due to the investment in the new plant (3 million euros). These figures are in line with OSAI's plan to invest approximately 16 million Euros over the next few years.
In terms of working capital, after 2020, the date of the COVID epidemic, we hope that OSAI will return to normal:
Receivables between 30.3% and 32.3% of revenues
Inventories between 45.9% and 43.9% of sales
Supplier debt between 16.0% and 19.0% of sales

MIDCAP PARTNERS • LOUIS CAPITAL MARKETS • 42 rue Washington • PARIS • 130 Wood Street • LONDON 35
IX. Management
Mirella Ferrero: Chair Co-founder of OSAI in 1992 with her brother Carlo Ferrero. More than 40 years of experience in the banking sector within the most important Italian financial groups, namely Unicredit, Banca Fideuram and Banca Generali. Ms. Ferrero has always been OSAI’s Chief Financial Officer.
Marco Guolo: CTO Mr. Guolo is the technical director and head of two divisions, namely Semiconductors and Lasers. He has nearly 30 years of experience in the field. He began his career in 1992 in laser design and production at RTM Spa. He joined OSAI in 1999 as a software analyst and only two years later he became director of the laser division. In 2011, he was appointed CTO and Technical and Commercial Director for the semiconductor and laser divisions.
Simone Ferraro: Technical & Sales Manager Mr. Ferraro is the technical and commercial director of the two remaining divisions, namely Automation and Electronics. He began working at OSAI in 2002 as Director of Laser Applications and held this position until 2008. Then, from 2008 to 2015, he served as Key Account Director, before also becoming Director of Sales Support.
Fabio Benetti – CEO Mr. Benetti holds a Master’s degree in Management Engineering from the University of Turin. He started his career in 2007 at OSAI as Head of Corporate Organisation. Since 2016 he has been COO and Head of Human Resources. This is a very important role within OSAI as HR is OSAI's most important asset. Following the IPO he became OSAI’s CEO.

MIDCAP PARTNERS • LOUIS CAPITAL MARKETS • 42 rue Washington • PARIS • 130 Wood Street • LONDON 36
Carlo Frigato : CFO Mr. Carlo Frigato holds a master's degree in electronic engineering and has a very long professional experience as a director. Mr. Frigato was the Chief Financial Officer of Buongiorno Spa between 2000 and 2014. Buongiorno Spa is one of Italy's most successful media companies and was listed on the Italian stock exchange until 2012, when it was acquired by Docomo. Between 2014 and 2018, Mr. Frigato was appointed Chief Financial Officer of Docomo Digital. Before becoming CFO of OSAI, he was appointed CFO of the Giglio Group in 2018.
X. ESG
A pioneer in ESG
OSAI has been interested in ESG since its inception and has increased its investment in "sustainability" in recent years.
Environment: In 2019, OSAI received ISO 14001:2015 certification for the environment and energy savings, particularly for water consumption. In addition, the company is pursuing the "OSAI Plastic Free Project" which aims to eliminate the use of plastics in all production plants up to the company cafeteria. Through this project, by 2020, OSAI will eliminate more than 20,000 plastic bottles and more than 75,000 coffee cups, reducing CO2 emissions by 10 tons.
In terms of energy consumption, OSAI has installed 5 photovoltaic power plants on its buildings which, in 2019, provided 158.5, MWh, reducing CO2 emissions by 91 tons (-19% compared to 2018).
Finally, as an in-depth analysis has shown, OSAI is very active in the development of automated solutions for the circular economy, such as the ADIR project.
Social: OSAI has always invested in renovating its buildings and offering its employees the best place to work and develop their full potential. The company offers all its employees additional accident insurance covering accidents at work and deaths outside of work. In addition, OSAI adopts flexible working hours, as well as smart-working permits and work permits for elderly families. These measures were particularly useful during the covid, when 130 workers worked in smart-working, thus ensuring continuity of operations. OSAI, which takes care of its employees, has been able to adopt security measures much stricter than those required by the government and, to date, none of its employees have tested positive for coronavirus. It should be considered that the group has not used any social safety net, such as the "Cassa Integrazione", but has maintained its entire workforce.
In addition, OSAI is investing heavily in the training of its workforce, in fact the number of training hours has increased from 780.5 hours in 2017 to 3,294 hours in 2019. OSAI is very active in its region and supports several social activities in schools and for people with disabilities. In addition, after the tragic death of Mr. Carlo Ferrero, founder of the company, OSAI created a non-profit organization for social benefit. Finally, during the pandemic emergency period, the group began producing face masks to be donated to hospitals, schools and charities.
MIDCAP PARTNERS • LOUIS CAPITAL MARKETS • 42 rue Washington • PARIS • 130 Wood Street • LONDON 37
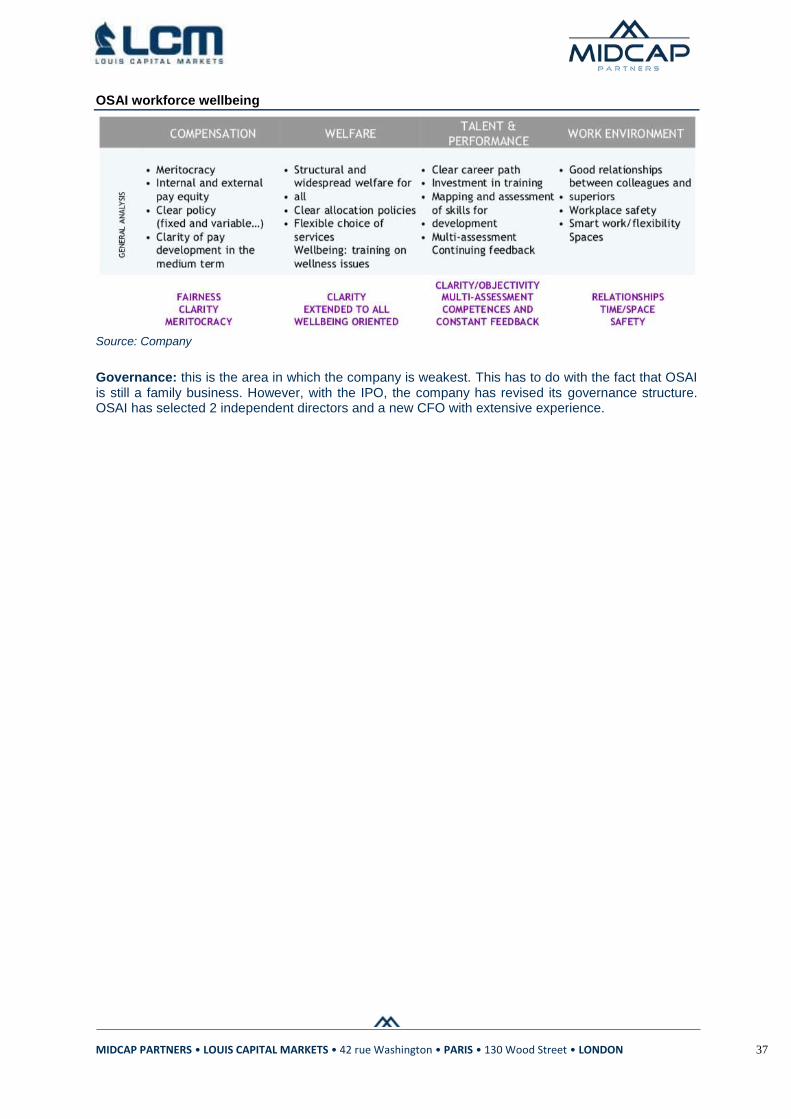
OSAI workforce wellbeing
Source: Company
Governance: this is the area in which the company is weakest. This has to do with the fact that OSAI is still a family business. However, with the IPO, the company has revised its governance structure. OSAI has selected 2 independent directors and a new CFO with extensive experience.

MIDCAP PARTNERS • LOUIS CAPITAL MARKETS • 42 rue Washington • PARIS • 130 Wood Street • LONDON 38
XI. Valuation
Discounted Cash Flow Our DCF valuation is based on the following assumptions: Normative flows
A Terminal Growth Rate of 2.0% Capital Expenditure (Capex) stable at 4.0% of revenue Depreciation & Amortization stable at 4.0% of revenue Change in Working Capital at 1% of revenue Corporate tax rate of 27.9%
Discount Rate (WACC: 9.9%)
A risk-free rate of 0.70% (10-year Italian BTP) A size and liquidity premium of 2.0% (200bps) A beta re-levered of 1.55 integrating a 57% equity and 43% debt financing structure An after-tax cost of debt of 2.9%
DCF discounting method : Flow chart
Source : Midcap Partners
DCF Valuation - FCFF 2021E 2022E 2023E 2024E 2025E 2026E 2027E 2028E 2029E 2030E
(All figures in K EUR millions)
Sales 40.405 47.988 56.082 62.433 68.532 74.162 79.103 83.143 86.098 87.820
% YoY 15,9% 18,8% 16,9% 11,3% 9,8% 8,2% 6,7% 5,1% 3,6% 2,0%
EBITDA recurring 5.416 6.869 8.308 9.373 10.300 11.157 11.909 12.525 12.976 13.239
% margin 13,4% 14,3% 14,8% 15,0% 15,0% 15,0% 15,1% 15,1% 15,1% 15,1%
Depreciation & Amortization 2.162 2.483 2.814 2.492 2.736 2.962 3.160 3.323 3.443 3.513
% of Sales 5,4% 5,2% 5,0% 4,0% 4,0% 4,0% 4,0% 4,0% 4,0% 4,0%
EBIT 3.254 4.385 5.493 6.882 7.564 8.195 8.749 9.202 9.533 9.726
EBIT Margin 8,1% 9,1% 9,8% 11,0% 11,0% 11,1% 11,1% 11,1% 11,1% 11,1%
Marginal tax rate 27,9% 27,9% 27,9% 27,9% 27,9% 27,9% 27,9% 27,9% 27,9% 27,9%
NOPAT 2.346 3.162 3.961 4.962 5.454 5.909 6.308 6.635 6.874 7.012
Add: Depreciation & Amortization + NCC 2.162 2.483 2.814 2.492 2.736 2.962 3.160 3.323 3.443 3.513
Less: Capital Expenditures 3.798 2.207 2.299 2.248 2.741 2.966 3.164 3.326 3.444 3.513
% of Sales 9,4% 4,6% 4,1% 3,6% 4,0% 4,0% 4,0% 4,0% 4,0% 4,0%
Less : Working Capital Changes 2.396 2.799 2.858 1.994 685 742 791 831 861 878
% of Sales 5,9% 5,8% 5,1% 3,2% 1,0% 1,0% 1,0% 1,0% 1,0% 1,0%
Unlevered Free Cash Flow (1.686) 639 1.618 3.212 4.763 5.162 5.513 5.801 6.011 6.134
Discount Period 1 2 3 4 5 6 7 8 9 10
Discount Factor 91% 83% 75% 69% 62% 57% 52% 47% 43% 39%
Present Value of Free Cash Flow (1.534) 529 1.219 2.202 2.972 2.931 2.848 2.727 2.571 2.387

MIDCAP PARTNERS • LOUIS CAPITAL MARKETS • 42 rue Washington • PARIS • 130 Wood Street • LONDON 39
Valuation summary
Source : Facset, Midcap Partners
Sensitivity analysis
Source : Midcap Partners
According to the DCF method, the enterprise value (EV) amounts to €49.7 million and, by subtracting the net financial position of €12.2 million, we have estimated an equity value of €37.5 million or €2.7 per share (potential upside of 65%).
Relative valuation
OSAI is a unique company, therefore we believe that a relative valuation will not be relevant. However, we present below such model for information purposes only.
Our peer sample is comprised of companies that compete with OSAI in at least one industry. The sample is heterogeneous, with many differences in size, margins, growth and leverage. It should be noted that most of OSAI's direct competitors are not publicly traded. We believe that this greatly compromises the relevance of the relative approach in this particular case.
Valuation Summary
Terminal Value Calculation: WACC CALCULATION
Perpetuity Growth Rate 2,0% Risk free rate (10 YR BTP) 0,70%
Terminal Year Free Cash Flow 6.134
Terminal Value 79.233 Size premium 2,0%
TV as a % of EV 62% Beta 1,55
Equity premium 8,0%
Implied Terminal EBITDA Multiple 6,0 x
Terminal Free Cash Flow Multiple 12,9 x Cost of equity 15,2%
Discount Factor 39% Interest rate 4,1%
NPV of Terminal Value 30.836 Tax rate 27,9%
Cost of debt (after tax) 2,9%
Cumulative NPV of Free Cash Flow 18.851
NPV of Terminal Value 30.836 % equity 56,80%
Enterprise Value 49.686 % debt 43,20%
Less : Bridge 12.235 Indirect Method WACC 9,9%
Equity Value (in '000€) 37.451
Shares outstanding 14.000
Price per share 2,68 €
Upside/(Downside) potential 65,1%
37 8,9% 9,4% 9,9% 10,4% 10,9%
1,0% € 41,3 € 37,3 € 33,7 € 30,5 € 27,7
1,5% € 43,8 € 39,4 € 35,5 € 32,0 € 29,0
2,0% € 46,6 € 41,7 € 37,5 € 33,7 € 30,4
2,5% € 49,8 € 44,4 € 39,7 € 35,6 € 32,1
3,0% € 53,6 € 47,5 € 42,3 € 37,8 € 33,9
49,6879163 8,9% 9,4% 9,9% 10,4% 10,9%
1,0% € 53,6 € 49,5 € 46,0 € 42,8 € 39,9
1,5% € 56,0 € 51,6 € 47,7 € 44,3 € 41,2
2,0% € 58,8 € 53,9 € 49,7 € 46,0 € 42,7
2,5% € 62,0 € 56,6 € 51,9 € 47,9 € 44,3
3,0% € 65,8 € 59,7 € 54,5 € 50,0 € 46,1
WACC
WACC
Perpetuity
growth
rate
Perpetuity
growth
rate
Enterprise Value (in €m)
Equity Value (in €m)
MIDCAP PARTNERS • LOUIS CAPITAL MARKETS • 42 rue Washington • PARIS • 130 Wood Street • LONDON 40
Description des comparables

MIDCAP PARTNERS • LOUIS CAPITAL MARKETS • 42 rue Washington • PARIS • 130 Wood Street • LONDON 41
Relative Valuation
Source : Factset, Midcap Partners
Applying a 30% discount, according to the above-mentioned comparison problem, we obtain a median relative valuation of €2.7 (fully consistent with our DCF valuation).
Relative Valuation
Discount applied to multiple 30%
Valuation year 2021E
2021E EV/Sales EV/EBITDA EV/EBIT EV/FCFF P/E P/B
Figure 40,4 5,4 3,3 3,1 1,9 16,1
Multiple 3,2 x 12,7 x 15,7 x 24,2 x 19,5 x 4,3 x
Multiple at -30% discount 2,2 x 8,9 x 11,0 x 17,0 x 13,6 x 3,0 x
Enterprise Value 89,9 48,0 35,7 52,7
Bridge 2020E (12,2) (12,2) (12,2) (12,2)
Equity 77,7 35,8 23,5 40,4 25,2 48,8
Diluted Number of shares 2020E 14,0 14,0 14,0 14,0 14,0 14,0
Equity value 5,6 2,6 1,7 2,9 1,8 3,5
% upside (downside) 240,5% 56,7% 2,9% 77,1% 10,6% 113,8%
Average Multiples € 2,99
Median Multiples € 2,72
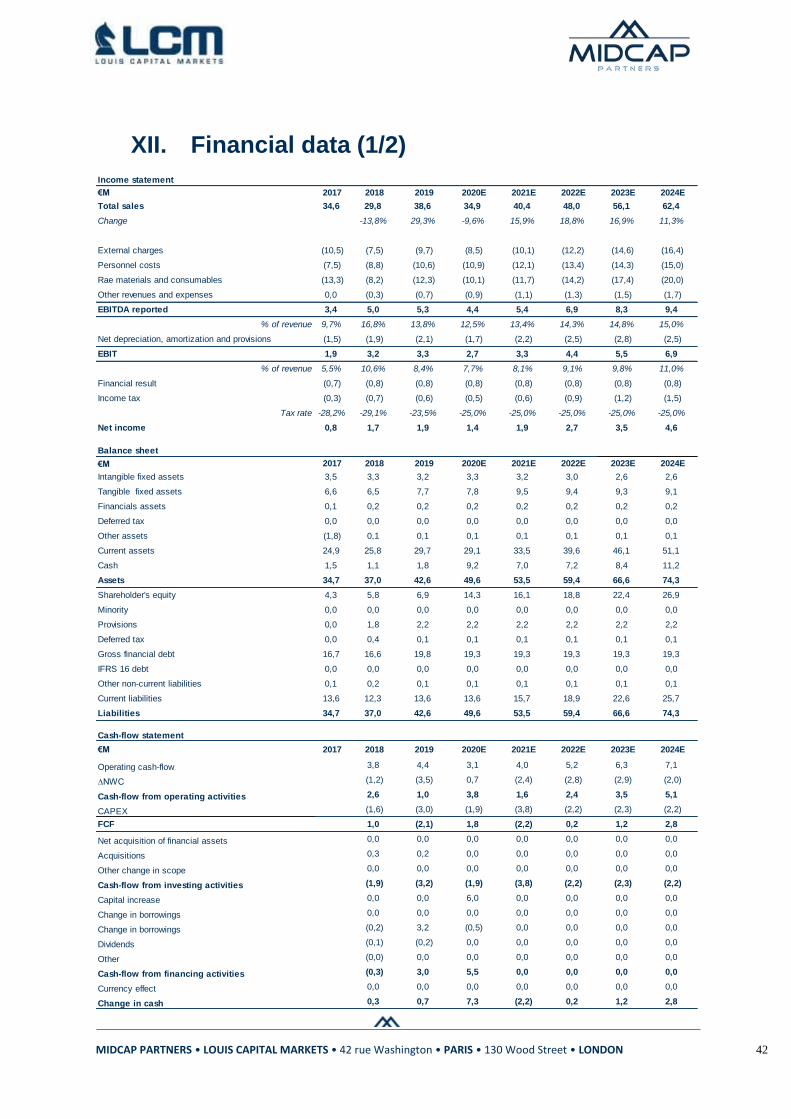
MIDCAP PARTNERS • LOUIS CAPITAL MARKETS • 42 rue Washington • PARIS • 130 Wood Street • LONDON 42
XII. Financial data (1/2)
Income statement
€M 2017 2018 2019 2020E 2021E 2022E 2023E 2024E
Total sales 34,6 29,8 38,6 34,9 40,4 48,0 56,1 62,4
Change -13,8% 29,3% -9,6% 15,9% 18,8% 16,9% 11,3%
External charges (10,5) (7,5) (9,7) (8,5) (10,1) (12,2) (14,6) (16,4)
Personnel costs (7,5) (8,8) (10,6) (10,9) (12,1) (13,4) (14,3) (15,0)
Rae materials and consumables (13,3) (8,2) (12,3) (10,1) (11,7) (14,2) (17,4) (20,0)
Other revenues and expenses 0,0 (0,3) (0,7) (0,9) (1,1) (1,3) (1,5) (1,7)
EBITDA reported 3,4 5,0 5,3 4,4 5,4 6,9 8,3 9,4
% of revenue 9,7% 16,8% 13,8% 12,5% 13,4% 14,3% 14,8% 15,0%
Net depreciation, amortization and provisions (1,5) (1,9) (2,1) (1,7) (2,2) (2,5) (2,8) (2,5)
EBIT 1,9 3,2 3,3 2,7 3,3 4,4 5,5 6,9
% of revenue 5,5% 10,6% 8,4% 7,7% 8,1% 9,1% 9,8% 11,0%
Financial result (0,7) (0,8) (0,8) (0,8) (0,8) (0,8) (0,8) (0,8)
Income tax (0,3) (0,7) (0,6) (0,5) (0,6) (0,9) (1,2) (1,5)
Tax rate -28,2% -29,1% -23,5% -25,0% -25,0% -25,0% -25,0% -25,0%
Net income 0,8 1,7 1,9 1,4 1,9 2,7 3,5 4,6
Balance sheet
€M 2017 2018 2019 2020E 2021E 2022E 2023E 2024E
Intangible fixed assets 3,5 3,3 3,2 3,3 3,2 3,0 2,6 2,6
Tangible fixed assets 6,6 6,5 7,7 7,8 9,5 9,4 9,3 9,1
Financials assets 0,1 0,2 0,2 0,2 0,2 0,2 0,2 0,2
Deferred tax 0,0 0,0 0,0 0,0 0,0 0,0 0,0 0,0
Other assets (1,8) 0,1 0,1 0,1 0,1 0,1 0,1 0,1
Current assets 24,9 25,8 29,7 29,1 33,5 39,6 46,1 51,1
Cash 1,5 1,1 1,8 9,2 7,0 7,2 8,4 11,2
Assets 34,7 37,0 42,6 49,6 53,5 59,4 66,6 74,3
Shareholder's equity 4,3 5,8 6,9 14,3 16,1 18,8 22,4 26,9
Minority 0,0 0,0 0,0 0,0 0,0 0,0 0,0 0,0
Provisions 0,0 1,8 2,2 2,2 2,2 2,2 2,2 2,2
Deferred tax 0,0 0,4 0,1 0,1 0,1 0,1 0,1 0,1
Gross financial debt 16,7 16,6 19,8 19,3 19,3 19,3 19,3 19,3
IFRS 16 debt 0,0 0,0 0,0 0,0 0,0 0,0 0,0 0,0
Other non-current liabilities 0,1 0,2 0,1 0,1 0,1 0,1 0,1 0,1
Current liabilities 13,6 12,3 13,6 13,6 15,7 18,9 22,6 25,7
Liabilities 34,7 37,0 42,6 49,6 53,5 59,4 66,6 74,3
Cash-flow statement
€M 2017 2018 2019 2020E 2021E 2022E 2023E 2024E
Operating cash-flow 3,8 4,4 3,1 4,0 5,2 6,3 7,1
∆NWC (1,2) (3,5) 0,7 (2,4) (2,8) (2,9) (2,0)
Cash-flow from operating activities 2,6 1,0 3,8 1,6 2,4 3,5 5,1
CAPEX (1,6) (3,0) (1,9) (3,8) (2,2) (2,3) (2,2)
FCF 1,0 (2,1) 1,8 (2,2) 0,2 1,2 2,8
Net acquisition of financial assets 0,0 0,0 0,0 0,0 0,0 0,0 0,0
Acquisitions 0,3 0,2 0,0 0,0 0,0 0,0 0,0
Other change in scope 0,0 0,0 0,0 0,0 0,0 0,0 0,0
Cash-flow from investing activities (1,9) (3,2) (1,9) (3,8) (2,2) (2,3) (2,2)
Capital increase 0,0 0,0 6,0 0,0 0,0 0,0 0,0
Change in borrowings 0,0 0,0 0,0 0,0 0,0 0,0 0,0
Change in borrowings (0,2) 3,2 (0,5) 0,0 0,0 0,0 0,0
Dividends (0,1) (0,2) 0,0 0,0 0,0 0,0 0,0
Other (0,0) 0,0 0,0 0,0 0,0 0,0 0,0
Cash-flow from financing activities (0,3) 3,0 5,5 0,0 0,0 0,0 0,0
Currency effect 0,0 0,0 0,0 0,0 0,0 0,0 0,0
Change in cash 0,3 0,7 7,3 (2,2) 0,2 1,2 2,8
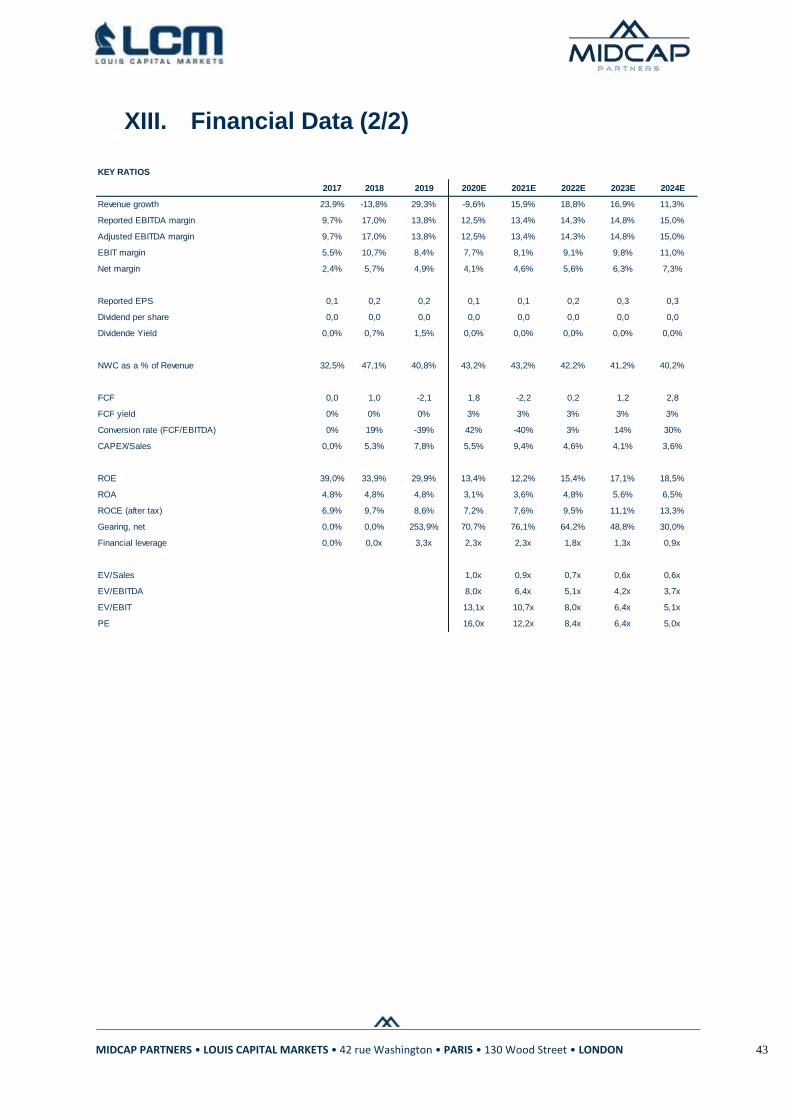
MIDCAP PARTNERS • LOUIS CAPITAL MARKETS • 42 rue Washington • PARIS • 130 Wood Street • LONDON 43
XIII. Financial Data (2/2)
KEY RATIOS
2017 2018 2019 2020E 2021E 2022E 2023E 2024E
Revenue growth 23,9% -13,8% 29,3% -9,6% 15,9% 18,8% 16,9% 11,3%
Reported EBITDA margin 9,7% 17,0% 13,8% 12,5% 13,4% 14,3% 14,8% 15,0%
Adjusted EBITDA margin 9,7% 17,0% 13,8% 12,5% 13,4% 14,3% 14,8% 15,0%
EBIT margin 5,5% 10,7% 8,4% 7,7% 8,1% 9,1% 9,8% 11,0%
Net margin 2,4% 5,7% 4,9% 4,1% 4,6% 5,6% 6,3% 7,3%
Reported EPS 0,1 0,2 0,2 0,1 0,1 0,2 0,3 0,3
Dividend per share 0,0 0,0 0,0 0,0 0,0 0,0 0,0 0,0
Dividende Yield 0,0% 0,7% 1,5% 0,0% 0,0% 0,0% 0,0% 0,0%
NWC as a % of Revenue 32,5% 47,1% 40,8% 43,2% 43,2% 42,2% 41,2% 40,2%
FCF 0,0 1,0 -2,1 1,8 -2,2 0,2 1,2 2,8
FCF yield 0% 0% 0% 3% 3% 3% 3% 3%
Conversion rate (FCF/EBITDA) 0% 19% -39% 42% -40% 3% 14% 30%
CAPEX/Sales 0,0% 5,3% 7,8% 5,5% 9,4% 4,6% 4,1% 3,6%
ROE 39,0% 33,9% 29,9% 13,4% 12,2% 15,4% 17,1% 18,5%
ROA 4,8% 4,8% 4,8% 3,1% 3,6% 4,8% 5,6% 6,5%
ROCE (after tax) 6,9% 9,7% 8,6% 7,2% 7,6% 9,5% 11,1% 13,3%
Gearing, net 0,0% 0,0% 253,9% 70,7% 76,1% 64,2% 48,8% 30,0%
Financial leverage 0,0% 0,0x 3,3x 2,3x 2,3x 1,8x 1,3x 0,9x
EV/Sales 1,0x 0,9x 0,7x 0,6x 0,6x
EV/EBITDA 8,0x 6,4x 5,1x 4,2x 3,7x
EV/EBIT 13,1x 10,7x 8,0x 6,4x 5,1x
PE 16,0x 12,2x 8,4x 6,4x 5,0x
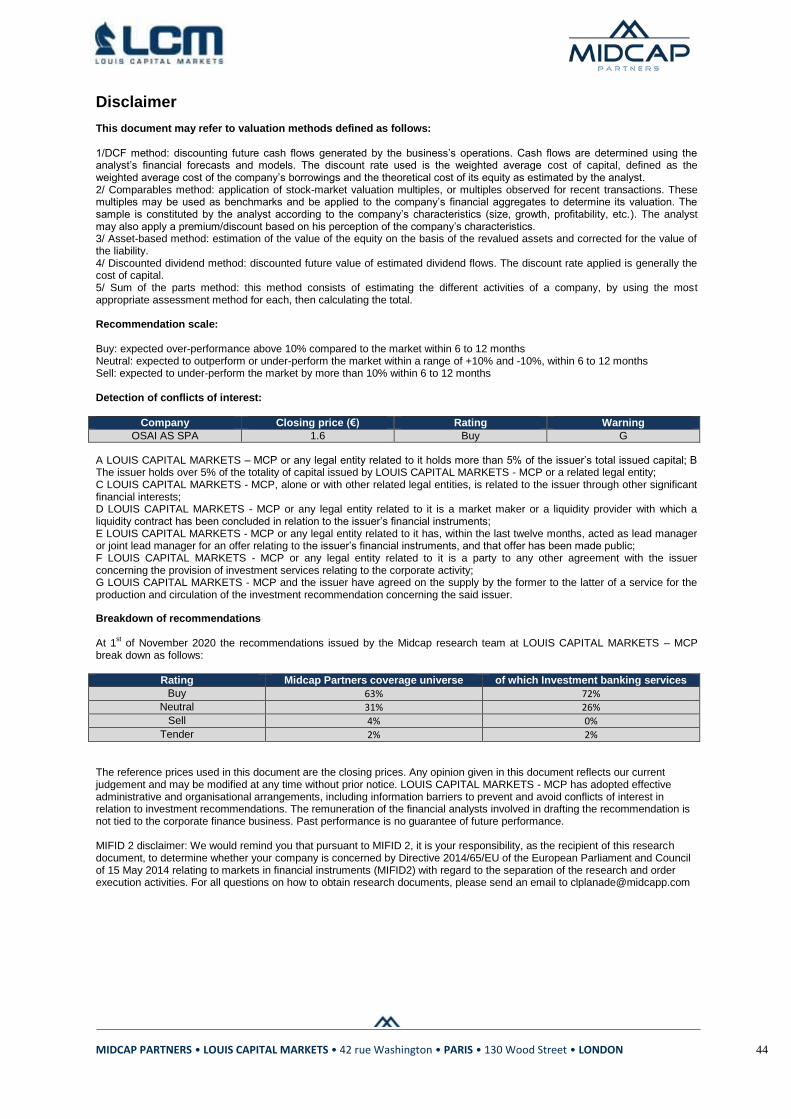
MIDCAP PARTNERS • LOUIS CAPITAL MARKETS • 42 rue Washington • PARIS • 130 Wood Street • LONDON 44
Disclaimer
This document may refer to valuation methods defined as follows: 1/DCF method: discounting future cash flows generated by the business’s operations. Cash flows are determined using the analyst’s financial forecasts and models. The discount rate used is the weighted average cost of capital, defined as the weighted average cost of the company’s borrowings and the theoretical cost of its equity as estimated by the analyst. 2/ Comparables method: application of stock-market valuation multiples, or multiples observed for recent transactions. These multiples may be used as benchmarks and be applied to the company’s financial aggregates to determine its valuation. The sample is constituted by the analyst according to the company’s characteristics (size, growth, profitability, etc.). The analyst may also apply a premium/discount based on his perception of the company’s characteristics. 3/ Asset-based method: estimation of the value of the equity on the basis of the revalued assets and corrected for the value of the liability. 4/ Discounted dividend method: discounted future value of estimated dividend flows. The discount rate applied is generally the cost of capital. 5/ Sum of the parts method: this method consists of estimating the different activities of a company, by using the most appropriate assessment method for each, then calculating the total. Recommendation scale: Buy: expected over-performance above 10% compared to the market within 6 to 12 months Neutral: expected to outperform or under-perform the market within a range of +10% and -10%, within 6 to 12 months Sell: expected to under-perform the market by more than 10% within 6 to 12 months Detection of conflicts of interest:
Company Closing price (€) Rating Warning
OSAI AS SPA 1.6 Buy G A LOUIS CAPITAL MARKETS – MCP or any legal entity related to it holds more than 5% of the issuer’s total issued capital; B The issuer holds over 5% of the totality of capital issued by LOUIS CAPITAL MARKETS - MCP or a related legal entity; C LOUIS CAPITAL MARKETS - MCP, alone or with other related legal entities, is related to the issuer through other significant financial interests; D LOUIS CAPITAL MARKETS - MCP or any legal entity related to it is a market maker or a liquidity provider with which a liquidity contract has been concluded in relation to the issuer’s financial instruments; E LOUIS CAPITAL MARKETS - MCP or any legal entity related to it has, within the last twelve months, acted as lead manager or joint lead manager for an offer relating to the issuer’s financial instruments, and that offer has been made public; F LOUIS CAPITAL MARKETS - MCP or any legal entity related to it is a party to any other agreement with the issuer concerning the provision of investment services relating to the corporate activity; G LOUIS CAPITAL MARKETS - MCP and the issuer have agreed on the supply by the former to the latter of a service for the production and circulation of the investment recommendation concerning the said issuer.
Breakdown of recommendations At 1
st of November 2020 the recommendations issued by the Midcap research team at LOUIS CAPITAL MARKETS – MCP
break down as follows:
Rating Midcap Partners coverage universe of which Investment banking services
Buy 63% 72%
Neutral 31% 26%
Sell 4% 0%
Tender 2% 2%
The reference prices used in this document are the closing prices. Any opinion given in this document reflects our current judgement and may be modified at any time without prior notice. LOUIS CAPITAL MARKETS - MCP has adopted effective administrative and organisational arrangements, including information barriers to prevent and avoid conflicts of interest in relation to investment recommendations. The remuneration of the financial analysts involved in drafting the recommendation is not tied to the corporate finance business. Past performance is no guarantee of future performance. MIFID 2 disclaimer: We would remind you that pursuant to MIFID 2, it is your responsibility, as the recipient of this research document, to determine whether your company is concerned by Directive 2014/65/EU of the European Parliament and Council of 15 May 2014 relating to markets in financial instruments (MIFID2) with regard to the separation of the research and order execution activities. For all questions on how to obtain research documents, please send an email to [email protected]

MIDCAP PARTNERS • LOUIS CAPITAL MARKETS • 42 rue Washington • PARIS • 130 Wood Street • LONDON 45
Research Disclosure - NOTICE TO US INVESTORS: This report was prepared, approved, published and distributed by Midcap Partners a company located outside of the United States (a “non-US Company”). This report is distributed in the U.S. by Louis Capital Markets, LP, a U.S. registered broker dealer, which assumes responsibility for the research report’s content, and is meant only for major U.S. institutional investors (as defined in Rule 15a-6 under the U.S. Securities Exchange Act of 1934 (the “Exchange Act”)) pursuant to the exemption in Rule 15a-6 and any transaction effected by a U.S. customer in the securities described in this report must be effected through Louis Capital Markets, LP rather than with or through the non-US Company. Neither the report nor any analyst who prepared or approved the report is subject to U.S. legal requirements or the Financial Industry Regulatory Authority, Inc. (“FINRA”) or other regulatory requirements pertaining to research reports or research analysts. The non-US Company is not registered as a broker-dealer under the Exchange Act or is a member of the Financial Industry Regulatory Authority, Inc. or any other U.S. self-regulatory organization. The non-US Company is the employer of the research analyst(s) responsible for this research report. The research analysts preparing this report are resident outside the United States and are not associated persons of any US regulated broker-dealer and therefore the analyst(s) is/are not subject to supervision by a US broker-dealer, and are not required to satisfy the regulatory licensing requirements of FINRA or required to otherwise comply with US rules or regulations regarding, among other things, communications with a subject company, public appearances and trading securities held by a research analyst account. Analyst Certification. Each of the analysts identified in this report certifies, with respect to the companies or securities that the individual analyses, that (1) the views expressed in this report reflect his or her personal views about all of the subject companies and securities and such recommendations were elaborated independently; and (2) no part of his or her compensation was, is or will be directly or indirectly dependent on the specific recommendations or views expressed in this report. This material was produced solely for information purposes and for the use of the recipient. This document does not constitute an offer of, or an invitation to buy or sell any security. The information contained herein has been obtained from published information and other sources which are considered to be reliable. The Companies noted herein accepts no liability or responsibility whatsoever for the accuracy or completeness of any such information. All estimates, expressions of opinion and other subjective judgments contained herein are made as of the date of this document. Louis Capital Markets, LP assumes responsibility for the research reports content in regards to research distributed in the U.S. Louis Capital Markets, LP, or its affiliates, has not managed or co-managed a public offering of securities for the subject company in the past 12 months, has not received compensation for investment banking services from the subject company in the past 12 months, does not expect to receive and does not intend to seek compensation for investment banking services from the subject company in the next 3 months. Louis Capital Markets, LP, or its affiliates, do not beneficially own 1% or more of the subject securities and there are not any other actual, material conflicts of interest noted at the time of the publication of this research report. As of the publication of this report, Louis Capital Markets, LP does not make a market in the subject securities. The non-US Company will refrain from initiating follow-up contacts with any recipient of this research report that does not qualify as a Major Institutional Investor, or seek to otherwise induce or attempt to induce the purchase or sale of any security addressed in this research report by such recipient.


![[FlexiOPTIMA] · Fagor / OSAI / OptiCNC Graph Fagor / OSAI / OptiCNC Graph Servo Servo Grampos ou Vácuo Staples and/or Vacuum Grampos ou Vácuo Staples and/or Vacuum 5020 5000 x](https://static.fdocuments.in/doc/165x107/608030a57e2a7a5cb1185d24/flexioptima-fagor-osai-opticnc-graph-fagor-osai-opticnc-graph-servo-servo.jpg)