Equity Research Adj. EBIT (3) (4) (2) (1) Nitro Games · game one day, seven days, and 30 days...
24
research.sebgroup.com/equity Important. All disclosure information can be found on pages 22 – 24 of this document Equity Research Nitro Games Buy Initiation of coverage IT/Technology Finland 19 December 2018 Keep your Nitros close at hand We initiate coverage of Nitro Games with a Buy recommendation and a target price of SEK 88.6. We believe that the company can gradually ramp-up its self-publishing revenues, while benefitting from Netmarble’s expertise in the MEA and Asia regions. Short-term revenues will be dependent on the new game ‘Heroes of Warland’. In 2019-20 we expect the company to launch one to two games, which would diversify single game risk. Investment case – partnerships and publishing Nitro Games (Nitro) has demonstrated its ability to develop and publish games. The company has cooperated with larger peers such as Paradox Interactive and Wargaming in work-for-hire projects. The company has partnered with Netmarble EMEA to act as its publishing partner in the Middle East and Africa (MEA) region. Samsung Electronics America and Huawei have both agreed to promote ‘Heroes of Warland’. We expect Nitro’s self-publishing business to drive growth in its revenues and gross margin over the next three years. Financial forecast – growth in the emerging mobile game genre We expect Nitro’s revenues to grow by 97% in 2019 and 45% in 2020. We believe the key driver of growth will be Nitro publishing its ‘Heroes of Warland’ and ‘Medals of War’ games, along with proceeds from the cooperation with Netmarble in the MEA region for two of Nitro’s games. We expect further growth potential overtime from Netmarble Asia willing to promote the games in China and rest of Asia and new work-for-hire contacts with large partners. Valuation – justified by a high rate of growth Nitro trades at 2.3x and 1.7x 2019E and 2020E EV/Sales, respectively. The company has many ways to justify the current share price, most notably the Netmarble partnership. Nitro must now deliver on growth and the valuation is justified, in our view, with room for multiples expansion. Key Data (2018E) Price (SEK) Target price (SEK) Recommendation Risk Reuters Bloomberg Market cap (SEKm) Market cap (USDm) Market cap (EURm) Net debt (EURm) Shares fully dil. (m) Avg daily turnover (SEKm) Free float 40.10 88.60 Buy 14 Normal 0 16 145 NITRO.ST 69% (4) 3.6 0.4 Share Price (12M) Absolute performance (green) / Relative to Nordic IT/Technology (purple). 30 40 50 60 70 80 Dec Jan Apr Jun Aug Oct Dec Financials (EUR) Source for all data on this page: SEB (estimates) and SIX/Thomson Reuters (prices) Year end: Dec 2017 2018E 2019E 2020E Revenues (m) 2 3 5 8 Adj. EBIT (3) (4) (2) (1) Pre-tax profit (m) (3) (4) (2) (1) EPS (1.91) (1.56) (0.66) (0.33) Adj. EPS (1.91) (1.56) (0.66) (0.33) DPS 0.00 0.00 0.00 0.00 Revenue growth (%) n.m. 54.1 97.0 44.9 Adj. EBIT growth (%) n.m. n.m. n.m. n.m. Adj. EPS growth (%) n.m. n.m. n.m. n.m. Adj. EBIT margin (%) n.m. n.m. (43.8) (15.1) ROE (%) (148.2) (104.4) (62.5) (58.7) ROCE (%) (120.4) (96.6) (57.5) (50.4) PER (x) n.m. n.m. n.m. n.m. Free cash flow yield (%) (28.9) (39.6) (17.4) (8.9) Dividend yield (%) 0.0 0.0 0.0 0.0 P/BV (x) 4.19 2.81 5.37 9.83 EV/Sales (x) 6.75 3.75 2.35 1.78 EV/Adj. EBITDA (x) (6.2) (2.8) (7.3) (25.4) EV/Adj. EBIT (x) (4.6) (2.4) (5.3) (11.7) Operating cash flow/EV (%) (25.5) (34.8) (13.8) (3.9) Net debt/Adj. EBITDA (x) 0.82 1.04 0.80 0.28 Analyst Veli-Pekka Puolakanaho (358) 9 616 28509 [email protected] Date and time of decision to initiate recommendation: 18 Dec 2018, 09:30 CET
Transcript of Equity Research Adj. EBIT (3) (4) (2) (1) Nitro Games · game one day, seven days, and 30 days...

research.sebgroup.com/equity Important. All disclosure information can be found on pages 22 – 24 of this document
Equity Research Nitro Games
Buy
Initiation of coverage IT/Technology Finland 19 December 2018
Keep your Nitros close at hand We initiate coverage of Nitro Games with a Buy recommendation and a target price of SEK 88.6. We believe that the company can gradually ramp-up its self-publishing revenues, while benefitting from Netmarble’s expertise in the MEA and Asia regions. Short-term revenues will be dependent on the new game ‘Heroes of Warland’. In 2019-20 we expect the company to launch one to two games, which would diversify single game risk.
Investment case – partnerships and publishing Nitro Games (Nitro) has demonstrated its ability to develop and publish games. The company has cooperated with larger peers such as Paradox Interactive and Wargaming in work-for-hire projects. The company has partnered with Netmarble EMEA to act as its publishing partner in the Middle East and Africa (MEA) region. Samsung Electronics America and Huawei have both agreed to promote ‘Heroes of Warland’. We expect Nitro’s self-publishing business to drive growth in its revenues and gross margin over the next three years.
Financial forecast – growth in the emerging mobile game genre We expect Nitro’s revenues to grow by 97% in 2019 and 45% in 2020. We believe the key driver of growth will be Nitro publishing its ‘Heroes of Warland’ and ‘Medals of War’ games, along with proceeds from the cooperation with Netmarble in the MEA region for two of Nitro’s games. We expect further growth potential overtime from Netmarble Asia willing to promote the games in China and rest of Asia and new work-for-hire contacts with large partners.
Valuation – justified by a high rate of growth Nitro trades at 2.3x and 1.7x 2019E and 2020E EV/Sales, respectively. The company has many ways to justify the current share price, most notably the Netmarble partnership. Nitro must now deliver on growth and the valuation is justified, in our view, with room for multiples expansion.
Key Data (2018E)
Price (SEK)Target price (SEK)RecommendationRisk
ReutersBloomberg
Market cap (SEKm)Market cap (USDm)Market cap (EURm)Net debt (EURm)
Shares fully dil. (m)Avg daily turnover (SEKm)Free float
40.1088.60
Buy
14
Normal
0
16145
NITRO.ST
69%
(4)
3.60.4
Share Price (12M)
Absolute performance (green) / Relative to Nordic IT/Technology (purple).
30
40
50
60
70
80
Dec Jan Apr Jun Aug Oct Dec
Financials (EUR)
Source for all data on this page: SEB (estimates) and SIX/Thomson Reuters (prices)
Year end: Dec 2017 2018E 2019E 2020ERevenues (m) 2 3 5 8Adj. EBIT (3) (4) (2) (1)Pre-tax profit (m) (3) (4) (2) (1)EPS (1.91) (1.56) (0.66) (0.33)Adj. EPS (1.91) (1.56) (0.66) (0.33)DPS 0.00 0.00 0.00 0.00
Revenue growth (%) n.m. 54.1 97.0 44.9Adj. EBIT growth (%) n.m. n.m. n.m. n.m.Adj. EPS growth (%) n.m. n.m. n.m. n.m.
Adj. EBIT margin (%) n.m. n.m. (43.8) (15.1)ROE (%) (148.2) (104.4) (62.5) (58.7)ROCE (%) (120.4) (96.6) (57.5) (50.4)
PER (x) n.m. n.m. n.m. n.m.Free cash flow yield (%) (28.9) (39.6) (17.4) (8.9)Dividend yield (%) 0.0 0.0 0.0 0.0P/BV (x) 4.19 2.81 5.37 9.83
EV/Sales (x) 6.75 3.75 2.35 1.78EV/Adj. EBITDA (x) (6.2) (2.8) (7.3) (25.4)EV/Adj. EBIT (x) (4.6) (2.4) (5.3) (11.7)Operating cash flow/EV (%) (25.5) (34.8) (13.8) (3.9)Net debt/Adj. EBITDA (x) 0.82 1.04 0.80 0.28
Analyst Veli-Pekka Puolakanaho (358) 9 616 28509 [email protected]
Date and time of decision to initiate recommendation: 18 Dec 2018, 09:30 CET
Company Update Nitro Games 19 December 2018 2
Equity Research
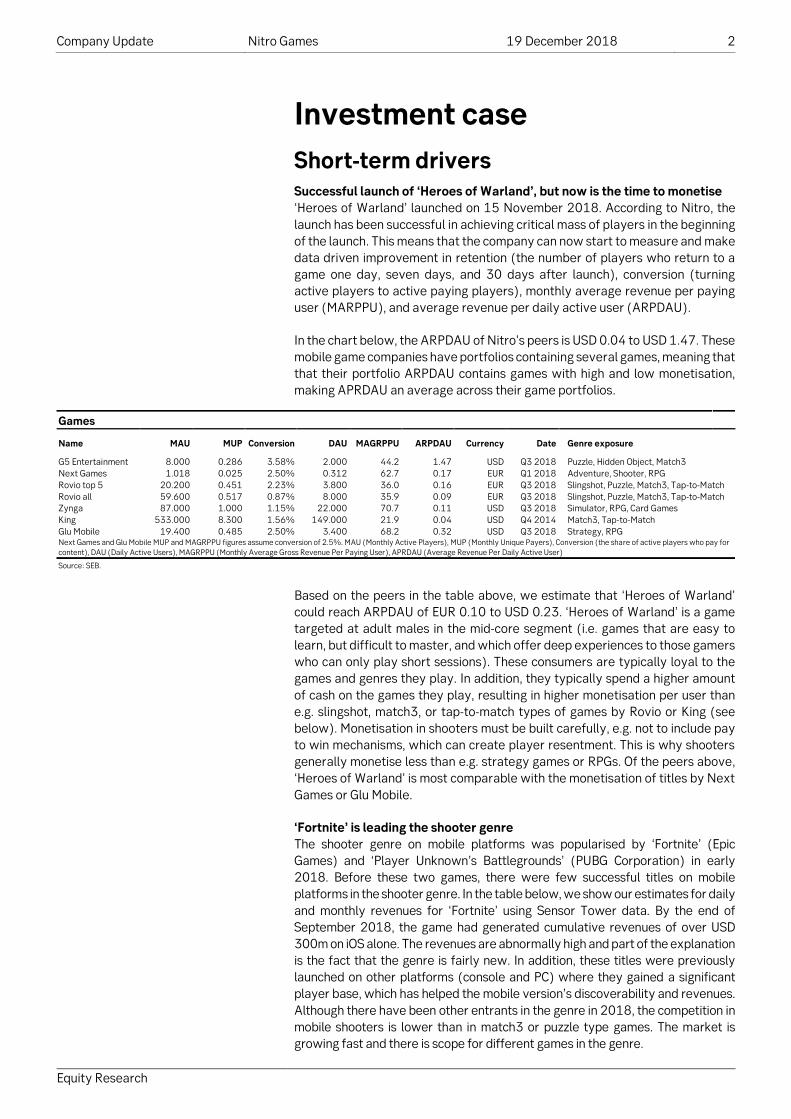
Investment case Short-term drivers Successful launch of ‘Heroes of Warland’, but now is the time to monetise ‘Heroes of Warland’ launched on 15 November 2018. According to Nitro, the launch has been successful in achieving critical mass of players in the beginning of the launch. This means that the company can now start to measure and make data driven improvement in retention (the number of players who return to a game one day, seven days, and 30 days after launch), conversion (turning active players to active paying players), monthly average revenue per paying user (MARPPU), and average revenue per daily active user (ARPDAU).
In the chart below, the ARPDAU of Nitro’s peers is USD 0.04 to USD 1.47. These mobile game companies have portfolios containing several games, meaning that that their portfolio ARPDAU contains games with high and low monetisation, making APRDAU an average across their game portfolios.
Games
Name MAU MUP Conversion DAU MAGRPPU ARPDAU Currency Date Genre exposure G5 Entertainment 8.000 0.286 3.58% 2.000 44.2 1.47 USD Q3 2018 Puzzle, Hidden Object, Match3 Next Games 1.018 0.025 2.50% 0.312 62.7 0.17 EUR Q1 2018 Adventure, Shooter, RPG Rovio top 5 20.200 0.451 2.23% 3.800 36.0 0.16 EUR Q3 2018 Slingshot, Puzzle, Match3, Tap-to-Match Rovio all 59.600 0.517 0.87% 8.000 35.9 0.09 EUR Q3 2018 Slingshot, Puzzle, Match3, Tap-to-Match Zynga 87.000 1.000 1.15% 22.000 70.7 0.11 USD Q3 2018 Simulator, RPG, Card Games King 533.000 8.300 1.56% 149.000 21.9 0.04 USD Q4 2014 Match3, Tap-to-Match Glu Mobile 19.400 0.485 2.50% 3.400 68.2 0.32 USD Q3 2018 Strategy, RPG Next Games and Glu Mobile MUP and MAGRPPU figures assume conversion of 2.5%. MAU (Monthly Active Players), MUP (Monthly Unique Payers), Conversion (the share of active players who pay for content), DAU (Daily Active Users), MAGRPPU (Monthly Average Gross Revenue Per Paying User), APRDAU (Average Revenue Per Daily Active User)
Source: SEB.
Based on the peers in the table above, we estimate that ‘Heroes of Warland’ could reach ARPDAU of EUR 0.10 to USD 0.23. ‘Heroes of Warland’ is a game targeted at adult males in the mid-core segment (i.e. games that are easy to learn, but difficult to master, and which offer deep experiences to those gamers who can only play short sessions). These consumers are typically loyal to the games and genres they play. In addition, they typically spend a higher amount of cash on the games they play, resulting in higher monetisation per user than e.g. slingshot, match3, or tap-to-match types of games by Rovio or King (see below). Monetisation in shooters must be built carefully, e.g. not to include pay to win mechanisms, which can create player resentment. This is why shooters generally monetise less than e.g. strategy games or RPGs. Of the peers above, ‘Heroes of Warland’ is most comparable with the monetisation of titles by Next Games or Glu Mobile.
‘Fortnite’ is leading the shooter genre The shooter genre on mobile platforms was popularised by ‘Fortnite’ (Epic Games) and ‘Player Unknown’s Battlegrounds’ (PUBG Corporation) in early 2018. Before these two games, there were few successful titles on mobile platforms in the shooter genre. In the table below, we show our estimates for daily and monthly revenues for ‘Fortnite’ using Sensor Tower data. By the end of September 2018, the game had generated cumulative revenues of over USD 300m on iOS alone. The revenues are abnormally high and part of the explanation is the fact that the genre is fairly new. In addition, these titles were previously launched on other platforms (console and PC) where they gained a significant player base, which has helped the mobile version’s discoverability and revenues. Although there have been other entrants in the genre in 2018, the competition in mobile shooters is lower than in match3 or puzzle type games. The market is growing fast and there is scope for different games in the genre.

Company Update Nitro Games 19 December 2018 3
Equity Research
Fortnite’s mobile daily revenue has been USD 0.4-2.5m during the first eight months since its release
Mar-18 Apr-18 May-18 Jun-18 Jul-18 Aug-18 Sep-18 Oct-18 Nov-18 Daily Revenue (USD m.) 0.4 0.5 1.7 1.5 2.0 2.2 2.0 2.5 1.2 Monthly Revenue (USD m.) 6.0 15.0 51.0 45.0 60.0 66.0 60.0 75.0 36.0 Cumulative Revenue (USD m.) 6.0 21.0 72.0 117.0 177.0 243.0 303.0 378.0 414.0 Source: SEB, Sensor Tower
In September 2018, ‘Fortnite’ developer Epic Games stated that the game had a total of 78.3m active monthly players across different platforms. We assume that half of these play on mobile platforms (smartphones and tablets are approximately 50% of the games industry by revenues in 2018 according to Newzoo) and 25% of these players use an Apple phone (representing iOS’ global market share of smart phones). A typical rate of converting a free player to a paying user in mobile games is 3% (see table on page 2). As a result, Fortnite’s iOS MARPPU is USD 204.3, which is considerably more than the average on mobile games, which is closer to USD 40 in western markets.
Fortnite’s monetisation on iOS devices
MAU Mobile MAU iOS MAU iOS MUP iOS MARPPU Fortnite Mobile (iOS) 78.3 39.150 9.8 0.3 204.3 Source: SEB, Epic Games
We do not expect ‘Heroes of Warland’ to perform nearly as well as ‘Fortnite Mobile’. However, we believe it is a good proxy of the potential in the market.
Revenue scenarios for ‘Heroes of Warland’ In our base case scenario (shown in orange in the table on page 4), we assume that ‘Heroes of Warland’ is able to achieve daily active users (DAU) of 80,000 and improve ARPDAU from EUR 0.10 to EUR 0.23 over a period of four years. This would imply daily revenue of EUR 0.01-0.02m, which is low compared with Fortnite’s daily revenue of USD 1.2m in September 2018. We base our assumptions on the performance of peers in the shooter genre as proxies. In addition, Nitro is aiming to achieve top 200 grossing games status for its shooter games, which for a shooter implies daily revenue between EUR 10,000 (EUR 0.9m per quarter) and EUR 20,000 (EUR 1.8m per quarter), based on DAU of 80,000 and ARPDAU of EUR 0.12 and EUR 0.25.
In our bear case scenario (shown in red in the table on page 4), we assume that ‘Heroes of Warland’ is able to achieve daily active users of 40,000, while retaining identical ARPDAU as our base case scenario, i.e. improving from EUR 0.10 to EUR 0.23 over a period of four years.
In our bull case scenario (shown in green in the table on page 4), we assume that ‘Heroes of Warland’ is able to achieve daily active users of 150,000 while retaining identical ARPDAU as our base case scenario, i.e. improving from EUR 0.10 to EUR 0.23 over a period of four years.
In all these scenarios, we have calculated revenues from markets where Nitro has published ‘Heroes of Warland’. In all the scenarios, we expect Netmarble’s published versions of ‘Heroes of Warland’ to receive 20% lower revenues due to a 20% smaller gamer base in the MEA region. Nitro receives 35% of this revenue after game store fees of 30%.
In all these scenarios, we expect Netmarble’s MEA version of the game to monetise with a similar revenue profile, but slightly more effectively due to larger UA budget at its disposal. Nitro receives 35% of the MEA region net revenue after store fees of 30%.

Company Update Nitro Games 19 December 2018 4
Equity Research
Nitro operates in a part of the market with limited competition The scenarios are dependent on the quality of the game, the virality of the game (the degree to which a game’s popularity spreads via word of mouth amongst players), and the effectiveness of user acquisition (UA). Nitro has had the ‘Heroes and Superstars’ TV show to promote ‘Heroes of Warland’. The company has also formed a promotional agreement with Huawei and Samsung Electronics America for the game (the latter of which has agreed to spend USD 0.2-0.5m on game UA. These factors fuel organic user acquisition and virality. According to Nitro’s management, the game has had a good launch, but with limited amount of retention data (the number of gamers returning to play the game in one day, seven days, and 30 days after download), it is too early to assess the effectiveness of monetisation.
‘Heroes of Warland’ scenarios: quarterly revenue (EURm) by ARPDAU (EUR) and DAU (m)
DAU ARPDAU 0.01 0.02 0.04 0.06 0.08 0.1 0.15 0.2 0.3 0.4 0.5 0.6 0.7 0.8 0.9 1 1.1 1.2 1.3 1.4 1.5 0.01 0.0 0.0 0.0 0.1 0.1 0.1 0.1 0.2 0.3 0.4 0.5 0.5 0.6 0.7 0.8 0.9 1.0 1.1 1.2 1.3 1.4 0.02 0.0 0.0 0.1 0.1 0.1 0.2 0.3 0.4 0.5 0.7 0.9 1.1 1.3 1.4 1.6 1.8 2.0 2.2 2.3 2.5 2.7 0.03 0.0 0.1 0.1 0.2 0.2 0.3 0.4 0.5 0.8 1.1 1.4 1.6 1.9 2.2 2.4 2.7 3.0 3.2 3.5 3.8 4.1 0.04 0.0 0.1 0.1 0.2 0.3 0.4 0.5 0.7 1.1 1.4 1.8 2.2 2.5 2.9 3.2 3.6 4.0 4.3 4.7 5.0 5.4 0.05 0.0 0.1 0.2 0.3 0.4 0.5 0.7 0.9 1.4 1.8 2.3 2.7 3.2 3.6 4.1 4.5 5.0 5.4 5.9 6.3 6.8 0.06 0.1 0.1 0.2 0.3 0.4 0.5 0.8 1.1 1.6 2.2 2.7 3.2 3.8 4.3 4.9 5.4 5.9 6.5 7.0 7.6 8.1 0.07 0.1 0.1 0.3 0.4 0.5 0.6 0.9 1.3 1.9 2.5 3.2 3.8 4.4 5.0 5.7 6.3 6.9 7.6 8.2 8.8 9.5 0.08 0.1 0.1 0.3 0.4 0.6 0.7 1.1 1.4 2.2 2.9 3.6 4.3 5.0 5.8 6.5 7.2 7.9 8.6 9.4 10.1 10.8 0.09 0.1 0.2 0.3 0.5 0.6 0.8 1.2 1.6 2.4 3.2 4.1 4.9 5.7 6.5 7.3 8.1 8.9 9.7 10.5 11.3 12.2 0.10 0.1 0.2 0.4 0.5 0.7 0.9 1.4 1.8 2.7 3.6 4.5 5.4 6.3 7.2 8.1 9.0 9.9 10.8 11.7 12.6 13.5 0.11 0.1 0.2 0.4 0.6 0.8 1.0 1.5 2.0 3.0 4.0 5.0 5.9 6.9 7.9 8.9 9.9 10.9 11.9 12.9 13.9 14.9 0.12 0.1 0.2 0.4 0.6 0.9 1.1 1.6 2.2 3.2 4.3 5.4 6.5 7.6 8.6 9.7 10.8 11.9 13.0 14.0 15.1 16.2 0.13 0.1 0.2 0.5 0.7 0.9 1.2 1.8 2.3 3.5 4.7 5.9 7.0 8.2 9.4 10.5 11.7 12.9 14.0 15.2 16.4 17.6 0.14 0.1 0.3 0.5 0.8 1.0 1.3 1.9 2.5 3.8 5.0 6.3 7.6 8.8 10.1 11.3 12.6 13.9 15.1 16.4 17.6 18.9 0.15 0.1 0.3 0.5 0.8 1.1 1.4 2.0 2.7 4.1 5.4 6.8 8.1 9.5 10.8 12.2 13.5 14.9 16.2 17.6 18.9 20.3 0.16 0.1 0.3 0.6 0.9 1.2 1.4 2.2 2.9 4.3 5.8 7.2 8.6 10.1 11.5 13.0 14.4 15.8 17.3 18.7 20.2 21.6 0.17 0.2 0.3 0.6 0.9 1.2 1.5 2.3 3.1 4.6 6.1 7.7 9.2 10.7 12.2 13.8 15.3 16.8 18.4 19.9 21.4 23.0 0.18 0.2 0.3 0.6 1.0 1.3 1.6 2.4 3.2 4.9 6.5 8.1 9.7 11.3 13.0 14.6 16.2 17.8 19.4 21.1 22.7 24.3 0.19 0.2 0.3 0.7 1.0 1.4 1.7 2.6 3.4 5.1 6.8 8.6 10.3 12.0 13.7 15.4 17.1 18.8 20.5 22.2 23.9 25.7 0.20 0.2 0.4 0.7 1.1 1.4 1.8 2.7 3.6 5.4 7.2 9.0 10.8 12.6 14.4 16.2 18.0 19.8 21.6 23.4 25.2 27.0 0.21 0.2 0.4 0.8 1.1 1.5 1.9 2.8 3.8 5.7 7.6 9.5 11.3 13.2 15.1 17.0 18.9 20.8 22.7 24.6 26.5 28.4 0.22 0.2 0.4 0.8 1.2 1.6 2.0 3.0 4.0 5.9 7.9 9.9 11.9 13.9 15.8 17.8 19.8 21.8 23.8 25.7 27.7 29.7 0.23 0.2 0.4 0.8 1.2 1.7 2.1 3.1 4.1 6.2 8.3 10.4 12.4 14.5 16.6 18.6 20.7 22.8 24.8 26.9 29.0 31.1 0.24 0.2 0.4 0.9 1.3 1.7 2.2 3.2 4.3 6.5 8.6 10.8 13.0 15.1 17.3 19.4 21.6 23.8 25.9 28.1 30.2 32.4 0.25 0.2 0.5 0.9 1.4 1.8 2.3 3.4 4.5 6.8 9.0 11.3 13.5 15.8 18.0 20.3 22.5 24.8 27.0 29.3 31.5 33.8 Source: SEB
The shooter genre on mobile is fresh, reflected in low user acquisition costs According to the company, the cost per install (CPI) in the shooter genre for mobile is low. One key explanatory factor is the relatively lower competition (there are few rivals in the genre). This means that even with limited resources, it can spend effectively on paid UA. Over time the competition is likely to increase, increasing the cost of UA. ‘Heroes of Warland’ now has a good window of opportunity to establish its fan base and a critical mass of gamers. The low competition has a significant impact on UA profitability, i.e. ROI. The higher the CPI, the higher the user lifetime value (LTV) needed to support a positive ROI and vice versa. Because shooter games have a low CPI and a user base which is willing to spend relatively high amounts of money, Nitro has an avenue for profitable growth, in our view.
‘Medals of War’ is on a knife’s edge Nitro’s first published game, ‘Medals of War’, is one year old in Western markets and less than half a year old in the MEA region where it was published by Netmarble EMEA. The game has had a slow start. We estimate that for the Western version of the game, DAU was between 14,000 and 30,000 in the first three months after release. According to Nitro, the game ARPDAU ranged from USD 0.07 to USD 0.19 between September 2017 and March 2018.

Company Update Nitro Games 19 December 2018 5
Equity Research
Nitro has improved its analytics and user acquisition methods since the start of the year. In addition, it has learnt from Netmarble’s analytics and UA tools through its collaboration. We estimate that the game has potential to drive some revenues, but we do not assign a significant weight to these in our financial model. In our estimates, ‘Medals of War’ will have approximately 20,000 DAU and ARPDAU of between EUR 0.07 to EUR 0.13. This implies quarterly revenue of between EUR 0.1 to EUR 0.2m in the next two years before declining. The game can make a greater impact on revenues by further expanding the player base and improving the retention. The company needs to find a way to optimise player life time value (LTV), which is in part driven by retention, and cost per install (CPI) for the game. In any case, we believe that the majority of Nitro’s efforts and resources should be directed to capitalise on the early success of ‘Heroes of Warland’, meaning that ‘Medals of War’ will remain a steady compounder.
New game pipeline Nitro has not revealed its plans for new game releases. In our view, the company will focus its efforts in 2019 to optimise the performance of ‘Heroes of Warland’. We expect one new launch in 2020 and one in 2021. In our model we assume that these games generate revenue of similar scale to ‘Medals of war’, i.e. EUR 0.15m to EUR 0.23m per quarter.
Asia option Netmarble has the first right of refusal to launch ‘Medals of War’ in Asia and ‘Heroes of Warland’ has been published in parts of Asia, but no deal has been made for China yet (where game companies in practice need a local partner). We do not include this optionality in our model. However, if these games’ KPIs reach a similar level to Netmarble’s internal thresholds, launch in Asia is highly likely. The largest upside potential comes from launching the games in China, which is the largest and fastest growing games market. However, due to government restructuring in China, the local authorities have not issued licences required to launch games in the country since March 2018. Therefore, the Asian launches for Nitro’s games are essentially a free option at this point. If they occur it is a positive, but the investment case does not rest on this possibility. As shown in the charts below, the Asia-Pacific region and in particular China are the leading areas of growth in the games industry. When China decides to continue issuing licences for games, there is a long list of developers waiting to exploit that opportunity.
Games market growth by region, 2017 to 2021
Source: SEB, Newzoo
26.4 28.7 30.3 31.5 32.64.4 5.0 5.5 6.0 6.5
29.7 32.7 35.2 37.3 39.3
61.171.4
81.090.8
101.2
0.0
20.0
40.0
60.0
80.0
100.0
120.0
140.0
160.0
180.0
200.0
2017 2018E 2019E 2020E 2021E
EMEA Latin America North America Asia-Pacific
Company Update Nitro Games 19 December 2018 6
Equity Research
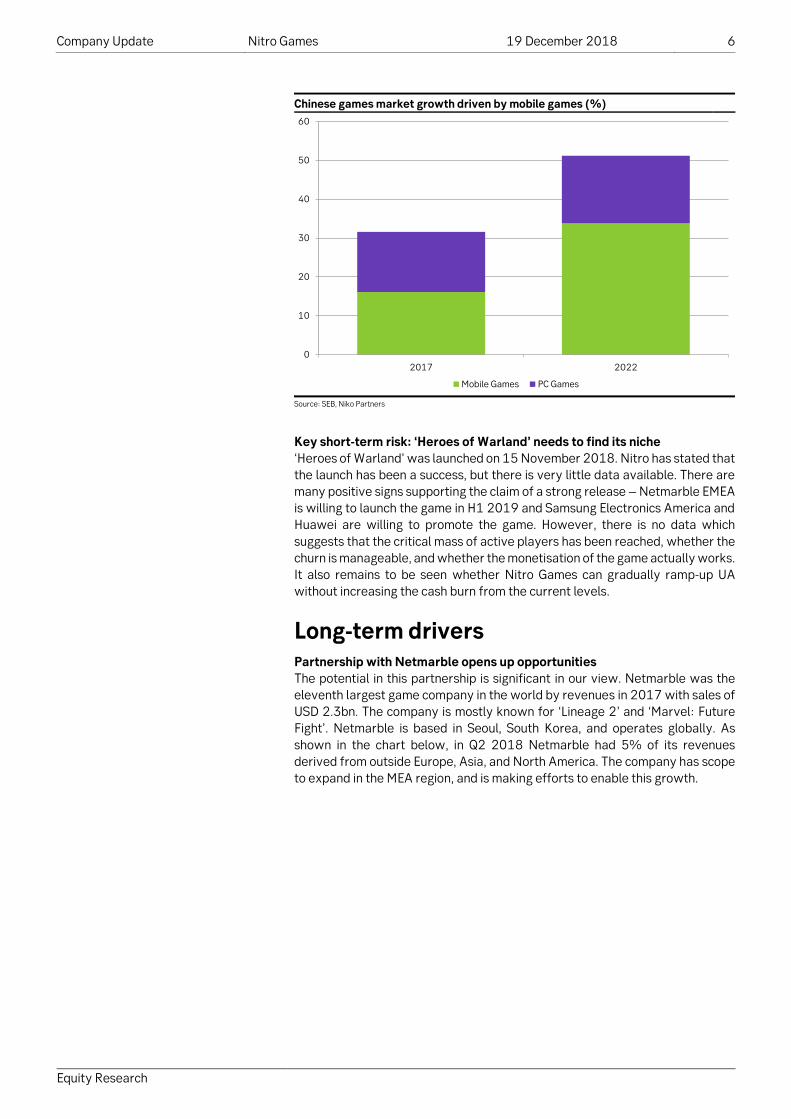
Chinese games market growth driven by mobile games (%)
Source: SEB, Niko Partners
Key short-term risk: ‘Heroes of Warland’ needs to find its niche ‘Heroes of Warland’ was launched on 15 November 2018. Nitro has stated that the launch has been a success, but there is very little data available. There are many positive signs supporting the claim of a strong release – Netmarble EMEA is willing to launch the game in H1 2019 and Samsung Electronics America and Huawei are willing to promote the game. However, there is no data which suggests that the critical mass of active players has been reached, whether the churn is manageable, and whether the monetisation of the game actually works. It also remains to be seen whether Nitro Games can gradually ramp-up UA without increasing the cash burn from the current levels.
Long-term drivers Partnership with Netmarble opens up opportunities The potential in this partnership is significant in our view. Netmarble was the eleventh largest game company in the world by revenues in 2017 with sales of USD 2.3bn. The company is mostly known for ‘Lineage 2’ and ‘Marvel: Future Fight’. Netmarble is based in Seoul, South Korea, and operates globally. As shown in the chart below, in Q2 2018 Netmarble had 5% of its revenues derived from outside Europe, Asia, and North America. The company has scope to expand in the MEA region, and is making efforts to enable this growth.
0
10
20
30
40
50
60
2017 2022
Mobile Games PC Games

Company Update Nitro Games 19 December 2018 7
Equity Research
Netmarble’s revenues by region in Q2 2018
Source: SEB
The MEA region gamer base is 80% the size of North America and Western Europe combined. In 2018 the region is expected to outpace growth in all other regions and the fast rate is expected to continue according to Newzoo estimates. This makes the region attractive for games developers. The challenge is that there are steep cultural differences making it crucial to localise games. Furthermore, UA and marketing has to be tailored to local markets. This is where a small game company such as Nitro can benefit from cooperation with a larger, established company such as Netmarble.
The games industry in MEA is growing fast and has a deep gamer base
2018E Revenues (USD bn.) Y-o-Y Growth Population (m.) Online Population (m.) Gamers (m.) North America 32.7 10.0% 363.7 298.9 199.9 Latin America 5.0 13.5% 650.6 411.3 234.1 Western Europe 20.0 5.6% 408.9 357.5 207.0 Eastern Europe 3.9 9.1% 353.0 265.0 147.1 MEA 4.9 23.6% 1716.2 601.4 330.7 APAC 71.4 16.8% 4098.0 1944.4 1234.2 Source: SEB, Newzoo
Nitro and Netmarble EMEA launched a localised version of ‘Medals of War’ in the MEA region in July 2018. In October 2018 the two companies agreed to publish ‘Heroes of Warland’ in the MEA region in H1 2019. For ‘Medals of War’, Netmarble Asia has the right of first refusal for Asia including China. Netmarble has internal game KPI thresholds which Nitro’s games need to surpass in order to be published in Asia. Success in this would imply strong revenue potential.
Even with access to the MEA region through only Netmarble EMEA, the partnership significantly expands Nitro’s addressable market. Netmarble EMEA guides Nitro to localise its games and performs marketing and pays for UA.
Work-for-hire – a source for low risk cash flow Nitro acts as a subcontractor for larger companies who choose to outsource certain game projects or parts of game projects to external companies. These projects have a fixed fee and typically last from one year to several years, depending on the nature of the contract and the game. There are three key advantages to these projects. First, Nitro receives revenues with little risk for the company. Second, Nitro is able to expand its developer team financed by the project payments, thus increasing brain capacity in the company. Third, these projects add reusable software modules for the NG Platform.
North America32%
South-Korea29%
Japan14%
Southeast Asia11%
Europe9%
Others5%

Company Update Nitro Games 19 December 2018 8
Equity Research
Although we appreciate the visibility of these projects, they tie up resources and have much lower gross margin and scalability than the company’s publishing business. We expect less work-for-hire and more games from Nitro.
NG Platform allows fast prototyping and rapid delivery The NG Platform is a database of game modules. These modules can be used to create game prototypes in an agile manner. Games are run on Nitro’s cloud servers, allowing the company to gather large amounts of data from its players. Nitro’s MVP Process utilises the technology modules and data analytics to enable fast transition from a game concept to a working prototype. Based on strong technical processes, the company can achieve a faster time to market than the average one to two years in the mobile game industry on average. This is particularly helpful in bidding for work-for-hire projects and has helped Nitro finish ahead of rivals in the past.
A small fish in a large pond Nitro can find its own niche in a large and fast growing industry. Not all game companies have to be the next Activision Blizzard, EA, or Ubisoft. The market is large enough and grows fast enough to support companies with different styles and sizes. Being a small company, Nitro can be nimble in idea generation and agile in prototyping. The company has demonstrated willingness to adapt its games to local tastes. Nitro’s management states that the company is willing to take risk in new game development, meaning that it can try something new and different, which is often not the case with larger companies. These qualities are appreciated by large peers, who continuously seek games to publish.
Ability to build up data analytics and knowhow from partners Large companies have sophisticated models to process ‘Big Data’ and the ability to optimise UA and live ops. The resources of small companies are more constrained. In fact, there is a chronic lack of skilled data analytics in the market, making them expensive and difficult to acquire. Nitro and its partners share data analytics for their common game projects. They combine resources to tweak and target user acquisition. This allows Nitro to build-up its knowledge and capacity in data analytics far better than it could if it acted alone. These lessons can then be used for user acquisition in games that the company publishes in Western markets, as well as future projects.
Nimble development and partnerships could drive future growth Nitro has demonstrated an ability to publish its own games and the ability to act as a reliable work-for-hire partner. The company has been able to establish major partnerships with publishers (e.g. Netmarble) and handset manufacturers/app store providers (Samsung, Huawei). Over the long-term, the key goal is the ability to keep new/current game development, user acquisition, analytics, and subcontracting in a balance so that profitable growth is enabled. Nitro has performed three directed share issues after its IPO. We want to see growth through several games/projects financed by cash flow. In practise this requires tight cost control and the ability to scale up the existing games, while taking care of new game pipeline. According to the company, the ideal amount over the short to medium-term would be to have two to three commercially viable games. This would diversify revenue streams without increasing the cost burden too much.
Key long-term risk: achieving critical mass of game & gamers and solid KPIs Nitro’s key challenge over the long-term is to keep producing popular games to support the growth of the company. Nitro does not yet have a bedrock of existing franchises it can leverage. It is crucial that it is able to develop a game portfolio with preferably several publishing partners. If it is not able to increase the size of the game portfolio and scale up the individual games to turn the company into profit, there is a risk that investors will grow impatient.

Company Update Nitro Games 19 December 2018 9
Equity Research
We value Nitro’s Netmarble cooperation. In our opinion it holds the most favourable risk/reward. If managed correctly, we believe there are strong benefits in fostering the relationship for several years to come. However, if something was to happen and the two companies were to separate ways, a lot of the upside potential would be taken away from the investment case. In any case, based on our discussions with Netmarble EMEA’s CEO, we are confident with the continuation of the partnership for now.
Financial forecasts Sales We expect Nitro’s sales to increase by 97% in 2019 on the back of the company publishing ‘Heroes of Warland’ in November 2018 and Netmarble EMEA publishing the game in the MEA region in H1 2018. We expect the game to keep growing for the next four years, but factor in no blue sky scenario. We expect Nitro to outpace revenue growth in the smartphone/tablet game market. We expect the company’s CAGR of 20.5% between 2020 and 2027 vs. Newzoo estimate of the mobile market CAGR of 17.4% between 2017 and 2021. We factor in decreasing rate of growth from 45% in 2020 to 14% in 2027 for Nitro. However, in a hit driven industry such as gaming, these growth figures are merely indicative.
Profitability Nitro was loss making in 2017 and we expect cash burn to continue until the end of 2018. ‘Heroes of Warland’ was released in November and it is typical that in the first few weeks of a launch UA is ramped up so that players find the game. We expect clean EBIT of a loss of EUR 4.3 m for 2018. In our probability weighted scenario estimates for 2019 and 2020, clean EBIT will be negative EUR 2.4m and negative EUR 1.2m, respectively, meaning that cash burn declines, but does not stop completely. This estimate is heavily dependent on the reception of ‘Heroes of Warland’. If UA works well and CPI is low, the company could achieve profitability faster than we expect.
Income Statement
(EURm) Q4/17 Q1/18 Q2(18 Q3/18 Q4/18E 2017 2018E 2019E 2020E 2021E 2022E Revenues 0.5 0.6 0.5 0.7 0.9 1.7 2.7 5.4 7.8 10.0 11.2 Total expenses 2.0 1.5 1.7 1.6 1.6 4.3 6.4 7.2 8.4 9.6 10.2 Change in finished goods and work in process 0.6 0.0 0.0 0.0 0.0 0.6 0.0 0.0 0.0 0.0 0.0 Materials and Services 0.3 0.3 0.3 0.4 0.4 0.7 1.4 2.3 2.9 3.5 3.8 Personnel Expenses 0.5 0.5 0.6 0.5 0.5 1.3 2.2 2.2 2.4 2.5 2.7 Other Operating Costs 0.6 0.7 0.8 0.7 0.7 1.7 2.9 2.7 3.1 3.6 3.8 EBITDA -1.5 -1.0 -1.2 -0.8 -0.7 -2.5 -3.7 -1.7 -0.5 0.5 1.1 EBITDA (%) -282.6% -167.0% -250.7% -111.6% -74.3% -145.0% -135.1% -32.4% -7.0% 5.4% 9.9% D&A 0.2 0.2 0.2 0.2 0.2 0.7 0.6 0.6 0.6 0.6 0.6 EBIT -1.6 -1.1 -1.4 -1.0 -0.8 -3.2 -4.3 -2.4 -1.2 -0.1 0.5 EBIT (%) -312.9% -194.4% -283.2% -132.7% -91.3% -184.1% -158.2% -44.3% -15.2% -0.9% 4.2% Pre-tax profit -1.7 -1.1 -1.4 -1.0 -0.8 -3.3 -4.3 -2.4 -1.2 -0.1 0.5 Net profit -1.7 -1.1 -1.4 -1.0 -0.8 -3.3 -4.3 -2.4 -1.2 -0.1 0.4 Source: SEB
Balance sheet At the end of 2018 we expect Nitro’s short-term and long-term interest bearing debt of EUR 0.1m and EUR 0.23m, respectively. We estimate cash of around EUR 4m. Therefore, the balance sheet is in reasonable condition after the previous directed share issue which took place in October 2018. However, cash burn cannot increase. We expect the company to remain in loss for 2019 (clean EBIT of negative EUR 2.4m) and 2020 (clean EBIT of negative EUR 1.2m), but we expect profitability to gradually improve in our scenario based analysis. The company performed directed share issues in 2018 and 2017 and additional share issues cannot be ruled out. However, this depends greatly on the success of ‘Heroes of Warland’ and the effectiveness of games monetisation and the price of its UA. Over the long-term we assume EBITDA and EBIT margins to increase to 21% and 13%, respectively (i.e. close to peer averages).

Company Update Nitro Games 19 December 2018 10
Equity Research
Valuation We initiate coverage with a target price of SEK 88.6 and Buy rating Our target price of SEK 88.6 is based on DCF valuation (using EUR/SEK rate as of 18 Dec). Our model assumes sales growth of 45% in 2020, 30% in 2021, and 24% in 2022. After this we assume that the growth rate will gradually decline to 14% in 2027. There is little visibility in long-term revenue growth of such a small young company. The smart phone game market is estimated to increase at a CAGR of 16% between 2018 and 2021 according to Newzoo. As elaborated above, Nitro starts off from a low base of sales and has a strong partner network to support its growth, making our targets achievable in our view.
In our model, company profitability improves gradually. Cash burn is reduced significantly in 2019/2020 before breaking even in 2021/2022. Break-even is possible earlier, but is dependent on a) success of the company’s recently launched games in the Western markets, b) Netmarble’s efforts in achieving critical mass of gamers onto Nitro’s games it has published, and c) the choice between balancing revenue growth vs. profitability by Nitro’s management when driving user acquisition investments.
DCF Summary
DCF valuation (EURm) Weighted average cost of capital (%) NPV of FCF in explicit forecast period 0 Risk free interest rate 2.5 NPV of continuing value 27 Risk premium 4.0 Value of operation 27 Cost of equity 6.5
Net debt (4) After tax cost of debt 2.0 Share issue/buy-back in forecast period - Value of associated companies - WACC 6.5 Value of minority shareholders' equity - Value of marketable assets - Assumptions DCF value of equity 31 Number of forecast years 10 DCF value per share (EUR) 8.6 EBIT margin - steady state (%) 12.8 Current share price (EUR) 3.80 EBIT multiple - steady state (x) 12.6 DCF performance potential (%) 127 Continuing value (% of NPV) 99.2 Source: SEB
DCF Sensitivity
Cost of equity 5.5 6.0 6.5 7.0 7.5 80 14 13 12 11 10 Equity capital 90 12 11 10 9 8 weight (%) 100 11 10 9 8 7 100 11 10 9 8 7 100 11 10 9 8 7 Absolute change in EBITDA margin - all years -2% -1% 0 +1% +2% -2% 6 7 8 8 9 Abs. change in -1% 7 7 8 9 10 sales growth - 0 7 8 9 9 10 all years +1% 7 8 9 10 11 +2% 8 9 10 11 11 Source: SEB

Company Update Nitro Games 19 December 2018 11
Equity Research
DCF Assumptions
Average Average Average (EURm) 2018E 2019E 2020E 2021E 2022E year 6 year 7-8 year 9-10
Sales growth (%) 58.6 97.7 45.4 30.0 24.0 22.0 19.0 15.0 EBITDA margin (%) (135.1) (32.4) (7.0) 3.0 6.0 9.0 13.5 19.5 EBIT margin (%) (158.2) (44.3) (15.2) (5.2) (2.2) 0.8 5.3 11.3 Gross capital expenditures as % of sales 25.7 13.0 9.0 9.0 9.0 9.0 9.0 9.0 Working capital as % of sales (0.9) (0.5) (0.3) (0.3) (0.3) (0.3) (0.3) (0.3)
Sales 3 5 8 10 13 15 20 27 Depreciation (1) (1) (1) (1) (1) (1) (2) (2) Intangibles amortisation 0 0 0 0 0 0 0 0 EBIT (4) (2) (1) (1) (0) 0 1 3 Taxes on EBIT 1 0 0 0 0 (0) (0) (1) Increase in deferred taxes 0 0 0 0 0 0 0 0 NOPLAT (3) (2) (1) (0) (0) 0 1 2
Gross capital expenditure (1) (1) (1) (1) (1) (1) (2) (2) Increase in working capital 0 0 0 0 0 0 0 0 Free cash flow (3) (2) (1) (0) (0) (0) 1 2
ROIC (%) (64.6) (64.6) (53.9) (23.0) (11.5) 4.9 38.6 94.1 ROIC-WACC (%) (71.1) (71.1) (60.4) (29.5) (18.0) (1.6) 32.1 87.6 Share of total net present value (%) 0.0 (7.0) (3.4) (1.5) (0.9) (0.0) 3.6 10.0 Source: SEB
Peer group valuation Nitro is a young company at an early phase of its self-publishing strategy. This means that it has significant growth potential, but low earnings visibility. Using our estimates, Nitro is currently trading at EV/Sales (2019) of 2.3x. This is considerably higher than e.g. Rovio or G5 Entertainment, who both trade at 0.6x, but much less than Glu Mobile or large cap peers. In order to justify its current valuation, the company needs to deliver on sales growth. We believe this is likely given the strong start of ‘Heroes of Warland’ and the pending launch in the MEA region published by Netmarble.
Peer group valuation
Price Mkt Cap PER(x) EV/Sales Exp. Sales Growth (%) ccy (lcl ccy) (USDm) 2018E 2019E 2020E 2018E 2019E 2020E 2018E 2019E 2020E
NETMARBLE CORP KRW 108500 8191.7 39.0 22.7 20.3 3.4 2.6 2.3 -13.7% 29.1% 7.0% TENCENT HOLDINGS LTD CNY 302.8 368641.0 36.1 30.3 24.0 8.0 6.1 4.7 31.8% 29.5% 26.2% ACTIVISION BLIZZARD INC USD 47.08 35924.4 18.1 17.0 15.0 4.5 4.1 3.5 6.3% 2.9% 8.6% ROVIO ENTERTAINMENT OY EUR 4.269 385.6 13.6 10.2 7.5 0.8 0.7 0.6 -3.8% 6.3% 6.0% G5 ENTERTAINMENT AB SEK 138.9 138.0 9.0 7.3 6.6 0.7 0.6 0.5 34.2% 15.0% 6.1% NEXT GAMES OY EUR 1.21 25.5 n.m. n.m. n.m. 0.4 0.4 0.3 10.9% 98.9% 38.7% ZYNGA INC - CL A USD 3.7 3189.0 22.3 22.6 17.2 3.0 2.5 2.0 5.5% 16.4% 10.7% GLU MOBILE INC USD 7.71 1104.4 28.6 22.7 15.1 n.a. n.a. n.a. 29.8% 16.8% 15.8%
Nitro Games SEK 38.6 15.4 n.m. n.m. n.m. 3.7 2.3 1.8 58.6% 97.7% 45.4%
Average 23.8 19.0 15.1 3.0 2.4 2.0 12.6% 26.8% 14.9% Median 22.3 22.6 15.1 3.0 2.5 2.0 8.6% 16.6% 9.6%
EV/EBITDA EV/EBIT EBIT margin (%) Share price performance (%) 2018E 2019E 2020E 2018E 2019E 2020E 2018E 2019E 2020E 1M 3M 12M
NETMARBLE CORP 20.4 11.0 9.4 26.0 13.1 11.4 13.2% 19.5% 19.9% -11.8 -2.3 -42.9 TENCENT HOLDINGS LTD 21.2 18.0 14.1 25.2 21.8 16.9 31.8% 28.0% 28.0% 4.0 -4.8 -23.0 ACTIVISION BLIZZARD INC 12.5 10.9 9.0 13.2 11.9 9.5 34.2% 34.6% 37.2% -4.2 -40.9 -28.3 ROVIO ENTERTAINMENT OY 4.8 3.8 2.7 7.2 4.6 2.9 11.0% 14.3% 18.7% -14.6 -10.1 -54.8 G5 ENTERTAINMENT AB 4.2 3.4 2.7 7.2 5.6 4.1 9.7% 10.4% 11.9% -11.7 -54.3 -53.9 NEXT GAMES OY n.m. n.m. 17.5 n.m. n.m. 68.4 n.m. n.m. 0.4% -21.4 -69.8 -86.1 ZYNGA INC - CL A 15.0 13.3 10.1 16.0 14.8 9.9 19.0% 16.8% 20.7% 7.6 -8.0 -8.9 GLU MOBILE INC n.a. n.a. n.a. n.a. n.a. n.a. 9.8% 11.5% n.m. 12.4 1.6 89.9
Nitro Games n.m. n.m. n.m. n.m. n.m. n.m. n.m. n.m. n.m. -29.8 -25.8 -21.4
Average 13.0 10.1 9.3 15.8 12.0 17.6 18.4% 19.3% 19.5% -5.0 -23.6 -26.0 Median 13.8 11.0 9.4 14.6 12.5 9.9 13.2% 16.8% 19.9% -7.9 -9.0 -35.6 Source: SEB

Company Update Nitro Games 19 December 2018 12
Equity Research
Company profile From work-for-hire… Nitro Games (Nitro) was founded in 2007 initially as part of a digital media studio called Nitro FX. Antti Villanen and Jussi Tähtinen are co-founders of the company. Nitro was spun off in 2009. Nitro is headquartered in Kotka, Finland, and has another office in Helsinki. Initially, Nitro focused mainly on work-for-hire and other development projects on PC where game publishers paid royalty payments depending on the success of the game. In 2013 Nitro started to develop its first mobile game and began developing its NG Platform to support future mobile launches.
…to publishing In 2017 the company changed its strategy. The new strategy has three dimensions:
● Steady cash flow from work-for-hire projects.
● Publish its own games titles in western markets.
● Partner with large publishers in the rest of the world to launch games localised to regional requirements.
Work-for-hire projects include a fixed fee which is recognised as revenue based on milestones. Typically the publisher receives all revenues and pays all costs associated with marketing the game, although there may be a small revenue share element after project costs for the developer. When publishing games in western markets, Nitro keeps all revenue, but also carries all of the marketing and user acquisition costs. In non-western markets Nitro applies a revenue share model with the publisher partner. The partner performs the majority of the marketing and UA costs and pays for the localisation costs.
Management & Ownership Jussi Tähtinen – CEO, 71 535 shares
Matti Nikkola – CFO, 172 594 shares
Samppa Rönkä – CTO, 10 002 shares
Antti Villanen – Chairman of Board, 129 254 shares
Competitive advantages and sustainability of market position Below is our assessment of the company’s fundamental profile. Porter’s Five describes the industry dynamics and how the company has specifically positioned itself in the market. Quality Profile describes perceived company quality on product and management level. In additional, it highlights financial risk and the degree of visibility into future revenues and earnings. In the SWOT analysis we have highlighted key considerations for the company when it comes to sustainability of competitive advantages and market position.

Company Update Nitro Games 19 December 2018 13
Equity Research
Porter’s Five Forces Porter’s Five
low mid high Industry Competition x Threat of New Entrants x Supplier Power x Customer Power x Threat of Substitutes x Source: SEB
Quality Profile
low mid high Uniqueness of Product x Management Quality x Structure of Growth X Earnings Visibility x Balance Sheet Strength x Source: SEB
Strengths ● Partnership with Netmarble.
● Proven ability to successfully launch games,
● Entrepreneurial management involved with day to day business,
● Strong experience in work-for-hire projects, - Ability to use influencer marketing to generate organic UA
● Collaborative corporate culture
Weaknesses ● Profitability is currently low,
● Future growth relies partly on new releases, - Low resources to spend on paid UA
Opportunities ● Achieving virality with Heroes of Warland,
● Potential to learn from partners’ analytics and UA methods,
● Netmarble co-operation opens Asian markets,
● Small successes are big for such a small firm,
Threats ● Incontrollable growth could hamper future projects,
● Netmarble co-operation failure,
● Equity owners growing impatient with poor profitability,
● Inability to secure new work-for-hire projects would decrease earnings visibility,
● Running out of cash
● Loss of key employees / inability to hire new ones due to “remote location” or lack of resources

Company Update Nitro Games 19 December 2018 14
Equity Research
Games portfolio Medals of War (Western version) ● Owned by Nitro and the first mobile game to be published by the company.
● Released for iOS on 19f September 2017 and for Android on 21 March 2018.
● The user score in the Apple App Store is 4.7/5, while in the Google Play store the user score is 4.5/5.
Medals of War (Eastern version) ● In accordance with Nitro’s strategy of publishing games with partners in
non-western markets, the company partnered with Netmarble EMEA to launch the game in the MEA region.
● Nitro receives 35% and Netmarble EMEA 65% of net revenue after app store fees (30% of gross revenue).
● The game was released for iOS and Android on 5 July 2018.
Heroes of Warland (Western version) ● A competitive multiplayer game for mobile. It is a class based shooter game,
where a five player team is pitted against another team.
● Owned by Nitro.
● Released for iOS and Android on 15 November 2018. The game was launched globally, except for the MEA region, China, Macau, Hong Kong, and Taiwan.
● The user score in the Apple App Store is 4.0/5, while in the Google Play store the user score is 3.9/5.
Current game development pipeline In November 2018 Nitro had two new games in production. One of the projects is a typical work-for-hire case, while the other is Nitro’s own IP.
Heroes of Warland MEA ● Nitro and Netmarble EMEA signed a term sheet in October 2018 to launch
the game in the Middle-East and Africa in H1 2019. Netmarble will cover the marketing and UA costs in the region, while Nitro carries the responsibility of localising the game according to Netmarble’s guidance.
● Nitro receives 35% and Netmarble EMEA 65% of net revenue after app store fees (30% of gross revenue).
● Nitro owns the IP rights for Heroes of Warland.
● Stage of development: Western version launched on 15 November 2018. MEA version being localised.
● Expected launch: MEA version in H1 2019.

Company Update Nitro Games 19 December 2018 15
Equity Research
Runegate Heroes ● Runegate Heroes is a competitive multiplayer game for mobile. It combines
elements from tower defence, strategy game, and role playing games into a multiplayer battle game.
● Nitro develops the game as a work-for-hire project for Wargaming, a company most famous for ‘World of Tanks’.
● Wargaming owns the IP and Nitro develops the game further for project revenues. There is a small revenue share element once project costs have been covered by game revenues.
● Stage of development: Game is in soft launch and development nearly complete. Further development contract being negotiated.
● Expected launch: 2019

Company Update Nitro Games 19 December 2018 16
Equity Research
Overview Investment case
We expect Nitro Games's recent launch ‘Heroes of Warland’ to drive significant revenue pickup in the short-term. Nitro Games has been able to form promotion co-operation for the game with Samsung Electronics America and Huawei. They have promoted the game through a TV series and they have Netmarble EMEA to publish and promote it in the MEA region. Over the long-term we expect Nitro Games to perform more self-publishing and less work-for-hire, which should drive up profitability and scalable growth.
Company profile
Nitro Games is a free-to-play mobile game developer based in Kotka, Finland. Nitro Games has a long history as a work-for-hire partner, but since 2017 has focused on self-publishing. The company has self-published two games, ‘Medals of War’ in September 2017 and ‘Heroes of Warland’ in November 2018. The company’s strategy is to self-publish games in western markets and partner with large companies is Eastern markets. Thus far Netmarble EMEA has published ‘Medals of War’ in the MEA region and will publish ‘Heroes of Warland’ in H1 2019.
Valuation approach
Our target price is based on DCF. Our model assumes that Nitro Games grows faster than the market over the coming years, reducing cash burn and a breakeven result in approximately 2021.
Target price risks A key short-term risk is that despite signs of a successful launch of ‘Heroes of
Warland’, there may be little evidence that it will be a commercially viable game. If this is the case, the company’s growth and profitability would suffer and more directed share issues would be needed. Over the long-term, Nitro Games needs to continue with partnerships. It is challenging for a small company to have its games discovered by gamers without the help of larger peers.
Segment growth 2017 to 2021 Games market by region 2018
Source: SEB, Newzoo Source: SEB, Newzoo
43.856.5
66.878.0
88.212.2
13.815.2
16.618.0
32.9
34.5
36.536.5
39.6
28.0
29.0
30.4
31.5
32.4
4.9
4.1
3.0
3.3
1.8
0.0
20.0
40.0
60.0
80.0
100.0
120.0
140.0
160.0
180.0
200.0
2017 2018E 2019E 2020E 2021E
Smart Phone Tablet Console PC Browser PC
EMEA21%
Latin America3%
North America24%
Asia-Pacific52%

Company Update Nitro Games 19 December 2018 17
Equity Research
PER - 12 month forward P/BV - 12 month forward
Source: SEB Source: SEB
EV/Sales - 12 month forward EV/EBITA - 12 month forward
Source: SEB Source: SEB
Net sales & EBITDA margin EBIT & Operating margin
Source: SEB Source: SEB
Comparison with sector index - 1 year Comparison with Rovio - 1 year
Source: SIX Source: SIX
(200.0)
(180.0)
(160.0)
(140.0)
(120.0)
(100.0)
(80.0)
(60.0)
(40.0)
(20.0)
0
1
2
3
4
5
6
7
2017 2018E 2019E 2020E
(%)
(EU
Rm
)
Net sales EBITDA margin
0
200
400
600
800
1,000
1,200
2017 2018 2019
(%)
P/BV - 12 month forward
(184.5)
(134.5)
(84.5)
(34.5)
(5)
(4)
(4)
(3)
(3)
(2)
2017 2018E 2019E 2020E
(%)
(EU
Rm
)
EBIT Operating margin
0.0
0.2
0.4
0.6
0.8
1.0
1.2
2017 2018 2019
(x)
PER - 12 month forward
0.0
0.2
0.4
0.6
0.8
1.0
1.2
2017 2018 2019
(x)
EV/EBITA - 12 month forward
0.0
1.0
2.0
3.0
4.0
5.0
6.0
7.0
2017 2018 2019
(x)
EV/Sales - 12 month forward
30
35
40
45
50
55
60
65
70
75
80
Dec 17 Mar 18 Jun 18 Aug 18 Nov 18
Nitro Games Rel Nordic IT/Technology
30
50
70
90
110
130
150
Dec 17 Mar 18 Jun 18 Aug 18 Nov 18
Nitro Games Rel Rovio

Company Update Nitro Games 19 December 2018 18
Equity Research
Profit & loss statement - Nitro Games(EURm) 2017 2018E 2019E 2020ENet Sales 2 3 5 8Other revenues 0 0 0 0Total revenues 2 3 5 8
Total expenses (4) (6) (7) (8)Profit before depreciation (2) (4) (2) (1)
Depreciation - Fixed assets (1) (1) (1) (1)Depreciation - Other assets 0 0 0 0Amortisation - Goodwill 0 0 0 0Amortisation - Other intangibles 0 0 0 0Operating profit (3) (4) (2) (1)
Net interest expenses (0) 0 0 0Foreign exchange items 0 0 0 0Other financial items 0 0 0 0Value changes - Fixed assets 0 0 0 0Value changes - Financial assets 0 0 0 0Value changes - Other assets 0 0 0 0Reported pre-tax profit (3) (4) (2) (1)
Minority interests 0 0 0 0Total taxes 0 0 0 0Reported profit after tax (3) (4) (2) (1)
Discontinued operations 0 0 0 0Extraordinary items 0 0 0 0Net Profit (3) (4) (2) (1)
Adjustments:Discontinued operations 0 0 0 0Interest on convertible debt 0 0 0 0Minority interests (IFRS) 0 0 0 0Value changes 0 0 0 0Goodwill/intangibles amortisations 0 0 0 0Restructuring charges 0 0 0 0Other adjustments 0 0 0 0Tax effect of adjustments 0 0 0 0Adjusted profit after tax (3) (4) (2) (1)
Margins, tax & returnsOperating margin n.m. n.m. (44.3) (15.2)Pre-tax margin n.m. n.m. (44.3) (15.2)Tax rate 0.0 0.0 0.0 0.0ROE n.m. n.m. (62.5) (58.7)ROCE n.m. (96.6) (57.5) (50.4)
Growth rates y-o-y (%)Total revenues n.a. 54.1 97.0 44.9Operating profit n.m. n.m. n.m. n.m.Pre-tax profit n.m. n.m. n.m. n.m.EPS (adjusted) 0.0 0.0 0.0 0.0
Cash flow(EURm) 2017 2018E 2019E 2020ENet profit (3) (4) (2) (1)Non-cash adjustments 1 1 1 1Cash flow before work cap (3) (4) (2) (1)
Ch. in working capital / Other (0) 0 0 0Operating cash flow (3) (4) (2) (1)
Capital expenditures 0 (1) (1) (1)Asset disposals 0 0 0 0L/T financial investments 0 0 0 0Acquisitions / adjustments 0 0 0 0Free cash flow (3) (4) (2) (1)
Net loan proceeds 0 0 0 0Dividend paid 0 0 0 0Share issue 0 6 0 0Other 0 0 0 0Net change in cash (3) 2 (2) (1)
AdjustmentsC/flow bef chng in work cap (3) (4) (2) (1)Adjustments 0 0 0 0Int on conv debt net of tax 0 0 0 0Cash earnings (3) (4) (2) (1)
Per share informationCash earnings (1.53) (1.33) (0.48) (0.15)Operating cash flow (1.69) (1.29) (0.48) (0.15)Free cash flow (1.69) (1.54) (0.68) (0.35)
Investment coverCapex/sales (%) 0.0 25.7 13.0 9.0Capex/depreciation (%) 0 112 109 109
Source for all data on this page: SEB

Company Update Nitro Games 19 December 2018 19
Equity Research
Balance sheet - Nitro Games(EURm) 2017 2018E 2019E 2020ECash and liquid assets 2 4 2 0Debtors 0 0 0 0Inventories 0 0 0 0Other 0 0 0 0Current assets 3 4 2 0
Interest bearing fixed assets 0 0 0 0Other financial assets 0 0 0 0Capitalized development cost 2 2 2 2Goodwill 0 0 0 0Other intangibles 0 0 0 0Fixed tangible assets 0 0 0 0Other fixed assets 0 0 0 0Fixed assets 2 2 2 2
Total assets 4 6 3 2
Creditors 0 0 0 0Other trade financing 0 0 0 0S/T interest bearing debt 0 0 0 0Other 0 0 0 0Current liabilities 0 0 0 0
L/T interest bearing debt 0 0 0 0Other long-term liabilities 0 0 0 0Convertible debt 0 0 0 0Pension provisions 0 0 0 0Other provisions 0 0 0 0Deferred tax 0 0 0 0Long term liabilities 1 1 1 1
Minority interests 0 0 0 0
Shareholders' equity 3 5 3 1
Total liabilities and equity 4 6 3 2
Net debt (m) (2) (4) (1) (0)Working capital (m) 0 (0) (0) (0)Capital employed (m) 4 5 3 2Net debt/equity (%) (63) (77) (53) (11)Net debt/EBITDA (x) 0.8 1.0 0.8 0.3Equity/total assets (%) 76 86 77 64Interest cover (17.4) 0.0 0.0 0.0
Valuation(EUR) 2017 2018E 2019E 2020E
No of shares, fully dil. (y/e) 2.3 3.6 3.6 3.6No of shares, fully dil. avg. 1.7 2.8 3.6 3.6
Share price, y/e 57.5 40.1 40.1 40.1Share price, high 67.8 78.8Share price, low 33.6 37.4Share price, avg 44.7 55.9
EPS (reported) (1.91) (1.56) (0.66) (0.33)EPS (adjusted) (1.91) (1.56) (0.66) (0.33)Cash earnings/share (1.53) (1.33) (0.48) (0.15)Dividend/share 0.00 0.00 0.00 0.00
Enterprise value/share 5.0 2.8 3.5 3.9Book value/share 1.4 1.4 0.7 0.4Adjusted equity/share 1.4 1.4 0.7 0.4
PER (adjusted) n.m. n.m. n.m. n.m.CEM (3.8) (2.9) (8.1) (25.7)Dividend yield 0.0 0.0 0.0 0.0
EV/EBITDA (4.7) (2.8) (7.3) (25.4)EV/EBITA (3.7) (2.4) (5.3) (11.7)EV/EBIT (3.7) (2.4) (5.3) (11.7)EV/Sales (x) 6.75 3.75 2.35 1.78Price/Book value 4.19 2.81 5.37 9.83Price/adjusted equity 4.19 2.81 5.37 9.83
Free cash flow/Market cap (%) (28.9) (39.6) (17.4) (8.9)Operating cash flow/EV (%) (25.5) (34.8) (13.8) (3.9)EV/Capital employed (x) 3.2 1.9 4.3 7.9
Main shareholders Management Company informationName (%) Votes Capital Title Name ContactJasperus S.A. 15.4 15.4 COB Antti Villanen Internet https://www.nitrogames.comSavox Investments 12.0 12.0 CEO Jussi Tähtinen Phone number +358 44 082 2268Swebank Robur NY Teknik 9.6 9.6 CFO Matti Nikkola
IR
Source for all data on this page: SEB

Company Update Nitro Games 19 December 2018 20
Equity Research
Target prices and risks Target price definition and associated risks Our target price is the analyst's assessment of what total return an investor should expect over the coming six to 12 months. The target is based on fundamental equity research and other factors at the analyst's discretion.
Our current target price of SEK 88.6 was set today (19 Dec 2018). The main risk to our target price on Nitro Games is as follows. A key short-term risk is that despite signs of a successful launch of ‘Heroes of Warland’, there may be little evidence that it will be a commercially viable game. If this is the case, the company’s growth and profitability would suffer and more directed share issues would be needed. Over the long-term, Nitro Games needs to continue with partnerships. It is challenging for a small company to have its games discovered by gamers without the help of larger peers.
Risk levels The risk level is the analyst’s view of the uncertainty in the earnings forecasts based on an assessment of the company’s business model, operating risk as well as financial risk. We use two risk levels with the following explanations:
● Normal risk: All forecasts involve uncertainty and we view companies in this risk level to have normal forecast risks
● High risk: The earnings forecasts are more uncertain than for an average instrument due to business model, operating risk, financial risk or any other reason at the analyst’s discretion. All instruments with shorter track record than 12 months as a listed company are by definition classified as high risk according to SEB.

Company Update Nitro Games 19 December 2018 21
Equity Research
Authors' statement of independence (Analyst Certification) We, the authors of this report, hereby confirm that notwithstanding the existence of any potential conflicts of interest referred to herein, the views expressed in this report accurately reflect our personal views about the companies and securities covered. We further confirm that we have not been, nor are or will be, receiving direct or indirect compensation in exchange for expressing any of the views or the specific recommendation contained in the report. We are not registered or qualified as research analysts, representatives or associated persons under the rules of any US exchange, regulatory organization or State.
This statement affects your rights This report is confidential and may not be reproduced, redistributed or republished by any recipient for any purpose or to any person.
Producers and Recipients SEB Research is approved and issued by Skandinaviska Enskilda Banken AB (publ) (“SEB”), a bank organized under the laws of the Kingdom of Sweden, on behalf of itself and its affiliates for institutional investors. SEB is not a registered Broker-Dealer under the US Securities and Exchange Act of 1934. When SEB Research is issued by an SEB subsidiary, the subsidiary itself is subject to this disclaimer.
Use This research report is produced for the private information of recipients - if you are not a client of ours, you are not entitled to this research report, and should destroy it. The document is not, and should not be construed as, an offer to sell or solicitation of an offer to buy any securities. Opinions contained in the report represent the author's present opinion only and may be subject to change. In the event that the author's opinion should change or a new analyst with a different opinion becomes responsible for our coverage of the company concerned, we shall endeavour (but do not undertake) to disseminate any such change, within the constraints of any regulations, applicable laws, internal procedures within SEB, or other circumstances. If you are in doubt as to the meaning of the recommendation system used by SEB in its research, please refer to the "Disclaimer" section of SEB Research website, to which our clients are granted access.
Good faith and limitations All information, including statements of fact, contained in this research report have been obtained and compiled in good faith from sources believed to be reliable. However, no representation or warranty, express or implied, is made by SEB with respect to the completeness or accuracy of its contents, and it is not to be relied upon as authoritative and should not be taken in substitution for the exercise of reasoned, independent judgement by you. Recipients are urged to base their investment decisions upon such investigations as they deem necessary. To the extent permitted by applicable law, no liability whatsoever is accepted by SEB for any direct or consequential loss arising from the use of this document or its contents.
Distribution This research report has been prepared by SEB or its affiliates and is being distributed by SEB offices in Stockholm, Copenhagen, Oslo, Helsinki, Frankfurt, London, Tallinn, Vilnius, Riga and Hong Kong. Research reports are prepared and distributed in Lithuania by AB SEB bankas and in Estonia by AS SEB Pank in accordance with the requirements of the local laws and Financial Supervision Authority’s conduct of business rules. It is being distributed in the United States by SEB Securities Inc. ('SEBSI'), a wholly owned subsidiary of SEB organized under the laws of the State of Delaware, USA. Any United States institutional investor receiving the report, who wishes to obtain further information or to effect a transaction in any security discussed in the report, should do so only through SEBSI and not its affiliates. Addresses and Phone numbers for each office can be found at the end of the report.

Company Update Nitro Games 19 December 2018 22
Equity Research
The SEB Group: members, memberships and regulators SEB is a member of, inter alia, Nasdaq OMX Nordic, Oslo Stock Exchange, the London Stock Exchange, NYSE Euronext, SIX Swiss Exchange, Frankfurt Stock Exchange, Tallinn Stock Exchange as well as certain European MTF’s such as BATS-Chi-X, Turquoise and Burgundy. SEB is regulated by Finansinspektionen in Sweden and, for the conduct of investment services business, in (i) Denmark by Finanstilsynet, (ii) Norway by Finanstilsynet, (iii) Finland by Finanssivalvonta, (iv) Germany by Bundesanstalt für Finanzdienstleistungsaufsicht, (v) the UK by the Financial Conduct Authority and Prudential Regulation Authority (details about the extent of our regulation by the Financial Conduct Authority and Prudential Regulation Authority are available from us on request), (vi) Estonia by the Estonian Financial Supervision Authority, (vii) Lithuania by the Bank of Lithuania , (viii) Latvia by the Financial and Capital Markets Commission and (ix) Hong Kong by Securities and Futures Commission. SEBSI is a U.S. broker-dealer, registered with the Financial Industry Regulatory Authority (FINRA). SEBSI is a subsidiary of SEB. SEBSI is authorized to engage in the underwriting of securities but does not make markets or otherwise engage in any proprietary trading in any securities.
SEB’s research reports are prepared in accordance with the industry standards and codes of conduct applicable to financial analysts in the countries where they are based. In Denmark, Finland, Norway and Sweden, analysts act in accordance with the rules of ethics of each country’s Society of Financial Analysts. Analysts comply with the recommendations and industry standards of the Danish, Norwegian and the Swedish Securities Dealers Associations and with those of the Federation of Finnish Financial Services. Analysts certified by the CFA Institute also comply with the Code of Ethics of the CFA Institute. The author of this report is not registered or qualified as a research analyst with FINRA and therefore may not be subject to the FINRA Rule 2241 restrictions on communications with a subject company, public appearances and trading securities held by a research analyst account.
Prevention and avoidance of conflicts of interest All research reports are produced by SEB’s Research department, which is separated from the rest of its activities by an Information Barrier; as such, research reports are independent and based solely on publicly available information. Following standard practice, recommendations and target share prices are removed from research on companies which are the subject of public offers on which SEB is advising. The remuneration of staff within the Research department is determined exclusively by research management and senior management and may include discretionary awards based on the firm’s total earnings, including investment banking and markets (sales and trading businesses) income; however, no such staff receive remuneration based upon specific investment banking or markets transactions. SEB’s Compliance department monitors the production of research and the observance of the group's procedures designed to prevent any potential conflicts of interest from affecting the content of research; the latter are described in greater detail in the "Statement of Policies for dealing with potential conflicts of interest surrounding our Research activities" which is available on our SEB Research website.
Your attention is also drawn to the fact that: The current market price of the securities shown in this report is the price prevailing at the close of the business day preceding the date of publication, save where such price was more than 5% different from the price prevailing as at the time of publication, in which case it is the latter.
Unless explicitly stated otherwise in this report, SEB expects (but does not undertake) to issue updates to this report following the publication of new figures or forecasts by the company covered, or upon the occurrence of other events which could potentially have a material effect on it.
The securities discussed in this research report may not be eligible for sale in all countries, and such securities may not be suitable for all types of investors. Offers and sales of securities discussed in this research report, and the distribution of this report, may be made only in countries where such securities are exempt from registration or qualification or have been so registered or qualified for offer and sale, and in accordance with applicable broker-dealer and agent/salesman registration or licensing requirements.
A copy of this report, not including the recommendation, has been provided to the issuer prior to its dissemination to check factual statements for accuracy; as a result, some amendments have been made.
Additional recommendation history for the issuer is available at https://research.sebgroup.com/equity
A full list of disclosures for other companies mentioned herein (in which SEB has research coverage), can be found on our SEB Research website

Company Update Nitro Games 19 December 2018 23
Equity Research
Methodology Our target price is based on valuation approaches described in the Overview section of this report, unless our estimates are in the process of being updated. Final consideration as to any valuations, projections and forecasts contained in this report are based on a number of assumptions and estimates and are subject to contingencies and uncertainties, and their inclusion in this report should not be regarded as a representation or warranty by or on behalf of the Group or any person or entity within the Group that they or their underlying assumptions and estimates will be met or realized. Different assumptions could result in materially different results. Past performance is not a reliable indicator of future performance. Foreign currency rates of exchange may adversely affect the value, price or income of any security or related investment mentioned in this report. In addition, investors in securities, such as ADRs, whose values are influenced by the currency of the underlying security, effectively assume currency risk.
Company specific disclosures and potential conflicts of interest A member of, or an entity associated with, SEB or its affiliates, officers, directors, employees or shareholders of such members (a) is not, and has never been, represented on the board of directors or similar supervisory entity of Nitro Games, (b) has from time to time bought or sold the securities issued by the company or options relating to the company, and (c) SEB does not hold any short / long position exceeding 0.5% of the total issued share capital of Nitro Games as of 30 Nov 2018. The analyst(s) responsible for this research report (jointly with their closely related persons) hold(s) 0 shares in Nitro Games and do(es) not have holdings in other instruments related to the company. Current recommendation for Nitro Games - Buy - was set on 18 Dec 2018. The dates of previous recommendation changes in relation to Nitro Games can be found on our Research Online website.

SEB Equity Research research.sebgroup.com/equity
SEB’s standardised recommendation structure
Consolidated distribution Clients to whom SEB has provided Clients from whom SEB has received as per 30 Sep 2018 (%) material investment services, last 12M (%) investment banking income, last 12M (%) Buy 49.6 19.2 10.2 Hold 40.4 9.2 6.7 Sell 10 1.2 2.3 Buy Attractive risk/reward - at least 10% upside to target price. Hold Fairly valued – the security / instrument is trading close to target price. Sell Unattractive risk/reward - security / instrument is trading above target price. Unrated Company not covered, or we are not allowed to have a recommendation for compliance reasons Source: SEB
Target price and recommendation revision history
Source: Thomson Reuters / SIX / SEB
Skandinaviska Enskilda Banken AB (publ). All rights reserved.
1
30
40
50
60
70
80
90
Jan 17 Jan 18
NITRO.ST Target price revisions
Please note, in the chart to the right: 1=Buy 2=Hold 3=Sell The grey spots mark the point where target prices have been changed. The price chart is not adjusted for dividends paid, whereas our recommendations are based on expected return including dividends
Copenhagen Bernstorffsgade 50 P.O. Box 100 DK-1577 Copenhagen V
Telephone: (45) 3328 2828
Frankfurt Stephanstrasse 14-16 D-60313 Frankfurt am Main
Telephone: (49) 69 9727 7740
Helsinki Eteläesplanadi 18 P.O. Box 630 FIN-00101 Helsinki
Telephone: (358) 9 616 28700
Hong Kong 17/F Jardine House 1 Connaught Place Central, Hong Kong Island Hong Kong
Telephone: (852) 3919 2600
London One Carter Lane London, EC4V 5AN
Telephone: (44) 20 7246 4000
New York 245 Park Avenue, 33rd Floor New York NY 10167
Telephone: (1) 212 692 4760
Oslo Filipstad Brygge 1, P.O. Box 1363 Vika NO-0113 Oslo
Telephone: (47) 2100 8500
Stockholm Kungsträdgårdsgatan 8 S-106 40 Stockholm
Telephone: (46) 8 522 29500
Tallinn Tornimäe 2 EE-Tallinn 15010
Telephone: (372) 665 7762