Equity House (USD/barrel) Equity House Avg.year to date...
15
Asiamoney’s 2013 Best Domestic Equity House Sector flash 13 July 2015 Disclosure: Bahana Securities does and seeks to do business with companies covered in its research reports. Investors should consider this report as only a single factor in making their investment decision. Please see the important disclaimer information on the back of this report *Based on consensus’ recent changes ↑ (up), ↓ (down), ↔ (unchanged) 2014 Finance Asia's Best Equity House Alpha Southeast Asia 2014 Best Research Call FMCG Sector Asiamoney's 2013 Best Domestic Equity House 2015 Institutional Investors Highest Ranked Local Research House 2015 Global Banking & Finance Review Best Research House Indonesia Oil & Gas UNDERWEIGHT (Unchanged) Arandi Nugraha E-mail: [email protected] Phone: +6221 250 5081 Ext. 3619 Downstream preference Upstream - Unexciting on oil oversupply & weaker gas demand: In line with our 2015 average oil price assumption of USD60/barrel, Brent oil price has averaged USD59.4/barrel ytd, down 45% y-y, on oversupply (exhibit 3) on weak global conditions/ US inventory levels jumped 22% y-y to 465k barrels (exhibit 6), and as Iraq increased its 2Q15 production to 3.9m b/d (+12% q-q). This caused the Indonesian Crude Price (ICP) to plunge, averaging 42% y-y ytd to USD61.9/barrel. Despite US rig counts having fallen 53% y-y (exhibit 7) to 859, we maintain our oil price assumption on the possible ending of Iran‟s oil embargo and the likely USD appreciation following a potential Fed rate hike. In the Indonesian gas sector, the local market (exhibit 8), accounting for some 54% of volumes, is being impacted by the sluggish domestic economy, resulting in weaker gas demand from industrial users. In 1Q15, MEDC‟s gas sales were down 30% q-q to 98.3bbtu/d, while Conoco Phillips, one of the country‟s biggest gas producers, saw its gas lifting drop 7% q-q to 430mmscfd. Midstream - Policy risk at center stage: For midstream players like PGAS, the spotlight on policy risk comes from industrial users‟ proposal to have lower gas selling prices, which is planned to be scheduled next year by the Economic Affairs Ministry. Based on our sensitivity analysis, every 10% ASP discount (from current ASP of USD9.2/mmbtu), would lower PGAS‟s 2016F earnings by 30% (exhibit 20). Downstream - Rising non-subsidized customers: Under the Jokowi government, prices of mobile gas (mogas) and diesel are no longer capped (exhibit 9) with periodic evaluations depending on movements in currency and global oil prices. Currently, the consumption breakdown between subsidized versus non-subsidized fuels is expected to reach 22%:78% (exhibit 8), compared to 40%:60% prior to the subsidy reduction. By having a no-subsidy system in the market, AKRA has been able to raise the number of subsidized-fuel customers as many energy consumers shift to non-subsidized fuel. Testimony to this was AKRA‟s 1Q15 distribution volumes which grew 15% y-y to 0.5mn kl with the management expecting a further 9% q-q volume increase to 0.6mn kl in 2Q15 (2015F: 2.2mn kl). Underweight on price outlook; Raise AKRA to Buy on 15% price fall At this stage of the market cycle, we retain our sector UNDERWEIGHT on weak price outlook due to soft global economy, particularly China‟s, creating a persistent oversupply condition, which would be exacerbated once Iran is allowed to re-export its oil. Thus, against the aforementioned operating backdrop, we revise down MEDC‟s DCF-based 12M TP to IDR2,300 (from IDR2,800) on higher risk premium (from 6% to 7%). On the flip side, we upgrade AKRA to BUY from Reduce on margin improvement and a 15% share price fall from its recent peak of IDR6,225 in June to currently IDR5,300, pricing in market disappointment in Freeport‟s decision to set up operation in Petrokimia Gresik industrial estate. While we raise AKRA‟s 12M TP to IDR6,100 (from IDR3,700), risks exist in lower-than-expected returns from its industrial/port operations as well as from weaker-than-expected oil prices. Exhibit 1. Key data, 2015F Code CP cap Old New (IDR) Rating TP Rating TP MEDC 2,510 REDUCE 2,800 REDUCE 2,300 PGAS 3,980 HOLD 4,000 HOLD 4,000 AKRA 5,300 REDUCE 3,700 BUY 6,100 Sector Neutral Neutral Source: Bloomberg, Bahana estimates Exhibit 2. Oil prices, June 2014-June 2015 (USD/barrel) 45 55 65 75 85 95 105 115 125 Brent ICP MOPS 92 Avg. year to date Brent : USD59.4/bbl, -45% y-y ICP : USD55.4/bbl, -48% y-y MOPS 92 : USD69.8/bbl, -40% y-y Source: Bloomberg Exhibit 3. Oil production, 1Q14 – 4Q15F (mn b/d) 91.8 92.1 92.7 94.2 94.4 94.7 95.7 95.5 90.3 90.3 91.9 92.9 91.5 91.4 93.9 94.0 87 88 89 90 91 92 93 94 95 96 97 1Q14 2Q14 3Q14 4Q14 1Q15 2Q15 3Q15 4Q15 World oil supply World oil demand Source: EIA, OPEC, Bloomberg Exhibit 4. Profitability margin, 1Q15 (%) 39.0 32.1 12.2 13.9 21.9 8.4 -1.1 15.7 6.1 -5 0 5 10 15 20 25 30 35 40 45 MEDC PGAS AKRA Gross margin Operating margin Net income margin Source: Bloomberg Exhibit 5. Relative performance to JCI, ytd (26.9) (26.6) (16.7) 35.7 (5) 0 5 10 15 20 (40) (30) (20) (10) 0 10 20 30 40 MEDC PGAS SECTOR AKRA (%) (%) Source: Bloomberg
Transcript of Equity House (USD/barrel) Equity House Avg.year to date...

Asiamoney’s
2013
Best Domestic
Equity House
Sector flash
13 July 2015
Disclosure: Bahana Securities does and seeks to do business with companies covered in its research reports. Investors should consider this report as only a single factor in
making their investment decision.
Please see the important disclaimer information on the back of this report
*Based on consensus’ recent changes ↑ (up), ↓ (down), ↔ (unchanged)
2014
Finance Asia's
Best
Equity House
Alpha
Southeast Asia
2014 Best
Research Call
FMCG Sector
Asiamoney's
2013
Best Domestic
Equity House
2015
Institutional
Investors
Highest Ranked
Local Research
House
2015
Global
Banking & Finance
Review
Best Research
House
Indonesia Oil & Gas
UNDERWEIGHT (Unchanged)
Arandi Nugraha E-mail: [email protected] Phone: +6221 250 5081 Ext. 3619
Downstream preference
Upstream - Unexciting on oil oversupply & weaker gas demand: In
line with our 2015 average oil price assumption of USD60/barrel, Brent oil
price has averaged USD59.4/barrel ytd, down 45% y-y, on oversupply
(exhibit 3) on weak global conditions/ US inventory levels jumped 22% y-y
to 465k barrels (exhibit 6), and as Iraq increased its 2Q15 production to
3.9m b/d (+12% q-q). This caused the Indonesian Crude Price (ICP) to
plunge, averaging 42% y-y ytd to USD61.9/barrel. Despite US rig counts
having fallen 53% y-y (exhibit 7) to 859, we maintain our oil price
assumption on the possible ending of Iran‟s oil embargo and the likely USD
appreciation following a potential Fed rate hike. In the Indonesian gas
sector, the local market (exhibit 8), accounting for some 54% of volumes,
is being impacted by the sluggish domestic economy, resulting in weaker
gas demand from industrial users. In 1Q15, MEDC‟s gas sales were down
30% q-q to 98.3bbtu/d, while Conoco Phillips, one of the country‟s biggest
gas producers, saw its gas lifting drop 7% q-q to 430mmscfd.
Midstream - Policy risk at center stage: For midstream players like
PGAS, the spotlight on policy risk comes from industrial users‟ proposal to
have lower gas selling prices, which is planned to be scheduled next year
by the Economic Affairs Ministry. Based on our sensitivity analysis, every
10% ASP discount (from current ASP of USD9.2/mmbtu), would lower
PGAS‟s 2016F earnings by 30% (exhibit 20).
Downstream - Rising non-subsidized customers: Under the Jokowi
government, prices of mobile gas (mogas) and diesel are no longer capped
(exhibit 9) with periodic evaluations depending on movements in currency
and global oil prices. Currently, the consumption breakdown between
subsidized versus non-subsidized fuels is expected to reach 22%:78%
(exhibit 8), compared to 40%:60% prior to the subsidy reduction. By
having a no-subsidy system in the market, AKRA has been able to raise
the number of subsidized-fuel customers as many energy consumers shift
to non-subsidized fuel. Testimony to this was AKRA‟s 1Q15 distribution
volumes which grew 15% y-y to 0.5mn kl with the management expecting
a further 9% q-q volume increase to 0.6mn kl in 2Q15 (2015F: 2.2mn kl).
Underweight on price outlook; Raise AKRA to Buy on 15% price fall
At this stage of the market cycle, we retain our sector UNDERWEIGHT on
weak price outlook due to soft global economy, particularly China‟s, creating a
persistent oversupply condition, which would be exacerbated once Iran is
allowed to re-export its oil. Thus, against the aforementioned operating
backdrop, we revise down MEDC‟s DCF-based 12M TP to IDR2,300 (from
IDR2,800) on higher risk premium (from 6% to 7%). On the flip side, we
upgrade AKRA to BUY from Reduce on margin improvement and a 15% share
price fall from its recent peak of IDR6,225 in June to currently IDR5,300,
pricing in market disappointment in Freeport‟s decision to set up operation in
Petrokimia Gresik industrial estate. While we raise AKRA‟s 12M TP to
IDR6,100 (from IDR3,700), risks exist in lower-than-expected returns from its
industrial/port operations as well as from weaker-than-expected oil prices.
Exhibit 1. Key data, 2015F
Code CP
cap
Old
New
(IDR) Rating TP
Rating TP
MEDC 2,510 REDUCE 2,800 REDUCE 2,300
PGAS 3,980 HOLD 4,000 HOLD 4,000
AKRA 5,300 REDUCE 3,700 BUY 6,100
Sector Neutral Neutral
Source: Bloomberg, Bahana estimates
Exhibit 2. Oil prices, June 2014-June 2015 (USD/barrel)
45
55
65
75
85
95
105
115
125
Brent ICP MOPS 92
Avg. year to dateBrent : USD59.4/bbl, -45% y-yICP : USD55.4/bbl, -48% y-yMOPS 92 : USD69.8/bbl, -40% y-y
Source: Bloomberg
Exhibit 3. Oil production, 1Q14 – 4Q15F (mn b/d)
91.892.1
92.7
94.2 94.4 94.7
95.7 95.5
90.3 90.3
91.9
92.9
91.5 91.4
93.9 94.0
87
88
89
90
91
92
93
94
95
96
97
1Q14 2Q14 3Q14 4Q14 1Q15 2Q15 3Q15 4Q15
World oil supply World oil demand
Source: EIA, OPEC, Bloomberg
Exhibit 4. Profitability margin, 1Q15 (%)
39.0
32.1
12.213.9
21.9
8.4
-1.1
15.7
6.1
-5
0
5
10
15
20
25
30
35
40
45
MEDC PGAS AKRA
Gross margin Operating margin Net income margin
Source: Bloomberg
Exhibit 5. Relative performance to JCI, ytd
(26.9) (26.6)
(16.7)
35.7
(5)
0
5
10
15
20
(40)
(30)
(20)
(10)
0
10
20
30
40
MEDC PGAS SECTOR AKRA
(%)(%)
Source: Bloomberg

Bahana Securities – Equity Research – Oil and gas sector update
2014
Finance Asia's
Best
Equity House
Alpha
Southeast Asia
2014 Best
Research Call
FMCG Sector
Asiamoney's
2013
Best Domestic
Equity House
2015
Institutional
Investors
Highest Ranked
Local Research
House
2015
Global
Banking & Finance
Review
Best Research
House
AKRA: Upgrading to BUY (from REDUCE) with a revised up TP of IDR6,100 (from IDR3,700)
At present, we see AKRA as being able to increase its petroleum distribution volumes given demand shift from subsidized to
non-subsidized fuel (exhibit 8). Management believes that volume escalation would mostly come from the general market,
which represents around 25% of total petroleum distribution volumes (exhibit 10). In our view, this, combined with effective
cost management and solid operating execution, provides AKRA with a competitive advantage, which should allow for a gross-
margin improvement (exhibit 12 and 13) to 9% in 2015 (2014: 8%; 1Q15: 12%). Thus, we revise up our 2015-16E EPS by 52-
60% for this year. In line with our higher earnings, we increase our DCF-based 12-month target price (TP) from IDR3,700 to
IDR6,100, which translates to 2015F PE of 26x. Risks to our call: lower-than-expected global oil prices and negative
sentiment stemming from slower than expected development of AKRA‟s industrial estate/port business in East Java.
Exhibit 6. AKRA earnings revisions
Old New Change (%)
IDRbn 2014A 2015F 2016F 2014A 2015F 2016F 2014A 2015F 2016F
Revenues 22,468 19,108 22,092 22,468 20,845 24,991 - 9.1 13.1
Gross profit 1,732 1,461 1,622 1,732 1,950 2,093 - 33.5 29.1
Gross margin (%) 7.7 7.6 7.3 7.7 9.4 8.4
Operating profit 1,063 877 871 1,063 1,251 1,314 - 42.6 50.8
Net Profit 810 600 566 810 914 903 - 52.3 59.5
EPS 208 154 145 208 234 231 - 52.3 59.5
ASP (IDR/liter) 9,674 6,510 6,582 9,674 6,626 7,175 - 1.8 9.0
Sales vol. (mn kl liter) 1.83 2.10 2.43 1.83 2.15 2.44 - 2.0 0.7
Source: Company, Bahana forecasts
Exhibit 7. AKRA IJ 1Q15 results q-q y-y 1Q15/ y-y 3M15/ 2014/ (IDRb) 1Q14 4Q14 1Q15 (%) (%) 1Q15F 3M15 (%) 2015F Cons.
Sales 5,630 5,479 4,801 (12.4) (14.7) 167.5 4,801 (14.7) 25 21 Gross profit 369 501 584 16.6 58.2 584 58.2
General expense 147 228 180 (20.7) 22.8 180 22.8
Operating profit 222 273 403 47.6 81.6 234.4 403 81.6 46 29
Net interest income/(expense) (9) (14) (7) (46.6) (13.0) (7) (13.0)
Forex gain (expenses) 13 14 (8) (159.7) (165.3) - (8) (165.3) Other income/(expense) (2) 99 (6) (106.0) 170.7
(6) 170.7
Taxation (51) (58) (67) 15.8 30.5
(67) 30.5
Minority interest 7 3 (20) (816.2) (401.2) (20) (401.2)
Net profit 180 231 295 27.6 63.8 223.7 295 63.8 49 31
BS & ratio analysis 1Q14 4Q14 1Q15 3M14 3M15 2014A 2015F 2016F Gross margin (%) 6.6 9.1 12.2 6.6 12.2 7.7 7.6 7.3
Operating margin (%) 3.9 5.0 8.4 3.9 8.4 4.6 4.6 3.9
Net margin (%) 3.2 4.2 6.1 3.2 6.1 3.6 3.1 2.6
Inventory Days 22 25 23 22 23 24 18 16
Receivable Days 59 70 75 59 75 70 86 78
Payable Days 58 69 70 58 70 67 77 67
Total cash 613 897 1,145 613 1,145 897 601 653
Total debt 4,557 4,126 3,994 4,557 3,994 4,126 5,834 5,758
Net gearing (%) 73.5 59.9 49.9 73.5 49.9 59.9 93.4 86.8 Source: Company, Bahana forecasts, Bloomberg
Exhibit 8. Subsidized and non-subsidized fuel, 2010 – 2015F
(mn kl)
38.2 41.7 45.0 46.3 46.5
17.9
27.029.7
30.0 31.0 32.0
62.0
-
10.00
20.00
30.00
40.00
50.00
60.00
70.00
80.00
90.00
2010 2011 2012 2013 2014 2015F
Subsidized Non-subsidized
65.271,4
75.077.3 78.5
79.9
Source: AKR Corporindo
Post subsidy removal, proportion of
gasoline should shift from 40/60% to 22/78% due to narrowing disparities between subsidized and non-subsidized fuels
Bahana Securities – Equity Research – Oil and gas sector update
2014
Finance Asia's
Best
Equity House
Alpha
Southeast Asia
2014 Best
Research Call
FMCG Sector
Asiamoney's
2013
Best Domestic
Equity House
2015
Institutional
Investors
Highest Ranked
Local Research
House
2015
Global
Banking & Finance
Review
Best Research
House
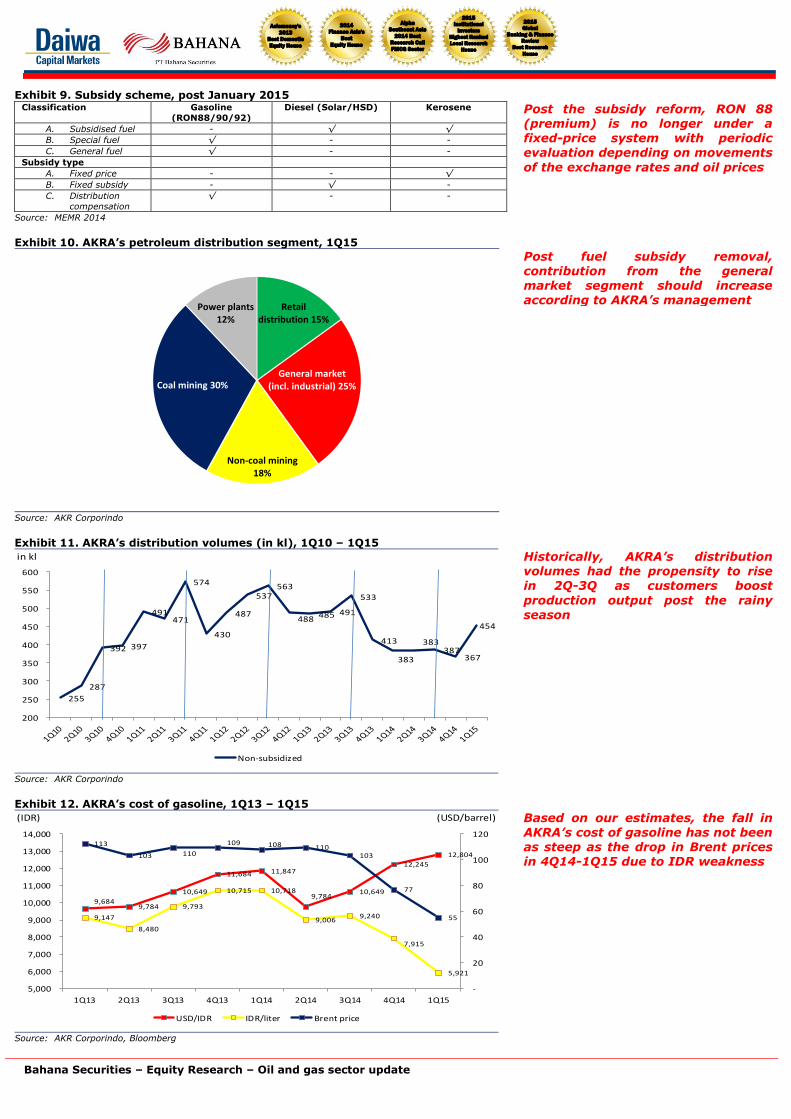
Exhibit 9. Subsidy scheme, post January 2015 Classification Gasoline
(RON88/90/92)
Diesel (Solar/HSD) Kerosene
A. Subsidised fuel - √ √
B. Special fuel √ - -
C. General fuel √ - -
Subsidy type
A. Fixed price - - √
B. Fixed subsidy - √ -
C. Distribution
compensation
√ - -
Source: MEMR 2014
Exhibit 10. AKRA’s petroleum distribution segment, 1Q15
Retail distribution 15%
General market (incl. industrial) 25%
Non-coal mining 18%
Coal mining 30%
Power plants 12%
Source: AKR Corporindo
Exhibit 11. AKRA’s distribution volumes (in kl), 1Q10 – 1Q15
in kl
255
287
392 397
491 471
574
430
487
537 563
488 485 491
533
413
383
383 387
367
454
200
250
300
350
400
450
500
550
600
Non-subsidized
Source: AKR Corporindo
Exhibit 12. AKRA’s cost of gasoline, 1Q13 – 1Q15
(IDR) (USD/barrel)
9,684 9,784
10,649
11,684 11,847
9,784 10,649
12,245
12,804
9,147
8,480
9,793
10,715 10,718
9,006 9,240
7,915
5,921
113
103 110
109 108 110 103
77
55
-
20
40
60
80
100
120
5,000
6,000
7,000
8,000
9,000
10,000
11,000
12,000
13,000
14,000
1Q13 2Q13 3Q13 4Q13 1Q14 2Q14 3Q14 4Q14 1Q15
USD/IDR IDR/liter Brent price
Source: AKR Corporindo, Bloomberg
Post the subsidy reform, RON 88 (premium) is no longer under a fixed-price system with periodic evaluation depending on movements
of the exchange rates and oil prices
Post fuel subsidy removal, contribution from the general market segment should increase according to AKRA’s management
Historically, AKRA’s distribution volumes had the propensity to rise in 2Q-3Q as customers boost
production output post the rainy season
Based on our estimates, the fall in AKRA’s cost of gasoline has not been as steep as the drop in Brent prices in 4Q14-1Q15 due to IDR weakness

Bahana Securities – Equity Research – Oil and gas sector update
2014
Finance Asia's
Best
Equity House
Alpha
Southeast Asia
2014 Best
Research Call
FMCG Sector
Asiamoney's
2013
Best Domestic
Equity House
2015
Institutional
Investors
Highest Ranked
Local Research
House
2015
Global
Banking & Finance
Review
Best Research
House
Exhibit 13. AKRA’s petroleum distribution margin, 1Q13-1Q15
USD/liter
7,739 7,162
7,918
8,950 9,299
8,774 8,671
7,513
5,484
8,418 7,967
8,812
10,000 10,310 10,030 10,019
9,064
6,937
262 317 247 528 529 687 764 896 901
-
2,000
4,000
6,000
8,000
10,000
12,000
1Q13 2Q13 3Q13 4Q13 1Q14 2Q14 3Q14 4Q14 1Q15
ASP MOPS CM
Source: AKR Corporindo
MEDC: Sluggish operating performance; Revised down TP to IDR2,300 (from IDR2,800)
On 24 June 2015, Donggi-Senoro LNG (DSLNG), Indonesia‟s fourth LNG plant (exhibit 16), post Tangguh, Bontang and Arun,
saw its first gas distribution amounting to 145mmscfd from the Senoro field, run by a Joint Operating Body (JOB): Pertamina
Medco E&P Tomori Sulawesi. The first cargo shipment is expected in the next 30-40 days with the Senoro field gradually
producing natural gas until it reaches production capacity of 310mmscfd. Although the LNG market is currently in a downtrend
on a y-y basis (Platts Japan/Korea Marker June avg. down 41.3% y-y to USD7.60/mmbtu), we believe DSLNG could be a
positive catalyst for MEDC‟s performance once the oil and gas sector recovers. On the back of sluggish operating performance in
oil and gas sales in 1Q15 (exhibit 15), we expect MEDC to experience a tough 2015. While we make no changes to our earnings
forecasts and maintain our REDUCE rating, we revise down our DCF-based 12-month TP from IDR2,800 to IDR2,300 on the
back of a higher risk premium of 7% (prior: 6%), translating to 2015F PE of 27.7x. Upside risks to our call are higher-than-
expected oil and gas sales volumes and prices.
Exhibit 14. MEDC IJ 1Q15 results q-q y-y 1Q15/ y-y 3M15/ 3M15/ (USDm) 1Q14 4Q14 1Q15 (%) (%) 1Q15F 3M15 (%) 2015F Cons.
Sales 189 199 128 (35.8) (32.6) 117 128 (32.6) 18 16 Gross profit 99 72 50 (31.0) (49.6) 50 (49.6)
Operating expense 38 49 32 (35.3) (16.9) 32 (16.9)
Operating profit 60 23 18 (21.6) (70.5) 74 18 (70.5) 11 9
Other income/(expense) (16) (16) (14) 17.1 16.7 (14) 16.7
Taxation (37) (6) (5) 9.0 85.0 (5) 85.0
Minority interest (2) (0) (1) na (3,095.
6)
31.9 (1) 31.9
Net profit 3 1 (1) na na (146) (1) na (18) (4)
BS & ratio analysis 1Q14 4Q14 1Q15 3M14 3M15 2014A 2015F 2016F Gross margin (%) 52.1 36.3 39.0 52.1 39.0 36.1 36.0 36.1
Operating margin (%) 31.8 11.4 13.9 31.8 13.9 21.4 21.8 26.6
Net margin (%) 1.6 0.3 (1.1) 1.6 (1.1) 1.3 1.1 1.6
Inventory Days 44 27 53 44 53 29 28 28
Receivable Days 68 56 89 68 89 59 47 47
Payable Days 118 66 126 118 126 70 64 64
Total cash 374 207 274 374 274 207 319 193
Total debt 1,151 1,106 1,126 1,151 1,126 1,106 1,496 1,927
Net gearing (%) 85 99 93 85 93 99 186 244 Source: Company, Bahana forecasts, Bloomberg
AKRA experienced improved margins in 4Q13-1Q15 due to tighter control over pricing (no volume discounts) and customer
selections (e.g. greater cautiousness when dealing with coal companies)

Bahana Securities – Equity Research – Oil and gas sector update
2014
Finance Asia's
Best
Equity House
Alpha
Southeast Asia
2014 Best
Research Call
FMCG Sector
Asiamoney's
2013
Best Domestic
Equity House
2015
Institutional
Investors
Highest Ranked
Local Research
House
2015
Global
Banking & Finance
Review
Best Research
House
Exhibit 15. MEDC’s oil and gas sales volumes, 1Q12 - 1Q15
(mn b/d) (bbtu/d)
155 154 153154
155 153
161 160156
134
150
141
98
29
3030
30
25 25
25
26
22
21
2222
20 95
105
115
125
135
145
155
165
20
22
24
26
28
30
32
1Q12 2Q12 3Q12 4Q12 1Q13 2Q13 3Q13 4Q13 1Q14 2Q14 3Q14 4Q14 1Q15
Oil sales Gas sales
Source: MEDC Exhibit 16. Indonesia LNG plants
Source: Directorate General of Oil and Gas, 2012
Exhibit 17. Crude oil inventory, July 2014 – June 2015
(barrels)
340,000
360,000
380,000
400,000
420,000
440,000
460,000
480,000
500,000
DOE crude oil total inventory
Source: Bloomberg, Bahana
1Q15 oil-sales volumes declined 7% y-y, while gas sales plunged 37% y-y
DSLNG, Indonesia’s fourth LNG plant, making its debut in supplying the market on 24 June 2015
On the oil side, a 28% spike in crude oil inventory ytd is impacting oil prices, making for a tough recovery,
although ...

Bahana Securities – Equity Research – Oil and gas sector update
2014
Finance Asia's
Best
Equity House
Alpha
Southeast Asia
2014 Best
Research Call
FMCG Sector
Asiamoney's
2013
Best Domestic
Equity House
2015
Institutional
Investors
Highest Ranked
Local Research
House
2015
Global
Banking & Finance
Review
Best Research
House
Exhibit 18. US rig counts, January 2014 – June 2015
(rig count)
0
500
1,000
1,500
2,000
2,500
US horizontal US vertical US directional
Source: Bloomberg, Bahana
PGAS: Not without risks; HOLD on 31% share price drop from recent peak
With PGAS functioning as a support for infrastructure development and a gauge for Indonesia‟s economic growth, its performance was hit on both sides in terms of supply and demand. On the demand side, 1Q15 industrial consumption fell 8% q-q to 773mmscfd on lower-than expected GDP growth (4.7% y-y) as well as a deceleration in electricity demand
growth (2.6% y-y vs 7.58% y-y in 1Q14). Domestic industries represented 97% of PGAS‟ sales. On the supply side, Conoco Phillips, one of PGAS‟s gas suppliers, reported a 7% q-q lower gas production output to 430mmscfd due to unfavorable sector performance. Currently, PGAS also faces policy risk, mainly on the possibility of the government lowering industrial gas selling prices. To help measure the impact of lower gas selling prices, we have conducted a sensitivity analysis (see exhibit 20). Based on our study, an ASP cut of 10% would impact PGAS‟ 2016F net income by 30%. Thus, we see downside risk to our call, although we maintain our HOLD rating for now as PGAS‟ share price has decreased 31% from its peak back in
January. Upside risk to our call would be better-than-expected gas-sales volumes due to Indonesia‟s improved economy. Exhibit 19. PGAS IJ 1Q15 results q-q y-y 1Q15/ y-y 3M15/ 3M15/ (USDm) 1Q14 4Q14 1Q15 (%) (%) 1Q15F 3M15 (%) 2015F Cons.
Sales 804 895 696 (22.2) (13.4) 123 696 (13.4) 19 19 Gross profit 297 363 223 (38.4) (24.8) 223 (24.8)
Operating expense 85 150 71 (52.8) (17.0) 71 (17.0)
Operating profit 212 212 153 (28.2) (27.9) 73 153 (27.9) 16 16
Net interest income/(expense) 1 (25) (15) (39.0) na (1,920.
7)
(15) na (1,920.
7)
Forex gain (expenses) (6) 32 (2) (107.4)
(107.4)
(61.5) (2) (61.5) Other income/(expense) 19 (31) 15 (147.8)
(147.8)
(24.3) 15 (24.3)
Taxation (49) (52) (40) (22.3) (17.2) (40) (17.2)
Minority interest (0) (5) 1 (112.2)
(112.2)
na
23,674.
3
1 na
23,674.
3
Net profit 177 131 109 (16.5) (38.1) 88 109 (38.1) 14 15
BS & ratio analysis 1Q14 4Q14 1Q15 3M14 3M15 2014A 2015F 2016F Gross margin (%) 36.9 40.5 32.1 36.9 32.1 43.0 39.8 39.6
Operating margin (%) 26.3 23.7 21.9 26.3 21.9 28.8 26.0 25.5
Net margin (%) 22.0 14.6 15.7 22.0 15.7 21.2 20.7 19.8
Inventory Days 3 7 8 3 8 7 6 3
Receivable Days 34 33 34 34 34 32 32 33
Payable Days 37 25 35 37 35 27 30 35
Total cash 1,170 1,216 1,150 1,170 1,150 1,216 1,227 1,299
Total debt 1,404 1,892 2,145 1,404 2,145 1,892 1,725 1,619
Net gearing (%) 9 23 33 9 33 23 15 9 Source: Company, Bahana forecasts, Bloomberg
Exhibit 20. PGAS sensitivity analysis, 2016F earnings
Average selling price (USD/mmbtu)
ASP changes (%)
Net income (USDmn)
Net income change (%)
9.24 - 656
8.32 -10 459 -30
7.39 -20 260 -60 Source: Bahana estimates
... prices have declined 6% despite a significant reduction in US rig counts
We estimate that for every 10% discount on gas ASP, PGAS’s 2016F
net income would drop by 30%

Bahana Securities – Equity Research – Oil and gas sector update
2014
Finance Asia's
Best
Equity House
Alpha
Southeast Asia
2014 Best
Research Call
FMCG Sector
Asiamoney's
2013
Best Domestic
Equity House
2015
Institutional
Investors
Highest Ranked
Local Research
House
2015
Global
Banking & Finance
Review
Best Research
House
Exhibit 21. Oil and gas: Policy risks
No. Policy Status Impact
1. Possible reduction on gas selling price
Plan Negative on PGAS
2. Permits simplification Plan Positive for investment landscape
3. Reduction of oil & gas blocks up for biddings
Plan Less exploration and lower production
4. Work contracts from production-to-revenue based
Plan Negative for MEDC
5. Gas agregator establishment Plan Positive impact for PGAS
6. Open access for gas pipelines Signed Limited impact for PGAS for now
Source: Bahana
Exhibit 22. Indonesia natural gas utilization, 2014
(%)
Export sales 46.5
Industry 19.2
Fertilizer 8.8
Power plant 14.0
Others 11.5
Source: SKK Migas
Exhibit 23. PGAS distribution volumes, 1Q13 – 1Q15
(mmscfd)
833827
808
824
876 866
860867
796
740
760
780
800
820
840
860
880
900
1Q13 2Q13 3Q13 4Q13 1Q14 2Q14 3Q14 4Q14 1Q15
Distribution
Source: Perusahaan Gas Negara
Currently, The Ministry of Coordinating Economic Affairs plans to push discussions on gas price reduction to 2016
According to SKK Migas, around
53.5% of Indonesia’s natural gas utilization is distributed to domestic markets, making ...
... weaker industrial activities
having affected PGAS distribution volumes, as ...

Bahana Securities – Equity Research – Oil and gas sector update
2014
Finance Asia's
Best
Equity House
Alpha
Southeast Asia
2014 Best
Research Call
FMCG Sector
Asiamoney's
2013
Best Domestic
Equity House
2015
Institutional
Investors
Highest Ranked
Local Research
House
2015
Global
Banking & Finance
Review
Best Research
House
Exhibit 24. PGAS industrial customers, 1Q15
Source: Perusahaan Gas Negara
Exhibit 25. Oil and gas sector summary
MEDC PGAS AKRA SECTOR
2015F 2015F 2015F
Recommendation REDUCE HOLD BUY
Target price 2,300 4,000 6,100
Price 2,510 3,980 5,300
Upside/downside (%) -8% 1% 15%
Shares outstanding (m) 3,339 24,213 3,905
Market cap (IDRb) 8,464 103,632 22,062 134,159
Market cap (USDm) 635 7,780 1,656 10,071
3m turnover (IDRb)/(USDm) 5.5/0.4 4.6/0.3 22.5/1.7
30avg daily volumes (m) 1.7 33.7 0.9
PE (x) 30.2 11.8 22.6 -
PE (x) @TP 27.7 11.8 26.1 206.57
PBV (x) 0.7 2.5 3.5 1.22
EV/EBITDA (x) 6.4 7.0 16.2 6.09
Net gearing (%) 104.5 0.2 49.5
BVPS (IDR/share) 3,395 1,606 1,533 1,383.00
EPS (IDR/share) 83 338 234 84.24
EPS growth (%) -18 -13.2 12.8 15.83
ROAA (%) 15.2 10 6.2 3.34
ROAE (%) 25.2 21.8 14.2 4.91
Growth (%)
Revenue -3.5 -1.2 -7.2 (2.33)
Gross profit -3.7 -14.8 12.6 (9.59)
Operating profit -1.9 -19.9 17.6 (12.60)
Net profit -20.0 -13.2 12.8 (9.35)
Margin (%)
Gross profit 36.0 37.1 9.4 32.48
Operating profit 21.9 23.3 6.0 20.37
Net profit 1.2 18.6 4.4 15.17
Source: Bloomberg, Bahana estimates
Based on stock prices as of 10 July 2015
... domestic industrial consumption represented 97% of PGAS’ sales

Bahana Securities – Equity Research – Oil and gas sector update
2014
Finance Asia's
Best
Equity House
Alpha
Southeast Asia
2014 Best
Research Call
FMCG Sector
Asiamoney's
2013
Best Domestic
Equity House
2015
Institutional
Investors
Highest Ranked
Local Research
House
2015
Global
Banking & Finance
Review
Best Research
House
AKR Corporindo (AKRA)
Source: Company, Bahana estimates
Arandi Nugraha ([email protected]) +6221 2505081 ext. 3619
Year to 31 December 2012 2013 2014 2015F 2016F
PROFIT & LOSS (IDRb)
Sales 21,674 22,338 22,468 20,845 24,991 Gross profit improvements on higher sales volumes
Gross profit 1,261 1,368 1,732 1,950 2,093 EBITDA 1,092 1,020 1,396 1,556 1,950 Depreciation 228 252 333 306 636 EBIT 864 768 1,063 1,251 1,314 Net interest income/(expense) (17) (38) (77) (121) (187) Forex gain/(losses) - - - - - Other income/(expense) (37) 3 8 (2) 14 Pre-tax profit 810 733 993 1,127 1,141 Taxes (191) (117) (203) (242) (268) Minority interest 30 33 20 28 30 Net profit 649 648 810 914 903
BALANCE SHEET (IDRb) Cash and equivalents 1,885 820 897 854 871 Cash maintenance amid ...
Trade receivables 3,224 4,352 4,351 4,533 5,331 Inventories 1,415 1,823 935 710 997 Fixed assets 3,177 4,227 4,390 4,770 6,419 Other assets 2,086 3,411 4,220 3,812 3,636 Total assets 11,788 14,633 14,792 14,680 17,254 Interest bearing liabilities 3,033 5,146 4,126 3,815 4,314 Trade payables 3,959 3,735 4,067 3,340 4,716 Other liabilities 586 389 637 579 590 Total liabilities 7,578 9,270 8,831 7,734 9,621 Minority interest 173 590 571 961 1,061 Shareholders' equity 4,037 4,773 5,391 5,985 6,572
CASH FLOW (IDRb) EBIT 864 768 1,063 1,251 1,314
... elevated level of 2016F
capex amounting to IDR1.4tn for power plant project
Depreciation 228 252 333 306 636 Working capital (853) (1,828) 1,657 (681) 136 Other operating items (215) (56) (267) (337) (411) Operating cash flow 25 (863) 2,786 538 1,675 Net capital expenditure (1,225) (2,335) (1,245) (273) (2,285) Free cash flow (1,201) (3,198) 1,542 265 (610) Equity raised/(bought) - - - - - Net borrowings 2,034 2,113 (1,019) (312) 500 Other financing (278) 20 (446) 4 127 Net cash flow 555 (1,065) 77 (42) 17 Cash flow at beginning 1,330 1,885 820 897 854 Cash flow at end 1,885 820 897 854 871
RATIOS ROAE (%) 16.5 13.5 14.3 14.2 12.4
Gross margin improvement, partly helped by IDR weakness
ROAA (%) 6.4 4.9 5.5 6.2 5.7 Gross margin (%) 5.8 6.1 7.7 9.4 8.4 EBITDA margin (%) 5.0 4.6 6.2 7.5 7.8 EBIT margin (%) 4.0 3.4 4.7 6.0 5.3 Net margin (%) 3.0 2.9 3.6 4.4 3.6 Payout ratio (%) 18.3 65.0 50.0 40.0 40.0 Current ratio (x) 1.4 1.2 1.1 1.2 1.2 Interest coverage (x) 15.6 6.9 7.7 6.7 5.2 Net gearing (%) 28.4 90.6 59.9 49.5 52.4 Debts to assets (%) 25.7 35.2 27.9 26.0 25.0 Debtor turnover (days) 54 70 70 78 77 Creditor turnover (days) 70 64 71 64 74 Inventory turnover (days) 25 31 16 14 16
MAJOR ASSUMPTIONS
ASP (IDR/liter) 8,048.4 8,698.9 9,673.7 6,625.7 7,175.0 Improvement on petroleum sales volumes as consumers purchase non-subsidized fuel
growth (%) 10.0 8.1 11.2 (31.5) 8.3
Petroleum sales vol. („000kl) 2,149.0 2,031.5 1,831.2 2,146.2 2,444.7
growth (%) 5.4 (5.5) (9.9) 17.2 13.9
Bahana Securities – Equity Research – Oil and gas sector update
2014
Finance Asia's
Best
Equity House
Alpha
Southeast Asia
2014 Best
Research Call
FMCG Sector
Asiamoney's
2013
Best Domestic
Equity House
2015
Institutional
Investors
Highest Ranked
Local Research
House
2015
Global
Banking & Finance
Review
Best Research
House
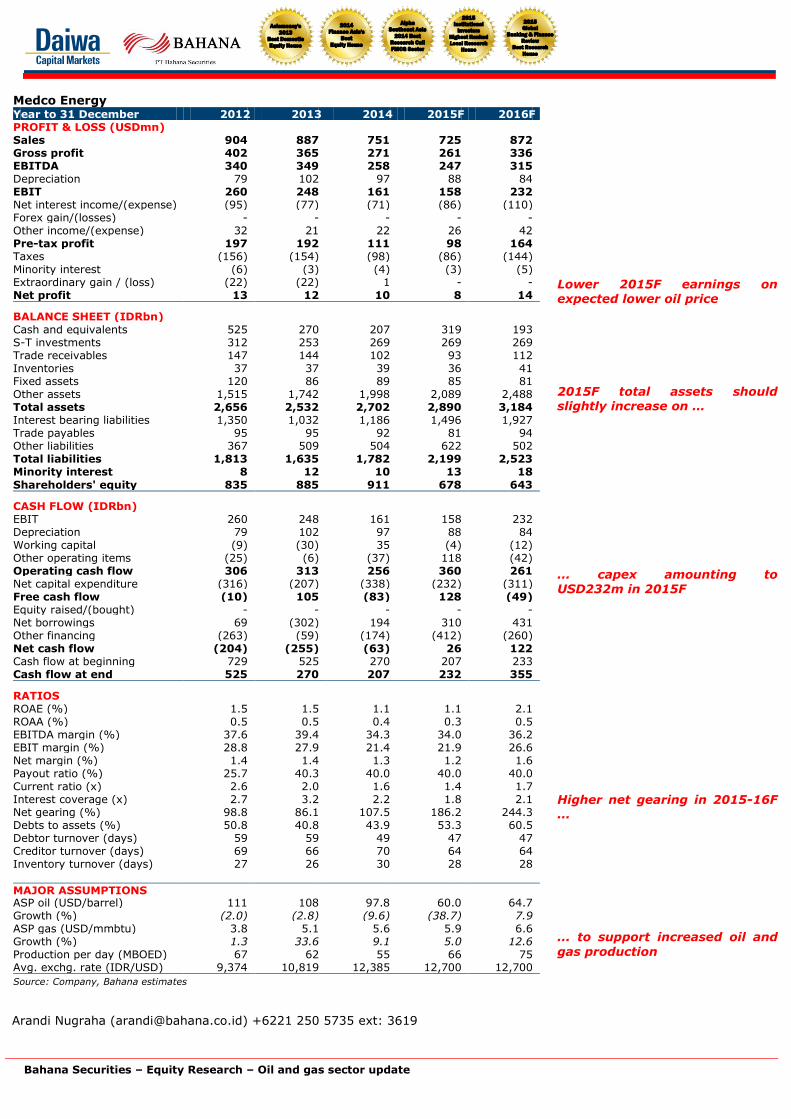
Medco Energy Year to 31 December 2012 2013 2014 2015F 2016F PROFIT & LOSS (USDmn) Sales 904 887 751 725 872 Gross profit 402 365 271 261 336 EBITDA 340 349 258 247 315 Depreciation 79 102 97 88 84 EBIT 260 248 161 158 232 Net interest income/(expense) (95) (77) (71) (86) (110) Forex gain/(losses) - - - - - Other income/(expense) 32 21 22 26 42 Pre-tax profit 197 192 111 98 164 Taxes (156) (154) (98) (86) (144) Minority interest (6) (3) (4) (3) (5) Extraordinary gain / (loss) (22) (22) 1 - - Net profit 13 12 10 8 14
BALANCE SHEET (IDRbn) Cash and equivalents 525 270 207 319 193 S-T investments 312 253 269 269 269 Trade receivables 147 144 102 93 112 Inventories 37 37 39 36 41 Fixed assets 120 86 89 85 81 Other assets 1,515 1,742 1,998 2,089 2,488 Total assets 2,656 2,532 2,702 2,890 3,184 Interest bearing liabilities 1,350 1,032 1,186 1,496 1,927 Trade payables 95 95 92 81 94 Other liabilities 367 509 504 622 502 Total liabilities 1,813 1,635 1,782 2,199 2,523 Minority interest 8 12 10 13 18
Shareholders' equity 835 885 911 678 643
CASH FLOW (IDRbn) EBIT 260 248 161 158 232 Depreciation 79 102 97 88 84 Working capital (9) (30) 35 (4) (12) Other operating items (25) (6) (37) 118 (42) Operating cash flow 306 313 256 360 261 Net capital expenditure (316) (207) (338) (232) (311) Free cash flow (10) 105 (83) 128 (49) Equity raised/(bought) - - - - - Net borrowings 69 (302) 194 310 431 Other financing (263) (59) (174) (412) (260) Net cash flow (204) (255) (63) 26 122 Cash flow at beginning 729 525 270 207 233 Cash flow at end 525 270 207 232 355
RATIOS ROAE (%) 1.5 1.5 1.1 1.1 2.1 ROAA (%) 0.5 0.5 0.4 0.3 0.5 EBITDA margin (%) 37.6 39.4 34.3 34.0 36.2 EBIT margin (%) 28.8 27.9 21.4 21.9 26.6 Net margin (%) 1.4 1.4 1.3 1.2 1.6 Payout ratio (%) 25.7 40.3 40.0 40.0 40.0 Current ratio (x) 2.6 2.0 1.6 1.4 1.7 Interest coverage (x) 2.7 3.2 2.2 1.8 2.1 Net gearing (%) 98.8 86.1 107.5 186.2 244.3 Debts to assets (%) 50.8 40.8 43.9 53.3 60.5 Debtor turnover (days) 59 59 49 47 47 Creditor turnover (days) 69 66 70 64 64 Inventory turnover (days) 27 26 30 28 28
MAJOR ASSUMPTIONS ASP oil (USD/barrel) 111 108 97.8 60.0 64.7 Growth (%) (2.0) (2.8) (9.6) (38.7) 7.9 ASP gas (USD/mmbtu) 3.8 5.1 5.6 5.9 6.6 Growth (%) 1.3 33.6 9.1 5.0 12.6 Production per day (MBOED) 67 62 55 66 75 Avg. exchg. rate (IDR/USD) 9,374 10,819 12,385 12,700 12,700
Source: Company, Bahana estimates
Lower 2015F earnings on expected lower oil price
2015F total assets should slightly increase on …
... capex amounting to USD232m in 2015F
Higher net gearing in 2015-16F ...
... to support increased oil and
gas production
Arandi Nugraha ([email protected]) +6221 250 5735 ext: 3619

Bahana Securities – Equity Research – Oil and gas sector update
2014
Finance Asia's
Best
Equity House
Alpha
Southeast Asia
2014 Best
Research Call
FMCG Sector
Asiamoney's
2013
Best Domestic
Equity House
2015
Institutional
Investors
Highest Ranked
Local Research
House
2015
Global
Banking & Finance
Review
Best Research
House
Perusahaan Gas Negara Year to 31 December 2012 2013 2014 2015F 2016F PROFIT & LOSS (USDmn) Sales 2,580 3,002 3,409 3,418 3,793 Gross profit 1,472 1,418 1,465 1,297 1,409 EBITDA 1,208 1,265 1,269 1,207 1,232 Depreciation 189 331 286 379 354 EBIT 1,018 934 982 828 878 Net interest inc./(expense) 6 5 (50) (57) (55) Forex gain/(losses) 50 84 47 47 47 Other income/(expense) 74 43 (1) 59 79 Pre-tax profit 1,148 1,066 979 878 949 Taxes (233) (228) (231) (199) (237) Minority interest (24) (33) (25) (20) (21) Net profit 891 805 723 659 690
BALANCE SHEET (USDmn) Cash and equivalents 1,567 1,319 1,216 1,100 1,151 S-T investments 117 87 93 93 93 Trade receivables 259 280 325 328 364 Inventories 2 15 65 23 26 Fixed assets 1,694 2,246 3,902 4,255 4,421 Other assets 269 371 615 613 612 Total assets 3,908 4,318 6,215 6,412 6,666 Interest bearing liabilities 939 1,026 1,892 1,725 1,619 Trade payables 189 158 138 230 259 Other liabilities 426 462 1,222 1,244 1,259 Total liabilities 1,553 1,647 3,252 3,200 3,137 Minority interest 157 182 196 196 196 Shareholders' equity 2,197 2,489 2,767 3,016 3,332
CASH FLOW (USDmn) EBIT 1,018 934 982 828 878 Depreciation 189 331 286 379 354 Working capital 160 37 368 154 5 Other operating items (201) (473) (740) (169) (188) Operating cash flow 1,166 829 897 1,191 1,049 Net capital expenditure (148) (866) (1,896) (731) (519) Free cash flow 1,019 (37) (999) 460 530 Equity raised/(bought) (35) - - - - Net borrowings (154) 87 866 (167) (106) Other financing (404) (298) 30 (409) (374) Net cash flow 426 (248) (103) (115) 50 Cash flow at beginning 1,141 1,567 1,319 1,216 1,100 Ending cash flow 1,567 1,319 1,216 1,100 1,151
RATIOS
ROAE (%) 45.3 34.3 27.5 22.8 21.8 ROAA (%) 24.4 19.6 13.7 10.4 10.6 Gross margin (%) 57.1 47.2 43.0 38.0 37.1 EBITDA margin (%) 46.8 42.1 37.2 35.3 32.5 EBIT margin (%) 39.5 31.1 28.8 24.2 23.2 Net margin (%) 34.5 26.8 21.2 19.3 18.2 Payout ratio (%) 51.7 56.8 56.8 56.8 56.8 Current ratio (x) 4.2 2.0 1.7 1.3 1.4 Interest coverage (x) 47.2 42.7 13.0 10.0 11.1 Net gearing (%) nc nc 0.2 0.2 0.1 Debts to assets (%) 24.0 23.8 30.4 26.9 24.3 Debtor turnover (days) 37 34 35 35 35 Creditor turnover (days) 62 36 40 40 40 Inventory turnover (days) 1 3 4 4 4
MAJOR ASSUMPTIONS Distribution vol. (mmscfd) 807 824 865 844 947 growth % 1.5 2.1 5.0 (2.5) 12.2 Distr. ASP (USD/mmbtu) 8.0 9.2 9.2 9.4 9.4 growth % 14.1 14.5 0.1 0.2 -
Source: Company, Bahana estimates
Arandi Nugraha ([email protected]) +6221 2505081 ext. 3619
Sales to decline on lower distribution volumes in 2015F
Trade receivables should
remain intact, with potential upside in 2016F on higher distribution volumes if the economy were to recover
Capex allocation for transmission and distribution projects
Lower gross margin on LNG purchases
Lower distribution volumes in 2015F, before rising in 2016F on economic improvement

Bahana Securities – Equity Research – Oil and gas sector update
2014
Finance Asia's
Best
Equity House
Alpha
Southeast Asia
2014 Best
Research Call
FMCG Sector
Asiamoney's
2013
Best Domestic
Equity House
2015
Institutional
Investors
Highest Ranked
Local Research
House
2015
Global
Banking & Finance
Review
Best Research
House
Research: +62 21 250 5081
Andre Natala Susanto
[email protected] Associate
ext 3601
Chandra Widjanarka
[email protected] Analyst
ext 1252
Harry [email protected]
Senior Associate DirectorHead of Research
Strategy, Consumer
ext 3600direct: +62 21 250 5735
Dealing Room: +62 21 527 0808 (Foreign Institutional)
Teguh Hartanto
[email protected] Director
Deputy Head of Research
Banks, Cement, Aviationext 3610
Leonardo Henry Gavaza, [email protected]
Senior Research ManagerAuto, Heavy equipment, Telco
ext 3608
Chandra Widjanarka
[email protected] Analyst
ext 1252
+62 21 250 5508 (Domestic Institutional)
Ashish Agrawal
[email protected] President
Institutional Equity Salesext 2550 / 2553
Reynard Poernawan
[email protected] Equity Sales
ext 2528
John M. Dasaad
[email protected] Sales
ext 2549
Yohanes Adhi Handoko
[email protected], Surabaya Branch
ext 7250
Suwardi Widjaja
[email protected] Sales
ext 2548
Amelia Husada
[email protected] President
Institutional Equity Salesext 2552
Michael W Setjoadi [email protected]
Research AnalystConsumer, Poultry
ext 3613
Nurul Farida
[email protected] Sales
ext 2543
Adrian Mahendra Putra
[email protected] AnalystIndustrial Estate
ext 3614
Hanna Marionda
[email protected] Trader
ext 2525
Adriana Kosasih
[email protected] Executive
ext 2541
Ari Santosa
[email protected] Trader
ext 2554
Adi Saputra
[email protected] Associate
ext 3693
Robin Sutanto
[email protected] Analyst
Propertyext 3620
Agustinus Reza Kirana
[email protected] AnalystTransportation
ext 3616
Wendy [email protected]
Research AnalystConsumer, Media
ext 3606
Research AnalystCement, Infratructure,Toll roads
ext 3605
Muhammad Wafi
[email protected] Analyst
ext 3609
+62 31 535 2788 (Surabaya Branch)
Arandi [email protected]
Research AnalystCoal, Metals, Oil & Gas
ext 3619
Head of Equity Sales & TradingInstitutional Equity Sales
ext 2545
Made Ayu Wijayati
[email protected] Executive
ext 3607
Sanni Satrio Dwi Utomo
[email protected] Associate
ext 3611
Andre Natala Susanto
[email protected] Associate
ext 3601
Zefanya Halim
[email protected] Manager
ext 3612
Novianty Permata Sari
ext 3618
Bagus Adi Yoga Prawira
[email protected] Associate
ext 3604
Head Office Surabaya Branch
Graha Niaga, 19th Floor Wisma BII, Ground Floor
Jl. Jend. Sudirman Kav. 58 Jl. Pemuda 60-70
Jakarta 12190 Surabaya 60271
Indonesia Indonesia
Tel. 62 21 250 5081 Tel. 62 31 535 2788
Fax. 62 21 522 6049 http://www.bahana.co.id Fax. 62 31 546 1157

Bahana Securities – Equity Research – Oil and gas sector update
2014
Finance Asia's
Best
Equity House
Alpha
Southeast Asia
2014 Best
Research Call
FMCG Sector
Asiamoney's
2013
Best Domestic
Equity House
2015
Institutional
Investors
Highest Ranked
Local Research
House
2015
Global
Banking & Finance
Review
Best Research
House
Disclaimer This publication is prepared by PT.Bahana Securities and reviewed by Daiwa Securities Group Inc. and/or its affiliates, and distributed outside Indonesia by Daiwa Securities Group Inc. and/or its affiliates, except to the extent expressly provided herein. Certain copies of this publication may be distributed inside and outside of Indonesia by PT. Bahana Securities in accordance with relevant laws and regulations. This publication and the contents hereof are intended for information purposes only, and may be subject to change without further notice. Any use, disclosure, distribution, dissemination, copying, printing or reliance on this publication for any other purpose without our prior consent or approval is strictly prohibited. Any review does not constitute a full verification of the publication and merely provides a minimum check. Neither Daiwa Securities Group Inc. nor any of its respective parent, holding, subsidiaries or affiliates, nor any of its respective directors, officers, servants and employees, represent nor warrant the accuracy or completeness of the information contained herein or as to the existence of other facts which might be significant, and will not accept any responsibility or liability whatsoever for any use of or reliance upon this publication or any of the contents hereof. Neither this publication, nor any content hereof, constitute, or are to be construed as, an offer or solicitation of an offer to buy or sell any of the securities or investments mentioned herein in any country or jurisdiction nor, unless expressly provided, any recommendation or investment opinion or advice. Any view, recommendation, opinion or advice expressed in this publication constitutes the views of the analyst(s) named herein and does not necessarily reflect those of Daiwa Securities Group Inc. and/or its affiliates nor any of its respective directors, officers, servants and employees except where the publication states otherwise. This research report is not to be relied upon by any person in making any investment decision or otherwise advising with respect to, or dealing in, the securities mentioned, as it does not take into account the specific investment objectives, financial situation and particular needs of any person.
Neither Daiwa Securities Group Inc. nor any of its affiliates is licensed to undertake any business within the Republic of Indonesia. Any display of any trade name or logo of the Daiwa Securities Group Inc. on this publication shall not be deemed to be an undertaking of any business within the Republic of Indonesia.
Daiwa Securities Group Inc., its subsidiaries or affiliates, or its or their respective directors, officers and employees from time to time may have trades as principals, or have positions in, or have other interests in the securities of the company under research including derivatives in respect of such securities or may have also performed investment banking and other services for the issuer of such securities. The following are additional disclosures.
Japan
Daiwa Securities Co. Ltd. and Daiwa Securities Group Inc.
Daiwa Securities Co. Ltd. is a subsidiary of Daiwa Securities Group Inc.
Investment Banking Relationship
Within the preceding 12 months, The subsidiaries and/or affiliates of Daiwa Securities Group Inc. * has lead-managed public offerings and/or secondary offerings (excluding straight bonds) of the securities of the following companies: Modern Land (China) Co. Ltd (1107 HK econtext Asia Ltd (1390 HK); Neo Solar Power Corp (3576 TT); Accordia Golf Trust (AGT SP); Hua Hong Semiconductor Ltd (1347 HK); GF Securities Co Ltd (1776 HK).
*Subsidiaries of Daiwa Securities Group Inc. for the purposes of this section shall mean any one or more of:
• Daiwa Capital Markets Hong Kong Limited (大和資本市場香港有限公司)
• Daiwa Capital Markets Singapore Limited
• Daiwa Capital Markets Australia Limited
• Daiwa Capital Markets India Private Limited
• Daiwa-Cathay Capital Markets Co., Ltd.
• Daiwa Securities Capital Markets Korea Co., Ltd
Disclosure of Interest of Bahana Securities
Investment Banking Relationship
Within the preceding 12 months, Bahana Securities has lead-managed public offerings and/or secondary offerings (excluding straight bonds) of the securities of the following companies: PT Telekomunikasi Indonesia (Persero) Tbk (TLKM IJ); Garuda Indonesia (Persero) (GIAA IJ); Wijaya Karya Beton Tbk PT (WTON IJ); J Resources Asia Pasific Tbk PT (PSAB IJ)
Hong Kong
This research is distributed in Hong Kong by Daiwa Capital Markets Hong Kong Limited (大和資本市場香港有限公司) (“DHK”) which is regulated by the Hong Kong Securities and Futures Commission. Recipients of this research in Hong Kong may contact DHK in respect of any matter arising from or in connection with this research.
Ownership of Securities
For “Ownership of Securities” information, please visit BlueMatrix disclosure Link at https://daiwa3.bluematrix.com/sellside/Disclosures.action.
Investment Banking Relationship
For “Investment Banking Relationship”, please visit BlueMatrix disclosure Link at https://daiwa3.bluematrix.com/sellside/Disclosures.action.
Relevant Relationship (DHK)
DHK may from time to time have an individual employed by or associated with it serves as an officer of any of the companies under its research coverage.
DHK market making
DHK may from time to time make a market in the securities covered by this research.
Singapore
This research is distributed in Singapore by Daiwa Capital Markets Singapore Limited and it may only be distributed in Singapore to accredited investors, expert investors and institutional investors as defined in the Financial Advisers Regulations and the Securities and Futures Act (Chapter 289), as amended from time to time. By virtue of distribution to these category of investors, Daiwa Capital Markets Singapore Limited and its representatives are not required to comply with Section 36 of the Financial Advisers Act (Chapter 110) (Section 36 relates to disclosure of Daiwa Capital Markets Singapore Limited‟s interest and/or its representative‟s interest in securities). Recipients of this research in Singapore may contact Daiwa Capital Markets Singapore Limited in respect of any matter arising from or in connection with the research.
Australia
This research is distributed in Australia by Daiwa Capital Markets Stockbroking Limited and it may only be distributed in Australia to wholesale investors within the meaning of the Corporations Act. Recipients of this research in Australia may contact Daiwa Capital Markets Stockbroking Limited in respect of any matter arising from or in connection with the research.
Ownership of Securities
For “Ownership of Securities” information, please visit BlueMatrix disclosure Link at https://daiwa3.bluematrix.com/sellside/Disclosures.action.
India
This research is distributed by Daiwa Capital Markets India Private Limited (DAIWA) which is an intermediary registered with Securities & Exchange Board of India. This report is not to be considered as an offer or solicitation for any dealings in securities. While the information in this report has been compiled by DAIWA in good faith from sources believed to be reliable, no representation or warranty, express of implied, is made or given as to its accuracy, completeness or correctness. DAIWA its officers, employees, representatives and agents accept no liability whatsoever for any loss or damage whether

Bahana Securities – Equity Research – Oil and gas sector update
2014
Finance Asia's
Best
Equity House
Alpha
Southeast Asia
2014 Best
Research Call
FMCG Sector
Asiamoney's
2013
Best Domestic
Equity House
2015
Institutional
Investors
Highest Ranked
Local Research
House
2015
Global
Banking & Finance
Review
Best Research
House
direct, indirect, consequential or otherwise howsoever arising (whether in negligence or otherwise) out of or in connection with or from any use of or reliance on the contents of and/or omissions from this document. Consequently DAIWA expressly disclaims any and all liability for, or based on or relating to any such information contained in or errors in or omissions in this report. Accordingly, you are recommended to seek your own legal, tax or other advice and should rely solely on your own judgment, review and analysis, in evaluating the information in this document. The data contained in this document is subject to change without any prior notice DAIWA reserves its right to modify this report as maybe required from time to time. DAIWA is committed to providing independent recommendations to its Clients and would be happy to provide any information in response to any query from its Clients. This report is strictly confidential and is being furnished to you solely for your information. The information contained in this document should not be reproduced (in whole or in part) or redistributed in any form to any other person. We and our group companies, affiliates, officers, directors and employees may from time to time, have long or short positions, in and buy sell the securities thereof, of company(ies) mentioned herein or be engaged in any other transactions involving such securities and earn brokerage or other compensation or act as advisor or have the potential conflict of interest with respect to any recommendation and related information or opinion. DAIWA prohibits its analyst and their family members from maintaining a financial interest in the securities or derivatives of any companies that the analyst cover. This report is not intended or directed for distribution to ,or use by any person, citizen or entity which is resident or located in any state or country or jurisdiction where such publication, distribution or use would be contrary to any statutory legislation, or regulation which would require DAIWA and its affiliates/ group companies to any registration or licensing requirements. The views expressed in the report accurately reflect the analyst‟s personal views about the securities and issuers that are subject of the Report, and that no part of the analyst‟s compensation was, is or will be directly or indirectly, related to the recommendations or views expressed in the Report. This report does not recommend to US recipients the use of Daiwa Capital Markets India Private Limited or any of its non – US affiliates to effect trades in any securities and is not supplied with any understanding that US recipients will direct commission business to Daiwa Capital Markets India Private Limited.
Taiwan
This research is distributed in Taiwan by Daiwa-Cathay Capital Markets Co., Ltd and it may only be distributed in Taiwan to institutional investors or specific investors who have signed recommendation contracts with Daiwa-Cathay Capital Markets Co., Ltd in accordance with the Operational Regulations Governing Securities Firms Recommending Trades in Securities to Customers. Recipients of this research in Taiwan may contact Daiwa-Cathay Capital Markets Co., Ltd in respect of any matter arising from or in connection with the research.
Philippines
This research is distributed in the Philippines by DBP-Daiwa Capital Markets Philippines, Inc. which is regulated by the Philippines Securities and Exchange
Commission and the Philippines Stock Exchange, Inc. Recipients of this research in the Philippines may contact DBP-Daiwa Capital Markets Philippines, Inc.
in respect of any matter arising from or in connection with the research. DBP-Daiwa Capital Markets Philippines, Inc. recommends that investors
independently assess, with a professional advisor, the specific financial risks as well as the legal, regulatory, tax, accounting, and other consequences of a proposed transaction. DBP-Daiwa Capital Markets Philippines, Inc. may have positions or may be materially interested in the securities in any of the markets
mentioned in the publication or may have performed other services for the issuers of such securities.
For relevant securities and trading rules please visit SEC and PSE Link at http://www.sec.gov.ph/irr/AmendedIRRfinalversion.pdf and
http://www.pse.com.ph/ respectively.
United Kingdom
This research report is produced by Daiwa Capital Markets Europe Limited and/or its affiliates and is distributed in the European Union, Iceland, Liechtenstein, Norway and Switzerland. Daiwa Capital Markets Europe Limited is authorised and regulated by The Financial Conduct Authority (“FCA”) and is a member of the London Stock Exchange, Eurex and NYSE Liffe. Daiwa Capital Markets Europe Limited and/or its affiliates may, from time to time, to the extent permitted by law, participate or invest in other financing transactions with the issuers of the securities referred to herein (the “Securities”), perform services for or solicit business from such issuers, and/or have a position or effect transactions in the Securities or options thereof and/or may have acted as an underwriter during the past twelve months for the issuer of such securities. In addition, employees of Daiwa Capital Markets Europe Limited and/or its affiliates may have positions and effect transactions in such securities or options and may serve as Directors of such issuers. Daiwa Capital Markets Europe Limited may, to the extent permitted by applicable UK law and other applicable law or regulation, effect transactions in the Securities before this material is published to recipients.
This publication is intended for investors who are not Retail Clients in the United Kingdom within the meaning of the Rules of the FCA and should not therefore be distributed to such Retail Clients in the United Kingdom. Should you enter into investment business with Daiwa Capital Markets Europe‟s affiliates outside the United Kingdom, we are obliged to advise that the protection afforded by the United Kingdom regulatory system may not apply; in particular, the benefits of the Financial Services Compensation Scheme may not be available.
Daiwa Capital Markets Europe Limited has in place organisational arrangements for the prevention and avoidance of conflicts of interest. Our conflict management policy is available at http://www.uk.daiwacm.com/about-us/corporate-governance-regulatory. Regulatory disclosures of investment banking relationships are available at https://daiwa3.bluematrix.com/sellside/Disclosures.action.
Germany
This document is distributed in Germany by Daiwa Capital Markets Europe Limited, Niederlassung Frankfurt which is regulated by BaFin (Bundesanstalt fuer Finanzdienstleistungsaufsicht) for the conduct of business in Germany.
Bahrain
This research material is distributed by Daiwa Capital Markets Europe Limited, Bahrain Branch, regulated by The Central Bank of Bahrain and holds Investment Business Firm – Category 2 license and having its official place of business at the Bahrain World Trade Centre, South Tower, 7th floor, P.O. Box 30069, Manama, Kingdom of Bahrain. Tel No. +973 17534452 Fax No. +973 535113
This material is provided as a reference for making investment decisions and is not intended to be a solicitation for investment. Investment decisions should be made at your own discretion and risk. Accordingly, no representation or warranty, express or implied, is made as to and no reliance should be placed on the fairness, accuracy, completeness or correctness of the information and opinions contained in this document, Content herein is based on information available at the time the research material was prepared and may be amended or otherwise changed in the future without notice. All information is intended for the private use of the person to whom it is provided without any liability whatsoever on the part of Daiwa Capital Markets Europe Limited, Bahrain Branch, any associated company or the employees thereof. If you are in doubt about the suitability of the product or the research material itself, please consult your own financial adviser. Daiwa Capital Markets Europe Limited, Bahrain Branch retains all rights related to the content of this material, which may not be redistributed or otherwise transmitted without prior consent.
United States
This report is distributed in the U.S. by Daiwa Capital Markets America Inc. (DCMA). It may not be accurate or complete and should not be relied upon
as such. It reflects the preparer‟s views at the time of its preparation, but may not reflect events occurring after its preparation; nor does it reflect
PT.Bahana Securities‟ or DCMA‟s views at any time. Neither PT.Bahana Securities, DCMA nor the preparer has any obligation to update this report
or to continue to prepare research on this subject. This report is not an offer to sell or the solicitation of any offer to buy securities. Unless this report says otherwise, any recommendation it makes is risky and appropriate only for sophisticated speculative investors able to incur significant losses.
Readers should consult their financial advisors to determine whether any such recommendation is consistent with their own investment objectives,
financial situation and needs. This report does not recommend to U.S. recipients the use of any of PT.Bahana Securities‟ or DCMA‟s non-U.S.
affiliates to effect trades in any security and is not supplied with any understanding that U.S. recipients of this report will direct commission business to
such non-U.S. entities. Unless applicable law permits otherwise, non-U.S. customers wishing to effect a transaction in any securities referenced in this
material should contact a Daiwa entity in their local jurisdiction. Most countries throughout the world have their own laws regulating the types of
securities and other investment products which may be offered to their residents, as well as a process for doing so. As a result, the securities
discussed in this report may not be eligible for sales in some jurisdictions. Customers wishing to obtain further information about this report should
contact DCMA: Daiwa Capital Markets America Inc., Financial Square, 32 Old Slip, New York, New York 10005 (telephone 212-612-7000).

Bahana Securities – Equity Research – Oil and gas sector update
2014
Finance Asia's
Best
Equity House
Alpha
Southeast Asia
2014 Best
Research Call
FMCG Sector
Asiamoney's
2013
Best Domestic
Equity House
2015
Institutional
Investors
Highest Ranked
Local Research
House
2015
Global
Banking & Finance
Review
Best Research
House
Ownership of Securities
For “Ownership of Securities” information please visit BlueMatrix disclosure Link at https://daiwa3.bluematrix.com/sellside/Disclosures.action .
Investment Banking Relationships
For “Investment Banking Relationships” please visit BlueMatrix disclosure link at https://daiwa3.bluematrix.com/sellside/Disclosures.action .
DCMA Market Making
For “DCMA Market Making” please visit BlueMatrix disclosure link at https://daiwa3.bluematrix.com/sellside/Disclosures.action .
Research Analyst Conflicts
For updates on “Research Analyst Conflicts” please visit BlueMatrix disclosure link at https://daiwa3.bluematrix.com/sellside/Disclosures.action. The
principal research analysts who prepared this report have no financial interest in securities of the issuers covered in the report, are not (nor are any
members of their household) an officer, director or advisory board member of the issuer(s) covered in the report, and are not aware of any material
relevant conflict of interest involving the analyst or DCMA, and did not receive any compensation from the issuer during the past 12 months except as
noted: no exceptions.
Research Analyst Certification For updates on “Research Analyst Certification” and “Rating System” please visit BlueMatrix disclosure link at
https://daiwa3.bluematrix.com/sellside/Disclosures.action . The views about any and all of the subject securities and issuers expressed in this
Research Report accurately reflect the personal views of the research analyst(s) primarily responsible for this report (or the views of the firm
producing the report if no individual analysts[s] is named on the report); and no part of the compensation of such analyst(s) (or no part of the
compensation of the firm if no individual analyst[s)] is named on the report) was, is, or will be directly or indirectly related to the specific
recommendations or views contained in this Research Report.
For stocks and sectors in Indonesia covered by Bahana Securities, the following rating system is in effect:
Stock ratings are based on absolute upside or downside, which is the difference between the target price and the current market price. Unless otherwise specified, these ratings are set with a 12-month horizon. It is possible that future price volatility may cause a temporary mismatch between upside/downside for a stock based on the market price and the formal rating. "Buy": the price of the security is expected to increase by 10% or more. "Hold": the price of the security is expected to range from an increase of less than 10% to a decline of less than 5%. "Reduce": the price of the security is expected to decline by 5% or more.
Sector ratings are based on fundamentals for the sector as a whole. Hence, a sector may be rated “Overweight” even though its constituent stocks are all rated “Reduce”; and a sector may be rated “Underweight” even though its constituent stocks are all rated “Buy”. “Overweight”: positive fundamentals for the sector. “Neutral”: neither positive nor negative fundamentals for the sector. “Underweight”: negative fundamentals for the sector.
Ownership of Securities For “Ownership of Securities” information, please visit BlueMatrix disclosure Link at https://daiwa3.bluematrix.com/sellside/Disclosures.action .
Investment Banking Relationships For “Investment Banking Relationship”, please visit BlueMatrix disclosure Link at https://daiwa3.bluematrix.com/sellside/Disclosures.action . Relevant Relationships (Bahana Securities) Bahana Securities may from time to time have an individual employed by or associated with it serves as an officer of any of the companies under its research coverage.
Bahana Securities market making Bahana Securities may from time to time make a market in securities covered by this research.
Additional information may be available upon request.
Japan - additional notification items pursuant to Article 37 of the Financial Instruments and Exchange Law
(This Notification is only applicable where report is distributed by Daiwa Securities Co. Ltd.)
If you decide to enter into a business arrangement with us based on the information described in materials presented along with this document, we ask you to pay close attention to the following items.
In addition to the purchase price of a financial instrument, we will collect a trading commission* for each transaction as agreed beforehand with you. Since commissions may be included in the purchase price or may not be charged for certain transactions, we recommend that you confirm the commission for
each transaction.
In some cases, we may also charge a maximum of ¥ 2 million (including tax) per year as a standing proxy fee for our deposit of your securities, if you are
a non-resident of Japan.
For derivative and margin transactions etc., we may require collateral or margin requirements in accordance with an agreement made beforehand with
you. Ordinarily in such cases, the amount of the transaction will be in excess of the required collateral or margin requirements.
There is a risk that you will incur losses on your transactions due to changes in the market price of financial instruments based on fluctuations in interest
rates, exchange rates, stock prices, real estate prices, commodity prices, and others. In addition, depending on the content of the transaction, the loss
could exceed the amount of the collateral or margin requirements. There may be a difference between bid price etc. and ask price etc. of OTC derivatives handled by us.
Before engaging in any trading, please thoroughly confirm accounting and tax treatments regarding your trading in financial instruments with such experts
as certified public accountants.
*The amount of the trading commission cannot be stated here in advance because it will be determined between our company and you based on current market conditions and the content of each transaction etc.
When making an actual transaction, please be sure to carefully read the materials presented to you prior to the execution of agreement, and to take responsibility for your own decisions regarding the signing of the agreement with us.
Corporate Name: Daiwa Securities Co. Ltd.
Financial instruments firm: chief of Kanto Local Finance Bureau (Kin-sho) No.108
Memberships: Japan Securities Dealers Association, Financial Futures Association of Japan
Japan Securities Investment Advisers Association
Type II Financial Instruments Firms Association