Equity House Best Domestic 2013 Spotlight 10 March 2014...
20
Asiamoney’s 2013 Best Domestic Equity House Spotlight 10 March 2014 Disclosure: Bahana Securities does and seeks to do business with companies covered in its research reports. Investors should consider this report as only a single factor in making their investment decision. Please see the important disclaimer information on the back of this report *Based on consensus’ recent changes ↑ (up), ↓ (down), ↔ (unchanged) THIS RESEARCH REPORT IS NOT TO BE DISTRIBUTED TO ANY INVESTORS OR OTHER PERSONS IN THE UNITED STATES. IF ANY INVESTOR OR OTHER PERSON IN THE UNITED STATES MISTAKENLY RECEIVES OR OTHERWISE COMES INTO POSSESSION OF THIS RESEARCH REPORT, NONE OF DAIWA SECURITIES CO. LTD., PT. BAHANA SECURIITES OR ANY OF THEIR AFFIILIATES SHALL HAVE ANY RESPONSIBILITY FOR THE CONTENTS HEREOF OR FOR ANY SUBSEQUENT TRANSACTIONS EXECUTED IN RELIANCE HEREON. Palm Oil Conference notes: Enhanced outlook Improved sentiment from higher biodiesel demand and weather risk We attended the 25 th Palm Oil Conference (POC) 2014 earlier this month at the Shangri-La Hotel in Kuala Lumpur (exhibit 16). The conference, presented by Bursa Malaysia Derivatives Market, was attended by 1,593 registered delegates from over 50 countries. Several key speakers had mostly positive outlooks due to the higher biodiesel mandate and weather risk. However, some speakers also continued to see risks from improving production of other vegetable oils. Dorab Mistry of Godrej International believes the Malaysia CPO price could go as high as MYR3,500/ton if an El Nino weather pattern occurs and MYR3,000/ton if it does not occur. Similarly, James Fry of LMC International believes that, if the Brent oil price remains at USD110/barrel, the Rotterdam CPO price could reach USD1,030 this year. Thomas Mielke takes a slightly more conservative approach, estimating a Rotterdam CPO price of USD970/ton (exhibit 17). Mother nature: The wild card for the 2014 CPO price Weather is likely to be the key factor in determining the short-to-medium- term outlook for the CPO price. Mistry expects the seasonally low production cycle that has started last March 2013 to continue through May 2014. The continued unusually dry weather in Malaysia and some parts of Sumatera Island, which began at the beginning of this year, could lower production in the short (6 months) to medium term (24 months). Many speakers agreed that continued unsupportive weather in the next 2 weeks would disrupt harvesting activities, lowering already tight CPO supply. Additionally, based on the Predictive Ocean Atmosphere Model for Australia (POAMA), there is more than a 50% probability that an El Nino pattern would occur in the near future (exhibit 18), as the last El Nino was 4 years ago. While bad weather conditions would likely harm the CPO supply, we believe an El Nino pattern would disrupt a huge amount of CPO supply. During the last few El Nino and La Nina occurrences, the CPO price rose significantly (exhibit 19-20). Raised demand on higher biodiesel mandates in several countries Mistry believes that additional demand for biodiesel would be a game changer for global CPO supply-demand. Additionally, for 2014 Mistry expects biodiesel to absorb additional vegetable oil volume of 3mn tons, of which 1mn tons would be from the Indonesian biodiesel demand. In addition to Indonesia, Malaysia plans to apply a 5% biodiesel blending requirement. In South America, Brazil (up from 7% to 10%) and Argentina (up from 8% to 10%) also plan to increase their biodiesel blending requirements in 2014 (exhibit 21). Although additional demand for biodiesel should be a key factor supporting the CPO price outlook, few expect Indonesia to secure all 3.3mn kl of 2014F biodiesel supply. Mielke expects Pertamina to only secure 2.4mn tons of 2014F biofuel supply, which basically amounts only to the current supply secured from the first and the second tenders. Exhibit 1. Rating & target price summary Code Market cap Old New (USDm) Rating TP Rating TP AALI 3,783 BUY 28,000 BUY 35,000 SIMP 1,316 HOLD 800 BUY 1,100 LSIP 1,373 HOLD 2,000 BUY 2,550 BWPT 547 HOLD 1,300 BUY 1,550 ANJT 473 HOLD 1,600 BUY 1,850 SGRO 332 REDUCE 1,300 BUY 2,250 Sect or 7,825 NEUTRAL NEUTRAL Source: Bloomberg, Bahana (Based on closing price Friday 8 March 2014) Exhibit 2. Comparative valuations, 2014F Code CP PER EV/ha Div. yield ROE (IDR) (x) (USD) (%) (%) AALI 27,575 12.0 15,671 4.1 31.9 SIMP 955 13.2 6,450 2.9 8.1 LSIP 2,310 14.9 10,063 2.0 15.1 BWPT 1,405 17.1 13,555 0.9 15.6 ANJT 1,630 11.7 9,616 4.3 9.6 SGRO 2,015 13.8 5,721 2.2 6.5 Sector 13.1 12,200 3.2 21.4 Source: Bloomberg, Bahana Exhibit 3. Plantations sector relative to JCI 3.4 19.7 (0.7) 20.0 24.6 26.8 (5) 0 5 10 15 20 25 30 (5) 0 5 10 15 20 25 30 ytd 1M 3M 6M 9M 12M (%) (%) Plantations sector relative to JCI Source: Bloomberg, Bahana Exhibit 4. Relative performance to JCI, ytd 12.8 10.1 3.4 0.2 (0.2) (4.0) (8.9) (10) (5) 0 5 10 15 (10) (5) 0 5 10 15 SIMP LSIP Sector AALI ANJT BWPT SGRO (%) (%) Source: Bloomberg, Bahana Exhibit 5. Relative performance to JCI, 1M 29.4 28.7 19.7 19.6 6.7 5.3 (5.8) (10) (5) 0 5 10 15 20 25 30 35 (10) (5) 0 5 10 15 20 25 30 35 LSIP SIMP Sector AALI SGRO BWPT ANJT (%) (%) Source: Bloomberg, Bahana Indonesian Plantation Update Leonardo Henry Gavaza E-mail: [email protected] Phone: +6221 250 5081 ext. 3608 Neutral (Unchanged)
Transcript of Equity House Best Domestic 2013 Spotlight 10 March 2014...

Asiamoney’s
2013
Best Domestic
Equity House
Spotlight
10 March 2014
Disclosure: Bahana Securities does and seeks to do business with companies covered in its research reports. Investors should consider this report as only a single factor
in making their investment decision.
Please see the important disclaimer information on the back of this report
*Based on consensus’ recent changes ↑ (up), ↓ (down), ↔ (unchanged)
THIS RESEARCH REPORT IS NOT TO BE DISTRIBUTED TO ANY INVESTORS OR OTHER PERSONS IN THE UNITED STATES. IF ANY INVESTOR OR OTHER PERSON IN THE UNITED
STATES MISTAKENLY RECEIVES OR OTHERWISE COMES INTO POSSESSION OF THIS RESEARCH REPORT, NONE OF DAIWA SECURITIES CO. LTD., PT. BAHANA SECURIITES OR ANY OF THEIR AFFIILIATES SHALL HAVE ANY RESPONSIBILITY FOR THE CONTENTS HEREOF OR FOR ANY SUBSEQUENT TRANSACTIONS EXECUTED IN RELIANCE HEREON.
Palm Oil Conference notes: Enhanced outlook
Improved sentiment from higher biodiesel demand and weather risk
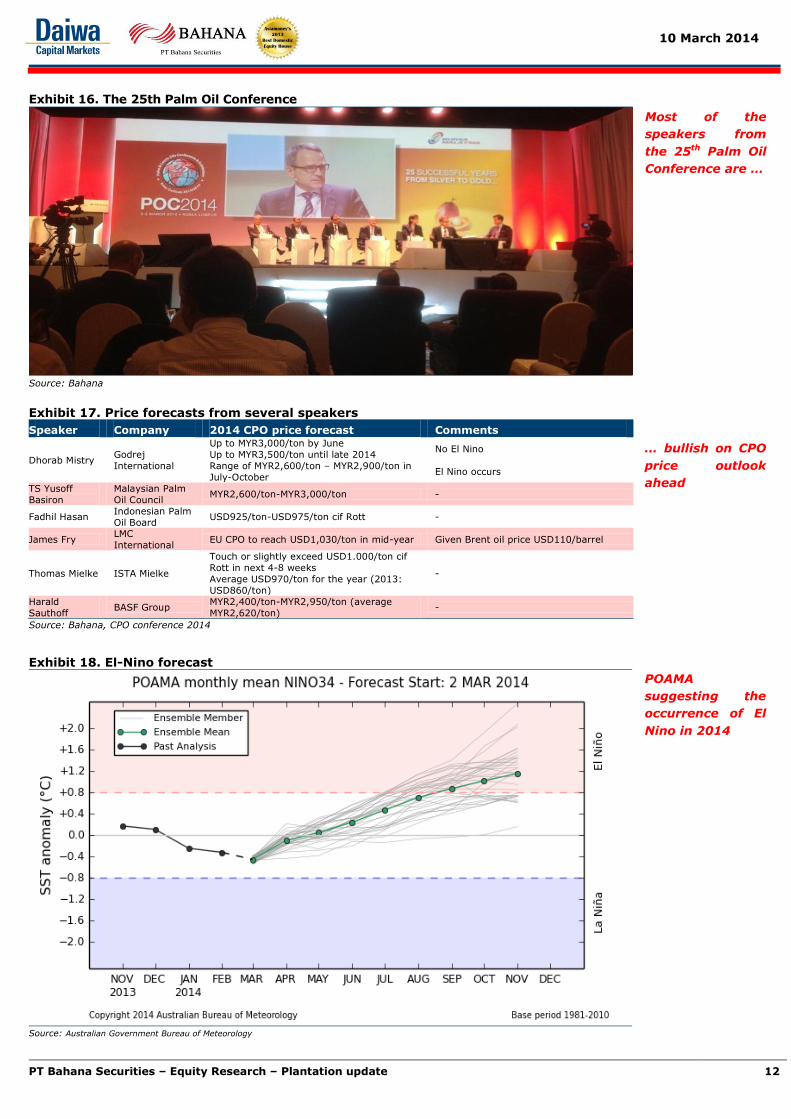
We attended the 25th Palm Oil Conference (POC) 2014 earlier this month at
the Shangri-La Hotel in Kuala Lumpur (exhibit 16). The conference,
presented by Bursa Malaysia Derivatives Market, was attended by 1,593
registered delegates from over 50 countries. Several key speakers had
mostly positive outlooks due to the higher biodiesel mandate and weather
risk. However, some speakers also continued to see risks from improving
production of other vegetable oils. Dorab Mistry of Godrej International
believes the Malaysia CPO price could go as high as MYR3,500/ton if an El
Nino weather pattern occurs and MYR3,000/ton if it does not occur.
Similarly, James Fry of LMC International believes that, if the Brent oil price
remains at USD110/barrel, the Rotterdam CPO price could reach USD1,030
this year. Thomas Mielke takes a slightly more conservative approach,
estimating a Rotterdam CPO price of USD970/ton (exhibit 17).
Mother nature: The wild card for the 2014 CPO price
Weather is likely to be the key factor in determining the short-to-medium-
term outlook for the CPO price. Mistry expects the seasonally low production
cycle that has started last March 2013 to continue through May 2014. The
continued unusually dry weather in Malaysia and some parts of Sumatera
Island, which began at the beginning of this year, could lower production in
the short (6 months) to medium term (24 months). Many speakers agreed
that continued unsupportive weather in the next 2 weeks would disrupt
harvesting activities, lowering already tight CPO supply. Additionally, based
on the Predictive Ocean Atmosphere Model for Australia (POAMA), there is
more than a 50% probability that an El Nino pattern would occur in the near
future (exhibit 18), as the last El Nino was 4 years ago. While bad weather
conditions would likely harm the CPO supply, we believe an El Nino pattern
would disrupt a huge amount of CPO supply. During the last few El Nino and
La Nina occurrences, the CPO price rose significantly (exhibit 19-20).
Raised demand on higher biodiesel mandates in several countries
Mistry believes that additional demand for biodiesel would be a game
changer for global CPO supply-demand. Additionally, for 2014 Mistry expects
biodiesel to absorb additional vegetable oil volume of 3mn tons, of which
1mn tons would be from the Indonesian biodiesel demand. In addition to
Indonesia, Malaysia plans to apply a 5% biodiesel blending requirement. In
South America, Brazil (up from 7% to 10%) and Argentina (up from 8% to
10%) also plan to increase their biodiesel blending requirements in 2014
(exhibit 21). Although additional demand for biodiesel should be a key factor
supporting the CPO price outlook, few expect Indonesia to secure all 3.3mn
kl of 2014F biodiesel supply. Mielke expects Pertamina to only secure 2.4mn
tons of 2014F biofuel supply, which basically amounts only to the current
supply secured from the first and the second tenders.
Exhibit 1. Rating & target price summary
Code Market
cap
Old
New
(USDm) Rating TP
Rating TP
AALI 3,783 BUY 28,000 BUY 35,000
SIMP 1,316 HOLD 800 BUY 1,100
LSIP 1,373 HOLD 2,000 BUY 2,550
BWPT 547 HOLD 1,300 BUY 1,550
ANJT 473 HOLD 1,600 BUY 1,850
SGRO 332 REDUCE 1,300 BUY 2,250
Sect
or 7,825 NEUTRAL NEUTRAL
Source: Bloomberg, Bahana
(Based on closing price Friday 8 March 2014)
Exhibit 2. Comparative valuations, 2014F
Code CP PER EV/ha Div.
yield ROE
(IDR) (x) (USD) (%) (%)
AALI 27,575 12.0 15,671 4.1 31.9
SIMP 955 13.2 6,450 2.9 8.1
LSIP 2,310 14.9 10,063 2.0 15.1
BWPT 1,405 17.1 13,555 0.9 15.6
ANJT 1,630 11.7 9,616 4.3 9.6
SGRO 2,015 13.8 5,721 2.2 6.5
Sector 13.1 12,200 3.2 21.4
Source: Bloomberg, Bahana
Exhibit 3. Plantations sector relative to JCI
3.4
19.7
(0.7)
20.0
24.6
26.8
(5)
0
5
10
15
20
25
30
(5)
0
5
10
15
20
25
30
ytd 1M 3M 6M 9M 12M
(%) (%)
Plantations sector relative to JCI Source: Bloomberg, Bahana
Exhibit 4. Relative performance to JCI, ytd
12.8
10.1
3.4
0.2
(0.2)
(4.0)
(8.9) (10)
(5)
0
5
10
15
(10)
(5)
0
5
10
15
SIMP LSIP Sector AALI ANJT BWPT SGRO
(%)(%)
Source: Bloomberg, Bahana
Exhibit 5. Relative performance to JCI, 1M
29.4 28.7
19.7 19.6
6.7 5.3
(5.8)(10)
(5)
0
5
10
15
20
25
30
35
(10)
(5)
0
5
10
15
20
25
30
35
LSIP SIMP Sector AALI SGRO BWPT ANJT
(%)(%)
Source: Bloomberg, Bahana
Indonesian Plantation Update
Leonardo Henry Gavaza E-mail: [email protected]
Phone: +6221 250 5081 ext. 3608
Neutral
(Unchanged)

10 March 2014
PT Bahana Securities – Equity Research – Plantation update 2
Asiamoney’s
2013
Best Domestic
Equity House
Risk from higher production of other vegetable oils
We believe there is still downward risk for the CPO price, as Mielke expects
2014 world vegetable oil production to reach 559k tons, up 6% y-y (exhibit
23). However, some vegetable oils cannot be exported given extremely high
export taxes (Argentina) and severe logistic problems (South America and
Canada). We expect higher world edible oil production in 2H14.
CPO price: Possible beyond the psychological level of USD1,000/ton
Support for CPO price will stem from low CPO production in the short to
medium term due to poor weather conditions in our view. Through 1H14,
we expect CPO production to be low in Indonesia and Malaysia (exhibit 24),
coinciding with huge demand on Lebaran festivities at end-1H14, pushing
inventory levels down further. We expect the CPO price to surpass the
psychological level of USD1,000/ton during 1H14 (exhibit 25). However, we
think a revisit to below USD1,000/ton in 2H14 on seasonality is likely, before
continuing its strong momentum in 2015 as production volumes should be
affected by current dry weather conditions. Thus, we raise our Rotterdam
CPO expectation from USD871/ton to USD964/ton (MPOB price:
MYR2,859/ton), up 13% y-y in 2014, and from USD915/ton to
USD1,025/ton (MPOB price: MYR3,025/ton), up 6% y-y in 2015 (exhibit 26).
At this stage, we have not included an El Nino risk in our numbers.
Improving outlook, but still a Neutral with AALI as our top pick
At current cycle, positive sentiment from higher CPO prices could be offset
by stronger IDR in our view. Hence, our NEUTRAL rating on the sector
remains (exhibit 1). Nevertheless, on the back of raised CPO prices, we
have upgraded our target prices and ratings. On valuation, the sector is
currently more attractive on 2014F PE of 13.1x (exhibit 2), a 32% discount
to its Malaysian peers. Our top pick remains AALI due to its strong long-term
growth potential (exhibit 10) on solid planting activities as well as
manageable cost structure. We maintain our BUY rating for AALI but raise
our target price to IDR35,000 from IDR28,000. We upgrade all of our
remaining plantation companies to BUY as we expect continued dry weather
to boost the CPO price, supporting the sector’s recent market
outperformance (nearly 20% in the past month). Risks to our
recommendations include continued stronger local currency against the USD,
lower-than-expected CPO prices as well as higher-than-expected labor (some
40% of COGS) and fertilizer costs (some 30% of COGS).
Exhibit 6. Relative performance to JCI, 3M
4.0
0.3
(0.4) (0.7)
(2.7)
(8.8)
(10.8)(12)
(10)
(8)
(6)
(4)
(2)
0
2
4
(12)
(10)
(8)
(6)
(4)
(2)
0
2
4
LSIP SIMP AALI Sector ANJT BWPT SGRO
(%)(%)
Source: Bloomberg, Bahana
Exhibit 7. Relative performance to JCI, 6M
41.0 38.9
20.0
16.2 14.0
5.7
(6.7) (10)
0
10
20
30
40
50
(10)
0
10
20
30
40
50
BWPT LSIP Sector AALI SIMP ANJT SGRO
(%)(%)
Source: Bloomberg, Bahana
Exhibit 8. Relative performance to JCI, 9M
43.6
31.9
24.6
16.9 16.7
11.3
6.9
0
5
10
15
20
25
30
35
40
45
50
0
5
10
15
20
25
30
35
40
45
50
BWPT AALI Sector LSIP ANJT SIMP SGRO
(%)(%)
Source: Bloomberg, Bahana
Exhibit 9. Relative performance to JCI, 12M
48.5
39.2
26.8
16.0
9.8
(7.1)(12.9)
(20)
(10)
0
10
20
30
40
50
(20)
(10)
0
10
20
30
40
50
AALI ANJT Sector LSIP BWPT SGRO SIMP
(%)(%)
Source: Bloomberg, Bahana

10 March 2014
PT Bahana Securities – Equity Research – Plantation update 3
Asiamoney’s
2013
Best Domestic
Equity House
AALI: Downstream support; Maintain BUY
Due to our fine-tuning as a result of 2013 full-year earnings results, for 2014-15 we downgrade our production
estimates by 4-5% on expectations of unsupportive weather conditions and raise our CPO price assumptions by 5-8%
on an improving CPO price outlook. Thus, we upgrade our earnings by 18-23% for 2014-15F. Following the successful
commercial operation of its first CPO refinery, AALI plans to build another refinery with 600k tpa capacity, with commercial
production expected in 2016. With the support of a stronger FFB nucleus production increase of 3% y-y, an improved
CPO price of IDR8.8mn, up 21% y-y, and additional sales from its CPO refinery, we expect AALI’s 2014 revenue to
reach IDR19.8t, up 56% y-y, resulting in 2014 earnings of IDR3.6t, up 100% y-y. Long-term growth prospects look
attractive on solid planting activities as well as manageable cost structure. With its big cap status, strong corporate
governance and transparency, we expect AALI to trade at a 2014 PE of 16.4x, a 20% discount to its Malaysian peers,
translating into a target price of IDR35,000. BUY.
Exhibit 10. AALI IJ Earnings revisions
Year-end 31 Dec Old New Change (%)
2013A 2014F 2015F 2013A 2014F 2015F 2013A 2014F 2015F
Sales 12,675 18,846 22,487 12,675 19,760 22,885 - 4.9 1.8
Gross profit 4,082 5,249 5,853 4,082 6,164 6,606 - 17.4 12.9
Gross margin (%) 32.2 27.9 26.0 32.2 31.2 28.9
Operating profit 3,005 3,879 4,307 3,005 4,793 5,058 - 23.6 17.4
Operating margin (%) 23.7 20.6 19.2 23.7 24.3 22.1
Net profit 1,801 2,925 3,157 1,801 3,606 3,726 - 23.3 18.0
Net margin (%) 14.2 15.5 14.0 14.2 18.2 16.3
EPS (IDR) 1,144 1,857 2,005 1,144 2,290 2,366 - 23.3 18.0
Source: Company, Bahana estimates
SIMP: Earnings bottoming out; Upgrade to BUY
For 2014-15, we cut our production expectations by 1-2% on unsupportive weather conditions, and we increase our CPO
price assumptions by 5-8% due to improving sentiment, resulting in earnings upgrades of 19-33%. We expect 2014 FFB
nucleus production to recover to 3mk tons, up 4% y-y, and 2014 edible oil sales volumes of 826k tons, up 4% y-y. We
expect 2014 revenue to reach IDR15.18t, up 19% y-y, while improved margin and forex losses should result in a 113% y-y
increase in 2014 earnings to IDR1,114bn. As we believe earnings have bottomed and future growth is strong on improved
CPO sentiment, we upgrade our rating on SIMP from HOLD to BUY with a new target price of IDR1,100, reflecting a 2014F
PE of 15.2x, a 20% discount to Malaysian peers.
Exhibit 11. SIMP IJ Earnings revisions
Year-end 31 Dec Old New Change (%)
2013A 2014F 2015F 2013A 2014F 2015F 2013A 2014F 2015F
Sales (IDRb) 13,280 15,872 17,321 13,280 15,831 16,828 - (0.3) (2.8)
Gross profit (IDRb) 2,947 3,654 4,019 2,947 4,111 4,288 - 12.5 6.7
Gross margin (%) 22.2 23.0 23.2 22.2 26.0 25.5
Operating profit (IDRb) 1,586 1,932 2,192 1,586 2,533 2,629 - 31.1 19.9
Operating margin (%) 11.9 12.2 12.7 11.9 16.0 15.6
Net profit (IDRb) 524 839 939 524 1,114 1,117 - 32.8 19.0
Net margin (%) 3.9 5.3 5.4 3.9 7.0 6.6
EPS (IDR) 33 53 59 33 70 71 - 32.8 19.0
Source: Bahana estimates

10 March 2014
PT Bahana Securities – Equity Research – Plantation update 4
Asiamoney’s
2013
Best Domestic
Equity House
LSIP: Enhanced conditions; Upgrade to BUY
In 2014-15, we downgrade our production estimates by 3-4% on unsupportive weather and upgrade our CPO price
assumptions by 5-8% on the improving CPO outlook. Thus, we upgrade our earnings by 11-19% for 2014-15F. With an
average estate age of 12 years, LSIP’s high productive estate proportion of 64% should support its yields in 2014-15.
LSIP plans to continue new plantings of 5k ha per annum in the next few years, with 2014 capex reaching IDR1tn,
supported by a strong cash position of IDR1.3tn. We expect 2014 CPO production to improve to 407k tons, up 3% y-y,
on dry weather despite improving age structure. We believe a higher CPO price of IDR8.8mn, up 21% y-y, would
support 2014 revenue of IDR4.7tn, up 14% y-y, resulting in 2014 earnings of IDR1.1tn, up 38% y-y. We upgrade our
recommendation on LSIP from HOLD to BUY with new target price of IDR2,550, reflecting a 2014F PE of 17.1x, a 10%
discount to the Malaysian sector, considering its low EV/ha of USD10,063 (18% discount to the sector).
Exhibit 12. LSIP IJ Earnings revisions
Year-end 31 Dec Old New Change (%)
2013A 2014F 2015F 2013A 2014F 2015F 2013A 2014F 2015F
Sales (IDRb) 4,134 4,509 4,821 4,134 4,693 4,927 - 4.1 2.2
Gross profit (IDRb) 1,253 1,537 1,719 1,253 1,723 1,840 - 12.1 7.0
Gross margin (%) 30.3 34.1 35.7 30.3 36.7 37.3
Operating profit (IDRb) 818 1,040 1,172 818 1,239 1,305 - 19.2 11.3
Operating margin (%) 19.8 23.1 24.3 19.8 26.4 26.5
Net profit (IDRb) 769 895 1,006 769 1,060 1,115 - 18.5 10.8
Net margin (%) 18.6 19.9 20.9 18.6 22.6 22.6
EPS (IDR) 113 131 147 113 155 163 - 18.5 10.8
Source: Bahana estimates
BWPT: 11-16% earnings upgrades for 2014-15F; Raise to BUY
For 2014-15, we cut our production estimates by 2-7% on unsupportive weather and upgrade our CPO price
assumptions by 5-8% on an improving CPO outlook. Thus, we raise BWPT’s 2014-15F earnings by 11-16%. We expect
2014 revenues to grow 44% y-y to IDR1.7t, while improved margins should result in a 134% y-y increase in 2014F
earnings to IDR354b. On improved sentiment for a higher CPO price, we upgrade our rating on BWPT from HOLD to BUY
with a new target price of IDR1,550, equating to a 2014F PE of 18.9x, at par with its Malaysian peers considering BWPT’s
solid long-term outlook.
Exhibit 13. BWPT IJ Earnings revisions
Year-end 31 Dec Old New Change (%)
2013F 2014F 2015F 2013F 2014F 2015F 2013F 2014F 2015F
Sales (IDRb) 1,177 1,695 2,150 1,177 1,700 2,200 - 0.3 2.3
Gross profit (IDRb) 490 812 1,059 490 858 1,146 - 5.6 8.2
Gross margin (%) 41.6 47.9 49.3 41.6 50.5 52.1
Operating profit (IDRb) 286 574 779 286 620 865 - 8.0 11.0
Operating margin (%) 24.3 33.8 36.2 24.3 36.4 39.3
Net profit (IDRb) 151 320 417 151 354 482 - 10.9 15.7
Net margin (%) 12.8 18.9 19.4 12.8 20.8 21.9
EPS (IDR) 35 74 96 35 82 112 - 10.9 15.7
Source: Bahana estimates
Note: 2013 earnings have not yet been released

10 March 2014
PT Bahana Securities – Equity Research – Plantation update 5
Asiamoney’s
2013
Best Domestic
Equity House
ANJT: Compelling Papua story; Reiterate BUY
In 2014-15, we cut our production estimates by 5% per year on unsupportive weather and upgrade our CPO price
assumptions by 5-8% on an improving CPO outlook. Thus, we upgrade our ANJT earnings for 2014-15F by 1-9%. We
expect 2014 revenue to reach USD178m, up 16% y-y, while improved margins should result in a 76% y-y increase in 2014
earnings to USD40m. We believe ANJT still has a compelling story on CPO and sago expansions in Papua Island. Therefore,
we reiterate our BUY recommendation on ANJT, considering the stock’s solid longer-term outlook, with a new target price
of IDR1,850, reflecting a 2014F PE of 13.3x, a 31% discount to the Malaysian sector due to a small-cap discount.
Exhibit 14. ANJT IJ Earnings revisions
Year-end 31 Dec Old New Change (%)
2013F 2014F 2015F 2013F 2014F 2015F 2013F 2014F 2015F
Sales (USDm) 154 175 205 154 178 205 - 1.9 (0.4)
Gross profit (USDm) 52 68 85 52 72 85 - 5.9 0.4
Gross margin (%) 33.6 38.9 41.4 33.6 40.4 41.7
Operating profit (USDm) 24 41 55 24 45 55 - 8.4 0.9
Operating margin (%) 15.3 23.7 26.7 15.3 25.2 27.0
Net profit (USDm) 23 37 46 23 40 46 - 7.8 0.9
Net margin (%) 14.8 21.3 22.2 14.8 22.5 22.5
EPS (IDR) 79 129 158 79 139 159 - 7.8 0.9
Source: Bahana estimates
Note: 2013 earnings have not yet been released
SGRO: Sector support; Upgrade to BUY
We raise SGRO’s earnings by 53% for 2014F and 27% for 2015F on higher expected CPO prices. We look for unpredictable
extreme weather to lead to 10.9% y-y FFB production in 2014 and result in an increase in the CPO ASP to IDR8.7mn/ton,
up 18% y-y. We expect SGRO’s 2014 revenue to reach IDR2.8t, up 31% y-y, resulting in 2014 earnings of IDR275bn,
up 179% y-y. We upgrade our recommendation on SGRO from REDUCE to BUY considering high EPS growth. SGRO is
attractive given a new target price of IDR2,250 reflecting a 2014F PE of 15.5x, even after taking into account a 21%
discount to the Malaysian sector due to a small-cap discount. To support growth, SGRO plans to increase production with
new CPO plantings of 10k ha, from 4-6k ha previously, in line with CPO price increase expectations on biodiesel
mandates. The company is also adding rubber plantings of 2-3k ha and 1-2k ha of sago.
Exhibit 15. SGRO IJ Earnings revisions
Year-end 31 Dec Old New Change (%)
2013F 2014F 2015F 2013F 2014F 2015F 2013F 2014F 2015F
Sales (IDRb) 2,174 2,648 2,992 2,174 2,842 3,122 - 7.3 4.4
Gross profit (IDRb) 423 639 735 423 760 809 - 19.0 10.1
Gross margin (%) 19.4 24.1 24.6 19.4 26.7 25.9
Operating profit (IDRb) 192 352 422 192 471 495 - 33.9 17.2
Operating margin (%) 8.8 13.3 14.1 8.8 16.6 15.9
Net profit (IDRb) 98 179 225 98 275 285 - 53.3 26.6
Net margin (%) 4.5 6.8 7.5 4.5 9.7 9.1
EPS (IDR) 52 95 119 52 146 151 - 53.3 26.6
Source: Bahana estimates
Note: 2013 earnings have not yet been released
10 March 2014
PT Bahana Securities – Equity Research – Plantation update 6
Asiamoney’s
2013
Best Domestic
Equity House
Source: Company, Bahana estimates
Leonardo Henry Gavaza ([email protected]) +6221 2505081 ext. 3608
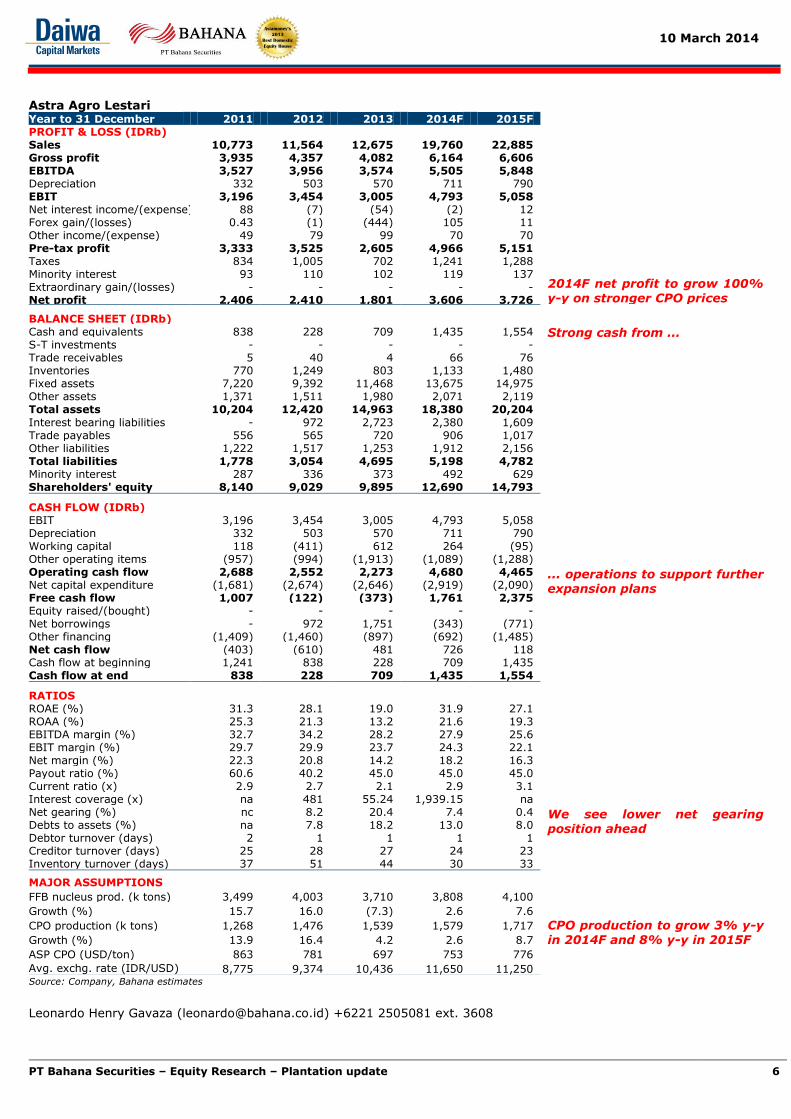
Astra Agro Lestari
Year to 31 December 2011 2012 2013 2014F 2015F
PROFIT & LOSS (IDRb)
Sales 10,773 11,564 12,675 19,760 22,885
2014F net profit to grow 100% y-y on stronger CPO prices
Gross profit 3,935 4,357 4,082 6,164 6,606 EBITDA 3,527 3,956 3,574 5,505 5,848 Depreciation 332 503 570 711 790 EBIT 3,196 3,454 3,005 4,793 5,058 Net interest income/(expense) 88 (7) (54) (2) 12 Forex gain/(losses) 0.43 (1) (444) 105 11 Other income/(expense) 49 79 99 70 70 Pre-tax profit 3,333 3,525 2,605 4,966 5,151 Taxes 834 1,005 702 1,241 1,288 Minority interest 93 110 102 119 137 Extraordinary gain/(losses) - - - - - Net profit 2,406 2,410 1,801 3,606 3,726 BALANCE SHEET (IDRb) Cash and equivalents 838 228 709 1,435 1,554 Strong cash from ... S-T investments - - - - - Trade receivables 5 40 4 66 76 Inventories 770 1,249 803 1,133 1,480 Fixed assets 7,220 9,392 11,468 13,675 14,975 Other assets 1,371 1,511 1,980 2,071 2,119 Total assets 10,204 12,420 14,963 18,380 20,204
Interest bearing liabilities - 972 2,723 2,380 1,609 Trade payables 556 565 720 906 1,017 Other liabilities 1,222 1,517 1,253 1,912 2,156 Total liabilities 1,778 3,054 4,695 5,198 4,782 Minority interest 287 336 373 492 629 Shareholders' equity 8,140 9,029 9,895 12,690 14,793
CASH FLOW (IDRb) EBIT 3,196 3,454 3,005 4,793 5,058
... operations to support further expansion plans
Depreciation 332 503 570 711 790 Working capital 118 (411) 612 264 (95) Other operating items (957) (994) (1,913) (1,089) (1,288) Operating cash flow 2,688 2,552 2,273 4,680 4,465 Net capital expenditure (1,681) (2,674) (2,646) (2,919) (2,090) Free cash flow 1,007 (122) (373) 1,761 2,375 Equity raised/(bought) - - - - - Net borrowings - 972 1,751 (343) (771) Other financing (1,409) (1,460) (897) (692) (1,485) Net cash flow (403) (610) 481 726 118 Cash flow at beginning 1,241 838 228 709 1,435 Cash flow at end 838 228 709 1,435 1,554
RATIOS ROAE (%) 31.3 28.1 19.0 31.9 27.1
We see lower net gearing position ahead
ROAA (%) 25.3 21.3 13.2 21.6 19.3 EBITDA margin (%) 32.7 34.2 28.2 27.9 25.6 EBIT margin (%) 29.7 29.9 23.7 24.3 22.1 Net margin (%) 22.3 20.8 14.2 18.2 16.3 Payout ratio (%) 60.6 40.2 45.0 45.0 45.0 Current ratio (x) 2.9 2.7 2.1 2.9 3.1 Interest coverage (x) na 481 55.24 1,939.15 na Net gearing (%) nc 8.2 20.4 7.4 0.4 Debts to assets (%) na 7.8 18.2 13.0 8.0 Debtor turnover (days) 2 1 1 1 1 Creditor turnover (days) 25 28 27 24 23 Inventory turnover (days) 37 51 44 30 33
MAJOR ASSUMPTIONS
FFB nucleus prod. (k tons) 3,499 4,003 3,710 3,808 4,100 CPO production to grow 3% y-y in 2014F and 8% y-y in 2015F
Growth (%) 15.7 16.0 (7.3) 2.6 7.6
CPO production (k tons) 1,268 1,476 1,539 1,579 1,717
Growth (%) 13.9 16.4 4.2 2.6 8.7
ASP CPO (USD/ton) 863 781 697 753 776
Avg. exchg. rate (IDR/USD) 8,775 9,374 10,436 11,650 11,250

10 March 2014
PT Bahana Securities – Equity Research – Plantation update 7
Asiamoney’s
2013
Best Domestic
Equity House
Source: Company, Bahana estimates
Leonardo Henry Gavaza ([email protected]) +6221 2505081 ext. 3608
Salim Ivomas Pratama
Year to 31 December 2011 2012 2013 2014F 2015F
PROFIT & LOSS (IDRb)
Sales 12,605 13,845 13,280 15,831 16,828
2014F net profit to grow 119%
on margin improvement and forex movements
Gross profit 4,342 3,894 2,947 4,111 4,288 EBITDA 3,917 3,408 2,504 3,556 3,817 Depreciation 675 806 918 1,023 1,188 EBIT 3,242 2,603 1,586 2,533 2,629 Net interest income/(expense) (260) (309) (401) (588) (606) Forex gain/(losses) 47 (47) (176) 90 - Other income/(expense) (117) (235) (75) (75) (75) Pre-tax profit 2,912 2,012 934 1,960 1,949 Taxes 661 496 299 490 487 Minority interest 585 359 111 356 344 Extraordinary gain/(losses) - - - - - Net profit 1,667 1,157 524 1,114 1,117 BALANCE SHEET (IDRb) Cash and equivalents 5,046 3,449 2,113 1,993 1,242
Debt likely to be maintained at current level going forward
S-T investments - - - - - Trade receivables 1,006 1,034 1,130 1,266 1,346 Inventories 1,678 1,889 1,568 1,979 2,104 Fixed assets 6,325 7,743 9,074 10,400 11,626 Other assets 18,035 19,560 23,075 21,894 21,576 Total assets 25,510 26,574 28,065 29,618 30,589
Interest bearing liabilities 7,260 6,780 7,886 7,886 7,886 Trade payables 433 661 664 781 836 Other liabilities 2,646 3,041 3,407 3,832 3,973 Total liabilities 10,339 10,482 11,957 12,499 12,695 Minority interest 2,423 2,515 2,440 2,547 2,650 Shareholders' equity 12,748 13,577 13,668 14,572 15,244
CASH FLOW (IDRb) EBIT 3,242 2,603 1,586 2,533 2,629
Capex to be around IDR3t level
Depreciation 675 806 918 1,023 1,188 Working capital (365) 172 152 (293) (94) Other operating items (1,648) (1,764) (1,859) (488) (1,470) Operating cash flow 1,904 1,817 797 2,775 2,253 Net capital expenditure (1,601) (2,753) (2,917) (2,792) (2,662) Free cash flow 303 (937) (2,120) (17) (409) Equity raised/(bought) 3,349 4 (85) - - Net borrowings (1,233) (480) 1,106 - - Other financing 454 (185) (237) (103) (342) Net cash flow 2,872 (1,597) (1,336) (120) (751) Cash flow at beginning 2,174 5,046 3,449 2,113 1,993 Cash flow at end 5,046 3,449 2,113 1,993 1,242
RATIOS ROAE (%) 16.3 8.8 3.8 7.9 7.5
EBITDA margin expected to be around 23% level
ROAA (%) 7.2 4.4 1.9 3.9 3.7 EBITDA margin (%) 31.1 24.6 18.9 22.5 22.7 EBIT margin (%) 25.7 18.8 11.9 16.0 15.6 Net margin (%) 13.2 8.4 3.9 7.0 6.6 Payout ratio (%) 19.9 30.1 40.0 40.0 40.0 Current ratio (x) 17.9 9.6 7.2 6.7 5.6 Interest coverage (x) 12.5 8.4 4.0 4.3 4.3 Net gearing (%) 17.4 24.5 42.2 40.4 43.6 Debts to assets (%) 28.5 25.5 28.1 26.6 25.8 Debtor turnover (days) 27 27 29 29 29 Creditor turnover (days) 17 24 24 24 24 Inventory turnover (days) 66 65 49 46 46
MAJOR ASSUMPTIONS
FFB nucleus prod. (k tons) 2,797 2,973 2,895 3,015 3,244 CPO production to grow 4% y-y in 2014F and 8% y-y in 2015F
Growth (%) 9.1 6.3 (2.6) 4.1 7.6
CPO production (k tons) 838 880 810 855 924
Growth (%) 13.2 5.0 (8.0) 5.5 8.2
ASP CPO (USD/ton) 859 791 685 753 776
Avg. exchg. rate (IDR/USD) 8,775 9,374 10,436 11,650 11,250

10 March 2014
PT Bahana Securities – Equity Research – Plantation update 8
Asiamoney’s
2013
Best Domestic
Equity House
Source: Company, Bahana estimates
Leonardo Henry Gavaza ([email protected]) +6221 2505081 ext. 3608
London Sumatra Indonesia
Year to 31 December 2011 2012 2013 2014F 2015F
PROFIT & LOSS (IDRb)
Sales 4,686 4,212 4,134 4,693 4,927
2014F net profit to grow 38% y-y
Gross profit 2,362 1,681 1,253 1,723 1,840 EBITDA 2,132 1,426 993 1,476 1,582 Depreciation 138 150 175 236 277 EBIT 1,993 1,276 818 1,239 1,305 Net interest income/(expense) 87 85 44 46 47 Forex gain/(losses) - - - - - Other income/(expense) 11 11 135 40 42 Pre-tax profit 2,091 1,372 997 1,325 1,394 Taxes (389) (257) (228) (265) (279) Minority interest - - - - - Extraordinary gain/(losses) - - - - - Net profit 1,702 1,116 769 1,060 1,115 BALANCE SHEET (IDRb) Cash and equivalents 2,064 1,799 1,401 1,338 1,439 Strong cash position of around
IDR1.3-1.4tn in 2014-15F … S-T investments - - - - - Trade receivables 101 37 92 67 77 Inventories 368 646 374 396 412 Fixed assets 3,901 4,474 5,270 5,976 6,640 Other assets 358 595 837 926 977 Total assets 6,792 7,552 7,975 8,704 9,545 Interest bearing liabilities - - - - - Trade payables 112 299 311 74 76 Other liabilities 840 973 1,050 1,208 1,250 Total liabilities 952 1,272 1,361 1,282 1,326 Minority interest 0 1 0 - - Shareholders' equity 5,839 6,280 6,614 7,422 8,219
CASH FLOW (IDRb) EBIT 1,993 1,276 818 1,239 1,305
… to support its expansion plans ahead
Depreciation 138 150 175 236 277 Working capital (267) (45) 214 (152) (27) Other operating items (314) (182) (50) (178) (190) Operating cash flow 1,551 1,199 1,157 1,146 1,365 Net capital expenditure (289) (869) (1,198) (1,031) (977)
Free cash flow 1,262 330 (41) 115 387 Equity raised/(bought) - - - - - Net borrowings - - - - - Other financing (358) (594) (358) (178) (287) Net cash flow 903 (264) (399) (63) 100 Cash flow at beginning 1,161 2,064 1,799 1,401 1,338 Cash flow at end 2,064 1,799 1,401 1,338 1,439
RATIOS ROAE (%) 32.7 18.4 11.9 15.1 13.6
EBITDA margin expected to be above 30%
ROAA (%) 27.5 15.6 9.9 12.7 12.2 EBITDA margin (%) 45.5 33.9 24.0 31.4 32.1 EBIT margin (%) 42.5 30.3 19.8 26.4 26.5 Net margin (%) 36.3 26.5 18.6 22.6 22.6 Payout ratio (%) 40.1 40.3 30.0 30.0 30.0 Current ratio (x) 22.6 8.3 6.0 24.4 25.4 Interest coverage (x) na na na na na Net gearing (%) nc nc nc nc nc Debts to assets (%) - - - - - Debtor turnover (days) 5 6 18 5 6 Creditor turnover (days) 8 6 6 6 6 Inventory turnover (days) 50 73 46 49 49
MAJOR ASSUMPTIONS
FFB nucleus prod. (k tons) 1,291 1,315 1,250 1,292 1,376 Production to grow 3% y-y in
2014F before growing at 6.5%
y-y in 2015F
Growth (%) 10.3 1.8 (4.9) 3.4 6.5
CPO production (k tons) 443 448 396 407 434
Growth (%) 21.1 1.2 (11.5) 2.7 6.5
ASP CPO (USD/ton) 860 787 686 753 776
Avg. exchg. rate (IDR/USD) 8,775 9,374 10,436 11,650 11,250

10 March 2014
PT Bahana Securities – Equity Research – Plantation update 9
Asiamoney’s
2013
Best Domestic
Equity House
Source: Company, Bahana estimates
Leonardo Henry Gavaza ([email protected]) +6221 2505081 ext. 3608
BW Plantation
Year to 31 December 2011 2012 2013 2014F 2015F
PROFIT & LOSS (IDRb)
Sales 888 944 1,177 1,700 2,200
Net profit to grow 134% y-y in 2014F and by 36% y-y in 2015F
Gross profit 614 571 490 858 1,146 EBITDA 532 515 458 838 1,113 Depreciation 49 98 172 219 248 EBIT 483 417 286 620 865 Net interest income/(expense) (56) (66) (81) (149) (222) Forex gain/(losses) (0) (1) (4) 2 0 Other income/(expense) 3 1 - - - Pre-tax profit 430 351 202 473 643 Taxes 110 89 50 118 161 Minority interest - - - - - Extraordinary gain/(losses) - - - - - Net profit 320 262 151 354 482 BALANCE SHEET (IDRb) Cash and equivalents 58 51 203 247 403
Increasing trend in total assets in line with …
S-T investments 182 25 25 25 25 Trade receivables 3 13 24 34 44 Inventories 169 216 177 197 271 Fixed assets 772 1,510 2,948 3,929 4,496 Other assets 2,405 3,099 2,877 2,828 3,110 Total assets 3,589 4,913 6,253 7,260 8,349 Interest bearing liabilities 1,800 2,822 3,502 4,176 4,813 Trade payables 209 212 305 306 329 Other liabilities 114 174 294 294 294 Total liabilities 2,124 3,207 4,101 4,776 5,436 Minority interest - - - - - Shareholders' equity 1,426 1,666 2,113 2,445 2,874
CASH FLOW (IDRb) EBIT 483 417 286 620 865
… the company’s capex for expansion purposes
Depreciation 49 98 172 219 248 Working capital (219) (119) 249 (82) (112) Other operating items (172) (156) (135) (265) (383) Operating cash flow 141 240 572 491 619 Net capital expenditure (1,130) (1,404) (1,395) (1,099) (1,046)
Free cash flow (989) (1,165) (823) (608) (427) Equity raised/(bought) 6 8 344 - - Net borrowings 611 1,022 680 674 636 Other financing (29) (30) (49) (23) (53) Net cash flow (402) (165) 153 44 156 Cash flow at beginning 499 58 51 203 247 Cash flow at end 58 51 203 247 403
- - - - RATIOS ROAE (%) 25.1 17.0 8.0 15.6 18.1
EBITDA margin to recover to
above 50% in 2015F
ROAA (%) 10.3 6.2 2.7 5.2 6.2 EBITDA margin (%) 59.9 54.6 38.9 49.3 50.6 EBIT margin (%) 54.4 44.2 24.3 36.4 39.3 Net margin (%) 36.1 27.8 12.8 20.8 21.9 Payout ratio (%) 15.1 18.5 15.0 15.0 15.0 Current ratio (x) 1.1 1.3 1.3 1.6 2.2 Interest coverage (x) 8.7 6.4 3.5 4.2 3.9 Net gearing (%) 122.2 166.3 156.1 160.7 153.4 Debts to assets (%) 50.2 57.4 56.0 57.5 57.6 Debtor turnover (days) 10 4 9 9 9 Creditor turnover (days) 265 206 162 133 114 Inventory turnover (days) 158 188 104 81 81
MAJOR ASSUMPTIONS
FFB nucleus prod. (k tons) 442 530 626 737 946 Production to grow strongly up
19% y-y in 2014F and 30% y-y
in 2015F
Growth (%) 15.3 20.6 18.4 18.8 30.3
CPO production (k tons) 111 125 139 180 235
Growth (%) 21.4 13.0 10.8 30.0 30.1
ASP CPO (USD/ton) 849 766 685 753 776
Avg. exchg. rate (IDR/USD) 8,775 9,374 10,436 11,650 11,250

10 March 2014
PT Bahana Securities – Equity Research – Plantation update 10
Asiamoney’s
2013
Best Domestic
Equity House
Source: Company, Bahana estimates
Leonardo Henry Gavaza ([email protected]) +6221 2505081 ext. 3608
Austindo Nusantara Jaya
Year to 31 December 2011 2012 2013 2014F 2015F
PROFIT & LOSS (USDm)
Sales 164 166 154 178 205
Earnings to reach USD46m in 2015F
Gross profit 81 78 52 72 85 EBITDA 69 55 38 62 76 Depreciation 14 14 15 18 21 EBIT 55 40 24 45 55 Net interest income/(expense) 1 2 1 0.6 (3) Forex gain/(losses) (0) 2 - - - Other income/(expense) 16 15 6 8 9 Pre-tax profit 72 59 30 53 61 Taxes 27 17 8 13 15 Minority interest - - - - - Extraordinary gain/(losses) - - - - - Net profit 46 42 23 40 46 BALANCE SHEET (USDm) Cash and equivalents 91 77 59 29 41
Continued expansion on…
S-T investments 0 0 0 0 0 Trade receivables 1 1 1 1 2 Inventories 14 16 11 12 15 Fixed assets 62 78 87 119 154 Other assets 744 227 283 307 336 Total assets 913 399 441 470 547 Interest bearing liabilities 2 6 5 5 55 Trade payables 3 5 6 6 7 Other liabilities 408 61 38 38 38 Total liabilities 414 72 48 48 99 Minority interest 12 1 1 1 1 Shareholders' equity 487 327 393 421 447
CASH FLOW (USDm) EBIT 55 40 24 45 55
… USD74-83m annual capex could …
Depreciation 14 14 15 18 21 Working capital 29 78 (30) (2) (2) Other operating items 71 41 (1) (5) (9) Operating cash flow 170 174 7 56 65 Net capital expenditure 71 (32) (67) (74) (83)
Free cash flow 240 142 (59) (18) (19) Equity raised/(bought) - 28 43 - - Net borrowings (224) 2 (2) - 50 Other financing (8) (296) 0 (11) (20) Net cash flow 9 (124) (18) (29) 11 Cash flow at beginning 132 91 77 59 29 Cash flow at end 91 77 59 29 41
- - - - RATIOS ROAE (%) 9.9 10.7 6.9 9.6 10.6 … improve ROE to the above
10% level by 2015F ROAA (%) 5.6 6.7 6.0 8.5 9.1 EBITDA margin (%) 42.3 33.1 25.1 35.1 37.2 EBIT margin (%) 33.7 24.4 15.3 25.2 27.0 Net margin (%) 27.9 25.3 14.8 22.5 22.5 Payout ratio (%) 526.7 - 50.0 50.0 50.0 Current ratio (x) 31.2 20.5 12.5 7.4 8.6 Interest coverage (x) na na na na 17.8 Net gearing (%) nc nc nc nc 3.1 Debts to assets (%) 0.2 1.5 1.0 1.0 10.0 Debtor turnover (days) 122 8 8 8 8 Creditor turnover (days) 24 17 20 20 20 Inventory turnover (days) 56 63 49 41 42
MAJOR ASSUMPTIONS
FFB nucleus prod. (k tons) 565 695 664 689 746 CPO production growth of 4% in 2014F and 8% in 2015F
Growth (%) 47.3 23.1 (4.6) 3.8 8.3
CPO production (k tons) 157 178 179 185 201
Growth (%) 19.6 13.5 0.2 3.8 8.3
ASP CPO (USD/ton) 870 781 685 753 776
Avg. exchg. rate (IDR/USD) 8,775 9,374 10,436 11,650 11,250

10 March 2014
PT Bahana Securities – Equity Research – Plantation update 11
Asiamoney’s
2013
Best Domestic
Equity House
Source: Company, Bahana estimates
Giovanni Aristo ([email protected]) +6221 2505081 ext. 3604
Sampoerna Agro
Year to 31 December 2011 2012 2013 2014F 2015F
PROFIT & LOSS (IDRb)
Sales 3,142 2,986 2,174 2,842 3,122
2014F net profit expected to grow 179% y-y on higher CPO prices ahead
Gross profit 1,061 793 423 760 809 EBITDA 839 663 403 737 808 Depreciation 124 191 211 266 313 EBIT 715 472 192 471 495 Net interest income/(expense) (6) (29) (77) (133) (144) Forex gain/(losses) - - - - - Other income/(expense) 34 14 14 14 14 Pre-tax profit 742 457 130 352 365 Taxes 193 121 26 70 73 Minority interest 9 7 5 7 7 Extraordinary gain/(losses) - - - - - Net profit 541 329 98 275 285 BALANCE SHEET (IDRb) Cash and equivalents 349 228 277 215 352
Higher debt ...
Trade receivables 4 112 87 114 125 Inventories 334 364 350 416 463 Fixed assets 2,154 2,746 3,021 3,742 4,005 Other assets 413 475 400 454 473 Total assets 3,411 4,138 4,366 5,191 5,686 Interest bearing liabilities 432 942 1,201 1,758 2,006 Trade payables 244 253 198 236 262 Other liabilities 218 243 192 224 237 Total liabilities 912 1,471 1,592 2,218 2,505 Minority interest 30 34 39 46 53 Shareholders' equity 2,469 2,633 2,702 2,895 3,094
CASH FLOW (IDRb) EBIT 715 472 192 471 495
... to finance 2014F capex
Depreciation 124 191 211 266 313 Working capital (40) (120) (22) (56) (31) Other operating items (178) (146) (95) (199) (211) Operating cash flow 621 398 287 482 565 Net capital expenditure (689) (786) (502) (1,001) (589) Free cash flow (68) (388) (215) (519) (23)
Equity raised/(bought) (272) - - - - Net borrowings 70 510 260 557 248 Other financing 88 (242) 4 (99) (88) Net cash flow (181) (121) 48 (62) 137 Cash flow at beginning 530 349 228 277 215 Cash flow at end 349 228 277 215 352
RATIOS ROAE (%) 23.5 12.9 3.7 9.8 9.5
Increasing on net gearing
ROAA (%) 17.2 8.7 2.3 5.8 5.2 EBITDA margin (%) 26.7 22.2 18.5 25.9 25.9 EBIT margin (%) 22.8 15.8 8.8 16.6 15.9 Net margin (%) 17.2 11.0 4.5 9.7 9.1 Payout ratio (%) 37.7 50.1 30.0 30.0 30.0 Current ratio (x) 2.8 2.8 3.6 3.2 3.6 Interest coverage (x) 113.9 16.1 2.5 3.5 3.4 Net gearing (%) 3.4 27.1 34.2 53.3 53.4 Debts to assets (%) 12.7 22.8 27.5 33.9 35.3 Debtor turnover (days) 9 14 15 15 15 Creditor turnover (days) 38 41 41 41 41 Inventory turnover (days) 49 58 73 73 73
MAJOR ASSUMPTIONS
FFB nucleus prod. (k tons) 1,614 1,723 1,323 1,467 1,606 FFB nucleus production
expected to grow 10% y-y in
2014F and 9% y-y in 2015F
Growth (%) 17.5 6.8 (23.2) 10.9 9.5
CPO production (k tons) 345 351 265 294 326
Growth (%) 19.3 1.9 (24.5) 10.9 10.8
ASP CPO (USD/ton) 861 776 685 753 776
Avg. exchg. rate (IDR/USD) 8,775 9,374 10,436 11,650 11,250
10 March 2014
PT Bahana Securities – Equity Research – Plantation update 12
Asiamoney’s
2013
Best Domestic
Equity House
Exhibit 16. The 25th Palm Oil Conference
Source: Bahana
Exhibit 17. Price forecasts from several speakers
Speaker Company 2014 CPO price forecast Comments
Dhorab Mistry Godrej
International
Up to MYR3,000/ton by June
Up to MYR3,500/ton until late 2014
Range of MYR2,600/ton – MYR2,900/ton in
July-October
No El Nino
El Nino occurs
TS Yusoff
Basiron
Malaysian Palm
Oil Council MYR2,600/ton-MYR3,000/ton -
Fadhil Hasan Indonesian Palm
Oil Board USD925/ton-USD975/ton cif Rott -
James Fry LMC
International EU CPO to reach USD1,030/ton in mid-year Given Brent oil price USD110/barrel
Thomas Mielke ISTA Mielke
Touch or slightly exceed USD1.000/ton cif
Rott in next 4-8 weeks
Average USD970/ton for the year (2013:
USD860/ton)
-
Harald
Sauthoff BASF Group
MYR2,400/ton-MYR2,950/ton (average
MYR2,620/ton) -
Source: Bahana, CPO conference 2014
Exhibit 18. El-Nino forecast
Source: Australian Government Bureau of Meteorology
Most of the
speakers from
the 25th Palm Oil
Conference are …
… bullish on CPO
price outlook
ahead
POAMA
suggesting the
occurrence of El
Nino in 2014
10 March 2014
PT Bahana Securities – Equity Research – Plantation update 13
Asiamoney’s
2013
Best Domestic
Equity House
Exhibit 19. Historical El-Nino and La-Nina graphic
Source: Bahana, ggweather
Exhibit 20. CPO prices in relation to weather disruptions
0
500
1,000
1,500
2,000
2,500
3,000
3,500
4,000
4,500
Jan-9
2
Aug-9
2
Mar-
93
Oct
-93
May-9
4
Dec-
94
Jul-
95
Feb-9
6
Sep-9
6
Apr-
97
Nov-9
7
Jun-9
8
Jan-9
9
Aug-9
9
Mar-
00
Oct
-00
May-0
1
Dec-
01
Jul-
02
Feb-0
3
Sep-0
3
Apr-
04
Nov-0
4
Jun-0
5
Jan-0
6
Aug-0
6
Mar-
07
Oct
-07
May-0
8
Dec-
08
Jul-
09
Feb-1
0
Sep-1
0
Apr-
11
Nov-1
1
Jun-1
2
Jan-1
3
Aug-1
3
Mar-
14
(MYR/ton)
Source: Bahana, ggweather
Exhibit 21. Additional demand for edible oils, 2010/11-2013/14F
Mn Ton 13-14 12-13 11-12 10-11
China +0.95 +1.10 +1.04 +1.09
India +0.90 +0.87 +0.75 +0.48
EU -0.30 +0.36 -0.33 -0.87
2014 2013 USA +0.20 +0.51 +1.19 +0.90
10% 8% Argentina +0.28 -0.87 +0.53 +0.55
7% 5% Brazil +0.45 +0.04 +0.15 +0.60
10% 7.50% Indonesia +1.65 +1.00 +0.99 +1.02
Others +2.57 +2.05 +2.47 +2.49
World +6.70 +5.06 +6.79 +6.26
Rising biodiesel mandates
Source: Bahana, Oil World
Whenever
weather
disruptions in the
forms of El-Nino
and La-Nina
occurred, …
… CPO prices
increased
significantly
Increased
biodiesel
mandate to
improve demand
for edible oils

10 March 2014
PT Bahana Securities – Equity Research – Plantation update 14
Asiamoney’s
2013
Best Domestic
Equity House
Exhibit 22. CPO supply & demand, net impact
2010-11 2011-12 2012-13F 2013F-14F
October-September
Opening stocks 7.84 9.27 10.55 9.96
Production 49.42 52.35 55.81 58.51
growth (%) 7.7 5.9 6.6 4.8
Consumption 47.99 51.19 56.14 58.59
growth (%) 6.6 6.7 9.7 4.4
Ending stocks 9.27 10.55 9.96 9.81
Stock/usage (%) 19.32 20.61 17.74 16.74 Source: Oil World
Exhibit 23. Vegetable oils supply & demand, net impact
2010-11 2011-12 2012-13F 2013F-14F
October-September
Opening stocks 17.93 19.16 21.42 21.17
Production 144.78 152.32 154.76 161.95
growth (%) 4.4 5.2 1.6 4.6
Consumption 143.69 149.99 154.89 161.00
growth (%) 4.1 4.4 3.3 3.9
Ending stocks 19.16 21.42 21.17 21.87
Stock/usage (%) 13.33 14.28 13.67 13.58 Source: Oil World
Exhibit 24. Malaysia CPO production & inventory, April 2011–January 2014
500
1,000
1,500
2,000
2,500
3,000
1,000
1,200
1,400
1,600
1,800
2,000
2,200
Apr-11 Jul-11 Oct-11 Jan-12 Apr-12 Jul-12 Oct-12 Jan-13 Apr-13 Jul-13 Oct-13 Jan-14
MPOB stock (LHS) Inventory (RHS)
(k tons) (k tons)
Source: Bloomberg
Exhibit 25. Average Rotterdam CPO CIF price, 1Q13-4Q15F
750
800
850
900
950
1,000
1,050
1,100
1,150
1,200
(USD/ton)
Avg. CPO price
2Q131Q13 4Q133Q13
864 850 798 887
2Q141Q14 4Q143Q14
929* 1,000* 974* 937*
4Q153Q152Q151Q15
1,049*1,058*1,025*963*
Source: Bloomberg, Bahana estimates *forecasted average
2.9m tons of
additional 2014F
production is
lower than the
last few years’
average of 3.5m
tons
7.4m tons of
additional 2014F
production is
much higher than
the last few
years’ average of
2.5m tons
We expect CPO
production to
remain weak
throughout 1Q14-
2Q14F …
… allowing the
CPO price to
reach USD
1,000/ton in
2Q14F
10 March 2014
PT Bahana Securities – Equity Research – Plantation update 15
Asiamoney’s
2013
Best Domestic
Equity House
Exhibit 26. Change in assumptions, 2013-15F
Assumption Old New
2014F 2015F 2014F 2015F
Rotterdam CIF CPO price (USD/mtn)
871 915 965 1,025
Growth (%) 2.0 5.0 13.4 6.4
Source: Bahana estimates
Exhibit 27. CPO price sensitivity analysis: Plantation sector
-20% -10% Base Case +10% +20%
Net Profit Chg. Net Profit Chg. Net Profit Chg. Net Profit Chg. Net Profit Chg.
Ticker (IDRbn) (%) (IDRbn) (%) (IDRbn) (%) (IDRbn) (%) (IDRbn) (%)
AALI IJ 1,515 (58.0) 2,560 (29.0) 3,606 0 4,652 29.0 5,697 58.0
SIMP IJ 610 (45.2) 862 (22.6) 1,114 0 1,366 22.6 1,618 45.2
LSIP IJ 613 (42.2) 836 (21.1) 1,060 0 1,284 21.1 1,507 42.2
BWPT IJ 156 (56.0) 255 (28.0) 354 0 454 28.0 553 56.0
ANJT IJ* 23 (43.4) 31 (21.7) 40 0 49 21.7 57 43.4
SGRO IJ 113 (59.0) 194 (29.5) 275 0 356 29.5 437 59.0
Sector (50.6) (25.3) 25.3 50.6
Source: Bahana estimates *in USDm
Exhibit 28. Valuation comparison
Market cap EPS growth
(%) Production gwt.
(%) 2014F PER
PER target
2014F ROE
2014F EV/ha
(USDm) 2013F 2014F 2013F 2014F (x) (x) (%) (USD/ha)
AALI IJ 3,783 (25.3) 100.2 4.2 2.6 12.0 15.3 31.9 15,671
SIMP IJ 1,316 (54.7) 118.5 (8.0) 5.5 13.2 15.2 8.1 6,450
LSIP IJ 1,373 (31.1) 37.9 (11.5) 2.7 14.9 16.4 15.1 10,063
BWPT IJ 547 (43.9) 134.4 10.8 30.0 17.1 18.9 15.6 13,555
ANJT IJ 473 (51.8) 76.5 0.2 3.8 11.7 13.3 9.6 9,616
SGRO IJ 332 (70.1) 134.4 (24.5) 10.9 13.8 15.5 9.8 5,721
Indonesia Planters* (36.1) 96.6 (1.6) 5.5 13.1 15.6 21.5 12,200
SIME MK 17,199 (18.1) (1.6) 17.2 18.8 11.5
IOI MK 9,316 (11.3) (17.9) 20.8 19.3 15.2
KLK MK 7,806 (21.4) 29.3 21.5 20.5 15.1
GENP MK 2,563 (18.6) 39.3 21.1 20.3 10.1
Malaysia Planters* (17.1) 3.6 19.3 19.4 13.1
Source: Bahana estimates, Bloomberg * Weighted average
Exhibit 29. CPO discount to soy oil, October 2008–February 2014
(10)
0
10
20
30
40
Oct
-08
Feb-0
9
Jun-0
9
Oct
-09
Feb-1
0
Jun-1
0
Oct
-10
Feb-1
1
Jun-1
1
Oct
-11
Feb-1
2
Jun-1
2
Oct
-12
Feb-1
3
Jun-1
3
Oct
-13
Feb-1
4
(%)
Average: 11.4%
Source: Bloomberg, Bahana estimates
10-12% higher
2014-15F CPO
price
assumptions
We estimate
every 10%
change in CPO
price to raise
sector’s earnings
by 25%
AALI is our top
BUY on strong
growth from
downstream
expansion
CPO trades at a
1% discount to
soy oil, compared
to the historical
average of a 12%
discount

10 March 2014
PT Bahana Securities – Equity Research – Plantation update 16
Asiamoney’s
2013
Best Domestic
Equity House
Exhibit 30. Plantation counters’ comparative valuations, 2014F AALI SIMP LSIP BWPT ANJT SGRO SECTOR
2014F 2014F 2014F 2014F 2014F 2014F
Recommendation BUY BUY BUY BUY BUY BUY
Target price 35,000 1,100 2,550 1,550 1,850 2,250
Price 27,575 955 2,310 1,405 1,630 2,015
Upside/downside (%) 26.9 15.2 10.4 10.3 13.5 11.7 19.4
TP/consensus (%) 144.2 126.1 128.9 109.9 115.6 129.1
Shares outstanding (m) 1,575 15,816 6,823 4,471 3,333 1,890
Dividend yield (%) 4.1 2.9 2.0 0.9 4.3 1.5 3.2
Market cap (IDRb) 43,424 15,105 15,761 6,282 5,433 3,808 89,813
Market cap (USDm) 3,783 1,316 1,373 547 473 332 7,824
3m turnover (IDRb)/(USDm) 38.3/3.3 11.0/1.0 71.8/6.3 30.1/2.6 0.6/0.0 1.7/0.2
3M avg daily volumes (m) 1.6 16.9 42.0 23.9 0.2 1.0
3M total daily vol (m) 99 1,011 2,517 1,434 4 57 762
PE (x) 12.0 13.2 14.9 17.1 11.7 13.8 13.1
PE (x) @TP 15.3 15.2 16.4 18.9 12.4 17.2 15.6
PBV (x) 3.4 1.0 2.1 2.7 1.3 1.3 2.5
EV/EBITDA (x) 7.4 5.7 10.0 11.9 7.3 7.3 7.9
Net gearing (%) 7.4 29.6 nc 160 nc 53.3
BVPS (IDR/share) 8,058 929 1,088 566 1,232 1,532
EPS (IDR/share) 2,290 72 155 82 139 146
DPS (IDR/share) 1,030 29 47 12 70 44
ROAA (%) 21.6 4.0 12.7 5.2 8.5 5.8 14.5
ROAE (%) 31.9 8.1 15.1 15.6 9.6 9.8 21.5
Nucleus area (ha) 233,858 288,539 114,329 67,677 52,231 77,083 833,717
EV/planted nucleus (USD/ha) 15,371 6,450 10,063 13,555 9,616 5,721 12,000
New planting (ha) 10,250 13,000 4,500 4,000 6,000 6,376 44,126
CPO sales volume (k tons) 1,579 855 407 194 185 279 3,500
Nucleus proportion (%) 54 76 73 92 100 50 66
(IDRbn)
Revenues 19,760 15,831 4,693 1,700 2,077 2,842 46,898
Operating profit 3,005 2,533 1,239 620 523 471 8,344
Net profit 1,801 1,145 1,060 354 467 275 5,068
Growth (%)
Revenue 55.9 19.2 13.5 44.5 15.9 30.7 38.0
Gross profit 51.0 39.5 37.4 75.2 39.4 79.8 48.9
Operating profit 59.5 59.7 51.5 116.3 90.4 145.6 67.6
EBITDA 54.0 42.0 48.6 83.0 62.2 82.8 54.8
Pretax profit 90.6 114.2 32.9 134.4 76.5 172.0 90.1
Net profit 100.2 118.5 37.9 134.4 76.5 179.4 96.6
Margin (%)
Gross profit 31.2 26.0 41.7 69.0 40.4 35.0 35.5
Operating profit 24.3 16.0 30.0 48.8 25.2 21.7 25.6
EBITDA 27.9 22.5 35.7 67.3 40.6 33.9 32.1
Pretax profit 25.1 12.6 32.1 36.2 34.8 16.2 25.2
Net profit 18.2 7.2 25.6 27.2 26.1 12.7 18.5
Source: Bloomberg, Bahana estimates
Based on stock prices as of 8 March 2014
All BUYs with
AALI as our top
pick

Asiamoney’s
2013
Best Domestic
Equity House
Ricardo Silaen, CFA
[email protected] Sales
ext 2524
Harry Su
[email protected] Associate Director
Head of Equities & Research
Strategy, Consumerext 3600
direct: +62 21 250 5735
Dealing Room: +62 21 527 0808 (Foreign Institutional)
Research: +62 21 250 5081
+62 21 250 5508 (Domestic Institutional) +62 31 535 2788 (Surabaya Branch)
Teguh Hartanto
[email protected] Director
Deputy Head of Research
Banks, Cementext 3610
Leonardo Henry Gavaza
[email protected] Research Manager
Auto, Plantations, Heavy equipment,
Property, Industrial estateext 3608
Arga Samudro
[email protected] 3602
Aditya Eka Prakasa
[email protected] Analyst
Poultry, Telco, Aviationext 3603
Salman Fajari [email protected]
Research AnalystProperty, Industrial estate, Steel,
Cement, Toll roadsext 3605
Jennifer Frederika Yapply
[email protected] Analyst
Coal, Oil and gas, Metalsext 3606
Chandra Widjanarka
[email protected] Analyst, Transportation
ext 3609
Maxi [email protected] Analyst
Auto, Construction, Consumer, Mediaext 3615
Nuriah Sari
[email protected] Executive
ext 3001
Nurul Farida
[email protected] Sales
ext 2543
Siti Fathia Maisa Syafurah
[email protected] Sales
ext 2547
Ashish Agrawal
[email protected] President
Institutional Equity Salesext 2550 / 2553
Reynard Poernawan
[email protected] Equity Sales
ext 2528
John M. Dasaad
[email protected] Sales
ext 2549
Yohanes Adhi Handoko
[email protected], Surabaya Branch
ext 7250
Angky Amarylis
[email protected] Trader
ext 2525
Suwardi Widjaja
[email protected] Sales
ext 2548
Ricardo Silaen, CFA
[email protected] President
Institutional Equity Salesext 2524
Nurul Farida
[email protected] Sales
ext 2543
Amelia Husada
[email protected] President
Institutional Equity Salesext 2552
Made Ayu Wijayati
[email protected] Executive
ext 3607
Laurensius Teiseran
[email protected] Associate
ext 3601
Nico Laurens
[email protected] Associate
ext 3614
Zefanya Angeline Halim
[email protected] Associate/Corporate Access &
Client Relationsext 3612
Giovanni Aristo
[email protected] Research Associate
ext 3604
Michael W Setjoadi [email protected]
Research AnalystConsumerext 3613
Head Office Surabaya Branch
Graha Niaga, 19th Floor Wisma BII, Ground Floor
Jl. Jend. Sudirman Kav. 58 Jl. Pemuda 60-70
Jakarta 12190 Surabaya 60271
Indonesia Indonesia
Tel. 62 21 250 5081 Tel. 62 31 535 2788
Fax. 62 21 522 6049 http://www.bahana.co.id Fax. 62 31 546 1157

Asiamoney’s
2013
Best Domestic
Equity House
Disclaimer This publication is prepared by PT.Bahana Securities and reviewed by Daiwa Securities Group Inc. and/or its non-U.S. affiliates, and distributed outside Indonesia by Daiwa Securities Group Inc. and/or its non-U.S. affiliates, except to the extent expressly provided herein. Certain copies of this publication may be distributed inside and outside of Indonesia by PT. Bahana Securities in accordance with relevant laws and regulations. This publication and the contents hereof are intended for information purposes only, and may be subject to change without further notice. Any use, disclosure, distribution, dissemination, copying, printing or reliance on this publication for any other purpose without our prior consent or approval is strictly prohibited. Neither Daiwa Securities Group Inc. nor any of its respective parent, holding, subsidiaries or affiliates, nor any of its respective directors, officers, servants and employees, represent nor warrant the accuracy or completeness of the information contained herein or as to the existence of other facts which might be significant, and will not accept any responsibility or liability whatsoever for any use of or reliance upon this publication or any of the contents hereof. Neither this publication, nor any content hereof, constitute, or are to be construed as, an offer or solicitation of an offer to buy or sell any of the securities or investments mentioned herein in any country or jurisdiction nor, unless expressly provided, any recommendation or investment opinion or advice. Any view, recommendation, opinion or advice expressed in this publication constitutes the views of the analyst(s) named herein and does not necessarily reflect those of Daiwa Securities Group Inc. and/or its affiliates nor any of its respective directors, officers, servants and employees except where the publication states otherwise. This research report is not to be relied upon by any person in making any investment decision or otherwise advising with respect to, or dealing in, the securities mentioned, as it does not take into account the specific investment objectives, financial situation and particular needs of any person.
Neither Daiwa Securities Group Inc. nor any of its affiliates is licensed to undertake any business within the Republic of Indonesia. Any display of any trade name or logo of the Daiwa Securities Group Inc. on this publication shall not be deemed to be an undertaking of any business within the Republic of Indonesia.
Daiwa Securities Group Inc., its subsidiaries or affiliates, or its or their respective directors, officers and employees from time to time have trades as principals, or have positions in, or have other interests in the securities of the company under research including derivatives in respect of such securities or may have also performed investment banking and other services for the issuer of such securities. The following are additional disclosures.
Japan
Daiwa Securities Co. Ltd. and Daiwa Securities Group Inc.
Daiwa Securities Co. Ltd. is a subsidiary of Daiwa Securities Group Inc.
Investment Banking Relationship
Within the preceding 12 months, The subsidiaries and/or affiliates of Daiwa Securities Group Inc. * has lead-managed public offerings and/or secondary offerings (excluding straight bonds) of the securities of the following companies: Blackgold International Holdings Ltd (BGG AU); Tosei Corporation (8923 JP); Modern Land (China) Co. Ltd (1107 HK); China Everbright Bank Company Limited (6818 HK); econtext Asia Ltd (1390 HK).
*Subsidiaries of Daiwa Securities Group Inc. for the purposes of this section shall mean any one or more of:
• Daiwa Capital Markets Hong Kong Limited (大和資本市場香港有限公司)
• Daiwa Capital Markets Singapore Limited
• Daiwa Capital Markets Australia Limited
• Daiwa Capital Markets India Private Limited
• Daiwa-Cathay Capital Markets Co., Ltd.
• Daiwa Securities Capital Markets Korea Co., Ltd
Disclosure of Interest of Bahana Securities
Investment Banking Relationship
Within the preceding 12 months, Bahana Securities has lead-managed public offerings and/or secondary offerings (excluding straight bonds) of the securities of the following companies: Sri Rejeki Isman (SRIL IJ); Semen Baturaja (Persero) (SMBR IJ); Tiphone Mobile Indonesia (TELE IJ); Austindo Nusantara Jaya (ANJT IJ); Telekomunikasi Indonesia (Persero) (TLKM IJ); Garuda Indonesia (Persero) (GIAA IJ)
Hong Kong
This research is distributed in Hong Kong by Daiwa Capital Markets Hong Kong Limited (大和資本市場香港有限公司) (“DHK”) which is regulated by the Hong Kong Securities and Futures Commission. Recipients of this research in Hong Kong may contact DHK in respect of any matter arising from or in connection with this research.
Ownership of Securities
For “Ownership of Securities” information, please visit BlueMatrix disclosure Link at https://daiwa3.bluematrix.com/sellside/Disclosures.action.
Investment Banking Relationship
For “Investment Banking Relationship”, please visit BlueMatrix disclosure Link at https://daiwa3.bluematrix.com/sellside/Disclosures.action.
Relevant Relationship (DHK)
DHK may from time to time have an individual employed by or associated with it serves as an officer of any of the companies under its research coverage.
DHK market making
DHK may from time to time make a market in the securities covered by this research.
Singapore
This research is distributed in Singapore by Daiwa Capital Markets Singapore Limited and it may only be distributed in Singapore to accredited investors, expert investors and institutional investors as defined in the Financial Advisers Regulations and the Securities and Futures Act (Chapter 289), as amended from time to time. By virtue of distribution to these category of investors, Daiwa Capital Markets Singapore Limited and its representatives are not required to comply with Section 36 of the Financial Advisers Act (Chapter 110) (Section 36 relates to disclosure of Daiwa Capital Markets Singapore Limited’s interest and/or its representative’s interest in securities). Recipients of this research in Singapore may contact Daiwa Capital Markets Singapore Limited in respect of any matter arising from or in connection with the research.
Australia
This research is distributed in Australia by Daiwa Capital Markets Stockbroking Limited and it may only be distributed in Australia to wholesale investors within the meaning of the Corporations Act. Recipients of this research in Australia may contact Daiwa Capital Markets Stockbroking Limited in respect of any matter arising from or in connection with the research.
Ownership of Securities
For “Ownership of Securities” information, please visit BlueMatrix disclosure Link at https://daiwa3.bluematrix.com/sellside/Disclosures.action.
India
This research is distributed by Daiwa Capital Markets India Private Limited (DAIWA) which is an intermediary registered with Securities & Exchange Board of India. This report is not to be considered as an offer or solicitation for any dealings in securities. While the information in this report has been compiled by DAIWA in good faith from sources believed to be reliable, no representation or warranty, express of implied, is made or given as to its accuracy, completeness or correctness. DAIWA its officers, employees, representatives and agents accept no liability whatsoever for any loss or damage whether direct, indirect, consequential or otherwise howsoever arising (whether in negligence or otherwise) out of or in connection with or from any use of or reliance on the contents of and/or omissions from this document. Consequently DAIWA expressly disclaims any and all liability for, or based on or relating to any such information contained in or errors in or omissions in this report. Accordingly, you are recommended to seek your own legal, tax or other advice and should rely solely on your own judgment, review and analysis, in evaluating the information in this document. The data contained in this document is subject to change without any prior notice DAIWA reserves its right to modify this report as maybe required from time to time. DAIWA is committed to

Asiamoney’s
2013
Best Domestic
Equity House
providing independent recommendations to its Clients and would be happy to provide any information in response to any query from its Clients. This report is strictly confidential and is being furnished to you solely for your information. The information contained in this document should not be reproduced (in whole or in part) or redistributed in any form to any other person. We and our group companies, affiliates, officers, directors and employees may from time to time, have long or short positions, in and buy sell the securities thereof, of company(ies) mentioned herein or be engaged in any other transactions involving such securities and earn brokerage or other compensation or act as advisor or have the potential conflict of interest with respect to any recommendation and related information or opinion. DAIWA prohibits its analyst and their family members from maintaining a financial interest in the securities or derivatives of any companies that the analyst cover. This report is not intended or directed for distribution to ,or use by any person, citizen or entity which is resident or located in any state or country or jurisdiction where such publication, distribution or use would be contrary to any statutory legislation, or regulation which would require DAIWA and its affiliates/ group companies to any registration or licensing requirements. The views expressed in the report accurately reflect the analyst’s personal views about the securities and issuers that are subject of the Report, and that no part of the analyst’s compensation was, is or will be directly or indirectly, related to the recommendations or views expressed in the Report. This report does not recommend to US recipients the use of Daiwa Capital Markets India Private Limited or any of its non – US affiliates to effect trades in any securities and is not supplied with any understanding that US recipients will direct commission business to Daiwa Capital Markets India Private Limited.
Taiwan
This research is distributed in Taiwan by Daiwa-Cathay Capital Markets Co., Ltd and it may only be distributed in Taiwan to institutional investors or specific investors who have signed recommendation contracts with Daiwa-Cathay Capital Markets Co., Ltd in accordance with the Operational Regulations Governing Securities Firms Recommending Trades in Securities to Customers. Recipients of this research in Taiwan may contact Daiwa-Cathay Capital Markets Co., Ltd in respect of any matter arising from or in connection with the research.
Philippines
This research is distributed in the Philippines by DBP-Daiwa Capital Markets Philippines, Inc. which is regulated by the Philippines Securities and Exchange Commission and the Philippines Stock Exchange, Inc. Recipients of this research in the Philippines may contact DBP-Daiwa Capital Markets Philippines,
Inc. in respect of any matter arising from or in connection with the research. DBP-Daiwa Capital Markets Philippines, Inc. recommends that investors
independently assess, with a professional advisor, the specific financial risks as well as the legal, regulatory, tax, accounting, and other consequences of a
proposed transaction. DBP-Daiwa Capital Markets Philippines, Inc. may have positions or may be materially interested in the securities in any of the
markets mentioned in the publication or may have performed other services for the issuers of such securities.
For relevant securities and trading rules please visit SEC and PSE Link at http://www.sec.gov.ph/irr/AmendedIRRfinalversion.pdf and http://www.pse.com.ph/ respectively.
United Kingdom
This research report is produced by Daiwa Capital Markets Europe Limited and/or its affiliates and is distributed in the European Union, Iceland, Liechtenstein, Norway and Switzerland. Daiwa Capital Markets Europe Limited is authorised and regulated by The Financial Conduct Authority (“FCA”) and is a member of the London Stock Exchange, Eurex and NYSE Liffe. Daiwa Capital Markets Europe Limited and/or its affiliates may, from time to time, to the extent permitted by law, participate or invest in other financing transactions with the issuers of the securities referred to herein (the “Securities”), perform services for or solicit business from such issuers, and/or have a position or effect transactions in the Securities or options thereof and/or may have acted as an underwriter during the past twelve months for the issuer of such securities. In addition, employees of Daiwa Capital Markets Europe Limited and/or its affiliates may have positions and effect transactions in such securities or options and may serve as Directors of such issuers. Daiwa Capital Markets Europe Limited may, to the extent permitted by applicable UK law and other applicable law or regulation, effect transactions in the Securities before this material is published to recipients.
This publication is intended for investors who are not Retail Clients in the United Kingdom within the meaning of the Rules of the FCA and should not therefore be distributed to such Retail Clients in the United Kingdom. Should you enter into investment business with Daiwa Capital Markets Europe’s affiliates outside the United Kingdom, we are obliged to advise that the protection afforded by the United Kingdom regulatory system may not apply; in particular, the benefits of the Financial Services Compensation Scheme may not be available.
Daiwa Capital Markets Europe Limited has in place organisational arrangements for the prevention and avoidance of conflicts of interest. Our conflict management policy is available at http://www.uk.daiwacm.com/about-us/corporate-governance-regulatory. Regulatory disclosures of investment banking relationships are available at https://daiwa3.bluematrix.com/sellside/Disclosures.action.
Germany
This document has been approved by Daiwa Capital Markets Europe Limited and is distributed in Germany by Daiwa Capital Markets Europe Limited, Niederlassung Frankfurt which is regulated by BaFin (Bundesanstalt fuer Finanzdienstleistungsaufsicht) for the conduct of business in Germany.
Bahrain
This research material is issued/compiled by Daiwa Capital Markets Europe Limited, Bahrain Branch, regulated by The Central Bank of Bahrain and holds Investment Business Firm – Category 2 license and having its official place of business at the Bahrain World Trade Centre, South Tower, 7th floor, P.O. Box 30069, Manama, Kingdom of Bahrain. Tel No. +973 17534452 Fax No. +973 535113
This material is provided as a reference for making investment decisions and is not intended to be a solicitation for investment. Investment decisions should be made at your own discretion and risk. Accordingly, no representation or warranty, express or implied, is made as to and no reliance should be placed on the fairness, accuracy, completeness or correctness of the information and opinions contained in this document, Content herein is based on information available at the time the research material was prepared and may be amended or otherwise changed in the future without notice. All information is intended for the private use of the person to whom it is provided without any liability whatsoever on the part of Daiwa Capital Markets Europe Limited, Bahrain Branch, any associated company or the employees thereof. If you are in doubt about the suitability of the product or the research material itself, please consult your own financial adviser. Daiwa Capital Markets Europe Limited, Bahrain Branch retains all rights related to the content of this material, which may not be redistributed or otherwise transmitted without prior consent.
For stocks and sectors in Indonesia covered by Bahana Securities, the following rating system is in effect:
Stock ratings are based on absolute upside or downside, which is the difference between the target price and the current market price. Unless otherwise specified, these ratings are set with a 12-month horizon. It is possible that future price volatility may cause a temporary mismatch between upside/downside for a stock based on the market price and the formal rating. "Buy": the price of the security is expected to increase by 10% or more. "Hold": the price of the security is expected to range from an increase of less than 10% to a decline of less than 5%. "Reduce": the price of the security is expected to decline by 5% or more.
Sector ratings are based on fundamentals for the sector as a whole. Hence, a sector may be rated “Overweight” even though its constituent stocks are all rated “Reduce”; and a sector may be rated “Underweight” even though its constituent stocks are all rated “Buy”. “Overweight”: positive fundamentals for the sector. “Neutral”: neither positive nor negative fundamentals for the sector. “Underweight”: negative fundamentals for the sector.
Ownership of Securities For “Ownership of Securities” information, please visit BlueMatrix disclosure Link at https://daiwa3.bluematrix.com/sellside/Disclosures.action .
Investment Banking Relationships For “Investment Banking Relationship”, please visit BlueMatrix disclosure Link at https://daiwa3.bluematrix.com/sellside/Disclosures.action .

Asiamoney’s
2013
Best Domestic
Equity House
Relevant Relationships (Bahana Securities) Bahana Securities may from time to time have an individual employed by or associated with it serves as an officer of any of the companies under its research coverage.
Bahana Securities market making Bahana Securities may from time to time make a market in securities covered by this research.
Additional information may be available upon request.
Japan - additional notification items pursuant to Article 37 of the Financial Instruments and Exchange Law
(This Notification is only applicable where report is distributed by Daiwa Securities Co. Ltd.)
If you decide to enter into a business arrangement with us based on the information described in materials presented along with this document, we ask you to pay close attention to the following items.
In addition to the purchase price of a financial instrument, we will collect a trading commission* for each transaction as agreed beforehand with you.
Since commissions may be included in the purchase price or may not be charged for certain transactions, we recommend that you confirm the
commission for each transaction.
In some cases, we may also charge a maximum of ¥ 2 million (including tax) per year as a standing proxy fee for our deposit of your securities, if you
are a non-resident of Japan.
For derivative and margin transactions etc., we may require collateral or margin requirements in accordance with an agreement made beforehand with
you. Ordinarily in such cases, the amount of the transaction will be in excess of the required collateral or margin requirements. There is a risk that you will incur losses on your transactions due to changes in the market price of financial instruments based on fluctuations in
interest rates, exchange rates, stock prices, real estate prices, commodity prices, and others. In addition, depending on the content of the transaction,
the loss could exceed the amount of the collateral or margin requirements.
There may be a difference between bid price etc. and ask price etc. of OTC derivatives handled by us.
Before engaging in any trading, please thoroughly confirm accounting and tax treatments regarding your trading in financial instruments with such
experts as certified public accountants.
*The amount of the trading commission cannot be stated here in advance because it will be determined between our company and you based on current market conditions and the content of each transaction etc.
When making an actual transaction, please be sure to carefully read the materials presented to you prior to the execution of agreement, and to take responsibility for your own decisions regarding the signing of the agreement with us.
Corporate Name: Daiwa Securities Co. Ltd.
Financial instruments firm: chief of Kanto Local Finance Bureau (Kin-sho) No.108
Memberships: Japan Securities Dealers Association, Financial Futures Association of Japan
Japan Securities Investment Advisers Association
Type II Financial Instruments Firms Association