Equity Group Investor Briefing H1 2015 presentation
72
Investor Briefing & H1 2015 Performance Aug 2015
-
Upload
red-fox-communications -
Category
Investor Relations
-
view
140 -
download
3
Transcript of Equity Group Investor Briefing H1 2015 presentation

Investor Briefing &
H1 2015 Performance
Aug 2015

2
Economic Overview

33
Inflation
§ Month-to-month inflation in Kenya increased from 6.9% in May 2015 to 7.03% in June 2015
largely driven by a rally in fuel prices but remains within the projected target of 7.5%
3.6
0.00.51.01.52.02.53.03.54.04.55.05.56.06.57.07.5
May-15Jan-15 Feb-15 Mar-15 Jun-15Apr-15
7.0%
2.8%
5.3%4.9%
Uganda
6.9%
3.5%
4.9%
3.6%
Tanzania
Rwanda
Kenya
6.1%
1.9%
0.3%
1.3%
5.6%
1.6%
3.3%
5.5%
4.3%4.0%
7.1%
4.5%4.2%
1.4%
6.3%
%

4
§ The exchange rate of KES against the US Dollar has witnessed an upward pressure over the last few months. Between Jan 2015
(KES 90.7) and end of July 2015 (KES 101.9), the shilling has depreciated by 12.3% against the US$. This is mainly a reflection of:
- A strong US Dollar as a result of the recovery of the US economy and the possible increase in interest rates.
- An elevated but seasonal demand for foreign exchange from the local corporate sector
- Repatriation of dividends by foreign investors
- Falling revenues from tourism, tea and horticulture
§ The import cover is currently at 4.14 times (marginally above the mandatory requirement of 4 times the countries import)
§ The government has an unutilized standby credit facility of KES 63billion available from the International Monetary Fund
4
Foreign Exchange Rate - Kenya
Feb-15
98
Mar-15Jan-15 Apr-15 May-15
96
0
92
100
94
102
Jul-15Jun-15 30-Jul-15
98.697.8
91.4
94.612.3%
101.9
90.7
92.3
KSH/USD
FX Movement over the last 7 month

5
USD vs. USH,TSH, RWF, KSH
KES vs East African Currencies
33.433.331.231.632.131.731.230.6
20.720.021.321.020.020.119.519.2
6.87.37.07.37.57.57.57.6
0.0
5.0
10.0
15.0
20.0
25.0
30.0
35.0
40.0
Apr-15Mar-15
KES / USHS
30th Jul 15
Jun-15Jan-15
-11%
+8%
+9%
KES / RWF
KES / TSHS
Feb-151st Jan 15 May-15
§ Although the KES has witnessed an upward pressure against the USD over the last few
months, it has strengthened against some of the regional currencies

6
Political and Economic review in the region§ There has been an increasing trend in interest rates over the last 6 months
§ Central Bank of Kenya increased the Central Bank Rate (CBR) by 150 basis points from 8.5% to 10% on 9th
June 2015, and then by another 150 basis points from 10% to 11.5% on July 7th 2015
§ The Central Bank also increased the Kenya Bank Reference Rate (KBRR) by 133 basis points from 8.54% to
9.87%
6
Interest Rates
91 Days T. Bill
182 Days T. Bill
364 Days T. Bill
Interbank rate
Jan Feb JuneMar Apr May
8.59% 8.59% 8.49% 8.42% 8.26% 8.26%
7.12% 6.77% 6.85% 8.77% 11.17% 11.78%
10.19% 10.37% 10.35% 10.26% 10.37% 10.55%
10.73% 10.96% 10.69% 10.57% 10.71% 10.98%

7
GDP Outlook
Kenya
§ GDP had been projected to grow by 6.5 - 7% in 2015 predicated on:
- Falling oil prices
- Faster scaling up of public investments in infrastructure (including a frontloading of the SGR project)
- Investments in security, ICT, agriculture, energy sector, health care, education, and tourism
East African Region
§ Growth in the region has been relatively strong. Rwanda, Ethiopia and Tanzania have seen the fastest-growth
in the region
§ Regional economies are projected to continue growing strongly (IMF, 2015). Kenya is well positioned as a
regional hub and can spur the growth through cross-border trade and regional integration.
Country 2014 2015 2016Kenya 5.3 6.5 7.2
Rwanda 7.0 7.0 7.0Tanzania 7.2 7.2 7.1
Uganda 4.9 5.4 5.6
GDP Growth in the East African Region (Percent) – 2015 & 2016 (Projections)
Source: IMF (2015)

8
Update on Strategic Initiatives

9
SME Strategy
Solid ICT Infrastructure Supporting our Business
Merchant Business & Payment Processing
Iconic and social brand
with significant impact
We have made solid progress on strategic initiatives
§ 27% increase in Diaspora remittances commissions
§ 57% increase in Merchant commissions
§ 30.5% increase in Mobile Banking transactions
§ 38.5% increase in Agent transactions
Innovative Delivery Channels
§ Mobile Banking§ Agency
§ SME’s now account for 68.4% of the loan book§ FX income growth
of 76%§ Current accounts
35% of deposits§ Delivering 50% of
GES commitment
Regional subsidiaries§ Assets grew by
64%§ PBT grew by 41%§ Contributed 18% of
deposits§ 2 non-banking
subsidiaries commenced operations
Diaspora Remittances8
6
4
Brand & Foundation 7
5
Regional Expansion & Diversification
3
2
Growth in investment in ICT of 57% leading to growth in ICT expenses of 89%
Equity Group Holdings Limited
(Governance & Leadership structure)
Completed restructuring &
staffed
1

10
Equity Group Holdings Limited structure
Group Board
CEO
Banking Subsidiaries*
Equity Bank Rwanda
Equity Bank Tanzania
Equity Bank Uganda
Equity Bank South Sudan
Equity Bank Kenya
Director Strategy, Legal, Company Secretary
Director Strategic Partnerships & Programme Mgt
Group Internal Auditor
CEO’s office
Corporate Office
Director, HR & Admin
Chief Risk Officer and Compliance
Chief Operating Officer (shared services)
Chief Officer, Finance, Innovation, Payments
Chief Marketing Officer
Chief Technology & Information Officer
Director, Corporate & SME Banking
Subsidiary Boards
* 100% wholly-owned banking subsidiaries, each with own Board of Directors compliant with local regulations
Non-Banking Subsidiaries
Consulting
Equity Insurance Agency
Equity Investment Bank
Equity Group Foundation
Infrastructure Services
Shareholders
Subsidiary Boards
Director of Operations
1
Director Brand, Culture and Communications
All senior roles, except for MD of Finserve and MD of EIA filled
New roles filled in the last 12 months

11
• Equitel provides a secure mobile channel that will redefine banking by converging banking and telecommunication enabling financial inclusion
• IT industrialisation will dramatically improve business agility and produce quality and cost effective services
• The platform will improve user experience by digitising processes, converge channels and deep customer insight
• Universal cashless payment platform that enables a cost efficient commerce and build a ecosystem that results in Equity Bank as the store of value
• Invest in human capital for growth and sustainability
• IT Commoditisation will reduce IT cost and make the region globally competitive
• MVNO, channel security , EGF capabilities Equity world , healthcare system, education content, agricultural programmes and more.
• Enterprise architecture, SOA / ESB /BPM / BAM / BRMS, SOA security) , rich API capabilities.
• Digitisation and process automation enables channel convergence, analytical and cognitive capacities through advances analytics and Big Data
• PCI-DSS compliant platform that is solidified in payment switch upgrade. E Commerce payment solution
• Investments in enabling expertise, learning and knowledge acquisition
• MSSP, extension of data centre capacities, comprehensive BCP capability, highly available scalable platform, DR outsourcing and shared network bandwidth
Investment Outcome
Strategic IT Investment open doors for customer focused innovation and market disruption2

12
IT investment and impact on P&L2
14.8
+57%
6.8
7.8
H1 2012
H1 2013
9.4+15%
H1 2014
+21%
H1 2015
KES “Billion”
+37%
8.4
H1 2014 H1 2015
6.1
Other Operating Expenses(incl. IT)
IT Spend over time
+89%
2.6
H1 2014 H1 2015
1.4
IT Expense (P&L)
+22%
5.8
H1 2014 H1 2015
4.7
Other Operating Expenses (excl. IT)

13
Regional Expansion & Diversification
Insurance
Investment Bank
Foundation
Finserve
Bank
A distinctive agile, convenient and secure mobile channel that seamlessly integrates and converges bank accounts and other financial products and services while providing value-add telecoms products and services
Insurance products to deepen the financial inclusion of our clients while providing cover for risk mitigation of banking products
A unique approach to impacting the lives of African in our communities using the Bank’s existing infrastructure, enormous human capital and Brand
Investment services for our corporate clients: brokerage, custodial and advisory
The leading inclusive bank across the East African region
3

14
§ Equity 3.0 is a comprehensive 10 year plan to transform Equity Group Holdings Ltd (EGHL), to one of the largestfinancial services providers in Africa. EGHL’s overarching objective is to grow its member base to over 100 millioncustomers, in 15 countries across the continent.
Rwanda
Kenya
Tanzania
Uganda
South Sudan
DRC
Regional Expansion - key delivery under Equity 3.0 3
Pending regulatory approval

15
KES “Billion”
Tanzania Rwanda Uganda S. Sudan
Customer deposits
Loan
20
Customer deposits growth
Loan Growth
Assets
Asset Growth
PBT
PBT Growth
Regional Total
14.90
89%
13.16
113%
20.08
91%
0.19
159%
7.97
52%
7.42
72%
13.26
83%
0.21
499%
10.59
26%
7.24
14%
15.04
20%
0.05
-8%
33.33
96%
3.74
-18%
40.31
69%
0.46
-5%
66.79
73%
31.57
48%
88.68
64%
0.9241%
Regional Expansion – Key Metrics3
Kenya
237.7
205.0
24%
318.0
22%
10.9
11%
Regional Contribution
Q2 2015
22%
13%
22%
8%
34%
Regional Contribution
Q2 2014
18%
11%
18%
6%

16
Assets and PBT contribution by countries
3.3%
4.1% 3.8%
2.4%
Q2 2015
Uganda
Rwanda100.0%
Q2 2014
100.0%
77.9%82.1%Kenya
S. Sudan
10.1%
7.9%
5.0%3.5%Tanzania
Total Assets split by Country PBT split by Country
4.4%
3.8%
1.6%
0.7%0.5% 1.8%
S. Sudan
0.3%
Q2 2014
100.0%
94.0%
Q2 2015
100.0%Rwanda
92.4%
Tanzania
Kenya
0.4%Uganda
3

17
KES “Billion”
Non-Banking Subsidiaries:
PBT H1 2014 H1 2015 Growth
Equity Insurance 0.24 0.32 33%
Equity Investment Bank 0.02 0.11 461%
Finserve Africa (Equitel) - -0.17 N/A
Diversification - Key delivery under Equity 3.03

18
Equity Investment Bank market share surges…3
Equity Investment Bank lauded as the 2nd biggest in stock brokerage…
▪ Stimulated by focus on foreign investors and leveraging on Equity Bank’s large customer base
▪ Kes 33.6 B brokerage business processed in Q2 2015 and now controlling 16% of the stock brokerage business in NSE.

19
Equity Insurance Agency3
Bancassurance Industry Performance
323
495407
334
223
69
20122011 H1 2015
+63.8%
2010 20142013
EIA PBT Trend
0
100
200
300
400
500
EIA Competitor 2 Competitor 8Competitor 6Competitor 5Competitor 4 Competitor 7Competitor 1 Competitor 3
KES Million
KES Million
Equity becomes the largest Insurance intermediary

20
4
1,023,646
902,003
788,478
665,661
581,066504,798
0
100,000
200,000
300,000
400,000
500,000
600,000
700,000
800,000
900,000
1,000,000
1,100,000
1,200,000
0
100,000
200,000
300,000
400,000
500,000
600,000
700,000
800,000
900,000
1,000,000
1,100,000
Jan2015
Mar2015
Apr2015
May2015
93%
Jun2015
Feb2015
Linkage to M-Banking SIM uptake
81%
76%
78%
81%
83%
84%
“Equitel” - The Fastest Growing MVNO with cumulative monthly growth rate of 93%

21
20.0
15.0
50.0
45.0
0.0
80.055.0
10.0
40.0
35.0
0.0
25.0
30.0
20.0
60.0
50.0
30.0
70.0
40.0
5.0
10.0
Jun2015
42.3
Apr2015
63.2
35.8
10.5
77.7
May2015
33.0
17.222.5
24.4
48.6
Feb2015
Mar2015
Jan2015
5.4
11.3
Monthly M-Banking Volumes (billions)Monthly M-Banking Transactions (millions)
In billion In million
M-Banking Transactions & Volume Trend (cumulative)4

22
1.9
1.6
1.3
1.00.8
2.4
+22%
Mar2015
Jan2015
May2015
Jun2015
Feb2015
+22%
Apr2015
+27%
+25%
+25%
Loan Value Disbursement (KES "Billion")Disbursement Count (number)
Loan Disbursements through Mobile Banking- key delivery under Equity 3.0
225,457 284,284 353,052 430,186 524,418 623,171
4

23
Equitel curves out 1.9% share of mobile subscriptions (during the January-March 2015 period)
4
Source: Communications Authority of Kenya

24
Consistent focus on Variable cost model…
Continuous Growth in Agency Banking4
▪ Number of agents increased to 21,108 agents. 54% growth y/y
… More transactions now processed under 3rd party infrastructure saving on fixed costs
▪ More transactions now processed under 3rd party infrastructure
▪ Agent transactions registered a 38.5% y/y growth
13.613.314.0
15.4
16.816.417.0
0
5
10
15
20
25
ATM
Q2 2014
16.0
Branch
Q2 2015
+38.5%
24.1
17.4
12.3
Agent
1.1
Q2 2011 Q2 2012
8.2
13.7
Q2 2013
14.3
Transactions (Millions)
(24%)
(30%)
(46%)
Note: Cash transactions only

25
Continuous Growth in Agency Deposits…4
56.452.2
49.945.2
24.222.321.418.5
+5%+10%
Q4 2014Q3 2014 Q2 2015Q1 2015
+8%
Agency Deposit Amount Agency Withdrawal AmountIn KES Billion
Deposits growing faster than withdrawals hence a “Net Cash-Inflow” position

26
SME contribution to the Loan Book
45.3%47.7%
50.2%
8.6%7.6%
6.7%
29.9% 26.2% 22.0%
15.2%
100.0% 100.0%
Q2 2013
18.2%
Q2 2014
3.4% 2.9%
12.8%
100.0%
Q2 2015
Consumer
3.5%Agriculture
Large Enterprises
Micro
SME
5

27
SME contribution to Deposit base
19%
35%30%
16%
Q2 2014
19%
100%
Q2 2015
100%
Term Deposits
100%
Q2 2013
Current Accounts 25%
46%54%56%Savings
Deposit split by type
5
…current accounts (as a proportion of overall deposits) increasing over time as a result of SME strategy

28
SME Income Contribution5
+51%
384.5
244.2
Q2 2015Q2 2013 Q2 2014
161.5
+57%
940.0
Q2 2013
1,069.8
Q2 2014
1,882.0
Q2 2015
+76%
+14%
Merchant Income Growth FX Income Growth
29
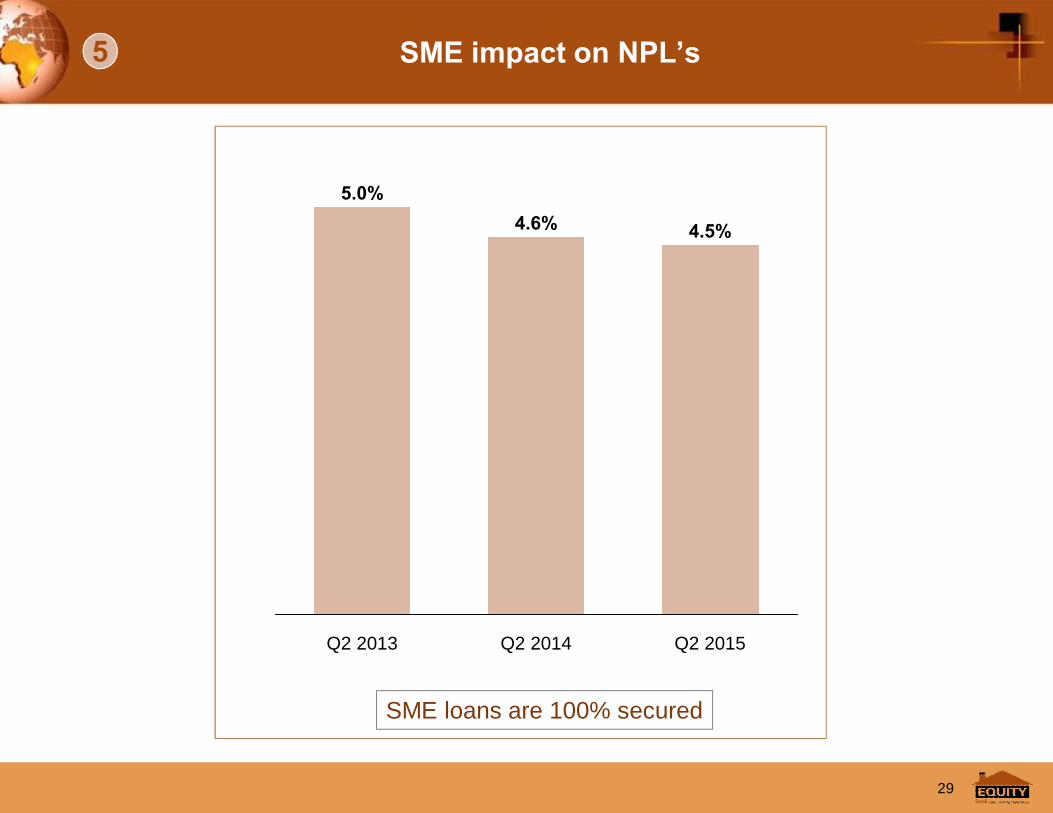
SME impact on NPL’s5
4.5%4.6%
Q2 2015Q2 2013 Q2 2014
5.0%
SME loans are 100% secured

30
Highlights
▪ Non Funded Income: grew by 30% YoY▪ Funded Income: Interest income grew by 11% YoY due to growth in loan book; Interest expenses grew by 27%
YoY due to increase in customer deposits
13.3bn(66%)
7.0bn(34%)
20.2bn
5.9bn(45%)
10.8(41%)
22.3bn
Q2 2014
Non-Funded
15.5(59%)
26.3bn
Q2 2015
Funded
11.3(64%)
Q2 2012
17.6bn
Q2 2013
14.0bn(63%)
8.3bn(37%)
6.3bn(36%)
Q2 2011
13.2bn
7.3bn(55%)
Non Funded Income by Type
70%
Fees & Commission
7%
17%
Other Income
Foreign Exchange
13%
Q2 2014
80%
Q2 2015
13%
Growing Non-funded Income as a result of cross-selling to SME’s5

31
Cost of funds
Group net interest margin has declined slightly but compensated by cross-selling to SME’s resulting in disproportionate growth in
Other Income
Net Interest Margin trend… driven by a decline in interest yield
Percentage
Net Interest Margin Yield on interest Earning Assets
9.89.9
10.810.9
Q2 ’15Q1 ’15Q4 ’14Q3 ’14
2.52.62.52.4
Q2 ’15Q1 ’15Q4 ’14Q3 ’14
12.312.513.313.3
Q2 15Q1 15Q4 ’14Q3 ’14
… due to increase in foreign portion of loan book
LocalCurrency
Loans
ForeignCurrency
Loans
100%
Q2 2014
81%
19%27%
Q2 2015
73%
100%
5

32
… due to increase in foreign portion of loan book
Cost of funds
EBKL net interest margin has declined slightly but compensated by cross-selling to SME’s resulting in disproportionate growth in
Other Income
Net Interest Margin trend… driven by a decline in interest yieldPercentage
Net Interest Margin Yield on interest Earning Assets
10.910.9
11.911.9
Q2 ’15Q3 ’14 Q4 ’14 Q1 ’15
2.62.62.42.4
Q3 ’14 Q2 ’15Q4 ’14 Q1 ’15
13.513.514.314.3
Q3 ’14 Q4 ’14 Q1 15 Q2 15
26%
ForeignCurrency
Loans
74%
Q2 2014
82%
100%
LocalCurrency
Loans
100%
Q2 2015
18%
5

33
We are building on our momentum in Payment Processing and Merchants…
We have partnered with key payment companies…
…which has allowed us to grow our number of transactions and commissions
▪ Equity is leading in Acquiring and Issuing
▪ Best in class payment channelservices work well with merchants
6
384
244
Q2 2014
+57%
16,454
Q2 2015
+59%
10,320
Turnover (Kes Million)Commissions (Kes Million)

34
7
887
192
276
+38%
796,503
Q2 2014 Q2 2015
4,698
EQUITY DIRECT 1,561VISA DIRECT
137
PAYPAL
WESTERN UNION
3,701
MONEYGRAM
26
1,450
2,892
In KES Million
Q2 2015
66.7
+27%
84.7
Q2 2014
Commissions growthVolume growth
Diaspora Remittances

35
EGF 7 Programmatic Pillars
Monitoring and evaluation
1
2
4
3
Education and
Leadership Development
Agriculture
Entrepre-neurship
Health
Innovation
Financial Inclusion and
Literacy
Environment
7
6
5
▪ Equity Afia
▪ Cash transfers▪ Fanikisha▪ Fanikisha+ (Tanzania)▪ Financial Knowledge for
Africa training programme
▪ Forest restoration
▪ Energy program
▪ Wings to Fly Learning
▪ Equitel - MY LIFE ▪ Entrepreneurship training program
▪ Transforming smallholder farmers
▪ Accelerating medium size farms
▪ Wings to Fly▪ Equity African Leaders
Programme
8 EGF 7 Programmatic Pillars

36
10,377TOTAL WINGS TO FLY SCHOLARS
TOTAL WINGS TO FLY SCHOLARS
13,000Entrepreneurs trained
USD
192,000,000TOTAL FUNDS RAISED FOR PROGRAMSTOTAL FUNDS RAISED FOR PROGRAMS
2,673University scholars
Of which 263 are placed in top global universities
SCHOLARSSCHOLARS
98% completion93% achieved university entry grades7% achieved ‘A’ grade79% holding Leadership positions
2011 GRADUATING CLASS2011 GRADUATING CLASS
KES
29.5 billion in loans to women
EMPOWERING LOANSEMPOWERING LOANS
1,260,486 Kenyan women and youth completed the financial literacy training in financial knowledge for Africa (FiKA) programme.
WOMEN & YOUTHWOMEN & YOUTH
Impact to date
500,000Subsistence farmers converted to agri-businesses
2010 11 12 13 14 2015
10,211 Scholars availed mobile & digital learning tools
1m Trees planted
7,836 Clean energy products
distributed2,400 Medium-sized
farmers supported
8 EGF Impact

37
Qualitative Analysis

38
Equity has earned recognition in 2015
Equity’s International Rankings
Equity’s Global Credit Rating
Equity BankOverall Soundness Performance
(Capital Assets Ratio) (Profits on capital) (Return on assets)
2015 Global Rank 916 88 18 8
2014 Global Rank 999 112 8 4

39
Equity has earned substantial accolades in 2015

40
Equity has earned substantial accolades in 2015

41
Best Brand and Recognition for Transparency
2014 - Top Banking Brand in Kenya

42
Performance of Core Business (Intermediation)

43
-11%
22%
80%
40%
Growth per Class
Funding Base
4.4(1%)30.3
(10%)
Deposits
Borrowed FundsOther Liabilities
32.4%
Shareholders’ Funds 53.3(18%)
400.9
301.0(75%)
Q2 2015
27.1(7%)
7.9(2%)
214.9(71%)
Q2 2014
65.0(16%)
302.9
In KES “Billion” 32.4% growth in funding with deposits accounting for 75%

44
Customer Deposits (Group) Growth
301.0
214.9
187.1
155.7
130.1
87.8
0
20
40
60
80
100
120
140
160
180
200
220
240
260
280
300
320+40%
+48%
+20%
+20%
+15%
Q2 2015Q2 2014Q2 2013Q2 2012Q2 2011Q2 2010
Deposit (Kes Billion)
2.4%
82.1%Kenya
4.9%
Uganda
Rwanda
Q2 2015
78.0%
S. Sudan 7.9%11.0%
3.7%Tanzania
Q2 2014
100.0%
3.9%
100.0%
3.5%
2.6%
Deposit split by Country
Q2 2015
Savings
Term Deposits
100%
39%
42%
19%
Q2 2014
100%
34%
50%
16%
Current Accounts
Deposit split by type

45
Customer Deposits (EBKL) and Market Share Growth
237.7
202.7
158.7142.4
125.5
95.2
8.7%
8.0%8.1%7.9%7.3%
0
20
40
60
80
100
120
140
160
180
200
220
240
260
0
1
2
3
4
5
6
7
8
9
2010 2012 2013 2014 H1 20152011
Customer Deposit (Kes Billion)Market Share %
%
16%
35%
46%
19%
Q2 2014
100%
30%
54%
Q2 2015
Savings
100%
Term Deposits
Current Accounts
Deposit split by type (EBKL)

46
50.6(12.6%)
66.3(16.5%)
+32.4%
30.1(9.9%)
47.3(11.8%)
302.9
Government Securities
186.5(61.6%)
45.3(15.0%)
236.8(59.1%)
Q2 2015Q2 2014
41.0(13.5%)
400.9
Cash & Cash Equivalents
Net Loans
Other Assets62%
12%
57%
27%
Growth per Asset Class
32.4% growth in asset base while still maintaining portfolio diversification
Assets of KSH 401 Billion driven by stable Deposit base
In KES billion

47
Net Loans & Advances (Group) Trend
236.8
186.5
150.5
124.5
97.7
68.3
0
20
40
60
80
100
120
140
160
180
200
220
240
260
+27%
Q2 2014Q2 2013 Q2 2015
+24%
+27%
+43%
+21%
Q2 2012Q2 2011Q2 2010
Net Loans & Advances (Kes Billion)

48
Net Loans & Advances (EBKL) Trend
205.2
165.1
134.9
114.3
90.9
65.2
0
20
40
60
80
100
120
140
160
180
200
220 +24%
+22%
+26%
+39%
Q2 2015Q2 2014Q2 2013Q2 2012Q2 2010
+18%
Q2 2011
Net Loans & Advances (Kes Billion)

49
Loan book by Segment and Entity
3.4%
3.0%
2.4%
1.9%
3.3%
5.4%
2.3% 3.1%
Q2 2015
100.0%
86.6%Kenya
Uganda
S. Sudan
Tanzania
Rwanda
Q2 2014
100.0%
88.5%
Split across the entities within the GroupSplit across Segments
47.7%50.2%
7.6%6.7%
26.2%22.0%
3.4%100.0%
18.2%
2.9%
Q2 2014
100.0%
15.1%Large Enterprises
Agriculture
SME
Micro
Consumer
Q2 2015

50
4.1%3.9%3.8%4.0%4.0%
4.4%4.3%4.2%4.3%
4.6%
Q1 2015Q4 2014Q3 2014Q2 2014 Q2 2015
GroupEBKL
Stable NPL Trend over time

51
62.5%63.2%64.5%61.2%59.9%
55.4%59.8%
64.4%
51.0%53.7%
86.2%87.0%88.0%83.5%81.9%
Q2’2015Q1’2015Q4’2014Q3’2014Q2’2014
(Gen. Prov. + Spec. Prov. + Int. Susp) / Gross NPL
CBK: (Spec. Prov. + Int. Susp) / Gross NPLIFRS: Impairment per IAS39 / Gross NPL
0.58% 0.63% 0.83% 0.63%Cost of Risk: 0.61%
Non-Performing Loans: High Coverage Levels

52
Financial Performance

53
Funding Distribution
Q2 2015
Broad base liabilities & funding sources
Q2 2014 Q2 2015 Growth Y/Y
Liabilities & Capital (Bn) KSH KSH %
Deposits 214.9 301.0 40%
Borrowed Funds 30.3 27.1 (11)%
Other Liabilities 4.4 7.9 80%
Shareholders’ Funds 53.3 65.0 22%
Total Liabilities & Capital 302.9 400.9 32.4%
Q2 2014
Borrowed Funds 10%
Shareholders’ Funds
18%
Other Liabilities
Deposits
1%
71%
Other Liabilities
Deposits
5%2%
76%
Borrowed Funds
16%
Shareholders’ Funds

54
Asset Distribution
Q2 2015Q2 2014
Asset Portfolio & Distribution
Q2 2014 Q2 2015 Growth Y/Y
Assets (bn) KSH KSH %
Net Loans 186.5 236.8 27%
Cash & Cash Equivalents 41.0 66.3 62%
Government Securities 45.3 50.6 12%
Other Assets 30.1 47.3 57%
Total Assets 302.9 400.9 32.4%
62%Net Loans
15%
Cash & Cash Equivalents
Government Securities
Other Assets
14%
10% 12%
Cash & Cash Equivalents
Government Securities
Other Assets
13%
17%59% Net Loans

55
KES (Billion) H1 2014 H1 2015 Growth
Interest Income 16.97 19.27 14%
Interest Expense (2.96) (3.76) 27%
Net Interest Income 14.02 15.50 11%
Non-Funded Income 8.32 10.81 30%
Total Income 22.34 26.31 18%
Loan Loss Provision (0.52) (0.68) 32%
Staff Costs (4.98) (5.13) 3%
Other Operating Expenses (6.11) (8.41) 37%
Total Costs (11.62) (14.22) 22%
PBT 10.83 12.10 12%
Tax (3.16) (3.53) 11%
PAT 7.66 8.57 12%
Delivering 12% Growth in PBT for the Group

56
Positive Financial Ratios
Kenya Kenya Group Group
Q2 2014 Q2 2015 Q2 2014 Q2 2015
Profitability
NIM 12.2% 10.8% 11.3% 9.8%
Cost to Income Ratio (with provisions) 48% 49% 52% 54%
Cost to Income Ratio (without provision) 46% 47% 50% 51%
RoAE 26.8% 35.0% 29.3% 26.6%
RoAA 5.4% 5.1% 5.3% 4.6%
Asset Quality
Cost of Risk 0.47% 0.34% 0.58% 0.61%
Liquidity / Leverage
Loan / Deposit Ratio 93.1% 86.8% 86.9% 78.7%
Capital Adequacy Ratios
Core Capital to Risk Weighted Assets 14.1% 14.6%
Total Capital to Risk Weighted Assets 17.0% 16.6%
Core Capital to Deposits Ratio 21.5% 18.4%

57
… PBT has grown at ~17% (CAGR)
PBT evolutionCost to Income Ratio EvolutionKES Billion
12.10
10.83
8.95
7.62
17%CAGR
Q2 ’15Q2 ’14Q2 ’13Q2 ’12
▪ Total Operating Income up 18% y/y .The growth is mainly attributed to increased diversification of income streams
▪ Operating expenses up 22% y/y due to expansion on IT capacity
The growth in Profit attributed to diversification of revenue streams (non-interest income activities)
51.4%49.7%49.0%49.9%47.4%46.0%44.8%46.7%
Q2 ’12 Q2 ’14Q2 ’13 Q2 ’15
BankGroup

58
35.0%35.9%
29.8%25.6% 26.6%27.6%
29.7%27.6%
Q2 ’15Q1 ’15Q4 ’14Q3 ’14
GroupEBKL
RoAE
5.1%5.2%
6.4%
5.2%4.6%4.8%
5.5%4.9%
Q3 ’14 Q1 ’15 Q2 ’15Q4 ’14
GroupEBKL
RoAA
39
Stable RoAA and RoAE overtime

59
Equity Bank is amongst the most profitable banks in Africa and the broader emerging markets
Equity Bank is amongst the most profitable banks in Africa and the broader emerging markets
SOURCE: The Banker Top 1000 Banks 2014 report; Annual Reports; press articles; McKinsey

60
Appendix

61
Cost of funds
Uganda Net interest margin …
Net Interest Margin over time … … driven by a decline in yield on interest
Percentage
Net Interest Margin Yield on interest Earning Assets
9.79.6
10.810.3
Q4 ’14 Q2 ’15Q3 ’14 Q1 ’15
3.53.13.53.8
Q4 ’14Q3 ’14 Q2 ’15Q1 ’15
13.212.614.314.1
Q1 15Q3 ’14 Q2 15Q4 ’14
30%
100%
Q2 2014
70%
ForeignCurrency
Loans49%
100%
Q2 2015
51%
LocalCurrency
Loans
…due to growing FX loans

62
Cost of funds
Tanzania Net interest margin …
Net Interest Margin over time …… driven by a decline in yield on interest
Percentage
Net Interest Margin Yield on interest Earning Assets
4.74.6
4.3
4.8
Q4 ’14Q3 ’14 Q2 ’15Q1 ’15
5.45.76.46.5
Q4 ’14 Q1 ’15 Q2 ’15Q3 ’14
10.010.410.711.3
Q1 15Q4 ’14 Q2 15Q3 ’14
100%
Q2 2014
62%
51%
38%
Q2 2015
49%
100%
ForeignCurrency
Loans
LocalCurrency
Loans
…due to growing FX loans

63
Cost of funds
Rwanda Net interest margin …
Net Interest Margin over time …… driven by a decline in yield on interest
Percentage
Net Interest Margin Yield on interest Earning Assets
9.19.5
8.3
7.0
Q3 ’14 Q2 ’15Q1 ’15Q4 ’14
1.71.73.23.1
Q1 ’15Q4 ’14Q3 ’14 Q2 ’15
10.811.211.510.1
Q1 15 Q2 15Q4 ’14Q3 ’14
ForeignCurrency
Loans
LocalCurrency
Loans
Q2 2015
100%
67%
33%
7%
100%
Q2 2014
93%
…due to growing FX loans

64
Cost of funds
South Sudan Net interest margin …
Net Interest Margin over time … … driven by a decline in yield on interest
Percentage
Net Interest Margin Yield on interest Earning Assets
2.6
3.1
3.5
3.7
Q2 ’15Q1 ’15Q4 ’14Q3 ’14
0.20.20.40.4
Q2 ’15Q1 ’15Q4 ’14Q3 ’14
2.93.33.94.1
Q2 15Q1 15Q4 ’14Q3 ’14

65
Performance Trend – Banking Entities
FY 2012 FY 2013 FY 2014 H1 2015Tanzania 117% 84% 77% 64%Rwanda 149% 116% 80% 70%South Sudan 55% 63% 70% 60%Uganda 89% 90% 85% 77%
Cost / Income Ratio Trend
FY 2012 FY 2013 FY 2014 H1 2015Tanzania N/A -157% 315% 159%Rwanda -296% -40% -219% 499%South Sudan 78% -74% 112% -5%Uganda 192% -3% 96% -8%
PBT Growth Trend
FY 2012 FY 2013 FY 2014 H1 2015Tanzania N/A 102% 90% 32%Rwanda 99% 83% 87% 15%South Sudan 10% 18% 31% 32%Uganda 6% 30% 8% 11%
Asset Growth Trend

66
RoAE and RoAA Trend – Banking Entities
FY 2012 FY 2013 FY 2014 H1 2015Tanzania -5.9% 3.8% 6.1% 9.6%Rwanda -18.6% -24.6% 11.7% 11.6%South Sudan 40.6% 5.6% 13.5% 17.8%Uganda 3.6% 12.6% 4.0% 1.9%
RoAE Trend
FY 2012 FY 2013 FY 2014 H1 2015Tanzania -1.9% 0.8% 1.1% 1.5%Rwanda -6.4% -4.4% 2.2% 2.4%South Sudan 4.5% 0.8% 1.9% 2.1%Uganda 0.6% 2.0% 0.6% 0.2%
RoAA Trend

67
Loan Growth and NPL Trend – Banking Entities
FY 2012 FY 2013 FY 2014 H1 2015Tanzania 0.7% 1.7% 2.3% 2.5%Rwanda 0.6% 2.4% 3.6% 4.2%South Sudan 1.3% 11.6% 24.7% 27.7%Uganda 3.5% 4.2% 3.8% 3.5%
NPL Trend
FY 2012 FY 2013 FY 2014 H1 2015Tanzania N/A 229.9% 116.4% 113.1%Rwanda 3876.9% 112.6% 70.7% 72.5%South Sudan 124.5% 23.4% -16.6% -18.1%Uganda 10.9% 1.9% -0.7% 14.5%
Loan Growth Trend

68
Equity vs Kenyan Peers
Price-to-Book (P/B)
Equity Group 2.9 Competitor 1 2.3 Competitor 2 2.2 Competitor 3 1.9 Competitor 4 1.7
Current Market Cap (USD million)
Equity Group 1,712 Competitor 1 1,598 Competitor 2 1,005 Competitor 3 414 Competitor 4 313
Price-to-Earnings (P/E)
Equity Group 9.1 Competitor 1 7.2 Competitor 2 9.8 Competitor 3 11.2 Competitor 4 8.9
5-Year CAGR (Total Assets)
Equity Group 25%Competitor 1 18%Competitor 2 17%Competitor 3 7%Competitor 4 25%
5-Year Average RoAE
Equity Group 30%Competitor 1 25%Competitor 2 26%Competitor 3 13%Competitor 4 23%
Valuation Comparables
Operating Benchmarks

69
Update on ProCredit DRC
Case for DRC – Economic Outlook
Strong Infrastructure Development§ Rural electrification and dam projects valued USD 53.4mn and modernization of road and transport infrastructure at USD 824mn.§ Ongoing construction of a hydro dam with capacity of 4,800 MW at USD 12bn cost.§ Ongoing establishment of industrial zones (eg: Maluku in Kinshasa).
Stable & Positive Macroeconomic Prospect§ Real GDP growth is estimated to hit 8.6% in 2014 and maintain an average of 7.2% from 2015 to 2019.§ Inflation expected to remain at single-digit levels over the next 5 years.§ Expected rise in domestic consumption and FDI inflows will lead to a more robust and stable economy.
Expanding Oil and Gas Sector
§ In 2014, Oil of DRC, owned by Israeli billionaire Dan Gertler discovered 3 billion barrels of oil which is expected to expand thesector.
§ Oil from the newly discovered field is expected to increase GDP by 25%.
Ongoing Public Sector Reforms§ Ongoing reforms to ensure that all public sector workers and state officials are paid via the banking system§ Ongoing reforms with the World Bank to improve economic governance§ The Mining Code is being revised in order to increase transparency and government’s benefit from expansion of the mining
industry

70
Low banking penetration levels in DRC
High interest rate spreads in DRC Banking sector dominated by Congolese families
§ Banking sector assets stood at $ 4.3 billion in 2013.
§ 18 banks serving a population of 69 million people.
§ Top 5 banks (4 family controlled) hold 71% of deposits.
Case for DRC (banking sector)
26%
53%Kenya
27%Rwanda
50%Nigeria
DRC
Ghana
19%
Banking Asset/GDP (%)Source: World bank
UK
DRC
2%
2%
6%
US
11%
South Africa
Nigeria
30%
Banking Asset Growth RatesSource: PWC
Significant growth in banking sector assets in DRC
54%44%
2%
Family controlled banksForeign controlled banksOthers
4%
21%DRC
9%Nigeria
9%Kenya
UK
USA
2%
Interest Rate SpreadsSource: World bank
Share of Total AssetsSource: Moodys

71
Case for ProCredit
Attractive asset with significant scale
Impressive performance & strong growth prospects
Significant non-interest income
Leading technology platform
Extensive distribution channels with considerable CASA
Experienced mgmt. team and efficient workforce
Unparalleled Corporate Governance
- Ranks as 7th largest bank by assets ($204m in assets)- 5% market share of the industry’s total deposit- 170k active accounts
- Asset growth of 20.4% (2012-2013)- Growing non-interest income (+25% of total income)- Average cost of funds of 0.7% and Pre-tax ROAE of 19.1%
- POS turnover of $1.4m per month- 80k clients have debit card- 50k m-banking and e-banking services clients
- Efficient and reliable Quipu in-house software (also used in global offices)- Existing e-banking and mobile banking platforms and self service terminals- Piloting first national SWIFT system
- 15 branches: 50 ATMs: 350 POSs; 20 Cash-In Terminals- First mover advantage in cards & e-business with Visa- Deposits with CASA of 93%
- Well-trained team with several years of banking experience- Management and staff have gone through ProCredit Academy Programmes- Staff reduced from 500 to 370 via staff restructuring (2010 –May 2014)
- Managed in line with German standards of high level of transparency- Strong risk management culture- Good relations with Banque Centrale du Congo and other authorities
Fast growing economy and sector with room for growth
- Economy driven by investment in the mining sector- GDP growth of 8.5% in 2013 coupled with low inflation of 1.3% (June 2014)- $4bn sector with 4yr CAGR of 26%- Low penetration levels in a large market of ~70 mn people

72
THANK YOUDr James Mwangi, CBSGroup Managing Director & CEO
KeEquityBank@KeEquityBank
Email: [email protected] site: www.equitybankgroup.com