Equity Focus list - financ · PDF filegists’ outlook on economic growth, asset alloca-...
26
Equity Focus list CIO Wealth Management Research June 2013 This report has been prepared by UBS Financial Services Inc. ("UBS FS"). ANALYST CERTIFICATION AND REQUIRED DISCLOSURES BEGIN ON PAGE 25. UBS does and seeks to do business with companies covered in its research reports. As a result, investors should be aware that the firm may have a conflict of interest that could affect the objectivity of this report. Investors should con- sider this report as only a single factor in making their investment decision.
Transcript of Equity Focus list - financ · PDF filegists’ outlook on economic growth, asset alloca-...

Equity
Focus list CIO Wealth Management Research
June 2013
This report has been prepared by UBS Financial Services Inc. ("UBS FS"). ANALYST CERTIFICATION AND REQUIRED DISCLOSURES BEGIN ON PAGE 25. UBS does and seeks to do business with companies covered in its research reports. As a result, investors should be aware that the firm may have a conflict of interest that could affect the objectivity of this report. Investors should con-sider this report as only a single factor in making their investment decision.

How does the list work?
The Equity Focus List integrates the strong intellectual capital across multiple research disciplines within the UBS CIO Wealth
Management Research team into a list of stocks that is designed to outperform the broad US equity market. Stocks chosen for the list are best aligned with the following disciplines: our House View, Fundamentals, Technicals, Thematics and Quantitative (described below). The CIO WMR Stock Selection Committee uses these tools to determine the final composition of the list.
House view Ticker Name Sector PageCMCSA Comcast Consumer Discretionary 7NKE Nike Consumer Discretionary 7ORLY O’Reilly Automotive Consumer Discretionary 8HOT Starwood Hotels Consumer Discretionary 8TJX TJX Companies Consumer Discretionary 9
The House View incorporates our macro strate-gists’ outlook on economic growth, asset alloca-tion, risk-taking, regional equity recommenda-tions, sector preferences within the US equity market, as well as US equity size and style tilts.
CLX Clorox Consumer Staples 9Fundamentals KO Coca-Cola Consumer Staples 10
CL Colgate-Palmolive Consumer Staples 10MRO Marathon Oil Energy 11PSX Phillips 66 Energy 11AFL Aflac Financials 12AMP Ameriprise Financials 12
We incorporate bottom-up industry analyst rat-ings from both UBS CIO Wealth Management Research and UBS Investment Research. Stocks must have a positive or neutral view from either source to be considered.
FITB Fifth Third Bancorp Financials 13Technicals JPM JPMorgan Financials 13
PRA ProAssurance Financials 14WFC Wells Fargo Financials 14ABT Abbott Laboratories Healthcare 15ESRX Express Scripts Healthcare 15MCK McKesson Healthcare 16
Stocks must have a Bullish or Neutral technical rating. Stocks with a Neutral technical rating in-cluded on the list require a favorable risk / re-ward with a material probability of breaking into a bullish trend.
MDT Medtronic Healthcare 16Thematic IR Ingersoll-Rand Industrials 17
KBR KBR Industrials 17TYC Tyco Industrials 18UPS United Parcel Service Industrials 18ACN Accenture Information Technology 19CSCO Cisco Systems Information Technology 19
We incorporate selections that we expect to benefit from our highest conviction tactical or secular equity themes based on previously pub-lished thematic research or theme-based re-search embedded in CIO WMR strategy reports.
GOOG Google Information Technology 20Quantitative LRCX Lam Research Information Technology 20
QCOM Qualcomm Information Technology 21SNDK SanDisk Information Technology 21CE Celanese Materials 22CPN Calpine Utilities 22
Our quantitative framework identifies factors that have produced historical outperformance within each industry group and then scores the current constituents of each industry group ac-cording to those factors. Factors encompass valuation, growth, quality, and momentum.
UBS CIO WMR Stock Selection Committee
David Lefkowitz, CFA, Chair Senior Equity Strategist Michael Dion, CFA Co-Head Sector Research Stephen Freedman, PhD, CFA (*)Co-Head Investment Strategy
Peter Lee Chief Technical Strategist Jonathan Woloshin, CFA Co-Head Sector Research Jeremy A. Zirin, CFA Chief Equity Strategist
Authors
David Lefkowitz, CFA, Senior Equity Strategist [email protected]
Jeremy A. Zirin, CFA, Chief Equity Strategist [email protected]
Peter Lee, Chief Technical Strategist [email protected]
(*) Non-voting

House view — US equities
US equity market overview Despite strong year-to-date gains, we see further up-side potential for US equities. Several of the upside risks for US equity markets that we identified in our 2013 outlook report in December 2012 are visibly playing out—housing fundamentals continue to improve, domes-tic energy production is surging, fiscal policy risks have become less acute, and dividends and share repurchases are accelerating. We now expect S&P 500 earnings per share to grow by 7% in both 2013 and 2014, up slightly from our prior expectations of 5-6%. Despite fears of an eventual Fed “taper”, we expect that the Federal Re-serve’s bond buying program will be in place until the fourth quarter of the year and then will only gradually be reduced. Our six month price target on the S&P 500 is 1730.
Fig. 1: Stocks reached all-time highs in late 1Q13…18 months after earnings S&P 500 price and EPS, indexed to 2007 Q2
20
40
60
80
100
120
1990 1994 1998 2002 2006 2010 2014
S&P 500 index price S&P 500 EPS, trailing 12-month
Source: Bloomberg, Standard & Poor's, UBS CIO WMR, as of 30 May 2013
Sector outlook We have a strong preference for cyclical over defen-sive sectors, with overweight allocations to Information Technology (IT), Industrials, and Consumer Discretionary. We are also overweight Financials, which should benefit from improving capital market activity, rising bond yields, and a sustained upturn in housing. Within defensive ar-eas of the market, we favor Consumer Staples and seg-ments of Healthcare (equipment and services). We re-cently downgraded Energy to underweight, and remain underweight market segments with high dividend yields and elevated relative valuations, such as Utilities, Tele-com, and Real Estate Investment Trusts.
Fig. 2: Low cyclical sector relative valuations should rise as the economic outlook improves Relative P/E of cyclicals versus defensives
60%
80%
100%
120%
140%
160%
180%
1995 1997 1999 2001 2003 2005 2007 2009 2011 2013
11% discount
Source: Bloomberg, UBS CIO WMR, as of 30 May 2013 Size and style We are overweight both small-caps and mid-caps relative to large-caps and have a moderate preference for growth over value. Smaller size segments should derive a greater benefit from an improving US economy, particu-larly US housing. Additionally, most of the traditional drivers of the relative performance between size seg-ments—rising markets, falling credit spreads versus Treasuries, and subdued market volatility—favor smaller size segments. Valuation continues to favor growth over value within style segments. Also, sector influences play a strong role in determining the relative performance of growth versus value. An improving outlook for Financials boosts value, but our strongest sector preference remains Technology, the largest weight in the growth index.
Fig. 3: Small- and mid-caps have greater exposure to US housing New and existing home sales (in millions), 6-month m.a.
012345678
1994 1996 1998 2000 2002 2004 2006 2008 2010 2012
0.00.20.40.60.81.01.21.41.6
Existing home sales (left) New home sales (right)
Source: Bloomberg, UBS CIO WMR, as of 30 May 2013

Themes
US Housing—the long grind higher The US housing recovery has already begun and should contribute to US GDP growth in the coming years. We expect home prices to continue to rise as supply/demand dynamics are supportive within the market. While many housing-related stocks have already delivered strong out-performance over the past 12-18 months, we view an improving housing market as a strong support for Finan-cials, specifically regional and global banks. Other indus-tries that have attractive valuations and housing market exposure include autos, cable TV, home furnishing, ma-chinery, and retailing.
Fig. 1: US home price gains to continue US inflation-adjusted market and equilibrium house price, loga-rithm of normalized index
-0.2-0.10.00.10.20.30.40.50.6
Q1 1987 Q1 1992 Q1 1997 Q1 2002 Q1 2007 Q1 2012
US market house price US equilibrium house price
Note: We use the S&P/Case-Shiller Home Price Index to measure the US national
single-family house price
Source: Thomson DataStream, UBS CIO WMR, as of 30 May 2013 Emerging consumers—more people, more money As emerging markets continue to grow, we believe that the resulting growth in the middle class will lead to in-creased demand for numerous consumer products and services, including both basic necessities (food, shelter, clothing) and discretionary items/services (automobiles, luxury goods, travel). There are a broad range of compa-nies that stand to benefit from the rise of emerging mar-ket consumers in the Consumer Staples, Healthcare and Consumer Discretionary sectors. The driver of the emerg-ing market consumption theme is relatively straightfor-ward: more people, more money.
Fig. 2: EM countries have room to expand consumption Household final consumption expenditure, as a share of GDP
30%35%40%45%50%55%60%65%70%75%
US Turkey Mexico Brazil India Indonesia Russia China
Source: World Bank, UBS CIO WMR, as of 30 May 2013 Technology—secular growth, on sale The technology sector is uniquely positioned to experi-ence strong growth in the coming years. The secular growth drivers within technology include smart mobility, cloud computing, e-commerce and big data. In addition, the sector will continue to increase its exposure to emerging markets, where penetration rates on smart-phones and more traditional computing devices are still relatively low. Many US tech companies dominate their categories globally and are well positioned to capture a significant portion of the expected growth within these markets. The technology sector should also benefit from a cyclical pickup in enterprise spending on IT products and services.
Fig. 3: Technology to benefit from rising smartphone penetration Global unit shipment forecasts, in millions
0
500
1000
1500
2000
2500
2011 2012 2013E 2014E 2015E 2016ESmartphones Feature phones
Source: UBS CIO WMR, as of 30 May 2013
Themes
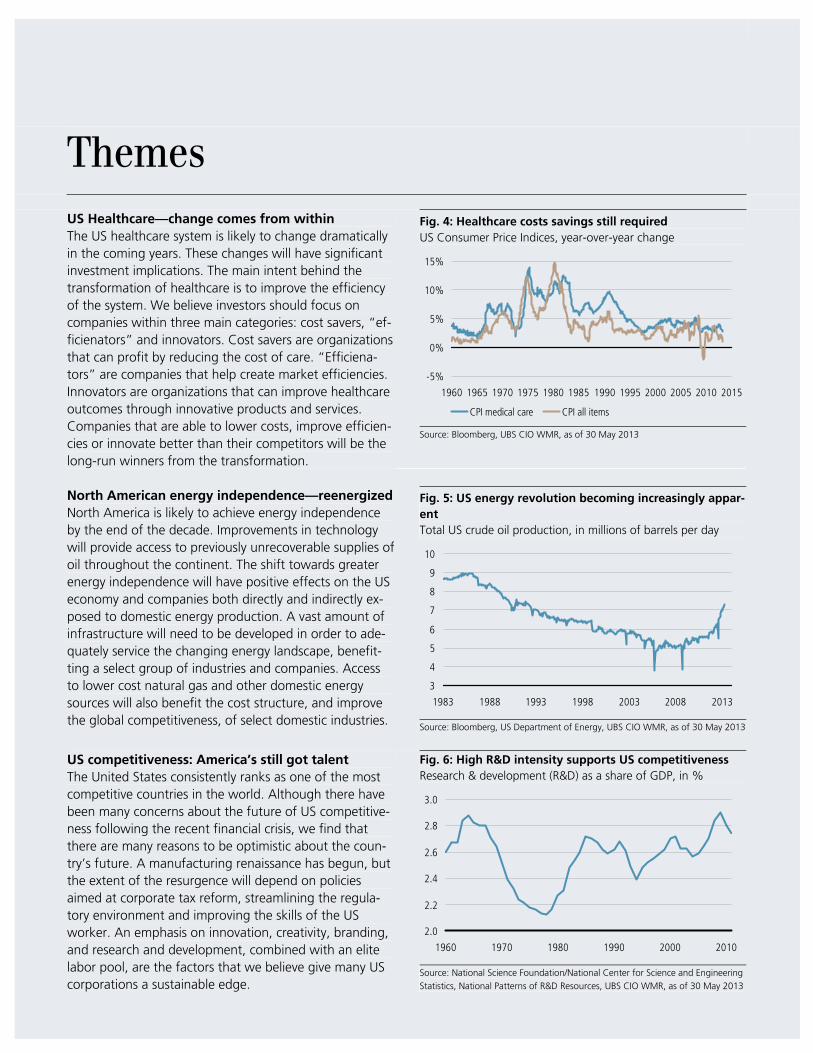
US Healthcare—change comes from within The US healthcare system is likely to change dramatically in the coming years. These changes will have significant investment implications. The main intent behind the transformation of healthcare is to improve the efficiency of the system. We believe investors should focus on companies within three main categories: cost savers, “ef-ficienators” and innovators. Cost savers are organizations that can profit by reducing the cost of care. “Efficiena-tors” are companies that help create market efficiencies. Innovators are organizations that can improve healthcare outcomes through innovative products and services. Companies that are able to lower costs, improve efficien-cies or innovate better than their competitors will be the long-run winners from the transformation.
Fig. 4: Healthcare costs savings still required US Consumer Price Indices, year-over-year change
-5%
0%
5%
10%
15%
1960 1965 1970 1975 1980 1985 1990 1995 2000 2005 2010 2015
CPI medical care CPI all items
Source: Bloomberg, UBS CIO WMR, as of 30 May 2013
North American energy independence—reenergizedNorth America is likely to achieve energy independence by the end of the decade. Improvements in technology will provide access to previously unrecoverable supplies of oil throughout the continent. The shift towards greater energy independence will have positive effects on the US economy and companies both directly and indirectly ex-posed to domestic energy production. A vast amount of infrastructure will need to be developed in order to ade-quately service the changing energy landscape, benefit-ting a select group of industries and companies. Access to lower cost natural gas and other domestic energy sources will also benefit the cost structure, and improve the global competitiveness, of select domestic industries.
Fig. 5: US energy revolution becoming increasingly appar-ent Total US crude oil production, in millions of barrels per day
3
4
5
6
7
8
9
10
1983 1988 1993 1998 2003 2008 2013
Source: Bloomberg, US Department of Energy, UBS CIO WMR, as of 30 May 2013 US competitiveness: America’s still got talent The United States consistently ranks as one of the most competitive countries in the world. Although there have been many concerns about the future of US competitive-ness following the recent financial crisis, we find that there are many reasons to be optimistic about the coun-try’s future. A manufacturing renaissance has begun, but the extent of the resurgence will depend on policies aimed at corporate tax reform, streamlining the regula-tory environment and improving the skills of the US worker. An emphasis on innovation, creativity, branding, and research and development, combined with an elite labor pool, are the factors that we believe give many US corporations a sustainable edge.
Fig. 6: High R&D intensity supports US competitiveness Research & development (R&D) as a share of GDP, in %
2.0
2.2
2.4
2.6
2.8
3.0
1960 1970 1980 1990 2000 2010
Source: National Science Foundation/National Center for Science and Engineering
Statistics, National Patterns of R&D Resources, UBS CIO WMR, as of 30 May 2013

Themes
Dividend growth stocks—don’t overpay for yield Historically, stocks that have consistently increased divi-dend payments year after year have generated solid in-vestment results. Our Dividend Ruler Stock List look for companies that meet four criteria: 1) an indicated divi-dend yield greater than that of the S&P 500; 2) solid fun-damentals/valuations, as gauged by our analyst ratings; 3) high historical dividend growth; and 4) strong histori-cal dividend consistency. We currently find that compa-nies with only the highest dividend yield are trading at very high valuation levels relative to companies that con-sistently deliver strong and consistent dividend growth.
Fig. 7: High dividend growth is at record low valuations relative to high dividend yield Relative P/E valuation of high dividend growth stocks versus high dividend yielding stocks
0.8
0.9
1.0
1.1
1.2
1.3
1.4
1.5
1.6
1995 1997 1999 2001 2003 2005 2007 2009 2011 2013
Source: FactSet, UBS CIO WMR, as of 23 May 2013 Q-GARP—quality growth at a reasonable price For our Q-GARP stock list, we screen for stocks that score highly on three characteristics: quality, secular earnings growth, and valuation. To measure quality, we look for companies that are highly profitability (high re-turn on equity) with low variability of their profit mar-gins. For growth, we look both at both the near-term and long-term earnings growth outlook. Lastly, we ex-amine valuation versus peers, relative to long-run histori-cal averages. We believe that growth stocks appear well positioned to outperform value stocks, but by definition growth stocks carry higher valuations. Our Q-GARP list attempts to handpick the most interesting secular growth stocks.
Fig. 8: Growth stock valuations remain attractive relative to value Growth P/E relative to Value P/E
1.0x
1.1x
1.2x
1.3x
1.4x
1.5x
1.6x
1.7x
1.8x
1979 1983 1987 1991 1995 1999 2003 2007 2011
Growth P/E relative to Value P/E Avg excl. Tech bubble
Source: Russell, UBS CIO WMR, as of 30 May 2013

Equity Focus List June 2013 7
Equity focus list Comcast (CMCSA) – Consumer Discretionary Nike (NKE) – Consumer Discretionary
House view – Preference for Growth stocks
Fundamentals – CIO WMR: Outperform; IB: Buy
Technicals – Bullish
Thematic – Member of Q-GARP and US housing lists
Quant – Low valuation; attractive growth
House view – Preference for Growth stocks
Fundamentals – CIO WMR: Marketperform; IB: Buy
Technicals – Bullish
Thematic – Member of Q-GARP List
Quant – Good asset turnover; strong balance sheet
Investment thesis Comcast is the largest broadband and pay TV provider in the US. Our positive view on Comcast largely rests on the company’s strong position in the broadband business. Due to cable’s superior broadband infrastructure, pricing power remains quite favorable (see chart below). More tactically, earlier this year the company acquired the 49% stake of NBCUniversal that it had not previously owned. The purchase is accretive to earnings and enables share-holders to fully capture potential upside from ongoing improvements at NBC. The company also stands to benefit from a recovering housing market, as new homes are added to its network. Industry-wide concerns about higher content costs for cable TV providers are mitigated by the company’s own-ership of NBCUniversal. The stock is trading at 16x for-ward earnings, a 10% premium to the market, but justi-fied by its strong competitive advantages, and share-holder friendly management team.
Investment thesis Nike is a footwear, athletic apparel and sports equipment manufacturer, with one of the strongest global consumer brands. This brand strength, a strong product pipeline, direct to consumer initiatives and emerging market con-sumer growth opportunities underpin our outlook for consistent long term earnings growth. In the near-term the company has potential upside from a turnaround in its China business, improvements in gross margins and continued innovation-driven market share gains in both basketball and running footwear. Looking further out, the 2014 World Cup and 2016 Olympics (both in Brazil) present opportunities for Nike to expand in this important emerging market. While market share in women’s apparel is low (<5%) it is a key growth initiative and potential source of upside. Nike generates solid free cash flow and has ramped up share repur-chases and dividends. Valuation relative to the market is in line with average levels over the last three years.
Broadband is driving solid pricing power Revenue per customer, in USD, brown bars reflect estimates
120125130135140145150155160165
3Q11 4Q11 1Q12 2Q12 3Q12 4Q12 1Q13 2Q13E 3Q13E
Source: UBS Investment Research, UBS CIO WMR, as of 30 May 2013
Nike: strong brand, strong returns Return on invested capital
0%
5%
10%
15%
20%
25%
FY01 FY03 FY05 FY07 FY09 FY11
Source: Bloomberg, UBS CIO WMR, as of 30 May 2013

8 Equity Focus List June 2013
Equity focus list O’Reilly Automotive (ORLY) – Consumer Discretionary Starwood Hotels (HOT) – Consumer Discretionary
House view – Preference for Growth stocks
Fundamentals – CIO WMR: Not Rated; IB: Buy
Technicals – Bullish
Thematic – Member of Q-GARP List
Quant – Good cash conversion; attractive free cash flow yield
House view – Preference for Growth stocks
Fundamentals – CIO WMR: Marketperform; IB: Buy
Technicals – Bullish
Thematic – Member of Q-GARP List
Quant – Good cash conversion; attractive growth Investment thesis O’Reilly is the second largest auto parts retailer in the US. The auto parts market is fragmented, with the top three retailers comprising only 30% of the market. Geographic expansion has enabled O’Reilly to post consistent top-line growth and has driven market share gains and same store sales growth that is typically better than peers. Effective inventory management enables O’Reilly to carry the largest selection of parts and serve both retail and professional consumers. An aging vehicle fleet and rising vehicle maintenance costs also underpin the growth out-look. Tactically, the company faces easy comparisons this year as the warm winter in 2012 enabled many car own-ers to forgo seasonal maintenance. In addition, manage-ment is reducing working capital needs and recently rolled out a loyalty rewards program. Profit margins have historically been fairly stable and the company has consis-tently generated solid returns on capital. O’Reilly regularlyreturns cash to shareholders.
Investment thesis Starwood Hotels is a global lodging company that is well positioned within the lodging industry given its focus on high-end consumers and business travelers. Recently, management raised the low end of its RevPAR guidance (revenue per available room, a proxy for pricing) by 100 basis points and guided 2013 earnings slightly above consensus. Strong pricing power is underpinned by limited new sup-ply additions in the lodging industry. Starwood should benefit from ongoing US economic growth as well as a recovery in overseas markets. In addition, Starwood is freeing up capital and creating a steadier cash flow stream by transitioning from owning its hotel rooms to a royalty model. Management has shown a commitment to shareholder value, by returning USD 1.8bn to sharehold-ers in the form of share repurchases and dividends since 2008.
Further consolidation likely to boost growth Number of auto parts stores, in thousands
05
10152025303540
2006 2007 2008 2009 2010 2011 2012
Top Ten Auto Parts Stores Industry
Source: O'Reilly, UBS CIO WMR, as of 30 May 2013
Technicals: Starwood breaking out Share price, in US dollars
01020304050607080
2007 2008 2009 2010 2011 2012 2013
Price 10-week m.a. 30-week m.a.
Symmetrical triangle breakout above the low 60s
Source: Bloomberg, UBS CIO WMR, as of 30 May 2013

Equity Focus List June 2013 9
Equity focus list TJX Companies (TJX) – Consumer Discretionary Clorox (CLX) – Consumer Staples
House view – Overweight Consumer Discretionary
Fundamentals – CIO WMR: Not Rated; IB: Buy
Technicals – Bullish
Thematic – Member of Q-GARP and US housing lists
Quant – Attractive free cash flow yield; good cash conversion
House view – Consumer Staples: preferred defensive sector
Fundamentals – CIO WMR: Outperform; IB: Neutral
Technicals – Bullish
Thematic – Member of Dividend Ruler Stock List
Quant – Attractive valuation; above average gross margins Investment thesis TJX is the leading off-price apparel and home furnishing retailer in the US and Canada, and is the only major off-price retailer chain in Europe. In the US, its brands include T.J. Maxx, Marshalls, and HomeGoods. The company has an enviable execution track record. Over its 35-year his-tory, only once has the company reported negative same store sales. The company is also leveraged to the ongoing, and in our view durable, recovery in the US housing market. Home furnishings account for roughly 30% of sales. TJX is cur-rently pioneering off-priced retailing in Europe and early results have been encouraging. Store traffic among younger customers has improved, which should support future sales growth. The company plans to roll out a new e-commerce strategy in the coming quarters. Relative valuations are only slightly higher than historical aver-ages.
Investment thesis Clorox, a diversified consumer products company, is at-tractive relative to peers in the current environment con-sidering its minimal exposure to weak regional end-markets (Europe). Sales volume and earnings momentum should improve in calendar 2013 driven by product inno-vation, particularly in its bleach business, coupled with margin expansion potential from productivity programs. Consensus earnings expectations appear relatively low and the majority of Street analysts are cautious on the stock, providing the potential for earnings “beats” and analyst upgrades to be a catalyst for the shares. Over the past ten years, Clorox has also delivered consistent divi-dend growth and currently has an attractive dividend yield of 3.4%. In terms of valuation, Clorox trades at a 10% valuation premium to the Consumer Staples sector, only slightly higher than its average premium over the past ten years.
16 consecutive years of positive same store sales growth Same store sales, year-over-year percent change
-2%-1%0%1%2%3%4%5%6%7%8%
1990 1993 1996 1999 2002 2005 2008 2011 2014E
Note: Light shading indicates UBS Investment Research estimates.
Source: FactSet, TJX, UBS Investment Research, UBS CIO WMR, as of 30 May
2013
Lower overhead & commodity costs to boost margins EBIT margins
14.0%14.5%15.0%15.5%16.0%16.5%17.0%17.5%18.0%18.5%
2008 2009 2010 2011 2012 2013E 2014E
Note: Tan bars indicate company guidance, with lighter shade indicating range of
expectations.
Source: Clorox, UBS CIO WMR, as of 30 May 2013

10 Equity Focus List June 2013
Equity focus list Coca-Cola (KO) – Consumer Staples Colgate-Palmolive (CL) – Consumer Staples
House view – Consumer Staples: preferred defensive sector
Fundamentals – CIO WMR: Outperform; IB: Neutral
Technicals – Bullish
Thematic – EM Consumer; member of Dividend Ruler Stock List
Quant – High gross margins; attractive valuation
House view – Consumer Staples: preferred defensive sector
Fundamentals – CIO WMR: Outperform; IB: Neutral
Technicals – Bullish
Thematic – EM Consumer; member of Div Ruler & Q-GARP Lists
Quant – High gross margins; good cash conversion Investment thesis Coca-Cola is the world's largest beverage company. Coke's high and stable profit margins and consistent long term growth are underpinned by one of the most recog-nized brands in the world. Coke has rejuvenated its brands through innovation and re-investment in the busi-ness, and has expanded its portfolio of non-carbonated beverages such as water, juice, and energy drinks to meet consumer demand for healthier beverage alterna-tives. Coke’s global brand recognition and the relatively low price point for its products should drive further global penetration, as strong growth in emerging markets con-tinues to underpin healthy global unit case growth. Pro-ductivity programs and, over time, refranchising its distri-bution network in North America should drive margin expansion. Cash flow remains strong, and the company consistently returns cash to shareholders via dividends and stock buybacks. Valuation is in line with long term averages.
Investment thesis Colgate continues to deliver solid execution and is one of the best-positioned companies in the Consumer Staples sector given its strong brands in attractive categories, particularly oral care. Over half of total revenues (52%) are derived in faster-growth emerging economies, and the company maintains leading or near-leading market shares across the BRIC regions. Colgate's steady margin expansion over the last decade is a reflection of the company’s strong market position, solid brand recognition as well as the success of its ongo-ing cost savings programs. Going forward, the company’s new product pipeline should bolster top-line growth and a new restructuring program should deliver cost savings later this year. We also like the stock for its strong and consistent dividend growth. Colgate has increased its dividend for the last 51 consecutive years, including a 10% increase announced this March.
Steady volume growth for Coca-Cola Global unit case volume growth, year-over-year
0%
1%
2%
3%
4%
5%
6%
1Q09 3Q09 1Q10 3Q10 1Q11 3Q11 1Q12 3Q12 1Q13
Source: Coca-Cola, UBS CIO WMR, as of 30 May 2013
More than half of Colgate sales from Emerging Markets Percent of total sales, by geography
17%24%
52%
7%
North America
Emerging markets
Western Europe
Other developed markets
Source: Colgate-Palmolive, UBS CIO WMR, as of 30 May 2013

Equity Focus List June 2013 11
Equity focus list Marathon Oil (MRO) – Energy Phillips 66 (PSX) – Energy
House view – Favor higher production growth within Energy
Fundamentals – CIO WMR: Marketperform; IB: Buy
Technicals – Bullish
Thematic – North America Energy Independence
Quant – Low valuation
House view – Crude / WTI spread to remain
Fundamentals – CIO WMR: Marketperform; IB: Buy
Technicals – Not Rated; not enough price history
Thematic – North America Energy Independence
Quant – Low valuation, strong balance sheet Investment thesis Marathon Oil is an international energy company in-volved in the exploration and production of crude oil and natural gas. The company is leveraged to domestic oil and gas production growth, with operations in the Eagle Ford, Bakken and Oklahoma resource basins. MRO spun off its downstream business (now Marathon Petroleum Corporation) in 2011. While production growth had been inconsistent prior to 2011, the company’s increase in its Eagle Ford acreage in the past two years has enabled increased production growth visibility, which management pegs at 5-7% through 2017. This propels cash flow per share growth, which should be nearly twice the level of peers, yet valua-tions are in line with its closest comparables. While we expect oil prices to be generally range-bound over the next few years, MRO’s production growth and low valua-tion should support solid share price gains.
Investment thesis Phillips 66 was spun off from ConocoPhillips in 2012. As a US refiner (with some overseas assets), PSX is a benefi-ciary of the US energy boom. The surge in domestic oil production has outpaced the industry’s ability to process and transport the commodity. In addition, there are legal restrictions on exporting US crude. As a result, domestic oil prices (WTI) trade at a discount to global oil prices (Brent), which gives US-based refiners a cost advantage. In addition, US refineries are run on relatively inexpensive domestic natural gas. These advantages for US refiners are likely to persist. PSX also owns midstream and chemi-cals businesses, which are also benefitting from the do-mestic energy boom. Some of the energy infrastructure assets may be put into an MLP which could be value-accretive for shareholders. The company has indicated that it intends to continue to increase dividends and share repurchases.
Eagle Ford Shale fuels high-margin production growth Marathon Oil production, in barrels of oil equivalent per day
0
100
200
300
400
500
600
700
4Q11 1Q12 2Q12 3Q12 4Q12 1Q13 2017Eagle Ford Total company
Source: Marathon Oil, UBS CIO WMR, as of 30 May 2013
Wide spread between Brent and WTI benefits refiners Brent/WTI spread and “Crack spread”
-10-505
1015202530
2005 2007 2009 2011 2013
0510152025303540
Brent/WTI spread (left) Crack spread (right)
Note: Crack Spread = difference between crude and gasoline prices.
Source: Bloomberg, UBS CIO WMR, as of 30 May 2013

12 Equity Focus List June 2013
Equity focus list AFLAC (AFL) – Financials Ameriprise (AMP) – Financials
House view – Overweight Financials
Fundamentals – CIO WMR: Outperform; IB: Neutral
Technicals – Bullish
Thematic – Member of Dividend Ruler Stock List
Quant – Attractive valuation; low volatility
House view – Overweight Financials
Fundamentals – CIO WMR: Outperform; IB: Buy
Technicals – Bullish
Thematic – Member of Q-GARP List
Quant – High cash distributions to shareholders Investment thesis AFLAC is a US-based insurer that markets and under-writes life and health insurance to individuals in both the US and Japan. It has a dominant market share in Japan from which it derives over 70% of its revenue. Sales growth in Japan is slowing from a very high level, but margins should improve due to mix shift. In addition, AFL’s business has high retention rates. US sales should benefit from a more active recruitment of better qualified agents, strength in new group insurance sales and an improving US labor market. AFL has a strong capital position. Although the company has heavy exposure to Japan, its shares have historically not been significantly correlated to movements in the yen. We believe AFLAC’s valuation is attractive, with a price-to-book multiple of 1.7x, much lower than its 10-year average of 2.6x. We believe valuation will expand as investors grow comfortable that the company’s high ROEs are sustainable.
Investment thesis Ameriprise is transitioning from an insurance business to an asset and wealth management business through or-ganic growth and acquisitions. This transition should re-sult in better returns on capital and a higher valuation multiple for the shares. The company’s good growth prospects are underpinned by increasing demand for fi-nancial advice as the population ages, as well as market share gains. In addition, assets under management and wealth management client activity should rise as equity markets make further gains. Ameriprise has a strong balance sheet and solid profit-ability. Despite strong share price performance so far in 2013, Ameriprise still trades at a below-market P/E multi-ple and a discount to asset managers. As Ameriprise be-comes increasingly viewed as an asset/wealth manager as opposed to an insurer, we expect its valuation to con-tinue to migrate towards the higher P/E multiple asset managers.
Technicals: Aflac is an emerging leader in Financials Share price, in US dollars
01020304050607080
2007 2008 2009 2010 2011 2012 2013
Price 10-week m.a. 30-week m.a.
Emerging from a 5-year triangle pattern
Source: Bloomberg, UBS CIO WMR, as of 30 May 2013
Ameriprise valuation to improve as business shifts Current forward P/E multiple for Ameriprise and sub-industries
6x7x8x9x
10x11x12x13x14x15x16x
Life & Health Insurance Ameriprise Asset Managers
Source: FactSet, UBS CIO WMR, as of 30 May 2013

Equity Focus List June 2013 13
Equity focus list Fifth Third Bancorp (FITB) – Financials JPMorgan Chase (JPM) – Financials
House view – Overweight Financials
Fundamentals – CIO WMR: Marketperform; IB: Buy
Technicals – Bullish
Thematic – Housing recovery; dividend & share buyback growth
Quant – Attractive valuation
House view – Overweight Financials
Fundamentals – CIO WMR: Outperform; IB: Buy
Technicals – Bullish
Thematic – Housing recovery; dividend & share buyback growth
Quant – Attractive return of capital to shareholders Investment thesis We expect Fifth Third to benefit from a gradual im-provement in commercial loan growth as 2013 unfolds. Fully 39% of total loans come from this segment, tops among its peers. While revenues should slowly pick up, expense management remains the strongest lever to im-prove profitability. Last quarter, core expenses declined by 4% driven by lower spending on technology, compen-sation and reduced credit-related expenses. Lower interest rates have pressured net interest margins (for all banks) over the past few quarters, but the recent increase in the 10-year bond yield to over 2.1% is en-couraging. Additionally, capital requirements under Basel III have already been achieved (Tier I Common ratio of nearly 9%), which should allow for greater distribution of excess capital in the form of dividends and share repur-chases over the coming several quarters.
Investment thesis At a valuation of 9.8x next 12 months EPS, JPM is the cheapest of the large-cap diversified banks. We believe this is unwarranted and presents an attractive opportu-nity for investors to benefit from an improving capital markets and lending environment. JPM’s profitability, as measured by return on tangible common equity, has con-sistently been in the mid-teens range, which is best among the global US banks. Stronger investment bank-ing revenues combined with continued improvements in credit trends should offset the pressure from declining net interest margins, which themselves could get a boost from a continuation of the recent rise in interest rates. In short, JPMorgan has a strong balance sheet with am-ple loan loss reserves, but also exposure to rebounding capital markets and consumer trends, which should pro-pel earnings power going forward. More aggressive re-turn of capital to shareholders is another potential cata-lyst.
Profitability at Fifth Third has been stronger than peers Return on tangible equity; peer group is other regional banks
-10%
-5%
0%
5%
10%
15%
20%
1Q10 3Q10 1Q11 3Q11 1Q12 3Q12 1Q13
FITB Regional banks
Source: SNL, UBS CIO WMR, as of 30 May 2013
JPMorgan viewed as the highest quality universal bank 5 Year credit default swap price, in basis points
60
70
80
90
100
110
120
JPM C BAC GS MS
Source: Bloomberg, UBS CIO WMR, as of 30 May 2013

14 Equity Focus List June 2013
Equity focus list ProAssurance (PRA) – Financials Wells Fargo (WFC) – Financials
House view – Overweight Financials
Fundamentals – CIO WMR: Outperform; IB: Not Rated
Technicals – Bullish
Thematic – US Healthcare
Quant – Attractive valuation; high return on equity
House view – Overweight Financials
Fundamentals – CIO WMR: Outperform; IB: Neutral
Technicals – Bullish
Thematic – Housing Recovery
Quant – Attractive valuation Investment thesis ProAssurance is a medical professional liability (MPL) in-surer. The company specializes in coverage of physicians, with an emphasis on individual and small group practices, not hospitals. The MPL market is fragmented, which makes market share gains easier and enables the com-pany to grow through acquisition. ProAssurance is the only publicly traded MPL company. PRA has a strong track record of double-digit book value growth, underwriting outperformance and gains in pre-miums and market share. The company should continue to be a beneficiary of recent changes in the health care landscape that have resulted in lower losses due to vari-ous state tort reform measures. Reserve releases contrib-uted to significant EPS upside in 1Q13, and we believe that current consensus EPS estimates may understate the level of reserve releases in 2013.
Investment thesis Wells Fargo is a high-quality large cap bank. We view Wells as a relatively inexpensive way to play a recovery in the US housing market, considering the meaningfully higher valuations of other housing market beneficiaries, such as homebuilders and housing-related retailers (home improvement, home furnishings, etc.). Rising interest rates are beginning to ease pressure on net interest mar-gins, while low mortgage rates should drive continued strong mortgage banking results. Meanwhile, credit trends (falling delinquency rates, net charge-offs) continue to improve. The company's diverse revenue sources, its consistently high profitability, the continuing opportunity from improving cross-selling in the legacy Wachovia franchise, and significant expense leverage lend strong upside to a company trading at only 10.8x forward earnings, a 25% discount to the market.
High retention rates, solid underwriting drive consistent results Premium Retention - Physicians
70%
75%
80%
85%
90%
95%
2005 2006 2007 2008 2009 2010 2011 2012
Source: ProAssurance, UBS CIO WMR, as of 30 May 2013
Technicals: WFC is nearing new highs, a bullish sign Share price, in US dollars
0
10
20
30
40
50
2007 2008 2009 2010 2011 2012 2013
Price 10-week m.a. 30-week m.a.
Recently cleared the top of its uptrend channel
Source: Bloomberg, UBS CIO WMR, as of 30 May 2013

Equity Focus List June 2013 15
Equity focus list Abbott Laboratories (ABT) – Healthcare Express Scripts (ESRX) – Healthcare
House view – Preference for Growth stocks
Fundamentals – CIO WMR: Outperform; IB: Buy
Technicals – Bullish
Thematic – US Healthcare; EM Consumer
Quant – Attractive valuation
House view – Preference for Growth stocks
Fundamentals – CIO WMR: Outperform; IB: Buy
Technicals – Bullish
Thematic – Member of Q-GARP List
Quant – Attractive valuation; good cash conversion Investment thesis The “new Abbott,” after the January 2013 spin-off of its proprietary pharmaceuticals business (AbbVie), is a large, diversified medical products company with four well-positioned business segments: Nutritionals (30% of reve-nues), Medical Devices (25%), Established Pharmaceuti-cals (25%) and Diagnostics (20%). The new Abbott is a top three player in businesses that account for over 75% of its revenues. With revenue growth estimated at 5-7% and reasonable margin expansion over the next five years (300bps), driven mostly by Nutritionals and Diagnostics, the new company has the potential to deliver low double digit EPS growth (11-13%). In addition, ABT has significant (nearly 40% of revenues) exposure to fast growing emerging markets. Given these strong growth prospects, we be-lieve valuation of 17.5x forward consensus earnings is reasonable and share price gains will be driven by the solid earnings growth outlook.
Investment thesis Express Scripts is the largest pharmacy benefit manager (PBM) in the country. PBMs are well-positioned as a large percentage of branded drugs go off-patent and face ge-neric competition for the first time. Generic drug sales are typically more profitable for PBMs than sales of branded pharmaceuticals. Healthcare reform should also boost volumes as more Americans gain drug insurance coverage. The industry’s oligopoly structure and the company's strong execution have resulted in steady margins and significant free cash flow. Its 2012 acquisition of Medco should further support earnings growth and margins. ESRX currently trades at approximately 13.6x next twelve months consensus EPS estimates, a discount to the broadUS equity market and near relative valuation lows. We believe this valuation discount is unwarranted given the solid double digit earnings growth that we expect.
The new ABT has significant emerging markets exposure Percent of total sales, by geography
EU32%
US30%
EM38%
Source: Abbott, UBS Investment Research, UBS CIO WMR, as of 30 May 2013
Express Scripts to benefit as prescription volume increasesPBM market share (prescriptions)
9%
6%
18%
11%24%
32% Express Scripts
CVS
UnitedHealth (Optum)
Argus
Catamaran
Other
Source: Express Scripts, UBS Investment Research, UBS CIO WMR, as of 30 May
2013

16 Equity Focus List June 2013
Equity focus list McKesson (MCK) – Healthcare Medtronic (MDT) – Healthcare
House view – Preference for Growth stocks
Fundamentals – CIO WMR: Outperform; IB: Buy
Technicals – Bullish
Thematic – Member of Q-GARP List
Quant – Attractive valuation
House view – Prefer Healthcare Eqmnt & Srvs within Healthcare
Fundamentals – CIO WMR: Outperform; IB: Buy
Technicals – Bullish
Thematic – Member of Dividend Ruler and Q-GARP Lists
Quant – Attractive valuation and growth Investment thesis McKesson is the largest US drug distributor, acting as middleman between pharmaceutical manufacturers and retailers. The largest three US drug distributors collec-tively comprise 97% of the market, an oligopoly industry structure that supports pricing power, margin stability and growth. Healthcare reform will increase healthcare insurance cov-erage, which should result in greater demand and higher volumes for healthcare products and services. The large volume of branded pharmaceuticals coming off patent should also support earnings growth given the greater profitability of generics for McKesson. We believe the stock is attractively valued, trading at a P/E multiple that is in line with the market despite higher than market av-erage growth prospects.
Investment thesis Medtronic is one of the largest medical equipment mak-ers in the world with specialties in spine, cardiac and neu-romodulation (e.g. pain management). The company should be able to maintain sales and EPS growth given its continued expansion into non-US markets, focus on chronic diseases, an aging population and a new slate of products that are taking share. Additional product launches to treat diabetes, hypertension and a new car-diac valve are in the pipeline. Medtronic recently reported surprisingly strong 4Q FY13 results, delivering better-than-expected sales gains in three of its largest product categories—implantable defi-brillators (ICDs), pacemakers and spine products. Its re-sults demonstrate that the markets for these products have finally stabilized after 2-3 years of downward trends and that Medtronic has gained market share from its competitors. The stock’s free cash flow yield of nearly 9% and ramping distributions to shareholders mitigate downside risks.
McKesson the largest of the “big three” drug distributorsDistributor market share (revenues)
24%
35%
41% McKesson
Cardinal
AmerisourceBergen
Source: McKesson, UBS Investment Research, UBS CIO WMR, as of 30 May 2013
Dominant market share in large product segments Worldwide market share
0%
10%
20%
30%
40%
50%
60%
ICDs Pacemakers Spine
Source: UBS Investment Research, UBS CIO WMR, as of 30 May 2013

Equity Focus List June 2013 17
Equity focus list Ingersoll-Rand (IR) – Industrials KBR (KBR) – Industrials
House view – Overweight Industrials
Fundamentals – CIO WMR: Not Rated; IB: Buy
Technicals – Bullish
Thematic – Cyclical improvement in capital spending
Quant – Attractive historical growth and valuation
House view – Overweight Industrials
Fundamentals – CIO WMR: Not Rated; IB: Buy
Technicals – Neutral
Thematic – North American Energy Independence
Quant – Attractive profitability and historical growth Investment thesis Ingersoll-Rand is a diversified industrial. It’s Climate Solu-tions unit – which includes both Trane Commercial (in-door climate control systems) and Thermo-King (transport refrigeration) – comprises half of revenues. The other businesses are Industrial Technologies, Security and Resi-dential Solutions. The company is most levered to the non-residential HVAC (heating, ventilation and air condi-tioning) end-markets. The commercial construction and retrofit cycles during the current recovery have been rather weak, but should improve over the next several quarters as US growth picks up and businesses become more convinced of its sustainability. We are already seeing select leading indica-tors that suggest the commercial HVAC end-markets are beginning to improve. An activist investor joined the board in 2012 and has sparked a shift to more share-holder-friendly activities such as a significant ramp in share repurchases, a proposed spin-off of its security business and a greater focus on cost discipline.
Investment thesis KBR is an engineering and construction firm that is wellpositioned to benefit from the build-out of infrastructure to support booming natural gas production. KBR has strong Liquefied Natural Gas (LNG) export terminal con-struction expertise. On the heels of a recent US Depart-ment of Energy study that showed that exports of natural gas from the US would have minimal impact on domesticprices, we expect the federal government to approve ad-ditional export terminals. The company should also benefit from LNG export facility development in Africa and Australia. Much higher natural gas prices in Europe and Japan (relative to the US) arefurther incentives to construct export and import facilities to take advantage of these geographical arbitrages. China is also turning to natural gas to satisfy its contin-ued thirst for energy. With the stock trading at only 12.5x earnings, we believe the risk/reward for the shares is attractive.
Technicals: New all-time highs for this leader in IndustrialsShare price, in US dollars
0
10
20
30
40
50
60
70
2007 2008 2009 2010 2011 2012 2013
Price 10-week m.a. 30-week m.a.
6-year triangle breakout above the low 50s is bullish
Source: Bloomberg, UBS CIO WMR, as of 30 May 2013
Low natural gas prices in US incentivizes US exports Natural gas price, in USD per MMBtu
02468
10121416
Sep-07 Sep-08 Sep-09 Sep-10 Sep-11 Sep-12US UK Netherlands
Source: Bloomberg, UBS CIO WMR, as of 24 May 2013

18 Equity Focus List June 2013
Equity focus list Tyco (TYC) – Industrials UPS (UPS) – Industrials
House view – Overweight Industrials
Fundamentals – CIO WMR: Not Rated; IB: Buy
Technicals – Bullish
Thematic – Cyclical improvement in capital spending
Quant – Low valuation, attractive historical growth
House view – Overweight Industrials
Fundamentals – CIO WMR: Outperform; IB: Buy
Technicals – Neutral
Thematic – Dividend Ruler, Q-GARP, US Competitiveness
Quant – Low share price volatility Investment thesis After divesting many divisions over the past several years, today’s Tyco is the market share leader in the global se-curity and fire protection services and equipment mar-kets. The company is levered to an increase in non-residential construction, which we believe is poised to improve. Non-residential construction usually takes its cues from residential construction, which has been re-bounding. Away from macro considerations the company has identi-fied margin expansion opportunities through efficiency gains and focusing on more profitable business. In fact, margins were up 120bps year over year in the most re-cent quarter. The industry is highly fragmented, and Tyco is in a good position to pursue an acquisition strategy within its markets. The company’s balance sheet is very strong and should fuel bolt-on acquisitions as well as more aggressive redeployment of capital to shareholders in the coming years.
Investment thesis UPS is a high-quality company that has consistently gen-erated attractive returns on capital – a reflection of the oligopoly nature of most of its markets and a keen focus on efficiency. We expect the company to benefit from a gradual re-acceleration in global economic growth over the next few quarters. UPS is also benefitting from the secular growth in e-commerce. Valuation is attractive, in our view. The stock’s current P/E is 14% higher than the market, a discount to its 30% valuation premium over the last 5 years. As the global economy recovers, we expect valuations to expand for this consistent earnings grower. Meanwhile, cash contin-ues to pile up on the balance sheet (see chart below) and the company’s 2.7% dividend yield and its recent USD 10 billion share repurchase authorization mitigate downside risks.
Non-residential construction activity poised to rebound Architecture Billings index, 6-month moving average
30
35
40
45
50
55
60
2001 2003 2005 2007 2009 2011 2013
Source: Bloomberg, UBS CIO WMR, as of 30 May 2013
Growing free cash flow supports share repurchases
Cash as a percentage of market value, rolling four quarter avg
0%
2%
4%
6%
8%
10%
12%
2001 2003 2005 2007 2009 2011 2013
Source: FactSet, UBS CIO WMR, as of 30 May 2013

Equity Focus List June 2013 19
Equity focus list Accenture (ACN) – Information Technology Cisco (CSCO) – Information Technology
House view – Overweight Information Technology
Fundamentals – CIO WMR: Marketperform; IB: Buy
Technicals – Bullish
Thematic – Cyclical improvement in capital spending
Quant – High return on capital, strong balance sheet
House view – Overweight Information Technology
Fundamentals – CIO WMR: Outperform; IB: Buy
Technicals – Bullish
Thematic – Cyclical improvement in capital spending
Quant – High return on capital, good asset turns Investment thesis Accenture is the world’s largest independent IT services provider, delivering management and technology con-sulting services and solutions (60% of revenue), as well as outsourcing services (~40%). Accenture enjoys high customer loyalty; 85% of clients have done business with the company for over a decade. Its core consulting and outsourcing business has proven to be resilient during the sluggish global economic recovery. Accenture has the implicit advantage of being an inde-pendent third party as it vies for business against inte-grated IT manufacturers and services companies such as Dell, Hewlett-Packard and IBM. Solid second quarter bookings growth suggests that the near-term outlook is improving and both revenues and earnings should reac-celerate during the second half of the year. Valuation isn’t as depressed as other stocks in Tech, in our view, but is fair relative to the company’s strong growth fun-damentals.
Investment thesis We believe Cisco’s guidance for 5-7% revenue growth and pro forma EPS growth of 7-10% over the next few years are likely to be reached or exceeded. Recent strong results underscore that the company is tracking well against these benchmarks. Though Cisco remains the dominant player in its slower-growth, core legacy busi-ness of routers (20% of revenue) and Ethernet switches (30% of revenue), we believe that its internal growth targets can be achieved through faster growth in other business lines. The company has successfully penetrated the data center server market as part of its cloud strategy, and is driving solid growth in mobility, video collaboration and security. With improving growth prospects and a new emphasis on shareholder-friendly measures (dividends and share repurchases), we expect Cisco’s low P/E multiple of 11.5x to expand over time.
IT spending outlook showing signs of improvement Accenture average services contract backlog growth, 6 month rolling average, year-over-year
-20%-15%-10%
-5%0%5%
10%15%20%25%30%
Mar-09 Dec-09 Sep-10 Jun-11 Mar-12 Dec-12
Source: Bloomberg, UBS CIO WMR, as of 30 May 2013
CSCO's growth to be driven by non-legacy segments
Earnings growth guidance, by segment
Segment Expected 3-5 year growth
rate
Data Center 20%-26%
Mobility 14%-17%
Software 14%-16%
Services 9%-11%
Video 6%-9%
Security 5%-7% Source: Cisco, UBS CIO WMR, as of 30 May 2013
20 Equity Focus List June 2013
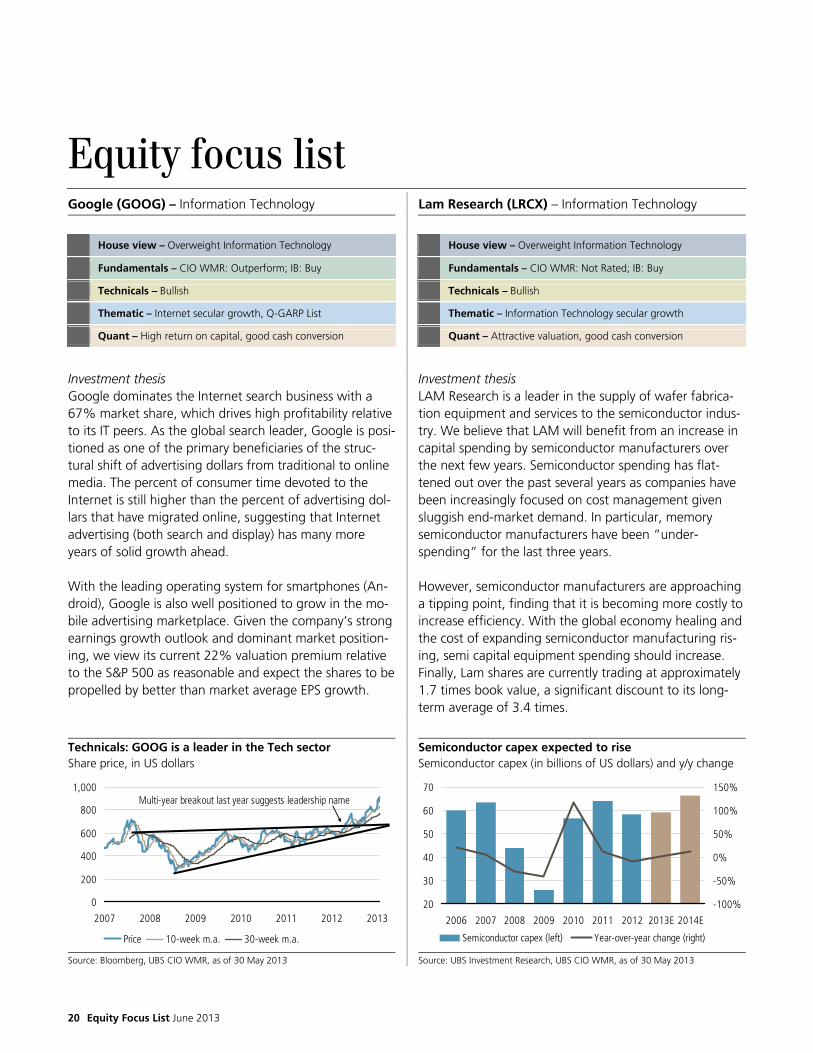
Equity focus list Google (GOOG) – Information Technology Lam Research (LRCX) – Information Technology
House view – Overweight Information Technology
Fundamentals – CIO WMR: Outperform; IB: Buy
Technicals – Bullish
Thematic – Internet secular growth, Q-GARP List
Quant – High return on capital, good cash conversion
House view – Overweight Information Technology
Fundamentals – CIO WMR: Not Rated; IB: Buy
Technicals – Bullish
Thematic – Information Technology secular growth
Quant – Attractive valuation, good cash conversion Investment thesis Google dominates the Internet search business with a 67% market share, which drives high profitability relative to its IT peers. As the global search leader, Google is posi-tioned as one of the primary beneficiaries of the struc-tural shift of advertising dollars from traditional to online media. The percent of consumer time devoted to the Internet is still higher than the percent of advertising dol-lars that have migrated online, suggesting that Internet advertising (both search and display) has many more years of solid growth ahead. With the leading operating system for smartphones (An-droid), Google is also well positioned to grow in the mo-bile advertising marketplace. Given the company’s strong earnings growth outlook and dominant market position-ing, we view its current 22% valuation premium relative to the S&P 500 as reasonable and expect the shares to be propelled by better than market average EPS growth.
Investment thesis LAM Research is a leader in the supply of wafer fabrica-tion equipment and services to the semiconductor indus-try. We believe that LAM will benefit from an increase in capital spending by semiconductor manufacturers over the next few years. Semiconductor spending has flat-tened out over the past several years as companies have been increasingly focused on cost management given sluggish end-market demand. In particular, memory semiconductor manufacturers have been “under-spending” for the last three years. However, semiconductor manufacturers are approaching a tipping point, finding that it is becoming more costly to increase efficiency. With the global economy healing and the cost of expanding semiconductor manufacturing ris-ing, semi capital equipment spending should increase. Finally, Lam shares are currently trading at approximately 1.7 times book value, a significant discount to its long-term average of 3.4 times.
Technicals: GOOG is a leader in the Tech sector Share price, in US dollars
0
200
400
600
800
1,000
2007 2008 2009 2010 2011 2012 2013
Price 10-week m.a. 30-week m.a.
Multi-year breakout last year suggests leadership name
Source: Bloomberg, UBS CIO WMR, as of 30 May 2013
Semiconductor capex expected to rise Semiconductor capex (in billions of US dollars) and y/y change
20
30
40
50
60
70
2006 2007 2008 2009 2010 2011 2012 2013E 2014E
-100%
-50%
0%
50%
100%
150%
Semiconductor capex (left) Year-over-year change (right)
Source: UBS Investment Research, UBS CIO WMR, as of 30 May 2013

Equity Focus List June 2013 21
Equity focus list Qualcomm (QCOM) – Information Technology SanDisk (SNDK) – Information Technology
House view – Overweight Information Technology
Fundamentals – CIO WMR: Outperform; IB: Buy
Technicals – Neutral
Thematic – Mobility secular growth
Quant – High return on capital, strong free cash flow growth
House view – Overweight Information Technology
Fundamentals – CIO WMR: Outperform; IB: Buy
Technicals – Bullish
Thematic – Mobility secular growth
Quant – High return on capital Investment thesis Qualcomm is one of the best ways to participate in the explosive growth in mobility, in our view. As an early pio-neer in developing wireless communications standards, Qualcomm assembled an impressive intellectual property portfolio. As a result, the company earns a royalty on all handsets that operate on certain 3G and 4G technolo-gies, which should continue to enjoy strong growth as these networks experience rapid expansion into emerging markets. This business accounts for over 70% of the company’s profits, with the remainder derived from semiconductor chips that are sold to handset manufac-turers. The company’s strong position in both businesses drives high and stable returns on invested capital and manage-ment expects double-digit annual revenue and EPS growth over the next five years. At a P/E of 13.4x, shares are trading at the bottom of their five-year absolute and relative valuation ranges.
Investment thesis SanDisk is a leading provider of NAND flash memory chips and the only “pure-play” of the five major global NAND flash manufacturers. NAND growth has been pro-pelled by the explosion in mobile devices, which rely on NAND chips to store everything from apps to videos. NAND is also beginning to penetrate the notebook mar-ket, displacing hard disk drives. SanDisk estimates that NAND memory will be used in 22% of notebook PCs this year and in over 50% by 2015-2016, up from just 12% in 2012. After suffering through a period of over-capacity in 2012, NAND manufacturers have dialed back expansion plans. As a result, NAND pricing has improved. We expect NAND manufacturers to remain disciplined especially as the cost of adding capacity is rising. Meanwhile, demand growth remains robust (“bits” sold in Q1 increased 36% year-over-year). At a current P/E of 13.6x, we find the shares compelling.
Royalty income rising for Qualcomm Qualcomm 3G/4G device shipment estimates, in millions
0
200
400
600
800
1000
1200
2010 2011 2012 2013E
Source: Qualcomm, UBS CIO WMR, as of 30 May 2013
Technicals: Large multi-year base breakout for SanDisk Share price, in US dollars
0
10
20
30
40
50
60
70
2007 2008 2009 2010 2011 2012 2013
Price 10-week m.a. 30-week m.a.
3 year accumulation and 25-point base breakout
Source: Bloomberg, UBS CIO WMR, as of 30 May 2013

22 Equity Focus List June 2013
Equity focus list Celanese (CE) – Materials Calpine (CPN) – Utilities
House view – Preference for small- and mid-caps
Fundamentals – CIO WMR: Outperform; IB: Not Rated
Technicals – Bullish
Thematic – North American Energy Independence
Quant – Attractive valuation
House view – Avoid expensive high dividend yielding Utilities
Fundamentals – CIO WMR: Outperform; IB: Buy
Technicals – Bullish
Thematic – North American Energy Independence
Quant – Attractive historical growth, low valuation Investment thesis Celanese is a global chemical manufacturer which is lev-eraged to a pickup in economic activity and has new management which is focused on restructuring underper-forming businesses. The company’s base business is gen-erally exposed to end markets such as automobiles, ap-pliances, paints, construction, carpets and solar photovol-taics. Celanese is also attempting to commercialize a new tech-nology that can convert coal and natural gas-based methanol into ethanol for use as a transportation fuel. While more speculative, this technology could be a block-buster based on the company’s expectation that it can be commercialized at a cost that is substantially lower than the current price of gasoline. Celanese is initially target-ing the Chinese and Indonesian markets for this technol-ogy. With the shares trading at a P/E of approximately 11x normalized EPS (excluding the ethanol opportunity), we believe risk / reward is attractive.
Investment thesis Calpine shares offer one of the best ways to participate in a power market recovery. Due to the recession, the US has surplus generating capacity. However, power markets are beginning to tighten as demand grows and the most inefficient coal-fired power plants are shuttered due to environmental regulations and poor profitability. This is particularly true in Texas where Calpine generates ap-proximately 25% of its power. In addition, we expect natural gas prices to slowly rise, lifting power prices. On a price to earnings basis valuation appears high but, current earnings are distorted by higher than normal de-preciation expense and do not account for the company’s large tax shield. Alternatively, the shares currently have an attractive normalized free cash flow yield of 7%. As power markets tighten, we expect this to rise to over 10%. Additionally, we look for share repurchases totaling3-4% of the company’s market value to provide further support.
Huge potential opportunity in ethanol fuel market Total sales, in billions of US dollars
0
10
20
30
40
50
60
70
CE revenues (2012) Global ethanol market (2011)
Source: Bloomberg, Celanese, UBS CIO WMR, as of 30 May 2013
Tightening Texas power markets a positive for Calpine Reserve margins (excess supply relative to demand)
0%
2%
4%
6%
8%
10%
12%
14%
16%
2013 2014 2015 2016 2017 2018 2019 2020 2021 2022
Regulators' target reserve margin
Source: ERCOT forecasts, UBS WMR, as of 30 May 2013

Equity Focus List June 2013 23
Appendix
Statement of Risk Equity markets are difficult to forecast because of fluctuations in the economy, investor psychology, geopolitical conditions, and other important variables.
Description and Methodology
To be included on the CIO WMR Equity Focus List, stocks must: 1. Have a positive or neutral fundamental rating. Stocks must be listed on either the Sector Outperform or Sector Marketperform List from
CIO Wealth Management Research (CIO WMR), or a 12-month rated Buy or Neutral recommendation by UBS Investment Research. UBS In-vestment Research is part of UBS Investment Bank (the UBS business group that includes, among others, UBS Securities LLC).
2. Have a favorable technical rating. Stocks must have a Bullish or Neutral technical rating. Neutral-rated stocks included on the list have a favorable risk / reward with a material probability of breaking into a bullish trend.
3. Score attractively on our quantitative framework. Our quantitative framework identifies factors that have produced historical outperfor-mance within each equity industry group. We apply these factors to the current industry group constituents in order to determine the most at-tractive candidates. Factors encompass valuation, growth, quality, and momentum indicators.
4. Fit into the UBS House View. The House View incorporates our macro strategists’ outlook on economic growth, asset allocation, risk-taking, regional equity recommendations, sector preferences within the US equity market, as well as US equity size and style tilts. The House View is articulated in our UBS House View publications.
5. Be consistent with our thematic views. We incorporate selections that we expect to benefit from our highest conviction tactical or secular equity themes based on previously published thematic research or theme-based research embedded in other strategy reports.
Portfolio analysis tools are also employed to measure overall factor exposures within the list. The UBS CIO WMR Stock Selection Committee (SSC) determines the constituents of the Equity Focus List by identifying stocks that screen attrac-tively on the criteria listed above. Members of the SSC are:
David Lefkowitz (Chair) Stephen R. Freedman (*) Jonathan Woloshin
Michael Dion Peter Lee Jeremy A. Zirin
(*) Non-voting The indicated performance is based on capital appreciation plus dividends of an equal weight portfolio, but does not include transaction costs, such as commissions, fees, margin interest, and interest charges. Actual transactions adjusted for such transaction costs will result in reduced total returns. Prices of stocks in this performance reflect closing prices one trading day after the addition or deletion to ensure that changes to the list are announced in a manner that allows clients to match the list's performance. A complete record of all the recommendations upon which the report is based is available from UBS Financial Services Inc. upon written request. Past performance is not an indication of future results.
Treatment of Equity Focus List Stocks on the Firm’s Restricted List Where securities are included on the Firm’s Restricted List (explained in more detail below) the securities are annotated as such with an asterisk, but have been left in the Equity Focus List for performance tracking purposes only. At the time the security was added to the Equity Focus List, and until the time it was added to the Restricted List, it met the WMR criteria for inclusion described above. However, while it is on the Restricted List the firm and authors of this publication, are prohibited from expressing their ongoing view of the security. As a matter of course this should nei-ther be necessarily construed positively or negatively, or as a recommendation to buy, hold or sell the security. The security remains on the Equity Focus List until such time as the security is removed from the Restricted List at which time the analyst will either re-affirm his/her ongoing inclusion on the Equity Focus List or remove it in accordance with the normal rules for changes to the list outlined above when other stocks are judged to offer more attractive risk/reward tradeoffs. The Firm’s Restricted List The principal reasons that issuers are included on the Firm’s Research Restricted list are that one or more legal entities within the UBS group are in-volved as an advisor and/or underwriter in a publicly announced corporate transaction. Dependent on relevant security regulations / laws, firm pol-icy , the management of conflicts of interest and to avoid the appearance of impropriety, there may be a requirement for all or a combination of the following: restrictions on the publication of new research, suspensions of research ratings and forecasts, prohibitions on making recommendations to clients, restrictions on placing securities into discretionary accounts and prohibitions on proprietary and/or personal account trading in respect of names on the list.

24 Equity Focus List June 2013
Appendix
Equity Focus List Name Ticker Sector Price (5/31/2013) Abbott Laboratories ABT Health Care $36.67 Accenture ACN Information Technology $82.11 Aflac AFL Financials $55.69 Ameriprise AMP Financials $81.52 Calpine CPN Utilities $20.31 Celanese CE Materials $49.35 Cisco Systems CSCO Information Technology $24.12 Clorox CLX Consumer Staples $83.08 Coca-Cola KO Consumer Staples $39.99 Colgate-Palmolive CL Consumer Staples $57.84 Comcast CMCSA Consumer Discretionary $40.17 Express Scripts ESRX Health Care $62.12 Fifth Third Bancorp FITB Financials $18.20 Google GOOG Information Technology $871.22 Ingersoll-Rand IR Industrials $57.53 JP Morgan JPM Financials $54.59 KBR KBR Industrials $36.10 Lam Research LRCX Information Technology $46.78 Marathon Oil MRO Energy $34.39 McKesson MCK Health Care $113.86 Medtronic MDT Health Care $51.01 Nike NKE Consumer Discretionary $61.66 O’Reilly Automotive ORLY Consumer Discretionary $108.85 Phillips 66 PSX Energy $66.57 ProAssurance PRA Financials $50.20 Qualcomm QCOM Information Technology $63.48 SanDisk SNDK Information Technology $59.02 Starwood Hotels HOT Consumer Discretionary $68.30 TJX Cos TJX Consumer Discretionary $50.61 Tyco TYC Industrials $33.81 United Parcel Service UPS Industrials $85.90 Wells Fargo WFC Financials $40.55
Source: Bloomberg, as of 31 May 2013

Equity Focus List June 2013 25
Appendix
Required Disclosures Analyst Certification Each research analyst primarily responsible for the content of this research report, in whole or in part, certifies that with respect to each security or issuer that the analyst covered in this report: (1) all of the views expressed accurately reflect his or her personal views about those securities or issuers; and (2) no part of his or her compensation was, is, or will be, directly or indirectly, related to the specific recommendations or views expressed by that research analyst in the research report. For a complete set of Required Disclosures relating to the companies that are the subject of this report, please mail a request to UBS Wealth Management Research Business Management, 1285 Avenue of the Americas, 13th Floor, New York, NY 10019. Stock Recommendation System
Wealth Management Research Analysts provide a relative rating, which is based on the stock’s total return potential against the total estimated return of the appropriate sector benchmark over the next 12 months.
Industry Sector Relative Stock View
Outperform (OUT) Expected to outperform the sector benchmark over the next 12 months.
Marketperform (MKT) Expected to perform in line with the sector benchmark over the next 12 months.
Underperform (UND) Expected to underperform the sector benchmark over the next 12 months.
Under review Upon special events that require further analysis, the stock rating may be flagged as "Under review" by the analyst. Restricted Issuing of research on a company by WMR can be restricted due to legal, regulatory, contractual or best business practice obligations which are normally caused by UBS Investment Bank's involvement in an investment banking transaction in regard to the concerned company. Sector bellwethers, or stocks that are of high importance or relevance to the sector, that are not placed on either the outperform or underperform list (i.e., are not expected to either outperform or underperform the sector benchmark) will be classified as Marketperform. Stocks that are rated Marketperform that are not sector bellwethers are not assigned a price target.
Technical Research Rating Definitions
Rating Corresponding Rating Category Definition and criteria
Bullish Buy Well-defined, reliable uptrend, an increase in the rate of change (or strong momen-tum) and confirming technical indicators.
Neutral Hold Trading range trend, a flat rate of change and confirming technical indicators.
Bearish Sell Negative or weakened trend, momentum and confirming technical indicators.
N/A Not enough historical data to make an evaluation.
UBS Investment Research Stock Recommendation System For information on the ways in which UBS manages conflicts and maintains independence of its research product; historical performance informa-tion; and certain additional disclosures concerning UBS research recommendations, please visit www.ubs.com/disclosures.
Global Equity Rating Definitions
UBS 12-Month Rating Definition
Buy FSR is > 6% above the MRA.
Neutral FSR is between -6% and 6% of the MRA.
Sell FSR is > 6% below the MRA. Key Definitions
Forecast Stock Return (FSR) is defined as expected percentage price appreciation plus gross dividend yield over the next 12 months.
Market Return Assumption (MRA) is defined as the one-year local market interest rate plus 5% (a proxy for, and not a forecast of, the equity risk premium).
Under Review (UR) Stocks may be flagged as UR by the analyst, indicating that the stock's price target and/or rating are subject to possible change in the near term, usually in response to an event that may affect the investment case or valuation.
Exceptions and Special Cases Core Banding Exceptions (CBE): Exceptions to the standard +/-6% bands may be granted by the Investment Review Committee (IRC). Factors considered by the IRC include the stock's volatility and the credit spread of the respective company's debt. As a result, stocks deemed to be very high or low risk may be subject to higher or lower bands as they relate to the rating. When such exceptions apply, they will be identified in the Companies Mentioned or Company Disclosure table in the relevant research piece.

26 Equity Focus List June 2013
Appendix
Disclaimer In certain countries UBS AG is referred to as UBS SA. This publication is for our clients’ information only and is not intended as an offer, or asolicitation of an offer, to buy or sell any investment or other specific product. It does not constitute a personal recommendation or takeinto account the particular investment objectives, financial situation and needs of any specific recipient. We recommend that recipients takefinancial and/or tax advice as to the implications of investing in any of the products mentioned herein. We do not provide tax advice. The analysis contained herein is based on numerous assumptions. Different assumptions could result in materially different results. Other thandisclosures relating to UBS AG, its subsidiaries and affiliates, all information expressed in this document were obtained from sources believed to be reliable and in good faith, but no representation or warranty, express or implied, is made as to its accuracy or completeness. All infor-mation and opinions are current only as of the date of this report, and are subject to change without notice. This publication is not intended to be a complete statement or summary of the securities, markets or developments referred to in the report. Opinions may differ or be contrary to those expressed by other business areas or groups of UBS AG, its subsidiaries and affiliates. UBS Wealth Management Research (UBS WMR) is written by Wealth Management & Swiss Bank and Wealth Management Americas. UBS Investment Research is written by UBS Investment Bank. The research process of UBS WMR is independent of UBS Investment Re-search. As a consequence research methodologies applied and assumptions made by UBS WMR and UBS Investment Research may differ, for example, in terms of investment horizon, model assumptions, and valuation methods. Therefore investment recommendations independently provided by the two UBS research organizations can be different. The analyst(s) responsible for the preparation of this report may interact with trading desk personnel, sales personnel and other constituen-cies for the purpose of gathering, synthesizing and interpreting market information. The compensation of the analyst(s) who prepared thisreport is determined exclusively by research management and senior management (not including investment banking). Analyst compensa-tion is not based on investment banking revenues, however, compensation may relate to the revenues of UBS as a whole, of which invest-ment banking, sales and trading are a part. At any time UBS AG, its subsidiaries and affiliates (or employees thereof) may make investment decisions that are inconsistent with the opin-ions expressed in this publication, may have a long or short positions in or act as principal or agent in, the securities (or derivatives thereof)of an issuer identified in this publication, or provide advisory or other services to the issuer or to a company connected with an issuer. Someinvestments may not be readily realizable since the market in the securities is illiquid and therefore valuing the investment and identifyingthe risk to which you are exposed may be difficult to quantify. UBS relies on information barriers to control the flow of information con-tained in one or more areas within UBS, into other areas, units, groups or affiliates of UBS. Some investments may be subject to sudden and large falls in value and on realization you may receive back less than you invested or may be required to pay more. Changes in foreign cur-rency exchange rates may have an adverse effect on the price, value or income of an investment. Past performance of an investment is not a guide to its future performance. Additional information will be made available upon request. This document may not be reproduced or copies circulated without prior written authority of UBS or a subsidiary of UBS. UBS expressly pro-hibits the distribution and transfer of this document to third parties for any reason. UBS will not be liable for any claims or lawsuits from any third parties arising from the use or distribution of this document. This report is for distribution only under such circumstances as may be permitted by applicable law. The securities described herein may not be eligible for sale in all jurisdictions or to all categories of investors. Distributed to US persons by UBS Financial Services Inc., a subsidiary of UBS AG. UBS Securities LLC is a subsidiary of UBS AG and an affiliate of UBS Financial Services Inc. UBS Financial Services Inc. accepts responsibility for the content of a report prepared by a non-US affiliate when it distributes reports to US persons. All transactions by a US person in the securities mentioned in this report should be effected through a US-registered broker dealer affiliated with UBS, and not through a non-US affiliate. The contents of this report have not been and will not be approved by any securities or investment authority in the United States or elsewhere. Version as per June 2011. © 2013. The key symbol and UBS are among the registered and unregistered trademarks of UBS. All rights reserved.